airmagnet laptop user guide
DESCRIPTION
Wireless LAN AnalyzerTRANSCRIPT
AirMagnet® Laptop
Wireless LAN AnalyzerUser Guide

2 Chapter 1: Introduction
AirMagnet Laptop Wireless LAN Analyzer User Guide
Chapter 1: Introduction
Main FeaturesAirMagnet Laptop offers the industry’s most advanced and comprehensive mobile solution for the wireless network. Its main features cover the following areas:
• WLAN Administration
• Security Policy Management
• Performance Policy Management
• Installation Survey and Audit
• Connection Troubleshooting

AirMagnet Laptop Wireless LAN Analyzer User Guide
Chapter 2: System Navigation 1
System NavigationChapter 2:
Chapter SummaryThis chapter discusses AirMagnet Laptop’s basic navigation controls, major screen options and their key functions. It covers the following topics:
• Launching AirMagnet Laptop.
• Navigating through the program.
• Viewing overall WLAN health.
• Viewing RF data by channel.
• Viewing RF data by WLAN nodes.
• Solving WLAN issues using AirWISE.
• Identifying top WLAN issues.
• Decoding WLAN frame packets.
2 Chapter 2: System Navigation
AirMagnet Laptop Wireless LAN Analyzer User Guide
Launching AirMagnet LaptopTo launch AirMagnet Laptop,
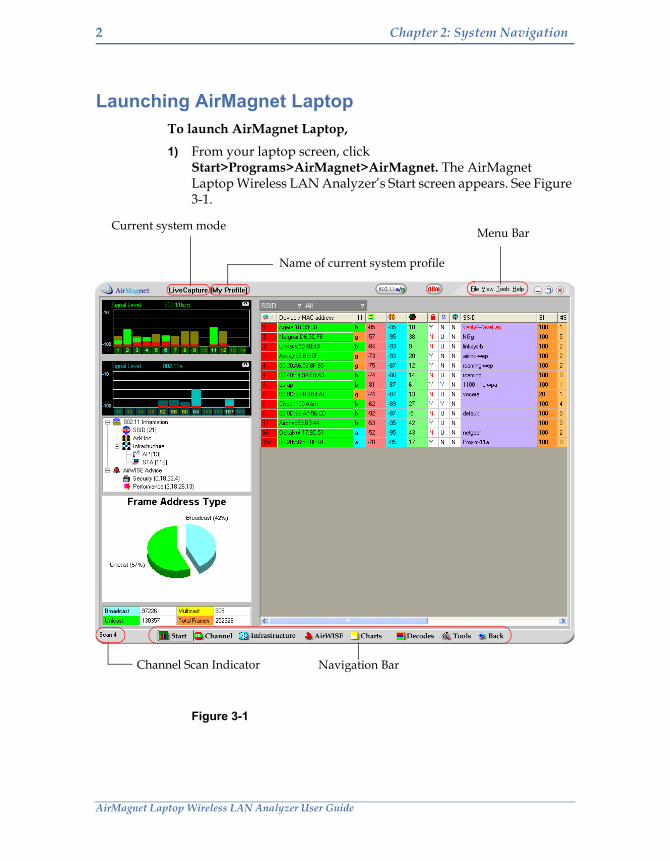
1) From your laptop screen, click Start>Programs>AirMagnet>AirMagnet. The AirMagnet Laptop Wireless LAN Analyzer’s Start screen appears. See Figure 3-1.
Figure 3-1
Current system mode
Name of current system profile
Menu Bar
Navigation BarChannel Scan Indicator

AirMagnet Laptop Wireless LAN Analyzer User Guide
Chapter 2: System Navigation 3
Tip: Figure 3-1 shows the “complete” AirMagnet Laptop Wireless LAN Analyzer’s Start screen, with all screen components. The user must either maximize the size of the screen or increase the screen resolution to see the complete screen.
The Navigation BarAt the bottom of the AirMagnet Laptop screen is the program’s Navigation Bar, which contains navigation buttons for accessing different screens and tools. You can navigate from one screen to another by clicking on these buttons. See Figure 3-2.
Figure 3-2
Table 3-1 contains brief descriptions of each of these buttons.
Table 3-1: Navigation Bar and Buttons
Button Description
Start button opens the Start screen, which shows the overall health of the wireless LAN environment.
Channel button opens the Channel screen, which allows you to visualize 802.11 traffic by channel.
Infrastructure button opens the Infrastructure screen, which displays the WLAN’s structure and components.
AirWISE button opens the AirWISE screen, which lists the performance and security alarms detected by AirWISE.
Chart button opens the Chart screen, which displays the top 10 bandwidth consumers in the wireless LAN.

4 Chapter 2: System Navigation
AirMagnet Laptop Wireless LAN Analyzer User Guide
Starting with the Start ScreenAirMagnet Laptop Wireless LAN Analyzer’s starts with the Start screen, which serves as a WLAN dashboard and is loaded with comprehensive, summarized information about RF signal quality, network infrastructure, security and performance status, and frame communication on your wireless LAN environment. You can get to the Start screen when you launch the program, or by clicking
from the Navigation Bar if you are on another screen.
By default, AirMagnet Laptop Wireless LAN Analyzer starts in a live capture mode, as indicated by Live Capture on its title bar. (Refer to Figure 3-1.) From here, one can easily drill down to a specific channel, a WLAN component (e.g., an access point or client station) or a security or performance alarm for further information or analysis.
Decode button opens the Decode screen, which displays the 802.11 packet summary in real time.
Tools button opens the Tools screen, which contains 12 easy-to-use WLAN tools for you to choose from.
Back button allows you to move back to the previous screen you visited.
Table 3-1: Navigation Bar and Buttons
Button Description
AirMagnet Laptop Wireless LAN Analyzer User Guide
Chapter 2: System Navigation 5
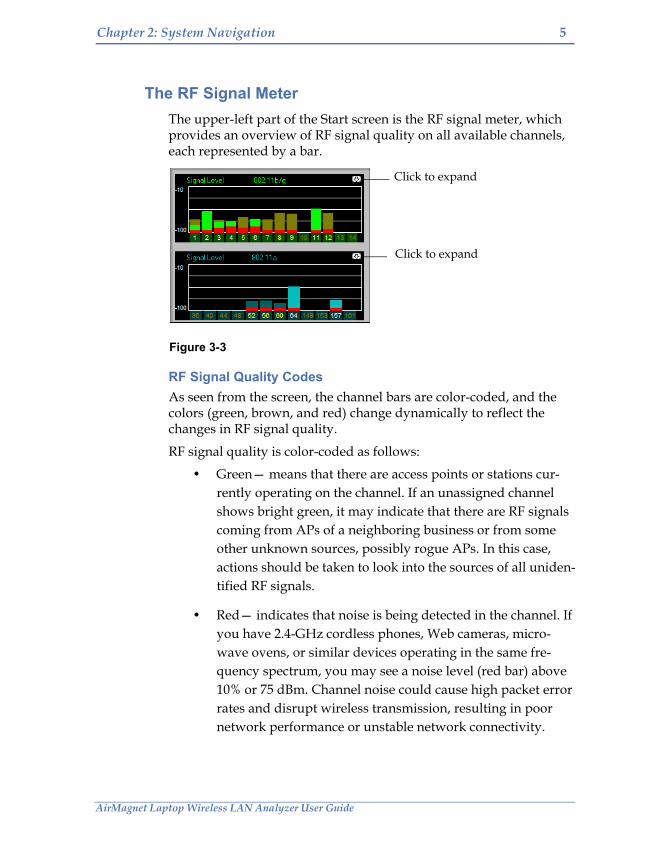
The RF Signal MeterThe upper-left part of the Start screen is the RF signal meter, which provides an overview of RF signal quality on all available channels, each represented by a bar.
Figure 3-3
RF Signal Quality CodesAs seen from the screen, the channel bars are color-coded, and the colors (green, brown, and red) change dynamically to reflect the changes in RF signal quality.
RF signal quality is color-coded as follows:
• Green— means that there are access points or stations cur-rently operating on the channel. If an unassigned channel shows bright green, it may indicate that there are RF signals coming from APs of a neighboring business or from some other unknown sources, possibly rogue APs. In this case, actions should be taken to look into the sources of all uniden-tified RF signals.
• Red— indicates that noise is being detected in the channel. If you have 2.4-GHz cordless phones, Web cameras, micro-wave ovens, or similar devices operating in the same fre-quency spectrum, you may see a noise level (red bar) above 10% or 75 dBm. Channel noise could cause high packet error rates and disrupt wireless transmission, resulting in poor network performance or unstable network connectivity.
Click to expand
Click to expand
6 Chapter 2: System Navigation
AirMagnet Laptop Wireless LAN Analyzer User Guide
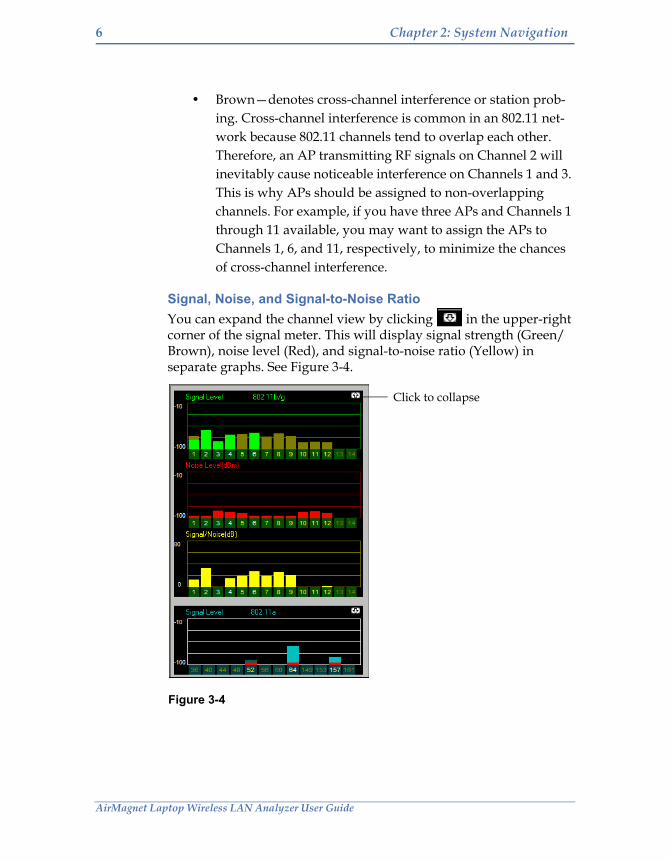
• Brown—denotes cross-channel interference or station prob-ing. Cross-channel interference is common in an 802.11 net-work because 802.11 channels tend to overlap each other. Therefore, an AP transmitting RF signals on Channel 2 will inevitably cause noticeable interference on Channels 1 and 3. This is why APs should be assigned to non-overlapping channels. For example, if you have three APs and Channels 1 through 11 available, you may want to assign the APs to Channels 1, 6, and 11, respectively, to minimize the chances of cross-channel interference.
Signal, Noise, and Signal-to-Noise RatioYou can expand the channel view by clicking in the upper-right corner of the signal meter. This will display signal strength (Green/Brown), noise level (Red), and signal-to-noise ratio (Yellow) in separate graphs. See Figure 3-4.
Figure 3-4
Click to collapse

AirMagnet Laptop Wireless LAN Analyzer User Guide
Chapter 2: System Navigation 7
You can customize the channel scan list by eliminating unused channels, and change the scan frequency. (See the chapter on “System Configuration”.) This will allow you to spend more time capturing traffic on known active channels, while still keeping an eye on those unassigned channels for rogue APs and stations.
You can restore the signal meter to its original state by clicking in the upper-right corner of the expanded signal meter screen. See Figure 3-4.
Tip: Double-clicking a channel in the signal meter will take you directly to the Channel screen.
Changing Media TypeAirMagnet Laptop Wireless LAN Analyzer provides concurrent support for 802.11 a/b/g network infrastructures. The user can choose the media type by clicking (for 802.11a), (802.11b/g), and (802.11a/b/g) on top of the screen. The selected media will be reflected in the signal meter and the data summary table on the left.
Note: Switching media type is just like physically changing the wireless card. AirMagnet will empty all the files captured in the buffer and then start capturing data using the new media type. If you are on a screen other than the Start screen, clicking the Media Type button will take you directly to the Start screen, and you cannot move back to that screen using the Back button.
Changing RF Signal Unit of MeasurementBy default, channel RF signal strength, noise level, and signal-to-noise ratio are displayed in percentage (%) or dBm. You can toggle between the two by tapping and in the upper-left corner of the screen.

8 Chapter 2: System Navigation
AirMagnet Laptop Wireless LAN Analyzer User Guide
Worldwide 802.11 a/b/g Radio Channel AllocationSince regulatory rules dictate the radio frequencies (channels) and emission powers for 802.11 standards in various parts of the world, the number of channels available depends on the geographical location and the type of media (802.11a/b/g) you select. Table 3-2 shows channel allocation for all 802.11 media in major parts of the world.
The 802.11 InformationThe 802.11 Information is an organizational summary of your wireless LAN infrastructure. It categorizes all the components or devices detected on your wireless network, and shows the total number of components or devices in each category. See Figure 3-5.
Figure 3-5
Table 3-2: Worldwide Radio Channel Assignment
Region/Country 802.11 b/g 802.11a
Americas 1 ~ 11 36, 40, 44, 48, 52, 56, 60, 64, 149, 153, 157, 161
Most part of Europe and Australia
1 ~ 13 36, 40, 44, 48, 52, 60, 64
France 10 ~ 14 36, 40 44, 48, 52, 56, 60, 64
Spain 10 ~ 11 36, 40 44, 48, 52, 56, 60, 64
Japan 1 ~ 14 34, 38, 42, 46
Pacific Rim (China, Taiwan, Hong Kong, Singapore, Korea)
1 ~11 36, 40, 44, 48, 52, 56, 60, 64, 149, 153, 157, 161

AirMagnet Laptop Wireless LAN Analyzer User Guide
Chapter 2: System Navigation 9
Tip: Highlighting a node such as SSID, Ad-Hoc, AP, or STA will allow you to display the network infrastructure information in the pie chart below; double-clicking an entry will take you directly to the Infrastructure screen.
The Alarm SummaryBelow the 802.11 Information is a section entitled AirWISE Advice, which categorizes all the alarms detected on your WLAN into security and performance. There are four sets of digits for each category, representing different levels of severity. The digits, from left to right, represent alarms whose status are Critical, Urgent, Warning, or Informational. See Figure 3-6.
Figure 3-6
Tip: Highlighting a alarm category will allow you to display in the pie chart the percentage of alarms in different categories; double-clicking an alarm category will take you directly to the AirWISE screen.

10 Chapter 2: System Navigation
AirMagnet Laptop Wireless LAN Analyzer User Guide
The Pie ChartThe pie chart provides an easy, visual display of the selected RF data. See Figure 3-7.
Figure 3-7
Note: The content of the pie chart depends on the item selected from the 802.11 Information and AirWISE Advice sections of the Start screen.
Tip: In order to display the pie chart, you must either maximize the size of your screen or increase your screen resolution, and you must also have the signal meter in a collapsed state.
Packet Frames SummaryIn the lower-left corner of the Start screen is a tabulation of packet frames AirMagent has detected that have been transmitted on your wireless network. The frames are categorized into three categories: broadcast, multicast, and unicast. See Figure 3-8.
Figure 3-8

AirMagnet Laptop Wireless LAN Analyzer User Guide
Chapter 2: System Navigation 11
Table 3-3 briefly describes each of these frames.
The WLAN RF Data Summary TableThe right-hand side of the Start screen is a table that summarizes the data about all the wireless devices detected on your WLAN. The data are listed in 16 categories, and you can customize the tabulation by SSID or Channel using the two filters in the upper-left corner of the table. The data include, from left to right, channel, device with MAC address, media type, signal, noise, signal-to-noise ratio, security, TK & MIC, Bridge Mode, SSID, BI, #STA, Preamble, PCF/DCF, First, and Last.
You can sort the data by any category simply by clicking the title of that column, e.g., SSID.
Use the scroll bar at the bottom of the table to view all the data contained in the table. Figure 3-9 shows the entire RF data summary table.
Tip: Double-clicking a field in the CH (channel) column will take to the AirWISE screen, which will show all alarms detected on that channel; double-clicking in any other field will take you directly to the Infrastructure screen.
Table 3-3: Summary of Packet Frames Transmission
Frame Type Description
Broadcast Broadcast is a term used to describe communication where data are sent for one point to all other points. In other words, there is just one sender, but the information is sent to all connected receivers.
Multicast Multicast is a communication pattern in which a source host sends a message to a group of destination hosts simultaneously.
Unicast Unicast is a term used to describe communication where data are sent from one point to another point. There are only one sender and one receiver.

12 Chapter 2: System Navigation
AirMagnet Laptop Wireless LAN Analyzer User Guide
Figure 3-9
Tables 3-4 and 3-5 below briefly describe the data in Figure 3-9.
Table 3-4: WLAN RF Data Summary Table Entries
Icon Description
Channel All available channels detected on the WLAN.
Device/MAC Address
Devices detected on each channel and their MAC addresses.
Media Type of 802.11 media, i.e., 802.11b or 802.11g, the device is using.
Signal Signal strength in% or dBm.
Noise Noise level measured in% or dBm.
S/N Signal-to-noise ratio measured in% or dBm.
Security Indicates the security mechanisms used on the WLAN:• N = WEP disabled;• Y = WEP required;• V = PPTP, IPSec, Secure Shell, etc.;• 1x= 802.1x.

AirMagnet Laptop Wireless LAN Analyzer User Guide
Chapter 2: System Navigation 13
Notice that some of the fields in the AP channel allocation screen (Figure 3-8) are also color-coded. Table 3-5 summarizes the color codes.
TK/MIC Indicates TKIP and MIC security settings:• Y = Enabled;• N = Disabled;• U = Unknown.
Bridge Mode • Y=Bridge Mode• N=Non-Bridge Mode
SSID Lists the SSID on each channel
BI Beacon Interval (in milliseconds)
#STA The number of stations found on the channel.
Preamble Preamble value: Long vs. Short.
PCF/DCF Point Coordination Function/Distributed Coordination Function.
First The time the first packet was received.
Last The time the last packet was received.
Table 3-5: AP Channel Allocation Color Codes
Color Description
Red on Channel Indicates outstanding alarms on the channel. Tap on the channel to display the alarms. (Alarm screen)
Red on Device/MAC Address
Indicates the device is inactive with the past 60 seconds. Tap on the MAC address for details. (Infrastructure screen)
Yellow on Device/MAC Address
Indicates the device has been inactive between the past 5 and 60 seconds. Tap on the MAC address for details. (Infrastructure screen)
Table 3-4: WLAN RF Data Summary Table Entries
Icon Description

14 Chapter 2: System Navigation
AirMagnet Laptop Wireless LAN Analyzer User Guide
Figure 3-4 displays top-level information of your WLAN RF environment and is easy to understand. It is especially useful if you want to have a quick grasp of what is going on in or around your WLAN. However, keep in mind that the data on this screen are real-time and dynamic. Old information gets erased as new information comes in. It is for this reason that AirMagnet Laptop comes with a live capture feature that allows you to record data so that they can be replayed at a later time for analysis. The data can be exported as well. For more information, see the section on saving and exporting files later in this user guide.
Green on Device/MAC Address
Indicates the device has been inactive with the last 5 seconds. Tap on the MAC address for detail. (Infrastructure screen)
Grey on Device/MAC Address
Indicates the device is inactive (based on configuration). Tap on the MAC address for details (Infrastructure screen)
Table 3-5: AP Channel Allocation Color Codes
Color Description

AirMagnet Laptop Wireless LAN Analyzer User Guide
Chapter 2: System Navigation 15
Working with the Channel ScreenYou can drill down to the Channel screen by clicking any of the channel bars on the signal meter from the Start screen, or by clicking
from the Navigation Bar. See Figure 3-10.
Figure 3-10
The Channel screen lets you focus on a specific channel for detailed analysis.
Channel Utilization and ThroughputThe top part of the screen consists of two signal meters: one displays channel utilization and the other throughput. The data can be displayed in dBm or percentage. As a rule of thumb, 60% of utilization or 6 Mbps of throughput is a realistic upper limit for an 802.11b network. Constant high channel utilization with most traffic
16 Chapter 2: System Navigation
AirMagnet Laptop Wireless LAN Analyzer User Guide
in 11 Mbps and low packet error rates may indicate that the 802.11b network may not have enough capacity to meet the needs of all its users. One possible solution would be to reduce the cell size and to add access points at strategic locations.
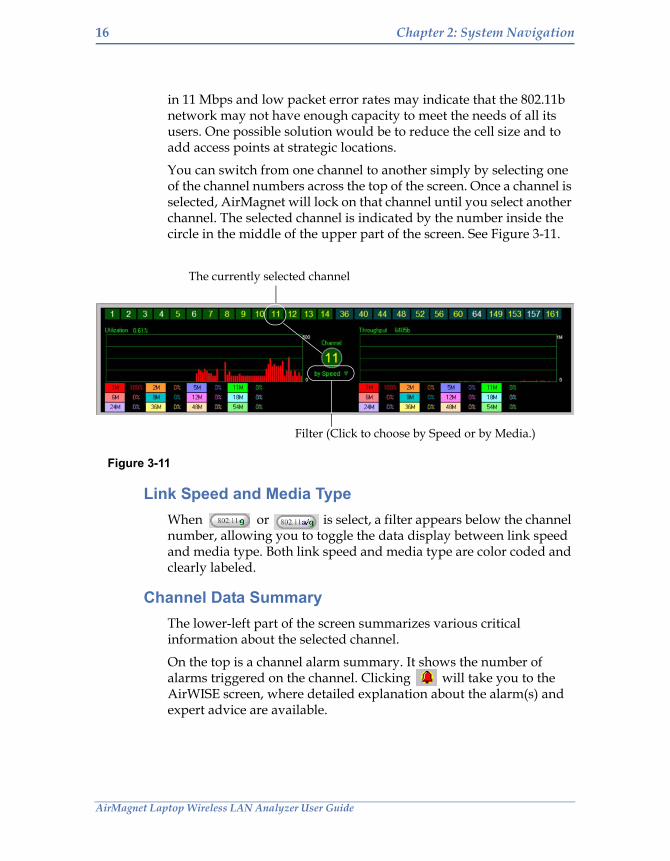
You can switch from one channel to another simply by selecting one of the channel numbers across the top of the screen. Once a channel is selected, AirMagnet will lock on that channel until you select another channel. The selected channel is indicated by the number inside the circle in the middle of the upper part of the screen. See Figure 3-11.
Figure 3-11
Link Speed and Media TypeWhen or is select, a filter appears below the channel number, allowing you to toggle the data display between link speed and media type. Both link speed and media type are color coded and clearly labeled.
Channel Data SummaryThe lower-left part of the screen summarizes various critical information about the selected channel.
On the top is a channel alarm summary. It shows the number of alarms triggered on the channel. Clicking will take you to the AirWISE screen, where detailed explanation about the alarm(s) and expert advice are available.
The currently selected channel
Filter (Click to choose by Speed or by Media.)
AirMagnet Laptop Wireless LAN Analyzer User Guide
Chapter 2: System Navigation 17
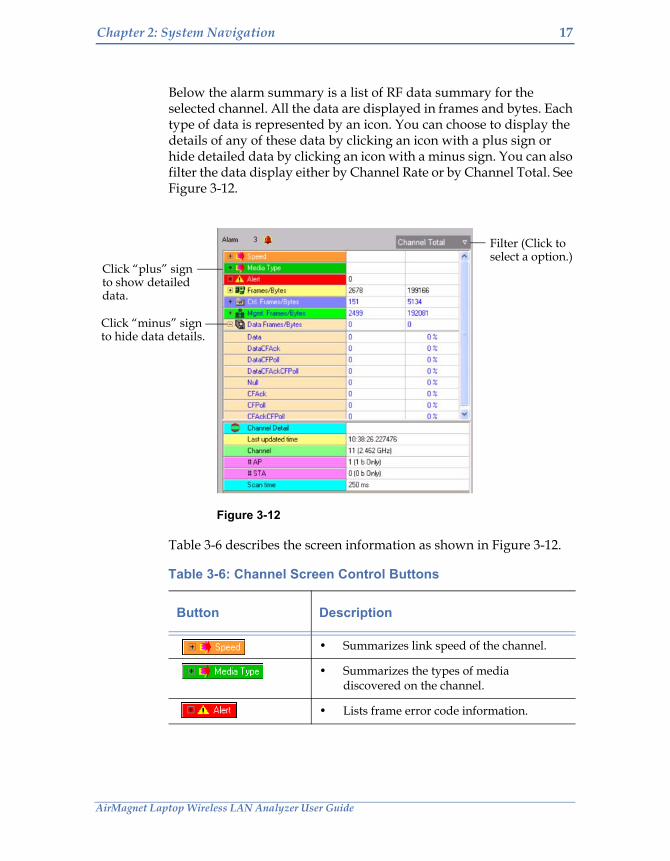
Below the alarm summary is a list of RF data summary for the selected channel. All the data are displayed in frames and bytes. Each type of data is represented by an icon. You can choose to display the details of any of these data by clicking an icon with a plus sign or hide detailed data by clicking an icon with a minus sign. You can also filter the data display either by Channel Rate or by Channel Total. See Figure 3-12.
Figure 3-12
Table 3-6 describes the screen information as shown in Figure 3-12.
Table 3-6: Channel Screen Control Buttons
Button Description
• Summarizes link speed of the channel.
• Summarizes the types of media discovered on the channel.
• Lists frame error code information.
Filter (Click to
Click “plus” sign to show detailed
Click “minus” sign
data.
to hide data details.
select a option.)

18 Chapter 2: System Navigation
AirMagnet Laptop Wireless LAN Analyzer User Guide
The Channel screen makes it easy to detect low link speeds, excessive retries, and cyclic redundancy check (CRC) errors.
Channel Data Graphical Display
Figure 3-13
• Divides frame and byte counts into control, management, data, and CRC error frames.
• Summarizes control frames/bytes.
• Summarizes management frames/bytes.
• Summarizes data frames/bytes.
• Summarizes RF information on the selected channel.
Table 3-6: Channel Screen Control Buttons
Button Description
Data Graph Selector Options
AirMagnet Laptop Wireless LAN Analyzer User Guide
Chapter 2: System Navigation 19
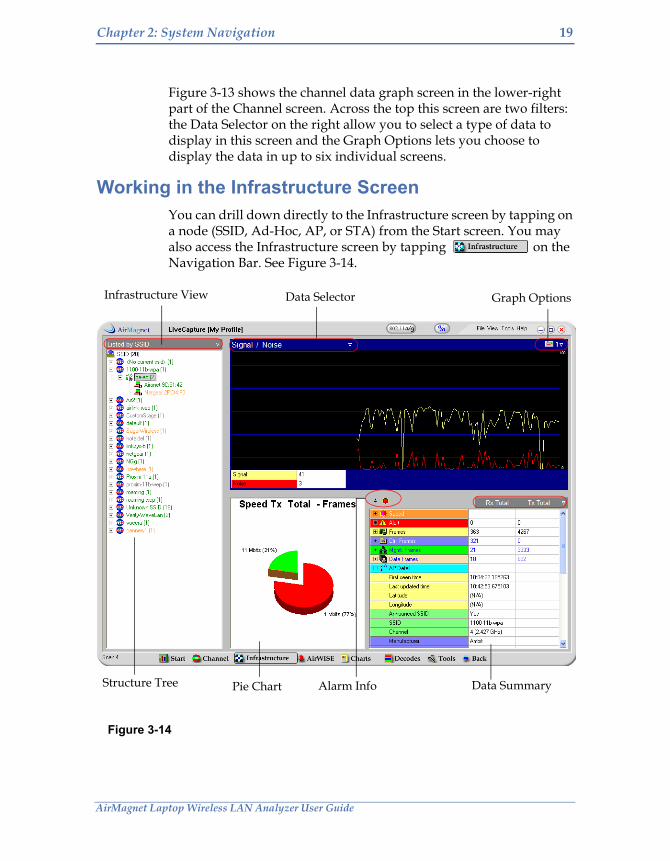
Figure 3-13 shows the channel data graph screen in the lower-right part of the Channel screen. Across the top this screen are two filters: the Data Selector on the right allow you to select a type of data to display in this screen and the Graph Options lets you choose to display the data in up to six individual screens.
Working in the Infrastructure ScreenYou can drill down directly to the Infrastructure screen by tapping on a node (SSID, Ad-Hoc, AP, or STA) from the Start screen. You may also access the Infrastructure screen by tapping on the Navigation Bar. See Figure 3-14.
Figure 3-14
Infrastructure View Data Selector Graph Options
Structure Tree Pie Chart Alarm Info Data Summary

20 Chapter 2: System Navigation
AirMagnet Laptop Wireless LAN Analyzer User Guide
The Network Tree StructureThe left part of the Infrastructure screen displays in an organized form all network nodes detected on your WLAN. You can use the filter on top of the screen to display the network infrastructure by SSID, channel, access point, station, peer-to-peer network, or 802.1x user. Selecting an access point will have all associated stations shown under the access point, identified by MAC or IP address. See Figure 3-14.
Network Infrastructure Color CodesAs seen from the Figure 3-14, SSIDs, APs, and stations on the network tree structure are color-coded. Each color represents a specific RF signal status as described in Table 3-7.
Viewing Detailed Network DataThe right-hand side of the Infrastructure screen displays the data for the selected node on the network tree structure. Selecting an AP or station from the network infrastructure will allow you to display various detailed information about the selected device.
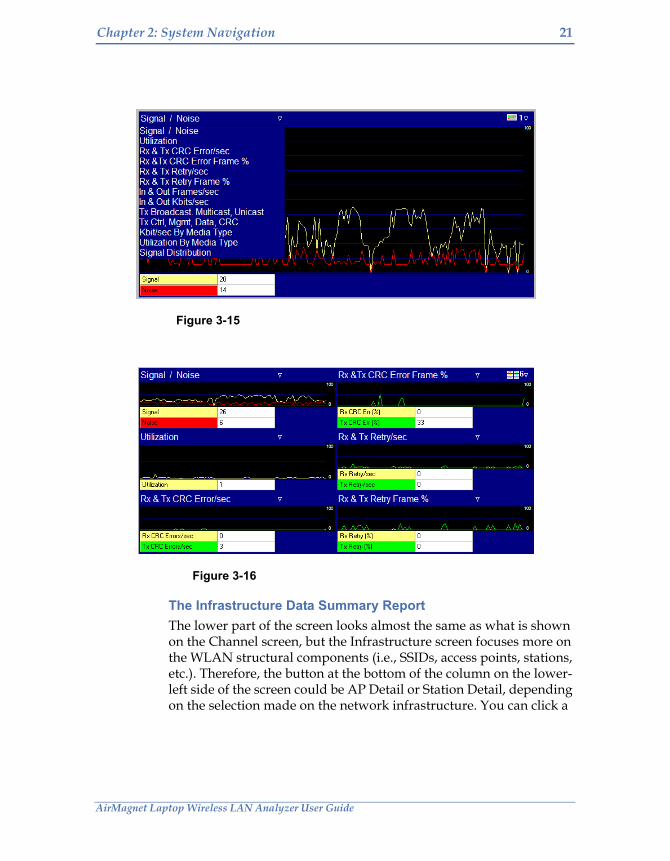
The Infrastructure Data GraphsThe top of the right-hand side of the Infrastructure screen is a graphical display of data for the selected node on the network tree. You can use the Data Selector to choose the data to display and the Graph Options to select a viewing option. See Figures 3-15 and 3-16.
Table 3-7: Infrastructure RF Signal Color Codes
Color Description
Green Signal was detected from the device within the last 5 seconds.
Orange Signal was detected from the device between the last 5 and 60 seconds.
Red Signal was detected form the device over the last 60 seconds.
Grey No signal was detected from the device (based on configuration).
AirMagnet Laptop Wireless LAN Analyzer User Guide
Chapter 2: System Navigation 21
Figure 3-15
Figure 3-16
The Infrastructure Data Summary ReportThe lower part of the screen looks almost the same as what is shown on the Channel screen, but the Infrastructure screen focuses more on the WLAN structural components (i.e., SSIDs, access points, stations, etc.). Therefore, the button at the bottom of the column on the lower-left side of the screen could be AP Detail or Station Detail, depending on the selection made on the network infrastructure. You can click a

22 Chapter 2: System Navigation
AirMagnet Laptop Wireless LAN Analyzer User Guide
plus sign to show detailed data, and the selected data will be displayed in the pie chart. (See the section below.) You can also customize the data display using the filter in the upper-right corner of the screen. See Figure 3-17.
Figure 3-17
The Infrastructure Data Pie ChartThe pie chart displays data for the selected AP or station from the network tree. You can display the data by Speed, Alert, Frames, Control Frames, Management Frames, Data Frames, or AP Detail (or Station Detail if a station is selected), by clicking the corresponding icon on the right.
The Alarm StatusThe Alarm Status shows the number of alarms that have been occurred involving the selected network nodes (i.e., SSID, AP, or station). Clicking will take to the AirWISE screen where you can view detailed information about the alarm(s).
Alarm Status
AirMagnet Laptop Wireless LAN Analyzer User Guide
Chapter 2: System Navigation 23
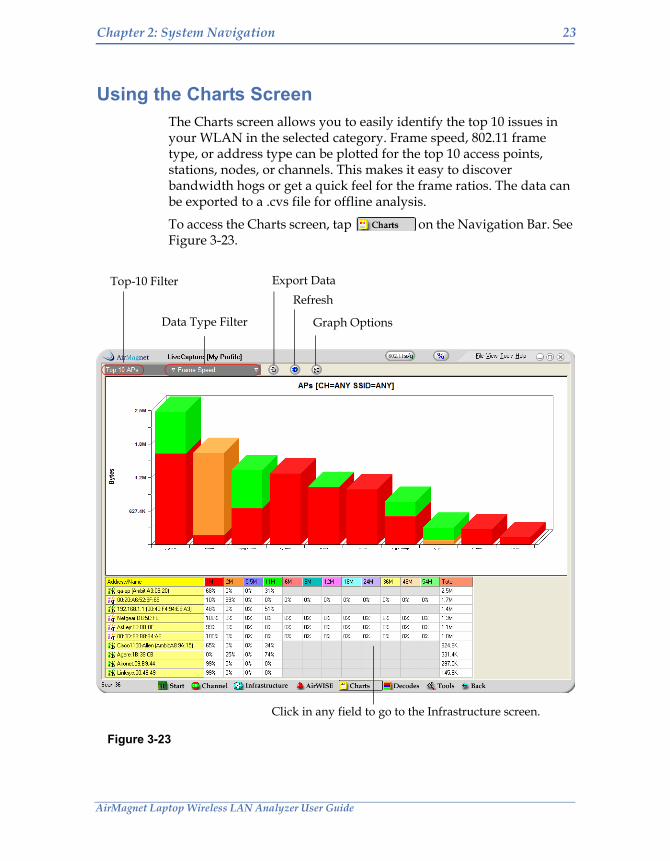
Using the Charts ScreenThe Charts screen allows you to easily identify the top 10 issues in your WLAN in the selected category. Frame speed, 802.11 frame type, or address type can be plotted for the top 10 access points, stations, nodes, or channels. This makes it easy to discover bandwidth hogs or get a quick feel for the frame ratios. The data can be exported to a .cvs file for offline analysis.
To access the Charts screen, tap on the Navigation Bar. See Figure 3-23.
Figure 3-23
Export DataRefresh
Graph Options
Top-10 Filter
Data Type Filter
Click in any field to go to the Infrastructure screen.

24 Chapter 2: System Navigation
AirMagnet Laptop Wireless LAN Analyzer User Guide
Choosing a Top-10 CategoryIn the upper-left corner of the Charts screen is a Top-10 filter, which contains four top-10s for you to choose from. The options are Top 10 APs, Top 10 STAs, Top 10 nodes, and Top 10 Channels.
Choosing a Data TypeTo the right of the Top-10 Filter is the Data Type Filter that allows you to fine-tune the top-10 using any of the following filters:
• Frame Speed
• 802.11 Frame Type
• Address Type
• Media Type
Choosing a Graph OptionAirMagnet allows the user to configure their chart settings using the Graph Option button on the Charts screen.
To configure chart settings,
1) Click across the top of the Charts scree. The Chart Option dialog box appears. See Figure 3-24.
Figure 3-24
AirMagnet Laptop Wireless LAN Analyzer User Guide
Chapter 2: System Navigation 25
2) Make the desired selections, and click OK.
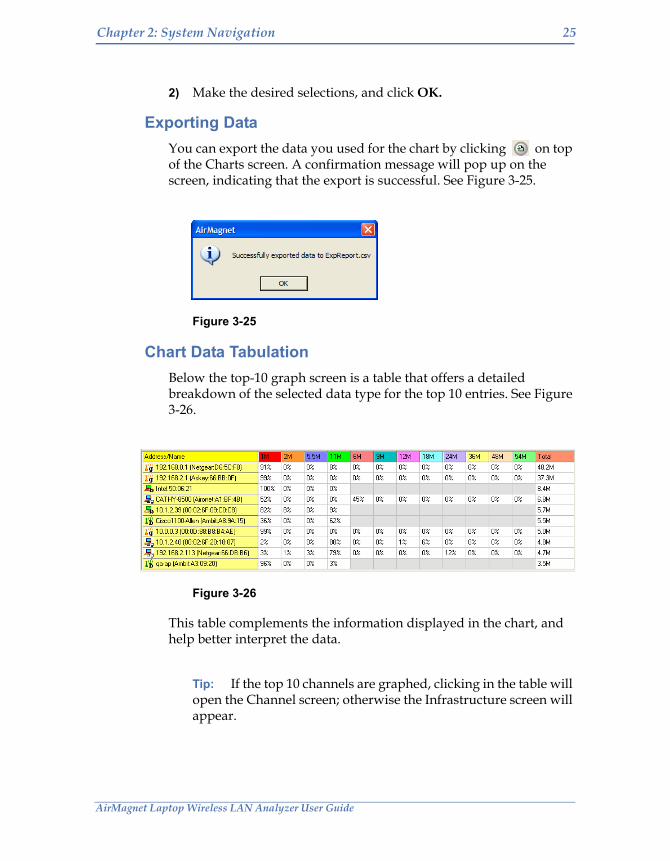
Exporting DataYou can export the data you used for the chart by clicking on top of the Charts screen. A confirmation message will pop up on the screen, indicating that the export is successful. See Figure 3-25.
Figure 3-25
Chart Data TabulationBelow the top-10 graph screen is a table that offers a detailed breakdown of the selected data type for the top 10 entries. See Figure 3-26.
Figure 3-26
This table complements the information displayed in the chart, and help better interpret the data.
Tip: If the top 10 channels are graphed, clicking in the table will open the Channel screen; otherwise the Infrastructure screen will appear.

26 Chapter 2: System Navigatio n
AirMagnet Laptop Wireless LAN Analyzer User Guide
Working with the Decodes ScreenYou can access the Decodes screen by clicking on the Navigation Bar. See Figure 3-27.
Figure 3-27
Check to activate filtering
Select Filter
Edit Filter
Pause Capture
Stop CaptureSelect Channel

AirMagnet Laptop Wireless LAN Analyzer User Guide
Chapter 2: System Navigation 27
The Decodes screen lets you view a scrolling list of packet frames as they are captured. Table 3-8 briefly describes the information on the Decodes screen.
Filtering Packet CapturesIn the upper-left corner of the Decodes screen is a Filter check box. When checked, it will activate the filtering feature so that you can select a filter from the filter list on the right. You can configure the capture filter to restrict the capture to a specific channel, SSID, AP, station, or frame type. See the following section for more information.
Editing Packet Capture FilterYour AirMagnet comes with the factory default filter settings. You can also configure you own filters as well. In either case, there are times when you may want to modify the filters. This can be done by clicking to open the filter configuration screen, where you can make changes to the selected filter. See Chapter 4 for more information.
Table 3-8: Decode Screen Parameters
Field Description
No The sequence of the captured packets. Shown only when packet capture is stopped.
Frame Gap The time gap between two frames.
CH Channel.
S Signal strength.
Length Frame length.
Source Source node.
Destination Destination node.
Summary Data packet summary.

28 Chapter 2: System Navigation
AirMagnet Laptop Wireless LAN Analyzer User Guide
Focusing Packet Capture on a Specific ChannelYou can select a specific channel as well simply by choosing a channel from the Select Channel drop-down list.
Analyzing Packet CapturesYou can stop the live capture temporarily by tapping so that you can take a closer look at the list of decode summary on the screen. You can then tap to resume the packet capture.
You can also conduct in-depth analysis of the captured packets by clicking . This will stop the live capture and open another Decodes screen where you can look into the captured packets to discover any hidden problems. See Figure 3-28.
Figure 3-28
List of Captured Packets
Packet Analysis Screen
AirMagnet Laptop Wireless LAN Analyzer User Guide
Chapter 2: WLAN Management Tools 29
Using the Charts Screen
Chapter SummaryThis chapter discusses the use of various advanced WLAN network management tools that come with AirMagnet Laptop Wireless LAN Analyzer.
The tools allow you to conduct the following WLAN management duties:
• Conducting site survey.
• Testing link performance.
• Performing WLAN diagnostics.
• Pinpointing the location of WLAN devices.
• Troubleshooting link connection with Ping tool.
• Tracing network device.
• Using the Whois tool.
• Using the GPS Log.
• Managing ACL.
• Measuring WLAN or cell coverage.
• Testing site RF signal distribution.
• Measuring RF jitter.
• Conducting roaming tests.

30 Chapter 2: WLAN Management Tools
AirMagnet Laptop Wireless LAN Analyzer User Guide
Conducting a Site SurveyA site survey is an in-depth inspection and analysis of a proposed WLAN site. The primary objective of the site survey is to ensure that mobile client stations receive good signals and transmission throughput rate in the area where the mobile stations operate, to determine the number of access points needed to cover the area and their placements.
A thorough site survey helps you assure the design and deployment of the WLAN meets the RF signal coverage and network bandwidth requirement before the network is turned on for operation.
The AirMagnet built-in site survey utility complements the site survey program that comes with the WLAN products you purchased from your WLAN vendor.
Consult your manufacturer’s site survey guide, supplied as part of your WLAN equipment, for complete requirements and procedures for a WLAN site survey.
Before you start gathering data of your site survey project, you must obtain a blueprint or a CAD drawing of the building or office layout. You should also determine the location where you wish to take survey data with simple identifications; for example, Location 1, Location 2, etc.
Configuring Survey Logging OptionsConfiguring logging options allows you to decide how the data should be collected.
AirMagnet Laptop Wireless LAN Analyzer User Guide
Chapter 2: WLAN Management Tools 31
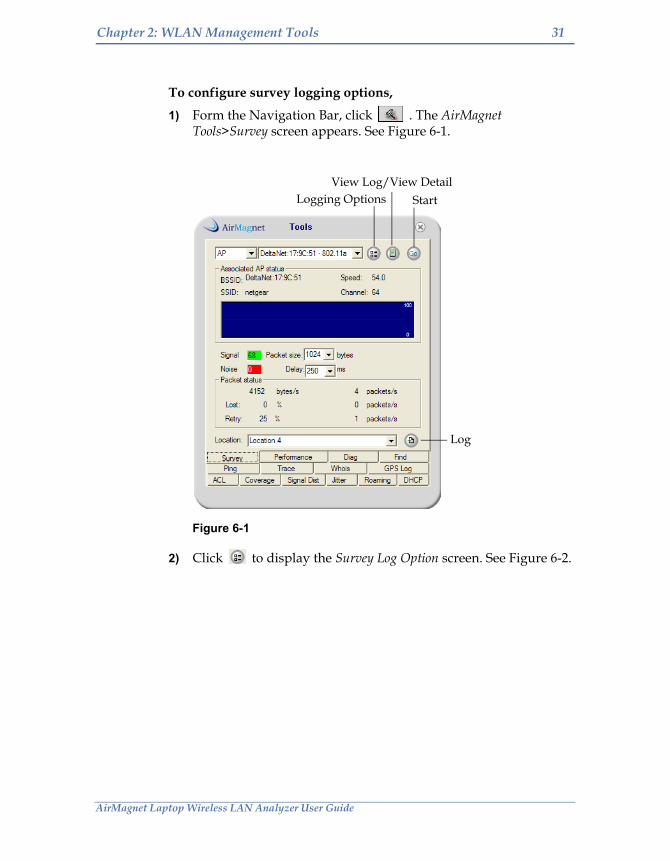
To configure survey logging options,
1) Form the Navigation Bar, click . The AirMagnet Tools>Survey screen appears. See Figure 6-1.
Figure 6-1
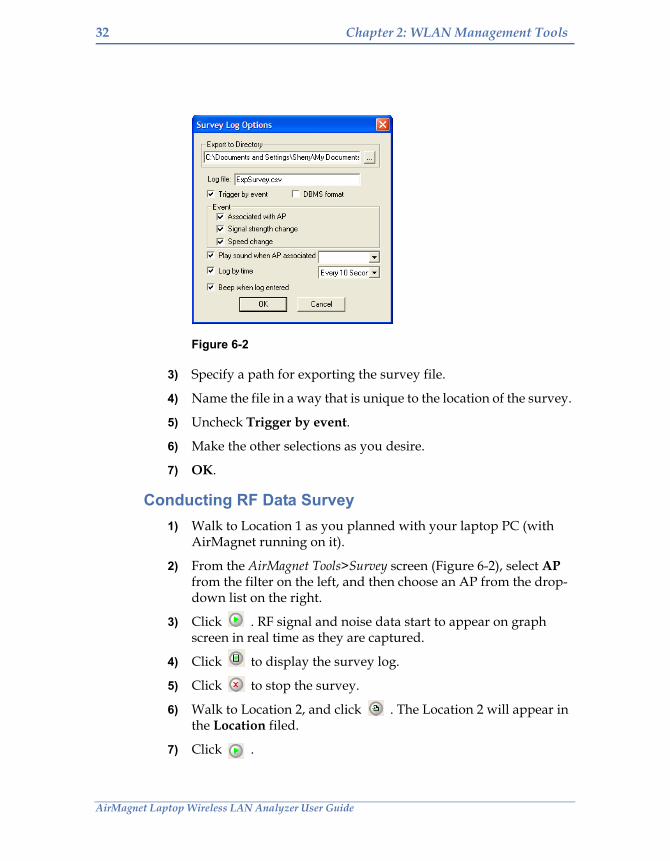
2) Click to display the Survey Log Option screen. See Figure 6-2.
Logging OptionsView Log/View Detail
Start
Log
32 Chapter 2: WLAN Management Tools
AirMagnet Laptop Wireless LAN Analyzer User Guide
Figure 6-2
3) Specify a path for exporting the survey file.
4) Name the file in a way that is unique to the location of the survey.
5) Uncheck Trigger by event.
6) Make the other selections as you desire.
7) OK.
Conducting RF Data Survey1) Walk to Location 1 as you planned with your laptop PC (with
AirMagnet running on it).
2) From the AirMagnet Tools>Survey screen (Figure 6-2), select AP from the filter on the left, and then choose an AP from the drop-down list on the right.
3) Click . RF signal and noise data start to appear on graph screen in real time as they are captured.
4) Click to display the survey log.
5) Click to stop the survey.
6) Walk to Location 2, and click . The Location 2 will appear in the Location filed.
7) Click .

AirMagnet Laptop Wireless LAN Analyzer User Guide
Chapter 2: WLAN Management Tools 33
8) Follow the same procedures to collect data at the other locations.
Tip: Upon completion of the survey, you can use a third-party software, such as Excel or Visio, to tabulate or plot the RF signal coverage.
Conducting a Network Performance Load Test
Important This test generates a large amount of WLAN traffic between the AirMagnet Laptop Analyzer and the selected Access Point, but not to the wired-side of the LAN.
The AirMagnet Performance tool is designed to serve the following purposes:
• Measuring maximum WLAN bandwidth from a given location.
• Finding the optimum 802.11 WLAN configuration for maximum throughput.
• Testing WLAN devices, especially the access points under various traffic stress.
The AirMagnet Performance tool conducts these tests and measurements by associating with the specified Access Points and generating stress traffic according to the specified performance test parameters such as:
• Transmission speed (1, 2, 5.5, 11 Mbps, or auto).
• 802.11 RTS/CTS activation.
• 802.11 retransmission configuration.
• 802.11 fragmentation configuration.

34 Chapter 2: WLAN Management Tools
AirMagnet Laptop Wireless LAN Analyzer User Guide
To conduct a network performance load test,
1) From AirMagnet Tools screen, click the Performance tab. The AirMagnet Tools>Performance screen appears. See Figure 6-3.
Figure 6-3
2) Click the down arrow and select an AP,
3) Specify the desired performance test parameters, and click .
Note: The test consists of constant echo traffic generation targeted at the selected AP and echo response monitoring. Test results are periodically updated on the screen. The ultimate number on the screen to pay attention to is the ‘kb/s’ (kilo bits per second) throughput. Other test results, such as the percentage of deferred transmit, frame retries, frame fragmentation, and lost frames may offer explanation to sub-optimum throughput numbers.
Note: You may consider changing the performance test parameters such as Use RTS and rerunning the test in order
Export
Start

AirMagnet Laptop Wireless LAN Analyzer User Guide
Chapter 2: WLAN Management Tools 35
to find the optimum 802.11 WLAN configuration for maximized throughput.
4) Click to stop the test.
Exporting Performance Test ResultsYou may export the results of your network performance for record-keeping, information-sharing, or further analysis.
To export performance test data,
1) Click . The Performance Results Export screen appears. See Figure 6-4.
Figure 6-4
2) Specify the export path, and name the file with a unique name.
3) Click OK.
Diagnosing Network Connectivity IssuesWithout intelligent tools, the process of troubleshooting a problem connection between a client station and an AP can be an incredible drain on professional resources. The AirMagnet Diagnostic tool identifies mismatched configurations, such as SSIDs, WEP keys, transmission rates, preamble, or RF channels. It also helps isolate the problem to the specific step in the association process where the connection is failing. These steps include probe discovery, authentication, re-association, and potential hardware failures.

36 Chapter 2: WLAN Management Tools
AirMagnet Laptop Wireless LAN Analyzer User Guide
To diagnose a client station connection problem,
1) Locate the client station’s MAC address from the client configuration utility program, or from the back of the 802.11 WLAN card.
2) Keep the client station running.
3) Place a laptop PC (with AirMagnet running on it) next to the client station.
4) From the AirMagnet Tools screen, select the Diag tab. The Tools>Diag screen appears. See Figure 6-5.
Figure 6-5
5) For STA, select the client station MAC address from the STA drop-down list.
View List
View LogView Result
StartExport
802.11/802.1x
AirMagnet Laptop Wireless LAN Analyzer User Guide
Chapter 2: WLAN Management Tools 37
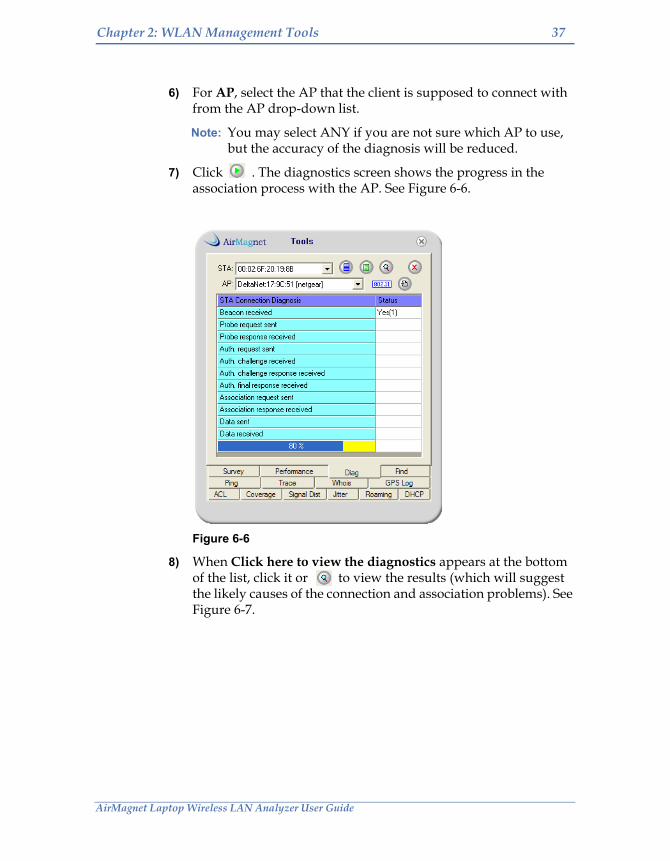
6) For AP, select the AP that the client is supposed to connect with from the AP drop-down list.
Note: You may select ANY if you are not sure which AP to use, but the accuracy of the diagnosis will be reduced.
7) Click . The diagnostics screen shows the progress in the association process with the AP. See Figure 6-6.
Figure 6-6
8) When Click here to view the diagnostics appears at the bottom of the list, click it or to view the results (which will suggest the likely causes of the connection and association problems). See Figure 6-7.

38 Chapter 2: WLAN Management Tools
AirMagnet Laptop Wireless LAN Analyzer User Guide
Figure 6-7
9) Click to view the step-by-step log.
10) Click to display 802.1x process information.
11) Click to export the log data.
12) Click to stop the diagnostics.
Finding Rogue DevicesAirMagnet not only can detect the presence of rogue APs or stations, but can also help find the physical location of any rogue devices that have been detected. This can be easily done using AirMagnet’s Find tool.
To locate a rogue device,
1) From the AirWISE screen, look for alarms under Rogue APs and client.
2) Identify an rogue AP or client, and record its SSID and MAC address.

AirMagnet Laptop Wireless LAN Analyzer User Guide
Chapter 2: WLAN Management Tools 38
3) From the AirMagnet Tools screen, select Find. The AirMagnet Tools>Find screen appears. See Figure 6-8
Figure 6-8
4) From the SSID list, select the SSID of the rogue device you have recorded.
5) Choose the channel the rogue device was using.
6) Specify what to find: AP vs. STA.
7) Click . The MAC addresses of the top 10 APs or stations with the same SSID will appear in the table, with the strongest one topping the list.
8) Find the MAC address of rogue device, and click in the field under to lock on its signal.
9) Look at the signal meter, and walk in the direction in which the signal gets stronger as you walk.
Audio on/offVolume Level
Select AP or STA
Select a channel
Start/Stop
Click to lock on the channel.
dBm/%

39 Chapter 2: WLAN Management Tools
AirMagnet Laptop Wireless LAN Analyzer User Guide
10) Turn on the audio and set the volume to High. This will make it even easier to locate the rogue device.
Managing WLAN Access Control List (ACL)Chapter 4 described the procedure to create an ACL (Access Control List). In this section, we will introduces the ACL tool that is used to check the ACL against the current devices discovered by AirMagnet. Such checks will help WLAN administrators:
• Identify new devices to add to the ACL
• Identify missing or malfunctioning devices
To use the ACL feature,
1) Make sure your ACL is configured. Refer to Chapter 4.
2) Patrol the intended coverage area with your AirMagnet Laptop Analyzer to discover the currently existing WLAN devices.
3) From the AirMagnet Tools screen, click the ACL tab. The Tools>ACL screen appears. See Figure 6-9.
Figure 6-9
AirMagnet Laptop Wireless LAN Analyzer User Guide
Chapter 2: WLAN Management Tools 40
This ACL screen displays information about the devices that are in the ACL as well as new devices that AirMagnet has just discovered.
The first column in the ACL screen as indicated by (Radio) shows the device’s radio signal status. It may contain one of the following two icons:
—The device’s radio is active and is discovered by AirMagnet Analyzer.
—The device’s radio is inactive and is not discovered by AirMagnet Analyzer. In this case, the WLAN administrator to investigate these possibilities:
• If this WLAN access point is missing or not functioning properly.
• If this WLAN access point is no longer deployed and therefore should be removed from the ACL.
The second column as indicated by shows whether or not this device is in the current ACL. It may contain one of the following two icons:
—The device is in the current ACL.
—The device is not in the current ACL. In this case, the WLAN administrator to investigate these possibilities:
• If this WLAN access point is an unauthorized access point (an AirMagnet security alarm should have already been generated in this case).
• If this is a new WLAN access point and therefore should be added to the ACL.
Adding a Newly Discovered DeviceTo add a newly discovered device to the ACL,
1) Check the AP or STA radio button.
2) Identify the device from table.
3) Highlight the entry.
4) Click Add.
41 Chapter 2: WLAN Management Tools
AirMagnet Laptop Wireless LAN Analyzer User Guide
Removing an Entry Off the ACLTo remove an entry off the ACL,
1) Select the entry in the table.
2) Click Del.
Exporting an ACLTo export an ACL,
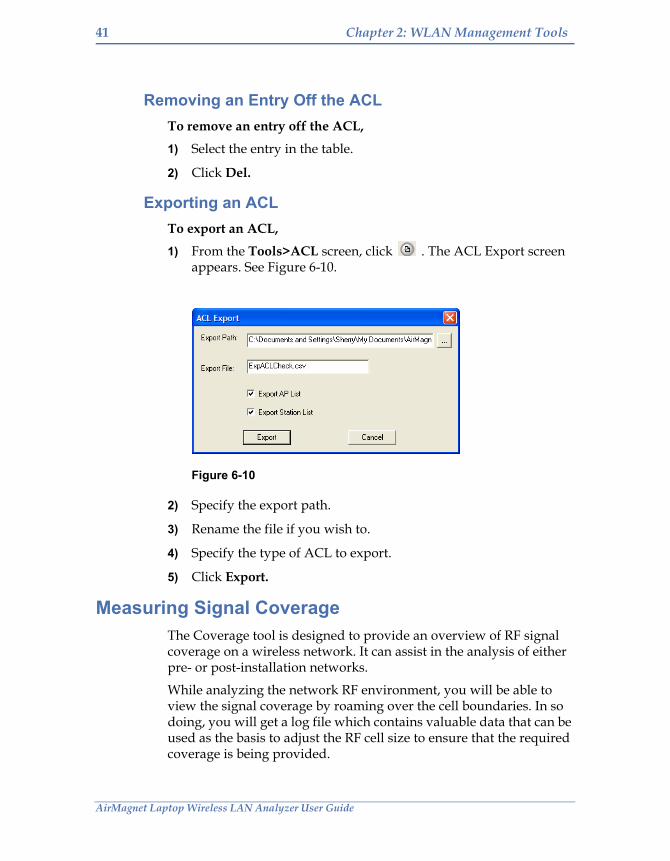
1) From the Tools>ACL screen, click . The ACL Export screen appears. See Figure 6-10.
Figure 6-10
2) Specify the export path.
3) Rename the file if you wish to.
4) Specify the type of ACL to export.
5) Click Export.
Measuring Signal CoverageThe Coverage tool is designed to provide an overview of RF signal coverage on a wireless network. It can assist in the analysis of either pre- or post-installation networks.
While analyzing the network RF environment, you will be able to view the signal coverage by roaming over the cell boundaries. In so doing, you will get a log file which contains valuable data that can be used as the basis to adjust the RF cell size to ensure that the required coverage is being provided.

AirMagnet Laptop Wireless LAN Analyzer User Guide
Chapter 2: WLAN Management Tools 42
Configuring Signal Coverage Test SettingsYou make want to set up some parameters before you actually start a signal coverage test. This will ensure that you’ll get the data you want.
To configure signal coverage test settings,
1) From the AirMagnet Tools screen, select the Coverage tab. The AirMagnet Tools>Coverage screen appears. See Figure 6-11.
Figure 6-11
2) Click . The Coverage Configuration screen appears. See Figure 6-12.
Switch Graph Type
Export
Start/Stop

43 Chapter 2: WLAN Management Tools
AirMagnet Laptop Wireless LAN Analyzer User Guide
Figure 6-12
3) Make the desired selections and click OK.
Measuring Site RF Signal Coverage To measure the site RF signal coverage,
4) From the AirMagnet Tools>Coverage screen, select an SSID from the drop-down list.
5) Click . Data will start to appear on the screen.
The Coverage tool screen provides a complete picture of the RF signal coverage the selected SSID(s) can provide. The tool also shows the amount of traffic that is above the Minimum Service Level you have specified.
If you have three APs set up to cover your facility, you can simply take AirMagnet Analyzer and roam the coverage area. Then by viewing the signal levels of all the APs, you can easily adjust the APs’ transmission power or relocated the APs to provide adequate or optimized RF signal coverage.
Measuring Signal DistributionThe Signal Distribution tool is designed to detect RF signal problems such signal Multipath. It provides the user with an easy way to monitor WLAN RF signal distribution patterns and to visualize issues that would other be difficult to see and analyze.

AirMagnet Laptop Wireless LAN Analyzer User Guide
Chapter 2: WLAN Management Tools 44
Configuring Signal Distribution Tool SettingsTo configure the Signal Distribution tool settings,
1) From the AirMagnet Tools screen, select the Signal Dist tab. The Signal Distribution screen appears. See Figure 6-13.
Figure 6-13
2) Click . The Signal Distribution Option screen appears. See Figure 6-14.
Logging Options Start/Stop

45 Chapter 2: WLAN Management Tools
AirMagnet Laptop Wireless LAN Analyzer User Guide
Figure 6-14
3) Make the desired selections, and click OK.
Conducting a Signal Distribution Test1) From the upper-left corner of the Tools>Signal Dist screen, select
AP or STA, and select a specific AP or STA on the right.
2) Click . Signal distribution data start to appear on the screen. See Figure 6-15.
Figure 6-15

AirMagnet Laptop Wireless LAN Analyzer User Guide
Chapter 2: WLAN Management Tools 46
The cluster of yellow dashes shown in Figure 6-15 represent the RF signal per packet being seen from the current location. In case of good signal distribution, the dashes should be all close together within a narrow range. It means that the site RF signals are consistent in strength with little variation. On the other hand, if the dashes are scattered all over the screen, it means the signal strength is varying and you may be having a problem that warrants your attention.
Measuring RF Signal JitterJitter refers to unwanted variations in the frequency or phase of a digital or analog signal. VoWLAN phones and systems are designed to accommodate a certain amount of jitter in the network. However, if the jitter value gets too high, the quality of calls or network connections may suffer.
Configuring Jitter Tool OptionsTo configure Jitter Tool Options,
1) From the AirMagnet Tools screen, select the Jitter tab. The Jitter tool screen appears. See Figure 6-16.
Figure 6-16
47 Chapter 2: WLAN Management Tools
AirMagnet Laptop Wireless LAN Analyzer User Guide
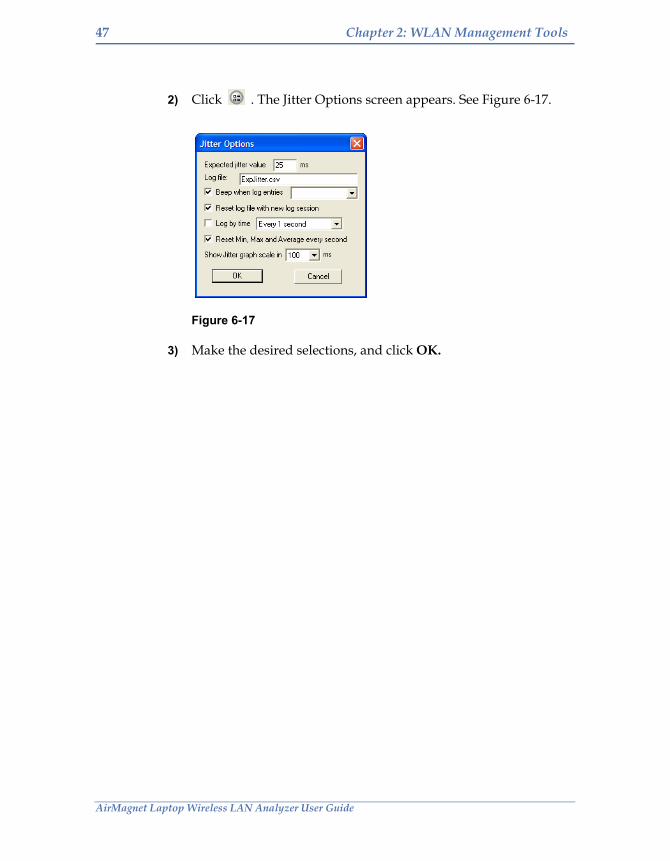
2) Click . The Jitter Options screen appears. See Figure 6-17.
Figure 6-17
3) Make the desired selections, and click OK.

AirMagnet Laptop Wireless LAN Analyzer User Guide
Chapter 2: WLAN Management Tools 48
Conducting a Signal Jitter TestTo measure RF signal jitter,
1) From the Jitter tool screen, select a station, and click . The Jitter screen appears. See Figure 6-18.
Figure 6-18
Table 6-1: Jitter Tool Screen Parameters
Parameters Description
AP The AP the station is associating with. Automatically detected.
CH The channel the AP is operating on. Automatically detected.
Util Channel utilization rate.
Noise Noise level in dBm.

49 Chapter 2: WLAN Management Tools
AirMagnet Laptop Wireless LAN Analyzer User Guide
Measuring Roaming ConnectivityThe Roaming tool is another feature designed to help troubleshoot VoWLAN installations. A key component of voice WLANs is the ability to roam between APs without dropping the call. If the roam time is too long, the chances that the call will be dropped increases considerably. With the AirMagnet Roaming tool, the user can measure the roaming delay between when a station disassociates from one AP and then associates with another AP.
CRC% CRC error rate.
DTIM DTIM configuration on the AP.
In Pkts Incoming packets from the AP.
Retry% Retry rate.
STD Standard deviation
Min. Minimum jitter value.
Max. Maximum jitter value.
Average Average jitter value.
Out Pkts outgoing packets to the AP.
Upper graph Incoming packet jitter distribution from 0 to 100 ms.
Lower graph Outgoing packet jitter distribution from 0 to 100 ms.
Red horizontal line The expected jitter value.
Table 6-1: Jitter Tool Screen Parameters
Parameters Description

AirMagnet Laptop Wireless LAN Analyzer User Guide
Chapter 2: WLAN Management Tools 50
Configuring Roaming Tool SettingsTo measure roaming connectivity,
1) From the Tools screen, select the Roaming tab. The Roaming tool screen appears. See Figure 6-19.
Figure 6-19
2) Click . The Roaming Options screen appears. See Figure 6-20.
Figure 6-20

51 Chapter 2: WLAN Management Tools
AirMagnet Laptop Wireless LAN Analyzer User Guide
3) Make the desired selections, and click OK.
Conducting a Roaming TestTo conduct a roaming test,
1) From the top of the Roaming tool screen, select SSID or AP, and choose a specific SSID or AP from the drop-down list.
2) Click . Data will start to appear on the screen. See Figure 6-21.
Figure 6-21
As seen from Figure 6-21, the Roaming tool tests the switching between two APs and the time it takes for the associations. By looking at the data on the screen, the user can discover issues that may exist.

AirMagnet Laptop Wireless LAN Analyzer User Guide
Chapter 2: WLAN Management Tools 52
Testing End-to-End WLAN ConnectivityWLAN connectivity problems can stem from a 802.11 data link layer malfunction, or IP network layer configuration issues. These end-to-end connectivity tests can be performed using AirMagnet’s DHCP, Ping, and Trace tools.
In order to troubleshoot and pinpoint the root cause, the interaction between the two networking layers must be investigated in a different way than you would with a wired LAN. AirMagnet provides a set of uniquely integrated tools to address these anomalies.
In order to achieve end-to-end network connectivity, a wireless device typically goes through the following four phases to reach the other end node for communication:
• Associate with a WLAN access point at the data link layer
• Use DHCP to acquire IP address for itself, default gateway, and DNS server
• Use DNS server to resolve the other end node’s domain name to an IP address
• Use the default gateway to reach the end node, via the resolved IP address
Diagnostic ProceduresVarious network circumstances can make these steps misbehave, thereby breaking the end-to-end connectivity. AirMagnet assists IT professionals in identifying these issues. The following four diagnostic steps are developed so one can use AirMagnet integrated tools to track down problems in the above four steps.
Step 1: Verifying Station-AP AssociationAirMagnet DHCP utility emulates a WLAN client acquiring IP level connectivity beginning from the initial 802.11 client association procedure. It can be used to confirm the association with a WLAN access point.

53 Chapter 2: WLAN Management Tools
AirMagnet Laptop Wireless LAN Analyzer User Guide
To activate the DHCP tool,
1) From the Tools screen, select the DHCP tab. The DHCP tool screen appears. See Figure 6-22.
Figure 6-22
2) Select AP or SSID, and choose a specific AP or SSID.
3) Click Associate. AirMagnet will initiate the association process either with the AP or SSID to match your selection.
Note: During the association process, AirMagnet will use the 802.11 configuration parameters such as the WEP keys you entered in the AirMagnet Configuration page, which you can access using File>Configure...>802.11. The associated AP and SSID will be displayed on the screen.
Note: If an unintended AP was associated or the association fails as will be indicated by an AirMagnet error message, you have confirmed that a data link layer problem exists. Such a problem can be best diagnosed with AirMagnet by using the tools described here.
AirMagnet Laptop Wireless LAN Analyzer User Guide
Chapter 2: WLAN Management Tools 54
Step 2: Verifying the DHCP Acquisition of IP AddressAfter the proper association to the desired AP has been confirmed in Phase 1, the next step is to verify the DHCP acquisition of IP addresses for client service, default gateway, and DNS server.
To verify the DHCP acquisition of IP addresses,
1) From the DHCP tool screen, click Renew to initiate the DHCP request. A successful DHCP request/reply will fill in the following IP level configuration parameters on your screen:
• Device IP address
• Subnet mask
• Default gateway
• DNS server
Note: If these parameters are not the ones you expected or if you received an AirMagnet DHCP failure message, the problem result from a bad WEP key configuration. If the problem persists after verifying the correct WEP key configuration, then the cause of your connectivity problem may be in your DHCP server.
2) (Upon verification of all the IP configuration parameters), click the Ping tab to open the Ping tool screen. See Figure 6-23.

55 Chapter 2: WLAN Management Tools
AirMagnet Laptop Wireless LAN Analyzer User Guide
Figure 6-23
Note: The associated AP from the DHCP screen should show up on the Ping tool screen to indicate that the association is maintained.
3) To start testing the IP subnet connectivity, enter the default gateway IP address and tap . You should see Ping responses on the screen with RTT (Round Trip Time) less than 100 milliseconds. See Figure 6-24.

AirMagnet Laptop Wireless LAN Analyzer User Guide
Chapter 2: WLAN Management Tools 56
Figure 6-24
Important If the Ping test shows a timeout, then IP connectivity with the local LAN has failed. At this point, check on the health of the default gateway and the physical connection between the associated AP and the wired LAN.
Step 3: Verifying DNS Name ResolutionNow that you have verified connectivity with the local subnet and your default gateway, you will confirm DNS name resolution.

57 Chapter 2: WLAN Management Tools
AirMagnet Laptop Wireless LAN Analyzer User Guide
To confirm DNS name resolution,
1) From the Ping page, enter a host name on your corporate network, such as your internal Web server, for example, www.internal.MyCompany.com.
2) Click . The Ping test should report Ping responses and their corresponding RTT (Round Trip Time).
Note: If AirMagnet displays an error message on the domain name resolution, check on the health of your DNS server.
Step 4: Reaching an End Node with Default GatewayThe final test is to communicate with the end node, which may be on the internet.
To connect to an end node from the default gateway,
1) From the same Ping page, enter the end node’s domain name, for example, www.yahoo.com.
2) Click . This Ping test verifies end-to-end IP network connectivity.
Tracing Connectivity BreakageIf Ping requests time out, the AirMagnet Trace utility can be used to isolate the routing path and locate breakage.
AirMagnet Laptop Wireless LAN Analyzer User Guide
Chapter 2: WLAN Management Tools 58
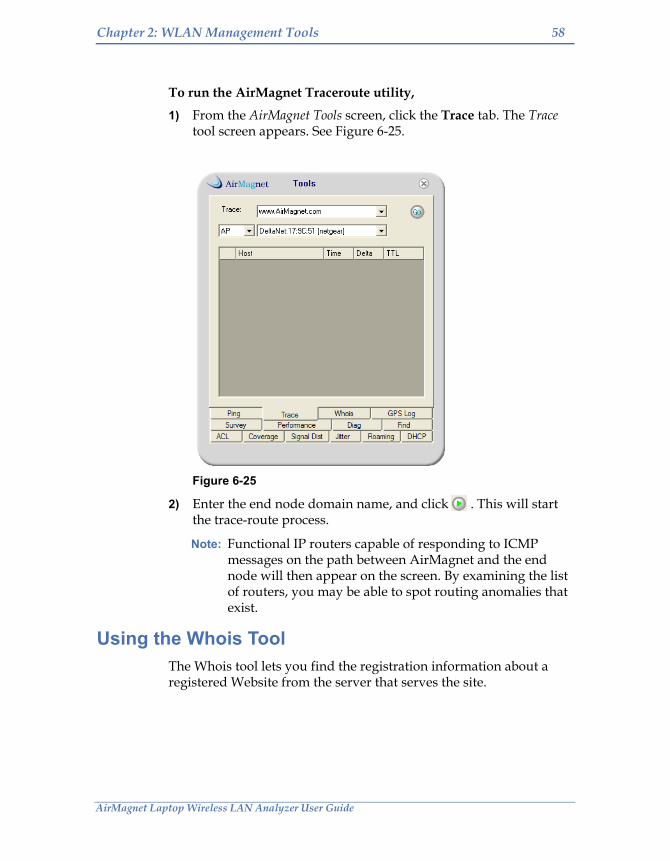
To run the AirMagnet Traceroute utility,
1) From the AirMagnet Tools screen, click the Trace tab. The Trace tool screen appears. See Figure 6-25.
Figure 6-25
2) Enter the end node domain name, and click . This will start the trace-route process.
Note: Functional IP routers capable of responding to ICMP messages on the path between AirMagnet and the end node will then appear on the screen. By examining the list of routers, you may be able to spot routing anomalies that exist.
Using the Whois ToolThe Whois tool lets you find the registration information about a registered Website from the server that serves the site.

59 Chapter 2: WLAN Management Tools
AirMagnet Laptop Wireless LAN Analyzer User Guide
To use the Whois tool,
1) From the Tools screen, click the Whois tab. The Whois tool screen appears. See Figure 6-26.
Figure 6-26
2) Enter a Web address.
3) Enter the name of a server.
4) Click . Information about the Website will appear on the screen.
5) Look through the list of IPs to locate the IP of the device.
Using the GPS Log ToolThe GPS Log allow you to find the exact location of a device that AirMagnet has detected. You need to have a GPS device connected to the laptop in order to use this utility.

AirMagnet Laptop Wireless LAN Analyzer User Guide
Chapter 2: WLAN Management Tools 60
Configuring the GPS Log ToolTo configure the GPS Log tool,
1) From the Tools screen, select the GPS Log tab. The GPS Log screen appears. See Figure 6-27.
Figure 6-27
2) Click . The GPS Log Options screen appears. See Figure 6-28.

61 Chapter 2: WLAN Management Tools
AirMagnet Laptop Wireless LAN Analyzer User Guide
Figure 6-28
3) Make the desired selections, and click OK.
Collecting GPS DataTo collecting GPS data,
1) From the GPS Log screen, click . Data will start to appear on the screen.