airplane cockpit environmental data - nasa · summary of xb-70 airplane cockpit environmental data...
TRANSCRIPT

NASA TECHNICAL NOTE NASA d./
TJ D-5439
Lorn+ COPY: RETURN TO A W L (WIOL-2)
KlRTLAND AFB, N MEX
SUMMARY OF XB-70 AIRPLANE COCKPIT ENVIRONMENTAL DATA
3
by Kirk S. Irwiiz ai2d William H. A i z d r e w s
Flight Resem-ch Ceizteln Edwards, Calzf;
N A T I O N A L AERONAUTICS A N D SPACE A D M I N I S T R A T I O N WASHINGTON, D. C. OCTOBER 1 9 6 9
https://ntrs.nasa.gov/search.jsp?R=19690028628 2020-01-03T19:03:24+00:00Z
TECH LIBRARY KAFB, NM
. Report No. 2. Government Accession No. NASA TN D-5449
'. Author(s) Kirk S. Irwin and William H. Andrews
1. Performing Organization Name and Address NASA Flight Research Center P. 0. Box 273 Edwards, Calif. 93523
!. Sponsoring Agency Name and Address
Xational Aeronautics and Space Administration Washington, D. C . 20546
i. Supplementary Notes
i. Abstract
I 3. Recipient's Catalog NO.
8. Performing Organization Report NO. H-561
10. Work Unit No. 720 -5 1-00 -0 9-24
11. Contract or Grant No.
I 113. Type of Report and Period Covered
Technical Note
114. Sponsoring Agency Code
Thermal, acoustical, and acceleration environmental data were obtained for the crew compartment of the XB-70 airplane during the 186-flight-hour airworthiness tes t program. More than 20 hours were flown at Mach numbers greater than 2.5.
Temperature levels, gradients, and time histories a re presented for the cockpit walls, floor, and windshields. Heat t ransfer through the walls and along the floor produced no crew discomfort. Thermal radiation from the hot inner windshield would have been objectionable to the crew if they had not been protected by insulated flight suits and helmets with faceplates.
The acoustical environment of the crew compartment was s imilar to that of other military turbojet bomber aircraft. A t Mach 3 the sound-pressure level in the XB-70 cockpit, primarily generated by onboard electrical and environmental equipment, was 96 decibels, which is about 10 decibels higher than that measured on a present subsonic jet transport. Subsonically, the cockpit noise levels exceeded military specification limits by a s much as 10 decibels at frequencies above 400 hertz. At cruise conditions the cockpit noise levels exceeded the supersonic transport internal-noise-level design cr i ter ia in the frequency range above 300 hertz.
Acceleration data for the XB-70 crew compartment and center of gravity are presented for taxi, takeoff, subsonic buffet, and atmospheric-turbulence conditions. The long, flexible fuselage produced unpleasant r ide characterist ics in the crew compartment under vibrational situations. However, flight control was always maintained, even in heavy turbulence.
7. Key Words Suggested by Author(s) I 18. Distribution Statement
XB-70 airplane - Cockpit environmental data Unclassified - Unlimited
9. Security Classif. (of this report) 20. Security Classif. (of this page) 21. No. of Pages 22. Price * Unclassified Unclassified 22 $3.00

SUMMARY OF XB-70 AIRPLANE COCKPIT ENVIRONMENTAL DATA
By Kirk S. Irwin and William H. Andrews Flight Research Center
INTRODUCTION
The supersonic transport will c a r r y its passengers and crew through a varied and often hostile environment. Successful operations under these conditions will depend on efficient environmental control systems, adequate acoustical insulation, and basic configuration design concepts that insure cabin and crew compartment comfort. In addition, the high-fineness -ratio fuselage that appears evident in the future supersonic transport design may introduce structural motions which will dictate requirements for sophisticated structural-mode damping systems. These systems may be essential to improve the overall passenger ride comfort, to provide an acceptable working platform for the flight crew, and to reduce the airplane structural fatigue. With the requirement to incorporate these and other related systems and at the same time minimize weight penalties, it is essential that designers be provided with data that can assist them in making early refinements to the subsequent design.
From September 1964 to June 1966, the two XB-70 airplanes were flown approximately 186 hours in the course of 95 flights. These flights were performed primarily to demonstrate the technical feasibility of the Mach 3 class of vehicle. The associated testing evaluated the general airplane handling qualities and performance and the overall airworthiness of the design. In conjunction with these data, information on the thermal, acoustical, and acceleration environment of the crew compartment was obtained throughout the flight envelope.
This report documents the crew-compartment environmental data recorded on the XB-70 flights and, where possible, compares the measured data with design estimates (ref. l ) , with data obtained under s imilar conditions on other aircraft , and with proposed military (ref. 2 ) and supersonic transport specifications for the future Mach 3 class of airplane.
A IRCRA FT DE SCRIPTION
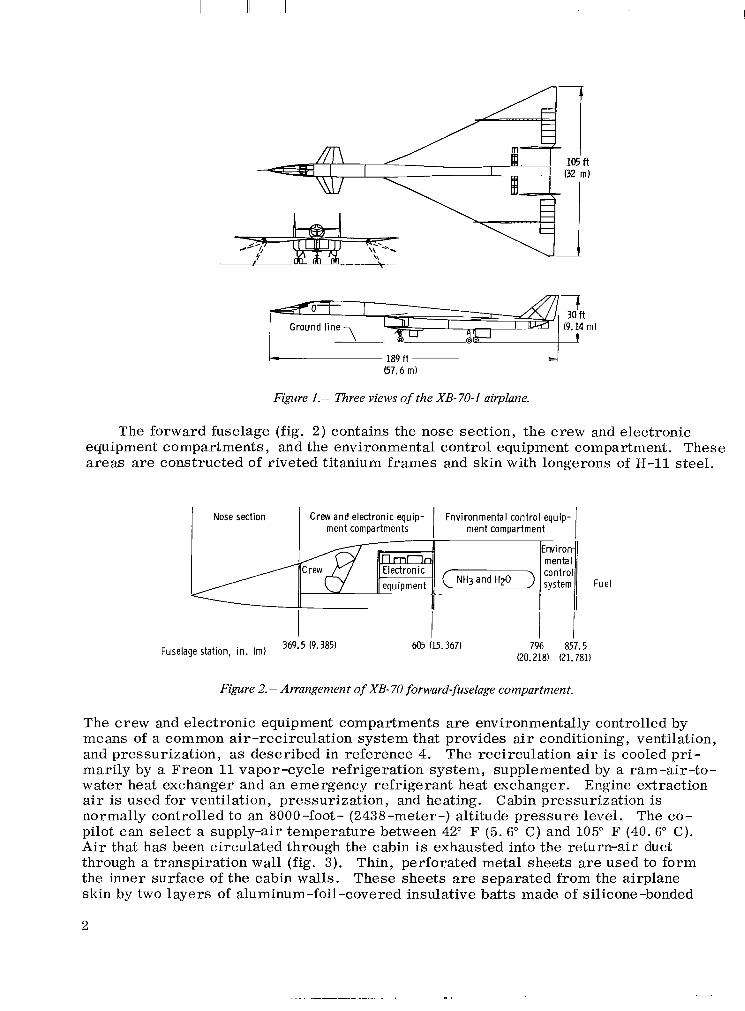
The XB-70 (fig. 1)is a two-place, high-altitude, supersonic airplane designed to fly at Mach 3 at altitudes above 70,000 feet (21,336 meters). It is characterized by a long forward fuselage with a canard surface equipped with flaps mounted aft of the crew compartment, a thin delta wing, twin movable vertical stabil izers, and dual two-dimensional, mixed-compression inlet ducts in the lower fuselage. Power is supplied by six General Electric YJ93 -GE -3 afterburning turbojet engines, each in the 30 ,000 pound- (133,446-newton-) thrust class. Additional information on the airplane, including a table of physical characterist ics, is presented in reference 3.
105 ft (32 m)
1 Figure 1.- Three views o f the XB-70-1 airplane.
The forward fuselage (fig. 2) contains the nose section, the crew and electronic equipment compartments, and the environmental control equipment compartment. These a reas a re constructed of riveted titanium frames and skin with longerons of H-11 steel.
Nose section Crew and electronic equip- Environmental control equipment compartments ment compartment
contro I Fuel
i I ~
796 857.5Fuselage station, in. (m) 369.5 (9.385) (20.218) (21.781)
Figure 2.-Arrangement of XB-70 forward-fuselageconzpartnient.
The crew and electronic equipment compartments a r e environmentally controlled by means of a common air-recirculation system that provides air conditioning, ventilation, and pressurization, as described in reference 4. The recirculation air is cooled p r i marily by a Freon ll vapor-cycle refrigeration system, supplemented by a ram-air-towater heat exchanger and an emergency refrigerant heat exchanger. Epgine extraction air is used for ventilation, pressurization, and heating. Cabin pressurization is normally controlled to an 8000 -foot- (2438-meter-) altitude pressure level. The copilot can select a supply-air temperature between 42" F (5. 6" C) and 105" F (40. 6" C). A i r that has been circulated through the cabin is exhausted into the return-air duct through a transpiration wall (fig. 3). Thin, perforated metal sheets are used to form the inner surface of the cabin walls. These sheets are separated from the airplane skin by two layers of aluminum-foil-covered insulative batts made of silicone -bonded
2
~.. - ... . . ...

Figure 3.- Cross section ofXB-70 crew-compartment transpiration wall.
Fiberglas. In addition, there are two air spaces, one between the two layers of insulation and the other between the inner insulation layer and the perforated metal sheet. Cabin air flows through the perforations and along the inner air space to return-air manifolds. The transpiration wall and insulation provide thermal and acoustical protection for the crew and electronic equipment compartments. The nose section and the environmental control equipment compartment are not insulated o r environmentally controlled.
The XB-70 has dual windshields (fig. 4(a)). The inner windshield forms the pressu re bulkhead. The outer windshield and nose ramp are movable. With the nose ramp down as shown in figure 4(b), the crew has minimum acceptable visibility throughout the flight envelope. The nose-ramp-up position shown in figure 4(c) provides aerodynamic fairing to minimize drag and heating at high speeds and virtually eliminates forward
Outer windshield Inner windshield
(a) Windshield arrangement.
(b)Nose ramp down. (c)Nose ramp up.
Figure 4.- XB-70 windshield arrangement and variable nose-ramp positions.
3

visibility. The space between the inner and the outer windshields is vented to the atmosphere. The outer windshield is composed of five tempered soda-lime glass panels, 3/8-inch (0.010-meter) thick and approximately 4 feet (1.22 meters) long. The five inner-windshield panels are laminated, with each panel consisting of a 1/8-inch( 0 . 0 0 3 - m e t e ~ )thick silicone (type K) interlayer between two panels of 5/16-inch(0.008-meter-) thick tempered soda-lime glass. There are two side windows, each composed of two 3/8-inch- (0. 010-meter-) thick monolithic glass panels separated by a dead-air gap.
Conditioned air is blown over the inner surfaces of the front and side panels of the inner windshield and over the inner surface of the side windows. The air issues from a series of orifices at the bottom of the windshield. This cooling reduces the temperatures of the surfaces that radiate heat directly into the faces of the crew.
INSTRUMENTATION
Thermal Instrumentation
The XB -70-2 was extensively instrumented to record thermal data on an 800 -channel airborne digital tape system which had a maximum frequency-response capability of 20 cycles per second. Seventy thermocouples were installed to monitor temperatures associated with the forward-fuselage environment. The areas instrumented were the windshield, floor, external skin, transpiration walls, and aisle. The specific locations and arrangements of the thermocouples are discussed in conjunction with the data recorded in the section entitled DISCUSSION OF RESULTS.
All thermocouples were chromel-alumel with ranges of -100" F (-73.3" C) to 1650" F (898.9" C). Their estimated accuracy was k8" F (&4.4" C) between 32" F (0" C) and 662" F (350" C). The free-stream total temperature was measured with two Rose-mount 102AE2AA platinum resistance-wire thermal probes mounted just under the entrance to the inlet ducts. Multiple radiation shields resulted in recovery factors of 0.996 (h0.004) for both probes. Two probes were used to improve the accuracy by splitting the range. One probe responded to temperatures from -90" F (-65.4" C) to 340" F (171.1" C); the other responded to temperatures from 272" F (133.3" C) to 725" F (385" C). Further details on the temperature measurements are included in reference 5.
Acoustical Instrumentation
Internal-noise microphones were installed in both XB-70 airplanes. Most of the data in this report were obtained from the XB-70-1, which had one Altec 21RB-150 microphone behind the copilot's seat in the cockpit and one Photocon M504 microphone in the environmental equipment compartment (fig. 5). The latter microphone was installed initially to investigate panel flutter and was, therefore, mounted very close to the outside skin. It was mounted within 1inch (0.0254 meter) of a 0.050-inch(0.00127-meter-) thick panel of 6AL4V titanium. The panel was nearly flat and measured about 9.25 inches (0.235 meter) by 46 inches (1.228 meters). The data from both microphones were recorded directly on a Parsons ATR 940 tape recorder at a tape speed of 7.5 inches per second (0.1905 meter/second).
4

Insulated and pressurized Noninsulated and unpressurized
Figure 5.- Location of internabnoise microphones on XB-70-2.
On the XB-70-2 an Altec 21BR-150 type of microphone was mounted behind the copilot's seat , as in the XB-70-1. The data were recorded on an Ampex CP-100 tape recorder at a tape speed of 30 inches per second (0.7620 meter/second).
The accuracy of the acoustics data from both of the XB-70 airplanes was *2 decibels (ref. 0.0002 dyne/cm2) from 20 hertz to 10 ,000 hertz.
Acceleration and Vibration Instrumentation
The acceleration and vibration data presented in this report were acquired from vertical and la teral accelerometers mounted at the pilot's station and at the center of gravity and were recorded on the aforementioned digital tape system. The accelerometer installations were essentially identical for both XB-70 airplanes. Al l four accelerometers were accurate to &2 percent of full scale. The ranges and flat frequency response of the four accelerometers were as follows:
I Parameter Frequency g response, HZ
Normal acceleration at center of gravity *2 0 to 30 Normal acceleration at pilot's station *5 0 to 30 Lateral acceleration at center of gravity * O . 3* 0 to 45 Lateral acceleration at pilot's station *2 0 to 45
TEST CONDITIONS
Al l XB-70 cabin environmental data were obtained during the limited envelope-expansion flights performed between September 1964 and June 1966. No special flight tests were performed fo r the pr imary purpose of obtaining these data. However, during the 20 months, the two airplanes flew 95 flights, accumulating flight hours in the Mach number ranges shown in the table on the following page.
5

I
Total
Subsonic 59.6 45.0 104.6 M = l t o 2 20.5 20.0 40.5 M = 2 t o 2 . 5 10.3 10.7 21.0 M = 2.5 to 3.0 3.6 14. 8 18.4 M = 3.0 .03 1. 8 1.83 Total 94.0 92.3 186.3
The flight envelope covered during the airworthiness evaluation is shown in figu r e 6. The longest continuous t ime at Mach 3 was 32 minutes, accomplished with the XB-70-2 airplane.
,25xld
A l t r d e , Altitude, m
20
Elevation at Edwards Air Force Base
0 .5 1.0 1.5 2.0 2.5 3.0 Mach number
Figure 6.- Flight envelope covered during the airworthiness testing of the XB-70 airplanes.
DISCUSSION OF RESULTS
Thermal Environment
The sources of heat t ransfer to the cockpit were external aerodynamic heating, solar radiation through the windshield, internal heat generation from mechanical and electrical equipment, and hot o r cold air circulation from the environmental control system. The thermal instrumentation was inadequate to allow a total heat-balance analysis for the cockpit. Thus, this discussion is limited to the presentation of certain representative and maximum temperatures experienced in key areas. The small amount of comparable predicted temperature data that is available is presented when possible. No attempt is made to account for the effect of the environmental control
6

I
system. The performance of the environmental control system and related test experience was reported in reference 1. Most of the thermal data in the present report may also be found in reference 5. These data are included herein to present in one document some of the pertinent factors related to the XB-70 crew-compartment environment.
Cockpit wall. - Several areas of the cockpit transpiration wall were instrumented to evaluate heat transfer through the wall with and without "heat shorts" through structural frames. Time histories of three temperature measurements made on the left side of the fuselage about 5 feet ( 1 . 5 meters) aft of the pilot's seat are presented in figure 7 for a flight that achieved 32 minutes of sustained Mach 3 flight. A time history of free-stream total temperature is included for reference. The effectiveness of the transpiration-wall cooling system can be seen from the relative insensitivity of the inner temperature to variations in total temperature.
\Fuselage skin
Temperature,"F
\Fiberglas insulation
Figure 7.- Time histones of temperature at XB-70 crew-compartment wall for a flight with 32 minutes
of Mach 3 cruise.
Figure 8 shows the temperature distribution through the same wall segment after 28 of the 32 minutes of flight at Mach 3. The instrumented cross section contained areas with and without structural frames. The outer thermocouples were inside the outer skin, and, hence, the temperatures they measured were somewhat lower than the actual skin temperature. Note that direct heat conduction through the metallic frame resulted in only a 10" F (5.6" C) higher temperature at the outer surface of the inner insulation than at the location at which there was no frame. The inner insulation further reduced that temperature difference to only 4" F (2.2" C); that is, 76" F (24" C) as compared to 72" F (22" C).
7

Fuselage skin
439"F (226" C)
640 LTransp i ra t ion wall (18" C)
Figure 8.- Temperature at XB-70 crew compartment wall after 28 minutes of Mach 3flight.
Temperature gradients through the cockpit wall at various Mach numbers a r e shown in figure 9. For each test the Mach number was held constant for approximately 20 minutes. The gradients are proportional to the conduction heat-transfer ra tes through the material. Higher Mach numbers with correspondingly higher skin temperatures produced higher heat rates through the outer insulation layer. The heat-transfer ra tes through both air gaps appear to be essentially constant and independent of Mach
Fuselage skin L T r a n s p i r a t i o n wall
0 0
-250
- 200
- 150 Temperature, Temperature,
"F "C - 100
- 50
I . .
I I I I -0
I 0 1 2 3 4 5
Distance from outer surface, inches I I I I I I I
0 2 4 6 8 10 12 Distance from outer surface, centimeters
Figure 9.- Temperaturegradients through XB-70 crew-compartment wall after 20 minutes of cruise at various Mach numbers.
8
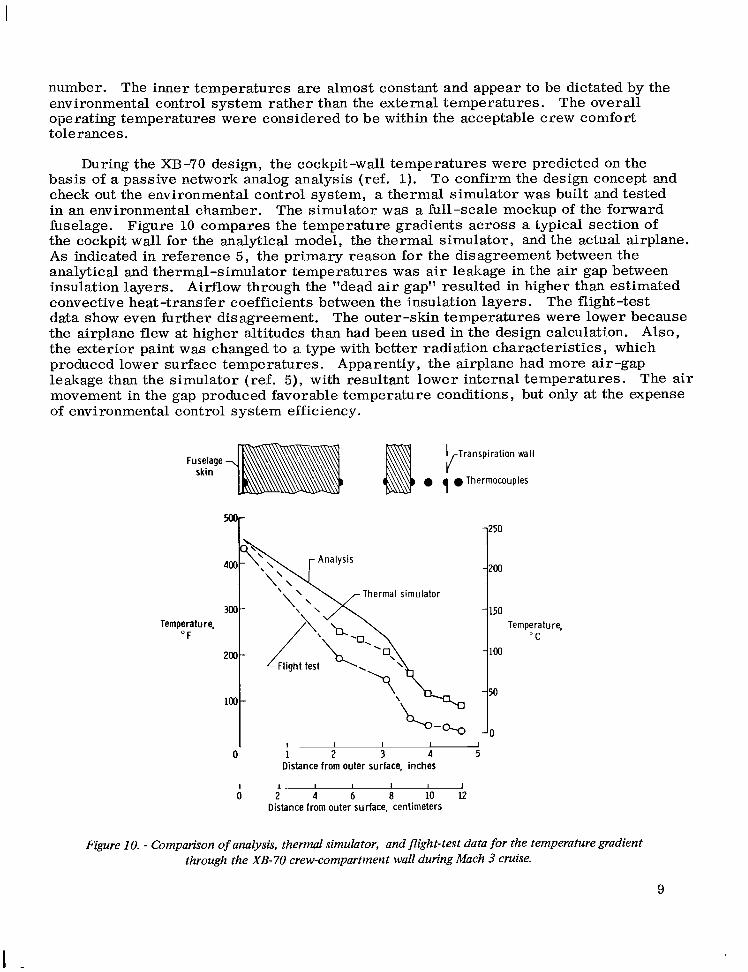
number. The inner temperatures a r e almost constant and appear to be dictated by the environmental control system rather than the external temperatures. The overall operating temperatures were considered to be within the acceptable crew comfort tolerances.
During the XB-70 design, the cockpit-wall temperatures were predicted on the basis of a passive network analog analysis (ref. 1). To confirm the design concept and check out the environmental control system, a thermal simulator was built and tested in an environmental chamber. The simulator was a full-scale mockup of the forward fuselage. Figure 10 compares the temperature gradients across a typical section of the cockpit wall for the analytical model, the thermal simulator, and the actual airplane. As indicated in reference 5, the primary reason for the disagreement between the analytical and thermal-simulator temperatures was air leakage in the a i r gap between insulation layers. Airflow through the "dead air gap" resulted in higher than estimated convective heat-transfer coefficients between the insulation layers. The flight-test data show even further disagreement. The outer-skin temperatures were lower because the airplane flew at higher altitudes than had been used in the design calculation. Also, the exterior paint was changed to a type with better radiation characterist ics, which produced lower surface temperatures. Apparently, the airplane had more air-gap leakage than the simulator (ref. 5), with resultant lower internal temperatures. The air movement in the gap produced favorable temperature conditions, but only at the expense of environmental control system efficiency.
Fuselage 1/Transpiration wall
skin 1 Thermocouples
-250
-200
-150 Temperature, Temperature,
" F ' C - loo
-50
;
-0 I I I I I I
0 1 2 3 4 5 Distance from outer surface, inches
1 - I I I I I 2 4 6 a 10 12
Distance from outer surface, centimeters
Figure I O . - Comparison ofanalysis, thermal simulator, and flight-test data for the temperature gradient through the XB-70 crew-compartment wall during Mach 3 cruise.
9

Cockpit floor. -To measure the heat t ransfer in the region of the cockpit floor, thermocouples were installed at various locations on the s t ructure between the outer skin and the internal cabin wall. Figure 11shows that after 32 minutes at Mach 3, the floor temperatures were lower than those predicted for the design mission. It is believed that the skin temperature was lower than predicted because the flight reached a higher altitude than that used in the design analysis. The inner-wall temperatures were lower than estimated because the flight-measured skin temperature was lower than that used for design estimates. Furthermore, the actual mission had less t ime at Mach 3 than the design mission, and the cockpit temperature was held at a much lower value than that used for prediction.
Floor
250
200
100 - 50
I I I I 1 I I I
0 1 2 3 4 5 6 7 a Distance from outer surface, inches
L 0
I 2
I 4 8 ib 112 it i f 1’8
Distance from outer surface, centimeters
Figure 11.- Temperaturesof crew-compartment floor predicted and measured on the XB-70 forMach 3.
Windshields. -Thermocouples were cemented to the outer and inner surfaces of the inner and outer windshields and imbedded in the silicone interlayer of the inner windshield to measure temperature levels and gradients. Figure 12 shows the temperature time histories of the outer surfaces of the inner and outer windshields for a flight with 32 minutes of Mach 3 cruise. Total temperature is plotted for reference. The surface temperature of the outer windshield responded rapidly to changes in total temperature, as would be expected. The surface temperature of the inner windshield was much less responsive, particularly at the lower temperatures. The fact that the inner-surface temperature dropped off soon after the outer-surface temperature decreased indicates that the pr imary source of heat t ransfer between the surfaces is radiation. Convective heat t ransfer would produce a greater lag.
10

700 I
600 - Free-stream
Tempfrature, Temperature, F "C Outer windshield - 150
Inner
0 20 40 60 80 100 120 Time, minutes
Figure 12.- Time histones of temperature on XB-70 windshields for a flight with 32 minutes of Mach 3 cruise.
Figure 13 shows the location of 13 of the thermocouples and the temperatures measured after 32 minutes of cruise at Mach 3 with the nose ramp up. The temperature of the outer surface of the outer windshield, 461" F (238" C), may be higher than expected because of the surface irregularity caused by the presence of the thermocouple itself. The temperature gradient from top to bottom of the inner windshield was caused primarily by the cooling air blown over the inner surface. The magnitudes of the inner -surface temperatures were strongly influenced by the cooling airflow rate selected by the crew. High flow rates produced lower temperatures but simultaneously
Outer windshielc
461"F
285°F (141°C) d/flocc 285"F (141"C ) 9 '417"F (214"C)
267"F (131"Ch Ioo ,,'(840c) 0 235"F(113"C)
273' F (134"C) &580 ,7no,C)r \ I U Side window r
Figure 13.- Temperatures measured on the inner and outer windshields and the side window of the XB-70 after 32 minutes of cruise at Mach 3 with the nose ramp up.
11

caused undesirable effects such as disturbing crew flight cards and procedures books. On all high-speed XB-70 flights the crew wore pressure suits and helmets with faceplates. The suit and helmet environment made the crew essentially unaware of any adverse thermal effects from the windshield. On the few occasions that the crew raised their faceplates during high Mach number flights , they reported noticeable thermal radiation from the windshield and termed it objectionable. The side -panel temperature of 235" F (113" C ) was measured at the silicone interlayer of the inner windshield. The aft side-window panel temperature of 41'7" F (214" C ) was measured on the outer sur face.
The only predicted data related to windshield temperatures that are applicable to the flight-test results are estimates of the temperature difference across the outer windshield. Figure 14 presents the temperature differences as a function of the outer-surface temperature for flight measurements and predictions from reference 1. The scat ter in the prediction data is due to the use of different inside film coefficients and calculations with and without solar radiation. As shown, the measured temperature
Three possible explanations for thisdifferences were much la rger than predicted. discrepancy are suggested in reference 5, as follows:
1. The local unevenness of the surface due to the presence of the thermocouple led to temperatures higher than t rue outer-surface temperatures.
2. The convective coefficients used in the analysis for the space between the two windshields were too low.
3. The windshield never reached steady-state conditions in flight test. -50
- 4 0
0 Flight test 80 - 0 Predicted
0
0 g
Oo:
60- 3 0
20
0 0
0
Temperature difference across outer windshield,
O C
Temperature difference across outer windshield, 40
"F -
L I I I I "0 0 100 200 300 400 500
Temperature of outer surface of outer windshield, O F
I I I I I I
0 50 100 150 200 250 Temperature of outer surface of outer windshield, "C
Figure 14.-Measured and predicted temperature differences across the outer windshield of the XB-70 as a function of the temperature of the outer surface of the outer windshield.
A number of the temperature measurements made in the cockpit were on surfaces within the reach of the pilot o r copilot and, thus, represent temperatures typical of
12

the surfaces the crew members might touch during flight. for six surfaces were as follows:
The maximum values noted
Surface of pilot's overhead panel . . . . . . . . . . . . . . . 177" F (81°C) Copilot's hatch transpiration-wall surface . . . . . . . . . . 124" F (51" C ) Inner windshield (inner surface) . . . . . . . . . . . . . . . 213" F (101" C ) Attitude indicator . . . . . . . . . . . . . . . . . . . . . . . 104" F (40" C) Floor beam/wall intersection . . . . . . . . . . . . . . . . 102" F (39" C) Floor beam at fuselage centerline . . . . . . . . . . . . . . 76" F (24" C)
Without gloves, the crew might have found various knobs and switches to be too warm for comfortable handling. The floor surface temperatures do not appear to be too warm for normal operation.
Acoustical Environment
Noise in the cockpit of an airplane is generated from many sources-external airflow y electrical equipment, cabin air conditioning, and engine noise transmitted externally and through structure. Ground tests with the XB-70 engines at idle power established that the noise level due to the electrical equipment (such as radios and navigation equipment) was 88 decibels (ref. 0 .0002 dyne/cmz). When the air-conditioning blowers were turned on during normal operations the noise level increased to 96 decibels.
Figure 15 is a plot of the overall sound-pressure-level measurements made on the XB-70-1 and the XB-70 -2 under stabilized flight conditions. The sound-pressure level is plotted against Mach number t o illustrate the trend of lower noise levels with
Environmental equipment compartment
Nose ramp down W Nose ramp up
130r Crew compartment 0 Nose ramp down 0 Nose ramp up A Engines idle, a i r condit ioning and
I electrical e a u i w " on
o m m 0 Engines idle, ai; condit ioning off, electrical e a u i m e n t on
Overall sound- 'lo 0 pressure level,
dB (ref. 0.0002 dynelcm)
I I I I 1 2 0 .5 1.0 1.5 2.0 2.5 3.0
Mach number
Figure 15.- Noise level of XB-70 crew and etiviroizinental equipment cotiipartinent as a function of Mach iiiitnber.
13

100
increasing Mach number. In general, the airplanes were at Mach 1at about 32,000 feet (9754 meters) altitude, Mach 2 at 45,000 feet (13,716 meters) to 60,000 feet (18,288 meters) altitude, and Mach 3 at 70,000 feet (21,336 meters) altitude o r above.
The cockpit showed about a 5-decibel noise reduction as the airplane was accelerated through approximately 0.85 Mach number. Tuft photographs of the forward fuselage and canard taken in this speed range indicate that the flow over the canard surface changed from separated to smooth and airframe buffet which existed from takeoff to Mach 0.85 disappeared.
The difference in noise level between the insulated cockpit and the noninsulated environmental control equipment compartment varied from as much as 20 decibels subsonically to a negligible difference at high Mach number. A portion of this noise-level difference may be attributed to the influence of the aft-facing cabin-air-overboard exhaust vent (fig. 5) which is mounted on the upper portion of the fuselage close to the microphone in the environmental equipment compartment. The presence of the vent may have affected the local boundary-layer thickness, which could in turn have increased the local noise level. Based on the results of the previously mentioned ground tes ts , the electrical and air-conditioning equipment are believed to have contributed significantly to the noise source in the cockpit at high Mach numbers.
The position of the nose ramp influenced the cockpit noise level at low speeds but had very little effect at high speeds. The nose-ramp position had no apparent effect on the noise level in the environmental control equipment compartment.
Octave-band plots of the cockpit noise for various Mach numbers are presented in figure 16 for the nose -ramp-up configuration. There was more low-frequency content in the noise spectrum at subsonic speeds than at supersonic speeds. This may be associated with the airframe vibration o r buffet mentioned previously. Supersonically, the octave-band plots show similar trends, with a generally lower level at higher Mach numbers.
Mach number Altitude, ft (m)
0 0.7 15,000 (4,572) 0 1.4 35,000 (10,668)A 2.2 55,000 (16,764)0 3.0 70,000 (21,336)
11°1
Octave-band level, dB
70t
Figure 16.- XB-70 crew-compartment noise octave-band variations with Mach number for the nose-ramp-upconfiguration.
14

Figure 17 compares the octave-band characteristics of the noise in the insulated cockpit with that in the noninsulated environmental equipment compartment. Both subsonically and supersonically the two areas had s imi la r spectral characteristics, with the cockpit 10 decibels to 20 decibels quieter. At Mach 2 . 5 and above, the difference in levels between the two areas became very small , as noted earlier.
0 Environmental control equipment compartment (noninsulated)
Crew compartment ( insulated)
1 1 1 1 1 1 1
63 125 250 500 1000 2OOO 4000 8000 Center frequency, Hz
(a ) Mach 0.8;altitude, 25,l 00 feet (7650 meters).
Octave-band I \
70 I I I 1 1 0 ' 6; 125 250 500 1OOO 2000 4000 8OOO
Center frequency, Hz
( b )Mach 1.8;altitude, 45,200feet (13,777 meters).
Figure 17.- Octave-band characteristicsof the noise in the XB-70 crew and environmental control equipnient compartments with the nose ramp up at one subsonic and one supersonic fright condition.
The influence of the nose-ramp position on the frequency cont.ent of the noise in the cockpit is illustrated in figure 18 for one subsonic and one supersonic flight condition. Raising the nose ramp reduced the high-frequency noise at subsonic speeds and reduced the lo\\.-frequency noise at supersonic speeds.
15

I. II I I 11.111-1
0 Nose ramp down 0 Nose ramp up
Octave -ba n d level, 80 dB
70t 60b '6; 115 2;O 5h lobo 2obo 4doo 8doo
Center frequency, Hz
(a)Mach 0.7; altitude, 15,000 feet (4572 meters).
r
t " o63 125 250 500 1000 2000 4000 8000b I I I I I I
Center frequency, Hz
( b )Mach 1.4; altitude 35,000 feet (10,668 meters).
Figure 18.- Octave-band characteristicsof the noise in the XB-70 crew compartment for the noseramp-up and nose-ramp-downconfigurationsat one subsonic and one supersonic flight condition,
Figure 19 shows that at the Mach 3 cruise condition with the nose ramp up, the XB-70 cockpit noise levels fell well within the band of data presented in reference 6 for
XB-70 0 Mach 0.7, nose ramp down 0 Mach 3.0, nose ramp up
100 - \
90- Octave-band
level, dB 80
70 - Typical subsonic jet bombers (ref. 6)
601 h I I I I I I I I 0 " 63 125 250 500 1000 2000 4000 8000
Center frequency, Hz
Figure 19.- Comparison of XB-70 crew-compartment noise octave-band characteristics with data for typical subsonic jet bombers and Military Specification MIL-H-8806.
1(i

typical subsonic jet bombers. Also in this speed range, the noise levels appear to be within the requirements of reference 2 (MIL-H-8806), which governs the acceptable noise levels in the cockpit of military aircraft . The noise levels in the cockpit during cruise at Mach 0 . 7 with the nose ramp down exceeded this Military Specification by as much as 10 decibels at frequencies above 400 hertz and exceeded the sound levels measured on subsonic bombers in the frequency range to 3000 hertz. XB-70 crew members commented that the cockpit noise level did not differ appreciably from that of other large military turbojet aircraft they had flown.
Figure 20 presents a comparison of the cockpit noise spectrum for the XB-70 cruising at Mach 3 at 70,000 feet (21,336 meters) altitude with the noise spectrum measured in a Boeing 707-320B cockpit at Mach 0.85 and 30 ,000 feet (9144 meters) altitude. Like most other military aircraft, the XB-70 exceeded the commercial-aircraf t cockpit noise level by at least 10 decibels. Both the XB-70 and the 707 airplane exceeded the supersonic transport internal-noise-level design c r i te r ia in the frequency ranges above 300 hertz and 800 hertz, respectively.
0 XB-70, Mach 3, 70,000feet (21,336 meters) alt itude
707-3208, Mach 0.85, 30,000feet (9144 meters) alt itude
Supersonic transport design criteria, Mach 2.7
Octave-band
dB
63 125 250 500 1000 2000 4000 8OOO Center frequency, Hz
Figure 20.- Comparison of XB-70 crew-compartnient noise octave-band characteristics at Mach 3 cruise with data for 707-320Bairplane at typical cruise condition and with the proposed FAA supersonic transport cruise standard.
Cockpit Vibration Environment
The cockpit of the XB-70 is particularly susceptible to vibration because of the long, slender, and relatively flexible forward fuselage. Even though the vibration o r acceleration environment in the cockpit can be significant, at no time during the flight prog ram did the pilots have difficulty controlling the airplane because of cockpit motions.
Taxi, takeoff, subsonic buffet, and turbulence were the greatest sources of cockpit vibration for the XB-70. These conditions are examined briefly in the following sections. N o attempt is made to explain the structural response to the disturbance. The data presented a r e essentially limited to typical acceleration t races and acceleration amplitude-velocity plots.
~Taxiing-takeoff operations. - Crew-compartment motions during taxiing operations were very noticeable. When the crew talked over the radio as they taxied the airplane,
17

I I I, "1 1111.1 , 1 1 1 1 I II 1.11 1 . 1 1 1 1I 1 1 1 1 1 1111111 11111II II I I I 1 1 1 1 1 1 1 1 ,111 I ..I
there was a discernible throb in their voices. The airplane was generally taxied at about 15 miles per hour (24 kilometers per hour), because at approximately 18 to 20 miles per hour (29 t o 32 kilometers per hour) and at heavy gross weights, fuselage resonance was excited by the nosewheel passing oiler the %-foot- ( 7 . 6 2 - m e t e ~ )long concrete blocks in the taxiway. The pilots stated that they could read notes and instruments without difficulty while taxiing, but writing legible notes on their knee pads was difficult.
The crew-compartment acceleration o r vibration environment was usually more severe during the takeoff roll than at any other time in the flight. Typical t races of the crew-compartment and center -of-gravity normal accelerations are presented in figure 21. The grea te r response of the crew compartment to takeoff vibration is
Vertical acceleration, 1
g
41 second I_
(a)Center of gravity. 2r
Vertical acceleration, 1
9
I I
01 I
_I 1 second L( b ) Crew compartment.
Figure 21.- Typical time history of vertical accelerationsat XB-70 center of gravity and crew cornpartnient during the takeoff roll.
apparent. This is further emphasized in figure 22, a composite of data from five take offs , which shows the peak-to -peak acceleration amplitude experienced during the takeoff roll as a function of airspeed. Both crew-compartment acceleration and center-ofgravity data are presented. On the average. the crew-compartment acceleration was 0.32g grea te r peak-to-peak than the center-of-gravity acceleration. The maximum acceleration appears to be at 100 knots, possibly because of a structural dynamic characterist ic of the airplane o r the existence of a rough area on the runway which the airplane coincidentally crossed at about 100 knots. At lift-off, usually between 200 knots and 220 knots, the acceleration reduced to about 3.0. l g (0.2g peak to peak).
18

1.6r 0 Crew compartment
I 0 0 o r
0 Center of gravity
0-1.2 0
Peak-to-peak acceleration - b amplitude, *8
9
0
I I I I I I 0 40 80 120 160 200 240 280
True airspeed, knots
Figure 22.- Acceleration amplitudes of XB-70 crew compartment measured as a function of true airspeed during five typical takeoff rolls.
Buffeting. - Below about Mach 0. 85 the XB-70 experienced continuous buffeting. The buffet subsided rather suddenly as the airplane was accelerated beyond Mach 0.83 to Mach 0 . 8 7 . The cessation of the buffet was accompanied by a decrease of about 5 decibels in crew-compartment noise. Observation of tufts on the canard surface verified that the flow on this surface changed from separated to attached at about the same speed that the noise and buffet were alleviated. It has not been proved, however, that the flow over the canard surface was the only, o r even the primary, source of the subsonic buffet.
Figure 23 shows typical traces of the crew-compartment and center-of-gravity accelerations at Mach 0.7 and an altitude of 10,000 feet (3048 meters). The t races show that the buffet produced only a minor a i rcraf t disturbance at the center of gravity. At the crew compartment the peak-to-peak acceleration was about 0.15g.
acceleration,
u
1 second I,
(a)Center of gravity
Vertical acceleration, 1
" -1 second
( b ) Crew compartment.
Figure 23.- Typical time history of vertical accelerations at XB-70 center ofgravity and crew compartment during subsonic buffet. Mach 0.7;altitude, 10,000feet (3048 meters).
19

Turbulence encounters. -The crew-compartment accelerations in the XB-70 were considered significant when the airplane encountered atmospheric turbulence. The XB-70 pilots invariably rated a patch of turbulence as more severe than the rating given the same turbulence by the pilot of an accompanying support airplane. Fo r example, when an XB-70 pilot ra ted the turbulence as moderate, the pilot of a B-58 flying with the XB-70 rated it as light. The relative lengths and flexibilities of the two aircraf t undoubtedly explain the major difference between the ratings.
Reference 7 gives an account of the XB-70 encounters with turbulence during an accumulated 75,757 miles (121,919 kilometers) of flight above 40,000 feet (12,192 met e r s ) altitude. Figure 24 presents time-history t races of the center-of-gravity and crew-compartment vertical accelerations during a portion of a turbulence encounter at Mach 2.4 and 55,000 feet (16,7G4 meters) altitude. The crew rated the turbulence as heavy .
Vertical acceleration, 1
9
O
1 second L(a ) Center of gravity.
2 -
Vertical acceleration, 1
g
01 A 1 second L (b )Crew conipartrnent.
Figure 24.- Typical time history of vertical acceleration at XB-70 center o f gravity and crew conzpartnzent during fzeavq$turbulence. Mach 2.4; altitude, 55,000 feet ( I 6,764 meters).
A t lon. speeds and lo\v altitudes the XB-70 frequently encountered atmospheric turbulence. The crew members reported that the response to even light turbulence at low speeds and altitudes would be unacceptable for a commercial transport and would be only marginally acceptable for a militnry airplane. Low-frequency lateral motion of the forward fuselage was more prominent in low-speed turbulence encounters thxn at high speed. Lateral accelerations in the crew compartment have been mentioned only with respect to turbulence response. There was little lateral acceleration associated with taxi, takeoff, o r subsonic buffet. The most severe lateral accelerations experienced in the XB-70 program were caused by inlet buzz which resulted from engine/inlet probl.ems during a flight early in the tes t program. The large pressure pulsations at the inlet mouth produced lateral accelerations of .i-O. 7g at the crew compartment with a frequency of 2 .3 hertz. The incident is reported in reference 8.
20

I
It was not surprising that the XB-70 crew-compartment accelerations were often relatively large. The long, flexible , cantilevered fuselage naturally amplified the airplane disturbances. Very likely, the forward-mounted canard surface accentuated o r even produced cockpit accelerations under some circumstances. Yet , even with the large accelerations experienced, at no time were the pilots unable to perform their functions and maintain control of the airplane because of cockpit motions.
CONCLUDING REMARKS
Thermal, acoustical, and acceleration environmental data were obtained for the crew compartment of the XB-70 airplane during the 186-flight-hour airworthiness program. More than 20 hours were flown at Mach numbers greater than 2.5.
Heat transfer through the cockpit walls and along the floor structure w a s lower than predicted by analysis and laboratory tests. The fact that the most severe tes t mission had considerably less time at Mach 3 than the design mission on which the predictions were based may be a contributing factor to the difference between measured and predicted data. The temperatures of the inner cockpit walls ,and floor were reasonably moderate and produced no crew discomfort.
Temperature gradients across the outer windshield were much la rger than p r e dicted, possibly because of: (1)local disturbance of the flow on the outer surface duc to the presence of the thermocouple; ( 2 ) more convective heat t ransfer between windshields than anticipated: and ( 3 ) nonattainment of steady-state conditions. The high temperatures of the inner windshield would have produced uncomfortable thermal radiation onto the crew members if adequate cooling air had not been blown over the inside of the inner windshield and i f the crew had not worn insulated flight suits 2nd helmets with faceplates.
The acoustical environment of the XB-70 crew compartment was similar to that of other large, military, turbojet aircraft . k r i n g cruise conditions the sound-pressure level in the XB-70 cockpit, primarily generated by onboard electrical ‘and environmental equipment, was 96 decibels, which was about 10 decibels higher than that measured in a present commercial subsonic jet transport. At siil)sonic specds. the cockpit noise levels exceeded military specification limits hv as much as 10 decibels at frequencies above 400 hertz. At Mach 3 . 0 cruise conditions the XB-70 cockpit noise levels exceeded the supersonic transport internal-noise-level design cr i ter ia in the frequency range above 300 hertz. The variable-position nose r:mp had ;Istrong influence on the noise level at low speed but was relatively insignificant at high speed.
The crew-compartment acceleration o r vibration environment \\.:IS worse than that of most military aircraf t and would be unacceptable for a comnicrcial t rmsport . The long, flexible forward fuselage amplified the vertical and lateral i.ibrations produced by tzxiingt takeoff roll. subsonic buffet, and atmospheric turbulence. Diring t,&eoff roll the amplitudes of the crew-compartment accelerations averaged 0 . 3 2 g pe,?k-topeak grea te r than the center-of-gravity accelerations.
The sensitivity of the XB-70 crew compartment to atmospheric turbulence caused the pilots to rate specific patches of turbulence one level more severe than the ratings
21

given by pilots in escor t aircraft. However, even in heavy turbulence o r airframe buffet, the pilots had no difficulty maintaining good flight control.
Flight Research Center, National Aeronautics and Space Administration,
Edwards, Calif., July 11, 1969.
REFERENCES
1. Butt, C. ;Celniker, R. ;et al. : Aerodynamic Heating Analysis for the XB-70A Prototype Air Vehicle. Rep. No. NA-62-859-1, North American Aviation, Inc. , May 1 , 1963.
2. Anon. : Acoustical Noise Level in Aircraft. General Specification for Mil. Specif. Mil-H-8806(ASG), Oct. 25, 1956.
3 . Wolowicz, Chester H. ; Strutz, Lar ry W. ; Gilyard, Glenn B. ; and Matheny, Nei l W. : Preliminary Flight Evaluation of the Stability and Control Derivatives and Dynamic Characteristics of the Unaugmented XB-70 -1 Airplane Including Comparisons With Predictions. NASA TN D-4578, 1968.
4. Oppenheim, J. E. ;Wan, G. ; and Cloud, P. B. : XB-70A Flight Test Summary Report. Environmental Control. Crew and Electrical Equipment Environment and Environmental Control System (ECS) Performance. Rep. No. NA-66-860 , North American Aviation, Inc. , Oct. 4 , 1966.
5. Butt, C. ;Haroldson, H. ; et al. : XB-70A Flight Test Summary Report. Structural Temperatures and Thermal Environment. North American Aviation, Inc. (NASA CR-82000), 1966.
6. Franken, Peter A. ; and Kerwin, Edward M. , Jr. ; et a l . : Methods of Flight Vehicle Noise Prediction. Tech. Rep. 58-343 (ASTIA No. AD-2057776), Wright Air Dev. Center, U. S. Air Force, Nov. 1958.
7 . Kordes, Eldon E. ; and Love, Betty J. : Preliminary Evaluation of XB-70 Airplane Encounters With High-Altitude Turbulence. NASA T N D-4209, 1967.
8. Wolowicz, Chester H. : Analysis of an Emergency Deceleration and Descent of the XB-70-1 Airplane Due to Engine Damage Resulting From Structural Failure. NASA TM X-1195, 1966.
22 NASA-Langley, 1969 - 25 H-561

NATIONAL AND SPACEADMINISIXATIONAERONAUTICS WASHINGTON,D. C. 20546
OFFICIAL BUSINESS FIRST CLASS MAIL
POSTAGE A N D FEES PAID NATIONAL AERONAUTICS A?
SPACE ADMINISTRATION
If Undelivcr.ible (Section 158PoSTMASTER: Posrd M a n u s l ) Do Not Rerur
'The neronaicticnf niici spnce nctii'iiies of the Uizited Strites shdf be coudiccted so ns to. coiztribic/e . . . to the expnnsion of hifntniz knoiuledge of phefjoiiieizd iiz the nttitosphere nizd spnce. The Adiiiiizistrntion shnff proi,idc f o r the widest psncticnbfe atid nppsopsinte disseniim?ion of irifosi~iritioncolzceriziiig its nctiimities niid the sesidts thereof.'.'
,-~NATIONAI. AERONATJTICSA N D SPACE ACT OF 195s
NASA scrmTwic AND TECHNICAL PUBLICATIONS , .- .
TECHNICAL REPORTS: Scientific. ahd technical information considered important, complcte, and a lasting contribution to existing knowledge.
TECHNICAL NOTES: Information less broad in scope but nevertheless of importance as a contrihurion to existing knowkdge.
TECHNICAL MEMORANDUMS: Information receiving limited distribution because of preliminary data, security classification, or other reasons.
CONTRACTOR REPORTS: Scientific and teclinical information generated under a NASA contract or grant and considered an important contribution to existing knowledgc.
TECHNICA1. TRANSLATIONS : Inforniation published in a foreign language considered to merit NASA distribution in English.
SPECIAL PUBLICATIONS: Information derived from or of value to NASA activities. Publications include conference proceedings, monographs, data compilations, handbooks, sourcebooks, and special bibliographies.
TECHNOLOGY UTILIZATION PUBLICATIONS: Information on technology used by NASA that may be of particular interest in commercial and other non-aerospac? xpplications. Publications include Tech Briefs, Ttchnology Utilization Reports and Notes, and Technology Surveys.
Details on the availability of fhese publications may be obtained from:
SCIENTIFIC AND TECHNICAL INFORMATION DIVISION
NATIONAL AERONAUTICS AND SPACE ADMINISTRATION Washington, D.C. 20546