airs, the atmospheric infrared sounder pre-launch brochure
DESCRIPTION
Brochure describing the mission and science goals of AIRS, the Atmospheric Infrared Sounder prior to its launch aboard NASA's Aqua satellite in May 2002.TRANSCRIPT


Acknowledgements
Edited by: Moustafa Chahine, Michael Gunson, Marguerite Syvertston, and Claire Parkinson
Technical Input: Moustafa Chahine, Michael Gunson, Eric Fetzer, Mark Hofstadter, Bjorn Lambrigtsen, Ed Olsen, and George Aumann
Graphics Input: Jeff Hall
Designed by: Scott Hulme, Winnie Humberson
Information provided through the courtesy of the Jet Propulsion Laboratory, California Institute of Technology,under a contract with the National Aeronautics and Space Administration.

Enhancing the quality of global meteorological observations can yield
considerable economic benefits through more reliable climate prediction,
improved weather forecasts, better understanding of the factors
influencing air quality, and mitigation of the economic and human costs
of natural hazards.
Terra, launched in December 1999, and Aqua, planned for launch in 2001,
are two main Earth Observing System (EOS) observatories that will use
multiple instruments to acquire the necessary data with the required
high precision and accuracy.
The Atmospheric Infrared Sounder, set for launch aboard Aqua, will
make global measurements of our atmosphere, providing new insights
into Earth’s weather and climate.
The Atmospheric Infrared Sounder
1

The Atmospheric
Infrared Sounder
(AIRS), together with
the Advanced
Microwave Sounding
Unit (AMSU) and the
Humidity Sounder
for Brazil (HSB) on
the Aqua mission,
represents the most
advanced sounding system ever deployed in space. The system is capable of measuring
the atmospheric temperature in the troposphere with radiosonde accuracies of 1 K over
1 km-thick layers under both clear and cloudy conditions, while the accuracy of the
derived moisture profiles will exceed that obtained by radiosondes. Furthermore, the
system will provide additional data on land and ocean surface temperature and surface
emissivity, cloud fraction (see centerfold example from an earlier instrument) and cloud
top height, and ozone burden of the atmosphere. This makes AIRS/AMSU/HSB the
primary observing system to study the global water and energy cycles, climate varia-
tion and trends, and the response of the climate system to increased greenhouse gases.
Weather or Climate?
When we talk about the weather, we are talking about conditions at one specific place andtime. If someone says “Yesterday we had an inch of rain in Los Angeles, but today is clearand dry,” he is talking about weather. The weather is constantly changing.
When we talk about climate, we are describing the long-term average of weather. If someonesays “Los Angeles usually gets two inches of rain in the month of November,” he is talkingabout climate. You have to make measurements for many years to get an idea of what thetrue climate is.
The difference between weather and climate is like the difference between a sports team win-ning one game and having a winning year. Some games you win, some games you lose(which is like the weather changing day-to-day), but if at the end of the year you’ve won a lotmore than you’ve lost, you’d say you’ve had a winning year (or a winning climate)!
2

Improving the world weather observing system is also an essential objective of Earth
system science and applications, because the phenomena that govern long term climate
are the same as those that manifest themselves in transient weather perturbations.
AIRS/AMSU/HSB observations are, therefore, equally applicable to both climate and
weather studies and will be provided to the US National Centers for Environmental
Prediction (NCEP) and the European Centre for Medium-Range Weather Forecasts
(ECMWF) for assimilation into the operational forecast General Circulation Models.
Through such assimilation, the AIRS/AMSU/HSB observations will lead to substantial
increases in the mid- and long-range weather forecast skill.
Measuring the Atmosphere with Radiosondes
Currently, weather balloons are the most important source of informationabout Earth’s atmosphere. They are usually called ‘radiosondes,’ sondemeaning ‘sounding’ in French, a reference to the ancient maritime practiceof measuring the deep ocean from ships. ‘Radio’ refers to their method ofdata return. Hundreds of balloons are launched around the globe twicedaily to sample the atmosphere to heights of about 15 km (10 mi). Eachballoon, about the diameter of a child’s wading pool, lifts temperature,humidity and pressure sensors in a milk carton-sized box. The sensorstransmit information to a receiver on the ground, where it is processed anddistributed to weather forecasting centers. The result is a snapshot of theatmosphere every twelve hours at a limited number of sites around theworld.
This picture is not complete. Most radiosondes are launched over land, sothat the 75% of the world covered by ocean is not sampled. Furthermore,economic differences between countries further influence coverage. Europe and NorthAmerica have excellent coverage, while much of Africa, Asia and South America are sparselysampled.
3

Is the Global Water Cycle Accelerating?
Water is indispensable to all living species, and
fresh water is an essential ingredient of life
on land. Water also plays a unique and
almost irreplaceable role for innumer-
able industrial processes and
domestic applications. For these
reasons, fresh water is an immense-
ly valuable resource on which our
existence depends. Evaporation, pre-
cipitation, and the long-range transport
of water vapor by winds are the processes
that constantly recycle water and renew fresh
water resources - a feature unique to our planet, at
least as far as we know. As civilization has evolved, we have been making ever-increas-
ing demands on water resources and by now, any substantial change in the global water
cycle would entail serious consequences in many regions of the world where water
resources are already strained.
The amount of water vapor carried by the atmosphere increases dramatically with tem-
perature, because warm air has a much larger water holding capacity than cold air. As
our global climate becomes warmer, models predict an acceleration of the global water
cycle, increased evaporation and increased global precipitation. Increased evaporation
entails faster depletion of ground water resources, although more abundant rainfall
means more frequent and generally larger flooding events. The report from the
Intergovernmental
Panel on Climate
Change (1996)
states that
“Warmer tempera-
tures will lead to a
more vigorous
hydrological cycle;
this translates into
prospects for more
severe droughts
and/or floods in
some places ....
Several models
4

indicate an increase in precipita-
tion intensity, suggesting a
possibility for more
extreme rainfall
events.” Thus, accu-
rate characterization
of the rate of recycling
of water in the atmos-
phere may be a sensitive
index of the multiple roles
of hydrology in the climate
system.
One general indicator of the strength of the global water cycle is the mean residence
time of water in the atmosphere. The equivalent of the entire water content of the
atmosphere is recycled 33 times each year. (This is obtained by dividing the average
global yearly precipitation of 95 cm/year by the total atmospheric content of precip-
itable water vapor of 2.9 cm). This gives water a mean global residence time in the
atmosphere of about 11 days (Chahine, Nature 1992). Variations in the residence time, or
its equivalent the recycling rate, can be obtained from space observations with an accu-
racy that permits determination of how it is changing on a monthly basis.
The results from current space data are not very accurate but nev-
ertheless show a small trend toward acceleration of the recy-
cling rate of 0.4 ± 0.5% per year. If this trend persists, it may
lead to an intensification of the global hydrological cycle,
having major impacts on regional water resources and the
possibility of changes in the magnitude and timing of
runoff and the intensity of floods and droughts.
Thus we have a direct and compelling interest in learn-
ing about any significant change in the global water
cycle. The most precise way to identify such a trend is by
measurement of changes in the precipitable water load car-
ried by the atmosphere. The AIRS/AMSU/HSB suite of
instruments will provide the most accurate information ever
obtained about the total atmospheric water content. From this we
can deduce whether, and at what rate, the Earth’s water cycle may be
accelerating.
5

Water vapor is the dominant greenhouse gas in the Earth’s atmosphere. It accounts for
about 60% of the greenhouse effect of the global atmosphere, and most of its sensitivity
to temperature, far exceeding the total combined effects of carbon dioxide, methane,
ozone and other greenhouse gases.
From time immemorial, humans have been engaged in activities that alter the environ-
ment, first by clearing forests and using the land for their own purposes, and now by
burning fossil fuels at a rate that results in a major increase in the amount of carbon
dioxide and other absorbing greenhouse gases present in the atmosphere. As a result,
the atmospheric concentration of carbon dioxide has already reached a level 30% higher
than at any time during the past 300,000 years, despite drastic changes in the Earth’s cli-
mate and successive ice ages. Methane concentration has more than doubled, while
unknown amounts of “aerosol” haze have been introduced in the atmosphere. In these
examples, the primary impact of human activities is well understood, yet the long-term
consequences cannot be readily predicted. The reason is that the primary impacts or
“forcing” of the Earth’s climate may be enormously amplified by further re-adjustments
in the Earth’s atmosphere, land and oceans.
Water vapor in the atmosphere strongly absorbs infrared radiation emitted by the
Earth’s surface and therefore acts as a blanket that insulates us from the cold radiation
sink of deep space. This atmospheric blanket is thickest in the tropics, where nighttime
air temperature remains close to daytime values. It is thin over deserts, high mountains,
and plateaus, where, partly as a consequence, temperatures drop precipitously at night.
Because of the presence of variable amounts of water vapor in the air above us, the sur-
face warming associated with an increase of energy absorbed by the planet is twice as
much as it would be with a totally dry atmosphere. This is a major effect and also a
source of considerable uncertainty about future climate change.
Water Vapor: Earth’s PrimaryGreenhouse Gas
6

While relatively thin, water vapor in the upper troposphere is particularly effective at
absorbing infrared radiation emitted by the Earth’s surface. Water is brought to this
level by tall storm clouds that rise high in the troposphere. However, we are not sure
how clouds interact with water vapor in this critical region and whether more active
convection, as anticipated with warmer conditions at the Earth’s surface, would add
moisture to the upper troposphere or, to the contrary, dry the air. Accurate measure-
ments of atmospheric humidity profiles will resolve this uncertainty.
The Greenhouse Effect
The Earth without its atmosphere wouldbe, on average, a much colder place.Warming to the familiar temperatures ofsun-heated surfaces during the day, ourplanet would cool to far below freezing atnight. The atmosphere retains much ofthe daytime heat by absorbing infraredradiation (this is the familiar warmth felt afew feet from a west-facing wall on asummer evening). A similar phenomenon occurs when sun shines through a window into aclosed room, hence the term “greenhouse effect.”
All gases absorb infrared radiation, but some are particularly effective. Water vapor is themost important greenhouse gas, mostly because it is so abundant. Next in importance arecarbon dioxide and methane. Water vapor varies naturally, but human activities have producedsignificant amounts of additional atmospheric carbon dioxide and methane, particularly sincethe start of the industrial revolution in the late eighteenth century. (Current United States percapita production of carbon dioxide is about six tons per year.) As early as a century ago sci-entists speculated that increasing carbon dioxide from burning coal and oil might warm theEarth. And as Earth warms, evaporation increases, sending more water vapor into our atmos-phere.
Our planet has experienced a rapid temperature increase since the 1970s, and six of the tenwarmest years of the past century were in the 1990s. Significant changes in climate haveaccompanied this warming. Are these changes caused by increasing greenhouse gases,notably carbon dioxide? While many climate researchers believe so, the causes of climatechange are not well understood. A goal of the AIRS/AMSU/HSB science team is long-term,stable observation of the atmosphere for monitoring global warming and other types of cli-mate change.
7

Change in global-mean temperature would not draw much attention if we did not fore-
see that relatively small variations in the global environment can entail changes of much
greater significance in regional weather, water resources and agricultural productivity.
The striking manifestations of “El Niño weather” are but one example of such climate-
weather connections.
Much remains to be learned, however, about the relationship between observed year-to-
year changes or long-term trends in planetary climate, and corresponding changes in
storm tracks and intensity. We already know that the frequency and distribution of trop-
ical cyclones, hurricanes or typhoons, between the Atlantic and Pacific oceans changes
from year to year, governed in part by El Niño events or their counterparts, but they are
also sensitive to other, longer term changes in global winds, the water content of the
lower atmosphere, the temperature of the ocean and probably more. Likewise, the
intensity and path of mid-latitude storms respond to planetary-scale patterns or “oscil-
lations” of the global atmosphere, of yet unknown origin. We surmise that these phe-
nomena hold the key to effective predictions of the anticipated regional effects of cli-
mate variations. We want to know the extent to which variations in local weather, pre-
cipitation and water resources are related to global climate change.
Are Current WeatherAnomalies Connected toClimate Change?
8

Furthermore, weather disturbances govern the distribution of clouds, their water con-
tent, and resulting rainfall, as well as solar radiation that reaches the surface. In order to
understand and predict climate change, it is not sufficient to consider atmospheric,
oceanic or land processes in isolation from the atmospheric circulation that controls the
fluxes of radiant energy, heat, and water among the atmosphere, ocean and land surface.
Such connections are transient and can only be understood by comparing meteorological
and hydrological forecasts with observations at the same place and time.
To learn more, we need to capture both the large-scale patterns of the global atmosphere
and the details of individual storms or dry spells. Satellite observation is the ideal tool
for this purpose; only space-based sensors can provide at the same time detailed infor-
mation on current weather events and a global view of the atmosphere. The most direct-
ly applicable information is delivered by atmospheric sounders like AIRS/AMSU/HSB,
which can resolve the vertical structure of weather systems.
9

Percent Cloud Covefrom the data of the TelevisioSatellite (TIROS) Operation
0 2
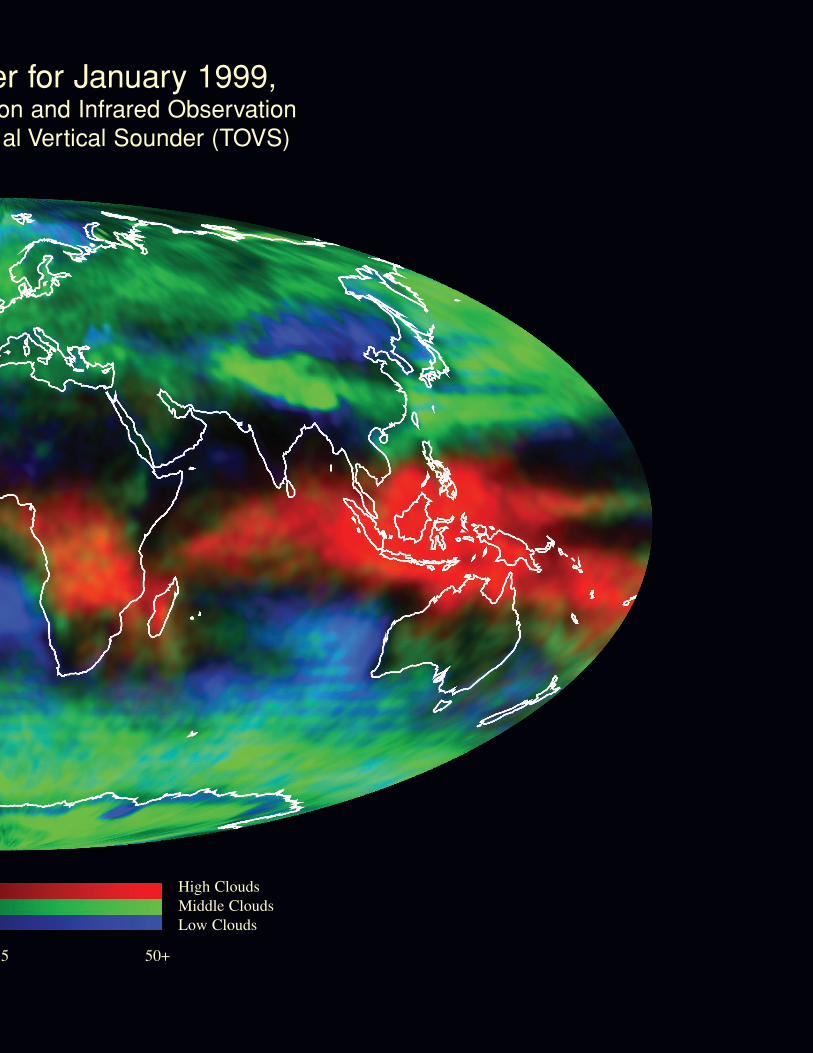
er for January 1999, on and Infrared Observational Vertical Sounder (TOVS)
High CloudsMiddle CloudsLow Clouds
5 50+

Only 50 years ago, weather forecasting was an
art, based on the inspired interpretation of
scarce data from a loose array of ground-based
observing stations, balloons, and aircraft. The abil-
ity to conduct appropriate weather reconnaissance
over the ocean was a decisive advantage. The timely
exchange of terse meteorological messages was the essence
of a successful “synoptic” (instantaneous) analysis of the weather
situation over the region. Thirty years ago, meteorologists had their first opportunity to
use global observations collected for the scientific purpose of demonstrating the feasibil-
ity of one-to-two-week weather prediction using computer models of the atmosphere.
We are now finally on the verge of achieving this objective, thanks to successive break-
throughs in global weather observation from the Earth’s surface and from space, a
sweeping acceleration in worldwide communications, and the ever increasing computer
capabilities.
Satellite-based sensors can only detect radiation emerging from the
Earth’s atmosphere, not measure directly the meteorological
properties of interest. The interpretation of satellite
measurements requires a complicated mathematical
procedure that consists of recreating as best we can
the radiation signature of the partially absorbing,
partially transparent atmospheric medium
below. This procedure was hitherto limited by
the accuracy and resolution of the basic radia-
tion measurements and incapable of matching
the accuracy of measurements made directly in
the atmosphere. For this reason, satellite obser-
vations added to the available information only
where local measurements were scarce, such as
most of the southern hemisphere and large oceanic
regions in the northern hemisphere. These technical limita-
tions have been overcome. We expect that satellite sounding
data will finally match the accuracy of balloon-borne sensors and deliver the same preci-
sion worldwide as was possible so far only over the developed regions of the northern
hemisphere, with corresponding improvement in the quality and range of extended
weather forecasts.
Improving Weather Forecasts
12

Predicting theWeather
The simplicity of tomorrow’sweather forecast masks aremarkably complex and difficultactivity. The forecast processbegins with the timely gatheringof atmospheric observations. These data sets are very large, but also surprisingly incomplete:current satellites take limited numbers of observations, and radiosondes are confined to the conti-nents twice daily. Large areas of our planet, especially over the oceans, are poorly observed.(Oceans may seem inconsequential to those of us living on land, but many weather disasters havefeatured poorly forecast oceanic storms moving ashore.)
Observations are combined mathematically with computer models of the atmosphere. These mod-els embody the equations describing the physical properties of the atmosphere. Despite theirsophistication, they only partially describe the atmosphere’s true behavior. For example, even ahigh resolution global model has gridpoints spaced every 100 km, so a single profile represents avolume of roughly 200,000 cubic km. The best possible observations entered into the mostsophisticated forecast models sometimes yield questionable predictions.
This leads to the final step in the forecast process. Weather forecasters analyze weather observa-tions and predictions from computer models. Forecasters use judgment and experience to sortthrough complex and sometimes contradictory information. The result is tomorrow’s forecast.
A major goal of the AIRS/AMSU/HSB science team is improving weather forecasts. This will beachieved through more complete observations, especially over the oceans.
13
243 253 263 273 283 293 303 313 K
Daytime Atmospheric Surface TemperatureTOVS data, July 1999

Understanding the dynamics of climate, the trans-
port of chemical agents in the atmosphere and their
distribution over the surface of the Earth, and the
rainfall and evaporation that control the growth of
vegetation requires a precise knowledge of the global
atmospheric circulation, temperature profiles, and
water vapor content.
AIRS/AMSU/HSB will observe and characterize the
entire atmospheric column from the surface to the
top of the atmosphere in terms of surface emissivity and temperature, atmospheric tem-
perature and humidity profiles, cloud amount and height, and the spectral outgoing
infrared radiation. These data and scientific investigations will answer long-standing
questions about the exchange and transformation of energy and radiation in the atmos-
phere and at the Earth’s surface.
1. Determination of the factors that control the global energy and water cycles: The
study of the global hydrologic cycle and its coupling to the energy cycle is a key to
understanding the major driving forces of the Earth’s climate system.
AIRS/AMSU/HSB will measure the major components of these driving forces
including the thermal structure of the surface and the atmosphere, the outgoing
longwave infrared radiation, and the atmospheric water vapor content.
2. Investigation of atmosphere-surface interactions: The high spectral resolution of
AIRS will provide several spectrally transparent window channels that will observe
the surface with minimal contamination by the atmosphere and will allow the
determination of accurate surface temperature and infrared spectral emissivity. In
addition, the narrow spectral channels in the short-wavelength infrared region will
observe the atmospheric layers near the Earth’s surface with the highest vertical res-
olution possible by passive remote sensing. The observations will enable investiga-
tions of the fluxes of energy and water vapor between the atmosphere and the sur-
face, along with their effect on climate.
Science Objectives
14

3. Improving numerical weather prediction: Numerical weather prediction models
have now progressed to the point where they can predict atmospheric temperature
profiles to an accuracy of 2 K, which is equivalent to the accuracy of current satellite
data. Further improvement in our knowledge of temperature profiles is essential in
order to improve forecasting accuracy. AIRS/AMSU/HSB temperature profiles with
radiosonde accuracy of 1 K in 1 km-thick layers are key to improving the accuracy
and extending the range of weather forecasts.
4. Detection of the effects of increased greenhouse gases: AIRS will map the concen-
tration of carbon dioxide and methane globally. In addition, the ability to provide
simultaneous observations of the Earth’s atmospheric temperature, ocean surface
temperature, and land surface temperature and infrared spectral emissivity, as well
as humidity, clouds and the distribution of greenhouse gases, makes
AIRS/AMSU/HSB a primary space instrument to observe and study the response
of the atmosphere to increased greenhouse gases.
5. Assessing climate variations and feedbacks: The accuracy and high spectral reso-
lution of AIRS provide a powerful new tool for climate studies. AIRS’ high resolu-
tion infrared coverage from 3.74 to 15 µm will give researchers the ability to vali-
date numerical models and to study different climate processes as needed. For
example, emission to space by strong and weak water vapor lines is a critical cli-
mate feedback mechanism in the middle and lower troposphere. Numerical models
must reproduce such lines as an indication of their ability to describe the climate
system.
This cut-away view of the AIRS instrument shows the key mechanical structures and assemblies. The spectrometer issmall compared to the volumerequired to support space radiatorsand electronics in a configurationconsistent with the spacecraft interface constraints.
15

Science Team
The international science team for the AIRS instrument includes experts from the United
States, France, Italy and Australia. Under the leadership of Dr. Moustafa Chahine at the
Jet Propulsion Laboratory, the team guides the definition of the AIRS instrument and its
scientific goals.
M. Chahine, JPL H. Revercomb, UW P. Rosenkranz, MIT A. Chedin, EP
H. Aumann, JPL J. Susskind, GSFC D. Staelin, MIT R. Rizzi, UB
C. Gautier, UCSB E. Kalnay, UMCP M. Goldberg, NOAA/NESDIS J. Le Marshall, ABM
W. Smith, LaRC L. Strow, UMBC R. Calhieros, AEB L. McMillan, NOAA/NESDIS
ABM Australian Bureau of MeteorologyAEB Agencia Espacial Brasileira (Brazilian Space Agency)EP Ecole Polytechnique, FranceGSFC Goddard Space Flight Center (NASA)JPL Jet Propulsion Laboratory (NASA)LaRC Langley Research Center (NASA)MIT Massachusetts Institute of TechnologyNESDIS National Environmental Satellite, Data, and Information ServiceNOAA National Oceanic and Atmospheric AdministrationUB University of Bologna, ItalyUCSB University of California, Santa BarbaraUMBC University of Maryland, Baltimore CountyUMCP University of Maryland, College ParkUW University of Wisconsin
16
Atmospheric Sounding
Atmospheric sounding for information about temperature and abundance of gases is based onthe fact that thermal radiation received by a radiometer originates at wavelength-dependentdepths in the atmosphere. This is caused by a non-uniform absorption spectrum, particularly bymolecular absorption lines. (Note that in an atmosphere in thermal and radiative equilibrium,emission equals absorption. If that were not the case, the atmosphere would either cool down orheat up until balance is reached.) At wavelengths near the peak of such a line, absorption may beso strong that most of the underlying atmosphere is opaque, and only the top of the atmosphereis “seen.” Conversely, at wavelengths away from the lines, often called a “window” region, theatmosphere may be nearly transparent, and the surface or the bottom of the atmosphere is seen.Through spectral sampling, i.e., by measuring narrow spectral bands or “channels,” it is then pos-sible to probe into different depths of the atmosphere.
It is possible to separate the effects of different atmospheric gases by using channels in differentspectral regions where one gas has absorption features while the others do not. To measure tem-perature profiles, AIRS uses a large number of CO2 absorption lines in the infrared spectralregion, while AMSU-A uses a few O2 absorption lines at microwave wavelengths. To measurewater vapor profiles, AIRS uses many H2O absorption lines throughout its spectral range, andHSB uses a single H2O absorption line in the microwave region. Since the vertical distribution ofCO2 and O2 are both stable and well known, the CO2 and O2 channels allow the temperature dis-tribution to be determined. With that known, the H2O channels allow the vertical distribution ofwater vapor density to be determined.
The infrared spectral range covered by AIRS also features absorption lines of other molecularspecies, such as O3 and CH4. This makes it possible to deduce ozone and methane profiles.Finally, while liquid water makes most clouds completely opaque in the infrared region, in themicrowave region they are partially transparent. The microwave spectral absorption features ofliquid water therefore make it possible to determine the vertical distribution of liquid water inclouds from AMSU-A and HSB measurements. This information is used to make the derived AIRStemperature and water vapor profiles more accurate.
17
The Instruments
AIRS measures upwelling radiances in 2378 spectral channels in the infrared (IR) from
3.74 µm to 15.4 µm. A set of 4 channels in the visible/near-infrared (Vis/NIR) observes
wavelengths from 0.4 to 1.0 µm to provide cloud cover and spatial variability informa-
tion. The microwave sounders provide sea ice concentration, snow cover, and additional
temperature profile information, as well as precipitable water and cloud liquid water
content. If cloud cover is too great for IR retrievals, the microwave measurements alone
will provide a coarse, low precision atmospheric temperature profile and surface charac-
terization.
AMSU-A is actually two completely separate sensor units, AMSU-A1 and AMSU-A2,
but during data processing on the ground the observations from the two instruments
are combined and treated as if they came from a single instrument. (This is possible
because the two units are very similar and are operated in a synchronized way.)
Together they provide measurements in 15 spectral channels. Most of them are used to
derive temperature profiles, from the surface upward to about 40 km. Some are used to
provide cloud information. The AMSU-A “footprint” is three times as wide as the AIRS
footprint, and an AMSU-A spot therefore covers a cluster of nine AIRS spots. Data from
a single AMSU-A spot are used to “cloud clear” a cluster of nine AIRS observations.
HSB provides measurements in four spectral channels, which are used to derive water
vapor profiles, from the surface to about 10 km, and some supplemental cloud informa-
tion. They are also used, together with AMSU-A data, to derive liquid water (i.e., cloud)
profiles to help make the AIRS-derived profiles more accurate. Rain intensity can also be
deduced from the HSB measurements.
The instruments are all cross-track scanners. They view their respective scan mirrors,
which rotate around an axis along the flight direction. As a mirror is rotated, the “view-
ing beam” sweeps across the ground track below the satellite and is reflected into its
instrument. As the spacecraft moves along this results in a scan “swath” that extends a
little more than 800 km on either side of the ground track. The AMSU-A reflectors make
a complete revolution in 8 seconds. The AIRS reflector and HSB reflector each make
three revolutions in the same time (i.e., each makes one revolution in 2.67 seconds).
About 99° of each 360° revolution is used to sample the atmosphere and surface below.
This takes about 6 seconds for AMSU-A and 2 seconds for AIRS and HSB. AMSU-A
takes 30 Earth-view samples in the 6-second period, and AIRS and HSB each take 90
Earth-view samples in the 2-second period. The sampling density of AIRS and HSB is
therefore triple that of the AMSU-A instruments, both along and across the swath.
Hence for each AMSU-A sample (or spot) there are nine HSB and nine AIRS spots.
The remainder of the rotation cycle is spent looking at empty space or internal calibra-
tion targets. Calibrating every scan cycle results in a very stable measurement system.
18

FACTS ABOUT AIRS
Size: stowed: 116.5 x 80 x 95.3 cm deployed: 116.5 x 158.7 x 95.3 cm Mass: 177 kg Power: 220 W Data Rate: 1.27 Mbps Spectral Range: IR: 3.74 - 15.4 µm Vis/NIR: 0.4 - 1.0 µm Channels: IR: 2378 Vis/NIR: 4 Aperture: 10 cm Instrument Field of View: IR: 1.1° (= 13.5 km @ nadir) Vis/NIR: 0.2° (= 2.3 km @ nadir) Swath Width: 99° (= 1650 km) Scan Sampling: IR: 90 x 1.1° Pointing Accuracy: IR: 0.1° Thermal Control: IR detectors: active cooler @ 60 K Passive radiator @ 150 K Electronics @ ambient Prime Contractor: British Aerospace Systems (formerly Lockheed-Martin) Responsible Organization: Jet Propulsion Laboratory
FACTS ABOUT AMSU
Instrument: AMSU-A1 AMSU-A2 Size: 72 x 34 x 59 cm 73 x 61 x 86 cm Mass: 49 kg 42 kg Power: 77 W 24 W Data Rate: 1.5 kbps 0.5 kbps Spectral Range: 50 - 90 GHz 23 - 32 GHz Channels: 13 2 Aperture: 15 cm (two) 30 cm (one) Instrument Field of View: 3.3° (= 40.5 km @ nadir) 3.3° (= 40.5 km @ nadir) Swath Width: 100° (= 1690 km) 100° (= 1690 km) Scan Sampling: 30 x 3.33° 30 x 3.33 ° Pointing Accuracy: 0.2° 0.2° Thermal Control: None (ambient) None (ambient) Prime Contractor: Aerojet Aerojet Responsible Organization: NASA/GSFC NASA/GSFC
FACTS ABOUT HSB
Size: 70 x 65 x 46 cm Mass: 51 kg Power: 56 W Data Rate: 4.2 kbps Spectral Range: 150 - 190 GHz Channels: 4 Aperture: 18.75 cm (one) Instrument Field of View: 1.1° (= 13.5 km @ nadir) Swath Width: 99° (= 1650 km) Scan Sampling: 90 x 1.1° Pointing Accuracy: 0.1° Thermal Control: None (ambient) Prime Contractor: Matra Marconi Space (UK) Responsible Organization: INPE (Brazil)
19

20
Data Products to be Derived from the AIRS/AMSU/HSB Data by the AIRS Science Team
Each of these products is described in the EOS Data Products Handbook, volume 2, published in 2000and available from the EOS Project Science Office web site at http://eospso.gsfc.nasa.gov.
Level 2 Cloud-Cleared Radiances
Flux Product Clear-column radianceOutgoing longwave radiation at the top of the atmosphereOutgoing shortwave radiation at the top of the atmosphereNet longwave flux at the surfaceNet shortwave flux at the surface
Atmospheric Temperature Product Temperature profile through the atmosphere (30 levels)Troposphere heightStratosphere height
Humidity Product Water vapor profile through the atmosphereTotal precipitable waterCloud liquid-water contentPrecipitation indicationCloud-ice indication
Cloud Product Cloud-top pressureCloud-top temperatureFractional cloud coverCloud spectral propertiesCloud type
Ozone Product Ozone profile through the atmosphereTotal ozone
Trace Constituent Product MethaneCarbon monoxide
Surface Analysis Product Sea surface skin temperatureLand surface skin temperatureInfrared surface emissivityMicrowave surface emissivity

The Aqua spacecraft under construction at TRW.
AIRS
AMSU-A1
AMSU-A2
HSB
21

NP-2001-5-248-GSFC