aisi s1 tool steel after deep cryogenic treatment: tensile...
TRANSCRIPT
Advances in Materials 2015; 4(2-1): 1-8
Published online January 16, 2015 (http://www.sciencepublishinggroup.com/j/am)
doi: 10.11648/j.am.s.2015040201.11
ISSN: 2327-2503 (Print); ISSN: 2327-252X (Online)
AISI S1 tool steel after deep cryogenic treatment: Tensile properties and microstructure
Keyvan Seyedi Niaki1, Seyed Ebrahim Vahdat
2, *
1Department of Mechanical Engineering, Iranian Research Organization for Science and Technology (IROST), Tehran, Iran 2Department of Engineering, Ayatollah Amoli Branch, Islamic Azad University, Amol, Iran
Email address: [email protected] (K. S. Niaki), [email protected] (S. E. Vahdat)
To cite this article: Keyvan Seyedi Niaki, Seyed Ebrahim Vahdat. AISI S1 Tool Steel after Deep Cryogenic Treatment: Tensile Properties and Microstructure.
Advances in Materials. Special Issue: Advanced Tool Steels. Vol. 4, No. 2-1, 2015, pp. 1-8. doi: 10.11648/j.am.s.2015040201.11
Abstract: Successful employment of advanced tool steel in engineering applications is related to its ability in terms of meeting
service life requirements and fabrication with proper dimensions. Deep cryogenic treatment may be used to produce advanced
tool steel by simultaneously increasing toughness, strength, and hardness. Twelve sets of specimens were tested, 9 of which were
deep cryogenic treated and then tempered. Tensile properties, hardness, X-ray diffraction, and scanning transmission electron
microscopy were applied for macroscopic and microscopic investigations. The best results of simultaneous improvement in
tensile toughness, hardness, and strength were obtained for 36 h soaking and 1 h tempering times.
Keywords: Hardness, STEM, Strength, Tensile Toughness, XRD
1. Introduction
Sustainable development is an important challenge in
human life. It refers to changing the process of proper
application of resources, conducting investments, and
orienting technology development in a way that could be
consistent with present and future needs. Proper use of raw
materials facilitates sustainable development [1-3].
Advanced tool steel properties include high strength, wear
resistance and hardness in addition to suitable toughness for
enduring mechanical impact loadings. Researchers [4-9]
demonstrated that sub zero treatments improved mechanical
properties of several steels. For example, for AISI M2 high
speed tool steel hardness and wear resistance improved by
using DCT compared with the conventional treatment [6].
Therefore, DCT used in this study for producing advanced
AISI S1 tool steel.
2. Experimental methods
Table 1 demonstrates the chemical analysis of AISI S1
used in this study. The AISI S1 is mostly used for
manufacturing cutting blades for thick sheets and also for
punching tools.
Table 1. Chemical analysis of the AISI S1 tool steel
(W%) Element (W%) Element (W%) Element (W%) Element (W%) Element (W%) Element
Rest Fe 0.0281 Mo 1.5700 W 0.0250 S 0.1280 Ni 0.4800 C
0.0567 P 0.3360 Mn 1.1200 Cr 0.0148 V 0.9950 Si
Many studies have been published on advanced tool steels;
however, each one has focused on one or few sets of
specimens rather than collecting data from many specimens.
Consequently, it is helpful to collect the published results in
order to have thorough representations of the measured
effects. Thus, 12 sets of AISI S1 specimens were tested. One
set consisted of the specimens which underwent the
conventional hardening procedure [10]. The remaining sets
of specimens underwent full treatment cycles. The
temperature-time history for the specimens is given in Fig.
1(a) and flowchart of the experimental procedure is depicted
in Fig. 1(b). The DCT work followed a procedure shown in
Fig. 1(b) and used a programmable cryogenic processor
which was designed and developed [11]. Considering the
2 Keyvan Seyedi Niaki and Seyed Ebrahim Vahdat: AISI S1 Tool Steel after Deep Cryogenic Treatment: Tensile
required tempering temperature of 200ºC, the cryogenic
processor had some added facility for the in
the DCT specimens for the required time durations. The time
from the end of hardening to the beginning of DCT was ≈17
min. However, the DCT specimens were tempered in
which led to the minimum time gap between the steps as ≈2
min. The specimens were assigned codes for easy
identification, which is described in Tables 2 and 3.
(a) DCT cycles
Table 2
Code Process Step 1
Standard Oil
quenching heated to 900±5 ºC
(rate ~ 5.5 ºC /min)002, 003, 241,242,243,
361,362,363, 481, 482,483
Water
quenching
Code Cooling Soaking
temperature
002 ----- --------
003 ----- --------
241
-150±4 ºC
(rate ~1.3 ºC/min) -196±6 ºC
242
243
361
362
363
481
482
483
The specimens had to be machined to the required sizes
prior to their treatment. The uniaxial force
tensile test (F-∆L) was carried out on a standard specimen
with 5 mm diameter and 25 mm parallel length at room
temperature, according to BS EN 10002-1 [12
was 0.00166 S-1, each test was repeated for three time
the average value was obtained. For example, it depicted for
specimens of 361 and 003 in Fig. 2.
A fast and reliable tool for phase and orientation map
Keyvan Seyedi Niaki and Seyed Ebrahim Vahdat: AISI S1 Tool Steel after Deep Cryogenic Treatment: Tensile
Properties and Microstructure
ring temperature of 200ºC, the cryogenic
processor had some added facility for the in-situ tempering of
the DCT specimens for the required time durations. The time
from the end of hardening to the beginning of DCT was ≈17
re tempered in-situ,
which led to the minimum time gap between the steps as ≈2
min. The specimens were assigned codes for easy
identification, which is described in Tables 2 and 3.
(b) DCT flow chart
Figure 1. DCT (a) Cycles; (b) Flow ch
Table 2. Codes for hardening of the AISI S1 tool steel
Step 1 Step 2 Step 3 Tempering process
heated to 900±5 ºC
(rate ~ 5.5 ºC /min)
soaked at 900 ºC
for 60±5 min
quenched
in oil
tempered at 450 ºC for 1 h (rate ~ 3 ºC/min)
air cooled to ambient temperature
quenched
in water Continued in Table 3
Table 3. Codes for DCT of AISI S1 tool steel
Soaking Tempering
temperature time temperature time
-----
200±5 ºC
(rate ~3 ºC/min)
2 h
----- 3 h
196±6 ºC
24 h
1 h
2 h
3 h
36 h
1 h
2 h
3 h
48 h
1 h
2 h
3 h
The specimens had to be machined to the required sizes
prior to their treatment. The uniaxial force-displacement
∆L) was carried out on a standard specimen
with 5 mm diameter and 25 mm parallel length at room
12]. The strain rate
1, each test was repeated for three times, and
the average value was obtained. For example, it depicted for
A fast and reliable tool for phase and orientation map
acquisition by an STEM was obtained in
specimens were cut out as 3 mm discs in the wire cut machine,
thinned to ~100nm by hand polishing, then dimpled and argon
ion milled using a Gatan PIPS mill and cold stage. STEM
machine used at LeRoy Eyring Center for Solid State Science,
John Cowley Center for HRE
USA. Theoretical patterns calculated for the phases listed in
the ASTM E975-13 [14].
Keyvan Seyedi Niaki and Seyed Ebrahim Vahdat: AISI S1 Tool Steel after Deep Cryogenic Treatment: Tensile
DCT flow chart
DCT (a) Cycles; (b) Flow chart
Tempering process
tempered at 450 ºC for 1 h (rate ~ 3 ºC/min) then
air cooled to ambient temperature
Continued in Table 3
Final cooling
Cooled in room to ambient
temperature
acquisition by an STEM was obtained in [13]. STEM
were cut out as 3 mm discs in the wire cut machine,
thinned to ~100nm by hand polishing, then dimpled and argon
ion milled using a Gatan PIPS mill and cold stage. STEM
machine used at LeRoy Eyring Center for Solid State Science,
John Cowley Center for HREM, Arizona State University,
USA. Theoretical patterns calculated for the phases listed in

Advances in Materials 2015; 4(2-1): 1-8 3
(a) specimen of 361
(b) specimen of 003
Figure 2. F-∆L curve for specimens of (a) 361 and (b) 003
3. Results and Discussion
3.1. Tensile Evaluations
As shown in Figs. 3 and 4, for different specimens, yield
strength and UTS showed no relative changes. However, in
comparison with the standard specimen, UTS and hardness of
the DCT specimens had 32-36% and 9-12% increase,
respectively.
Figure 3. Tempering time trend of yield strength
Figure 4. Tempering time trend of UTS
Fig. 5 shows that, with increasing the tempering time, the
soaking time required for obtaining the maximum hardness
was reduced. For example, for 1 h of tempering time, 48 h of
soaking time at -196ºC was needed to achieve maximum
hardness. For 2 h of tempering time, the corresponding
soaking time at -196ºC was approximately 24 h and further
increase in soaking time was not necessary. In other words,
with increase in tempering time, shorter soaking time was
required for obtaining maximum hardness. In addition, Fig. 5
demonstrates that, with increase in soaking time, the
tempering time required for obtaining maximum hardness was
reduced. For example, for 24 h of soaking time at -196ºC, 3 h
of tempering time was needed to achieve maximum hardness.
For 36 h of soaking time at -196ºC, the corresponding
tempering time was 2 h. In the case of 48 h of soaking time,
the required tempering time was 1 h. In other words, with
increase in soaking time, shorter tempering time was required
for achieving maximum hardness.
Figure 5. Tempering time trend of hardness
The above findings could be explained by the results of
microstructure section. Volume fraction (Vf) of SC increased
with soaking or tempering times from 2.18 V% to 12.87 V%
(Fig. 10), which led to maximum hardness.
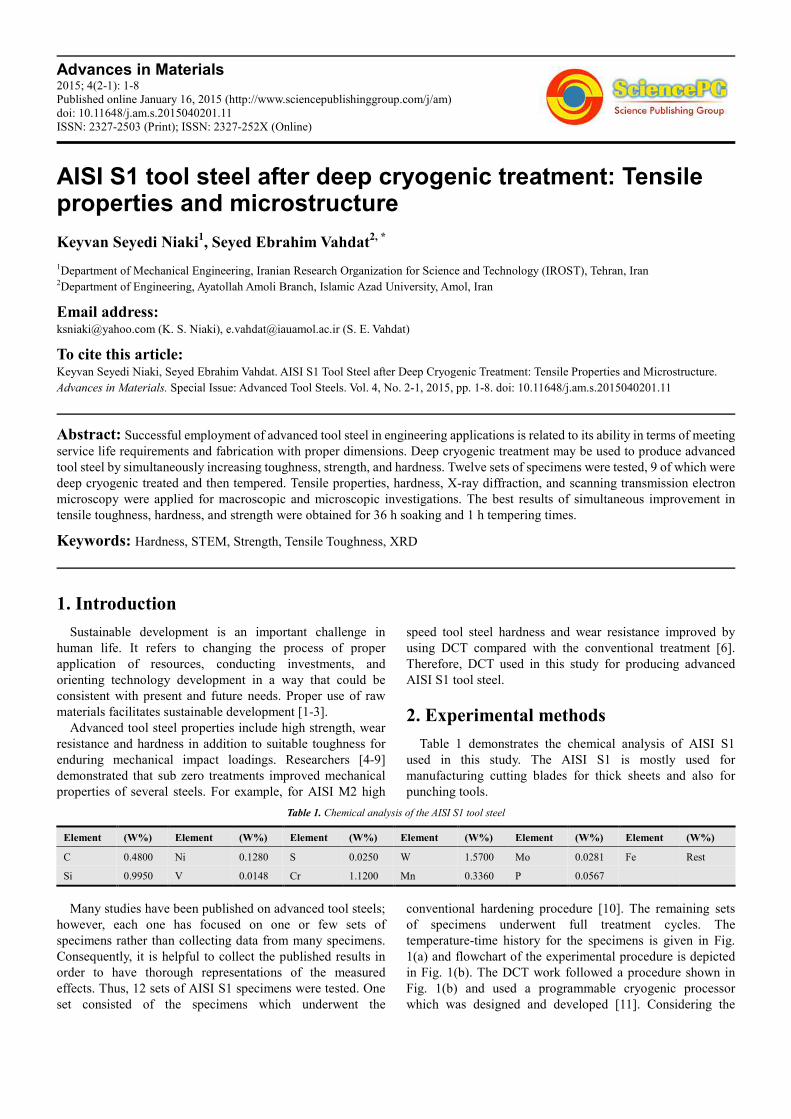
As demonstrated in Fig. 6, among all the specimens,
elongation of specimen 242 was the minimum, while
specimens 361 and 482 had maximum elongation. Therefore,
according to Figs. 4 and 6 and considering the following
relation in [15] (Equation 1), specimens 361 and 482
presented 12-35% improvement in tensile toughness as
demonstrated in Fig. 7; where UTS is ultimate tensile strength
and ef is fracture strain.
2/3×UTS×ef ≈ UT or tensile toughness (1)
4 Keyvan Seyedi Niaki and Seyed Ebrahim Vahdat: AISI S1 Tool Steel after Deep Cryogenic Treatment: Tensile
Figure 6. Tempering time trend of elongation
As demonstrated in Fig. 7, in this research, specimens 361
and 482 had higher tensile toughness than conventionally
treated ones, which showed that increasing DCT duration
needed increasing tempering time to obtain high tensile
toughness. For example, for 36 h of soaking time at
h of tempering time was needed to achieve maximum tensile
toughness. For 48 h of soaking time at
corresponding tempering time was 2 h. In other words, with
increase in the tempering time, longer soaking time wa
required for obtaining maximum tensile toughness, because
tempering after DCT caused more reduction of residual stress
than tempering after conventional treatment
words, increasing DCT duration produced more dislocations
[17, 18], which needed increasing tempering time (at constant
tempering temperature) to obtain high tensile toughness.
Figure 7. Tempering time trend of tensile toughness
3.2. XRD and STEM Evaluations
The austenite to martensite transformation (M
274.63oC and finished (Mf) at 59.63
oC. Ms and M
obtained using Payson and Savage' equations (2) and (3)
which were valid for AISI S1.
Ms(oC) = 498.9 - (316.7×C%) - (33.3×Mn%)
(16.7×Ni%-11.1×(Si+Mo+W
Mf(oC) = Ms(
oC)-215
Keyvan Seyedi Niaki and Seyed Ebrahim Vahdat: AISI S1 Tool Steel after Deep Cryogenic Treatment: Tensile
Properties and Microstructure
Tempering time trend of elongation
As demonstrated in Fig. 7, in this research, specimens 361
and 482 had higher tensile toughness than conventionally
treated ones, which showed that increasing DCT duration
needed increasing tempering time to obtain high tensile
36 h of soaking time at -196ºC, 1
h of tempering time was needed to achieve maximum tensile
toughness. For 48 h of soaking time at -196ºC, the
corresponding tempering time was 2 h. In other words, with
increase in the tempering time, longer soaking time was
required for obtaining maximum tensile toughness, because
tempering after DCT caused more reduction of residual stress
than tempering after conventional treatment [16]. In other
words, increasing DCT duration produced more dislocations
, which needed increasing tempering time (at constant
tempering temperature) to obtain high tensile toughness.
trend of tensile toughness
The austenite to martensite transformation (Ms) started at
and Mf values were
obtained using Payson and Savage' equations (2) and (3) [19],
(33.3×Mn%) - (27.8×Cr%) -
Mo+W)) (2)
(3)
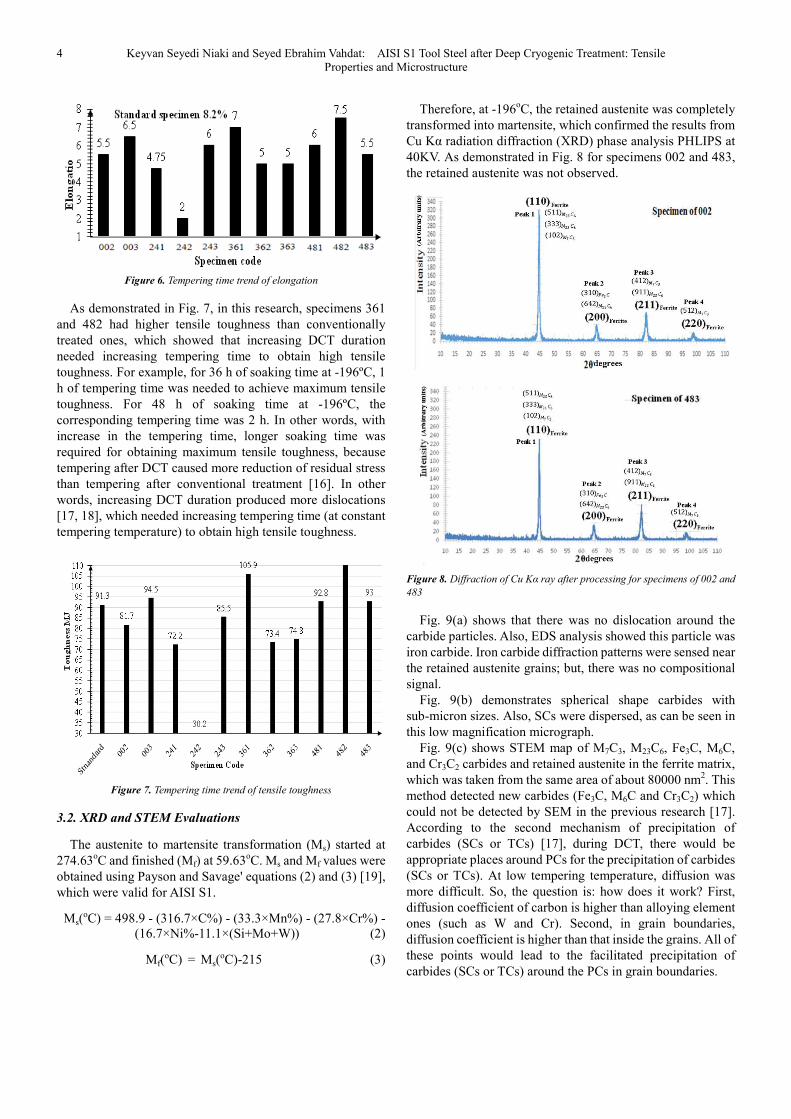
Therefore, at -196oC, the retained austenite was completely
transformed into martensite, which confirmed the results from
Cu Kα radiation diffraction (XRD) phase analysis PHLIPS at
40KV. As demonstrated in Fig. 8 for specimens 002 and 483,
the retained austenite was not obse
Figure 8. Diffraction of Cu Kα ray after processing f
483
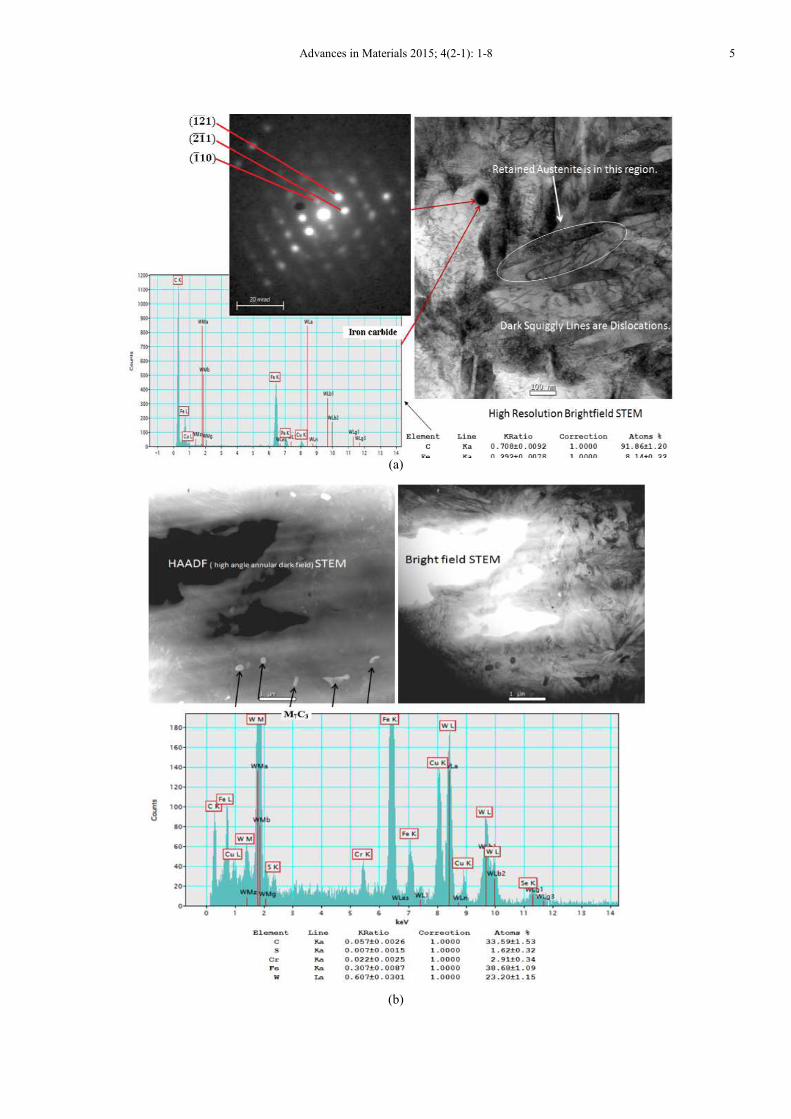
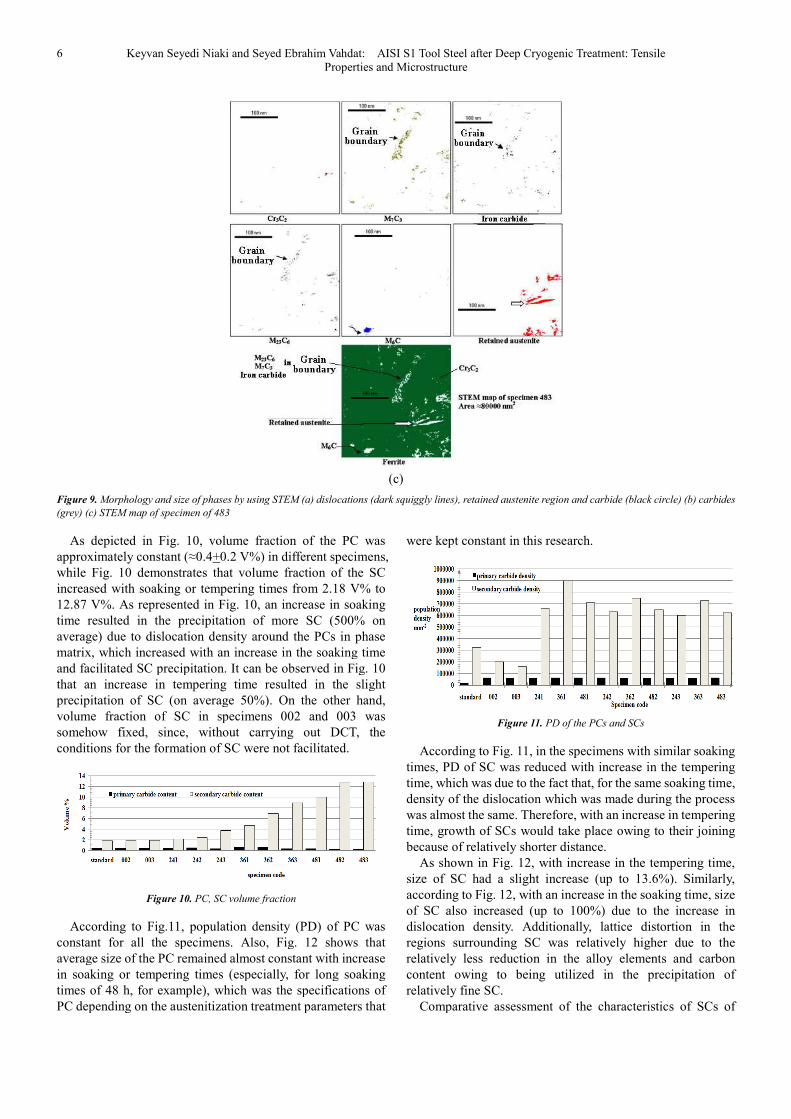
Fig. 9(a) shows that there was no dislocation around the
carbide particles. Also, EDS analysis showed this particle was
iron carbide. Iron carbide diffraction patte
the retained austenite grains; but, there was no compositional
signal.
Fig. 9(b) demonstrates spherical shape carbides with
sub-micron sizes. Also, SCs were dispersed, as can be seen in
this low magnification micrograph.
Fig. 9(c) shows STEM map of M
and Cr3C2 carbides and retained austenite in the ferrite matrix,
which was taken from the same area of about 80000 nm
method detected new carbides (Fe
could not be detected by SEM in the
According to the second mechanism of precipitation of
carbides (SCs or TCs) [17], during DCT, there would be
appropriate places around PCs for the precipitation of carbides
(SCs or TCs). At low tempering temperature, diffusion was
more difficult. So, the question is: how does it work? First,
diffusion coefficient of carbon is higher than alloying element
ones (such as W and Cr). Second, in grain boundaries,
diffusion coefficient is higher than that inside the grains. All of
these points would lead to the facilita
carbides (SCs or TCs) around the PCs in grain boundaries.
Keyvan Seyedi Niaki and Seyed Ebrahim Vahdat: AISI S1 Tool Steel after Deep Cryogenic Treatment: Tensile
C, the retained austenite was completely
transformed into martensite, which confirmed the results from
Cu Kα radiation diffraction (XRD) phase analysis PHLIPS at
40KV. As demonstrated in Fig. 8 for specimens 002 and 483,
the retained austenite was not observed.
Diffraction of Cu Kα ray after processing for specimens of 002 and
Fig. 9(a) shows that there was no dislocation around the
Also, EDS analysis showed this particle was
iron carbide. Iron carbide diffraction patterns were sensed near
the retained austenite grains; but, there was no compositional
Fig. 9(b) demonstrates spherical shape carbides with
micron sizes. Also, SCs were dispersed, as can be seen in
this low magnification micrograph.
s STEM map of M7C3, M23C6, Fe3C, M6C,
carbides and retained austenite in the ferrite matrix,
which was taken from the same area of about 80000 nm2. This
method detected new carbides (Fe3C, M6C and Cr3C2) which
could not be detected by SEM in the previous research [17].
According to the second mechanism of precipitation of
, during DCT, there would be
appropriate places around PCs for the precipitation of carbides
(SCs or TCs). At low tempering temperature, diffusion was
n is: how does it work? First,
diffusion coefficient of carbon is higher than alloying element
ones (such as W and Cr). Second, in grain boundaries,
diffusion coefficient is higher than that inside the grains. All of
these points would lead to the facilitated precipitation of
carbides (SCs or TCs) around the PCs in grain boundaries.
Advances in Materials 2015; 4(2-1): 1-8
(a)
(b)
5
6 Keyvan Seyedi Niaki and Seyed Ebrahim Vahdat: AISI S1 Tool Steel after Deep Cryogenic Treatment: Tensile
Figure 9. Morphology and size of phases by using STEM (a)
(grey) (c) STEM map of specimen of 483
As depicted in Fig. 10, volume fraction of the PC was
approximately constant (≈0.4+0.2 V%) in different specimens,
while Fig. 10 demonstrates that volume fraction of the SC
increased with soaking or tempering times from 2.18 V% to
12.87 V%. As represented in Fig. 10, an increase in soaking
time resulted in the precipitation of more SC (5
average) due to dislocation density around the PCs in phase
matrix, which increased with an increase in the soaking time
and facilitated SC precipitation. It can be observed in Fig. 10
that an increase in tempering time resulted in the slight
precipitation of SC (on average 50%). On the other hand,
volume fraction of SC in specimens 002 and 003 was
somehow fixed, since, without carrying out DCT, the
conditions for the formation of SC were not facilitated.
Figure 10. PC, SC volume fraction
According to Fig.11, population density (PD) of PC was
constant for all the specimens. Also, Fig. 12 shows that
average size of the PC remained almost constant with increase
in soaking or tempering times (especially, for long soaking
times of 48 h, for example), which was the specifications of
PC depending on the austenitization treatment parameters that
Keyvan Seyedi Niaki and Seyed Ebrahim Vahdat: AISI S1 Tool Steel after Deep Cryogenic Treatment: Tensile
Properties and Microstructure
(c)
Morphology and size of phases by using STEM (a) dislocations (dark squiggly lines), retained austenite region and
As depicted in Fig. 10, volume fraction of the PC was
0.2 V%) in different specimens,
while Fig. 10 demonstrates that volume fraction of the SC
times from 2.18 V% to
12.87 V%. As represented in Fig. 10, an increase in soaking
time resulted in the precipitation of more SC (500% on
average) due to dislocation density around the PCs in phase
matrix, which increased with an increase in the soaking time
and facilitated SC precipitation. It can be observed in Fig. 10
time resulted in the slight
itation of SC (on average 50%). On the other hand,
volume fraction of SC in specimens 002 and 003 was
somehow fixed, since, without carrying out DCT, the
conditions for the formation of SC were not facilitated.
PC, SC volume fraction
to Fig.11, population density (PD) of PC was
constant for all the specimens. Also, Fig. 12 shows that
average size of the PC remained almost constant with increase
times (especially, for long soaking
ich was the specifications of
PC depending on the austenitization treatment parameters that
were kept constant in this research.
Figure 11. PD of the PCs and
According to Fig. 11, in the specimens with similar soaking
times, PD of SC was reduced with increase in the tempering
time, which was due to the fact that, for the same soaking time,
density of the dislocation which was made during the process
was almost the same. Therefore, with an increase in
time, growth of SCs would take place owing to their joining
because of relatively shorter distance.
As shown in Fig. 12, with increase in the
size of SC had a slight increase (up to 13.6%)
according to Fig. 12, with an increase in the soaking time, size
of SC also increased (up to 100%) due to the increase in
dislocation density. Additionally, lattice distortion in the
regions surrounding SC was relatively higher due to the
relatively less reduction in the alloy elements and carbon
content owing to being utilized in the precipitation of
relatively fine SC.
Comparative assessment of the characteristics of SCs of
Keyvan Seyedi Niaki and Seyed Ebrahim Vahdat: AISI S1 Tool Steel after Deep Cryogenic Treatment: Tensile
retained austenite region and carbide (black circle) (b) carbides
were kept constant in this research.
PD of the PCs and SCs
According to Fig. 11, in the specimens with similar soaking
times, PD of SC was reduced with increase in the tempering
time, which was due to the fact that, for the same soaking time,
density of the dislocation which was made during the process
the same. Therefore, with an increase in tempering
time, growth of SCs would take place owing to their joining
because of relatively shorter distance.
As shown in Fig. 12, with increase in the tempering time,
size of SC had a slight increase (up to 13.6%). Similarly,
according to Fig. 12, with an increase in the soaking time, size
of SC also increased (up to 100%) due to the increase in
dislocation density. Additionally, lattice distortion in the
regions surrounding SC was relatively higher due to the
tively less reduction in the alloy elements and carbon
content owing to being utilized in the precipitation of
Comparative assessment of the characteristics of SCs of
Advances in Materials 2015; 4(2-1): 1-8 7
specimen 361 and those of specimens 002 and 003 could help
infer that volume fraction of SCs increased by 125% (Fig. 10)
and PD of SCs increased by 350% (Fig. 11) which was
associated with reduction in their mean diameter by 30% (Fig.
12). These results unambiguously indicated that DCT refined
SCs.
Figure 12. Average size of the PCs and SCs
4. Conclusions
Different soaking and tempering times were considered to
study the effect of various treatment cycles on tensile
properties and microstructure of advanced AISI S1 specimens.
Kinetically, in the present research, the most appropriate times
were 36 h and 48 h of deep cryogenic and 1 h and 2 h of
tempering treatments, respectively, because 12-35%
improvement in tensile toughness, 9-12% improvement in
hardness, and 32-36% improvement in strength were obtained
at these times. For advanced AISI S1 steel, it was observed
that maximum tensile toughness could be obtained by
simultaneously increasing soaking and tempering times. But,
if reduction in production time and cost was of primary
concern, lower soaking and tempering times would seem to be
a more feasible option. In this case, 36 h of soaking time and 1
h of tempering time would be a more feasible option.
Nomenclature
DCT Deep Cryogenic Treatment
PD Population Density
PC
Primary Carbide
Carbide precipitates as the consequence of the
solidification
SC
Secondary Carbide
Carbide precipitates as the consequence of the
first tempering
SEM Scanning Electron Microscopy
STEM Scanning Transmission Electron Microscopy
Vf Volume Fraction
XRD X-ray diffraction
References
[1] S. E. Vahdat and A. Pournaghi, "The Model for Monitoring of Pollutants Located in Different Regions," Management Science and Practice Vol. 1, pp. 8-13, 2013.
[2] S. E. Vahdat and F. M. Nakhaee, Eds., Air Pollution Monitoring using Fuzzy Logic in Industries, (InTech, Croatia, 2011), pp. 21-30.
[3] S. E. Vahdat and N. Towhidi, "Sustainable development of Iron and steel making in Environment in Iran by fuzzy logic," Journal of Environmental Studies Vol. 51, pp. 111-122, 2009.
[4] Q. Wang, X. Ning, Q. Chen and B. Mao, Eds., Effect of Cryogenic Treatment on Retained Austenite and Fatigue Life of Gcr15 Wheel-Hub Bearing, (Springer Berlin Heidelberg, 2013), vol. 196, pp. 1701-1707.
[5] S. Katoch, R. Sehgal and V. Singh, Eds., Effect of Cryogenic Treatment on Hardness, Microstructure and Wear Behavior of Hot Die Steel Grade AISI-H13, (Springer India, 2014), pp. 159-166.
[6] S. Gill, J. Singh, R. Singh and H. Singh, "Effect of Cryogenic Treatment on AISI M2 High Speed Steel: Metallurgical and Mechanical Characterization," J. of Materi Eng and Perform Vol. 21, pp. 1320-1326, 2012.
[7] S. Gill and H. Singh, Eds., Cryogenic Treatment of Materials: Cutting Tools and Polymers, (Springer Berlin Heidelberg, 2013), pp. 245-273.
[8] S. Gill, J. Singh, R. Singh and H. Singh, "Metallurgical principles of cryogenically treated tool steels—a review on the current state of science," Int J Adv Manuf Technol Vol. 54, pp. 59-82, 2011.
[9] S. Gill, H. Singh, R. Singh and J. Singh, "Cryoprocessing of cutting tool materials—a review," Int J Adv Manuf Technol Vol. 48, pp. 175-192, 2010.
[10] C. W. Wegst, Key to Steel, (Verlag Stahlschlussel Wegst GMBH, Dusseldorf, 1989).
[11] F. Farhani and K. S. Niaki, "A Programmable System for Treatment of Alloy Steels at Cryogenic Temperatures," Advanced Materials Research Vol. 264-265, pp. 1240-1245, 2011.
[12] B.S., 10002–1, Metallic materials tensile testing, Part 1: method of test at ambient temperature, 2001
[13] S. Thuillier and E. F. Rauch, "Development of microbands in mild steel during cross loading," Acta Metallurgica et Materialia Vol. 42, pp. 1973-1983, 1994.
[14] A.S.T.M., E975, X-Ray Determination of Retained Austenite in Steel with Near Random Crystallographic Orientation, 2013
[15] G. E. Dieter, Ed., Mechanical Behavior under tensile and compressive loads, (ASM international, Ohio, 2000), vol. 8, pp. 5, 100-103.
[16] A. Bensely, S. Venkatesh, D. Mohan Lal, G. Nagarajan, A. Rajadurai and K. Junik, "Effect of cryogenic treatment on distribution of residual stress in case carburized En 353 steel," Materials Science and Engineering: A Vol. 479, pp. 229-235, 2008.
[17] S. E. Vahdat, S. Nategh and S. Mirdamadi, "Microstructure and tensile properties of 45WCrV7 tool steel after deep cryogenic treatment," Materials Science and Engineering: A Vol. 585, pp. 444-454, 2013.
[18] S. E. Vahdat, "Effect of Deep Cryogenic Processing on Tensile Toughness of 45WCrV7 Steel," International Journal of Steel Structures Vol. 14, pp. 1-8, 2014.

8 Keyvan Seyedi Niaki and Seyed Ebrahim Vahdat: AISI S1 Tool Steel after Deep Cryogenic Treatment: Tensile
Properties and Microstructure
[19] W. G. Vermeulen, P. F. Morris, A. P. d. Weijer and S. v. d. Zwaag, "Prediction of martensite start temperature using artificial neural networking," Ironmaking and Steelmaking Vol. 23, pp. 433-437, 1996.