aki akitani deputy secretary general review of current economic trends in breeding & racing
TRANSCRIPT

Aki AKITANI
Deputy Secretary General
Review of Current Economic Trends in Breeding & Racing
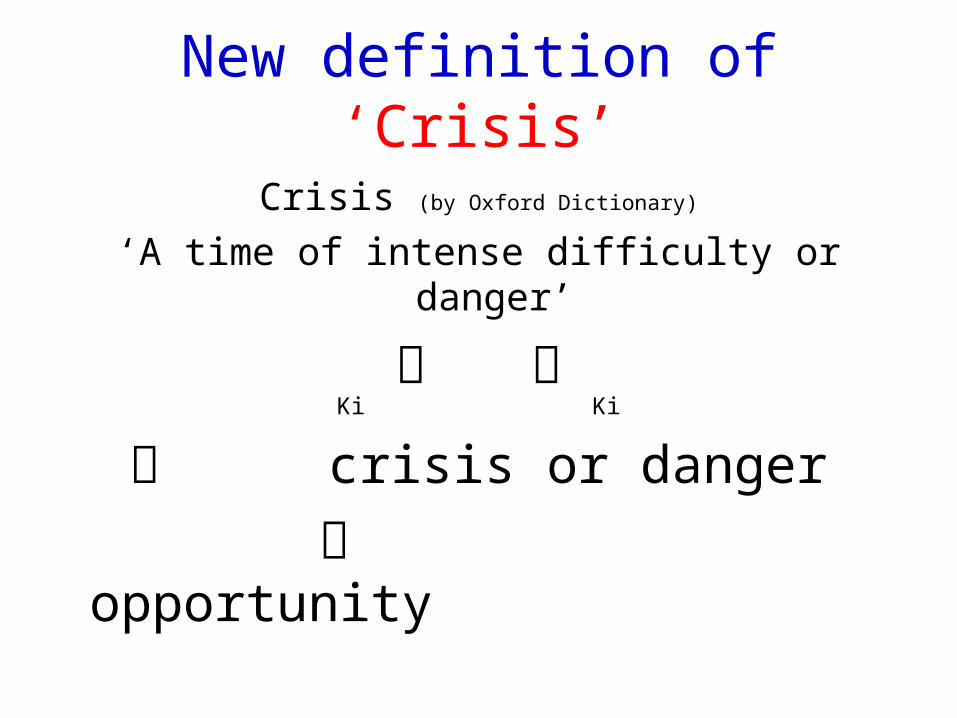
New definition of ‘Crisis’
Crisis (by Oxford Dictionary)
‘A time of intense difficulty or danger’
危 機Ki Ki
危 crisis or danger
機 opportunity

Contents
• Analysis of Racing Data
2010 & First Half 2011
• Future Turnover Indicators

50000
60000
70000
80000
90000
100000
110000
120000
130000
2004 2005 2006 2007 2008 2009 2010
Number of Foals (2004-2010)
109,000 FoalsDecline by 7.1%
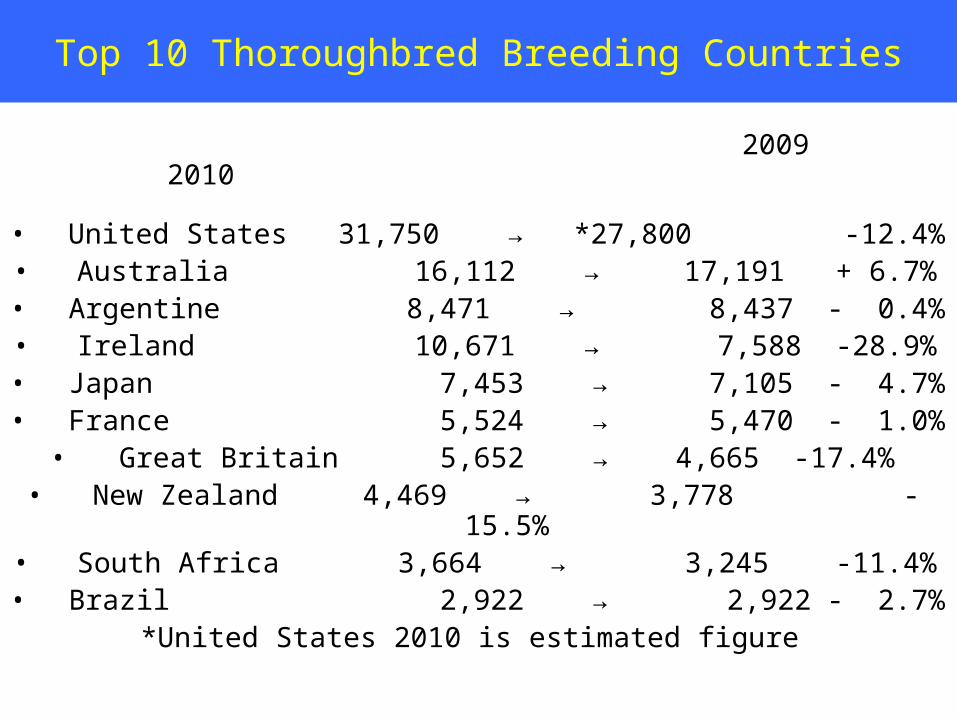
Top 10 Thoroughbred Breeding Countries
2009 2010
• United States 31,750 → *27,800 -12.4%• Australia 16,112 → 17,191 + 6.7%
• Argentine 8,471 → 8,437 - 0.4%• Ireland 10,671 → 7,588 -28.9%
• Japan 7,453 → 7,105 - 4.7%• France 5,524 → 5,470 - 1.0%
• Great Britain 5,652 → 4,665 -17.4%• New Zealand 4,469 → 3,778 -15.5%
• South Africa 3,664 → 3,245 -11.4%• Brazil 2,922 → 2,922 - 2.7%
*United States 2010 is estimated figure

0
20000
40000
60000
80000
100000
120000
140000
160000
180000
200000
2002 2003 2004 2005 2006 2007 2008 2009 2010
Number of Races 2002-2010 jumpflat
154,000 Flat 8,000 Jump
Decline by 3%

0.0
0.5
1.0
1.5
2.0
2.5
3.0
2004 2005 2006 2007 2008 2009 2010
Prize Money 2004-2010 (billion euro)
2.86 Billion Euro+ 10.6%
-1.6%
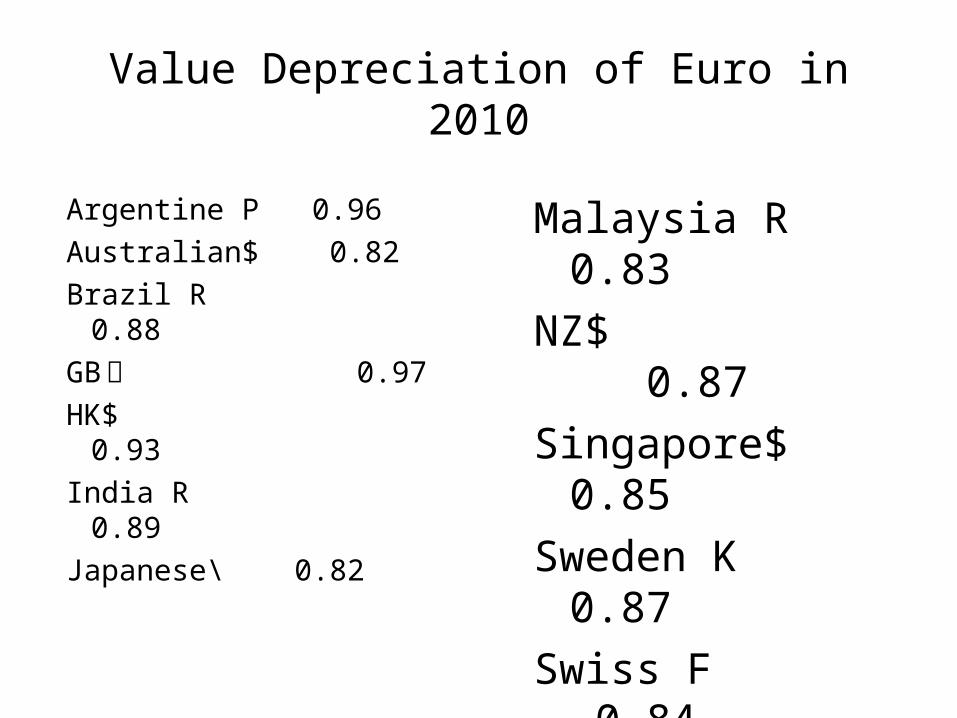
Value Depreciation of Euro in 2010
Argentine P 0.96
Australian$ 0.82
Brazil R 0.88
GB £ 0.97
HK$ 0.93
India R 0.89
Japanese\ 0.82
Malaysia R 0.83
NZ$ 0.87
Singapore$ 0.85
Sweden K 0.87
Swiss F 0.84
Turkey L 0.96
US$ 0.93

50
55
60
65
70
75
80
85
90
95
2002 2003 2004 2005 2006 2007 2008 2009 2010
Total Betting Turnover 2002-2010 (billion €)
€88 billion Increase by 5%
Decrease by 1.4%
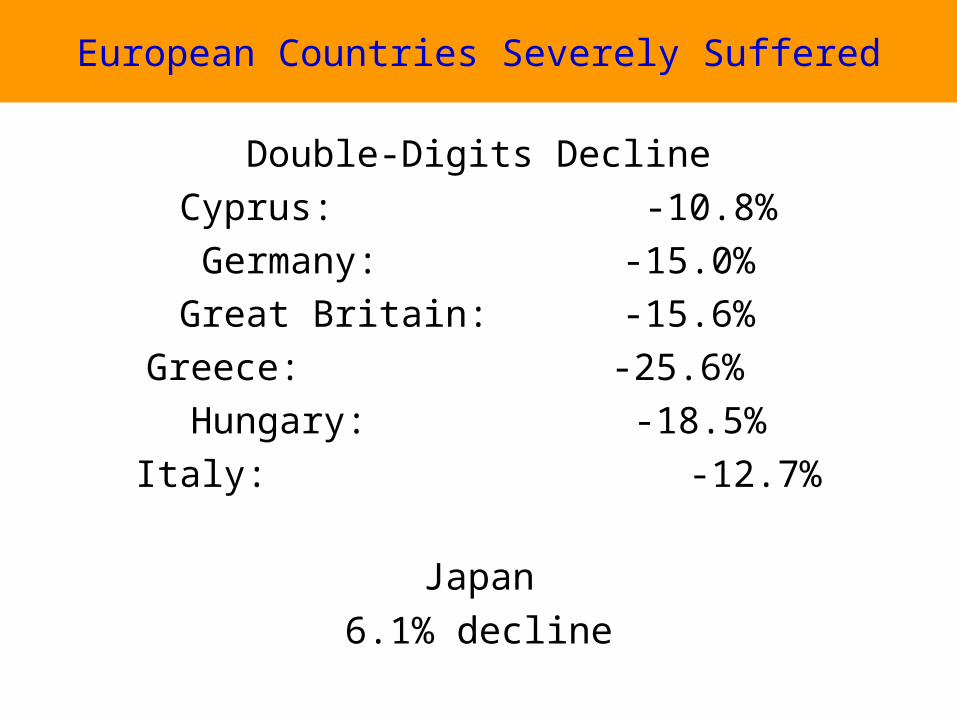
European Countries Severely Suffered
Double-Digits Decline
Cyprus: -10.8%
Germany: -15.0%
Great Britain: -15.6%
Greece: -25.6%
Hungary: -18.5%
Italy: -12.7%
Japan
6.1% decline
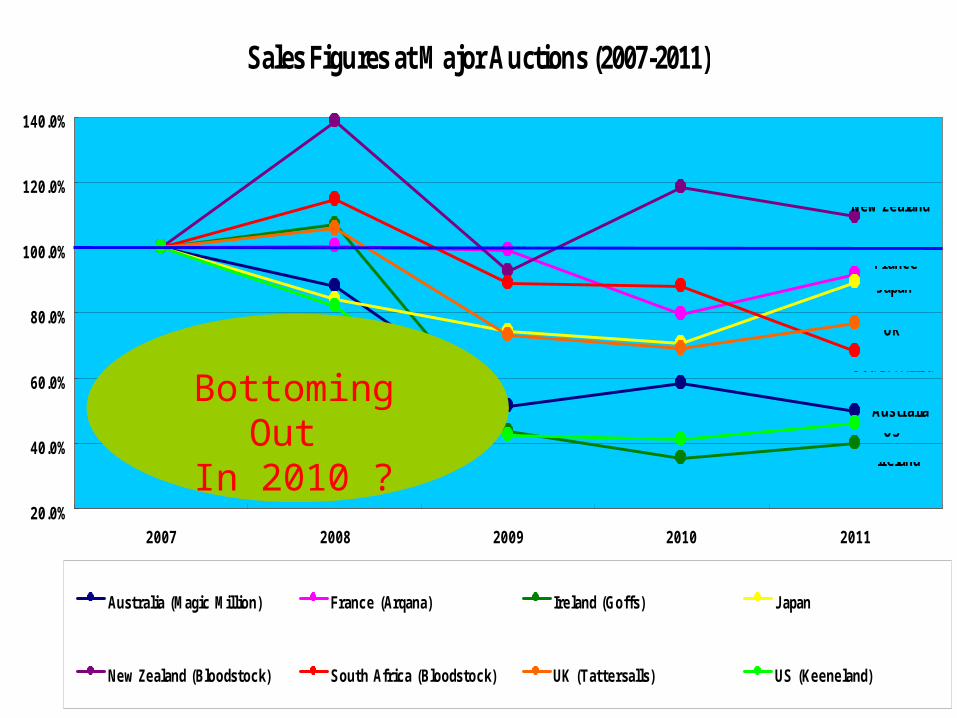
Sales Figures at Major Auctions (2007-2011)
20.0%
40.0%
60.0%
80.0%
100.0%
120.0%
140.0%
2007 2008 2009 2010 2011
Australia (Magic Million) France (Arqana) Ireland (Goffs) J apan
New Zealand (Bloodstock) South Africa (Bloodstock) UK (Tattersalls) US (Keeneland)
Australia
New Zealand
South Africa
UK
J apanFrance
US
Ireland
Bottoming Out In 2010 ?

World WageringFirst Half of 2011
France (PMU) + 3.4 %
Hong Kong (Yearly) + 6.5 %
Italy - 17.8 %
Japan (JRA) - 10.4 %
Korea + 0.4 %
Singapore - 10.2 %
United States - 7.7 %

World Wagering/Gaming Outlook 2011
‘Overall we expect global horserace betting to be about on a par with 2010 -we were expecting it to be ahead by 1.5% before the earthquake.’
Simon Holliday H2 Gambling Capital

Racing Data Input On-Line
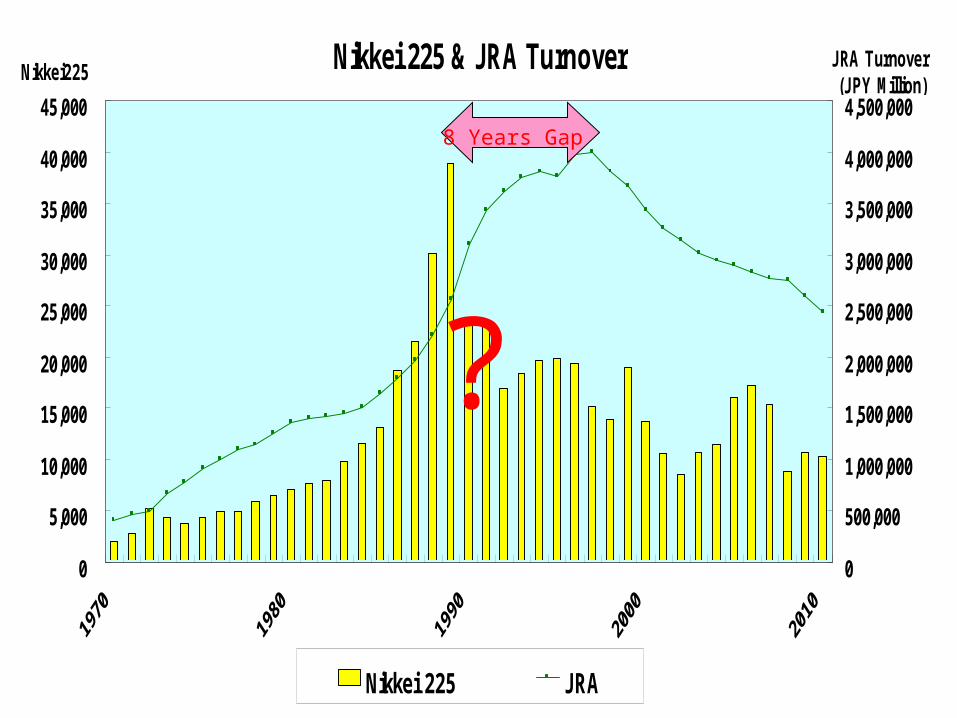
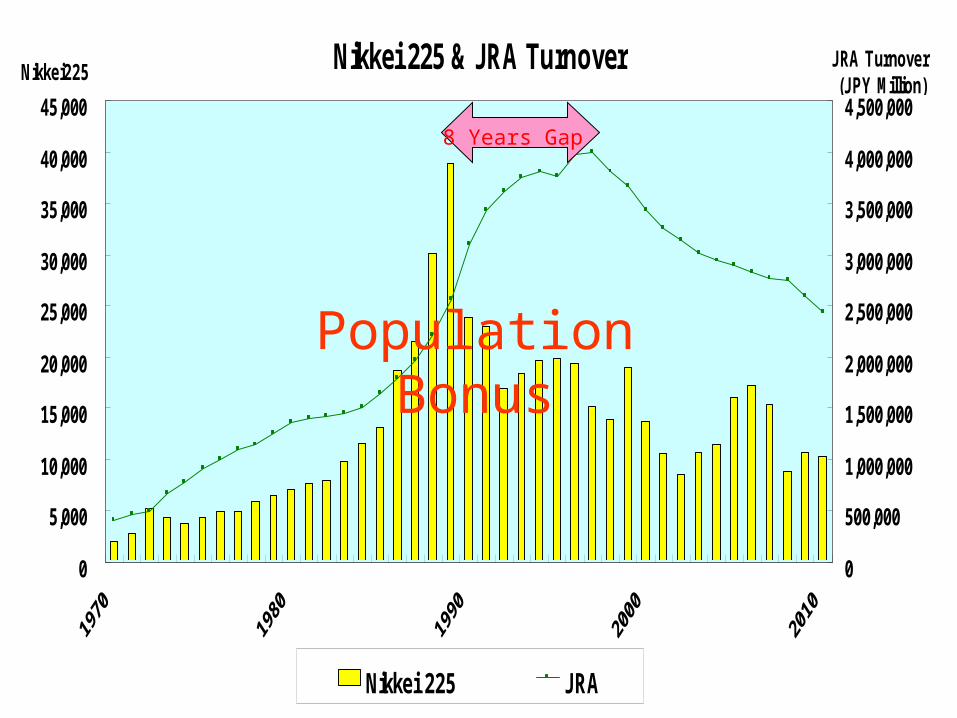
Nikkei 225 & JRA Turnover
0
5,000
10,000
15,000
20,000
25,000
30,000
35,000
40,000
45,000
Nikkei225
0
500,000
1,000,000
1,500,000
2,000,000
2,500,000
3,000,000
3,500,000
4,000,000
4,500,000
J RA Turnover (J PY Million)
Nikkei 225 J RA
8 Years Gap
?

Turnover……….?
The number of Customers
X
Per Capita spending on Racing
Disposable Income Penetration

1st Session‘Racing Authorities/Pari Mutuel Operators
Still running the same race?’
Racing Authorities and Pari Mutuel OperatorsNeed promoting racing together
Racing Authorities needs to provide‘Racing Stories’
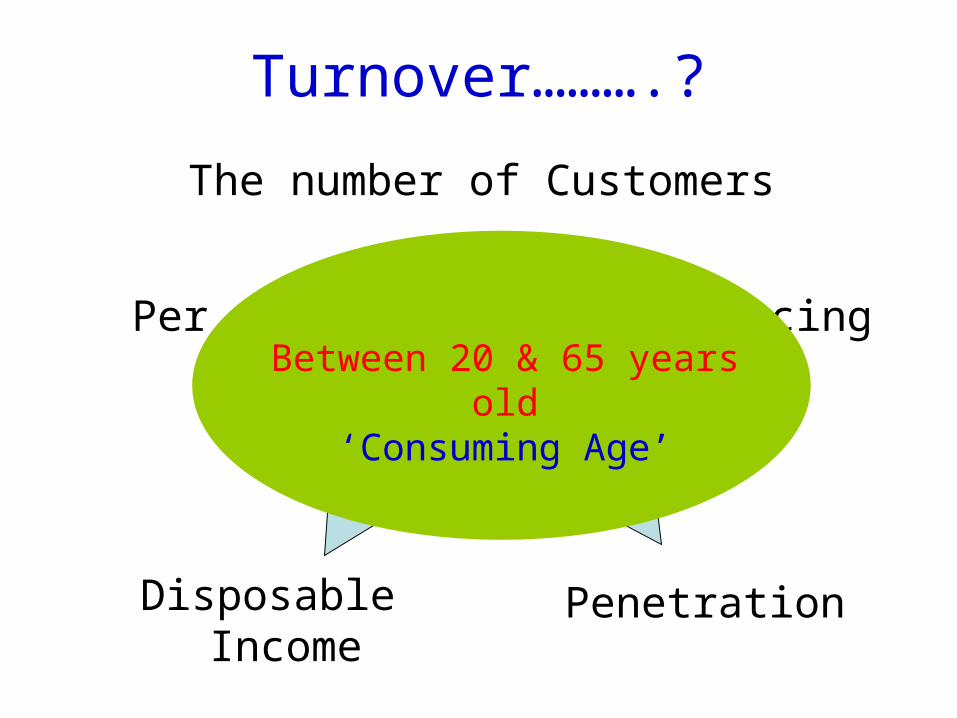
Turnover……….?
The number of Customers
X
Per Capita spending on Racing
Disposable Income Penetration
Between 20 & 65 years old‘Consuming Age’

104,665
111,940117,060
121,049 123,661 125,570 126,926 127,768 127,510
0
20,000
40,000
60,000
80,000
100,000
120,000
140,000
1970 1975 1980 1985 1990 1995 2000 2005 2009
Population Change 1970-2009 (x1,000)
Hit a PlateauIn 2004

0
2
4
6
8
10
12
0~4 5~9 10~14 15~19 20~24 25~29 30~34 35~39 40~44 45~49 50~54 55~59 60~64 65~69 70~74 75~79 80~84 85~
Demography 1970 (x millon)
Generation X
62,502,000

0
2
4
6
8
10
12
0~4 5~9 10~14 15~19 20~24 25~29 30~34 35~39 40~44 45~49 50~54 55~59 60~64 65~69 70~74 75~79 80~84 85~
Demography 1985 (x millon)
Generation XGeneration Y
73,552,000
Population Bonus
0
2
4
6
8
10
12
0~4 5~9 10~14 15~19 20~24 25~29 30~34 35~39 40~44 45~49 50~54 55~59 60~64 65~69 70~74 75~79 80~84 85~
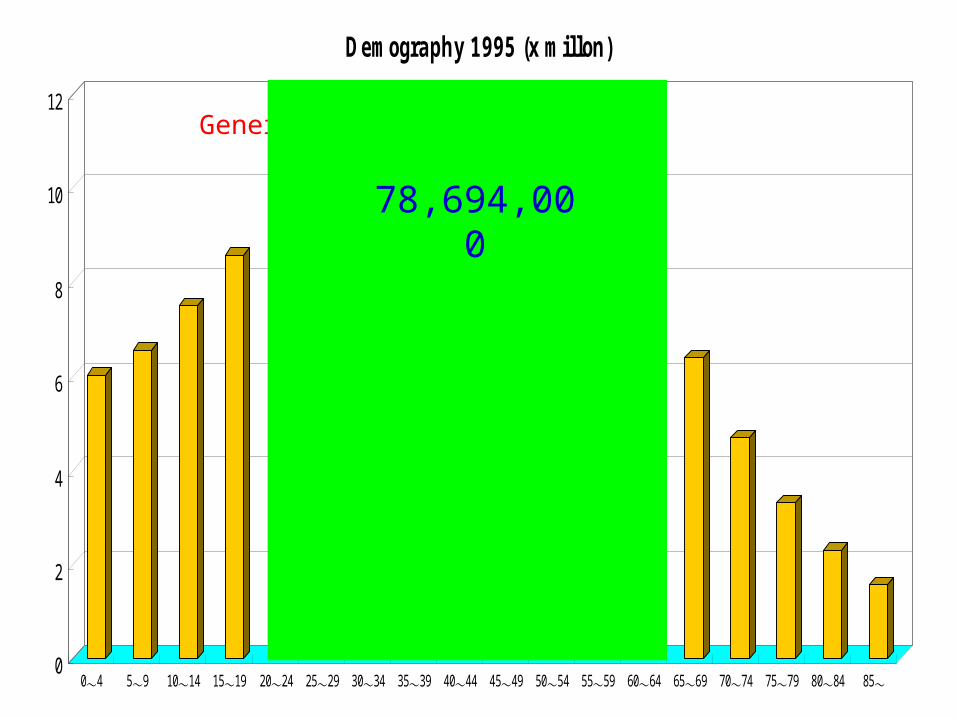
Demography 1995 (x millon)
Generation Y Generation X
78,694,000
Nikkei 225 & JRA Turnover
0
5,000
10,000
15,000
20,000
25,000
30,000
35,000
40,000
45,000
Nikkei225
0
500,000
1,000,000
1,500,000
2,000,000
2,500,000
3,000,000
3,500,000
4,000,000
4,500,000
J RA Turnover (J PY Million)
Nikkei 225 J RA
8 Years Gap
Population Bonus

0
2
4
6
8
10
12
0~4 5~9 10~14 15~19 20~24 25~29 30~34 35~39 40~44 45~49 50~54 55~59 60~64 65~69 70~74 75~79 80~84 85~
Demography 2005 (x millon)
Generation Y Generation X
77,829,000
70,826,000by 2015
63,052,000by 2030

Financial Crisis in 2008
‘Crisis of the Century’
POPULATION
‘Crisis of our History’
B O N U S

China
In 2000 Census
125 million between 10 & 14
69 million between 0 & 4
45% less children in ten years
Longer term effect will be phenomenal
One Child Policy

Index (consuming age by disposable income) (no penetration)vs
JRA Turnover
0.00
1.00
2.00
3.00
4.00
5.00
6.00
7.00
8.00
9.00
10.00INDEX
0.00
1.00
2.00
3.00
4.00
5.00
6.00
7.00
8.00
9.00
10.00J RA Turnover
Index J RA
Customer Service Dept
Super IdolHorse
Mobile Phoneand others

What we have to do?
To know yourself
Population Bonus
Low Penetration &Disposable Income
Population Onus
High Penetration &Disposable Income
1 2
3 4

For Those Who are In Section Four
What you can do ?
Beyond Conventional MarketGeographically, Gender-wise, Generation-Wise
Efficiency
Diversification
‘Less is More’
Secure Other Sources of Income

New definition of ‘Crisis’
Crisis (by Oxford Dictionary)
‘A time of intense difficulty or danger’
危 機Ki Ki
危 crisis or danger
機 opportunity

Aki AKITANI
Deputy Secretary General
Review of Current Economic Trends in Breeding & Racing