akva 2q 2007 presentation
TRANSCRIPT

1
The global leader in aquaculture technology
2Q 2007 presentation21 August 2007
Knut Molaug, CEO
Rolf Andersen, CFO
2
Pro-forma● Please note that unless otherwise stated all comments in this
presentation are based on pro-forma numbers as if the merger between AKVAsmart, Helgeland Plast and the Wavemaster group had taken place 1 January 2005 and that the acquisition of Maritech had taken place before 1 January 2006.

2
3
Agenda
Acquisition of UNI Aqua
2Q 2007 Financial review
Outlook
Q&A session
Background & highlights
4
AKVA group in brief
• The leading aquaculture technology supplier• The only player with global presence• The largest supplier to the aquaculture industry• High growth company • Profitable • Industry consolidator
Cage systems
Feed systems
AKVA group facts
Feed barges
Sensors & cameras
Software systems and services
Recirculation systems

3
5
2Q highlights●Operating revenue in 2Q increased to 244 MNOK and
the period’s EBITDA was 20.1 MNOK. The revenue for the first half was 460 MNOK and the periods EBITDA was 40.7 MNOK.
●The order backlog was 376 MNOK at the end of the 2Q, an increase of 84 MNOK compared to the end of 1Q.
●The outlook for the remainder of 2007 and 2008 is good. The long term outlook improved.
●Acquisition of Maritech finalised – making AKVA the leading software provider to the global seafood industry.
●Letter of intent signed to acquire UNI Aqua AS – AKVA taking a leading role in the high growth recirculation aquaculture system market.
6
Acquisition of UNI Aqua
2Q 2007 Financial review
Outlook
Q&A session
Background & highlights

4
7
2Q financials – P&L
6.5%
1.3717 223
8.9%
38%
23.6-6.7
30.20.6
29.7-11.1
40.7-418.0
458.82007YTD
11.4%
14.5%
25.9-8.9
34.9-3.1
38.0-10.3
48.3-284.8
333.12006YTD
9.4 %
3.4714 016
12.4 %
48.6-13.5
62.1-4.2
66.3-21.1
87.4-616.4
703.82006Year
13.7%
16.4%
18.1-5.9
24.0-1.6
25.6-5.1
30.7-155.9
186.720062Q
5.7%
0.6217 223
8.2%
30%
10.6-3.6
14.20.3
14.0-6.1
20.1-223.5
243.620072Q
EBITDA margin
EBIT margin
EPS (NOK)Average # shares (1000)
Revenue growth
Net profitTaxes
EBTNet financial items
EBITDepreciation & Amortisation
EBITDAOperating costs excl. depreciation
Operating revenues(MNOK)P&L 2007 (Pro-forma)
8
2Q financials – P&L comments●The demand for AKVA groups products increased in
2Q – the revenues increased by 30%.
●Margins lower than expectedDue to unfavourable product mix and competitive pressure in INTECH the EBITDA margins decreased.Delayed revenue growth for OPTECH
● Increasing order backlogThe order backlog increased from 294 MNOK to 375 MNOK.
●One-off restructuring costs related to Maritech acquisition of 1,6 MNOK

5
9
Business areas - OPTECHOPTECH (MNOK)
● 2Q revenues within the main products were at approximately the same level as in 2Q 2006.
The growth mainly related to the sold Marel distribution (as of. 1 September 2007) which generally has lower margins than the main products ● The revenue growth was limited by capacity constraints of customers
subcontractors in Chile and longer lead times in Norway in the production of barges and thus the deliveries are pushed into 2H.
● EBITDA margin of 8,6% which is down compared to 2Q 2006 due to increased capacity costs to manage the coming but delayed growth.
84101 94 9398 110
0255075
100
1Q 2Q 3Q 4Q
OPTECHOPTECHFarm operations Farm operations
technologytechnology
------
Feed systemsFeed systems
CamerasCameras
SensorsSensors
SoftwareSoftware
Etc.Etc.
Pro-forma
05
101520
Revenues
EBITDA
20062007
9,016,2
12,1 10,7
1Q 2Q 3Q 4Q9,411,5
10
Business areas - INTECHINTECH (MNOK)
● Strong revenue growth compared 2Q 2006: +57%● EBITDA margin of 7,8%. ● The margins were affected by competitive pressure in Chile and
unfavourable product mix in the Norwegian market.
INTECHINTECHInfrastructure Infrastructure
technologytechnology
------
Steel cagesSteel cages
Plastic cagesPlastic cages
Feed bargesFeed barges
BoatsBoats
etc.etc.
Pro-forma
6386 80
105118 135
020406080
100120140
1Q 2Q 3Q 4Q
0
10
20
Revenues
EBITDA
20062007
11,76,1
14,56,7 9,5
1Q 2Q 3Q 4Q10,6
6
11
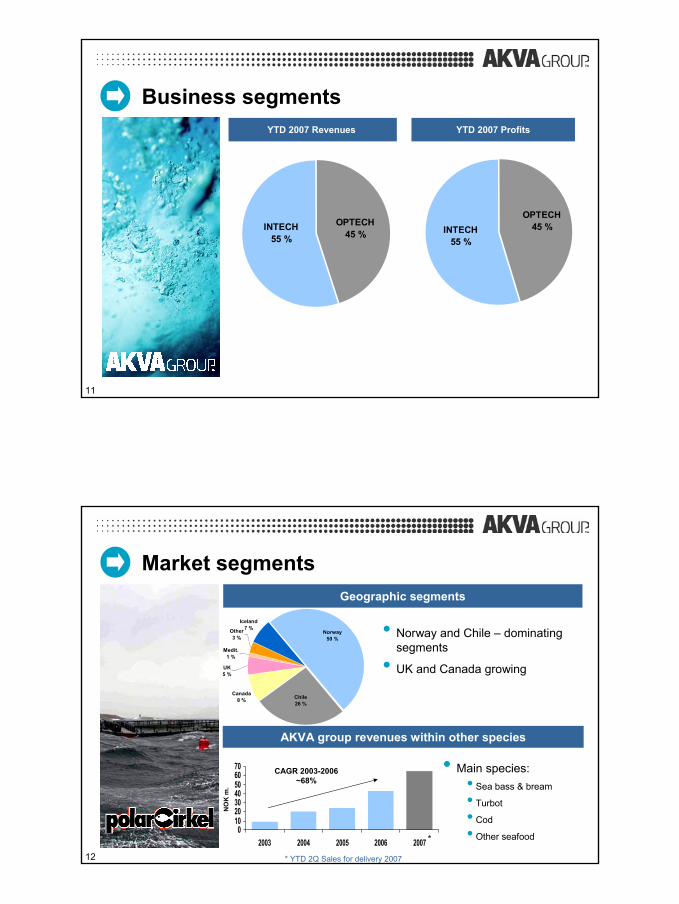
Business segments
OPTECH45 %
INTECH55 %
YTD 2007 ProfitsYTD 2007 Revenues
OPTECH45 %INTECH
55 %
12
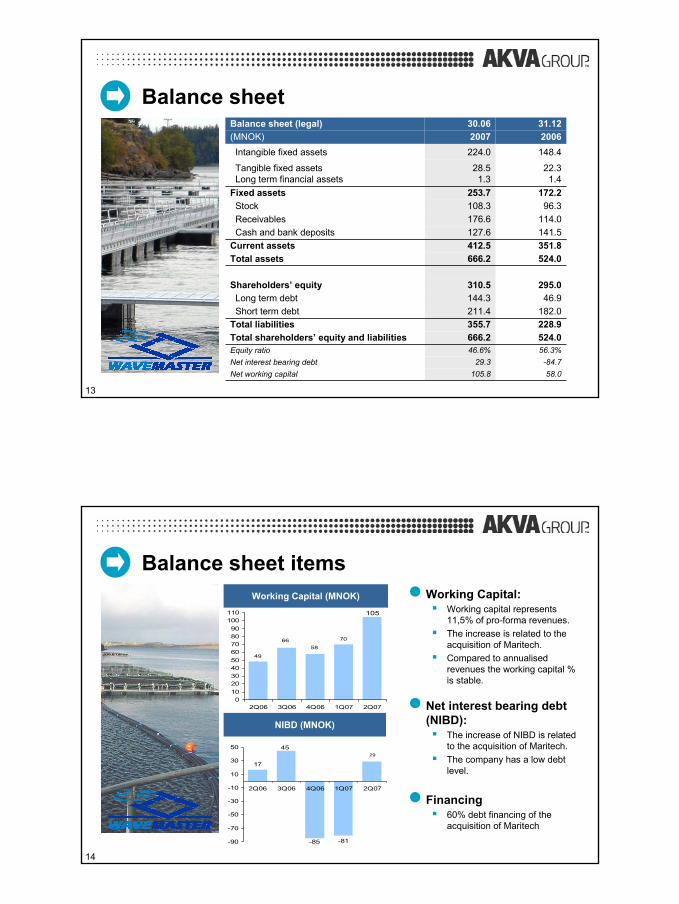
Market segments
Iceland7 %
Canada8 % Chile
26 %
Norway50 %
UK5 %
Medit.1 %
Other3 %
Geographic segments
• Norway and Chile – dominating segments
• UK and Canada growing
010203040506070
2003 2004 2005 2006 2007
AKVA group revenues within other species
CAGR 2003-2006 ~68%
NO
K m
.
• Main species:• Sea bass & bream
• Turbot
• Cod
• Other seafood
* YTD 2Q Sales for delivery 2007
*
7
13
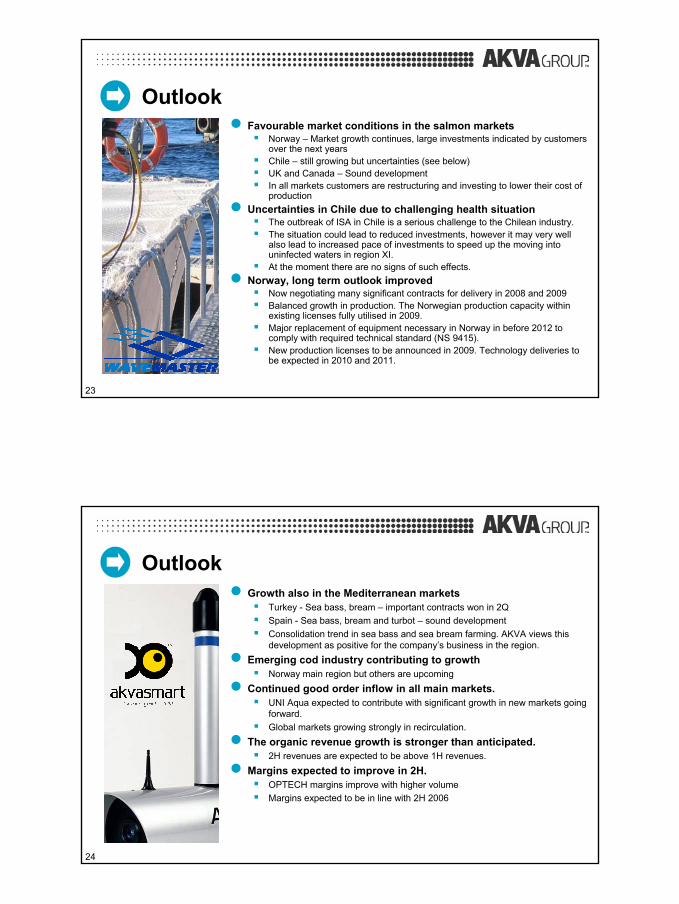
Balance sheet
58.0105.8Net working capital-84.7
56.3%524.0228.9182.046.9
295.0
524.0351.8141.5114.096.3
172.2
22.31.4
148.4200631.12
29.346.6%666.2355.7211.4144.3310.5
666.2412.5127.6176.6108.3253.7
28.51.3
224.0200730.06
Short term debt
Equity ratio
Receivables
Balance sheet (legal)(MNOK)
Total shareholders’ equity and liabilities
Net interest bearing debt
Total liabilities
Long term debtShareholders’ equity
Total assetsCurrent assetsCash and bank deposits
StockFixed assets
Tangible fixed assetsLong term financial assets
Intangible fixed assets
14
Balance sheet items
70
49
6658
105
0102030405060708090
100110
2Q06 3Q06 4Q06 1Q07 2Q07
-81
17
45
-85
29
-90
-70
-50
-30
-10
10
30
50
2Q06 3Q06 4Q06 1Q07 2Q07
Working Capital (MNOK)
NIBD (MNOK)
● Working Capital:Working capital represents 11,5% of pro-forma revenues.The increase is related to the acquisition of Maritech. Compared to annualised revenues the working capital % is stable.
● Net interest bearing debt (NIBD):
The increase of NIBD is related to the acquisition of Maritech. The company has a low debt level.
● Financing60% debt financing of the acquisition of Maritech

8
15
Strong financial position●Equity:
Strong equity position
●Cash Position:Very strong cash positionIncreased overdraft facilities in 2Q giving better financial flexibility.Available cash 173 MNOK.
56 %
37 %30 %
56 %
47 %
0 %
10 %
20 %
30 %
40 %
50 %
60 %
70 %
2004 2005 2006 1Q07 2Q07
Equity (%)
145
27 19
142128
0
25
50
75
100
125
150
175
200
2Q 3Q 4Q 1Q07 2Q07
Cash balance (MNOK)
16
Cash flow statement
141 46311 377127 625Cash and cash equivalents end of period
6 1996 199109 709Cash and cash equivalents beginning of period
135 2635 17817 916Net cash flow
148 312-11 17622 566Net cash flow from financial activities
-23 637-2 929-8 738Net cash flow from investment activities
10 58819 2834 088Net cash flow from operational activities
Total 2Q2Q(KNOK)
200620062007*Cash flow statement
* pro-forma
● Legal cash flow statement is affected by the Maritech acquisition● Pro forma cash flow statement 2007 is prepared as if Maritech
was acquired before 1 January 2007.● Investments well below depreciation

9
17
Order backlog and inflow
241
169211 211
305
145184
291
375
0
50
100
150
200
250
300
350
400
1Q2006 2Q2006 3Q2006 4Q2006 1Q2007 2Q2007
Backlog Inflow
● Consolidation of Maritech accounts for approximately 35 MNOK of the increase in the order backlog.
● Norwegian market main growth driver● Chilean market still strong and stable● Mediterranean main market region outside the salmon market
2006 Order backlog and inflow per quarter (MNOK)
na na. na.
18
Acquisition of UNI Aqua
2Q 2007 Financial review
Outlook
Q&A session
Background & highlights

10
19
Acquisition headlines● Binding LOI to acquire 85% of the shares of UNI Aqua AS from
Scheel & Urup Holding ApS. UNI Aqua AS is a Danish limited private company. The parties have started negotiations for the acquisition of the remaining 15 % of UNI Aqua AS. The letter of intent is binding but subject to due diligence examinations. Expect to consummate the acquisition in Sep. 2007.
● UNI Aqua AS is an important and leading supplier of aquaculture recirculation technology with expertise within both marine and fresh water recirculation systems.
The marked for recirculation technology is growing significantly in numerous markets.
● The agreed consideration for the shares is DKK 11,730,000 which is conditional upon the EBITDA and revenue of the target company satisfying agreed levels.
An additional consideration, earn-out, could become payable for 2008, 2009 and 2010.
Tuna fish in recirculation fish farm
20
Acquisition headlines● Strategically important acquisition
Enhancement / broadening of the product portfolio. • AKVA group has traditionally focused on the marine phase of the salmon
industry. By this investment the company takes an important steptowards the fresh water phase in salmon farming.
Creates important inroad to global markets non-salmon markets (both marine and fresh water).Proven deliveries and designs to a number of fish species, such as: Salmon, trout, eel, turbot, sole, tuna, pike perch, king fish, blue fin tuna, barramundi, merluza, cod, halibut and abalone.The company has delivered/designed systems to numerous countries over the last few years: Norway, Denmark, Chile, Canada, China, Iran, Australia, Spain, Portugal and South Africa
● Entering Asian markets Based on AKVA group preliminary assessment the company believe that recirculation systems together with cage systems will be essential for a strong entry into Asian aquaculture markets.

11
21
Acquisition headlines● Adding volume to other AKVA group products
Through product bundling the acquisition is expected to add volume to other AKVA group products, mainly within the OPTECH area. Adding volume into existing distribution network
● Strong growth within recirculation is expected going forwardThe growth is expected globally And in the salmon industry in Norway and Chile
● Further investments planned to develop UNI AquaManagement of UNI Aqua has, together with AKVA group worked out a plan for the further development of UNI Aqua. This plan includes additional future investments to develop UNI Aqua further to become the worlds leading supplier of recirculation systems.
● UNI Aqua to be included in INTECH business area
22
Acquisition of UNI Aqua
2Q 2007 Financial review
Outlook
Q&A session
Background & highlights
12
23
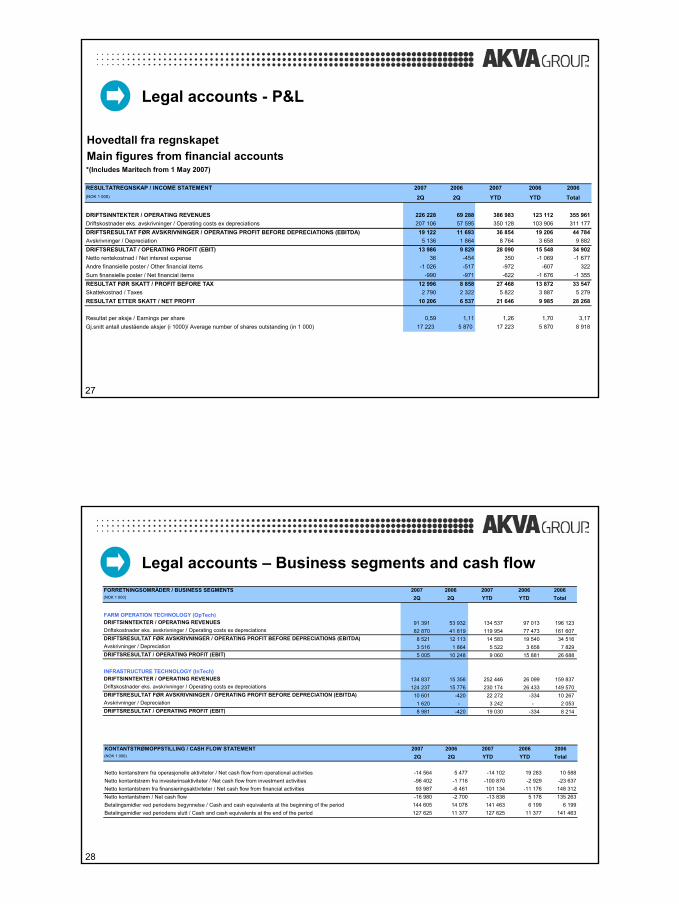
Outlook● Favourable market conditions in the salmon markets
Norway – Market growth continues, large investments indicated by customers over the next yearsChile – still growing but uncertainties (see below)UK and Canada – Sound developmentIn all markets customers are restructuring and investing to lower their cost of production● Uncertainties in Chile due to challenging health situationThe outbreak of ISA in Chile is a serious challenge to the Chilean industry.The situation could lead to reduced investments, however it may very well also lead to increased pace of investments to speed up the moving into uninfected waters in region XI.At the moment there are no signs of such effects. ● Norway, long term outlook improvedNow negotiating many significant contracts for delivery in 2008 and 2009Balanced growth in production. The Norwegian production capacity within existing licenses fully utilised in 2009. Major replacement of equipment necessary in Norway in before 2012 to comply with required technical standard (NS 9415). New production licenses to be announced in 2009. Technology deliveries to be expected in 2010 and 2011.
24
Outlook● Growth also in the Mediterranean markets
Turkey - Sea bass, bream – important contracts won in 2Q Spain - Sea bass, bream and turbot – sound development Consolidation trend in sea bass and sea bream farming. AKVA views this development as positive for the company’s business in the region.
● Emerging cod industry contributing to growthNorway main region but others are upcoming
● Continued good order inflow in all main markets.UNI Aqua expected to contribute with significant growth in new markets going forward. Global markets growing strongly in recirculation.
● The organic revenue growth is stronger than anticipated. 2H revenues are expected to be above 1H revenues.
● Margins expected to improve in 2H.OPTECH margins improve with higher volumeMargins expected to be in line with 2H 2006

13
25
Acquisition of UNI Aqua
2Q 2007 Financial review
Outlook
Q&A session
Background & highlights
26
Appendix
14
27
Legal accounts - P&L
Hovedtall fra regnskapetMain figures from financial accounts *(Includes Maritech from 1 May 2007)
RESULTATREGNSKAP / INCOME STATEMENT 2007 2006 2007 2006 2006(NOK 1 000) 2Q 2Q YTD YTD Total
DRIFTSINNTEKTER / OPERATING REVENUES 226 228 69 288 386 983 123 112 355 961Driftskostnader eks. avskrivninger / Operating costs ex depreciations 207 106 57 595 350 128 103 906 311 177DRIFTSRESULTAT FØR AVSKRIVNINGER / OPERATING PROFIT BEFORE DEPRECIATIONS (EBITDA) 19 122 11 693 36 854 19 206 44 784Avskrivninger / Depreciation 5 136 1 864 8 764 3 658 9 882DRIFTSRESULTAT / OPERATING PROFIT (EBIT) 13 986 9 829 28 090 15 548 34 902Netto rentekostnad / Net interest expense 36 -454 350 -1 069 -1 677Andre finansielle poster / Other financial items -1 026 -517 -972 -607 322Sum finansielle poster / Net financial items -990 -971 -622 -1 676 -1 355RESULTAT FØR SKATT / PROFIT BEFORE TAX 12 996 8 858 27 468 13 872 33 547Skattekostnad / Taxes 2 790 2 322 5 822 3 887 5 279RESULTAT ETTER SKATT / NET PROFIT 10 206 6 537 21 646 9 985 28 268
Resultat per aksje / Earnings per share 0,59 1,11 1,26 1,70 3,17Gj.snitt antall utestående aksjer (i 1000)/ Average number of shares outstanding (in 1 000) 17 223 5 870 17 223 5 870 8 918
28
Legal accounts – Business segments and cash flowFORRETNINGSOMRÅDER / BUSINESS SEGMENTS 2007 2006 2007 2006 2006(NOK 1 000) 2Q 2Q YTD YTD Total
FARM OPERATION TECHNOLOGY (OpTech)DRIFTSINNTEKTER / OPERATING REVENUES 91 391 53 932 134 537 97 013 196 123 Driftskostnader eks. avskrivninger / Operating costs ex depreciations 82 870 41 819 119 954 77 473 161 607 DRIFTSRESULTAT FØR AVSKRIVNINGER / OPERATING PROFIT BEFORE DEPRECIATIONS (EBITDA) 8 521 12 113 14 583 19 540 34 516 Avskrivninger / Depreciation 3 516 1 864 5 522 3 658 7 829 DRIFTSRESULTAT / OPERATING PROFIT (EBIT) 5 005 10 248 9 060 15 881 26 688
INFRASTRUCTURE TECHNOLOGY (InTech)DRIFTSINNTEKTER / OPERATING REVENUES 134 837 15 356 252 446 26 099 159 837 Driftskostnader eks. avskrivninger / Operating costs ex depreciations 124 237 15 776 230 174 26 433 149 570 DRIFTSRESULTAT FØR AVSKRIVNINGER / OPERATING PROFIT BEFORE DEPRECIATION (EBITDA) 10 601 -420 22 272 -334 10 267 Avskrivninger / Depreciation 1 620 - 3 242 - 2 053 DRIFTSRESULTAT / OPERATING PROFIT (EBIT) 8 981 -420 19 030 -334 8 214
KONTANTSTRØMOPPSTILLING / CASH FLOW STATEMENT 2007 2006 2007 2006 2006(NOK 1 000) 2Q 2Q YTD YTD Total
Netto kontanstrøm fra operasjonelle aktiviteter / Net cash flow from operational activities -14 564 5 477 -14 102 19 283 10 588Netto kontantstrøm fra investerinsaktiviteter / Net cash flow from investment activities -96 402 -1 716 -100 870 -2 929 -23 637Netto kontantstrøm fra finansieringsaktiviteter / Net cash flow from financial activities 93 987 -6 461 101 134 -11 176 148 312Netto kontantstrøm / Net cash flow -16 980 -2 700 -13 838 5 178 135 263Betalingsmidler ved periodens begynnelse / Cash and cash equivalents at the beginning of the period 144 605 14 078 141 463 6 199 6 199Betalingsmidler ved periodens slutt / Cash and cash equivalents at the end of the period 127 625 11 377 127 625 11 377 141 463

15
29
“The global leader in aquaculture technology”
Vision statement and strategy
● Lead the technological development
● Lead the consolidation of the global aquaculture supply industry
● Realise cost benefits through economies of scaleMarketing and sales network Operations R&D
● Attract, motivate and retain competent employees
● Profitable growth
30
Key growth drivers● Strong underlying growth in salmon farming
Long term growth trendStrong outlook for investments by salmon farming industry
● Further industrialisationLarger fish farming companies require higher degree of controlLarger production units require increased use of technologyIncreased technology penetration in Chile
● Significant untapped potential within other fish speciesRepresents about 10% of AKVA group revenues and currently growing at more than 50% annuallyStrong growth in a number of speciesSalmon industry is the model for industrialisation of other sea based fish farming