akzonobel q4 and full-year 2014 results investor update presentation
TRANSCRIPT

255-255-255
185-201-208
068-105-125
085-190-207
000-146-187
000-139-197
000-081-146
134-134-136
000-000-000
183-185-186
000-139-197
000-081-146
134-134-136
183-185-186
185-201-208
255-255-255
Text Bk D1
Color 6
Color 5
Color 4
Color 3
Color 2
Color 1
Text Bk D2
Text Bk L1
Text Bk L2
Hyper
F. Hyper
Text D2
Text L2
Agenda main
Agenda main 2nd
Investor Update Full-Year 2014 and Q4 results
Ton Büchner & Maëlys Castella
February 12, 2015

255-255-255
185-201-208
068-105-125
085-190-207
000-146-187
000-139-197
000-081-146
134-134-136
000-000-000
183-185-186
000-139-197
000-081-146
134-134-136
183-185-186
185-201-208
255-255-255
Text Bk D1
Color 6
Color 5
Color 4
Color 3
Color 2
Color 1
Text Bk D2
Text Bk L1
Text Bk L2
Hyper
F. Hyper
Text D2
Text L2
Agenda main
Agenda main 2nd
Agenda
1. 2014 highlights and operational review
2. Financial review
3. Conclusion
4. Questions
2 Investor Update Full-Year 2014 and Q4 results

255-255-255
185-201-208
068-105-125
085-190-207
000-146-187
000-139-197
000-081-146
134-134-136
000-000-000
183-185-186
000-139-197
000-081-146
134-134-136
183-185-186
185-201-208
255-255-255
Text Bk D1
Color 6
Color 5
Color 4
Color 3
Color 2
Color 1
Text Bk D2
Text Bk L1
Text Bk L2
Hyper
F. Hyper
Text D2
Text L2
Agenda main
Agenda main 2nd
255-255-255
185-201-208
068-105-125
085-190-207
000-146-187
000-139-197
000-081-146
134-134-136
000-000-000
183-185-186
000-139-197
000-081-146
134-134-136
183-185-186
185-201-208
255-255-255
Text Bk D1
Color 6
Color 5
Color 4
Color 3
Color 2
Color 1
Text Bk D2
Text Bk L1
Text Bk L2
Hyper
F. Hyper
Text D2
Text L2
Agenda main
Agenda main 2nd
2014 highlights and operational review Ton Büchner
3 Investor Update Full-Year 2014 and Q4 results

• Clear operational improvements visible in the results, despite challenging market conditions
• Major transformation programs in all three Business Areas and support functions
• Functional alignment through Global Business Services making clear progress
and corporate costs are coming down
• Steady progress on people, process, and product safety, resulting in
significant improvement in total reportable injury rate (TRR) from 2.3 to 1.8
• Ranked #1 on Dow Jones Sustainability Index (Materials industry group)
for third year in a row
• Human Cities initiative launched:
- commitment to improving, energizing and
regenerating urban communities
- partnership with 100 Resilient Cities pioneered
by The Rockefeller Foundation
• On track to deliver 2015 targets
Key achievements during 2014
4 Investor Update Full-Year 2014 and Q4 results

255-255-255
185-201-208
068-105-125
085-190-207
000-146-187
000-139-197
000-081-146
134-134-136
000-000-000
183-185-186
000-139-197
000-081-146
134-134-136
183-185-186
185-201-208
255-255-255
Text Bk D1
Color 6
Color 5
Color 4
Color 3
Color 2
Color 1
Text Bk D2
Text Bk L1
Text Bk L2
Hyper
F. Hyper
Text D2
Text L2
Agenda main
Agenda main 2nd
Financial highlights of 2014
5 Investor Update Full-Year 2014 and Q4 results
14.296
FY 2013 FY 2014
958 987
FY 2013 FY 2014
716 811
FY 2013 FY 2014
Revenue
Operating income
Net cash from
operating activities
• Revenue down 2 percent, with positive volumes more than offset by currency effects and divestments
• Operating income up 3 percent, due to higher operating results and lower restructuring charges,
partially offset by adverse incidental items
• Net cash inflow from operating activities up 13 percent
897
1,072
FY 2013 FY 2014
Operating income
excl. incidental items
14,590 14,296
-2% +13% +20% +3%

255-255-255
185-201-208
068-105-125
085-190-207
000-146-187
000-139-197
000-081-146
134-134-136
000-000-000
183-185-186
000-139-197
000-081-146
134-134-136
183-185-186
185-201-208
255-255-255
Text Bk D1
Color 6
Color 5
Color 4
Color 3
Color 2
Color 1
Text Bk D2
Text Bk L1
Text Bk L2
Hyper
F. Hyper
Text D2
Text L2
Agenda main
Agenda main 2nd
FY 2014 revenue and operating income – underlying margins continue to improve
€ million FY 2013 FY 2014 Δ%
Revenue 14,590 14,296 -2
Operating income excluding incidentals 897 1,072 20
Operating income 958 987 3
Ratio, % FY 2013 FY 2014
Return on sales 6.6 6.9
Return on sales (excluding incidentals) 6.1 7.5
Return on sales (excluding incidentals & restructuring costs) 8.5 9.3
Moving average return on investment 9.6 10.0
Increase
Decrease
-1% +1% 0%
-2%
Volume Price/Mix Acquisitions/Divestments
Exchange rates Total
-2%
Revenue development FY 2014 vs. FY 2013
6 Investor Update Full-Year 2014 and Q4 results

255-255-255
185-201-208
068-105-125
085-190-207
000-146-187
000-139-197
000-081-146
134-134-136
000-000-000
183-185-186
000-139-197
000-081-146
134-134-136
183-185-186
185-201-208
255-255-255
Text Bk D1
Color 6
Color 5
Color 4
Color 3
Color 2
Color 1
Text Bk D2
Text Bk L1
Text Bk L2
Hyper
F. Hyper
Text D2
Text L2
Agenda main
Agenda main 2nd
Fragile economic environment impacting all Business Areas
-6
-2
2
6
Decorative Paints Performance Coatings Specialty Chemicals AkzoNobel
Quarterly volume development in % year-on-year
-4
-1
2
5
Decorative Paints Performance Coatings Specialty Chemicals AkzoNobel
Quarterly price/mix development in % year-on-year
-2% 0% -1% -1%
0% +1% 0% 0%
2013
2014
7 Investor Update Full-Year 2014 and Q4 results

255-255-255
185-201-208
068-105-125
085-190-207
000-146-187
000-139-197
000-081-146
134-134-136
000-000-000
183-185-186
000-139-197
000-081-146
134-134-136
183-185-186
185-201-208
255-255-255
Text Bk D1
Color 6
Color 5
Color 4
Color 3
Color 2
Color 1
Text Bk D2
Text Bk L1
Text Bk L2
Hyper
F. Hyper
Text D2
Text L2
Agenda main
Agenda main 2nd
Foreign exchange rates were no longer a headwind in Q4, but impacted full-year results
-8
-4
0
4
Decorative Paints Performance Coatings Specialty Chemicals AkzoNobel
Quarterly foreign exchange rate development in % year-on-year
+1%
+3% +2%
+1%
2013
2014
8
• Adverse currency effects, impacting first nine months 2014, were visible in all Business Areas and any
lost income related to this will not come back in our results
• Negative currency effects disappeared in Q4
Investor Update Full-Year 2014 and Q4 results
255-255-255
185-201-208
068-105-125
085-190-207
000-146-187
000-139-197
000-081-146
134-134-136
000-000-000
183-185-186
000-139-197
000-081-146
134-134-136
183-185-186
185-201-208
255-255-255
Text Bk D1
Color 6
Color 5
Color 4
Color 3
Color 2
Color 1
Text Bk D2
Text Bk L1
Text Bk L2
Hyper
F. Hyper
Text D2
Text L2
Agenda main
Agenda main 2nd
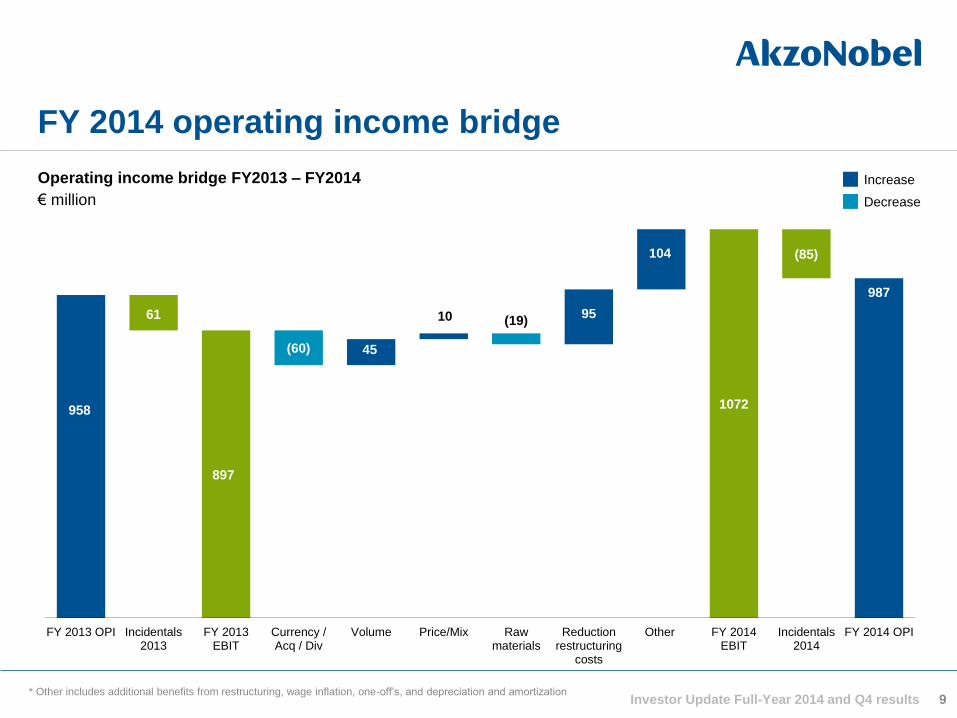
(60)
(19)
(85)
958
61
897
45
10 95
104
1072
987
FY 2013 OPI Incidentals2013
FY 2013EBIT
Currency /Acq / Div
Volume Price/Mix Rawmaterials
Reductionrestructuring
costs
Other FY 2014EBIT
Incidentals2014
FY 2014 OPI
FY 2014 operating income bridge
9 Investor Update Full-Year 2014 and Q4 results
Operating income bridge FY2013 – FY2014
€ million Decrease
Increase
* Other includes additional benefits from restructuring, wage inflation, one-off’s, and depreciation and amortization

255-255-255
185-201-208
068-105-125
085-190-207
000-146-187
000-139-197
000-081-146
134-134-136
000-000-000
183-185-186
000-139-197
000-081-146
134-134-136
183-185-186
185-201-208
255-255-255
Text Bk D1
Color 6
Color 5
Color 4
Color 3
Color 2
Color 1
Text Bk D2
Text Bk L1
Text Bk L2
Hyper
F. Hyper
Text D2
Text L2
Agenda main
Agenda main 2nd
Financial targets – progress made to date
10
2.2
9.5 9.0 9.5 9.4
6.0 6.3
9.8 10.4
0
4
8
12
16
Decorative Paints Performance Coatings Specialty Chemicals%
FY2012
FY2013
Return on sales
3.0
21.7
13.6 13.7
21.3
8.2 8.8
22.0
14.8
0
8
16
24
32
Decorative Paints Performance Coatings Specialty Chemicals
Return on investment
5.9 6.6 6.9
0
4
8
12
FY2012 FY2013 FY2014
8.9 9.6 10.0
0
4
8
12
16
FY2012 FY2013 FY2014
%
AkzoNobel
Business
Areas
Return on sales – 2015 target 9.0%* Return on investment – 2015 target 14.0%*
% %
* Adjusted for 2012 impairment charge (€2.1 billion)
FY2014
Investor Update Full-Year 2014 and Q4 results

The majority of global manufacturing output is still anticipating expansion
11
*Bubble size=manufacturing output, 2015e (US$bn: 2010 prices)
Sources: Oxford Economics, HSBC [China], Markit [US], Swedbank (Sweden)
Purchase Managers’ Index (PMI)*
January 2015
Investor Update Full-Year 2014 and Q4 results
Russia
France China
Brazil Germany
Japan India
US
Spain Sweden
40
50
60
Ma
nu
factu
rin
g P
MI

Overall consumer confidence levels went down for many countries
12 Source: Nielsen
129 107 106 98 95 94 89 85
57
0
20
40
60
80
100
120
140
India China US Germany Brazil UK Netherlands Sweden France
Consumer confidence, Q4 2014
Figures below 100 indicate some degree of pessimism
Recent trends compared
to Q3 2014
Investor Update Full-Year 2014 and Q4 results

255-255-255
185-201-208
068-105-125
085-190-207
000-146-187
000-139-197
000-081-146
134-134-136
000-000-000
183-185-186
000-139-197
000-081-146
134-134-136
183-185-186
185-201-208
255-255-255
Text Bk D1
Color 6
Color 5
Color 4
Color 3
Color 2
Color 1
Text Bk D2
Text Bk L1
Text Bk L2
Hyper
F. Hyper
Text D2
Text L2
Agenda main
Agenda main 2nd
~42% of revenues
New Build Projects
Maintenance, Renovation & Repair
Building Products & Components
~16% of revenues
Automotive OEM, Parts and Assembly
Automotive Repair
Marine and Air Transport
~17% of revenues
Consumer Durables
Consumer Packaged Goods
~25% of revenues
Natural Resource and Energy Industries
Process Industries
13 Investor Update Full-Year 2014 and Q4 results
255-255-255
185-201-208
068-105-125
085-190-207
000-146-187
000-139-197
000-081-146
134-134-136
000-000-000
183-185-186
000-139-197
000-081-146
134-134-136
183-185-186
185-201-208
255-255-255
Text Bk D1
Color 6
Color 5
Color 4
Color 3
Color 2
Color 1
Text Bk D2
Text Bk L1
Text Bk L2
Hyper
F. Hyper
Text D2
Text L2
Agenda main
Agenda main 2nd
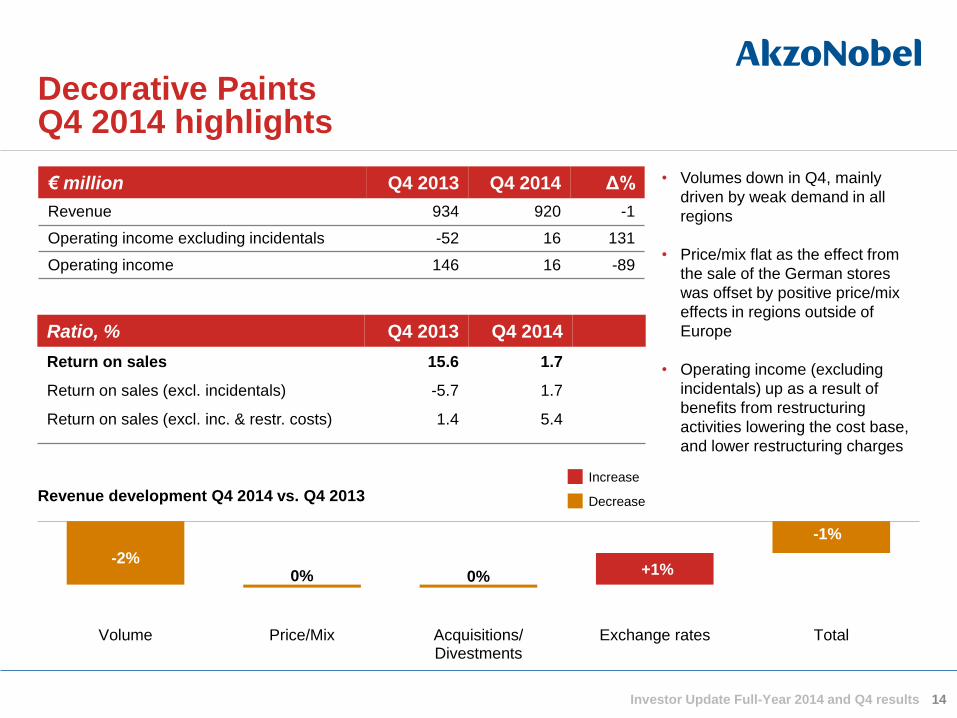
14
= • Volumes down in Q4, mainly
driven by weak demand in all
regions
• Price/mix flat as the effect from
the sale of the German stores
was offset by positive price/mix
effects in regions outside of
Europe
• Operating income (excluding
incidentals) up as a result of
benefits from restructuring
activities lowering the cost base,
and lower restructuring charges
Decorative Paints Q4 2014 highlights
€ million Q4 2013 Q4 2014 Δ%
Revenue 934 920 -1
Operating income excluding incidentals -52 16 131
Operating income 146 16 -89
Ratio, % Q4 2013 Q4 2014
Return on sales 15.6 1.7
Return on sales (excl. incidentals) -5.7 1.7
Return on sales (excl. inc. & restr. costs) 1.4 5.4
Increase
Decrease Revenue development Q4 2014 vs. Q4 2013
-2% 0% +1%
-1%
0%
Volume Price/Mix Acquisitions/Divestments
Exchange rates Total
-4%
Investor Update Full-Year 2014 and Q4 results

255-255-255
185-201-208
068-105-125
085-190-207
000-146-187
000-139-197
000-081-146
134-134-136
000-000-000
183-185-186
000-139-197
000-081-146
134-134-136
183-185-186
185-201-208
255-255-255
Text Bk D1
Color 6
Color 5
Color 4
Color 3
Color 2
Color 1
Text Bk D2
Text Bk L1
Text Bk L2
Hyper
F. Hyper
Text D2
Text L2
Agenda main
Agenda main 2nd
15
Performance Coatings Q4 2014 highlights
Increase
Decrease
+1% 0% 0% +3% +4%
Volume Price/Mix Acquisitions/ Divestments Exchange rates Total
Revenue development Q4 2014 vs. Q4 2013
• Q4 revenue was up 4 percent due
to favorable currencies and
price/mix
• Overall volumes flat with growth in
Marine & Protective Coatings
offset by other businesses
• Restructuring costs in line with
2013, while currencies and margin
improvements drove ROS up to
7.5 percent
• A new organizational structure was
introduced in Q4 with fewer
management layers
-1%
€ million Q4 2013 Q4 2014 Δ%
Revenue 1,367 1,416 4
Operating income excluding incidentals 73 106 45
Operating income 73 106 45
Ratio, % Q4 2013 Q4 2014
Return on sales 5.3 7.5
Return on sales (excl. incidentals) 5.3 7.5
Return on sales (excl. inc. & restr. costs) 11.0 12.8
Investor Update Full-Year 2014 and Q4 results

255-255-255
185-201-208
068-105-125
085-190-207
000-146-187
000-139-197
000-081-146
134-134-136
000-000-000
183-185-186
000-139-197
000-081-146
134-134-136
183-185-186
185-201-208
255-255-255
Text Bk D1
Color 6
Color 5
Color 4
Color 3
Color 2
Color 1
Text Bk D2
Text Bk L1
Text Bk L2
Hyper
F. Hyper
Text D2
Text L2
Agenda main
Agenda main 2nd
16
• Q4 revenue in line with previous
year, with adverse impact of
volumes and divestments offset by
favorable currency effects
• Adverse volume impact caused by
interruptions in the manufacturing
and supply chain and market
reactions following the large oil
price reduction, leading to
destocking
• Lower restructuring costs and
results from operational excellence
programs, increased profitability
Specialty Chemicals Q4 2014 highlights
Increase
Decrease
-1%
-1%
-1% 0%
Volume Price/Mix Acquisitions/Divestments
Exchange rates Total
Revenue development Q4 2014 vs. Q4 2013
€ million Q4 2013 Q4 2014 Δ%
Revenue 1,200 1,194 -1
Operating income excluding incidentals 91 93 2
Operating income -30 93 410
Ratio, % Q4 2013 Q4 2014
Return on sales -2.5 7.8
Return on sales (excl. incidentals) 7.6 7.8
Return on sales (excl. inc. & restr. costs) 9.9 7.9
+1%
Investor Update Full-Year 2014 and Q4 results

17
Decorative Paints
Specialty Chemicals
Performance Coatings
• New operating model in Europe
• Take advantage of our scale in back office functions, combined
on a global and European level
• More focused country Sales and Marketing organization
All three Business Areas are transforming and delayering in a significant way
Investor Update Full-Year 2014 and Q4 results
• Restructuring of Functional Chemicals
• Aligned organization with our strategy to focus on five main
chemical platforms
• Factory consolidation and relocation of business headquarters
to adapt to market conditions
• Footprint reductions announced in 2013, resulted in the closure
of eight sites
• New organization structure with fewer management layers and
clearer accountability
• Seven customer centric Strategic Market Units

18
Global Business Services is making clear progress
Investor Update Full-Year 2014 and Q4 results
Decorative Paints
Specialty Chemicals
Performance Coatings
Functional support activities:
Human Resources
Finance
Information Management
HSE
NPR Procurement
Centers of
Expertise (CoE) Shared Service
Centers (SSC)
Business Partner
Global Business Services Customers

The net impact of a sustained lower oil price can have a positive impact in 2015
19
Inventories
GDP
Investor Update Full-Year 2014 and Q4 results
Fre
igh
t an
d lo
gis
tics
F
reig
ht a
nd
log
istic
s
Sales Raw materials Production

255-255-255
185-201-208
068-105-125
085-190-207
000-146-187
000-139-197
000-081-146
134-134-136
000-000-000
183-185-186
000-139-197
000-081-146
134-134-136
183-185-186
185-201-208
255-255-255
Text Bk D1
Color 6
Color 5
Color 4
Color 3
Color 2
Color 1
Text Bk D2
Text Bk L1
Text Bk L2
Hyper
F. Hyper
Text D2
Text L2
Agenda main
Agenda main 2nd
Investor Update Full-Year 2014 and Q4 results
Monomers,
Precursors, etc.
Downstream oil related products have clearly different dynamics
20
Feedstocks Base (petro)chemicals
Intermediates and more complex molecules
Methanol
Ethylene
Ethanol
Propylene
Benzene
Xylenes
Etc.
Intermediates More complex
molecules
Monomers & Latex
Resins
Packaging
Additives
Solvents
Crude Oil
(Shale) Gas
Coal
Bio based
Renewables

255-255-255
185-201-208
068-105-125
085-190-207
000-146-187
000-139-197
000-081-146
134-134-136
000-000-000
183-185-186
000-139-197
000-081-146
134-134-136
183-185-186
185-201-208
255-255-255
Text Bk D1
Color 6
Color 5
Color 4
Color 3
Color 2
Color 1
Text Bk D2
Text Bk L1
Text Bk L2
Hyper
F. Hyper
Text D2
Text L2
Agenda main
Agenda main 2nd
255-255-255
185-201-208
068-105-125
085-190-207
000-146-187
000-139-197
000-081-146
134-134-136
000-000-000
183-185-186
000-139-197
000-081-146
134-134-136
183-185-186
185-201-208
255-255-255
Text Bk D1
Color 6
Color 5
Color 4
Color 3
Color 2
Color 1
Text Bk D2
Text Bk L1
Text Bk L2
Hyper
F. Hyper
Text D2
Text L2
Agenda main
Agenda main 2nd
Financial review Maëlys Castella
21 Investor Update Full-Year 2014 and Q4 results

255-255-255
185-201-208
068-105-125
085-190-207
000-146-187
000-139-197
000-081-146
134-134-136
000-000-000
183-185-186
000-139-197
000-081-146
134-134-136
183-185-186
185-201-208
255-255-255
Text Bk D1
Color 6
Color 5
Color 4
Color 3
Color 2
Color 1
Text Bk D2
Text Bk L1
Text Bk L2
Hyper
F. Hyper
Text D2
Text L2
Agenda main
Agenda main 2nd
FY 2014 - strong underlying performance
22 Investor Update Full-Year 2014 and Q4 results
Operational improvement
• ROS 6.9%; +30bp
• ROS 7.5%; +140bp excluding incidentals
• ROI 10%; +40bp
• ROI 10.9%; +190bp excluding incidentals
Cash discipline
• Capex €588 million
• OWC as a percentage of revenue 10.1%
• Ratings confirmed: S&P - BBB+/Stable Moodys - Baa1/Stable
Cash flow and EPS
• Net cash from operating activities €811 million
• Adjusted EPS €2.81

255-255-255
185-201-208
068-105-125
085-190-207
000-146-187
000-139-197
000-081-146
134-134-136
000-000-000
183-185-186
000-139-197
000-081-146
134-134-136
183-185-186
185-201-208
255-255-255
Text Bk D1
Color 6
Color 5
Color 4
Color 3
Color 2
Color 1
Text Bk D2
Text Bk L1
Text Bk L2
Hyper
F. Hyper
Text D2
Text L2
Agenda main
Agenda main 2nd
Summary – FY 2014 results
€ million FY 2013 FY 2014 Δ%
EBITDA 1,513 1,690 +12%
Amortization and depreciation (616) (618)
Operating income before incidentals 897 1072 +20%
Incidentals 61 (85)
Operating income 958 987 +3%
Net financing expenses (200) (156)
Minorities and associates (54) (51)
Income tax (111) (252)
Discontinued operations 131 18
Net income attributable to shareholders 724 546 -25%
Ratio FY 2013 FY 2014
Earnings per share from total operations (in €) 3.00 2.23
Adjusted earnings per share (in €) 2.62 2.81
23 Investor Update Full-Year 2014 and Q4 results

255-255-255
185-201-208
068-105-125
085-190-207
000-146-187
000-139-197
000-081-146
134-134-136
000-000-000
183-185-186
000-139-197
000-081-146
134-134-136
183-185-186
185-201-208
255-255-255
Text Bk D1
Color 6
Color 5
Color 4
Color 3
Color 2
Color 1
Text Bk D2
Text Bk L1
Text Bk L2
Hyper
F. Hyper
Text D2
Text L2
Agenda main
Agenda main 2nd
Q4 operating income strongly affected by incidental items
€ million Q4 2013 Q4 2014 Δ%
Revenue 3,482 3,517 1
Operating income excluding incidentals 55 169 207
Operating income 116 83 -28
Ratio, % Q4 2013 Q4 2014
Return on sales 3.3 2.4
Return on sales (excluding incidentals) 1.6 4.8
Return on sales (excluding incidentals & restructuring costs) 7.4 7.9
Moving average return on investment 9.6 10.0
Increase
Decrease
-1% 0% 0%
+2% +1%
Volume Price/Mix Acquisitions/Divestments
Exchange rates Total
Revenue development Q4 2014 vs. Q4 2013
24 Investor Update Full-Year 2014 and Q4 results

255-255-255
185-201-208
068-105-125
085-190-207
000-146-187
000-139-197
000-081-146
134-134-136
000-000-000
183-185-186
000-139-197
000-081-146
134-134-136
183-185-186
185-201-208
255-255-255
Text Bk D1
Color 6
Color 5
Color 4
Color 3
Color 2
Color 1
Text Bk D2
Text Bk L1
Text Bk L2
Hyper
F. Hyper
Text D2
Text L2
Agenda main
Agenda main 2nd
Summary – Q4 2014 results – significant operational improvements offset by incidentals
€ million Q4 2013 Q4 2014 Δ%
EBITDA 208 330 +59%
Amortization and depreciation (153) (162)
Operating income before incidentals 55 168 +205%
Incidentals 61 (85)
Operating income 116 83 -28%
Net financing expenses (48) (41)
Minorities and associates (12) (13)
Income tax (21) (36)
Discontinued operations 16 14
Net income attributable to shareholders 51 7 -86%
Ratio Q4 2013 Q4 2014
Earnings per share from total operations (in €) 0.21 0.03
Adjusted earnings per share (in €) (0.01) 0.33
25 Investor Update Full-Year 2014 and Q4 results

255-255-255
185-201-208
068-105-125
085-190-207
000-146-187
000-139-197
000-081-146
134-134-136
000-000-000
183-185-186
000-139-197
000-081-146
134-134-136
183-185-186
185-201-208
255-255-255
Text Bk D1
Color 6
Color 5
Color 4
Color 3
Color 2
Color 1
Text Bk D2
Text Bk L1
Text Bk L2
Hyper
F. Hyper
Text D2
Text L2
Agenda main
Agenda main 2nd
Incidental and other items relevant for Q4 and full-year results
26 Investor Update Full-Year 2014 and Q4 results
Incidentals – Positive P&L impact €61 million
Divestment Building Adhesives (Decorative
Paints) and Primary Amides (Specialty
Chemicals)
Non-cash impairment charge (Specialty
Chemicals)
• Adverse incidental items impacted our FY 2014 results; FY 2013 incidental items were favorable
• All incidental items are non-recurring
FY 2013
FY 2014
Other exceptional items
Divestment of Decorative Paints North America
(€141 million gain in profit from discontinued
operations and €779 million cash inflow)
Incidentals – Negative P&L impact €85 million
Fraud incident at our Chicago offices
Provisions for legacy items and project costs
related to a divestment
Other exceptional items
Mainly related to a settlement of a case following
the divestment of Organon BioSciences in 2007
(€ 88 million cash outflow)

255-255-255
185-201-208
068-105-125
085-190-207
000-146-187
000-139-197
000-081-146
134-134-136
000-000-000
183-185-186
000-139-197
000-081-146
134-134-136
183-185-186
185-201-208
255-255-255
Text Bk D1
Color 6
Color 5
Color 4
Color 3
Color 2
Color 1
Text Bk D2
Text Bk L1
Text Bk L2
Hyper
F. Hyper
Text D2
Text L2
Agenda main
Agenda main 2nd
Cash flows – Increased cash from operating activities and lower Capex
€ million Q4 2013 Q4 2014 Δ% FY 2013 FY 2014 Δ%
Profit for the period from continuing operations 48 9 661 600
Amortization and depreciation 152 162 616 618
Change working capital 277 364 (13) 28
Change provisions (41) (4) (395) (406)
Other changes (127) (50) (153) (29)
Net cash from operating activities 309 481 + 56% 716 811 + 13%
Capital expenditures (234) (186) -21% (666) (588) -12%
Acquisitions and divestments net of cash acquired 309 32 313 38
Changes from borrowings (362) 424 (253) (367)
Dividends (70) (84) (286) (280)
Other changes (4) 1 37 33
Cash flows before discontinued operations (52) 668 (139) (353)
Cash flows from discontinued operations (17) (63) 675 (88)
Net change in cash and cash equivalents of total operations (69) 605 536 (441)
27 Investor Update Full-Year 2014 and Q4 results
255-255-255
185-201-208
068-105-125
085-190-207
000-146-187
000-139-197
000-081-146
134-134-136
000-000-000
183-185-186
000-139-197
000-081-146
134-134-136
183-185-186
185-201-208
255-255-255
Text Bk D1
Color 6
Color 5
Color 4
Color 3
Color 2
Color 1
Text Bk D2
Text Bk L1
Text Bk L2
Hyper
F. Hyper
Text D2
Text L2
Agenda main
Agenda main 2nd
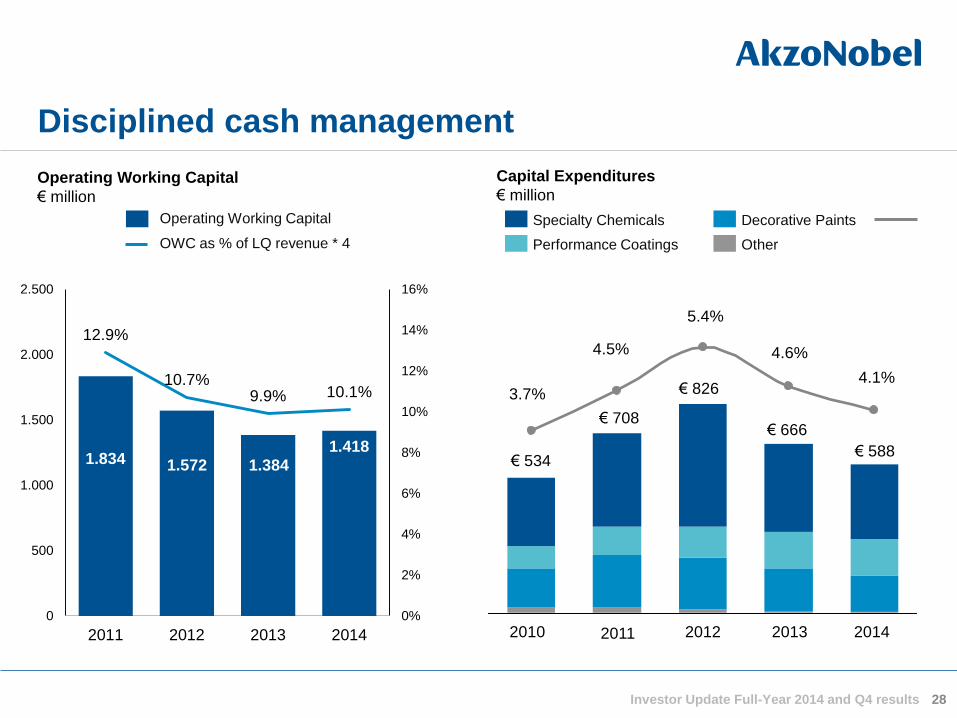
Disciplined cash management
28
1.834 1.572 1.384
1.418
12.9%
10.7% 9.9% 10.1%
0%
2%
4%
6%
8%
10%
12%
14%
16%
0
500
1.000
1.500
2.000
2.500
2011 2012 2013 2014
Operating Working Capital
€ million
€ 666
€ 826
4.6%
5.4%
€ 708
4.5%
3.7%
€ 534
2013 2012 2011 2010 2014
€ 588
4.1%
Capital Expenditures
€ million
Other
Decorative Paints
Performance Coatings
Specialty Chemicals
Investor Update Full-Year 2014 and Q4 results
Operating Working Capital
OWC as % of LQ revenue * 4
255-255-255
185-201-208
068-105-125
085-190-207
000-146-187
000-139-197
000-081-146
134-134-136
000-000-000
183-185-186
000-139-197
000-081-146
134-134-136
183-185-186
185-201-208
255-255-255
Text Bk D1
Color 6
Color 5
Color 4
Color 3
Color 2
Color 1
Text Bk D2
Text Bk L1
Text Bk L2
Hyper
F. Hyper
Text D2
Text L2
Agenda main
Agenda main 2nd
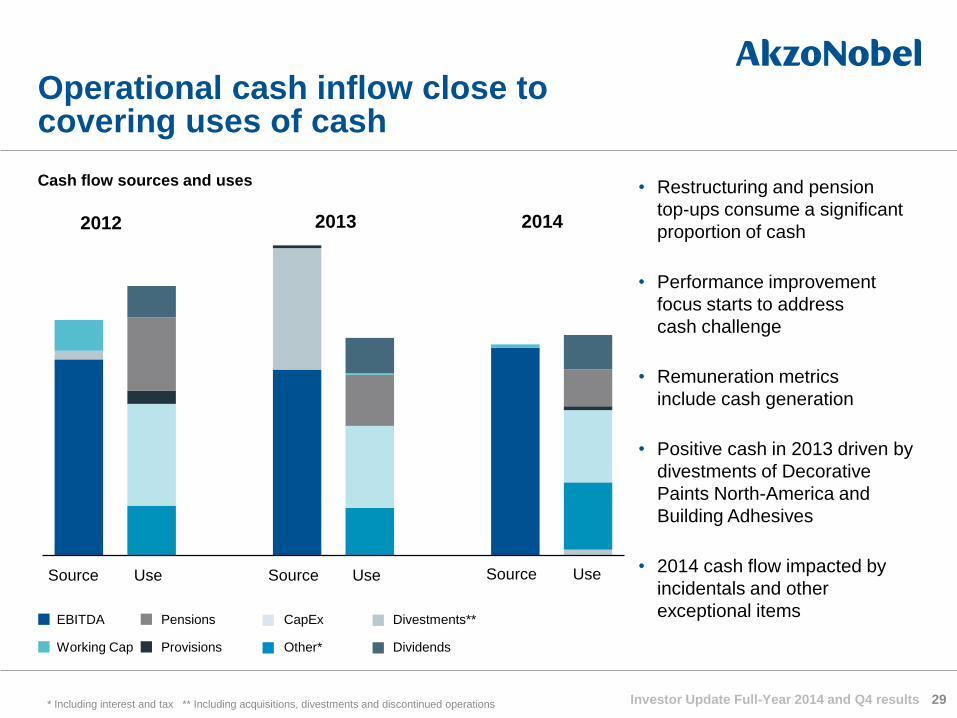
Cash flow sources and uses
29
• Restructuring and pension
top-ups consume a significant
proportion of cash
• Performance improvement
focus starts to address
cash challenge
• Remuneration metrics
include cash generation
• Positive cash in 2013 driven by
divestments of Decorative
Paints North-America and
Building Adhesives
• 2014 cash flow impacted by
incidentals and other
exceptional items
Operational cash inflow close to covering uses of cash
2012 2013
Source Use Source Use
Dividends
Divestments** EBITDA
Other* Working Cap
CapEx
Provisions
Pensions
* Including interest and tax ** Including acquisitions, divestments and discontinued operations
2014
Investor Update Full-Year 2014 and Q4 results
Source Use

255-255-255
185-201-208
068-105-125
085-190-207
000-146-187
000-139-197
000-081-146
134-134-136
000-000-000
183-185-186
000-139-197
000-081-146
134-134-136
183-185-186
185-201-208
255-255-255
Text Bk D1
Color 6
Color 5
Color 4
Color 3
Color 2
Color 1
Text Bk D2
Text Bk L1
Text Bk L2
Hyper
F. Hyper
Text D2
Text L2
Agenda main
Agenda main 2nd
30 Investor Update Full-Year 2014 and Q4 results
Debt maturities
€ million
Continuously reducing costs of long term bonds
Average cost of long term bonds
%
7.29 6.35 5.62 4.89 3.63
0
2
4
6
8
2010 2011 2012 2013 2014
825 622
800 750
500 320
2014 2015 2016 2017 2018 2019 2020 2021 2022 2023 2024
€ bonds £ bonds $ bonds
• Debt duration 4.8 years
• Net interest expense down
by €74 million compared
to 2013
Repaid
7.75%
7.25%
8.00%
4.00% 2.625%
1.75%

255-255-255
185-201-208
068-105-125
085-190-207
000-146-187
000-139-197
000-081-146
134-134-136
000-000-000
183-185-186
000-139-197
000-081-146
134-134-136
183-185-186
185-201-208
255-255-255
Text Bk D1
Color 6
Color 5
Color 4
Color 3
Color 2
Color 1
Text Bk D2
Text Bk L1
Text Bk L2
Hyper
F. Hyper
Text D2
Text L2
Agenda main
Agenda main 2nd
IAS 19 pension deficit increases to €0.8 billion in 2014 due to de-risking
31 Investor Update Full-Year 2014 and Q4 results
Key pension assumptions metrics Q4 2013 Q4 2014
Discount rate 4.2% 3.4%
Inflation rate 3.2% 2.8%
300
484
1,528 259
(638)
(1,936)
(841)
(844)
Deficit end Q42013
Top-ups Discount rateson DBO
Inflationon DBO
Asset returnover P&L
ICIPF Buy-ins Other Deficit end Q42014
Decrease
Increase
Pension deficit development during 2014 € million

255-255-255
185-201-208
068-105-125
085-190-207
000-146-187
000-139-197
000-081-146
134-134-136
000-000-000
183-185-186
000-139-197
000-081-146
134-134-136
183-185-186
185-201-208
255-255-255
Text Bk D1
Color 6
Color 5
Color 4
Color 3
Color 2
Color 1
Text Bk D2
Text Bk L1
Text Bk L2
Hyper
F. Hyper
Text D2
Text L2
Agenda main
Agenda main 2nd
255-255-255
185-201-208
068-105-125
085-190-207
000-146-187
000-139-197
000-081-146
134-134-136
000-000-000
183-185-186
000-139-197
000-081-146
134-134-136
183-185-186
185-201-208
255-255-255
Text Bk D1
Color 6
Color 5
Color 4
Color 3
Color 2
Color 1
Text Bk D2
Text Bk L1
Text Bk L2
Hyper
F. Hyper
Text D2
Text L2
Agenda main
Agenda main 2nd
Conclusion Ton Büchner
32 Investor Update Full-Year 2014 and Q4 results

255-255-255
185-201-208
068-105-125
085-190-207
000-146-187
000-139-197
000-081-146
134-134-136
000-000-000
183-185-186
000-139-197
000-081-146
134-134-136
183-185-186
185-201-208
255-255-255
Text Bk D1
Color 6
Color 5
Color 4
Color 3
Color 2
Color 1
Text Bk D2
Text Bk L1
Text Bk L2
Hyper
F. Hyper
Text D2
Text L2
Agenda main
Agenda main 2nd
Dividend policy unchanged – stable to rising dividend
33
• Our dividend policy is to pay a stable to rising
dividend each year
• An interim and final dividend will be paid in
cash unless shareholders elect to receive a
stock dividend
0.33 0.33
2013 2012
1.12 1.12
2011
0.33
1.12
2010
0.32
1.08
2009
0.30
1.05
Final dividend Interim dividend
Dividends paid (€)
2014
0.33
1.12
Investor Update Full-Year 2014 and Q4 results

255-255-255
185-201-208
068-105-125
085-190-207
000-146-187
000-139-197
000-081-146
134-134-136
000-000-000
183-185-186
000-139-197
000-081-146
134-134-136
183-185-186
185-201-208
255-255-255
Text Bk D1
Color 6
Color 5
Color 4
Color 3
Color 2
Color 1
Text Bk D2
Text Bk L1
Text Bk L2
Hyper
F. Hyper
Text D2
Text L2
Agenda main
Agenda main 2nd
Conclusion
34
• Improved underlying performance as efficiency programs take effect
• Higher return on sales and return on investment, despite the volatile economic environment
• Developing from transformation towards continuous improvement
• Markets, raw materials and exchange rates expected to remain volatile
• We are on track to deliver the 2015 targets
• Capital Markets Day in London on Tuesday 27 October
Investor Update Full-Year 2014 and Q4 results

255-255-255
185-201-208
068-105-125
085-190-207
000-146-187
000-139-197
000-081-146
134-134-136
000-000-000
183-185-186
000-139-197
000-081-146
134-134-136
183-185-186
185-201-208
255-255-255
Text Bk D1
Color 6
Color 5
Color 4
Color 3
Color 2
Color 1
Text Bk D2
Text Bk L1
Text Bk L2
Hyper
F. Hyper
Text D2
Text L2
Agenda main
Agenda main 2nd
255-255-255
185-201-208
068-105-125
085-190-207
000-146-187
000-139-197
000-081-146
134-134-136
000-000-000
183-185-186
000-139-197
000-081-146
134-134-136
183-185-186
185-201-208
255-255-255
Text Bk D1
Color 6
Color 5
Color 4
Color 3
Color 2
Color 1
Text Bk D2
Text Bk L1
Text Bk L2
Hyper
F. Hyper
Text D2
Text L2
Agenda main
Agenda main 2nd
Questions
35 Investor Update Full-Year 2014 and Q4 results
255-255-255
185-201-208
068-105-125
085-190-207
000-146-187
000-139-197
000-081-146
134-134-136
000-000-000
183-185-186
000-139-197
000-081-146
134-134-136
183-185-186
185-201-208
255-255-255
Text Bk D1
Color 6
Color 5
Color 4
Color 3
Color 2
Color 1
Text Bk D2
Text Bk L1
Text Bk L2
Hyper
F. Hyper
Text D2
Text L2
Agenda main
Agenda main 2nd
Safe Harbor Statement
This presentation contains statements which address such key issues as
AkzoNobel’s growth strategy, future financial results, market positions, product development, products in
the pipeline, and product approvals. Such statements should be carefully considered, and it should be
understood that many factors could cause forecasted and actual results to differ from these statements.
These factors include, but are not limited to, price fluctuations, currency fluctuations, developments in raw
material and personnel costs, pensions, physical and environmental risks, legal issues, and legislative,
fiscal, and other regulatory measures. Stated competitive positions are based on management estimates
supported by information provided by specialized external agencies. For a more comprehensive discussion
of the risk factors affecting our business please see our latest Annual Report, a copy of which can be found
on the company’s corporate website www.akzonobel.com.
36 Investor Update Full-Year 2014 and Q4 results

255-255-255
185-201-208
068-105-125
085-190-207
000-146-187
000-139-197
000-081-146
134-134-136
000-000-000
183-185-186
000-139-197
000-081-146
134-134-136
183-185-186
185-201-208
255-255-255
Text Bk D1
Color 6
Color 5
Color 4
Color 3
Color 2
Color 1
Text Bk D2
Text Bk L1
Text Bk L2
Hyper
F. Hyper
Text D2
Text L2
Agenda main
Agenda main 2nd
255-255-255
185-201-208
068-105-125
085-190-207
000-146-187
000-139-197
000-081-146
134-134-136
000-000-000
183-185-186
000-139-197
000-081-146
134-134-136
183-185-186
185-201-208
255-255-255
Text Bk D1
Color 6
Color 5
Color 4
Color 3
Color 2
Color 1
Text Bk D2
Text Bk L1
Text Bk L2
Hyper
F. Hyper
Text D2
Text L2
Agenda main
Agenda main 2nd
Appendices
37 Investor Update Full-Year 2014 and Q4 results

255-255-255
185-201-208
068-105-125
085-190-207
000-146-187
000-139-197
000-081-146
134-134-136
000-000-000
183-185-186
000-139-197
000-081-146
134-134-136
183-185-186
185-201-208
255-255-255
Text Bk D1
Color 6
Color 5
Color 4
Color 3
Color 2
Color 1
Text Bk D2
Text Bk L1
Text Bk L2
Hyper
F. Hyper
Text D2
Text L2
Agenda main
Agenda main 2nd
38
= • Volumes up 1 percent, with
increases in Asia offset by lower
volumes in Latin America,
reflecting difficult trading
conditions. Flat volumes in EMEA
• Revenue declined 6 percent due
to divestments, adverse currency
effects and adverse price/ mix.
The latter was mainly driven by
the sale of the German stores
• Costs down following the
implementation of restructuring
programs and strict cost control
Decorative Paints FY 2014 highlights
€ million FY 2013 FY 2014 Δ%
Revenue 4,174 3,909 -6
Operating income excluding incidentals 200 248 24
Operating income 398 248 -38
Ratio, % FY 2013 FY 2014
Return on sales 9.5 6.3
Return on sales (excl. incidentals) 4.8 6.3
Return on sales (excl. inc. & restr. costs) 7.3 8.4
Increase
Decrease Revenue development FY 2014 vs. FY 2013
1% -3%
-3% -6%
Volume Price/Mix Acquisitions/Divestments
Exchange rates Total
-1%
Investor Update Full-Year 2014 and Q4 results

255-255-255
185-201-208
068-105-125
085-190-207
000-146-187
000-139-197
000-081-146
134-134-136
000-000-000
183-185-186
000-139-197
000-081-146
134-134-136
183-185-186
185-201-208
255-255-255
Text Bk D1
Color 6
Color 5
Color 4
Color 3
Color 2
Color 1
Text Bk D2
Text Bk L1
Text Bk L2
Hyper
F. Hyper
Text D2
Text L2
Agenda main
Agenda main 2nd
39
Performance Coatings FY 2014 highlights
Increase
Decrease
+1% +1% 0%
0%
Volume Price/Mix Acquisitions/ Divestments Exchange rates Total
Revenue development FY 2014 vs. FY 2013
• Volumes up 1 percent, mainly from
growth in Marine and Protective
Coatings and Powder Coatings
• Full-year revenue flat due to
adverse currencies
• Restructuring activity continued,
including implementation of new
BA organizational structure with
fewer management layers and
clearer accountability
• Operating income increased 4
percent with benefits from
restructuring more than offsetting
higher restructuring costs
-2%
€ million FY 2013 FY 2014 Δ%
Revenue 5,571 5,589 0
Operating income excluding incidentals 525 545 4
Operating income 525 545 4
Ratio, % FY 2013 FY 2014
Return on sales 9.4 9.8
Return on sales (excluding incidentals) 9.4 9.8
Return on sales (excl. inc. & restr. costs) 11.2 12.4
Investor Update Full-Year 2014 and Q4 results

255-255-255
185-201-208
068-105-125
085-190-207
000-146-187
000-139-197
000-081-146
134-134-136
000-000-000
183-185-186
000-139-197
000-081-146
134-134-136
183-185-186
185-201-208
255-255-255
Text Bk D1
Color 6
Color 5
Color 4
Color 3
Color 2
Color 1
Text Bk D2
Text Bk L1
Text Bk L2
Hyper
F. Hyper
Text D2
Text L2
Agenda main
Agenda main 2nd
40
• Revenue down 1 percent due to
better volumes and price/mix more
than offset by divestments and
adverse currency
• Price pressure in caustic,
unfavorable currency
developments, and production
interruptions in the manufacturing
and supply chain in Rotterdam
impacted results
• Lower restructuring costs, results
from operational excellence
programs, and previous
restructuring measures increased
profitability
Specialty Chemicals FY 2014 highlights
Increase
Decrease
-1%
-2% -1%
+1% +1%
Volume Price/Mix Acquisitions/Divestments
Exchange rates Total
Revenue development FY 2014 vs. FY 2013
€ million FY 2013 FY 2014 Δ%
Revenue 4,949 4,883 -1
Operating income excluding incidentals 418 508 22
Operating income 297 508 71
Ratio, % FY 2013 FY 2014
Return on sales 6.0 10.4
Return on sales (excluding incidentals) 8.5 10.4
Return on sales (excl. inc. & restr. costs) 10.0 10.7
Investor Update Full-Year 2014 and Q4 results

255-255-255
185-201-208
068-105-125
085-190-207
000-146-187
000-139-197
000-081-146
134-134-136
000-000-000
183-185-186
000-139-197
000-081-146
134-134-136
183-185-186
185-201-208
255-255-255
Text Bk D1
Color 6
Color 5
Color 4
Color 3
Color 2
Color 1
Text Bk D2
Text Bk L1
Text Bk L2
Hyper
F. Hyper
Text D2
Text L2
Agenda main
Agenda main 2nd
Q4 2014 Operating income – Cash bridge
41
€ million Q4 2013 Q4 2014
Operating Income 116 83
Incidentals (61) 85
Depreciation & amortization 153 162
EBITDA before incidentals 208 330
Other 20 (54)
Change working capital 277 364
Change provisions (41) 8
Interest paid (61) (49)
Income tax paid (94) (118)
Net cash from operating activities 309 481
Investor Update Full-Year 2014 and Q4 results
255-255-255
185-201-208
068-105-125
085-190-207
000-146-187
000-139-197
000-081-146
134-134-136
000-000-000
183-185-186
000-139-197
000-081-146
134-134-136
183-185-186
185-201-208
255-255-255
Text Bk D1
Color 6
Color 5
Color 4
Color 3
Color 2
Color 1
Text Bk D2
Text Bk L1
Text Bk L2
Hyper
F. Hyper
Text D2
Text L2
Agenda main
Agenda main 2nd
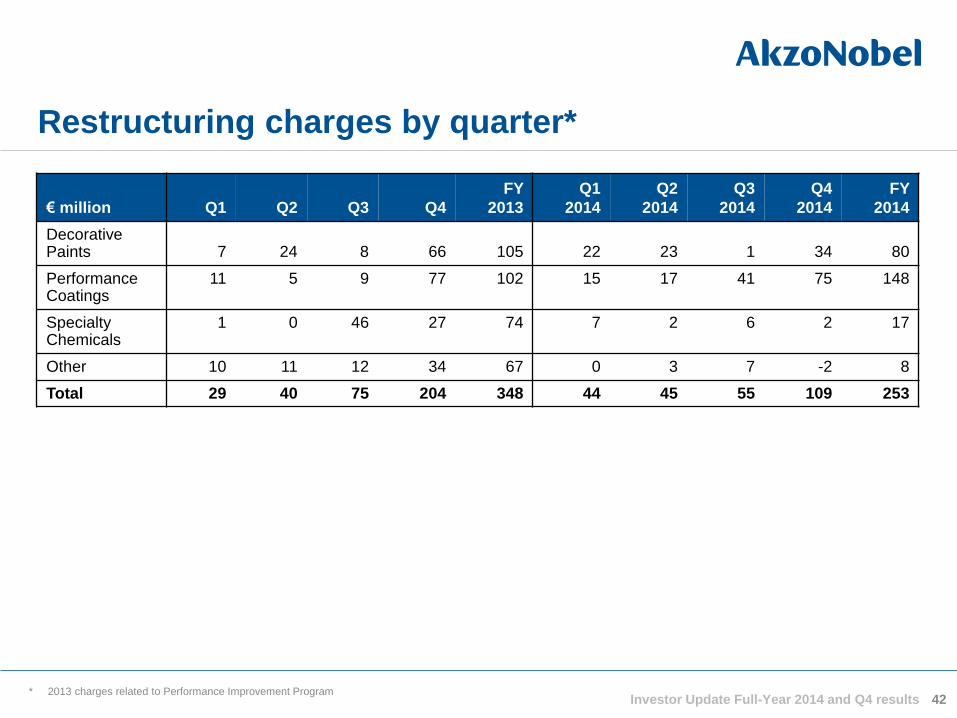
Restructuring charges by quarter*
42
€ million Q1 Q2 Q3 Q4
FY
2013
Q1
2014
Q2
2014
Q3
2014
Q4
2014
FY
2014
Decorative Paints 7 24 8 66 105 22 23 1 34 80
Performance Coatings
11 5 9 77 102 15 17 41 75 148
Specialty Chemicals
1 0 46 27 74 7 2 6 2 17
Other 10 11 12 34 67 0 3 7 -2 8
Total 29 40 75 204 348 44 45 55 109 253
* 2013 charges related to Performance Improvement Program Investor Update Full-Year 2014 and Q4 results

255-255-255
185-201-208
068-105-125
085-190-207
000-146-187
000-139-197
000-081-146
134-134-136
000-000-000
183-185-186
000-139-197
000-081-146
134-134-136
183-185-186
185-201-208
255-255-255
Text Bk D1
Color 6
Color 5
Color 4
Color 3
Color 2
Color 1
Text Bk D2
Text Bk L1
Text Bk L2
Hyper
F. Hyper
Text D2
Text L2
Agenda main
Agenda main 2nd
Effects from Building Adhesives on FY 2013 results
43
€ million Q1 Q2 Q3 Q4 FY 2013
Revenue 45 49 47 - 141
Operating Income 4 5 3 - 12
• Divestment completed on October 1st, 2013
• Results still included in 2013 financials, impact on 2014 revenue
development visible through acquisitions/divestments
Investor Update Full-Year 2014 and Q4 results

255-255-255
185-201-208
068-105-125
085-190-207
000-146-187
000-139-197
000-081-146
134-134-136
000-000-000
183-185-186
000-139-197
000-081-146
134-134-136
183-185-186
185-201-208
255-255-255
Text Bk D1
Color 6
Color 5
Color 4
Color 3
Color 2
Color 1
Text Bk D2
Text Bk L1
Text Bk L2
Hyper
F. Hyper
Text D2
Text L2
Agenda main
Agenda main 2nd
IAS 19 pension deficit reduces to €0.8 billion in Q4 2014
Key pension assumptions metrics Q3 2014 Q4 2014
Discount rate 3.7% 3.4%
Inflation rate 3.0% 2.8%
1
236
762
225 (1,143)
(857)
(68)
(844)
Deficit end Q32014
Top-ups Discount rateson DBO
Inflationon DBO
Asset returnover P&L
ICIPF Buy-in Other Deficit end Q42014
Decrease
Increase
Pension deficit development during Q4 2014 € million
44 Investor Update Full-Year 2014 and Q4 results

Innovation Pipeline Q4 2014 Decorative Paints – Dulux stain removal Non-additive
interior paint
Key Features
• Nano shell binder technology
• Premium stain removal
performance
• Eco-sense technology
• Good durability
Customer Benefits
• Good dirt resistance
• Easy clean
• Well-being indoor environment
• Long life wall protection
Growth Potential
• Launched in Dec 2014
• Keeping leading position in
market with premium
classification in Chinese new
stain removal standard
A super-premium eco-sense interior paint with good stain removal and other performance
Investor Update Full-Year 2014 and Q4 results 45

Innovation Pipeline Q4 2014
Specialty Coatings - Leather Touch Clearcoat
Key Features
• A soft-feel, clear coat for plastic
coated electronic devices
• Excellent fat-edge control and
slippery touch, that in
conjunction with the substrate,
mimics the touch of leather
• Imparts a soft feeling that can
be tuned on demand
Customer Benefits
• Compatible with current
standard plastic substrates and
basecoats, providing a wide
range of colors
• Durable and scratch resistant
• Engenders a ‘sense of
sophistication’ for users
• Higher productivity due to fast
painting process and less scrap
Growth Potential
• Good growth envisaged, driven
by the increasing market for
mobile, wireless devices and
Chinese OEMs shifting to
premium product markets
A soft-feel clear coat that mimics the feeling of leather in mobile electronics
Investor Update Full-Year 2014 and Q4 results 46

Innovation Pipeline Q4 2014 Industrial Chemicals – Steam savings in chlorine production
Key Features
• Reduction in the consumption
of process steam in chlorine
production by recovery of
excess heat from 4 stage
evaporation
Benefits
• Significant savings on steam
use
• CO2 footprint reduced by
4,400 ton/year
• 80% of steam generated
from a waste incineration unit
and only 20% of steam cost
dependent on natural gas
price
• Supports certification by the
German Eco-Management
Audit Scheme (EMAS)
Minimizing steam consumption in chlorine production at Bitterfeld, Germany
Innovation
• Innovative use of advanced
modelling and process
engineering to reduce ‘fresh’
steam demand
Investor Update Full-Year 2014 and Q4 results 47

255-255-255
185-201-208
068-105-125
085-190-207
000-146-187
000-139-197
000-081-146
134-134-136
000-000-000
183-185-186
000-139-197
000-081-146
134-134-136
183-185-186
185-201-208
255-255-255
Text Bk D1
Color 6
Color 5
Color 4
Color 3
Color 2
Color 1
Text Bk D2
Text Bk L1
Text Bk L2
Hyper
F. Hyper
Text D2
Text L2
Agenda main
Agenda main 2nd
255-255-255
185-201-208
068-105-125
085-190-207
000-146-187
000-139-197
000-081-146
134-134-136
000-000-000
183-185-186
000-139-197
000-081-146
134-134-136
183-185-186
185-201-208
255-255-255
Text Bk D1
Color 6
Color 5
Color 4
Color 3
Color 2
Color 1
Text Bk D2
Text Bk L1
Text Bk L2
Hyper
F. Hyper
Text D2
Text L2
Agenda main
Agenda main 2nd
Reference
48 Investor Update Full-Year 2014 and Q4 results

255-255-255
185-201-208
068-105-125
085-190-207
000-146-187
000-139-197
000-081-146
134-134-136
000-000-000
183-185-186
000-139-197
000-081-146
134-134-136
183-185-186
185-201-208
255-255-255
Text Bk D1
Color 6
Color 5
Color 4
Color 3
Color 2
Color 1
Text Bk D2
Text Bk L1
Text Bk L2
Hyper
F. Hyper
Text D2
Text L2
Agenda main
Agenda main 2nd
AkzoNobel today
49
• Revenue €14.3 billion
• 47,210 employees
• 44% of revenue from high growth markets
• Major producer of Paints, Coatings and
Specialty Chemicals
• Leadership positions in many markets
25%
29%
35%
11% PerformanceCoatings
DecorativePaints
SpecialtyChemicals
Other
42%
19%
39% 39%
27%
34%
Revenue by
Business Area
Operating income
by Business Area
Invested capital by
Business Area
6.9%
Return on sales
(operating income/revenue)
10.0%
Return on investment
(Operating income/average
12 months invested capital)
Investor Update Full-Year 2014 and Q4 results

255-255-255
185-201-208
068-105-125
085-190-207
000-146-187
000-139-197
000-081-146
134-134-136
000-000-000
183-185-186
000-139-197
000-081-146
134-134-136
183-185-186
185-201-208
255-255-255
Text Bk D1
Color 6
Color 5
Color 4
Color 3
Color 2
Color 1
Text Bk D2
Text Bk L1
Text Bk L2
Hyper
F. Hyper
Text D2
Text L2
Agenda main
Agenda main 2nd
50
High growth markets are 44% of revenue and their importance will increase
% of 2014 revenue
37%
Mature Europe
26%
Asia Pacific
4%
Other regions
10%
Latin America
15%
North America 8%
Emerging Europe
Share of revenues from high growth markets will increase over time
Investor Update Full-Year 2014 and Q4 results

255-255-255
185-201-208
068-105-125
085-190-207
000-146-187
000-139-197
000-081-146
134-134-136
000-000-000
183-185-186
000-139-197
000-081-146
134-134-136
183-185-186
185-201-208
255-255-255
Text Bk D1
Color 6
Color 5
Color 4
Color 3
Color 2
Color 1
Text Bk D2
Text Bk L1
Text Bk L2
Hyper
F. Hyper
Text D2
Text L2
Agenda main
Agenda main 2nd
Our proposition: Leading market
positions delivering leading performance
51
AkzoNobel has gone through a significant amount of
strategic change over the past five years
Today, the company has
• Excellent portfolio of businesses
• Good long term growth potential on the basis of end-user segment growth
• Strong positions in high growth markets (44% of revenue)
• Leadership positions in many markets
• Clear leader in sustainability
• Track record of delivering sustainable innovations and products
• Strong brands, both in consumer and industrial markets
Clear focus to deliver on our significant potential
• Improved returns and cash flow
• Leveraging scale
• Simplification and standardization
• Continued innovation
Investor Update Full-Year 2014 and Q4 results

255-255-255
185-201-208
068-105-125
085-190-207
000-146-187
000-139-197
000-081-146
134-134-136
000-000-000
183-185-186
000-139-197
000-081-146
134-134-136
183-185-186
185-201-208
255-255-255
Text Bk D1
Color 6
Color 5
Color 4
Color 3
Color 2
Color 1
Text Bk D2
Text Bk L1
Text Bk L2
Hyper
F. Hyper
Text D2
Text L2
Agenda main
Agenda main 2nd
< 8.9 9.6
10.0 14.0
0
4
8
12
16
2012 2013 2014 2015
Return on sales
(Operating income/revenue)
%
52
Return on investment
(Operating income/average
12 months invested capital)
%
Net debt/EBITDA
x
2015 financial targets focused on quality of earnings and value creation
On track to achieve 2015 targets
* 2012 excluding impairment (€2.1 billion) and after IAS19
5.9 6.6
6.9 9.0
0
4
8
12
2012 2013 2014 2015
1.4 1.0 1.0
2.0
0
1
2
3
2012 2013 2014 2015
* *
Investor Update Full-Year 2014 and Q4 results
255-255-255
185-201-208
068-105-125
085-190-207
000-146-187
000-139-197
000-081-146
134-134-136
000-000-000
183-185-186
000-139-197
000-081-146
134-134-136
183-185-186
185-201-208
255-255-255
Text Bk D1
Color 6
Color 5
Color 4
Color 3
Color 2
Color 1
Text Bk D2
Text Bk L1
Text Bk L2
Hyper
F. Hyper
Text D2
Text L2
Agenda main
Agenda main 2nd
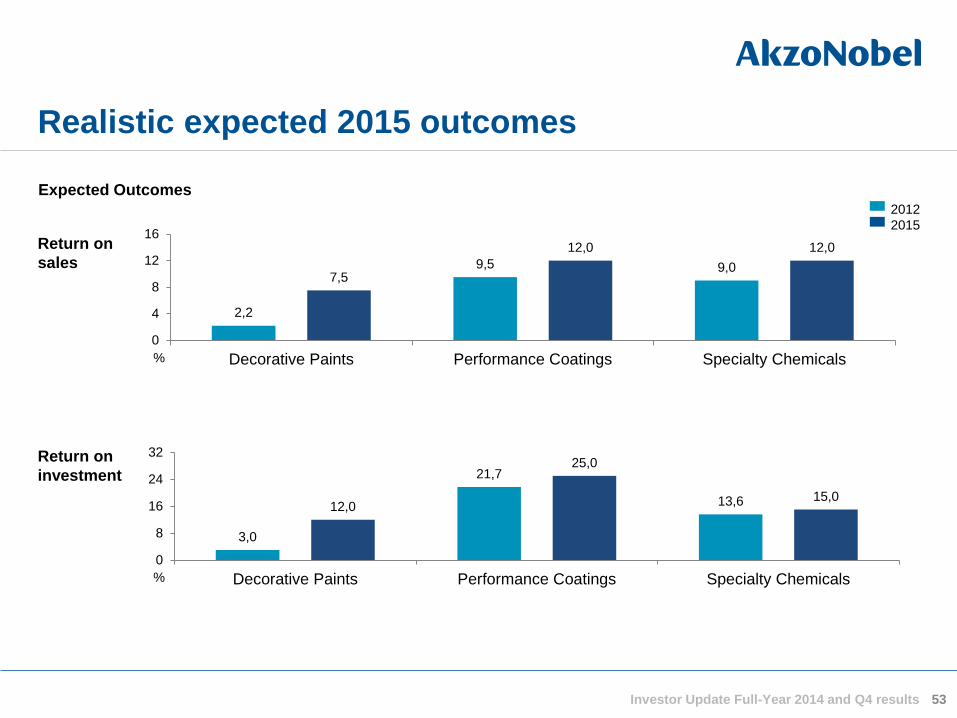
2,2
9,5 9,0 7,5
12,0 12,0
0
4
8
12
16
Decorative Paints Performance Coatings Specialty Chemicals
3,0
21,7
13,6 12,0
25,0
15,0
0
8
16
24
32
Decorative Paints Performance Coatings Specialty Chemicals
Realistic expected 2015 outcomes
Return on
sales
Return on
investment
2012
2015
%
%
Expected Outcomes
53 Investor Update Full-Year 2014 and Q4 results

255-255-255
185-201-208
068-105-125
085-190-207
000-146-187
000-139-197
000-081-146
134-134-136
000-000-000
183-185-186
000-139-197
000-081-146
134-134-136
183-185-186
185-201-208
255-255-255
Text Bk D1
Color 6
Color 5
Color 4
Color 3
Color 2
Color 1
Text Bk D2
Text Bk L1
Text Bk L2
Hyper
F. Hyper
Text D2
Text L2
Agenda main
Agenda main 2nd
54
AkzoNobel strategy introduced in 2013
• Organic growth
• Operational excellence
Investor Update Full-Year 2014 and Q4 results

255-255-255
185-201-208
068-105-125
085-190-207
000-146-187
000-139-197
000-081-146
134-134-136
000-000-000
183-185-186
000-139-197
000-081-146
134-134-136
183-185-186
185-201-208
255-255-255
Text Bk D1
Color 6
Color 5
Color 4
Color 3
Color 2
Color 1
Text Bk D2
Text Bk L1
Text Bk L2
Hyper
F. Hyper
Text D2
Text L2
Agenda main
Agenda main 2nd
By end-user segment
2014, 100% = ~ €100 billion
The global paints and coatings market is around €100 billion
By market sector
2014, 100% = ~ €100 billion
Decorative
Paints
(43%)
Powder
Auto OEM Performance
Coatings
(57%)
Protective
Wood Fin
Vehicle
refinish
Coil
Marine
Packaging
Aerospace
Yacht
Buildings and
Infrastructure
Transportation
Consumer
Goods
Industrial
55
Source: Orr & Boss; management analysis Investor Update Full-Year 2014 and Q4 results
Others
Spec. finishes

255-255-255
185-201-208
068-105-125
085-190-207
000-146-187
000-139-197
000-081-146
134-134-136
000-000-000
183-185-186
000-139-197
000-081-146
134-134-136
183-185-186
185-201-208
255-255-255
Text Bk D1
Color 6
Color 5
Color 4
Color 3
Color 2
Color 1
Text Bk D2
Text Bk L1
Text Bk L2
Hyper
F. Hyper
Text D2
Text L2
Agenda main
Agenda main 2nd
AkzoNobel has many leading market positions
No.1 Position Other key players
Decorative
Multiple regions
outside North
America
PPG, regional players
North America* Sherwin-Williams PPG, regional players
Protective Sherwin-Williams, Jotun
Powder Axalta, Jotun, regional players
Auto refinish Axalta PPG, AkzoNobel
Wood Sherwin-Williams, Valspar
Marine Jotun, Chugoku
Coil PPG, Beckers
* AkzoNobel not present with North America divestment to PPG 56 Investor Update Full-Year 2014 and Q4 results

255-255-255
185-201-208
068-105-125
085-190-207
000-146-187
000-139-197
000-081-146
134-134-136
000-000-000
183-185-186
000-139-197
000-081-146
134-134-136
183-185-186
185-201-208
255-255-255
Text Bk D1
Color 6
Color 5
Color 4
Color 3
Color 2
Color 1
Text Bk D2
Text Bk L1
Text Bk L2
Hyper
F. Hyper
Text D2
Text L2
Agenda main
Agenda main 2nd
0%
100%
Profit and loss breakdown*
% of total
In aggregate variable costs represent 53% of revenue
Decorative
Paints
Performance
Coatings
Specialty
Chemicals
AkzoNobel
Raw materials, energy and other variable costs
Fixed production costs
Selling, advertising, administration, R&D costs
EBIT margin
* Rounded percentages 57
• AkzoNobel is well positioned for
economic recovery
• Variable costs represent
53% of revenue
• Decorative Paints is more
driven by personnel costs
in the distribution network, while
Specialty Chemicals has more
production costs
Investor Update Full-Year 2014 and Q4 results

58
We are actively addressing all components of operating expenses
* All costs in € billion for 2013
Operating expenses
General &
Administrative Selling Expenses
Research,
Development &
Innovation
Global Business
Services Commercial Excellence Initiatives
Drives organic growth
Operating expense
components
Addressed by
Investor Update Full-Year 2014 and Q4 results

255-255-255
185-201-208
068-105-125
085-190-207
000-146-187
000-139-197
000-081-146
134-134-136
000-000-000
183-185-186
000-139-197
000-081-146
134-134-136
183-185-186
185-201-208
255-255-255
Text Bk D1
Color 6
Color 5
Color 4
Color 3
Color 2
Color 1
Text Bk D2
Text Bk L1
Text Bk L2
Hyper
F. Hyper
Text D2
Text L2
Agenda main
Agenda main 2nd
• We are moving into continuous improvement which will enable us to achieve the 2015 targets
– 2014 restructuring charges amounted to €253 million
– From 2015 onwards, more normalized levels of restructuring costs, around 1% of revenues
Ongoing initiatives in 2015 and beyond:
Drive towards continuous improvement and commercial excellence
59
Commercial Excellence
• Delivering quality products and innovations to our customers at a lower cost
to serve
− Improve customer satisfaction
− Drive organic growth
− Improve margin management
− Sales and marketing productivity
Global Business Services
• Streamlining corporate functions (Finance, HR, IM et cetera) by introducing
a new Global Business Services function responsible for implementing
standardized core functional processes throughout the organization
• Centers of Excellence, Shared Service Centers, Business Partnering
Investor Update Full-Year 2014 and Q4 results

255-255-255
185-201-208
068-105-125
085-190-207
000-146-187
000-139-197
000-081-146
134-134-136
000-000-000
183-185-186
000-139-197
000-081-146
134-134-136
183-185-186
185-201-208
255-255-255
Text Bk D1
Color 6
Color 5
Color 4
Color 3
Color 2
Color 1
Text Bk D2
Text Bk L1
Text Bk L2
Hyper
F. Hyper
Text D2
Text L2
Agenda main
Agenda main 2nd
60
Sustainability is business; business is sustainability
(Resource Efficiency Index)
A new indicator measuring how efficiently we generate value
(expressed as gross profit divided by cradle-to-grave carbon footprint)
of revenue by 2020 from products that are more sustainable for
our customers than the products of our competitors
more efficient resource and energy use across the entire value chain
by 2020 (measured by carbon footprint reduction)
AkzoNobel ranked #1 again in the Dow Jones Sustainability Index for the Materials Industry group
Investor Update Full-Year 2014 and Q4 results

255-255-255
185-201-208
068-105-125
085-190-207
000-146-187
000-139-197
000-081-146
134-134-136
000-000-000
183-185-186
000-139-197
000-081-146
134-134-136
183-185-186
185-201-208
255-255-255
Text Bk D1
Color 6
Color 5
Color 4
Color 3
Color 2
Color 1
Text Bk D2
Text Bk L1
Text Bk L2
Hyper
F. Hyper
Text D2
Text L2
Agenda main
Agenda main 2nd
61
AkzoNobel values drive cultural change
Investor Update Full-Year 2014 and Q4 results

Leading performance; gaining momentum
• ROS below peers
• Not earning our cost
of capital
• Inadequate free cash
flow
• Operating expenses
too high
• Not leveraging scale
Historical
issues
DP
7.5%
12%
PC
12%
25%
SC
12%
15%
Vision
& Strategy
2015 Targets
& Incentives
Culture
& Values
• Organic growth
• Operational
excellence
• ROS 9%
• ROI 14%
• Operating income -
not adjusted EBITDA
• CO₂ & Eco-premium
products
• Cash flow
• Incentives aligned
• Customer Focused
• Deliver on
Commitments
• Passion for
Excellence
• Winning Together
Business Area
Strategies
Business Area
Expected Outcomes
ROS
ROI
62 Investor Update Full-Year 2014 and Q4 results

49%
25%
14%
8% 4%
Mature Europe
Asia Pacific
Latin America
Emerging Europe
Other regions
Decorative Paints business at a glance
63
Revenue by geographic spread*
• We are the global leader in size in the attractive global
Decorative Paints market
• We are pursuing a vision of becoming the leading
global Decorative Paints company in size and performance
• Strategic priorities:
– Fix Europe
– Grow profitably in high-growth markets
€ million 2014
Revenue 3,909
EBITDA 405
Operating income 248
Return on sales 6.3%
Return on investment 8.8%
Employees 15,200
Revenue by end-user
sub-segment
Decorative Paints key figures Key messages
75%
25% Maintenance,renovation and repair
New build projects
Investor Update Full-Year 2014 and Q4 results * 2013

* Europe includes Africa and Middle East 64
In Decorative Paints we hold strong market positions across all regions
Geographic area Geographic size
(€ billion)
AkzoNobel
position
Europe* 12.2 1
South East Asia and Pacific 1.7 1
China and North Asia 6.4 2
Latin America 2.5 2
India and South Asia 2.8 3
Investor Update Full-Year 2014 and Q4 results

65
• Our well-known brands are one of our
key competitive advantages
• We have a number of powerful, relevant
brands occupying a number of positions
across different markets (consumer,
professional, and other such as
woodcare)
• Where possible, we have leveraged our
scale and created a single global identity
• We have rationalized our brand portfolio –
concentrating our investment behind
fewer, bigger, better brands
We have very strong brands linked by a global approach to branding
Co
ns
um
er
Pro
fes
sio
na
l
Oth
er
Investor Update Full-Year 2014 and Q4 results

66
Fix Europe
Objectives:
• Improve performance by driving organic growth and operational excellence
and changing the operating model in Europe
Actions:
• Implement a central operating model and simplify our organizational structure
• Consolidate our manufacturing and distribution footprint
• Develop and implement standardized and efficient marketing and sales
platforms
• Redesign back office processes to support back office consolidation and
restructuring
• Maintain a strong focus on customers and markets through the transition
period
Investor Update Full-Year 2014 and Q4 results

67
Changing our operating model in Europe
Action
2012
2013
2014
2015
Integrate relevant European activities and management
Rationalize product portfolio and raw materials
Rationalize manufacturing footprint
Fully implement sales excellence
Outsource certain finance businesses
Implement central operating model
Leverage repeatable models globally
Investor Update Full-Year 2014 and Q4 results

68
Grow profitably in high-growth markets
Objectives:
• Outgrow the market
• Ensure that we leverage our (global) scale to ensure
that we improve relative profitability while we grow
Actions:
• Develop profitable mid-market business model(s)
• Build and implement a robust distribution strategy framework
• Leverage global marketing and innovation scale to win locally
• Leverage our strong brands
• Create and implement a digital marketing strategy
Investor Update Full-Year 2014 and Q4 results

27%
20% 30%
8%
11% 4% Mature Europe
North America
Asia Pacific
Latin America
Emerging Europe
Other regions
21%
37%
28%
14% Buildings andInfrastructure
Transportation
ConsumerGoods
Industrial
Performance Coatings business at a glance
Key messages
• We have leading market positions
• Strategic priorities include:
– Performance improvement initiatives
– Differentiated growth strategies
Performance Coatings key figures
Revenue by end-user segment
Revenue by geographic spread*
€ million 2014
Revenue 5,589
EBITDA 687
Operating income 545
Return on sales 9.8%
Return on investment 22.0%
Employees 20,500
69 Investor Update Full-Year 2014 and Q4 results * 2013

27%
24% 18%
31%
Marine & ProtectiveCoatings
Automotive & AerospaceCoatings
Powder Coatings
Industrial Coatings
2014 revenue by Business Unit
We are organized in four Business Units
Marine & Protective
Coatings
• Protective
• Marine
• Yacht
Automotive &
Aerospace Coatings
• Vehicle Refinishes
• Specialty Finishes
• Aerospace
Industrial Coatings • Wood
• Coil
• Packaging
Powder Coatings • Powder
Business Unit Market sectors
70
• Vehicle Refinishes
• Specialty Finishes
• Aerospace
Automotive &
Aerospace Coatings
• Protective
• Marine
• Yacht
Marine &
Protective Coatings
• Powder Powder Coatings
• Wood
• Coil
• Packaging
Industrial Coatings
Investor Update Full-Year 2014 and Q4 results

AkzoNobel is the global market leader in Performance Coatings, excluding Automotive
Performance Coatings revenue
€ billion, 2013 unless noted
* 2012 data
Source: Annual Reports; AkzoNobel analysis 71
0
1
2
3
4
5
6
Non-Automotive Automotive
Investor Update Full-Year 2014 and Q4 results

0
1
2
3
4
5
6
7
Protective VehicleRefinishes
Powder Wood Marine SpecialtyFinishes
Coil Packaging Aerospace Yacht
AkzoNobel has many leading market sector positions in Performance Coatings
Performance Coatings market sectors
€ billion, 2013
AkzoNobel market share
position (by value) 2013 x
3
1
1
1/2
1
1 1
2
1/2 1
72 Source: Orr & Boss 2012 for base data on market sectors; AkzoNobel analysis Investor Update Full-Year 2014 and Q4 results

73
Outgrow the market organically
• Marine
• Protective
• Powder
• Specialty Finishes
Improve performance by
driving operational excellence
• Industrial (Wood, Coil, Packaging)
• Vehicle Refinishes
• Yacht
• Aerospace
Expected outcomes
• Improved market share
• Costs don’t grow as fast as revenue
• Improved return on sales
in percentage terms
Expected outcomes
• Growth with the market
• Reduced absolute operating expenditure
• Improved return on sales based on
cost reduction
Pursue differentiated growth strategies
Investor Update Full-Year 2014 and Q4 results

Business at a glance
74
Key messages
• Serving attractive markets, growing over the cycle
• Leading positions in five main platforms
• 56% of revenues generated outside of mature Europe
• Significant expansion investments now operational
• Driving functional excellence
Specialty Chemicals key figures
Revenue by end user segment
Revenue by geographic spread*
18%
6%
19%57%
Buildings and
infrastructure
Transportation
Consumer
goods
Industrial
44%
22%
17%
10%
5%2%
Mature Europe
North America
Asia Pacific
Latin America
Emerging Europe
Other regions
€ million 2014
Revenue 4,883
EBITDA 815
Operating income 508
Return on sales 10.4%
Return on investment 14.8%
Employees 9,800
Investor Update Full-Year 2014 and Q4 results * 2013

75
• $3.5 trillion market
• Solution provider for society
– manufacturing
– food production
– climate change
• Continuous growth
• Strong growth in China
1990 2000 2012 2020
Other
China
Asia Pacific
North America
Western Europe
0.9
1.3
3.4
6.3
Chemicals industry over time, by geography
$ trillion
The chemical industry is large and growing
Source: McKinsey
6.6%
%
6.8%
%
7.4%
% CAGR (nominal)
Investor Update Full-Year 2014 and Q4 results

Salt-chlorine chain
100% of Industrial Chemicals
Ethylene Oxide Network
40% of Functional Chemicals
Surfactants
85% of Surface Chemistry
Bleaching Chemicals
60% of Pulp & Performance chemicals
76
Our Business Units Our Platforms
Five well positioned platforms in their industries
Industrial Chemicals
Pulp & Performance chemicals
Surface Chemistry
Polymer Catalysts
40% of Functional Chemicals
Functional Chemicals
Investor Update Full-Year 2014 and Q4 results
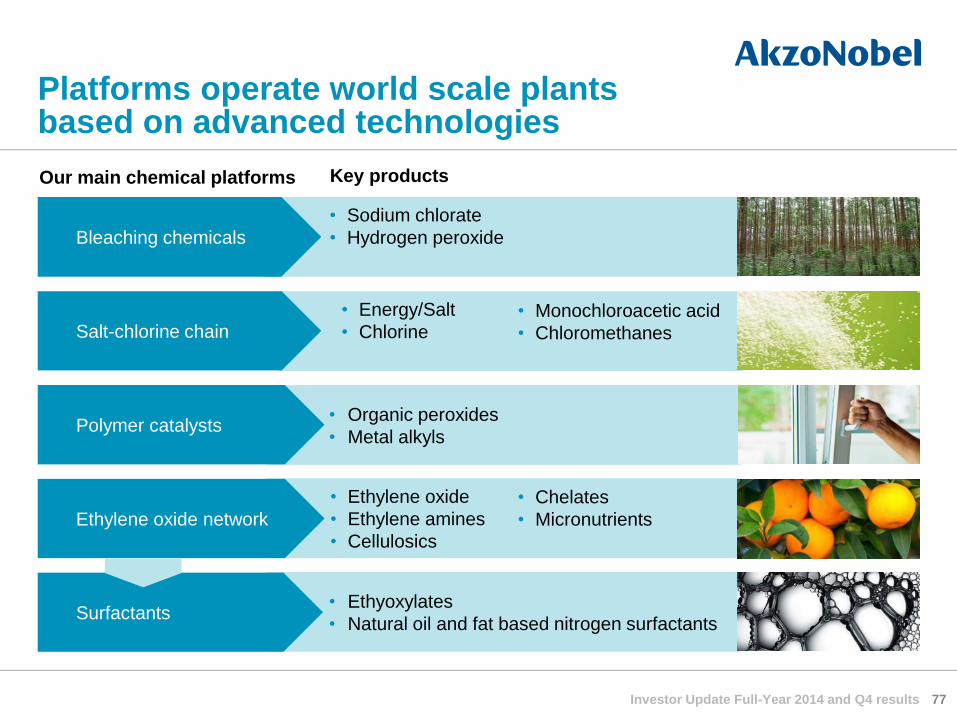
• Sodium chlorate
• Hydrogen peroxide
• Ethylene oxide
• Ethylene amines
• Cellulosics
• Organic peroxides
• Metal alkyls
• Ethyoxylates
• Natural oil and fat based nitrogen surfactants
• Energy/Salt
• Chlorine
Platforms operate world scale plants based on advanced technologies
• Monochloroacetic acid
• Chloromethanes
Our main chemical platforms Key products
Salt-chlorine chain
Bleaching chemicals
Ethylene oxide network
Polymer catalysts
Surfactants
• Chelates
• Micronutrients
77 Investor Update Full-Year 2014 and Q4 results

Major projects and timing of spend
• Capital expenditure peaked at 8.7%
of revenue in 2012
• Infrastructure is now in place and ready to take
on additional demand
0
100
200
300
400
500
2010 2011 2012 2013 2014
Capital Expenditure Depreciation and Amortization
BA Specialty Chemicals capital expenditure
€ million
We have invested in the recent past and are well-prepared for future growth
Investment project 2010 2011 2012 2013 2014 2015
Ningbo multisite
Frankfurt membrane
Brazil Eldorado
Brazil Suzano
Boxing
78 Investor Update Full-Year 2014 and Q4 results

79
Four operational improvement initiatives
Improve
productivity of
supply chain and
operations
• Asset optimization
• Production system
roll out
• Lean six sigma
• Industrial IT platform
• Yield, waste
and quality focus
Strengthen
commercial
excellence
• Customer value
creation
• Organic growth
• Margin management
• Sales force
productivity
Reduce
organizational
costs
• Restructuring
• Organization
delayering
• Restricted
recruitment
Enhance product
and process
innovation
• New applications
and products
• Variable cost
reduction
• Process
intensification
• Standard processes
Investor Update Full-Year 2014 and Q4 results

Improve performance by driving
operational excellence
~50% of portfolio
Main platforms
• Salt-chlorine chain
• Polymer catalysts
• Ethylene oxide network
80
Outgrow the market organically
~ 50% of portfolio
Main platforms
• Bleaching chemicals
• Surfactants
Actions
• Reduce costs and further
improve productivity in
operations
• Improve raw material
(cost) position
Differentiated strategies per platform
Actions
• Capitalize on investments
• Grow by successfully
commercializing products
for attractive applications
Investor Update Full-Year 2014 and Q4 results

81
Salt-Chlorine chain: Right at the heart of the customer base
* Pipelines transporting crude oil (RAPL), nafta (PALL), industrial gasses, ethylene and
propylene
Refinery Steam cracker
Pipelines*
Refinery & olefin producer Olefin consumer
Investor Update Full-Year 2014 and Q4 results

Ethylene oxide network: Capitalizing on China investments
Site plan
Hydrogen
Cyanide Organic
Peroxides
Ethylene
Amines Cellulosics
Surfactants
Chelates Bio-treatment
facility
Ethylene
Oxide
82 Investor Update Full-Year 2014 and Q4 results
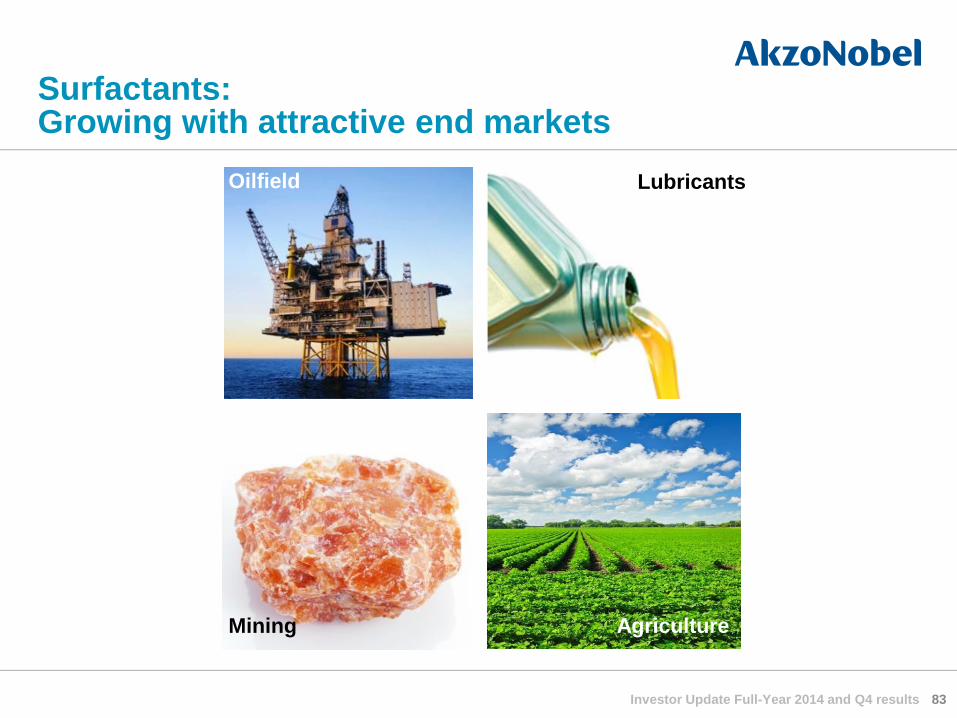
Surfactants: Growing with attractive end markets
Oilfield
Mining
Lubricants
Agriculture
83 Investor Update Full-Year 2014 and Q4 results

Our platforms build on value chains
Raw materials
Base chemicals
Chemical inter-mediates
Performance/ functional chemicals
‘End’ products
84
Bleaching chemicals
Salt-chlorine chain
Ethylene oxide network
Polymer catalysts
Surfactants
Investor Update Full-Year 2014 and Q4 results

255-255-255
185-201-208
068-105-125
085-190-207
000-146-187
000-139-197
000-081-146
134-134-136
000-000-000
183-185-186
000-139-197
000-081-146
134-134-136
183-185-186
185-201-208
255-255-255
Text Bk D1
Color 6
Color 5
Color 4
Color 3
Color 2
Color 1
Text Bk D2
Text Bk L1
Text Bk L2
Hyper
F. Hyper
Text D2
Text L2
Agenda main
Agenda main 2nd
0,0
0,5
1,0
1,5
2010 2011 2012 2013 2014
2015 target: net debt to EBITDA ratio of less than two
85
Net debt/EBITDA
x
• We have a strong liquidity position to support
business needs: net cash and cash equivalents
€1.7 billion*
• Undrawn revolving credit facility of €1.8 billion
(2018) €1.5 and $3 billion commercial paper
programs, backed by revolving credit facility
• 2013 improvement in Net Debt / EBITDA , which
was retained in 2014
• Maintain investment grade rating of BBB+
* At the end of Q4 2014 Investor Update Full-Year 2014 and Q4 results

255-255-255
185-201-208
068-105-125
085-190-207
000-146-187
000-139-197
000-081-146
134-134-136
000-000-000
183-185-186
000-139-197
000-081-146
134-134-136
183-185-186
185-201-208
255-255-255
Text Bk D1
Color 6
Color 5
Color 4
Color 3
Color 2
Color 1
Text Bk D2
Text Bk L1
Text Bk L2
Hyper
F. Hyper
Text D2
Text L2
Agenda main
Agenda main 2nd
Proactively managing or removing pension liabilities
86
Interest rate /
Inflation hedging
• Active management of interest rate and inflation
exposure, with around 70% of overall defined benefit
obligation (DBO) risks hedged
Longevity hedging • Courtaulds (CPS) longevity swap with Swiss Re in 2012
(€1.75billion)
Buy-in
• UK ICIPF’s annuity buy-in’s with Legal & General
and Prudential in 2014, covering ~ €4.7 billion
pensioner liabilities
Divestments
• Sale of Decorative Paints Canada in 2013
(DBO reduced by €301 million)
• Sale of National Starch in 2011 resulted in substantial
DBO reduction
Cash out /
Sleeper management
• US plan deferred members offered a cash out in 2013
(red. €85 million)
• UK CPS cash out in 2013 (DBO reduced by €39 million)
Buy-out • USA buy-out with MetLife in 2013 (DBO reduced by
€493 million)
Retain and
Manage Risk
Remove Risk
Investor Update Full-Year 2014 and Q4 results

255-255-255
185-201-208
068-105-125
085-190-207
000-146-187
000-139-197
000-081-146
134-134-136
000-000-000
183-185-186
000-139-197
000-081-146
134-134-136
183-185-186
185-201-208
255-255-255
Text Bk D1
Color 6
Color 5
Color 4
Color 3
Color 2
Color 1
Text Bk D2
Text Bk L1
Text Bk L2
Hyper
F. Hyper
Text D2
Text L2
Agenda main
Agenda main 2nd
Pension cash flow guidance
87
• Top-ups relate mainly to the 2 big UK plans, the ICI Pension Fund and the CPS
Pension Scheme
• Top-ups are based on prudent actuarial valuation of liabilities, which differs from
accounting liability
• Actuarial pension deficit of the 2 big UK plans is estimated at €1.5-2 billion
• The next triennial funding review for the ICI Pension Fund is expected to be
completed in 2015 and in 2016 for the CPS Scheme
• The forward looking estimates make no allowance for changes in the funded
status at future actuarial valuations or for additional contributions to de-risking
such as the 2013 MetLife transaction in the US
• As a result of the 2014 buy-in transactions an additional one-off payment
of £125 million (€160 million) will likely be added at the end of the top-up
schedule as part of the next valuation
Defined benefit pension cash top-ups
[Status February 2013]
€ million
2014 actual 300
2015 -17 est.* ~330/year
2018 est.* ~100
* Based upon currently agreed deficit contribution schedules for the UK plans
Make sure line weight is
consistent
Regular contributions
€ million 2015 estimated
Defined benefit 100
Defined contribution 140
Investor Update Full-Year 2014 and Q4 results

255-255-255
185-201-208
068-105-125
085-190-207
000-146-187
000-139-197
000-081-146
134-134-136
000-000-000
183-185-186
000-139-197
000-081-146
134-134-136
183-185-186
185-201-208
255-255-255
Text Bk D1
Color 6
Color 5
Color 4
Color 3
Color 2
Color 1
Text Bk D2
Text Bk L1
Text Bk L2
Hyper
F. Hyper
Text D2
Text L2
Agenda main
Agenda main 2nd
Variable costs analysis
2014
* Other variable costs include variable selling costs (e.g. freight) and products for resale ** Other raw materials include cardolite, hylar etc.
*** Chemicals and intermediates include caustic soda, acetic acid, tallow, ethylene, ethylene oxide, sulfur, amines etc. 88 Investor Update Full-Year 2014 and Q4 results
26%
4%
5%
6%
16% 3%
10%
17%
7%
6%
Energy & other variable costs*
Raw materials
Other raw materials**
Titanium
dioxide
Coatings’ specialties
Resins
Pigments
Additives
Solvents
Chemicals and
intermediates***
Packaging

255-255-255
185-201-208
068-105-125
085-190-207
000-146-187
000-139-197
000-081-146
134-134-136
000-000-000
183-185-186
000-139-197
000-081-146
134-134-136
183-185-186
185-201-208
255-255-255
Text Bk D1
Color 6
Color 5
Color 4
Color 3
Color 2
Color 1
Text Bk D2
Text Bk L1
Text Bk L2
Hyper
F. Hyper
Text D2
Text L2
Agenda main
Agenda main 2nd
Both short & long term incentives are aligned with our priorities
89
• Covers more than 600 executives
• Priorities are aligned with strategy and 2015 targets
Executive short term incentive 2014
STI
Element
Metric
20% Return on investment
20% Operating income
30% Operating cash flow
30% Personal targets – related to
performance improvement
plan
LTI
Element
Metric
35% Return on investment
35% Total Shareholder Return
30% Sustainability / SAM - DJSI
Executive long term incentive 2014
Investor Update Full-Year 2014 and Q4 results