al shaheer financial hy standalone 2015
TRANSCRIPT

Standalone Financial Statement
Audit Report5Directors’ Report6Balance Sheet7Profit and Loss Account8Statement of Comprehensive Income9Cash Flow Statement10Statement of Changes in Equity11Notes to the Financial Statements12Consolidated Financial Statements22Consolidated Balance Sheet23Consolidated Profit and Loss Account24Consolidated Statement of Comprehensive Income25Consolidated Cash Flow Statement26Consolidated Statement of Changes in Equity27Notes to the Consolidated Financial Statements28
4Company Profile2
Contents...

Board Members Secretary Management on invitation
Committee of Directors
1. Audit Committee
Board of DirectorsNoorur Rahman Abid - ChairmanKamran Ahmed KhaliliNaveed GodilMuhammad AliAdeeb AhmedRizwan JamilQaysar AlamRukhsana Asgher
Chief Executive OfficerKamran Ahmed Khalili
Company SecretaryMohammed Ashraf
a. Noorur Rahman Abid (Chairman) Company Secretary CEOb. Qaysar Alam CFOc. Muhammad Ali
Board Members Secretary Management on invitation2. Human Resource and Compensation Committee
a. Rukhsana Asgher (Chairperson) Company Secretary CEOb. Noorur Rahman Abid CFO
Board Members Secretary Management on invitation3. Operations and Cost Optimization Committee
a. Qaysar Alam (Chairman) Company Secretary CEOb. Rukhsana Asgher CFO
Half Yearly Report 201502
CompanyInformation

Registered OfficeSuite/5/5, 3rd Floor Mansoor Tower, Block 8, Shahrah e Roomi, Clifton, Karachi
AuditorsErnst & Young Ford Rhodes Sidat HyderChartered Accountants Progressive Plaza, Beaumont Road, P.O.Box 15541Karachi 75530
Siddiqui and RazaOffice No. 505Continental Trade CentreBlock No. 8 CliftonKarachi
Registrar & Share Registration OfficeCentral Depository Company of Pakistan LimitedCDC House, 99-B, Block B, S.M.C.H.S.,Main Shahrah e Faisal, Karachi – 74400.
Board Members Secretary Management on invitation5. Marketing Committee
a. Rizwan Jamil (Chairman) Company CEOb. Rukhsana Asgher Secretary CFO
Board Members Secretary Management on invitation4. Strategic Investment Committee
a. Muhammad Ali (Chairman) Company Secretary CEOb. Rizwan Jamil CEO c. Noorur Rahman Abid
Half Yearly Report 201503

Statements2015
Standalone Financial

Auditor’s Report to the Members on Review ofInterim Financial InformationIntroduction
We have reviewed the accompanying condensed interim balance sheet of Al Shaheer Corporation Limited (the Company) as at 31 December 2015, the related condensed interim profit and loss account, condensed interim statement of comprehensive income, condensed interim cash flow statement, and condensed interim statement of changes in equity and notes to the accounts for the six-month period then ended (here-in-after referred to as “interim financial information”). Management is responsible for the preparation and presentation of this interim financial information in accordance with approved accounting standards as applicable in Pakistan for interim financial reporting. Our responsibility is to express a conclusion on this interim financial information based on our review.
Scope of Review
We conducted our review in accordance with International Standard on Review Engagements 2410, “Review of Interim Financial Information Performed by the Independent Auditor of the Entity. “A review of interim financial information consists of making inquiries, primarily of persons responsible for financial and accounting matters, and applying analytical and other review procedures. A review is substantially less in scope than an audit conducted in accordance with International Standards on Auditing and consequently does not enable us to obtain assurance that we would become aware of all significant matters that might be identified in an audit. Accordingly, we do not express an audit opinion.
Conclusion
Based on our review, nothing has come to our attention that causes us to believe that the accompanying interim financial information is not prepared, in all material respects, in accordance with approved accounting standards as applicable in Pakistan for interim financial reporting.
Chartered Accountants
Review Engagement Partner: Shariq Ali Zaidi
Date: 29 February 2016Karachi
Half Yearly Report 201505

“On behalf of the Board of Directors of Al Shaheer Corporation Limited, I am pleased to present to you the audited financial statements of the company for the first half of the financial year 2015-2016.
(Rupees)
31 December, 2015(Un-audited)
31 December, 2014(Audited)
Directors' Report
“Profit before Tax 171,174,862 97,566,972Taxation 2,294,279 (18,004,147 )Profit after Tax 173,469,141 115,571,119EPS - Basic Rs. 1.48/share Rs. 1.55/Share - Diluted Rs. 1.44/share Rs. 1.55/Share
“The key indicators for the first half are showing a very healthy trend which is evident from expansion in retail universe, enhanced customer base of B2B business and continually fueling export business. Your company has served a record number of Qurbani Project Customers during this period. All of this signifies the trust our customers continue to place in our business and our brands.
During the first half of FY15-16, we were able to expand our retail universe by 18 stores, taking the total number of stores to 44 at the end of December. Our retail brands continued to register strong topline growth, with Meat One growing at 31% and Khaas growing at 180% vs year ago. Although these are promising numbers, the high operating cost of our outlets present a significant challenge on delivering profit from each individual location in case of Khaas Meat, where the target consumers carry relatively lower purchasing power. In the coming period we will consolidate the Khaas network to the most profitable locations while the major retail reach will be achieved through the Meat One brand.
Our expanded Meat One retail base has also enabled us to reach out a higher number of B2B customers enabling us to deliver outstanding results on this front too. During this period, we rapidly grew the B2B business - doubling it versus year ago (92% growth net of armed forces supplies).
Our core export business continues to grow by leaps and bounds. In first half FY15-16, we were able to grow this business by 47% over last year. One of our major projects - Feedlot Fattening - through our subsidiary, Al Shaheer Farms - went live at the end of October 2015. Trial fattening on a variety of breeds is underway and the initial results are extremely encouraging. We are obtaining over 50% harvest ratio. The construction of our poultry plant in Lahore is in full swing and completion is expected by October 2016. Your company is confident that it will continue to fuel this growth trend through several other initiatives taking place during the upcoming quarters. With enhanced reach via an ever expanding retail footprint, focused strategies to delightfully serve our customers across SBUs, a robust and innovative business plan for the immediate as well as the future, we are certainly looking forward to exciting and rewarding times ahead. We look forward to your continued trust and support in our bid to deliver value to all our stakeholders- our customers, our communities and certainly our shareholders.
On Behalf of Board of Directors
Kamran KhaliliCEO
Half Yearly Report 201506

Half Yearly Report 201507
Chief Executive Director
(Rupees)Note
31 December, 2015(Un-audited)
30 June, 2015(Audited)
ASSETSNON-CURRENT ASSETS Property, plant and equipment 5 2,000,793,500 1,142,070,716Intangible assets 2,321,925 2,736,336 2,003,115,425 1,144,807,052Long-term investment 35,700,000 35,700,000Long-term deposits 26,702,993 13,400,000Deferred tax asset 6 80,690,351 51,616,979 2,146,208,769 1,245,524,031CURRENT ASSETS Fuels and lubricants 5,447,313 3,441,275Stock-in-trade 7 135,354,447 31,179,079Trade debts 8 703,128,809 527,345,804Loans and advances 473,905,595 543,640,769Short-term deposits and prepayments 34,151,752 21,500,540Short term investments 9 628,430,866 - -Other receivables 10 212,601,589 161,786,886Taxation – net 52,965,205 28,428,346Cash and bank balances 28,030,621 1,812,348,955 2,274,016,197 3,129,671,654TOTAL ASSETS 4,420,224,966 4,375,195,685
EQUITY AND LIABILITIESSHARE CAPITAL AND RESERVESAuthorised capital150,000,000 (30 June 2015: 150,000,000) ordinary 1,500,000,000 1,500,000,000 shares of Rs. 10/- eachIssued, subscribed and paid-up capital 11 1,235,803,720 665,410,160Capital reserves - share premium 1,692,697,322 - -Revenue reserves - unappropriated profit 511,326,733 285,557,861 3,439,827,775 950,968,021Advance against issue of shares - - 1,781,250,000Surplus on revaluation of fixed assets 201,125,534 216,302,218NON-CURRENT LIABILITIES Long-term financing 21,488,156 36,072,965Deferred liabilities 17,570,274 18,054,095 39,058,430 54,127,060CURRENT LIABILITIES Trade and other payables 12 671,741,693 1,262,666,924Accrued mark-up 1,470,473 16,912,936Current portion of long-term financing 59,381,778 77,684,637Due to a related party 13 7,619,283 15,283,889 740,213,227 1,372,548,386TOTAL EQUITY AND LIABILITIES 4,420,224,966 4,375,195,685
CONTINGENCIES AND COMMITMENTS 14 The annexed notes 1 to 26 form an integral part of these condensed interim financial statements.
Condensed Interim Balance SheetAS AT 31 DECEMBER 2015

Half Yearly Report 201508
Chief Executive Director
(Rupees)
Half year ended Quarter ended31 December,
2015(Un-audited)
31 December,2014
(Un-audited)
31 December, 2015
(Un-audited)
31 December,2014
(Audited)
Turnover – net 15 3,570,813,966 2,267,285,884 1,635,746,547 1,121,486,909Cost of sales 16 (3,058,656,234 ) (1,906,918,161 ) (1,329,775,707 ) (921,815,603 ) Gross profit 512,157,732 360,367,723 305,970,840 199,671,306 Administrative and distribution expenses 17 (329,264,697 ) (222,009,038 ) (182,481,016 ) (120,570,509 )Other expenses 18 (29,184,660 ) (7,932,228 ) (27,490,348 ) (9,630,361 ) (358,449,357 ) (229,941,266 ) (209,971,364 ) (130,200,870 ) Operating profit 153,708,375 130,426,457 95,999,476 69,470,436 Other income 19 49,843,188 10,871,189 9,000,609 5,568,170Finance costs (32,376,701 ) (43,730,674 ) (9,972,896 ) (19,689,000 ) Profit before tax 171,174,862 97,566,972 95,027,189 55,349,600 Taxation 20 2,294,279 18,004,147 5,812,312 10,109,486 Profit for the period 173,469,141 115,571,119 100,839,501 65,459,086
Earnings per share – Basic 21 1.48 1.55 0.86 0.88 Earnings per share – Diluted 21 1.44 1.55 0.84 0.88 The annexed notes 1 to 26 form an integral part of these condensed interim financial statements.
Note
Condensed Interim Profit and Loss Account FOR THE HALF YEAR ENDED 31 DECEMBER 2015

Half Yearly Report 201509
(Rupees)
Half year ended Quarter ended31 December,
2015(Un-audited)
31 December,2014
(Un-audited)
31 December, 2015
(Un-audited)
31 December,2014
(Audited)
Profit for the period 173,469,141 115,571,119 100,839,501 65,459,086Other comprehensive income: Other comprehensive income not to be reclassified to profit and loss account in subsequent periods: Effect of change in tax rate applied to previously recognized re-measurement gain on defined benefit plan 1,850 - - - - - - Total other comprehensive income, net of tax 1,850 - - - - - -Total comprehensive income for the period 173,470,991 115,571,119 100,839,501 65,459,086
The annexed notes 1 to 26 form an integral part of these condensed interim financial statements.
Chief Executive Director
Condensed Interim Statement of Comprehensive IncomeFOR THE HALF YEAR ENDED 31 DECEMBER 2015

Half Yearly Report 201510
Note (Rupees)
31 December, 2015(Un-audited)
31 December, 2014(Audited)
Chief Executive Director
Condensed Interim Cash Flow StatementFOR THE HALF YEAR ENDED 31 DECEMBER 2015
CASH FLOWS FROM OPERATING ACTIVITIES
Profit before tax 171,174,862 97,566,972 Adjustments for: Depreciation 48,809,950 42,805,425 Amortisation 808,611 2,387,521 Reversal of provision for doubtful debts - net (21,446,270 ) - - Unrealised loss on short-term investments 14,803,691 - - (Loss) / gain on disposal of property, plant and equipment (10,773,137 ) 46,890 Workers’ Profits Participation Fund 9,193,065 5,828,523 Workers’ Welfare Fund 3,943,365 1,991,163 Gratuity 4,273,378 3,608,507 Finance costs 32,376,701 43,730,674 81,539,354 100,398,703 Operating profit before working capital changes 252,714,216 197,965,675
Decrease / (increase) in current assets: Fuels and lubricants (2,006,038 ) - - Stock-in-trade (104,175,369 ) 17,054,688 Trade debts (154,336,735 ) 88,264,786 Loans and advances 69,735,175 (144,594,733 ) Short-term deposits and prepayments (12,651,212 ) (1,063,548 ) Other receivables (50,814,702 ) (16,684,414 ) (254,248,881 ) (57,023,221 ) Increase / (decrease) in current liabilities: Trade and other payables (599,644,964 ) 48,117,469 Due to a related party (7,664,606 ) (79,298,143 ) (607,309,570 ) (31,180,674 ) Cash flows used in operations (608,844,235 ) (88,203,895 ) Long-term deposit - net (13,302,993 ) (2,108,999 ) Tax paid (44,400,950 ) (18,423,839 ) Gratuity paid (4,757,200 ) (478,401 ) WPPF paid (4,340,661 ) - - WWF paid 373,964 - - Net cash flows (used in) / generated from operating activities (675,272,075 ) 88,750,541
CASH FLOWS FROM INVESTING ACTIVITIES Additions to: - property, plant and equipment (284,036,930 ) (35,514,554 ) - capital work-in-progress (657,023,292 ) (46,103,020 ) - intangible assets (394,200 ) (165,200 ) Sale proceeds from disposal of property, plant and equipment 44,300,625 4,340,351 Purchase of short-term investments (643,234,557 ) - - Net cash flows used in investing activities (1,540,388,354 ) (77,442,423 )
CASH FLOWS FROM FINANCING ACTIVITIES Proceeds from issue of shares 593,750,000 190,088,895 ) Advance against issue of shares – net - - (211,470,679 ) Share issue costs paid (81,701,072 ) - - Long-term financing - net (32,887,668 ) (12,662,829 ) Finance costs paid (47,819,164 ) (46,549,642 ) Net cash flows generated from / (used in) financing activities 431,342,096 (80,594,255 )Net decrease in cash and cash equivalents (1,784,318,333 ) (69,286,137 ) Cash and cash equivalents at the beginning of the period 1,812,348,954 16,839,927 Cash and cash equivalents at the end of the period 22 28,030,621 (52,446,210 ) The annexed notes 1 to 26 form an integral part of these condensed interim financial statements.

Half Yearly Report 201511
(Rupees)
Revenuereserve
Unappropriatedprofit
Total Issued,
subscribedand paid-up
capital
Capitalreserves Share
premium
Balance as at 01 July 2014 - (Audited) 260,015,000 - - 155,959,348 415,974,348
Pro�t for the period - - - - 115,571,119 115,571,119Other comprehensive income for the period, net of tax - - - - - - - -Total comprehensive income for the period - - - - 115,571,119 115,571,119
Issue of 2,745,759 right shares at premium of Rs. 59.23 per share 27,457,590 162,631,306 - - 190,088,896
Surplus on revaluation of �xed assets realised on account of incremental depreciation charged on related assets, net of deferred tax - - - - 12,935,704 12,935,704
Balance as at 31 December 2014 - (Audited) 287,472,590 162,631,306 284,466,171 734,570,067
Balance as at 30 June 2015 - (Audited) 665,410,160 - - 285,557,861 950,968,021
Pro�t for the period - - - - 173,469,141 173,469,141Other comprehensive income for the period, net of tax - - - - 1,850 1,850Total comprehensive income for the period - - - - 173,470,991 173,470,991
Issue of 25,000,000 ordinary shares at premium of Rs.85 per share (notes 1.2 & 11.1) 250,000,000 2,125,000,000 - - 2,375,000,000
Issue of 32,039,356 bonus shares at 35% (note 11.2) 320,393,560 (320,393,560) - - - -
Surplus on revaluation of �xed assets realised on account of incremental depreciation charged on related assets, net of deferred tax - - - - 15,176,683 15,176,683
Share issue costs, net of deferred tax - - (74,787,920) - - (74,787,920)
Transfer of share issue costs, net of deferred Tax - - (37,121,198) 37,121,198 - -
Balance as at 31 December 2015 - (Un-audited) 1,235,803,720 1,692,697,322 511,326,733 3,439,827,775
The annexed notes 1 to 26 form an integral part of these condensed interim �nancial statements.
Chief Executive Director
Condensed Interim Statement of Changes in EquityAS AT 31 DECEMBER 2015

Half Yearly Report 201512
1. LEGAL STATUS AND OPERATIONS
1.1 Al Shaheer Corporation Limited (the Company) was incorporated as a private limited company in Pakistan on 30 June 2012 under the Companies Ordinance, 1984. The Company was formed as result of amalgamation of two firms having common partners namely, 'Al Shaheer Corporation' and 'MeatOne', which stands as merged on 30 June 2012 and the Company commenced its operations from 01 July 2012 by continuing homogenous line of business of said firms. Subsequently, during the year ended 30 June 2015, the Company changed its legal status from private limited company to public limited company and accordingly, the name of the Company changed to Al Shaheer Corporation Limited. The registered office of the Company is situated at Suite No. G/5/5, 3rd floor, Mansoor Tower, Block-8, Shahrah-e-Roomi, Clifton, Karachi. The Company is engaged in trading of different kinds of Halal meat including goat, cow, chicken and fish, both for export market and local sales through chain of retail stores.
1.2 On 24 August 2015, the Company enlisted on Pakistan Stock Exchange Limited through issue of 25 million ordinary shares of Rs.10/- each. Out of the total issue of 25 million ordinary shares, 18.750 million ordinary shares have been subscribed through book building process by high net worth individuals and institutional investors and 6.250 million ordinary shares have been subscribed by the general public through initial public offering.
1.3 As of the balance sheet date, the Company owns 51% shares in its subsidiary namely, Al Shaheer Farms (Private) Limited (the subsidiary company).
1.4 These condensed interim financial statements are the separate condensed interim financial statements of the Company in which the investment in the above mentioned subsidiary has been accounted for at cost less accumulated impairment losses, if any.
2. STATEMENT OF COMPLIANCE
These condensed interim financial statements of the Company for the six months period ended December 31, 2015 have been prepared in accordance with the requirements of the International Accounting Standard 34 - Interim Financial Reporting and provisions of and directives issued under the Companies Ordinance, 1984. In case where requirements differ, the provisions of or directives issued under the Companies Ordinance, 1984
have been followed.
3. BASIS OF PREPARATION
3.1 These condensed interim financial statements are un-audited but subject to limited scope review by the auditors and are being submitted to the shareholders as required under Section 245 of the Company Ordinance, 1984. These condensed interim financial statements do not include all the information and disclosures required in the annual financial statements, and should be read in conjunction with the financial statements (unconsolidated) of the Company for the year ended June 30, 2015.
3.2 The figures of the condensed interim profit and loss account for the quarter ended December 31, 2015 and December 31, 2014 and notes forming part thereof have not been reviewed / audited by the auditors of the Company, as they have reviewed and audited the cumulative figures for the half year ended December 31, 2015 and December 31, 2014, respectively.
4. SIGNIFICANT ACCOUNTING POLICIES The accounting policies and the methods of computation adopted in the preparation of these condensed interim
financial statements are the same as those applied in the preparation of the annual financial statements (unconsolidated) for the year ended June 30, 2015, except for the adoption of the following new standards and
accounting policy for investments:
4.1 New standards
The Company has adopted the following new standards which became effective for the current period:
IFRS 10 – Consolidated Financial Statements IFRS 11 – Joint Arrangements IFRS 12 – Disclosure of Interests in Other Entities IFRS 13 – Fair Value Measurement
Notes to the Condensed Interim Financial Statements (Un-audited)FOR THE HALF YEAR ENDED 31 DECEMBER 2015

Half Yearly Report 201513
(Rupees)Note
31 December, 2015(Un-audited)
30 June, 2015(Audited)
Operating fixed assets 5.1 1,079,513,005 707,398,013 Capital work-in-progress 5.2 921,280,495 434,672,703
2,000,793,500 1,142,070,716
5.1 The movement in operating fixed assets during the period / year are as follows:
Opening balance 707,398,013 723,386,111 Additions during the period / year 5.1.1 454,452,430 74,858,862 1,161,850,443 798,244,973 Disposals during the period / year (WDV) (33,527,488 ) (3,187,560 ) Depreciation charge for the period / year (48,809,950 ) (87,659,400 ) (82,337,438 ) (90,846,960 ) Operating fixed assets (WDV) 1,079,513,005 707,398,013
5.1.1 Additions including transfers during the period / year Freehold land 408,460,500 - - Building 1,792,780 2,433,038 Plant and machinery 5,478,175 16,666,336 Furniture and fittings 5,182,689 12,639,678 Motor vehicles 16,367,174 13,955,086 Office equipment 10,989,663 26,622,521 Tools and equipment 1,453,684 866,875 Computers and accessories 4,727,766 1,675,328 5.2 454,452,430 74,858,862
5. PROPERTY, PLANT AND EQUIPMENT
Notes to the Condensed Interim Financial Statements (Un-audited)FOR THE HALF YEAR ENDED 31 DECEMBER 2015
The adoption of the above new standards did not have any material effect on these condensed interim financial statements.
4.2 Investments - At fair value through profit or loss
An investment is classified at fair value through profit or loss if it is held for trading or is designated as such upon initial recognition. Financial instruments are classified as held for trading if they are acquired for the purpose of selling and repurchasing in near term. Held for trading assets are acquired principally for the purpose of generating a profit from short-term fluctuation in price. Financial instruments are designated at fair value through profit or loss if the Company manages such investments and makes sales and purchase decision based on their fair value in accordance with the Company’s investment strategy.
All investments classified as investments at fair value through profit or loss are initially measured at cost being fair value of consideration given. All transaction costs are recognised directly in profit and loss account. At subsequent dates these investments are measured at fair value, determined on the basis of prevailing market prices, with any resulting gain or loss recognised directly in the profit and loss account. These are classified as current and non-current assets in accordance with criteria set out by IFRSs.

Half Yearly Report 201514
5.2 Capital work-in-progress The movement In capital work-in-progress is as follows:
6. DEFERRED TAX ASSET
(Rupees)
Transfers to operating
fixed assetsClosing balance
Opening balance
Additions during the
period / year
Land 41,035,046 167,915,500 (170,415,500) 38,535,046 Civil works 4,512,276 2,213,267 - - 6,725,543 Equipment and machinery 212,205,065 181,815,067 - - 394,020,132 Advance to suppliers and contractors 161,215,486 305,079,458 - - 466,294,944 Intangible asset under development 15,704,830 - - - - 15,704,830
31 December 2015 – (Un-audited) 434,672,703 657,023,292 (170,415,500) 921,280,495
30 June 2015 – (Audited) 338,961,014 120,488,087 (24,776,398) 434,672,703
(Rupees)
31 December, 2015(Un-audited)
30 June, 2015(Audited)
Deferred tax assets on deductible temporary difference: - unabsorbed tax losses 102,438,059 76,170,512 - unused tax credits 1,666,634 1,666,634 - deferred liability – defined benefit plan 4,050,236 3,677,126 108,154,929 81,514,272 Deferred tax liabilities on taxable temporary difference: - accelerated tax depreciation on property, plant and equipment (8,588,727 ) (8,689,932 ) - surplus on revaluation of fixed assets (18,875,851 ) (21,207,361 ) (27,464,578 ) (29,897,293 ) 80,690,351 51,616,979
7. STOCK-IN-TRADE Livestock 100,599,275 9,686,672 Finished goods 34,755,172 21,492,407 135,354,447 31,179,079
Notes to the Condensed Interim Financial Statements (Un-audited)FOR THE HALF YEAR ENDED 31 DECEMBER 2015

Half Yearly Report 201515
10.1 Included herein receivable from shareholders on account of tax on bonus shares issued during the period/ year (note 12.2).
10.2 Included herein Rs. 21.486 million (30 June 2015: Nil) receivables from Al Shaheer Farms (Private) Limited (the subsidiary company).
11. ISSUED, SUBSCRIBED AND PAID-UP CAPITAL
11.1 During the period, the Company enlisted on Pakistan Stock Exchange Limited through issue of 25 million ordinary shares having face value of Rs. 10/- at a premium of Rs. 85/- each as disclosed in note 1.2 to these condensed interim financial statements.
11.2 During the period, the Company has issued 32,039,356 ordinary shares (30 June 2015: 35,600,341 ordinary shares) of Rs. 10/- each as bonus shares. Out of the total bonus issue of Rs. 320.394 million (30 June 2015: Rs. 356.003 million), shares of Rs. 320.394 million (30 June 2015: Rs. 300.202 million) were issued from the share premium account and the remaining Rs. Nil (30 June 2015: Rs. 55.801 million) were transferred from unappropriated profit.
8. TRADE DEBTS - unsecured
(Rupees)Note
31 December, 2015(Un-audited)
30 June, 2015(Audited)
Notes to the Condensed Interim Financial Statements (Un-audited)FOR THE HALF YEAR ENDED 31 DECEMBER 2015
Considered good Overseas 483,125,936 358,549,297 Local 220,002,873 168,796,507 703,128,809 527,345,804 Considered doubtful Overseas 1,030,596 15,331,482 Local - - 7,145,385 1,030,596 22,476,866 Less: Provision for doubtful debts 8.1 1,030,596 22,476,866 703,128,809 527,345,8048.1 Provision for doubtful debts Opening balance 22,476,866 - - Provision for the period / year 1,030,596 22,476,866 Reversal during the period / year (22,476,866) - - Closing balance 1,030,596 22,476,866
9. SHORT-TERM INVESTMENTS
Investments at fair value through profit or loss: Held for trading - listed shares 228,863,374 - - Investments designated at fair value through profit or loss - mutual funds 399,567,492 - - 628,430,866 - -10. OTHER RECEIVABLES Unsecured, considered good Sales tax receivables 67,820,933 33,286,920 Others 10.1 & 10.2 144,780,656 128,499,966 212,601,589 161,786,886

Half Yearly Report 201516
12. TRADE AND OTHER PAYABLES
(Rupees)Note
31 December, 2015(Un-audited)
30 June, 2015(Audited)
Notes to the Condensed Interim Financial Statements (Un-audited)FOR THE HALF YEAR ENDED 31 DECEMBER 2015
Creditors Trade 222,123,119 157,399,455 Non-trade 16,878,246 54,306,242 239,001,365 211,705,697 Murabaha 12.1 257,427,263 888,279,667 Accrued liabilities 14,490,279 20,646,661 Advance from customers 19,410,037 27,219,267 Witholding tax payable 12.2 38,419,292 37,927,950 Workers' Profits Participation Fund 12.3 12,901,065 8,048,661 Workers' Welfare Fund 9,266,132 5,398,803 Payable against purchase of capital work-in-progress 15,980,686 43,100,419 Retention money 2,520,196 10,000,000 Other payables 62,325,378 10,339,799 671,741,693 1,262,666,924
12.1 There are no major changes in the terms and condition of murabaha arrangements as disclosed in the annual financial statements (unconsolidated) of the Company for the year ended 30 June 2015.
12.2 Included herein withholding tax payable on bonus shares (note 11.1) and purchases amounting to Rs. 24.794 million and Rs. 11.183 million (30 June 2015: Rs. 17.800 million and Rs. 11.183 million) respectively.
(Rupees)
31 December, 2015(Un-audited)
30 June, 2015(Audited)
12.3 Workers' Profits Participation Fund (WPPF)
As at 01 July 8,048,661 11,261,709 Charge for the period / year 9,193,065 8,048,661 Payments during the period / year (4,340,661 ) (11,261,709 ) As at 31 December 12,901,065 8,048,661
13. DUE TO A RELATED PARTY
Represents interest free unsecured loan obtained from the Company's Chief Executive and which is repayable on demand.
14. CONTINGENCIES AND COMMITMENTS
There are no major changes in the status of contingencies and commitments as reported in the annual financial statements (unconsolidated) of the Company for the year ended 30 June 2015.
Half Yearly Report 201517
(Rupees)
Half year ended Quarter ended31 December,
2015(Un-audited)
31 December,2014
(Un-audited)
31 December, 2015
(Un-audited)
31 December,2014
(Audited)
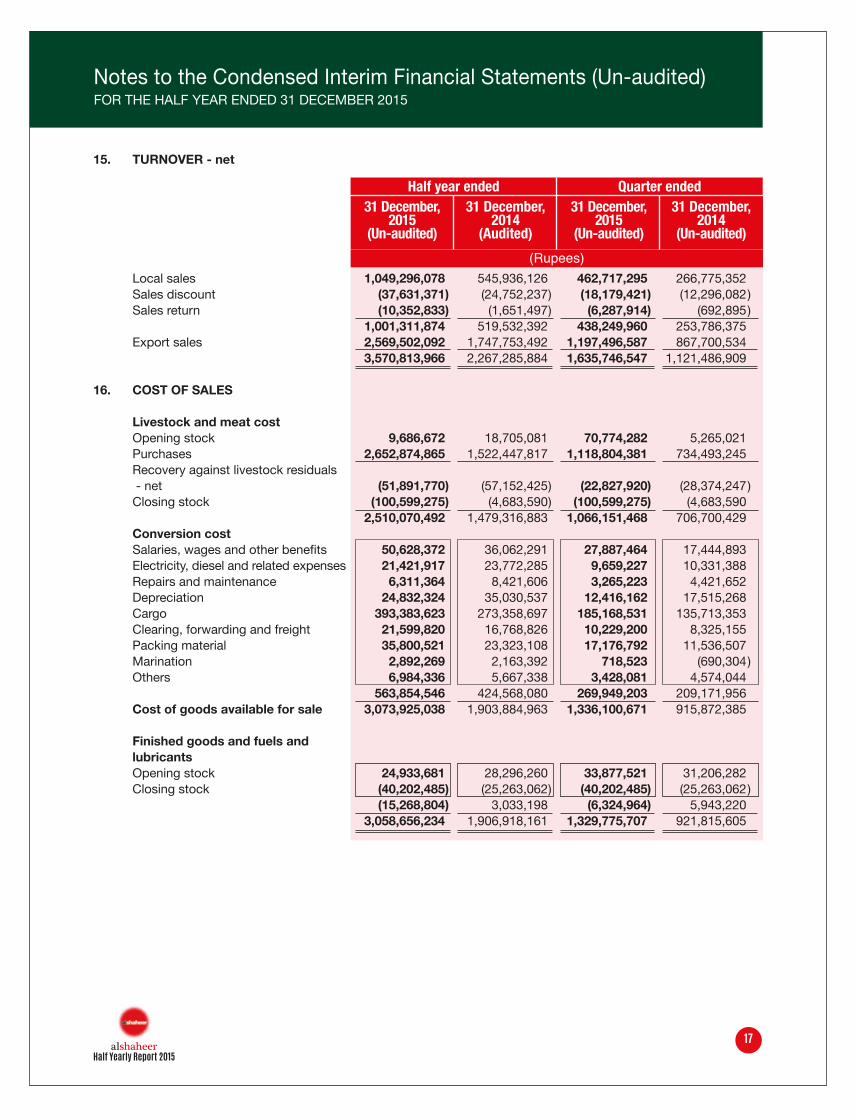
Local sales 1,049,296,078 545,936,126 462,717,295 266,775,352 Sales discount (37,631,371 ) (24,752,237 ) (18,179,421 ) (12,296,082 ) Sales return (10,352,833 ) (1,651,497 ) (6,287,914 ) (692,895 ) 1,001,311,874 519,532,392 438,249,960 253,786,375 Export sales 2,569,502,092 1,747,753,492 1,197,496,587 867,700,534 3,570,813,966 2,267,285,884 1,635,746,547 1,121,486,909
16. COST OF SALES Livestock and meat cost Opening stock 9,686,672 18,705,081 70,774,282 5,265,021 Purchases 2,652,874,865 1,522,447,817 1,118,804,381 734,493,245 Recovery against livestock residuals - net (51,891,770 ) (57,152,425 ) (22,827,920 ) (28,374,247 ) Closing stock (100,599,275 ) (4,683,590 ) (100,599,275 ) (4,683,590 2,510,070,492 1,479,316,883 1,066,151,468 706,700,429 Conversion cost Salaries, wages and other benefits 50,628,372 36,062,291 27,887,464 17,444,893 Electricity, diesel and related expenses 21,421,917 23,772,285 9,659,227 10,331,388 Repairs and maintenance 6,311,364 8,421,606 3,265,223 4,421,652 Depreciation 24,832,324 35,030,537 12,416,162 17,515,268 Cargo 393,383,623 273,358,697 185,168,531 135,713,353 Clearing, forwarding and freight 21,599,820 16,768,826 10,229,200 8,325,155 Packing material 35,800,521 23,323,108 17,176,792 11,536,507 Marination 2,892,269 2,163,392 718,523 (690,304 ) Others 6,984,336 5,667,338 3,428,081 4,574,044 563,854,546 424,568,080 269,949,203 209,171,956 Cost of goods available for sale 3,073,925,038 1,903,884,963 1,336,100,671 915,872,385 Finished goods and fuels and lubricants Opening stock 24,933,681 28,296,260 33,877,521 31,206,282 Closing stock (40,202,485 ) (25,263,062 ) (40,202,485 ) (25,263,062 ) (15,268,804 ) 3,033,198 (6,324,964 ) 5,943,220 3,058,656,234 1,906,918,161 1,329,775,707 921,815,605
Notes to the Condensed Interim Financial Statements (Un-audited)FOR THE HALF YEAR ENDED 31 DECEMBER 2015
15. TURNOVER - net

Half Yearly Report 201518
17. ADMINISTRATIVE AND DISTRIBUTION EXPENSES
Included herein salaries, wages and other benefits, repairs and maintenance, marketing and advertisement, rent, rates and taxes and depreciation of Rs. 96.806 million, Rs. 8.160 million, Rs. 35.662 million, Rs. 52.253 million and Rs. 23.978 million (31 December 2014: Rs. 67.746 million, Rs. 0.513 million, Rs. 26.025 million, Rs. 41.698 million and Rs. 7.775 million), respectively.
18. OTHER EXPENSES
Included herein unrealized loss on short-term investments at fair value through profit or loss and WPPF of Rs. 14.804 million and Rs. 9.193 million (31 December 2014: Rs. Nil and Rs. 5.828 million), respectively.
19. OTHER INCOME
Included herein reversal of provision for doubtful debts, gain on disposal of property, plant and equipment, mark-up on saving account and dividend income of Rs. 21.446 million, Rs. 10.773, Rs. 4.504 million and Rs. 6.488 million (31 December 2014: Rs. Nil, Rs. Nil, Rs. Nil and Rs. Nil), respectively.
(Rupees)
Half year ended Quarter ended31 December,
2015(Un-audited)
31 December,2014
(Un-audited)
31 December, 2015
(Un-audited)
31 December,2014
(Audited)
Current (19,864,092 ) (13,825,389 ) (11,730,870 ) (6,163,133) Prior - - 59,184 - - - - Deferred 22,158,371 31,770,352 17,543,182 16,272,619 2,294,279 18,004,147 5,812,312 10,109,48621. EARNINGS PER SHARE - basic and diluted Profit for the period 173,469,141 115,571,119 100,839,501 65,459,086 (Restated) (Restated) Weighted average number of ordinary shares of Rs. 10/- each – basic 117,107,769 74,560,185 117,107,769 74,560,185 Weighted average number of ordinary shares of Rs. 10/- each – diluted 120,224,207 74,560,185 120,224,207 74,560,185 (Restated) (Restated) Earnings per share – basic (Rupees) 1.48 1.55 0.86 0.88 Earnings per share – diluted 1.44 1.55 0.84 0.88 (Rupees) 21.1 During the current period, the Company has issued 35% bonus as stated in note 11.2 to these condensed interim financial statements, which has resulted in restatement of basic and diluted earnings per share for the period ended 31 December 2014.
20. TAXATION
Notes to the Condensed Interim Financial Statements (Un-audited)FOR THE HALF YEAR ENDED 31 DECEMBER 2015

Half Yearly Report 201519
22. CASH AND CASH EQUIVALENTS
(Rupees)
31 December, 2015(Un-audited)
31 December, 2014(Audited)
Notes to the Condensed Interim Financial Statements (Un-audited)FOR THE HALF YEAR ENDED 31 DECEMBER 2015
Cash and bank balances 56,621,014 20,964,951 Book overdraft (28,590,393 ) (73,411,161 ) 28,030,621 (52,446,210 )
23. TRANSACTIONS WITH RELATED PARTIES
The related parties include group companies, retirement benefit funds, companies where directors also hold directorship, directors and key management personnel. The related party status of outstanding balances as at 31 December 2015 and 30 June 2015 are disclosed in respective notes to these condensed interim financial statements, wherever applicable. Transactions with related parties other than those disclosed elsewhere in these condensed interim financial statements are as follows:
(Rupees)
Half year ended31 December,
2015(Un-audited)
31 December,2014
(Audited)
Nature of transactions Existing shareholders Issue of right shares - - 2,014,754 Issue of bonus shares 12,005,781 - - Subsidiary company Payments made on behalf of the subsidiary Company 21,486,925 - - Key management personal Remuneration and benefits 1,005,000 675,000
Half Yearly Report 201520
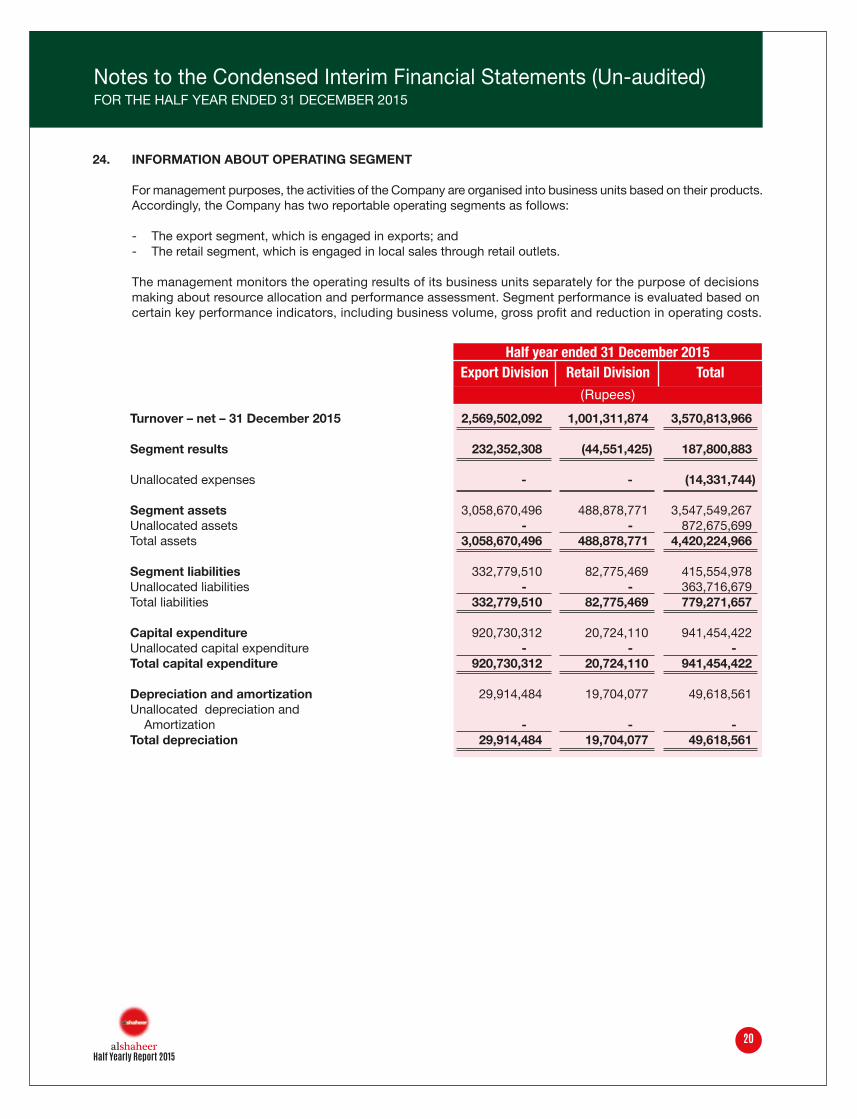
24. INFORMATION ABOUT OPERATING SEGMENT
For management purposes, the activities of the Company are organised into business units based on their products. Accordingly, the Company has two reportable operating segments as follows:
- The export segment, which is engaged in exports; and - The retail segment, which is engaged in local sales through retail outlets.
The management monitors the operating results of its business units separately for the purpose of decisions making about resource allocation and performance assessment. Segment performance is evaluated based on certain key performance indicators, including business volume, gross profit and reduction in operating costs.
Notes to the Condensed Interim Financial Statements (Un-audited)FOR THE HALF YEAR ENDED 31 DECEMBER 2015
(Rupees)
Half year ended 31 December 2015Retail Division TotalExport Division
Turnover – net – 31 December 2015 2,569,502,092 1,001,311,874 3,570,813,966
Segment results 232,352,308 (44,551,425 ) 187,800,883 Unallocated expenses - - - - (14,331,744 )
Segment assets 3,058,670,496 488,878,771 3,547,549,267 Unallocated assets - - - - 872,675,699 Total assets 3,058,670,496 488,878,771 4,420,224,966 Segment liabilities 332,779,510 82,775,469 415,554,978 Unallocated liabilities - - - - 363,716,679 Total liabilities 332,779,510 82,775,469 779,271,657 Capital expenditure 920,730,312 20,724,110 941,454,422 Unallocated capital expenditure - - - - - - Total capital expenditure 920,730,312 20,724,110 941,454,422
Depreciation and amortization 29,914,484 19,704,077 49,618,561 Unallocated depreciation and Amortization - - - - - - Total depreciation 29,914,484 19,704,077 49,618,561

Half Yearly Report 201521
Non-current assets of the Company are confined within Pakistan and consist of property, plant and equipment, intangible assets, long-term investment and deposit.
No customer of the Company constitutes more than 10% of the Company's total revenue related to aforesaid segments.
Segment assets and liabilities
Segment assets include all operating assets by a segment and consist principally of property, plant and equipment, stock-in-trade and trade debts. Segment liabilities include all operating liabilities and consist principally of trade and other payables.
Administrative costs, distribution costs (excluding cartage and freight), other income, finance costs, other expenses and taxation is managed on the Company basis and are not allocated to operating segments.
25. DATE OF AUTHORISATION OF ISSUE
These condensed interim financial statements were authorised for issue on February 29, 2016 by the Board of Directors of the Company.
26. GENERAL
26.1 Corresponding figures have been reclassified for the purpose of better presentation and comparison, wherever necessary and in line with reclassification reported in the annual financial statements (unconsolidated) of the Company for the year ended 30 June 2015. However, there are no material reclassifications to report.
26.2 All figures have been rounded off to the nearest rupee, unless otherwise stated.
Chief Executive Director
Notes to the Condensed Interim Financial Statements (Un-audited)FOR THE HALF YEAR ENDED 31 DECEMBER 2015

Statements2015
Consolidated Financial

Chief Executive Director
Consolidated Condensed Interim Balance SheetAS AT 31 DECEMBER 2015
(Rupees)Note
31 December, 2015(Un-audited)
30 June, 2015(Audited)
ASSETSNON-CURRENT ASSETS Property, plant and equipment 5 2,063,418,191 1,204,341,076 Intangible assets 2,321,925 2,736,336 2,065,740,116 1,207,077,412 Long-term deposits 26,702,993 13,400,000 Deferred tax asset 6 80,690,350 51,616,979 2,173,133,459 1,272,094,391 CURRENT ASSETS Fuels and lubricants 5,447,313 3,441,275 Stock-in-trade 7 135,354,447 31,179,078 Trade debts 8 703,128,809 527,345,804 Loans and advances 491,116,216 548,655,502 Short-term deposits and prepayments 34,151,752 21,500,540 Short-term investments 9 628,430,866 - - Other receivables 10 191,500,860 161,786,886 Taxation - net 52,965,205 28,428,346 Cash and bank balances 31,334,952 1,812,353,955 2,273,430,419 3,134,691,386 TOTAL ASSETS 4,446,563,878 4,406,785,777
EQUITY AND LIABILITIESSHARE CAPITAL AND RESERVESAuthorised capital150,000,000 (2014: 50,000,000) ordinary 1,500,000,000 1,500,000,000 shares of Rs. 10/- eachIssued, subscribed and paid-up capital 11 1,235,803,720 665,410,160 Capital reserves - share premium 1,692,697,322 - - Revenue reserves - unappropriated profit 507,121,050 284,073,808 Non-controlling interest 30,259,247 32,874,146 3,465,881,340 982,358,114Advance against issue of shares - - 1,781,250,000 Surplus on revaluation of fixed assets 201,125,534 216,302,218 NON-CURRENT LIABILITIES Long-term financing 21,488,156 36,072,965 Deferred liabilities 17,570,274 18,054,096 39,058,430 54,127,061CURRENT LIABILITIES Trade and other payables 12 672,027,041 1,262,866,924 Accrued mark-up 1,470,476 16,912,936 Current portion of long-term financing 59,381,778 77,684,637 Due to a related party 13 7,619,283 15,283,889 740,498,578 1,372,748,386 TOTAL EQUITY AND LIABILITIES 4,446,563,882 4,406,785,779CONTINGENCIES AND COMMITMENTS 14 The annexed notes 1 to 26 form an integral part of these financial statements.
Half Yearly Report 201523

Chief Executive Director
Consolidated Condensed Interim Profit and Loss Account FOR THE HALF YEAR ENDED 31 DECEMBER 2015
Note (Rupees)
Half year ended Quarter ended31 December
2015(Un-audited)
31 December2014
(Audited)
31 December, 2015
(Un-audited)
31 December2014
(Audited)
Turnover - net 15 3,570,813,966 2,267,285,884 1,635,746,547 1,121,486,909 Cost of sales 16 (3,058,656,234) (1,906,918,161) (1,329,775,707) (921,815,603) Gross profit 512,157,732 360,367,723 305,970,840 199,671,306 Administration and distribution expenses 17 (334,601,225) (222,009,038) (187,112,745) (120,570,509)Other expenses 18 (29,184,660) (7,932,228) (27,490,348) (9,630,361) (363,785,885) (229,941,266) (214,603,093) (130,200,870) Operating profit 148,371,847 130,426,457 91,367,747 69,470,436 Other income 19 49,843,188 10,871,189 9,000,609 5,568,170 Finance costs (32,376,701) (43,730,674) (9,972,896) (19,689,005) Profit before taxation 165,838,333 97,566,972 90,395,460 55,349,600 Taxation 20 2,294,279 18,004,147 5,812,312 10,109,486
Profit for the period 168,132,612 115,571,119 96,207,772 65,459,086
Attributable to: Owners of the Holding Company 170,747,510 115,571,11 9 98,477,319 65,459,086 Non-controlling interests (2,614,899 ) - - (2,269,547 ) - - 168,132,612 115,571,119 96,207,772 65,459,086
Earnings per share – Basic 21 1.44 1.55 0.82 0.88
Earnings per share – Diluted 21 1.40 1.55 0.80 0.88
The annexed notes 1 to 26 form an integral part of these financial statements.
Half Yearly Report 201524

Chief Executive Director
Consolidated Condensed Interim Statement of Comprehensive IncomeFOR THE HALF YEAR ENDED 31 DECEMBER 2015
(Rupees)
Half year ended Quarter ended31 December,
2015(Un-audited)
31 December,2014
(Audited)
31 December, 2015
(Un-audited)
31 December,2014
(Audited)
Profit for the period 168,132,612 115,571,119 96,207,772 65,459,086Other comprehensive income: Other comprehensive income not to be reclassified to profit and loss account in subsequent periods: Effect of change in tax rate applied to previously recognized re-measurement gain on defined benefit plan 1,850 - - - - - - Other comprehensive income for the period,net of tax 1,850 - - - - - - Total comprehensive income for the period 168,134,462 115,571,119 96,207,772 65,459,086
Attributable to: Owners of the Holding Company 170,749,360 115,571,11 9 98,477,319 65,459,086 Non-controlling interests (2,614,899) - - (2,269,547) - -
168,134,462 115,571,119 96,207,772 65,459,086
The annexed notes 1 to 26 form an integral part of these financial statements.
Half Yearly Report 201525

Chief Executive Director
Consolidated Condensed Interim Cash Flow StatementFOR THE HALF YEAR ENDED 31 DECEMBER 2015
Note (Rupees)
31 December, 2015(Un-audited)
31 December, 2014(Audited)
CASH FLOWS FROM OPERATING ACTIVITIES
Profit before taxation 165,838,333 97,566,972 Adjustments for: Depreciation 48,809,950 42,805,425 Amortisation 808,611 2,387,521 Gain on disposal of property, plant and equipment (10,773,137) 46,890 Reversal Provision for Doubtful Debts (21,446,270) - - Amortization of deferred loss on Ijarah - - - - Unrealised loss on short-term investments 14,803,691 Workers’ Profits Participation Fund (WPPF) 9,193,065 5,828,523 Workers’ Welfare Fund 3,493,365 1,991,163 Gratuity 4,273,378 3,608,507 Finance costs 32,376,701 43,730,674 81,539,354 100,398,703 Operating profit before working capital changes 247,377,686 197,965,675 Decrease / (increase) in current assets: Fuels and lubricants (2,006,038) - - Stock-in-trade (104,175,369) 17,054,688 Trade debts (154,336,736) 88,264,786 Loans and advances 57,539,286 (144,594,733) Short-term deposits and prepayments (12,651,212) (1,063,548) Other receivables (29,713,974) (16,684,414) (245,344,042) (57,023,221) Increase / (decrease) in current liabilities: Trade and other payables (599,559,615) 48,117,469 Due to a related party (7,664,606) (79,298,143) Cash flows generated from operations (605,190,577) 109,761,780 Long-term deposit - net (13,302,993) (2,108,999) Taxes paid (44,400,950) (18,423,839) Gratuity paid (4,757,200) (478,401) WPPF paid (4,340,661) - - WWF paid 373,964 - - Net cash flows generated from operating activities (671,618,417) 88,750,541 CASH FLOWS FROM INVESTING ACTIVITIES Addition to: - property, plant and equipment (284,391,264) (35,514,554) - capital work-in-progress (657,023,292) (46,103,020) - intangible assets (394,200) (165,200) Sale proceeds from disposal of property, plant and equipment 44,300,625 4,340,351 Short term investment (643,234,557) - - Net cash flows used in investing activities (1,540,742,688) (77,442,423) CASH FLOWS FROM FINANCING ACTIVITIES Proceeds from issue of shares 593,750,000 190,088,895 Advance against issue of shares - net - - (211,470,679) Share issue cost paid (81,701,071) - - Long-term financing - net (32,887,668) (12,662,829) Finance costs paid (47,819,161) (46,549,642) Net cash flows generated from financing activities 431,342,100 (80,594,255) Net increase in cash and cash equivalents (1,781,019,005) (69,286,137) Cash and cash equivalents at the beginning of the year 1,812,353,955 16,839,927 Cash and cash equivalents at the end of the year 22 31,334,950 (52,446,210)The annexed notes 1 to 26 form an integral part of these financial statements.
Half year ended
Half Yearly Report 201526

(Rupees)
Revenuereserve
Unappropr-iated profit
Non-controlling interests
Total Issued,
subscribedand paid-up
capital
Capitalreserves Share
premium
Consolidated Condensed Interim Statement of Changes In EquityAS AT DEtCEMBER 2015
Chief Executive Director
Balance as at 01 July 2014 260,015,000 - - 155,959,348 - - 415,974,348 Profit for the period - - - - 115,571,119 - - 115,571,119 Other comprehensive income for the period net of tax - - - - - - - - - - Total comprehensive income for the period - - - - 115,571,119 - - 115,571,119 Issue of 2,745,759 right shares at premium of Rs. 59.23 per share 27,457,590 162,631,306 - - - - 190,088,896 Surplus on revaluation of fixed assets realised on account of incremental depreciation charged on related assets, net of deferred tax - - - - 12,935,704 - - 12,935,704 Balance as at 31 December 2014 287,472,590 162,631,306 284,466,171 - - 734,570,067 Profit for the year - - - - 81,314,410 81,314,410 Other comprehensive income for the year, net of tax - - - - 125,773 125,773 Total comprehensive income for the year - - - - 81,440,183 81,440,183 Issue of right shares (note 15.1) 2,193,416 shares at premium of Rs. 62.72 per share 21,934,160 137,571,052 - - 159,505,212
Issue of 35,600,341 bonus shares at 115.06% (note 15.2) 356,003,410 (300,202,358) (55,801,052) - - Surplus on revaluation of fixed assets realised on account of incremental depreciation charged on related assets, net of deferred tax - - - - 12,573,755 12,573,755 Share Issue Costs, net of deferred tax (note 1.2 & note 16) (37,121,198) (37,121,198) As at 30 June 2015 665,410,160 - - 284,073,808 32,874,146 982,358,114 Profit for the period - - - - 170,747,510 (2,614,899) 168,132,612 Other comprehensive income for the year, net of tax - - - - 1,850 1,850 Total comprehensive income for the period - - - - 170,749,360 (2,614,899) 168,134,462 Issue of 25,000,000 ordinary shares at premium of Rs.85 per share (notes 1.2 & 11.1) 250,000,000 2,125,000,000 - - - - 2,375,000,000 Issue of 32,039,356 bonus shares at 35% (note 11.2) 320,393,560 (320,393,560) - - - - - - Surplus on revaluation of fixed assets realised on account of incremental depreciation charged on related assets, net of deferred tax - - - - 15,176,683 - - 15,176,683 Share issue costs, net of deferred tax - - (74,787,920) - - - - (74,787,920) Transfer of share issue costs, net of deferred Tax - - (37,121,198) 37,121,198 - - - - Balance as at 31 December 2015 1,235,803,720 1,692,697,322 507,121,050 30,259,247 3,465,881,340
The annexed notes 1 to 26 form an integral part of these financial statements.
Half Yearly Report 201527
1. LEGAL STATUS AND OPERATIONS
The Group consists of Al Shaheer Corporation Limited (the Holding Company) and its subsidiary company Al Shaheer Farms (Private) Limited (the Subsidiary Company) that have been consolidated in these consolidated financial statements. Brief profiles of the Holding Company and its Subsidiary Company are as follows:
1.1 the Holding Company Al Shaheer Corporation Limited (the Holding Company) was incorporated as a private limited company in
Pakistan on 30 June 2012 under the Companies Ordinance, 1984. The Holding Company was formed as result of amalgamation of two firms having common partners namely, 'Al Shaheer Corporation' and 'MeatOne', which stands as merged on 30 June 2012 and the Company commenced its operations from 01 July 2012 by continuing homogenous line of business of said firms. During the year, the Holding Company changed its legal status from private limited company to public limited company and accordingly, the name of the Holding Company changed to Al Shaheer Corporation Limited. The registered office of the Holding Company is situated at Suite No. G/5/5, 3rd floor, Mansoor Tower, Block-8, Shahrah-e-Roomi, Clifton, Karachi. The Holding Company is engaged in trading of different kinds of Halal meat including goat, cow, chicken and fish, both for export market and local sales through chain of retail stores.
On 24 August 2015, the Holding Company enlisted on Karachi, Lahore and Islamabad stock exchanges through issue of 25 million ordinary shares of Rs.10/- each. Out of the total issue of 25 million ordinary shares, 18.750 million ordinary shares have been subscribed through book building process by high net worth individuals and institutional investors and 6.250 million ordinary shares have been subscribed by the general public through
initial public offering. 1.2 the Subsidiary Company
The Subsidiary Company was incorporated in Pakistan as a private limited company on 02 March 2015 under the Companies Ordinance, 1984. The principal activity of the Subsidiary Company is to carry on all kinds of farming including agricultural, poultry, horticultural and dairy and to purchase, acquire, keep, maintain, breed, sell or otherwise dispose of all kinds of cattle and other form of live stocks. The registered office of the Subsidiary Company is situated at Suite No. G/5/5, 3rd Floor, Mansoor Tower, Block-8, Shahrah-e-Roomi, Clifton, Karachi, Pakistan. As of the balance sheet date, the Holding Company has 51% shareholding in the Subsidiary Company.
1.3 These consolidated condensed interim financial statements are the separate consolidated condensed interim financial statements of the Company in which the investment in the above mentioned subsidiary has been accounted for at cost less accumulated impairment losses, if any.
2. STATEMENT OF COMPLIANCE These consolidated financial statements have been prepared in accordance with the approved accounting standards as applicable in Pakistan. Approved accounting standards comprise of such International Financial Reporting Standards (IFRSs) issued by the International Accounting Standard Board (IASB) and Islamic Financial Accounting standards (IFAS) issued by Institute of Chartered Accountant of Pakistan (ICAP) as are notified under the Companies Ordinance, 1984, provisions of and directives issued under the Companies Ordinance, 1984. In case requirements differ, the provisions or directives of the Companies Ordinance, 1984, shall prevail.
3. BASIS OF PREPARATION
3.1 These consolidated condensed interim financial statements are un-audited but subject to limited scope review by the auditors and are being submitted to the shareholders as required under Section 245 of the Company Ordinance, 1984. These consolidated condensed interim financial statements do not include all the information and disclosures required in the annual financial statements, and should be read in conjunction with the financial statements (unconsolidated) of the Company for the year ended June 30, 2015.
3.2 The figures of the consolidated condensed interim profit and loss account for the quarter ended December 31, 2015 and December 31, 2014 and notes forming part thereof have not been reviewed / audited by the auditors of the Company, as they have reviewed and audited the cumulative figures for the half year ended December 31, 2015 and December 31, 2014, respectively.
4. SIGNIFICANT ACCOUNTING POLICIES
The accounting policies and the methods of computation adopted in the preparation of these consolidated condensed interim financial statements are the same as those applied in the preparation of the annual financial statements (unconsolidated) for the year ended June 30, 2015, except for the adoption of the following new standards and accounting policy for investments:
Notes to the Consolidated Condensed Interim Financial Statements (Un-audited)FOR THE HALF YEAR ENDED 31 DECEMBER 2015
Half Yearly Report 201528

5. PROPERTY, PLANT AND EQUIPMENT
Notes to the Consolidated Condensed Interim Financial Statements (Un-audited)FOR THE HALF YEAR ENDED 31 DECEMBER 2015
4.1 New Standards
The Company has adopted the following new standards which became effective for the current period:
IFRS 10 – Consolidated Financial Statements IFRS 11 – Joint Arrangements IFRS 12 – Disclosure of Interests in Other Entities
IFRS 13 – Fair Value Measurement
The adoption of the above new standards did not have any material effect on these consolidated condensed interim financial statements.
4.2 Investments - At fair value through profit or loss
An investment is classified at fair value through profit or loss if it is held for trading or is designated as such upon initial recognition. Financial instruments are classified as held for trading if they are acquired for the purpose of selling and repurchasing in near term. Held for trading assets are acquired principally for the purpose of
generating a profit from short-term fluctuation in price. Financial instruments are designated at fair value through profit or loss if the Company manages such investments and makes sales and purchase decision based on their fair value in accordance with the Company’s investment strategy.
All investments classified as investments at fair value through profit or loss are initially measured at cost being fair value of consideration given. All transaction costs are recognised directly in profit and loss account. At subsequent dates these investments are measured at fair value, determined on the basis of prevailing market prices, with any resulting gain or loss recognised directly in the profit and loss account. These are classified as current and non-current assets in accordance with criteria set out by IFRSs.
(Rupees)Note
31 December, 2015(Un-audited)
30 June, 2015(Audited)
Operating fixed assets 5.1 1,142,137,696 707,398,013 Capital work-in-progress 5.2 921,280,495 496,943,063
2,063,418,191 1,204,341,076 5.1 The movement in operating fixed assets during the period / year are as follows:
Opening Balance 707,398,011 723,386,111 Additions during the period / year 5.1.1 517,077,124 74,858,862
1,224,475,134 798,244,973 Disposals during the period / year (WDV) (33,527,488 ) (3,187,560 ) Depreciation charge for the period / year (48,809,951 ) (87,659,400 )
(82,337,439 ) (90,846,960 ) Operating fixed assets (WDV) 1,142,137,696 707,398,013
5.1.1 Additions including transfers during the period / year
Freehold land 408,460,500 - - Building 62,205,775 2,433,038 Plant and machinery 5,478,175 16,666,336 Furniture and fittings 5,182,689 12,639,678 Motor vehicles 16,367,174 13,955,086 Office equipment 11,235,092 26,622,521 Tools and equipment 1,637,684 866,875 Computers and accessories 6,510,035 1,675,328
517,077,124 74,858,862
Half Yearly Report 201529

5.2 Capital work-in-progress The movement in capital work-in-progress is as follows:
6. DEFERRED TAX ASSET / (LIABILITY) - NET
Notes to the Consolidated Condensed Interim Financial Statements (Un-audited)FOR THE HALF YEAR ENDED 31 DECEMBER 2015
(Rupees)
Transfers to operating
fixed assetsClosing balance
Opening balance
Additions during the
period / year
Land 41,035,046 167,915,500 (170,415,500) 38,535,046 Civil works 4,512,276 2,213,267 - - 6,725,543 Equipment and machinery 214,293,599 181,815,067 (2,088,534) 394,020,132 Advance to suppliers and contractors 221,397,312 305,079,458 (60,181,826) 466,294,944 Intangible asset under development 15,704,830 - - - - 15,704,830 31 December 2015 496,943,063 657,023,292 (232,685,860) 921,280,495 30 June 2015 338,961,014 182,758,447 (24,776,398) 496,943,063
(Rupees)Note
31 December, 2015(Un-audited)
30 June, 2015(Audited)
Deferred tax assets on deductible temporary differences:
Unabsorbed tax losses and unused tax credits 102,438,059 76,170,512 Unused tax credits 1,666,634 1,666,634 Deferred liability – defined benefit plan 4,050,236 3,677,126 108,154,928 81,514,272 Deferred tax liabilities on taxable temporary differences:
accelerated tax depreciation on property, plant and equipment (8,588,727) (8,689,932) Surplus on revaluation of fixed assets (18,875,851) (21,207,361) (27,464,578) (29,897,293)
80,690,350 51,616,9797. STOCK-IN-TRADE
Livestock 100,599,275 9,686,672 Finished goods 34,755,172 21,492,405 135,354,447 31,179,078 8. TRADE DEBTS
Considered good Overseas 483,125,936 358,549,297 Local 220,002,873 168,796,507 703,128,809 527,345,804 Considered doubtful Overseas 1,030,596 15,331,482 Local - - 7,145,385 1,030,596 22,476,867 Less: Provision for doubtful debts 8.1 1,030,596 22,476,867 703,128,809 527,345,804 8.1 Provision for doubtful debts
Opening balance 22,476,866 - - Provision for the period / year 1,030,596 22,476,866 Reversal during the period / year (22,476,866 ) - - Closing balance 1,030,596 22,476,866
Half Yearly Report 201530
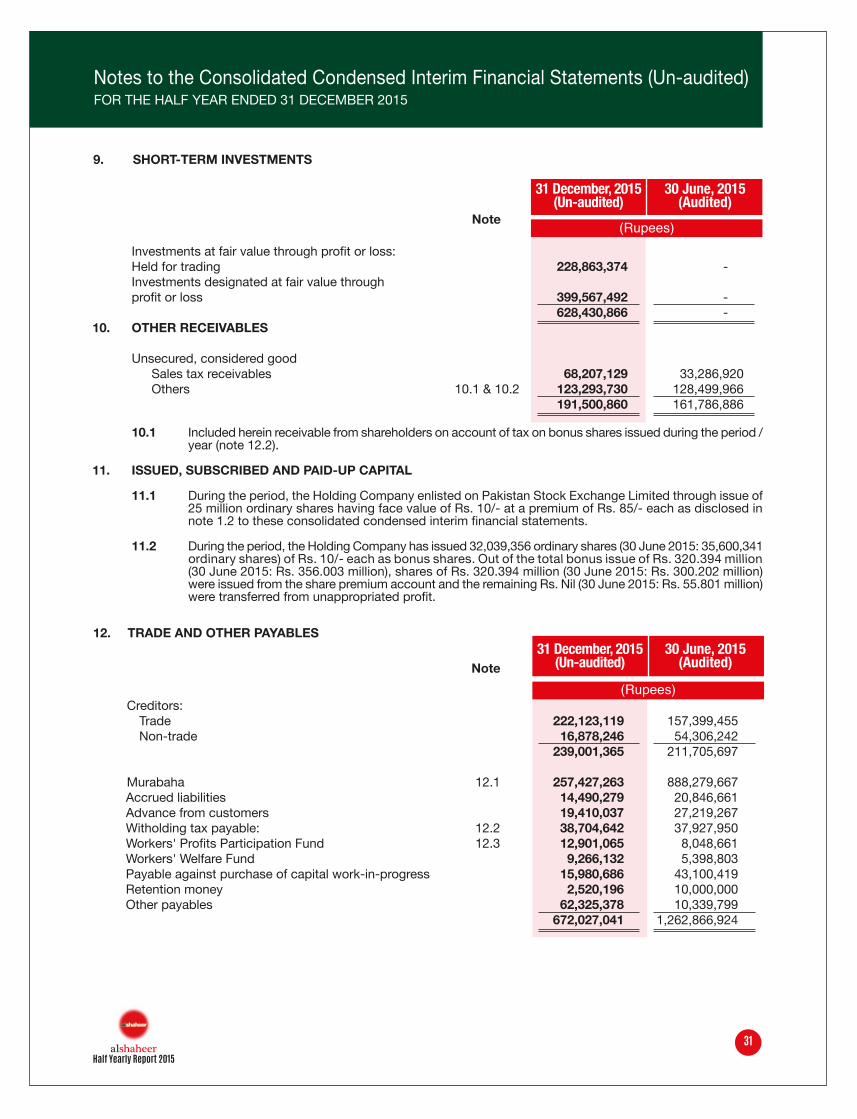
9. SHORT-TERM INVESTMENTS
(Rupees)Note
31 December, 2015(Un-audited)
30 June, 2015(Audited)
Notes to the Consolidated Condensed Interim Financial Statements (Un-audited)FOR THE HALF YEAR ENDED 31 DECEMBER 2015
Investments at fair value through profit or loss: Held for trading 228,863,374 - - Investments designated at fair value through profit or loss 399,567,492 - - 628,430,866 - - 10. OTHER RECEIVABLES
Unsecured, considered good Sales tax receivables 68,207,129 33,286,920 Others 10.1 & 10.2 123,293,730 128,499,966 191,500,860 161,786,886
10.1 Included herein receivable from shareholders on account of tax on bonus shares issued during the period / year (note 12.2).
11. ISSUED, SUBSCRIBED AND PAID-UP CAPITAL
11.1 During the period, the Holding Company enlisted on Pakistan Stock Exchange Limited through issue of 25 million ordinary shares having face value of Rs. 10/- at a premium of Rs. 85/- each as disclosed in note 1.2 to these consolidated condensed interim financial statements.
11.2 During the period, the Holding Company has issued 32,039,356 ordinary shares (30 June 2015: 35,600,341 ordinary shares) of Rs. 10/- each as bonus shares. Out of the total bonus issue of Rs. 320.394 million (30 June 2015: Rs. 356.003 million), shares of Rs. 320.394 million (30 June 2015: Rs. 300.202 million) were issued from the share premium account and the remaining Rs. Nil (30 June 2015: Rs. 55.801 million) were transferred from unappropriated profit.
(Rupees)Note
Creditors: Trade 222,123,119 157,399,455 Non-trade 16,878,246 54,306,242 239,001,365 211,705,697
Murabaha 12.1 257,427,263 888,279,667 Accrued liabilities 14,490,279 20,846,661 Advance from customers 19,410,037 27,219,267 Witholding tax payable: 12.2 38,704,642 37,927,950 Workers' Profits Participation Fund 12.3 12,901,065 8,048,661 Workers' Welfare Fund 9,266,132 5,398,803 Payable against purchase of capital work-in-progress 15,980,686 43,100,419 Retention money 2,520,196 10,000,000 Other payables 62,325,378 10,339,799 672,027,041 1,262,866,924
12. TRADE AND OTHER PAYABLES31 December, 2015
(Un-audited)30 June, 2015
(Audited)
Half Yearly Report 201531

12.3 Workers' Profits Participation Fund (WPPF)
(Rupees)
31 December, 2015(Un-audited)
30 June, 2015(Audited)
Notes to the Consolidated Condensed Interim Financial Statements (Un-audited)FOR THE HALF YEAR ENDED 31 DECEMBER 2015
As at 01 July 8,048,661 11,261,709 Charge for the year 3,493,365 8,048,661 WPPF paid during the year 1,359,039 (11,261,709)
12,901,065 8,048,661
13. DUE TO A RELATED PARTY
Represents interest free loan obtained from the Holding Company's Chief Executive at the time of incorporation of the Holding Company in 2012. The loan is unsecured and is repayable on demand.
14. CONTINGENCIES AND COMMITMENTS
There are no major changes in the status of contingencies and commitments as reported in the annual financial statements (unconsolidated) of the Holding Company for the year ended 30 June 2015.
12.1 There are no major changes in the terms and condition of murabaha arrangements as disclosed in the annual financial statements (unconsolidated) of the Holding Company for the year ended 30 June 2015.
12.2 Included herein withholding tax payable on bonus shares (note 11.1) and purchases amounting to Rs. 24.794 million and Rs. 11.183 million (30 June 2015: Rs. 17.800 million and Rs. 11.183 million) respectively.
Half Yearly Report 201532

Notes to the Consolidated Condensed Interim Financial Statements (Un-audited)FOR THE HALF YEAR ENDED 31 DECEMBER 2015
15. TURNOVER
(Rupees)
Half year ended Quarter ended31 December,
2015(Un-audited)
31 December,2014
(Un-audited)
31 December, 2015
(Un-audited)
31 December,2014
(Audited)
Local sales 1,049,296,078 545,936,126 462,717,295 266,775,352 Sales discount (37,631,371 ) (24,752,237 ) (18,179,421 ) (12,296,082 )
Sales return (10,352,833 ) (1,651,497 ) (6,287,914 ) (692,895 ) 1,001,311,874 519,532,392 438,249,959 253,786,375
Export sales 2,569,502,092 1,747,753,492 1,197,496,588 867,700,534
3,570,813,966 2,267,285,884 1,635,746,547 1,121,486,909
16. COST OF SALES
Livestock and meat cost Opening stock 9,686,672 18,705,081 70,774,282 5,265,021 Purchases 2,652,874,865 1,522,447,817 1,118,804,381 734,493,244 Recovery against livestock residuals-net (51,891,770 ) (57,152,425 ) (22,827,920 ) (28,374,247 ) Closing stock (100,599,275 ) (4,683,590 ) (100,599,275 ) (4,683,590 )
2,510,070,492 1,479,316,884 1,066,151,469 706,700,429 Conversion cost Salaries, wages and other benefits 50,628,372 36,062,291 27,887,464 17,444,893 Electricity, diesel and related expenses 21,421,917 23,772,285 9,659,227 10,331,388 Repairs and maintenance 6,311,364 8,421,606 3,265,223 4,421,652 Depreciation 24,832,324 35,030,537 12,416,162 17,515,268 Cargo 393,383,623 273,358,697 185,168,531 135,713,353 Clearing and forwarding 21,599,820 16,758,626 10,229,200 8,314,955 Freight - - 10,200 - - 10,200 Packing material 35,800,521 23,323,108 19,801,627 11,536,507 Livestock food - - - - (2,624,835) - -
Marination 2,892,269 2,163,392 718,523 (690,304 ) Miscellaneous 6,984,337 5,667,338 3,428,081 4,574,043
563,854,546 424,568,080 269,949,202 209,171,955
Cost of goods available for sale 3,073,925,038 1,903,884,964 1,336,100,671 915,872,384
Finished goods and fuels and lubricants Opening stock 24,933,681 28,296,260 33,877,521 31,206,282 Closing stock (40,202,485 ) (25,263,062 ) (40,202,485 ) (25,263,062 )
(15,268,804 ) 3,033,198 (6,324,964 ) 5,943,220 3,058,656,234 1,906,918,163 1,329,775,707 921,815,605
Half Yearly Report 201533

20. TAXATION
Notes to the Consolidated Condensed Interim Financial Statements (Un-audited)FOR THE HALF YEAR ENDED 31 DECEMBER 2015
17. ADMINISTRATIVE AND DISTRIBUTION EXPENSES
Included herein salaries, wages and other benefits, repairs and maintenance, marketing and advertisement, rent, rates and taxes and depreciation of Rs. 96.806 million, Rs. 8.160 million, Rs. 35.662 million, Rs. 52.253 million and Rs. 23.978 million (31 December 2014: Rs. 67.746 million, Rs. 0.513 million, Rs. 26.025 million, Rs. 41.698 million and Rs. 7.775 million), respectively.
18. OTHER EXPENSES
Included herein unrealised loss on short-term investments at fair value through profit or loss and WPPF of Rs. 14.804 million and Rs. 9.193 million (31 December 2014: Rs. Nil and Rs. 5.828 million), respectively.
19. OTHER INCOME Included herein reversal of provision for doubtful debts, gain on disposal of property, plant and equipment, mark-up
on saving account and dividend income of Rs. 21.446 million, Rs. 10.773 million, Rs. 4.504 million and Rs. 6.488 million (31 December 2014: Rs. Nil, Rs. Nil, Rs. Nil and Rs. Nil), respectively.
(Rupees)
Half year ended Quarter ended31 December,
2015(Un-audited)
31 December,2014
(Un-audited)
31 December, 2015
(Un-audited)
31 December,2014
(Audited)
Current (19,864,092 ) (13,825,389 ) (11,730,870 ) (6,163,133 ) Prior years - - 59,184 - - - - Deferred 22,158,371 31,770,352 17,543,182 16,272,619
2,294,279 18,004,147 5,812,312 10,109,486
21. EARNINGS PER SHARE - basic and diluted
Profit for the year after taxation (Rupees) 168,132,612 115,571,119 96,207,772 65,459,086 (Restated) (Restated) Weighted average number of ordinary shares of Rs. 10/- each - basic 117,107,769 74,560,185 117,107,769 74,560,185
Weighted average number of ordinary shares of Rs. 10/- each - diluted 120,224,207 74,560,185 120,224,207 74,560,185 (Restated) (Restated) Basic earnings per share (Rupees) 1.44 1.55 0.82 0.88 Diluted earnings per share (Rupees) 1.40 1.55 0.80 0.88
21.1 During the current period, the Holding Company has issued 35% bonus as stated in note 11.2 to these consolidated condensed interim financial statements, which has resulted in restatement of basic and diluted earnings per share for the period ended 31 December 2014.
Half Yearly Report 201534

Notes to the Consolidated Condensed Interim Financial Statements (Un-audited)FOR THE HALF YEAR ENDED 31 DECEMBER 2015
(Rupees)
31 December, 2015(Un-audited)
31 December, 2014(Audited)
(Rupees)
31 December, 2015(Un-audited)
30 June, 2015(Audited)
Cash and bank balances 59,925,345 20,964,951 Book overdraft (28,590,393 ) (73,411,161 )
31,334,952 (52,446,210 )
23. TRANSACTIONS WITH RELATED PARTIES
The related parties include group companies, retirement benefit funds, companies where directors also hold directorship, directors and key management personnel. The related party status of outstanding balances as at 31 December 2015 and 30 June 2015 are disclosed in respective notes to these consolidated condensed interim financial statements, wherever applicable. Transactions with related parties other than those disclosed elsewhere in these consolidated condensed interim financial statements are as follows:
22. CASH AND CASH EQUIVALENTS
Nature of transactions
Existing shareholders Issue of right shares - - 2,014,754 Issue of bonus shares 12,005,781 - -
Major shareholder of the Subsidiary Company (non-controlling interest) Payments made on behalf of the Group 21,486,925 - -
Key management personal Remuneration and benefits 1,005,000 675,000
24. INFORMATION ABOUT OPERATING SEGMENT
For management purposes, the activities of the Group are organized into business units based on their products. Accordingly, the Group has two reportable operating segments as follows:
- The export segment, which is engaged in exports; and - The retail segment, which is engaged in local sales through retail outlets.
The management monitors the operating results of its business units separately for the purpose of decisions making about resource allocation and performance assessment. Segment performance is evaluated based on certain key performance indicators, including business volume, gross profit and reduction in operating costs.
Half Yearly Report 201535

Chief Executive Director
(Rupees)
Half year ended 31 December 2015Retail Division TotalExport Division
Turnover - net 2,569,502,092 1,001,311,874 3,570,813,966
Segment results 232,352,308 (44,551,425) 187,800,883
Unallocated expenses / income - - - - (19,668,271)
Segment assets 3,058,670,496 488,878,771 3,547,549,267 Unallocated assets - - - - 899,014,611 Total assets 3,058,670,496 488,878,771 4,446,563,878
Segment liabilities 332,779,510 82,775,469 415,554,978 Unallocated liabilities - - - - 364,002,030 Total liabilities 332,779,510 82,775,469 779,557,008
Capital expenditure 921,084,646 20,724,110 941,808,756 Unallocated capital expenditure - - - - - - Total capital expenditure 921,084,646 20,724,110 941,808,756
Depreciation 29,914,484 19,704,077 49,618,561 Unallocated depreciation - - - - - - Total depreciation 29,914,484 19,704,077 49,618,561
Non-current assets of the Group are confined within Pakistan and consist of property, plant and equipment, intangible assets, long-term investments and deposits.
No customer of the Group constitutes more than 10% of the Group's total revenue related to aforesaid segments.
Segment assets and liabilities
Segment assets include all operating assets by a segment and consist principally of property, plant and equipment, stock-in-trade and trade debts. Segment liabilities include all operating liabilities and consist principally of trade and other payables.
Administrative costs, distribution costs (excluding cartage and freight), other income, finance costs, other expenses and taxation is managed on the Group basis and are not allocated to operating segments.
Notes to the Consolidated Condensed Interim Financial Statements (Un-audited)FOR THE HALF YEAR ENDED 31 DECEMBER 2015
25. DATE OF AUTHORISATION FOR ISSUE
These condensed interim financial statements were authorised for issue on February 29, 2016 by the Board of Directors of the Company.
26. GENERAL
26.1 Corresponding figures have been reclassified for the purpose of better presentation and comparison, wherever necessary and in line with reclassification reported in the annual financial statements
(unconsolidated) of the Company for the year ended 30 June 2015. However, there are no material reclassifications to report.
26.2 All figures have been rounded off to the nearest rupee, unless otherwise stated.
Half Yearly Report 201536