alabi, o. and turner, k. and smith, m. j. (2017) supply ...detailing hfc system inventories readily...
TRANSCRIPT

Alabi, O. and Turner, K. and Smith, M. J. (2017) Supply chain [Chapter 4].
In: The Economic Impact of Hydrogen and Fuel Cells in the UK. H2FC
SUPERGEN, London, pp. 43-69. ,
This version is available at https://strathprints.strath.ac.uk/60500/
Strathprints is designed to allow users to access the research output of the University of
Strathclyde. Unless otherwise explicitly stated on the manuscript, Copyright © and Moral Rights
for the papers on this site are retained by the individual authors and/or other copyright owners.
Please check the manuscript for details of any other licences that may have been applied. You
may not engage in further distribution of the material for any profitmaking activities or any
commercial gain. You may freely distribute both the url (https://strathprints.strath.ac.uk/) and the
content of this paper for research or private study, educational, or not-for-profit purposes without
prior permission or charge.
Any correspondence concerning this service should be sent to the Strathprints administrator:
The Strathprints institutional repository (https://strathprints.strath.ac.uk) is a digital archive of University of Strathclyde research
outputs. It has been developed to disseminate open access research outputs, expose data about those outputs, and enable the
management and persistent access to Strathclyde's intellectual output.

43Chapter 4 Supply chain
CHAPTER 4 SUPPLY CHAIN
44 A H2FC SUPERGEN White Paper
4.1 INTRODUCTION
The Supply Chain is critical to the establishment of a hydrogen fuel cell economy
and indeed offers immense beneit to the economy. A range of Lifecycle Analysis
studies conducted in EU FC Framework and EU FCH Joint Undertaking projects37
detailing HFC system inventories readily explains the widespread extent of potential
interest showing that the physical bulk of any fuel cell system or application does not
involve a great deal of new technology. Although the core fuel cell (or electrolysis)
stack is fundamental to the technology – the physical bulk of any system or applica-
tion is made up of regular engineering and fabricated components. And the greatest
proportion of cost and value in such systems is entrained in their overall design and
integration content (IP). For example in scoping out the prospects for a hydrogen ferry
being built and operated in Scotland, around 200 local supply chain companies were
identiied which could have an interest in such a development.38
It should be noted that different HFC companies have different commercial
strategies. Some may choose to develop and manufacture core HFC components,
such as fuel cell or electrolysis stacks, only. In that case the relative proportion of
in-house fabricated core HFC product content will be much higher than for those
producing complete systems. At some point however those core HFC elements will
have to be integrated into some form of complete system for the end user and this will
necessarily result in the purchase and use of non-core system elements. From a wider
macro-economic impact perspective therefore, it is valid to consider systems as a
whole and the type of overall systems’ bills of materials referred to above.
Non-core components are on the whole the same or very similar to those widely
employed in the electricity generation and gas supply industries – and hence the
electricity generation and gas supply industries make for the best economic proxies of
the impact that the deployment of HFC technology might have on the macro economy.
Both electricity generation and gas supply industries have relatively high economic
multipliers – meaning that additional investment in either of those, as proxies to an
emergent HFC technology industry, can be expected to have a relatively large and pos-
itive impact on the UK macro economy. (Subject to the import/export qualiications
mentioned elsewhere.)
HFC speciic additional supplies add additional value, an ‘HFC layer’, into the elec-
tricity generation and gas supply proxy supply chain and it is a reasonable assump-
tion that an overall multiplier for an HFC industry will be at least a little higher still
than the proxy employed in this paper’s modelling work. No attempt is made herein
to assess how much higher such an HFC multiplier might be as this would involve a
much more extensive piece of work than can be covered here – essentially creating an
SIC classiication from scratch. Insuficient historical evidence exists at this time to do
that reliably in any case. For now, it is suficient to recognise that modelling outcomes
of this work are liable to be conservative.
37 www.fch.europa.eu/fchju-projects.
38 HySeas I Final Report (2014), updated in Hyseas II (2016), not public, but can be made available on
appropriate request from www.cmassets.co.uk/.

45Chapter 4 Supply chain
The non-core element supply chain is made up of a range of components and services
obtained from both the UK and overseas. Given that supply chains are already mature
and pre-established for components such as pumps, pipes, wiring, power-electronics,
generic controllers and so on, it seems unlikely that the deployment of HFC technolo-
gies will create any substantial number of new UK (or overseas) businesses to supply
that type of system element. In the worst case economic scenario, where a conven-
tional power generation solution is replaced with a like-for-like HFC based one, there
will be little or no direct net micro or macro-economic effect over and above the addi-
tional ‘HFC layer’ of HFC deployment. The impact in that case is essentially to retain
jobs and current levels of economic activity.
To exemplify that in the transport sector, we could imagine those currently employed
in internal combustion engine making being redeployed to the construction of FC sys-
tems or their component parts. In other applications, because HFC systems and appli-
cations are likely to be smaller and more distributed than conventionally centralised
power stations (for example), it is almost certain that the deployment of HFC technol-
ogies will generate more manufacturing work for those existing component supply
businesses. This must result in either higher productivity, increased employment or
some measure of both, in and around those types of supply chain business in the UK.
As the European capital of oil and gas, indeed as the inventor of much of the world’s
fossil energy extraction industry, and also from her other industrial history, the UK
has retained a perhaps surprising (to some) amount of industrial manufacturing and
IP which is very relevant to an emergent HFC sector supply chain. In general this
paper seeks to avoid mentioning speciic companies as inclusion of all businesses
with a potential HFC interest is dificult, however for example Rolls Royce, Johnson
Matthey, The Wood Group, Aggreko and The Weir Group are known as major suppli-
ers of the Global energy and energy extraction and processing sector. Multinational
extraction and reinery specialists such as BP, Ineos, Exxon, Technip and Shell are
very well represented in the UK and are employers of very large numbers of UK res-
idents. All of these companies already have HFC activity or the potential to supply
components and/or expertise into an emergent HFC sector. And in the wake of giants
such as those, comes their UK and overseas supply chains.
In addition to the multinational giants, the UK has a good number of smaller special-
ist and HFC speciic companies – some manufacturing core HFC components and/or
systems, others supplying related services. The UK has particular strengths in elec-
trolysis, high-temperature fuel cell based technologies and systems, niche applica-
tions, hydrogen storage and systems integration. Virtually all of that UK interest is IP
rich and hence is potentially value rich. It is worth noting that a great deal of macroe-
conomic value derives from the service activities required to support HFC activities.
The greatest bulk of service sector activity will necessarily be local to the UK, is of
relatively high value and cannot be readily outsourced from the UK.
In this context the UK Motor Industry deserves special mention as it is likely to
be amongst the most extensive integrators of HFC technologies. Although largely
foreign-owned, the UK has a very signiicant and currently thriving vehicle

46 A H2FC SUPERGEN White Paper
manufacturing sector. As fossil-derived fuels become less acceptable, it is essen-
tial that the UK’s vehicle manufacturing sector adapts and evolves towards zero
emissions vehicles.
Although battery vehicle technology is improving, and specialist vehicle successes
such as Tesla, there are many obstacles to whole scale replacement of the internal
combustion engine by battery systems, such as limited range, grid capacity and cost.
Li-battery improvement can be expected but will probably be gradual rather than
offering the step-change (and increased vehicles ranges) so frequently promised in the
past. Wittingham lays out a good overview of historical, current and probably future
of battery development and notes 8 speciic fundamental technical issues that would
need to be overcome were the Li-air batteries often referred to as potentially offering
conventional vehicle range ever to become commercial.39 The irst generation of HFC
road vehicles have ranges of 200–300 miles and beyond and can be reilled in much
the same time as reilling with liquid fossil fuels does.
The Battery Vs Hydrogen vehicle competition/conlict idea is misplaced. In reality,
the technologies are complimentary. All HFC vehicles have and will continue to have
a good-sized Li-ion battery – to get them started, to allow the most eficient use of
the HFC technology (load levelling) and to beneit from regenerative-braking. HFC
vehicles are smart hybrids from day one! And from that smart-hybrid observation, it
is a short step to realise what the inevitable passenger vehicle of the future will look
like – at least in terms of its power provision. That vehicle will have suficient battery
capacity to allow battery-only usage in and around towns, on short commutes, school
runs and such. But that local battery range will be backed up with signiicant addi-
tional range-extension from HFC technology.
Nissan/Renault seem to have been among the irst of the major automotives to realise
this and Renault’s HFC range-extended electric ‘HyKangoo’ vans can already be found
in the UK.40 Nissan have recently announced their hybrid e-NV200 – which is essen-
tially the same electric vehicle platform as the e-Kangoo, with the NV200 HFC variant
employing a different fuel cell type.
Nissan already make electric vehicles in Sunderland and hence they already have
the electric platform and virtually all of the required supply chain established for
Hy-Leafs (if we can name them that). Others will surely follow as the model provides
for zero tail pipe emissions, low-cost battery charging for local transport needs along-
side the familiar consumer convenience of fast-illing (of H2) for range.
In order to maintain the UK’s current healthy vehicle manufacturing sector, the devel-
opment of a vehicle HFC supply chain seems to be essential. Failure to do so seems
likely to have the effect of eventually losing current UK engine manufacture such as
Land Rover Jaguar’s plant at Wolverhampton in favour of importing fuel cell units –
which equates to inancial leakage from the UK economy.
39 Whittingham, M Stanley : History, Evolution and Future Status of Energy storage, Proceedings of the
IEEE | P1518, Vol. 100, May 13th, 2012.
40 http://brightgreenhydrogen.org.uk/.

47Chapter 4 Supply chain
Whether UK automotive FC manufacturing capability would or should amount to
100% of FC sub-assembly construction or local integration of both locally made and
imported components would be a matter for speciic investors. However, given the UK
Government’s existing vehicle power train investments and commitments to invest,
some thought should be given in that context to ensuring a signiicant continuity of
vehicle power plant production in the UK – by encouraging and incentivising sub-
stantive private investment in vehicle FC production.
Core-HFC and supply-chain should arguably be a key sector element within the UK’s
recently announced proposals and consultation on developing a modern Industrial
Strategy41 as HFC aligns well with 9 of its 10 announced ‘Strategic Pillars’.
4.2 HYDROGEN SUPPLY CHAIN
This chapter now explores the nature of the hydrogen supply chain activity
implied by the headline input-output ‘multiplier’ values introduced in Chapter 3.
It focuses on the composition of these multipliers in terms of output in different UK
industries required or supported by key industries that are identiied as direct players
in the ‘hydrogen economy’, in terms of the value added (GDP at sectoral level) content
of indirect and induced supply chain activity.42 It also highlights whether any boost
to activity in a given sector is likely to be temporary (start-up investment activity)
or on-going (operation of the hydrogen economy).
In Chapter 6 the analysis is extended to consider the employment and wage income
content of supply chain activity. The supply chain analysis here and in Chapter 6
continues to focus ‘at the margin’. That is, impacts are initially considered in terms
of supply chain activity required per £1million of activity generated by the shift
to a hydrogen economy. This helps inform analysis of the nature of the industrial
base required to respond to opportunities and challenge presented by this shift
(in Chapter 5) and of the nature of the skills requirement (Chapter 7). It also helps
inform consideration of issues around export opportunities set in the context of the
retention of intellectual property (Chapter 8). Chapter 9 then introduces considera-
tion of potential scale of making even a limited shift to a hydrogen economy. It does
so by applying information on projected demand shifts that may drive new activity
via the multipliers identiied and analysed in the earlier chapters.43
However, a crucial issue that must be highlighted up front, and one which frames the
analysis in this chapter, is that any transition to hydrogen as a fuel vector will require
a reallocation of spending and related supply chain activity away from traditional
fossil fuels, rather than a pure economic expansion. This issue has been introduced
41 UK Govt. announcement and press releases to date available at: www.gov.uk/government/news/pm-
unveils-plans-for-a-modern-industrial-strategy-it-for-global-britain.
42 In considering results reported, the reader is reminded that input-output multiplier analysis must be
approached with caution given that it can only be based on the most recently available ‘analytical’
input-output accounts for the UK economy, here (as explained in Chapter 3) for the year 2010.
43 As will be explained in Chapter 9, use of input-output multipliers for scaled ‘what if’ scenario analysis
involves additional modelling assumptions that must be considered in drawing policy implications
from results reported.

48 A H2FC SUPERGEN White Paper
in Chapter 3, where it was explained that, in economic terms, the transition to a
hydrogen-based economy is likely to require three key phases to achieve the replace-
ment of traditional reined fossil fuels with hydrogen-based energy source(s).
The irst of these mainly involves a change in how personal transportation services
are delivered, and is characterised by a contraction in expenditure on traditional
reined fossil fuels, mainly petrol and diesel. This is the focus of Section 4.2 below.
It is only in the second and third phases – respectively involving uptake of hydrogen
as a fuel and investment to support/enable this shift – that potential expansion in
activity across the economy becomes relevant. The remainder of the chapter considers
the output and value added (GDP by the income measure at basic prices) composition
of supply chains that are likely to be relevant in each of these phases, starting with the
net multiplier impact of £1million reallocated from conventional fossil fuel to hydro-
gen in transportation activity.
4.3 REFINED FUEL SECTOR: SUPPLY CHAIN STRUCTURE
AFFECTED BY CONTRACTION IN DEMAND FOR PETROL
AND DIESEL TO RUN VEHICLES
This section provides an overview of the UK supply chain structure for the
‘Manufacture of coke and reined petroleum products’ (Standard Industrial
Classiication, SIC, code 19) or ‘Reined fuel’ industry. This is the industrial sector
that currently supplies the petrol and diesel used to run vehicles. The headline mul-
tiplier values identiied in Chapter 3 are £1.47million output required throughout the
UK economy per £1million of household or other inal consumption spending, with a
value added component of £0.33million relected by the 0.33 output-GDP multiplier.
Again, it is important to note that these relate to 2010 analytical input-output data
for the UK. In Section 4.2.1 below the nature and potential implication of real world
developments (e.g. the closure of the reinery at Milford Haven in 2015) are consid-
ered, before the composition of the output and value added multipliers is considered
in Section 4.2.2.
4.3.1 Practical qualiications: some real word developments pre- and post-2010
According to the UK input-output data, in 2010 the ‘reined fuel’ sector had a total
output of £26,007million (2010 prices). Around 41% of this was produced to meet
export demand and 25% to meet UK household domestic demand. A minimal (0.1%)
of output went to other forms of inal demand (e.g. capital formation). The remaining
34% of sector output was produced to meet UK industrial (or intermediate) demand,
about a ifth of which is ‘own sector’ (implying some over-aggregation of activity
in the input-output industry and/or notable levels of the use of some reined fuels
in the production of others).
The 2010 input-output information has to be put in context. It will incorporate
pre-2010 shifts in activity, such as the closure of the Petro Plus reinery in Teeside
in 2009. However, two other reineries have closed since 2010: Petro Plus in Coryton
in 2012 and Murco in Milford Haven in 2014. This will have impacted the scale of
activity in the ‘reined fuel’ sector.

49Chapter 4 Supply chain
However, in terms of using 2010 multipliers, the key question is whether the input
structure (per £1million total input) has changed. A 2015 UK Oil and Gas Industry44
shows that exports of reined fuels have fallen lately. If the contraction in the industry
is mainly in terms of delivery and destination of output, it is possible to retain coni-
dence in the level and composition of the output multipliers (with the 1.47 core value
for output). The 2015 industry data do show an increase in imports around UK reined
fuel use. However, the crucial test for the multipliers is the importance of imported
inputs to the UK reining industry relative to use of domestic intermediate inputs
(although imported reined fuels may still be distributed via UK reineries).
As discussed, the 2010 input-output data already relect a high import content in the
reined fuel industry’s input structure (75% of intermediate – i.e. excluding pay-
ments to capital, labour and net production taxes – inputs are imported). This high
import intensity is what causes the reined fuel industry to have the lowest multipli-
ers of all 103 UK input-output industries. However, if import intensity has increased
(e.g. more crude oil raw inputs being imported rather than sourced from the UK off-
shore industry), the true multiplier values may in practice now be lower than those
reported for 2010.
Given that the scenario examined here involves a projected contraction in reined
fuel industry activity, this means that the 2010 multipliers may over-estimate
the extent of contraction. Given that this will thereby render estimates of the
resulting net expansion from transition to a hydrogen (transport) economy as being
conservative, the decision has been taken to work with the 2010 multipliers as
they stand. It is important to note that any pound, or £1million spend in this sector
excludes distribution margins and taxes on fuels, which have to be neglected in
an input-output study of the type commissioned here.
4.3.2 The nature of supply chain contraction linked to reduced demand for
UK ‘reined fuel’
The basic input-output tables (i.e. before the multipliers are derived) tell us that,
according to patterns relected in the 2010 data, the main UK industries that the
‘Reined fuel’ sector purchases buys inputs from are ‘Extraction of crude petro-
leum and natural gas & mining or metal ores’ (SIC 06) and ‘own sector’ (see above).
However, while other more technical relationships are relected, such as a relatively
high importance of purchases from the electricity sector, it is important to note that
service industries are also important in the ‘Reined fuel’ direct supply chain,
particularly ‘Financial service activities’ (SIC 64).
When multipliers are derived to extend to indirect and induced supply chain relation-
ships, the role of UK resource extraction and energy supply industries remains appar-
ent. Moreover, the importance of manufacturing and service activities is enhanced
through indirect and induced supply chain links. This is shown in Figure 4.1 where
the 0.47 (£470k per £1mllion) indirect and induced component of the 1.47 ‘Reined
44 DBEIS (2016) Petroleum: Chapter 3, Digest of United Kingdom Energy Statistics (DUKES) –
see www.gov.uk/government/collections/oil-statistics.
50 A H2FC SUPERGEN White Paper
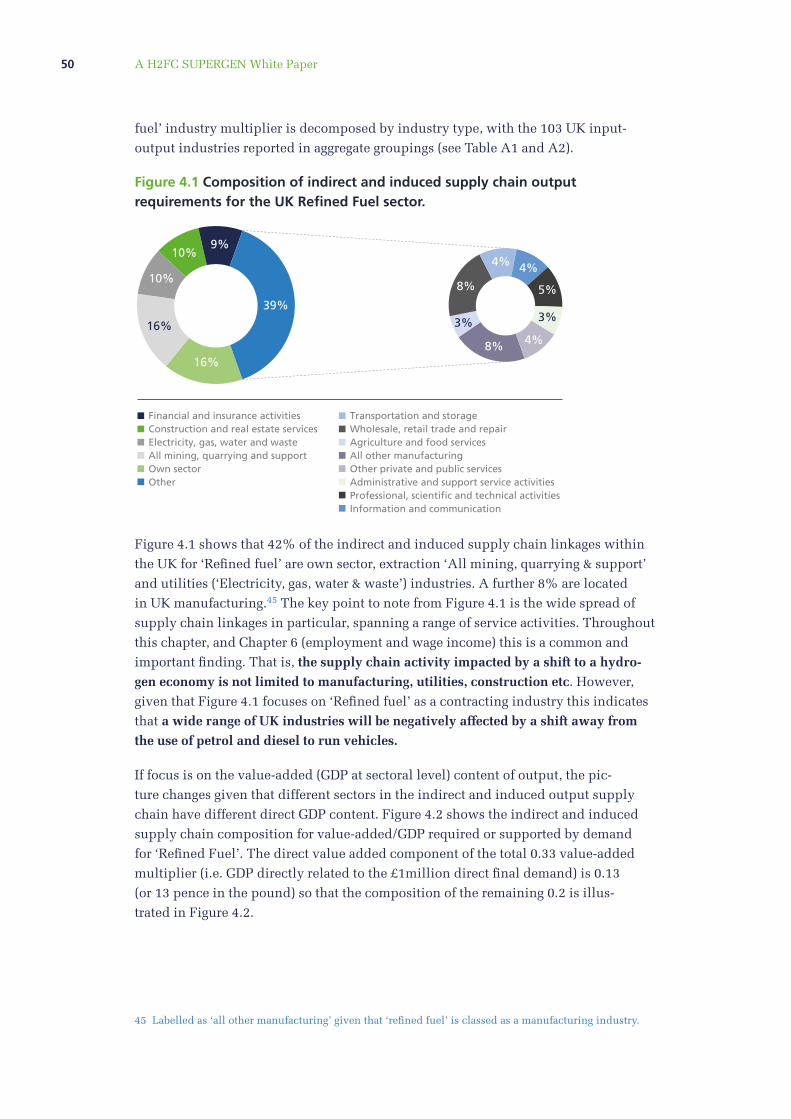
fuel’ industry multiplier is decomposed by industry type, with the 103 UK input-
output industries reported in aggregate groupings (see Table A1 and A2).
Figure 4.1 Composition of indirect and induced supply chain output
requirements for the UK Reined Fuel sector.
Financial and insurance activities
Construction and real estate services
Electricity, gas, water and waste
All mining, quarrying and support
Own sector
Other
Transportation and storage
Wholesale, retail trade and repair
Agriculture and food services
All other manufacturing
Other private and public services
Administrative and support service activities
Professional, scientiic and technical activities
Information and communication
9%
4%4%
4%
3%3%
8%
8%
5%
10%
10%
16%
16%
39%
Figure 4.1 shows that 42% of the indirect and induced supply chain linkages within
the UK for ‘Reined fuel’ are own sector, extraction ‘All mining, quarrying & support’
and utilities (‘Electricity, gas, water & waste’) industries. A further 8% are located
in UK manufacturing.45 The key point to note from Figure 4.1 is the wide spread of
supply chain linkages in particular, spanning a range of service activities. Throughout
this chapter, and Chapter 6 (employment and wage income) this is a common and
important inding. That is, the supply chain activity impacted by a shift to a hydro-
gen economy is not limited to manufacturing, utilities, construction etc. However,
given that Figure 4.1 focuses on ‘Reined fuel’ as a contracting industry this indicates
that a wide range of UK industries will be negatively affected by a shift away from
the use of petrol and diesel to run vehicles.
If focus is on the value-added (GDP at sectoral level) content of output, the pic-
ture changes given that different sectors in the indirect and induced output supply
chain have different direct GDP content. Figure 4.2 shows the indirect and induced
supply chain composition for value-added/GDP required or supported by demand
for ‘Reined Fuel’. The direct value added component of the total 0.33 value-added
multiplier (i.e. GDP directly related to the £1million direct inal demand) is 0.13
(or 13 pence in the pound) so that the composition of the remaining 0.2 is illus-
trated in Figure 4.2.
45 Labelled as ‘all other manufacturing’ given that ‘reined fuel’ is classed as a manufacturing industry.

51Chapter 4 Supply chain
Figure 4.2 Composition of indirect and induced supply chain value-added (GDP)
requirements for the UK Reined Fuel sector.
Financial and insurance activities
Wholesale, retail trade and repair
Construction and real estate services
All mining, quarrying and support
Other
Transportation and storage
Electricity, gas, water and waste
Own sector
Agriculture and food services
All other manufacturing
Other private and public services
Administrative and support service activities
Professional, scientiic and technical activities
Information and communication
11%
4% 5%
6%
4%5%
5%
6%
6%
2%
9%
12%
25%
43%
There are two important features to note from Figure 4.2. First the identity of the UK
industries where most value-added would be lost from reduced demand for petrol
and diesel (shown in the larger pie chart) shifts relative to output in Figure 4.1, with
the service industries that provide inancial and distributional services having higher
GDP content than utilities or manufacturing (both of which shift to the smaller pie
chart). However, the impact on extraction/mining and mining support industries is
markedly greater due to the high value-added content particularly of off-shore oil and
gas extraction in the UK: the UK ‘Extraction of crude petroleum and natural gas &
mining of metal ores’ industry (SIC 6) has a relatively high direct value-added intensity
(68 pence in the pound in 2010). However, this is a result that must be qualiied. If the
UK oil and gas industry continues to decline, the supply chain multipliers of ‘Reined
fuel’ (positive or negative) will also decline, particularly in terms of GDP content.
The second important feature of Figure 4.2 (value-added content of output) relative
to Figure 4.1 (output) is that the spread of industries affected is greater, with the share
in the ‘other’ part of the larger pie chart (broken out in the smaller one) growing in
Figure 4.2. Again, the key point is that the UK industries with the strongest shares
in Figures 4.1 and 4.2 join the ‘Reined fuel’ industry itself (which loses the direct
impacts of the £1million spend, and its own £130k value-added component within
this) as ‘losers’ in the shift to a hydrogen (transport) economy. Moreover, this extends
to a variety of service industries.
The point made in Chapter 3 – that a pound for pound reallocation of spending away
from the UK ‘Reined fuel’ sector, with its relatively weak domestic upstream supply
chain linkages and low marginal multiplier values – is likely to have net positive
impacts extends to the sectoral level here. This is discussed in more detail in Section
4.4 below. First, in Section 4.3 the supply chain composition of the existing (2010)

52 A H2FC SUPERGEN White Paper
gas and electricity production and distribution industries – identiied in Chapter 3
as proxies for hydrogen supply – is examined. Suficient common elements with the
‘Reined fuel’ supply industry are found such that (in Section 4.4) a key inding is that
there are likely to be net contractions in activity in only three or four of the 103 UK
industries identiied in the input-output framework, most notably ‘Reined fuel’ itself.
As highlighted below, this depends crucially on the assumption of a pound for pound
reallocation. On the other hand, given that ‘Reined fuel’ has the lowest multipliers of
any of the 103 UK industries, it may be expected that, as long as any spend withdrawn
from petrol/diesel supply is spent within the UK (rather than on imported goods
and services), there will be a net overall positive impact. The question then is one of
‘winners and losers’ at the sectoral level. This can be more fully considered by moving
to what has been identiied in Chapter 3 as Phase 2 of the transition scenario, where
reduced spending on petrol/diesel is reallocated, in whole or in part, to hydrogen.
At a high level of analysis, in 2010 UK households spent just under £6556million on
the outputs of the ‘Reined fuel’ sector. Applying this igure to the overall multipliers,
this equates to £9,646million in UK output, £2,187million of which is value-added
or GDP content, and supporting 19,225 full-time equivalent jobs. On the other hand,
the same spend directed at an activity similar to UK gas supply would translate
to £14,741million in output (net increase of £7,131million), £5,279million in GDP
(a net increase of £2,920million, or 0.24% additional total UK GDP in 2010) and
52,689 FTE jobs (a net increase of 33,464). The next section considers how output and
GDP multiplier impacts in the gas and electricity supply proxies are spread across all
UK industries, with similar analysis for employment carried out in Chapter 6.
4.4 PROXY HYDROGEN SUPPLY SECTORS: SUPPLY CHAIN
STRUCTURES FOR CURRENT UK GAS AND/OR ELECTRICITY SUPPLY
This section is concerned with the need to consider the supply chain implications of
compensation of reduced demand for the UK ‘Reined fuel’ industry as spending to
run vehicles shifts from petrol/diesel to hydrogen. The irst question is how much can
be absorbed by spending on hydrogen fuel. In Chapter 3, in the absence of an existing
hydrogen supply industry, the existing (again based on 2010 data) UK gas and/or elec-
tricity production and distribution industries are identiied as potential proxies, albeit
in the absence of consideration of any additional layers of activity likely to be required
in processing hydrogen and removing emissions via CCS. As discussed in Chapter 3, gas
supply may be considered as an appropriate proxy industry given that existing gas indus-
try infrastructure may be used in distributing hydrogen. On the other hand, there may be
similarities with electricity supply given that hydrogen and electricity share the charac-
teristic of being a secondary energy carrier/vector rather than a raw energy resource.
Figure 4.3 illustrates the sectoral composition of the indirect and induced (1.25 or
£1.25million) component of the 2.25 ‘Gas supply’ industry output multiplier. Here the
‘Electricity, gas, water and waste’ utility composite from Figure 4.1 is split to identify
gas supply as ‘own sector’ distinguished from ‘other utilities’, while ‘reined fuels’
falls back into ‘All manufacturing’.

53Chapter 4 Supply chain
Figure 4.3 Composition of indirect and induced supply chain output
requirements for the UK Gas sector.
Construction and real estate services
Other utilities
All mining, quarrying and support
Own sector
All manufacturing
Other
Financial and insurance activities
Information and communication
Transportation and storage
Wholesale, retail trade and repair
Agriculture and food services
Other private and public services
Administrative and support service activities
Professional, scientific and technical activities
8%
6%
3%
3%4%
6%
5%
2%
18%
27%
7%8%
32%
3%
A key point to note is that the main supply chain sectors where output is supported
by demand for gas supply (larger pie chart in Figure 4.3) are resource extraction, util-
ity, construction and manufacturing industries. On the other hand, the 32% of supply
chain requirements broken out in the smaller pie chart are mainly service industries.
This reinforces the point already made that the service industry requirement of a
hydrogen economy must be carefully considered.
Another crucial point to be made is that marginal multiplier values relect the operat-
ing costs of the proxy hydrogen supply industry. However, this assumes that suficient
investment will be made up-front to permit the industry to operate in a similar way to
that relected in Figure 4.3 for gas supply as the proxy. That is, on-going service links
to, for example, the construction and inance industries assume that suficient initial
investment to enable these supply links is made. The input-output model could be
used to separately model impacts of up-front investment activity and this point is
revisited in the context of construction below.
A note on CCS
If carbon capture and storage (CCS) would be introduced in hydrogen supply, this
would be likely to increase the direct dependence of the gas supply proxy on manu-
facturing (e.g. through chemicals required) and on the construction sector. Production
may also become more capital and/or labour-intensive, with the latter in turn increas-
ing the strength of induced effects in all of the multipliers identiied for (here) the gas
supply proxy. Thus, the input structure may change to some extent. However, as dis-
cussed in Chapter 3 (Section 3.4.2), the impact of this on multiplier values cannot be
assessed without an in-depth study to develop the input-output framework to incor-
porate CCS activity. Such a study is beyond the scope of the current paper. However,
as with additional processing involved in creating hydrogen, it is important to note

54 A H2FC SUPERGEN White Paper
that any additional layers of activity, while adding to costs, will also add to supply
chain requirements and, therefore, activity supported throughout the UK economy.
Returning to the gas supply proxy as it stands, Figure 4.4 illustrates the indirect
and induced supply chain composition for value-added/GDP required or supported
by demand for the current (2010) UK gas supply industry. The direct value added
component of the total 0.81 value-added multiplier (i.e. GDP directly related to
the £1million direct inal demand) is 0.22 (or 22 pence in the pound) so that the
composition of the remaining 0.59 is illustrated in Figure 4.4.
Figure 4.4 Composition of indirect and induced supply chain value-added (GDP)
requirements for the UK Gas sector.
Construction and real estate services
All mining, quarrying and support
Other
Transportation and storage
Wholesale, retail trade and repair
Other utilities
Own sector
Agriculture and food services
All manufacturing
Other private and public services
Administrative and support service activities
Professional, scientific and technical activities
Financial and insurance activities
Information and communication
6%
4%4%
6%
6%7%
5%
4%
3%
2%
9%
40%
51%
4%
Two key results are apparent in Figure 4.4. The irst is, once again the relative impor-
tance of service industries. The second is the dominating impact of value-added
required or supported by spending on gas in the UK mining and mining support
composite group. Again, as with reined fuel supply but to a greater extent here, the
key element of this is the value-added content of the UK off-shore oil and gas extrac-
tion industry (noted above as 68 pence in the pound).
This is an important issue in considering the nature of the gas supply proxy. As
discussed in Chapter 3 (Section 3.4.2), if extraction in the UK oil and gas extraction
industry continues to decline, more of the gas resource would be imported, thereby
reducing the values of the UK multiplier values for gas as a proxy for hydrogen. There
is also the issue that the gas proxy is largely motivated by the existing infrastructure,
rather than the gas resource itself. If the resource used to produce hydrogen is not one
that would be extracted by the UK off-shore industry (SIC 6) then the output and val-
ue-added component of the gas proxy multiplier located in the mining and mining
support industries will be reduced.

55Chapter 4 Supply chain
A note on the impact of the UK oil and gas extraction industry on
proxy multipliers
As indicated by Figure 4.4, the existing dependence of the UK gas supply industry
on the particularly the UK oil and gas extraction industry (SIC 6) has a marked impact
on the nature of the supply chain multiplier relationships that are mapped to the
hydrogen supply proxy in this paper. Figure 4.5 shows the impact on the gas supply
output-GDP multiplier (which also includes the direct component of 22p in the
pound that is excluded from Figure 4.4) of removing the indirect and induced impacts
located in the SIC 6 extraction industry. However, given that this is also driven by the
use of UK oil and gas in other industries in the supply chain, the multiplier is also
shown excluding only the impact of the gas supply industry’s own purchases. The
results of the same analysis are also reported for the electricity industry (where indi-
rect and induced relevance on UK oil and gas extraction, and the mining and mining
support industry as a whole, is shown in Figure 4.6 below). In both the gas and
electricity proxy cases, while the impact of discounting these elements is relatively
large, inclusion of the same results for ‘Reined fuel’ in Figure 4.5 demonstrates that
other domestic supply chain impacts remain suficiently strong that either proxy has
a larger overall multiplier impact.
Figure 4.5 Impacts on UK gas,electricity and reined fuel output-value added
(GDP) multiplier of the remaining impacts of upstream supply chain reliance
on UK oil and gas extraction.
0
0.1
0.5
0.4
0.3
0.2
0.6
0.7
0.8
0.9
Reined fuel Electricity Gas
Multiplier not including any supply chain link to UK oil and gas
Impacts of indirect and induced links to oil and gas extraction
Impacts of direct and induced links to oil and gas extraction
Reined fuel Electricity Gas
Total multiplier effect 0.33 0.78 0.81
Excluding impacts of direct purchases
from oil and gas extraction 0.30 0.69 0.64
11.55% 11.60% 21.04%
Excluding any supply chain link to UK oil and gas 0.29 0.62 0.59
14.11% 20.14% 26.12%

56 A H2FC SUPERGEN White Paper
Turning to the alternative proxy of electricity supply, Figure 4.6 shows the com-
position of the indirect and induced (1.56 or £1.56million) component of the 2.56
‘Electricity supply’ industry output multiplier. As noted in Chapter 3, the total elec-
tricity supply output multiplier is notably larger than that for gas supply (2.25). Figure
4.6 demonstrates that there are, however, similarities in the industrial composition
of indirect and induced impacts across other UK industries (though the ‘own sector’
electricity impact is large relative to that for gas).
The main area of divergence between the gas and electricity supply proxies is in the
more limited contribution of the mining and mining support industries under the
latter. This is emphasised when attention turns to the composition of the indirect and
induced component of the electricity supply output-GDP multiplier in Figure 4.7, and
has already been demonstrated in Figure 4.5. Again, particularly due to the relatively
high value-added intensity of the oil and gas extraction industry, the contribution
of mining and mining support industries is larger in the output-GDP relative to the
overall output multiplier. However, remember the total multiplier is slightly smaller,
(0.79), than that of gas supply, (0.81). In comparing gas and electricity as proxies, note
from Figure 4.5 that when the impact of SIC 6 oil and gas extraction components (own
sector purchases and fuller supply chain dependence) is removed the output-GVA
multiplier for electricity is actually larger than for the gas supply proxy.
Figure 4.6 Composition of indirect and induced supply chain output
requirements for the UK Electricity sector.
Other utilities
All mining, quarrying and support
Own sector
All manufacturing
Other
Information and communication
Transportation and storage
Wholesale, retail trade and repair
Construction and real estate services
Agriculture and food services
Other private and public services
Administrative and support service activities
Professional, scientiic and technical activities
Financial and insurance activities
3%
3%
3%
4%3%
6%
5%
2%
17%8%
31%
10%
34%5%

57Chapter 4 Supply chain
Figure 4.7 Composition of indirect and induced supply chain value-added (GDP)
requirements for the UK Electricity sector.
Financial and insurance activities
Construction and real estate services
All mining, quarrying and support
Own sector
All manufacturing
Other
Information and communication
Transportation and storage
Wholesale, retail trade and repair
Other utilities
Agriculture and food services
Other private and public services
Administrative and support service activities
Professional, scientiic and technical activities
4%
5%
4%
6%3%
5%
2%
8% 7%
29%
13% 7%
36%7%
Comparing Figures 4.6 and 4.7, the other key point to note is that the contribution
of own sector and other utilities contracts (given a relative low value-added inten-
sity) while the contribution of service industries, particularly inance/insurance and
‘professional, scientiic and technical activities’ grows. Thus, again, a key inding is
that the role of service sectors must be carefully analysed in considering the indus-
trial base underlying a potential hydrogen economy. That is, attention must not
be limited to the manufacturing base for equipment to enable hydrogen uptake.
4.5 NET MULTIPLIER EFFECTS OF A SHIFT IN FUEL SOURCE FOR
TRANSPORTATION (OUTPUT AND VALUE ADDED)
A key issue that has been emphasised earlier in Chapters 3 and 4 is that it is crucial
to consider the net impacts of shifting from the use of petrol and diesel to hydrogen
in running vehicles, rather than focus on the gross impacts of spending on hydro-
gen as a fuel. For illustrative purposes, this section considers the net economy-wide
impacts of a pound for pound (£1million/or £1million) shift between petrol/diesel
and hydrogen fuels to run vehicles. For various reasons (including but not limited
to what relative prices of petrol diesel vs. hydrogen may actual prove to be) a pound
for pound reallocation may not be a realistic assumption. But, as noted in Chapter 3,
‘Reined fuel’ has the lowest multiplier values of all UK industries suggest that the
total net impact of any reallocation of spending away from reined fuels towards any
other UK produced good or service (i.e. as opposed to imports) will be positive impact
for goods and services production in the UK economy. One other example considered
below is the possibility of using some savings from reduced fuel spend on expendi-
ture on vehicles. However, the question of how spending may be reallocated is largely
reserved for the fuller scenario analysis in Chapter 9.
Taking the simple example of a pound for pound reallocation of fuel spending, the
net total impacts on the UK economy can be derived using the headline multipliers

58 A H2FC SUPERGEN White Paper
for reined fuel versus the hydrogen proxy industries. As noted in Chapter 3, the
overall output multipliers for gas and electricity supply (respectively £2.56million
and £2.25million per £1million demand) are higher than that for reined fuel supply
(£1.47million per £1million demand). Thus, a positive overall impact on UK output
may be expected for every pound (or £million) reallocated of spending between
reined fuel and either proxy. The headline results are generated simply by taking
the differences in the total multiplier values: for a £1million reallocation the net
impact would be £0.78millin (£777,225) for reined fuel to the gas supply proxy and
£1.09million (£1,087,705) for the electricity supply proxy.
Similarly for value-added (GDP at industry level), differences in the headline multipliers
of £0.33million, £0.81milion and £0.78million for reined fuel, gas and electricity supply
respectively allow us to calculate the total impact of a £1million reallocation. In this con-
text, given the greater value-added content of UK gas supply, the ranking between reallo-
cation to the gas or electricity proxies is reversed. The net impacts on total UK GDP would
be £0.472million (£471,666) for reined fuel to the gas supply proxy and £0.445million
(£445,429) for reined fuel to the electricity supply proxy. The main lesson from this
headline inding is that the economy-wide impacts of shifting from traditional fossil fuel
to hydrogen to run vehicles will be maximised if hydrogen supply can replicate the same
or similar strength of domestic supply linkages as existing gas or electricity supply.
These net positive overall impacts would, of course, be reduced if the role of the UK
oil and gas extraction industry is reduced in line with the analysis in Section 4.3
above. However, retaining focus on the unadjusted proxy multipliers, a key focus in
analysing the net impacts of a reallocation of spend from one fuel source to another
is to identify if there are any net ‘losers’. Of all 103 UK industries as classiied in
the input-output accounts, application of the multiplier predicts that 3 or 4 sectors
(depending on whether the electricity or gas proxy is applied) will suffer net losses.
These are identiied in Table 4.1. Of these, the sizeable loss is to the ‘Reined fuel’
sector itself and this is mainly due to the £1million direct loss of demand.
Table 4.1 Identiication of industry location and magnitude of potential gross
losses from the shift from petrol/diesel to hydrogen.
Output Value added (GDP)
SIC Sector name Reined fuel
to electricity
proxy
Reined fuel
to gas proxy
Reined fuel
to electricity
proxy
Reined fuel
to gas proxy
10.4 Manufacture of vegetable,
animal oils and fats
-£6 -£27 -£2 -£10
19 Manufacture of reined
petroleum products
-£1,060,251 -£1,066,289 -£134,412 -£135,177
20.3 Manufacture of industrial
gases
-£629 -£973 -£142 -£220
20.4 Manufacture of
petrochemicals
£480 -£925 £78 -£1,495
Source: Author’s calculations based on UK input-output data produced by the Fraser of Allander Institute.

59Chapter 4 Supply chain
In terms of the distribution of potential gains from a reallocation, the results relect the
discussion of the composition of the output and output-GDP multipliers in the previ-
ous section. At the level of the aggregate industry groupings reported in the pie charts
in Section 4.3 (but with ‘reined fuel’ separated from other manufacturing), Table 4.2
shows that all (except ‘reined fuel’) are net ‘winners’. The net impacts for the industry
groupings (which incorporate the gross losses reported in Table 4.1) sum to the totals
derived from the headline multipliers above. Note that the mining and mining support
industries in particular gain most if gas supply is used as a proxy for hydrogen supply,
while manufacturing and service industries (particularly professional, scientiic and
technical services) gain more under the electricity supply proxy. However, a crucial
point to note, once again, is the importance of considering the potential expansion in
various service activities, and, thus, the need not to limit attention to manufacturing
and/or technical requirements in a shift to a hydrogen economy.
Table 4.2 Net impacts on UK industry groupings of a £1million reallocation of
inal spending from petrol/diesel to hydrogen.
Output Value added
SIC Sector name Reined fuel
to electricity
proxy
Reined fuel
to gas proxy
Reined fuel
to electricity
proxy
Reined
fuel to gas
proxy
01–03,
67,68
Agriculture and food services £11,086 £10,083 £4,956 £4,500
04–07 All mining, quarrying
and support
£194,109 £266,425 £125,589 £178,867
19 Manufacture of reined
petroleum products
-£1,060,251 -£1,066,289 -£134,412 -£135,177
08–48 All other Manufacturing £98,838 £43,935 £32,059 £15,280
52–57 Other utilities £1,558,506 £1,276,346 £264,261 £275,982
58,77,
78
Construction and real estate
services
£44,822 £52,035 £23,176 £26,275
49–51,
59,60
Wholesale, retail trade
and repair
£47,225 £32,673 £22,811 £15,992
61–66 Transportation and storage £20,777 £17,614 £9,064 £7,548
69–73 Information and communication £32,143 £26,977 £17,736 £14,883
74–76 Financial and insurance
activities
£38,151 £28,053 £20,515 £14,872
79–85 Professional, scientiic
and technical activities
£46,011 £37,505 £26,703 £22,239
86–92 Administrative and support
service activities
£27,997 £27,903 £16,009 £16,119
93–103 Other private and public services £28,291 £23,965 £16,961 £14,286
Total £1,087,705 £777,225 £445,429 £471,666
Source: Author’s calculations based on UK input-output data produced by the Fraser of Allander Institute.

60 A H2FC SUPERGEN White Paper
4.6 ENABLING THE USE OF HYDROGEN AS A FUEL: POTENTIAL
FOR OUTPUT AND VALUE-ADDED EXPANSION IN THE UK VEHICLE
MANUFACTURING INDUSTRY
As argued in Chapter 3, there could also be a potential boost to UK manufacturing at
the second transition phase if funds saved from spending on petrol/diesel are directed
towards UK manufactured hydrogen-ready cars. More generally, if the UK vehicle
manufacturing industry could develop specialism in producing hydrogen-ready
cars, routine replacement and upgrade of domestic vehicles during the transition
towards hydrogen could involve domestic rather than import spending. Indeed, one
issue for consideration identiied in Chapter 3 is whether the availability of a good
quality UK branded vehicle may help incentivise individuals to engage in the transi-
tion towards hydrogen cars.
Moreover, if the UK industry could develop such a specialism is producing hydro-
gen-ready vehicles, there is also the potential to expand current vehicle production
for export: in 2020 the UK vehicle manufacturing industry (SIC 29) exported just
under 60% of its output, while only 13% went to UK household demand. That is,
the UK vehicle manufacturing industry is already an export orientated one and
could potentially extend its role via developing specialism in producing hydrogen
ready vehicles.
Again, in Chapter 3 the headline output and output-GDP multipliers for the UK
vehicle manufacturing industry have been identiied (based on the 2010 input-
output data) as 2.35 for output (£2.35million required/supported throughout the UK
economy per £1million spend on vehicles produced) and 0.80 for GDP (£0.8million
per £1million spend). Figure 4.8 shows the results of decomposing the indirect and
induced components (1.35) of the output multiplier while Figure 4.9 considers the
related GDP content (only 0.31, given a high direct, 0.49, component of the out-
put-GDP multiplier).
One key observation is similar to what has been noted already for fuel supply indus-
tries. This is the importance of impacts on some of the service industries of demand
for UK vehicle manufacturing is greater when focus is on GDP content rather than
gross output. The opposite is true of impacts via other (i.e. non-vehicle) manufactur-
ing and utilities where output gains are less value-added intensive. A key industry
area to highlight here is the ‘wholesale, retail trade and repair’ grouping. Even where
cars are imported, distribution services within the UK will be used. This has two
important implications. First, even if hydrogen-ready vehicles are imported, if this
involves additional spending on cars by UK consumers, there may still be positive
multiplier effects on the UK economy as irms involved in distribution services
within the UK will export their services to foreign manufacturers. Where there is
a direct boost to distribution activity via export demand in this way (as opposed
to an indirect boost via demand for UK vehicle manufacturing) the multipliers for
the relevant distribution industry (identiied as SIC 45 in Table 3.1 in Chapter 3)
are relevant: these are 1.94 for output and 1.07 for value added (i.e. £1.94million
and £1.05million in UK-wide output and GDP respectively per £1million export

61Chapter 4 Supply chain
demand for UK distribution services). If relevant, these multipliers can be decom-
posed in a similar manner to that demonstrated here for vehicle manufacturing and
other industries.
Figure 4.8 Composition of indirect and induced supply chain output
requirements for the UK Motor Vehicles sector.
Financial and insurance activities
Wholesale, retail trade and repair
Construction and real estate services
Own sector
All other manufacturing
Other
Information and communication
Transportation and storage
Electricity, gas, water and waste
All mining, quarrying and support
Agriculture and food services
Other private and public services
Administrative and support service activities
Professional, scientiic and technical activities
4%
4%
3%
5%
3%5%
1%
17% 9%
8%
14%
23%
29% 4%
Figure 4.9 Composition of indirect and induced supply chain value-added (GDP)
requirements for the UK Motor Vehicles sector.
Financial and insurance activities
Wholesale, retail trade and repair
Construction and real estate services
All other manufacturing
Other
Information and communication
Transportation and storage
Electricity, gas, water and waste
All mining, quarrying and support
Own sector
Agriculture and food services
Other private and public services
Administrative and support service activities
Professional, scientiic and technical activities
5%7%
5%
6%
3%
7%
3%
11%
20%
11%
17%
41%
4%
1%
Second, and related to the irst point, in the context of using input-output multipliers
(which assume that if demand for output rises the requirement all input requirements
expand) if there is substitution in favour of UK manufactured vehicles away from
imports rather than an overall increase in demand for cars, there may not be much

62 A H2FC SUPERGEN White Paper
of a net expansion in distribution activity. That is, the 17% contribution of distribu-
tion services to the output multiplier in Figure 4.8 and 20% for value-added in Figure
4.9 may relect a potential over-statement of the total marginal multiplier impacts of
any increased demand for the UK vehicle manufacturing sector. On the other hand, if
there is a net boost to export demand for the UK industry and/or a net increase in UK
household demand for UK-made vehicles, an increase in distribution activity may be
more likely.
Within the aggregate manufacturing industry in Figure 4.8 and 4.9, the greatest
supply chain impacts of demand for UK vehicle manufacturing are found in
industries such as manufacturing of fabricated metals, rubber and plastic, iron and
steel, all of which would remain important in the context of hydrogen-ready vehicles.
On the other hand, other types of manufacturing such as electrical equipment to
support fuel cell (manufacture of batteries and accumulators) may become more
important in the context of shifting to hydrogen-ready vehicles. However, in
considering economy-wide multiplier effects, as with the consideration of CCS in
the context of the gas supply proxy above, the results in Figures 4.8 and 4.9 would
only be substantially affected if such a development had suficient impact on the
input structure (and UK supply-chain dependence) of the industry.
4.7 OUTPUT AND VALUE-ADDED LINKED TO UK INDUSTRIES THAT
MAY BE ‘INVESTMENT’ TARGETS IN FACILITATING THE SHIFT TO A
HYDROGEN ECONOMY
Chapter 3 identiied a third transition phase wherein there may be potential for
economic expansion through investment in activity to support increased uptake and
maintenance of hydrogen-based technologies. Within this, three broad categories
for the types of industries affected/targeted were highlighted (in Section 3.4.3). The
irst is industries where output is required to enable people to actually use hydrogen
as a fuel and, in the case of transport, the vehicle manufacturing industry discussed
in the previous section would be the key focus. But, if focus broadens to areas such
as heating, then the manufacture of heating systems would become relevant. This is
not an area considered at this stage but to do so would involve identifying the UK
input-output classiied industry that produces the product(s) used by consumers and
studying the up-stream supply chain as is done here for vehicle manufacturing.
Another dimension of the crucial ‘make or buy’ question was also identiied in chap-
ter 3 in the context of enabling people to use hydrogen as a fuel. That is, R&D activity
may be required to enable UK manufacturers to produce hydrogen-ready equipment
to enable people to switch to hydrogen as a fuel. Indeed, R&D activity may be required
in order to make the switch in the fuel supply (the potential multiplier impacts of this
switch have been considered in Sections 4.2–4.4 above). For this reason in Section
4.6.1, multiplier impacts for R&D spending in the UK are decomposed. Within this,
the crucial question of the timeframe over which boosted R&D activity may be required
and sustained and the implications for the use of multiplier analysis is considered.
63Chapter 4 Supply chain
The question of relevant timeframe for additional activity and impact is also relevant
in the context of the second type of industry identiied at the investment stage under
Phase 3. This is where short-term but potentially large scale investment spending may
be required to enable supply and distribution of hydrogen. In Section 3.4.3 focus was
placed in this context on the UK construction industry, which would be involved,
for example, in developing service station capacity for hydrogen refuelling for vehi-
cles; however, it would be relevant in a wider hydrogen economy context where, for
example, pipeline infrastructure needs to be laid, heating systems need to be installed
etc. Accordingly, the headline multipliers for the UK construction industry are also
decomposed in Section 4.6.1.
Finally, a third type of industry where increased capacity requirements may be required
was identiied in Chapter 3 (Section 3.4.3) as those indirectly rather than directly
impacted by spending changes. This falls into a more general consideration of consid-
ering increased capacity requirements in those industries that play a prominent role in
the supply chain decompositions carried out throughout this chapter. Consideration of
commonly identiied industries in this respect is the focus of Section 4.6.2.
4.7.1 Direct investment targets – examples of R&D and construction
In terms areas of the UK economy that may deliver the greatest opportunities for a
‘high quality’ impact through the shift to a hydrogen economy, research and devel-
opment (R&D) is a key candidate. That is, there is a crucial ‘make or buy’ question,
where there are important opportunities if the UK can become a known specialised
player in designing and delivering hydrogen-based technologies and delivery capac-
ity (outlined in Section 1.6, (Chapter 1). Moreover, if the UK can become a ‘maker’
of hydrogen-related technologies, opportunities may extend to exploiting hydrogen
economy developments in other countries. If so, there is potential for sustained eco-
nomic expansion in the UK though continued R&D activity at least over the medium
term as a hydrogen transition takes place. As previously, the UK would begin such
a shift into HFC vehicle manufacturing from a position of existing strength in design
and manufacture of analogous conventional vehicles and supply chain components
and services suggesting that the UK is well placed to make such a shift from that exist-
ing brand-strength.
Chapter 3 has identiied how, in terms of UK industrial value-added multipliers,
with £1.29million in value-added generated throughout the UK economy per £1million
inal demand (including export of services), ‘Scientiic Research and Development’
(SIC 72) ranks second out of all 103 UK industries in terms of the GDP impacts
required/supported in its supply chain (only ‘Education’ is higher). It also ranks highly
on employment and wage income multipliers, as will be explored in Chapter 6.
A crucial point to note, however, is that the impacts of R&D spending will be incor-
porated in the multipliers of other industries. That is, where industries such as the
UK vehicle manufacturing or energy supply sectors and/or their up-stream supply
chain partners commit part of their operational spending to on-going R&D activity
within the UK, impacts in the UK R&D sector will already be captured within the
‘Professional, scientiic and technical activities’ grouping in the Figures in Sections

64 A H2FC SUPERGEN White Paper
4.2–4.5. However, if a boost to R&D activity is required to enable a major step-up in
capability and/or capacity in the context of the shift to a hydrogen economy – which
would include any R&D required to make CCS a reality – additional spending in the
form of government and/or non-proit sector inal spending may be required. If this is
the case, it is appropriate to directly apply that spending to multiplier values for the
R&D industry.
Figure 4.10 Composition of indirect and induced supply chain output
requirements for the UK Scientiic Research and Development sector.
Wholesale, retail trade and repair
Construction and real estate services
Other
Transportation and storage
Electricity, gas, water and waste
All mining, quarrying and support
Own sector
Agriculture and food services
All manufacturing
Other private and public services
Administrative and support service activities
Professional, scientiic and technical activities
Financial and insurance activities
Information and communication
6%
11%
8%
10%4%
11%
7%6%1%
2%11%
13%
76%10%
Figure 4.10 shows the results of decomposing the indirect and induced components
(1.39 of a total 2.39) of the UK R&D industry output multiplier (it is separated from
‘other professional scientiic and technical activities’). Figure 4.11 (below) then con-
siders the related GDP content. As noted above, R&D has a relatively high output-GDP
multiplier of (1.29), and it is one with both relatively high direct value added content
(59 pence in the pound) but also strong indirect and induced GDP embedded in the
UK supply chain. Thus, Figure 4.11 illustrates the industry sources of only the indi-
rect and induced £0.7million in value-added per £1million inal spending on R&D.
The key observation that can be made in comparing Figures 4.10 and 4.11 is that,
while output is supported across a wide range of UK industries, if attention is
focussed on value-added or GDP generated the impacts are more concentrated in
service activities with higher value-added intensities. On the other hand, as has been
found above for other industries, the relative importance of impacts in manufactur-
ing and utility industries decreases when attention is on value-added rather than
gross output.

65Chapter 4 Supply chain
Figure 4.11 Composition of indirect and induced supply chain value-added
requirements for the UK Scientiic Research and Development sector.
Other private and public services
Administrative and support
service activities
Financial and insurance activities
Wholesale, retail trade and repair
Construction and real estate services
Other
Transportation and storage
Electricity, gas, water and waste
All mining, quarrying and support
Own sector
Agriculture and food services
All manufacturing
Professional, scientiic and technical activities
Information and communication
5%
9%
7%
6%4%
2%
12%
13%
11%
11%
15%
38%
3%
2%
From Figure 4.11, the biggest share of indirect/induced value-added required/
supported by R&D spending is in the ‘Other private and public services’ grouping.
Just over half of this is located in the UK Education sector, where academic depart-
ments in universities are located and there is both high direct value-added and strong
supply chain linkages involving GDP generation. As will be explored in Chapter 6,
this type of supply chain activity is particularly strong in the wage income element
of value-added.
Note that, as in the case of other industries where multiplier impacts are decom-
posed in this chapter, that an important area for impact in the R&D supply chain is
in the UK construction industry (combined in the igures with the renting/leasing of
property/land through real estate services). In moving to consider the UK construc-
tion industry as a potential investment target to enable a step-change in the shift to
a hydrogen economy, this result emphasises a point already made for R&D above.
That is, the impacts of construction spending will be incorporated in the multipliers
of other industries where they and/or their up-stream supply chain partners commit
part of their operational spending to on-going construction activity (including rou-
tine maintenance etc.).
Again though, if a boost to construction activity is required to enable a major step-up
in capability and/or capacity, for example, in building hydrogen re-fuelling stations
and/or installing pipelines for hydrogen supply and/or carbon sequestration, addi-
tional spending in the form of government and/or private investment to enable capital
formation may be required. If this is the case, it is appropriate to directly apply that
spending to multiplier values for the construction industry. However, this must be
done in the context that the boost from any investment in construction may be short-
term in nature, relating only to the additional investment required with multiplier

66 A H2FC SUPERGEN White Paper
impacts in other industries potentially not lasting much longer than the construction
project in question. On the other hand, where major infrastructure development is
required, project periods could last a number of years.
Figure 4.12 shows the results of decomposing the indirect and induced components
(1.31 of a total 2.31) of the UK construction industry output multiplier. Figure 4.11
then considers the related indirect and induced GDP content, or the 0.6 component
of the 1.01 output-GDP multiplier that is not directly generated in the construction
sector itself.
In contrast to the case of R&D, comparison of Figures 4.12 and 4.13 illustrates a
similar spread of output and GDP impacts across UK industry groupings in the UK
construction industry supply chain. Again, the core inding is that the relative impor-
tance of impacts in some service orientated industries tends to grow when focus is on
value-added while the opposite is true of manufacturing and utility industries.
Another key observation is the importance of ‘own sector’ indirect and induced
impacts in the construction industry, which implies some over-aggregation of activi-
ties in the ‘construction’ industry in the UK input-output accounts. The input-output
sector incorporates all of SIC grouping 41–43, which encompasses construction of
buildings (SIC 41), civil engineering (SIC 42) and specialised construction services
(SIC 43), where the latter includes plumbing, glazing, rooing etc.
Figure 4.12 Composition of indirect and induced supply chain output
requirements for the UK Construction sector.
Wholesale, retail trade and repair
Own sector
All manufacturing
Other
Information and communication
Transportation and storage
Real estate services
Electricity, gas, water and waste
All mining, quarrying and support
Agriculture and food services
Other private and public services
Administrative and support service activities
Professional, scientiic and technical activities
Financial and insurance activities
5%
7%
5%
7%
6%5%
3%
22%
11%
18%
49%
4%
6%
1%

67Chapter 4 Supply chain
Figure 4.13 Composition of indirect and induced supply chain value-added
(GDP) requirements for the UK Construction sector.
Wholesale, retail trade and repair
Own sector
All manufacturing
Other
Information and communication
Transportation and storage
Real estate services
Electricity, gas, water and waste
All mining, quarrying and support
Agriculture and food services
Other private and public services
Administrative and support service activities
Professional, scientiic and technical activities
Financial and insurance activities
5%
8%
6%
8%
7%
3%
25%
11%
12%
52%
4%
8%
1%2%
4.7.2 Enabling expansion in upstream supply chains of directly
impacted industries
As in the cases of R&D and construction, the supply chain decomposition for key
industries that are likely to be directly affected by a shift to a hydrogen economy has
identiied a range of upstream industries within these supply chains where capacity
may ultimately need to expand. This is partly relected through the multipliers them-
selves, where indirect and induced impacts relect additional input requirements
of supply chain industries. However, there may in practice be constraints on the
capacity and capability of supply industries that will require investment in physi-
cal and/or human capital to enable them to expand as predicted via the application
of simple input-output multipliers. In the context of using input-output multiplier
modelling for scaled scenario analysis, Chapter 9 will highlight the potential need for
more sophisticated economic modelling to consider the need for, and further impacts
of investment requirements on economic adjustment processes.
However, the results of the multiplier decomposition carried out here, and in Chapter
6 for employment, do enable initial consideration of the type of industrial and skills
base that is likely to be required in making the move to a hydrogen economy. This is
the focus of Chapters 5 and 7, and some key observations can be drawn from indings
reported in this chapter (and from Chapter 6 for skills analysis in Chapter 7).
The irst key observation that can be made is in the context of shifting from reined
(petrol and diesel) to hydrogen fuels in a transport context. This chapter has shown
that if either existing gas or electricity supply is taken as a proxy for hydrogen supply,
the UK oil and gas extraction industry is likely to continue to play an important role.

68 A H2FC SUPERGEN White Paper
The multiplier analysis demonstrates that particularly domestic gas extraction is
crucial contributor to the strong UK GDP impacts of a potential shift from reined
fuels (where the import content is high and multiplier impacts thus relatively weak)
to hydrogen produced using a gas resource.
If imported gas were used instead, the beneits to the UK economy would be likely
to remain positive but much more limited. This in turn raises the issue of the need
for investment in CCS to limit the climate change impacts of continued economic
reliance on hydrogen carbons. The introduction of CCS may or may not signiicantly
impact the operational multiplier impacts of spending on a hydrogen fuel (proxied
here by gas or electricity supply). However, as noted in the previous section, invest-
ment irst in R&D and then construction activity to enable large scale CCS may have
signiicant economy-wide impacts, even if over a shorter time frame.
The second key observation is the importance of service activities across the differ-
ent industries for which multiplier impacts have been decomposed in this chapter.
In particular, a common inding has been the importance of the UK inance and
insurance industries in terms of both output and (particularly) GDP impacts of
potential expansion and on-going operation of a hydrogen economy. Consideration
of any increased capacity implications for the UK inance industry must be taken in
the context of net impacts (i.e. given that the hydrogen economy involves replacement
of a traditional fossil fuel economy). However, at least in the transition stages, where
new and additional investment activity must be inanced, this is likely to be positive.
However, assessment of what capacity expansion is possible in practice in the UK
inance industry must of course be subject to uncertainty presented by the current
Brexit transition.
4.8 CONCLUSIONS
This chapter has focussed on examining the composition of the supply chains of
UK industries that are likely to be directly impacted through the three key economic
phases identiied in Chapter 3 as likely for the UK economy to move through in
realising the actualisation of a hydrogen-economy. It has begun to explore the
nature of the hydrogen supply chain activity underlying the headline input-
output ‘multiplier’ values introduced in Chapter 3. It has done so by examining the
composition of these multipliers in terms of gross output and value-added (GDP)
content therein in different UK industries required or supported by key industries that
are identiied as direct players in the ‘hydrogen economy’. It also highlights whether
any boost to activity in a given sector is likely to be temporary (investment activity)
or on-going (operation of the hydrogen economy).
In terms of fuel supply, a key argument of the analysis is the need to consider the net
impacts of moving away from petrol and diesel in transport activity (and thereby
triggering a contraction in the relevant supply industry) and towards hydrogen based
fuel (with proxy industries identiied to consider the nature of expansion. The key
inding was that, provided actual hydrogen supply shares the type of relatively strong
UK supply chain linkages of current gas and electricity supply, net impacts on the

69Chapter 4 Supply chain
UK economy are likely to be positive. However, a large share of the potential posi-
tive GDP impacts on the UK economy originate in the off-shore oil and gas industry.
While this presents dual challenges in the context of (a) the maturing (and currently
declining) off-shore industry, and (b) the low carbon motivations for shifting to a
hydrogen economy, it may also present an opportunity if expansion through knowl-
edge and physical infrastructure development involves a combination of hydrogen
and CCS.
The other key argument emerging from the multiplier analysis in this chapter
is the need to ensure that attention to development of the UK industrial base to
enable a hydrogen economy includes attention to required service sector provision.
Particularly where attention is on value-added (GDP) rather than broader activity
levels, services play potentially as important a role as manufacturing in enabling and
operating a hydrogen economy in the UK. How these arguments extend in the context
of the employment and jobs of supply chain activity to support a hydrogen economy
is the focus of Chapter 6. First, Chapter 5 considers how the indings reported here
impact the potential development of the UK industrial base, including potential scale
and other economies that may be realised through development of industrial clusters.
A inal point to make in concluding this chapter is that the proxies employed prob-
ably do not adequately relect that hydrogen production is liable to be a far more
distributed activity than the UK’s current highly centralised reinery and reined fuels
activity. Hydrogen can be made anywhere that a gas or electricity supply can be found
and even simply for reasons of increased local and national resilience there is great
merit in having such a far more distributed activity. Hydrogen is a relatively awkward
gas to transport other than by pipe on account of its low volumetric density – and if
and when the UK develops a substantive piped hydrogen network there will be areas
where it will not be practical to pipe hydrogen in from distant larger production
facilities. A more distributed activity will almost certainly require a larger measure
of capital investment than a centralised model would, however it also implies more
employment and more economic activity generally. And for that ‘more distributed’
reason alone, the economic igures developed within the model used certainly and
probably quite signiicantly underestimate the amount of economic activity implied
in such a transition.