alasdair cain & jennifer flynn national bus rapid transit institute center for urban...
TRANSCRIPT

Alasdair Cain & Jennifer Flynn
National Bus Rapid Transit Institute
Center for Urban Transportation Research
University of South Florida
Mark McCourt & Taylor Reyes
Redhill Group
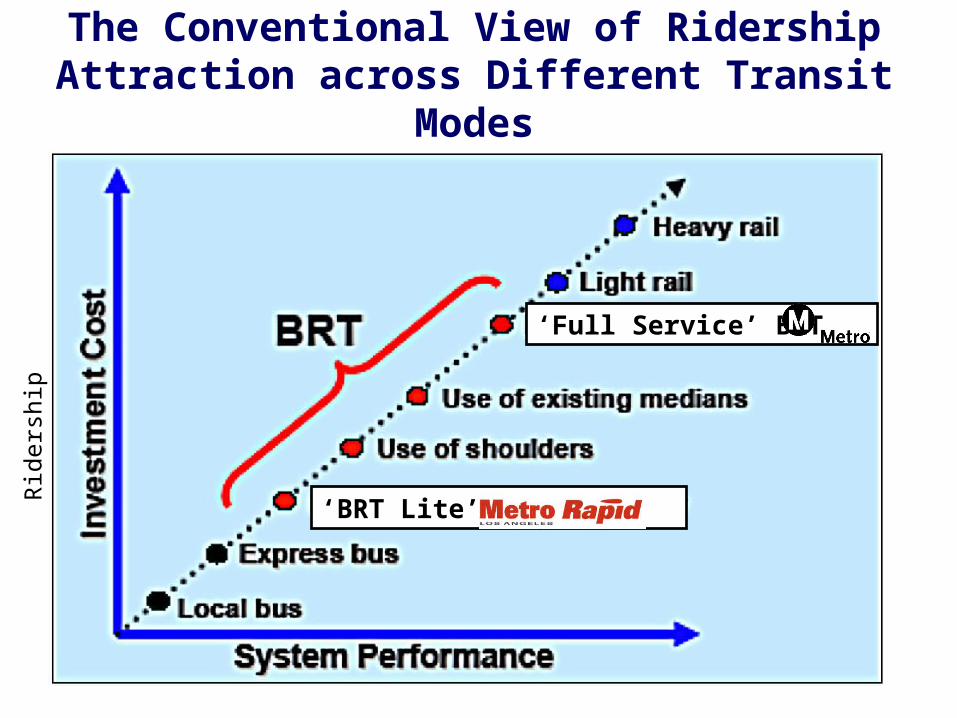
The Conventional View of Ridership Attraction across Different Transit Modes
System performance
Rid
ersh
ip a
ttra
ctio
n
Bus-based transit
Rail-based transit
conventional bus
Heavy rail
“BRT-lite”
“Full service” BRT
LRT
Ridership attraction due to “tangible” service attributes
Ridership attraction due to
“intangible” service attributes
‘BRT Lite’
‘Full Service’ BRT

Study Objectives
• Do people perceive alternative rapid transit modes differently?
• If differences exist, where do they originate?
• Can ridership attraction be attributed to specific tangible and intangible service attributes?
• What variations exist with regard to socio-economic / geographic factors?

Study Methodology
• Literature Review• Los Angeles selected
as case study location• Focus groups in 2007• Attitudinal survey in
2008

Focus Groups
• Group composition:– Mostly choice users with some potential users– Users of local bus, Metro Rapid, Orange Line, Gold/Blue Line,
Red Line • Objectives:
– Identify different tangible and intangible factors– Understand the issues that influence the relative attractiveness of
different rapid transit modes vs private auto– Inform survey design process

Identification of Tangible and Intangible Service Attributes
• Tangible service attributes: – Travel Cost – transit fares, plus related costs like parking
– Door-to-door travel time– Frequency of service – how often the service runs– Hours of service – how early or late service runs, and/or weekend hours– Convenience of service – goes where you need to go/parking availability– Reliability of service – does the service run on time?
• Intangible service attributes: – Safety while riding – safety form accidents and/or crime– Comfort while riding – seats available, temperature, smooth ride, cleanliness, etc.– Safety at the station/stop – safety from accidents and/or crime– Comfort at the station/stop – shelter from weather, amenities, etc.– Customer service – provided by drivers and other transit service staff– Ease of service use – clear service info, routes easy to figure out, etc.– Other riders – feeling secure/at ease/compatible with others using the service– Avoid stress/cost of car use – traffic, parking, accidents, tickets, etc.
Attitudinal Survey
• Survey objectives:– Quantify the relative importance of each tangible and intangible factor– Compare average overall ratings across each mode– Assess impact of socio-economic / geographic factors
• Local LA market research company, Redhill Group, hired to collect and analyze data
• Survey instrument and sampling plan developed in Spring 2008– RDD Telephone survey used to sample potential (non-transit) users– Hybrid On-Board Survey / Telephone Survey used to sample users of
different rapid transit modes • Samples collected of users of the following modes:
– Regular bus - Metro Rapid (“BRT Lite”)– Orange Line (“Full BRT”) - Blue Line (LRT)– Gold Line (LRT) - Red Line (HRT)
• Data collection conducted August – October 2008• Report submitted in February 2009

Do people perceive alternative transit modes differently?
3.4
3.6
3.8
4
4.2
4.4
Local bus Metro Rapid -“BRT Lite”
Orange Line -“Full service” BRT
Blue Line (LRT) Gold Line (LRT) Red Line (HRT)
Ave
rage
Ove
rall
Mod
al R
atin
gs
Total Sample Non-Transit Users
3.4
3.6
3.8
4
4.2
4.4
Local bus Metro Rapid -“BRT Lite”
Orange Line -“Full service” BRT
Blue Line (LRT) Gold Line (LRT) Red Line (HRT)
Ave
rage
Ove
rall
Mod
al R
atin
gs
Total Sample Non-Transit Users
Tier 2
Tier 3
Tier 4
Tier 1

Overall Rating versus Capital Cost per Mile
3.6
3.7
3.8
3.9
4
4.1
4.2
4.3
0 50 100 150 200 250 300 350
Capital Cost per Mile ($M, 2005 dollars)
Ove
rall
Ra
ting
Local bus
Blue Line LRT
Orange Line BRTGold Line LRT
Red Line HRTTier 4
Tier 3
Tier 2
Tier 1
Metro Rapid 'BRT Lite'

Where do the Modal Differences Originate?
Modal Comparisons Summary Analysis
Gold Line LRT
vs. Blue Line LRT
Higher overall ratings achieved by Gold Line compared to Blue Line were primarily due to intangible attributes:
- safety at station, safety while riding, and other riders
Orange Line BRT
vs. Blue Line LRT
Higher overall ratings achieved by Orange Line compared to Blue Line were primarily due to intangible attributes:
- safety at station, safety while riding, and other riders
Orange Line BRT
vs. Gold Line LRT
Similar overall ratings were due to comparable tangible and intangible attribute ratings
Orange Line BRT
vs.
Metro Rapid BRT
Higher overall ratings achieved by Orange Line compared to Metro Rapid resulted from higher tangible and intangible attribute ratings:
- Most significant difference related to station/stop comfort
Metro Rapid BRT vs. Local Bus
Higher overall ratings achieved by Metro Rapid compared to Local Bus were due primarily to higher tangible attribute ratings like travel time, frequency, and reliability

Can Ridership Attraction be Linked to Specific Tangible and Intangible Service Attributes?
3.4
3.6
3.8
4
4.2
4.4
4.6
4.8
5
Servic
e re
liabil
ity
Servic
e fre
quen
cy
Ride sa
fety
Servic
e sp
an
Statio
n/sto
p sa
fety
Servic
e co
nven
ience
Ease
of se
rvice
use
Avoidi
ng st
ress
/cost
of ca
r use
Trave
l Cos
t
Trave
l Tim
e
Ride C
omfo
rt
Custo
mer
Ser
vice
Statio
n/sto
p co
mfo
rt
Other
ride
rs
Ave
rage
Att
ribu
te R
atin
gs
Total Sample Non-Transit Users

Index Regression Models
R Square Constant
Travel Time/Span/
Frequency
Avoiding stress/cost of car use/
Convenience/Ease of Use
Safety/Comfort
Customer Service/
Other Riders
Local 59.9% -.011 .321 .437 .145 .097
Rapid 55.3% .474 .250 .434 .130 .090
Orange 56.9% .425 .274 .401 .179 .067
Gold 57.3% .478 .211 .411 .226 .059
Blue 57.5% .310 .201 .364 .292 .082
Red 56.7% .473 .212 .344 .276 .086

Variation Across Socio-Economic / Geographic Factors
• Overall average rating of each transit service was generally consistent across socio-economic / geographic variables
• Overall average rating of each transit service was positively correlated with level of familiarity with that service
• Travel cost more important for transit captive users• Travel time more important to transit choice users• Transit users (choice and captive) put more weight on service
frequency, travel cost, station comfort, and other riders)• Non-transit users (potential
and auto captive) put more weight on reliability, safety while riding, safety at station/stop, convenience, and customer service

Conclusions
• Public do perceive alternative rapid transit modes differently• Perceived differences linked to level of investment and urban context• Overall perceptions of the different transit modes driven by a mixture of
both tangible and intangible service attributes:– Reliability and service frequency are most important tangible attributes– Safety (while riding and at station/stop) is the most important intangible
attribute, particularly for non-transit users• Tangible attributes (functionality) more important in determining
attractiveness of lower-investment bus-based modes, • Intangible attributes more important in determining attractiveness of
higher investment BRT and rail modes• BRT capable of competing with rail-based transit (at least in the
perception of the general public) in return for lower capital cost investments
• How these ratings translate into ridership attraction potential is a topic for further research………….

Full report can be download at www.nbrti.org/research
Alasdair Cain
(813) 974-5036