alaska-canada rail link strategic environmental … deliverables/stage 2... · feasibility study....
TRANSCRIPT

INFORMATION INSIGHTS, INC.
212 FRONT STREET, STE 100
FAIRBANKS, ALASKA 99701
Prepared for
MACLEOD INSTITUTE
1835 – 20 AVENUE NW
CALGARY, AB T2M 1H4
Alaska-Canada Rail Link Strategic Environmental Assessment Socio-economic Impact Assessment - Alaska
Final Report
JULY 31, 2006


Alaska-Canada Rail Link Strategic Environmental Analysis Socio-economic Impact Assessment - Alaska
FINAL REPORT JULY 31, 2006
Brian Rogers, Principal Consultant – Project Manager Sherry Modrow, Senior Consultant – Socio-cultural Team Leader Jana Peirce, Senior Consultant – Economic Team Leader Jason Bergerson, Consultant Nadine Hargesheimer, Consultant Shelly Wade, Consultant Charles Ermer, Research Analyst Bobby Wilken, Research Analyst Nancy Lowe, Projects Coordinator Elizabeth Fison, Intern Jessica Holden, Intern
Prepared for
Macleod Institute 1835 – 20 Avenue NW Calgary, AB T2M 1H4
Prepared by
Information Insights, Inc. 212 Front Street, Suite 100 Fairbanks, Alaska 99701 (907) 450-2450 phone (907) 450-2470 fax
605 West 2nd Avenue Anchorage, Alaska 99501 (907) 272-5074 phone (907) 272-5076 fax
www.infoinsights.com [email protected]


ACRL SEA Socio-economic Impact Assessment - Alaska
Table of Contents
1 Introduction.....................................................................................................................7
2 Review of Literature and Data Sources for the Socio-cultural Impact Analysis......8 2.1 ACRL corridor communities ...................................................................................8 2.2 Community overviews...........................................................................................13 2.3 Literature review of potential socio-cultural impacts ............................................26 2.4 Impacts of a proposed gas pipeline........................................................................40
3 Regulatory and statutory frameworks........................................................................41 3.1 Strategic Environmental Assessment.....................................................................41 3.2 Public lands in Alaska: ANILCA ..........................................................................42 3.3 National Environmental Policy Act (NEPA).........................................................42 3.4 Achieving meaningful consultation with Native communities and individuals ....46
4 Socio-cultural and Human Ecological Impacts..........................................................47 4.1 Anticipated impacts on resident communities and individuals .............................47 4.2 Human ecological and cultural resources ..............................................................49 4.3 Cumulative impacts ...............................................................................................56 4.4 Preliminary engagement strategy...........................................................................56
5 Overview of Economic Impacts ...................................................................................58
6 Review of Literature and Data Sources for the Economic Impact Analysis ...........62 6.1 ACRL construction and operations........................................................................62 6.2 Alaska resupply .....................................................................................................67 6.3 Minerals development in Alaska ...........................................................................68 6.4 Alaska Highway gas pipeline ................................................................................70 6.5 Alaska North Slope oil and gas operations............................................................72 6.6 Military defense and emergency management benefit ..........................................73 6.7 Other direct impacts...............................................................................................74 6.8 Previous impact studies .........................................................................................74
7 Reference Case: Alaska economy without ACRL......................................................77 7.1 Demographic and workforce trends.......................................................................77 7.2 Alaska Railroad operations....................................................................................77 7.3 Mining industry......................................................................................................78
Information Insights, Inc. 3

ACRL SEA Socio-economic Impact Assessment - Alaska
7.4 Alaska Highway gas pipeline project ....................................................................79 7.5 Alaska North Slope oil and gas industry ...............................................................80
8 Economic Impact of the ACRL ...................................................................................83 8.1 Impacts of ACRL construction and operations......................................................83 8.2 Freight transportation savings................................................................................92 8.3 Effect on Alaska consumer price index ...............................................................102 8.4 Impact on mineral development ..........................................................................102 8.5 Impact on oil and gas development .....................................................................105 8.6 Impact on military defense and emergency management....................................109 8.7 Impact on tourism ................................................................................................109 8.8 U.S. impacts outside Alaska ................................................................................110
9 Miscellaneous Fiscal Effects of the ACRL................................................................111
9.1 Impact on government revenues ..........................................................................111 9.2 Impact on government expenditures....................................................................112
10 Works Cited.................................................................................................................115
Appendix: Land Status in the ACRL Corridor, Alaska ...............................................125
4 Information Insights, Inc.

ACRL SEA Socio-economic Impact Assessment - Alaska
Index of Tables
Table 1: ACRL corridor communities .................................................................................. 9 Table 2: Regional demographics......................................................................................... 13 Table 3: Summary of potential impacts and proposed mitigation measures ...................... 31 Table 4: ACRL capital expenditure for Alaska segments................................................... 63 Table 5: ACRL operating costs........................................................................................... 63 Table 6: Innovative Scheduling projections, Delta Junction to Canadian border............... 64 Table 7: Innovative Scheduling traffic forecast, Delta Junction to Canadian border ......... 64 Table 8: Alaska gas pipeline freight volumes, inbound...................................................... 71 Table 9: Potential traffic flows and revenues from Alaska gas pipeline............................. 71 Table 10: Construction costs of Alaska segments................................................................. 83 Table 11: Economic impacts of ACRL construction on Alaska ........................................... 84 Table 12: Combined impact of Skagway area port and rail projects .................................... 88 Table 13: Workforce projections for ACRL operations ....................................................... 88 Table 14: Percent U.S. crews under one route-cost-traffic scenario..................................... 89 Table 15: Alaska portion of total impact calculations .......................................................... 90 Table 16: Economic impacts of ACRL operations on Alaska .............................................. 90 Table 17: Summary of ACRL mainline and Skagway area impacts on Alaska ................... 91 Table 18: Comparison of container vessels and RO/RO barges with intermodal rail .......... 96 Table 19: Comparison of truck freight costs with intermodal rail ........................................ 96 Table 20: Comparison of rail-barge freight costs with intermodal rail................................. 97 Table 21: Summary of community resupply savings............................................................ 97 Table 22: Resupply savings by mode and commodity type................................................ 100 Table 23: Employment impact of new mine development ................................................. 103 Table 24: Employment multipliers for Alaska’s mining industry ...................................... 104 Table 25: Production value per employee........................................................................... 105 Table 26: Transportation savings on Interior Alaska segments of a gas pipeline............... 108 Table 27: Transportation cost savings for chemicals and metals........................................ 108
Index of Figures Figure 1: Native population in ACRL corridor communities .............................................. 11 Figure 2: Unemployment in ACRL corridor communities .................................................. 12 Figure 3: Map of Southeast Fairbanks census area .............................................................. 14 Figure 4: North Slope oil production forecast...................................................................... 82 Figure 5: Construction employment in Alaska, 2000-2014 ................................................. 85 Figure 6: Impact of gas pipeline and ACRL construction on jobs ....................................... 86 Figure 7: Community resupply traffic flows, 2000-2003..................................................... 98 Figure 8: Potential community resupply diversions with ACRL ......................................... 99 Figure 9: Indirect and induced effects of $1 billion in new mine expenditure................... 104
Information Insights, Inc. 5

ACRL SEA Socio-economic Impact Assessment - Alaska
6 Information Insights, Inc.

ACRL SEA Socio-economic Impact Assessment - Alaska
1 Introduction This report assesses social and economic impacts of linking Alaska to existing railroads in Canada and the U.S. The assessment forms part of an initial scoping of issues that need to be understood by policy-makers and affected communities before deciding whether to proceed with pre-development activities and assessments for a proposed Alaska-Canada Rail Link.
The possibility of connecting the Alaska Railroad to the rest of the North American railway system has been floated as an option since the first tracks led north from Seward. Today, heavy shipping traffic and the current demand for raw materials in domestic and foreign markets have again opened the issue of a railway linking Alaska and Canada.
Several legislative developments over the past six years have given impetus to the current Feasibility Study. In December 2000, the U.S. Congress approved the Rails to Resources Act, authorizing a $6 million (USD) appropriation to create a joint U.S.- Canada commission for a feasibility study. This was followed by a study defining issues relevant to Canada. In 2005, the Governor of Alaska signed Bills SB31 and SB32 into law, which respectively allow for delineation of a transportation corridor between the existing rail corridor and the Canada-Alaska boarder and authorize the Alaska Railroad Corporation to extend rail line to Fort Greeley, Alaska. In all, a rail link from Fairbanks through the Yukon and into British Columbia would require the construction of approximately 1,150 km of rail, most of it in Canada.
This study integrates human ecological and socio-economic factors in a manner that helps stakeholders in both private and public sectors understand the consequences of their choices. A human ecological approach to socio-cultural impacts includes impacts on Alaska Native and Canadian First Nations communities and integrates relations between humans and other animals, plants, and their habitats. Our project team took a systems-wide perspective, looking first at local communities in the rail corridor, then at state, provincial and national/international elements.
The report assesses merits, risks and impacts associated with public sector support and investment in an Alaska-Canada Rail Link. The intent is to ensure choices that support economic, social and environmental sustainability over the long term. This provides an early warning, long-range assessment of likely construction and operations impacts and benefits to both the natural and human environment from such an investment.
The final decision support document will combine bio-physical, social, economic and related factors to assist decision-makers in their deliberations as to whether, when and to what extent they should consider investing in the rail link. The document will integrate trans-boundary and sustainability perspectives into the assessment. Integrative analysis and interpretation will produce a decision support document that is consistent with the true intent of Strategic Environmental Assessments, giving decision-makers a solid foundation for moving forward with this important initiative.
Information Insights, Inc. 7

ACRL SEA Socio-economic Impact Assessment - Alaska
2 Review of Literature and Data Sources for the Socio-cultural Impact Analysis
This section summarizes the literature and data sources that form the basis of the socio-cultural analysis. In the case of socio-cultural and human ecological impacts, the best sources of information are often the individuals who will be impacted, and this section includes data from personal interviews in addition to published information. In preparing to analyze the potential human impacts of the ACRL, we asked the following questions:
Which communities live in the corridor? What is the demographic makeup of the communities? What adverse or beneficial implications of socio-cultural impacts could become potential
deal makers and deal breakers for the ACRL? What specific community, livelihood and gender impacts can be anticipated? How will changing local economies affect the cultural backbone of people who live in the
rail corridor and adjacent to it? What planning, research and remediation will be required? How will the project affect abundance of subsistence resources, access to subsistence
resources, and quality of subsistence resources? What fish and wildlife dynamics need to be included? What cultural resources analysis needs to take place? How will new activity cumulatively affect the subsistence resources and economy of the
Upper Tanana region? Are the impacts direct and exponential? What are the adverse and unintended impacts and potential strategies for mitigation
and/or management? What land ownership and land use considerations need to be part of this discussion?
2.1 ACRL corridor communities Table 1 identifies the communities located within the economic watershed of the proposed Alaska-Canada Rail Link and includes basic demographic information for each. Communities are listed in alphabetical order. The State of Alaska records high rates of unemployment for many of the communities in the ACRL corridor. The state does not track subsistence as a form of employment, and some authors consider this to be a misrepresentation of the occupational status of village residents (Lonner, 1980). For this reason we include an indicator for subsistence characteristics as a basic demographic feature in the table below. The subsistence way of life incorporates hunting and food-gathering, cultural and environmental knowledge, education and employment into a multi-faceted way of life not captured by government statisticians.
Following the table is a set of maps showing the relative population size, the proportion of the population that is Alaska Native, and the unemployment rate for corridor communities.
8 Information Insights, Inc.

Table 1: ACRL corridor communities
Population Employment Community Total Percent
Native Industries Percent
unemployed
History and Culture
Subsistence Governance Location
Chicken 14 0 Tourism 0 Historic home of Han Kutchin people.
Not known No formal structure
Taylor Hwy, Mile 66;
Delta Junction Deltana
1,047 1,939
5 Farming; missile defense; mining
11.6 Tanana Athabascans occupied the area historically.
Moose, caribou, bear, sheep, waterfowl
City of Delta Junction (2nd Class); Deltana is unorganized rural area
At junction of Richardson and Alaska Highways; 95 miles from Fairbanks
Dot Lake Dot Lake Village
27 33
5 73
Dot Lake Lodge
40.0 Long used by hunters; area has an Athabascan freight trail. Edible plants harvest is higher than regional pattern.
Moose, caribou, sheep, grouse, hare, waterfowl, bear, porcupine, squirrel; berries and edible plants.
Native Village of Dot Lake; Tanana Chiefs Conference (TCC)
On Alaska Highway between Delta and Tok
Eagle Eagle Village
137 78
7 44
School, mining; seasonal jobs
14.3 Home of Han Kutchin Indians
Moose, caribou and other resources
First Class City; Native Village of Eagle; TCC
End of Taylor Highway
Fort Greely 197 < 5 Missile facility
3.2 In 1948, Fort Greely became Northern Warfare Training Center; then U. S. Army Cold Regions Test Center
Not significant subsistence usage
Five miles south of Delta Junction on Richardson Highway
Haines 1811 18.5 Commercial fishing; government; tourism; transport
13.6 Chilkat Indian territory; became mining supply center in Klondike gold rush of 1890s
Not a significant subsistence usage community
Central Council Tlingit & Haida Indian Tribes; Chilkoot Indian Association
Western shore of Lynn Canal; 80 air miles NW of Juneau
Information Insights, Inc. 9

ACRL SEA Socio-economic Impact Assessment - Alaska
Population Employment Community Total Percent
Native Industries Percent
unemployed
History and Culture
Subsistence Governance Location
Healy Lake 29 73 Subsistence; seasonal jobs outside the village
17.9 Population changes seasonally
Moose, caribou, waterfowl, Dall sheep, fishing
Healy Lake Village Council; TCC
29 miles east of Delta Junction; not connected to road system
Mentasta Lake
142 71 Subsistence; trapping; little cash employment
20 Best-known route of Athabascan migration across Alaska Range
Hunting, fishing, trapping and gathering
Mentasta Lake Village Council; Copper River Native Assoc.
38 miles SW of Tok Junction; 6 miles off Tok-Slana Cutoff of Glenn Hwy
Northway Northway Junction Northway Village
87 78
99
82 58
95
Subsistence, construction, trapping and seasonal fire fighting
13.5 Athabascans used area for seasonal subsistence; WW II brought airport construction
Moose, caribou, sheep, bear, waterfowl, fish, roots, berry picking
Northway Village Council; TCC
50 miles SE of Tok
Skagway 834 5 Cruise destination; tourism; freight; fishing
14.1 "Skagua" was the Tlingit name; site of Klondike staging and WP&YR, first railroad in Alaska
Not a significant subsistence usage community
First Class City; Skagway Traditional Council
90 miles NE of Juneau; 108 road miles south of Whitehorse, YT
Tanacross 149 90 Subsistence, trapping, Native handicrafts, seasonal jobs
57.1 Tanah or Tinneh Athabascans; old village site across Tanana River burned in 1979
Moose, caribou, fish, plants and berries
Tanacross Village Council; Tanacross Incorporated
12 miles NW of Tok on Alaska Highway
Tetlin 150 97 Subsistence; tribal and seasonal jobs; trapping
46.9 Historic home of semi-nomadic Athabascan people
Moose, grouse, waterfowl, fish
Tetlin Tribal Council
On Tetlin River, 20 miles SE of Tok, in Tetlin Nat’l Wildlife Refuge
Tok 1459 19 Transport, services, tourism, state & federal jobs; subsistence, trapping
18 Traditionally an Athabascan area; Alaska Road Commission Camp (1942), US Coast Guard LORAN station (1976)
Berries, moose, caribou, sheep, bear, fish
Tok Native Association; TCC
Junction of Alaska Hwy and Tok Cutoff to Glenn Highway

ACRL SEA Socio-economic Impact Assessment - Alaska
Figure 1: Native population in ACRL corridor communities
Information Insights, 2006
Information Insights, Inc. 11

ACRL SEA Socio-economic Impact Assessment - Alaska
Figure 2: Unemployment in ACRL corridor communities
Information Insights, 2006
12 Information Insights, Inc.

ACRL SEA Socio-economic Impact Assessment - Alaska
2.2 Community overviews Communities within the economic watershed of the proposed Alaska-Canada Rail Link were contacted for this study and interviewed about potential social, economic, and cultural impacts of a rail link with Canada. Opinions provided in community interviews have been combined with baseline demographic and economic data from the Alaska Division of Community Advocacy’s Community Database Online (2006) to create the following thumbnail sketches of the communities expected to be impacted by the ACRL. Some generalizations have been made for communities that could not be reached in time for this report.
2.2.1 Upper Tanana region The communities in the Upper Tanana region have primarily subsistence-based economies. Few wage-earning positions are available, with tourism and government positions being the highest employers. Of the communities interviewed, all representatives noted their community would welcome additional wage earning employment, with the caveat that their subsistence way of life would have to be taken into consideration and protected.
Regional overview The Upper Tanana region falls within the Southeast Fairbanks Census Area. Baseline demographic information for the area was retrieved from the U.S. Census State & County Quick Facts site for census year 2000, and is compared against the State of Alaska as a whole.
Table 2: Regional demographics
Demographic Identifier Southeast Fairbanks C.A. State of Alaska
Total Population 6,174 629,932Percent of population American Indian or Alaska Native
12.7 15.8
Language other than English spoken at home, age 5+
16.4 14.3
High school graduates, percent of persons age 25+
86.8 88.3
Bachelor’s degree or higher, percent age 25+ 18.2 24.7Median value of owner-occupied housing units
$86,000 $144,200
Median household income, 2003 Census $40,869 $52,391Percent of persons below poverty, 2003 Census
15.7 9.9
Land area (square miles) 24,815 571,951Persons per square mile .2 1.1
Source: U.S. Census Bureau, 2000
Information Insights, Inc. 13

ACRL SEA Socio-economic Impact Assessment - Alaska
Figure 3: Map of Southeast Fairbanks census area
Source: U.S. Census Bureau
City of Delta Junction Delta Junction lies 95 miles southeast of Fairbanks at the junction of the Richardson and Alaska Highways. The Second Class City adjoins a large, unorganized rural residential area called Deltana; the combined area has an estimated population of between three and eight thousand people.
During personal communication (May 18, 2006) with community consultant Lamar Cotten, he noted no philosophical barrier to a railroad coming to Delta, and saw it as an opportunity to assist the town. Currently, a majority of travelers get gasoline in Tok and attempt to continue on to Fairbanks without stopping. A possible cause for this could be due to the community layout: there is no center or hub for the community. The addition of a railroad depot could serve as a center, improving the community’s ability to draw travelers out of their cars and into more interaction in the town.
The area has not been identified as a tribal land area; no known archeological or topographical features would hinder building and permits. Some discarded nerve gas containers of cold war origin required clean up. Although none are known at this time, more may be found upon excavation. (Cotten, 2006)
Delta has roughly 40,000 acres of farmed land, producing barley, grains, potatoes, dairy products, cattle, and hogs. Subsistence is not a major factor in the area, although residents hunt for moose, caribou, bear, sheep, and waterfowl. The area is a major producer of high quality gravel.
14 Information Insights, Inc.

ACRL SEA Socio-economic Impact Assessment - Alaska
Wage earning employment in the area is widely available in all types of industry from agriculture to professional services. By far the largest employer in the area is the educational, health and social services field providing 23.6 percent of employment. A large agricultural industry produces barley, grains, potatoes, dairy products, cattle, and hogs (DCCED, 2006). The area is also a major producer of high quality gravel (Cotten, 2006).
The majority of residents (94 percent) are non-Native, with 11.6 percent of the population unemployed and nearly 20 percent living in poverty. Median annual household income for the area ranges from $43,00-$49,000. Native entities active in the area include Doyon Limited and Tanana Chiefs Conference (DCCED, 2006).
Fort Greely Approximately 100 miles southeast of Fairbanks and five miles south of Delta Junction on the Richardson Highway, this decommissioned military base serves as a missile interceptor facility site as of 2004.
The Pentagon expects to expand Fort Greely in two-year increments as new technology becomes available. To speed up the ground-based midcourse defense deployment, engineers are preparing to extend the Alaska Railroad to Delta Junction and Fort Greely. The military supports railroad expansion, expecting positive effects from its presence. Recent changes in military plans, however, are leading to layoffs that will affect Fort Greely and the surrounding communities.
The population is two percent Native; three percent of the work force is unemployed, with 16 percent of the community living in poverty. Median household income of $33,750 annually falls short of the median in nearby Delta.
Native entities active in the area include Doyon Limited and Tanana Chiefs Conference. Native subsistence is not a factor for this community (DCCED, 2006), although hunting is a leading source of food and recreation for residents of the community and environs.
Dot Lake and Dot Lake Village Dot Lake is located on the Alaska Highway, 50 miles northwest of Tok and 155 miles southeast of Fairbanks. In addition to Dot Lake, Dot Lake Village is located in the area with a land area of only 3.6 square miles. The area is referred to as an “ice edge”, 13 feet from the water table with permafrost surrounding the village area up to the mountain on one side and wetlands on the other.
There is no industry in either community. Wage-earning employment is provided through service occupations, professional, and self-employment. Subsistence is the primary form of sustenance for area residents. Moose is the primary source of meat with caribou being secondary. Caribou should not be affected by placement of a rail – the herds live in the mountain areas. Fishing is not a primary source of subsistence for their area. Salmon runs do not reach this region, although a Department of Natural Resources study did find a salmon spawning area close by. Berry picking is important, with raspberry, blueberry, blackberry, and cranberries harvested. There is no single, central location for the berries; they are dispersed throughout the area, reducing concerns about impacts from rail construction (Miller, 2006).
Information Insights, Inc. 15
ACRL SEA Socio-economic Impact Assessment - Alaska
Dot Lake Village resident Ted Charles (Tribal Development Specialist, personal communication, June 2006) felt construction of a railway system through their land would benefit the area with reduction of freight costs and an alternate means of re-supplying.
A previously proposed railroad route put the rail between the school and highway; the community would oppose any plan requiring that location for this rail. Individuals consulted for Dot Lake did not know of archeological issues that would impede building; however, there is archeological evidence in the nearby area of Healy Lake. There are a few small areas with Native allotment land and cemetery areas inside village boundaries according to T. Charles, Tribal Development Specialist for Northway Village Council (personal communication, June 12, 2006).
The population of Dot Lake is five percent Native; 40 percent of the work force is unemployed. Median household income for residents is $13,750; six percent of the community lives in poverty. Native entities active in the area include Doyon Limited and Tanana Chiefs Conference (DCCED, 2006).
The population of Dot Lake Village is 73.7 percent Native; none of the work force is unemployed. Median household income for villagers is $16,250; 19 percent of the community lives in poverty. Native entities active in the area include Doyon Limited, Tanana Chiefs Conference, Village of Dot Lake, and Dot Lake Native Corporation. Dot Lake Village received 69,120 acres in the Alaska Native Claims Settlement Act (DCCED, 2006).
Eagle and Eagle Village Located on the Taylor Highway, the First Class City lies six miles west of the Alaska-Canadian border on the left bank of the Yukon River. The Yukon-Charley Rivers National Preserve is northwest of the town. The community of Eagle Village is located 3 miles east of the City of Eagle on the Taylor Highway.
Tribal lands surround the city and village, and tribal lands receive protection under the Federal Trust Lands Act. Doyon Limited and the Eagle Village corporation own land, and individuals own restricted Native lands in allotments ranging from 40 to 160 acres. Sources consulted believed rights to the land could be negotiated with a mutually beneficial result, but it would take time (personal communication, Isaac Juneby, Eagle Village Chief, May 12, 2006).
Chief Juneby feels if wage-earning employment were available through railroad construction, the community would be more inclined to back the building through their lands (personal communication, May 2006). There is an extensive disparity between communities for unemployment rates; largely Native populated Eagle Village suffers a 40 percent higher rate than the City of Eagle. Of the positions currently available in both communities, social services, service providers, and public administration are the highest employers.
Subsistence is a major factor in the community. There is a current shortage of moose in the area and there are noted concerns that a railroad may deepen that shortage. Additionally, concern was voiced over any impact construction might have on the Yukon River salmon fisheries. The community trusts that the Department of Fish & Game would provide an adequate environmental impact assessment of the area (Juneby, 2006).
16 Information Insights, Inc.

ACRL SEA Socio-economic Impact Assessment - Alaska
The population of the City of Eagle is seven percent Native; median household income is $36,042. Fourteen percent of the city work force is unemployed, with 17 percent of the city population living in poverty. The population of Eagle Village is 44 percent Native and 57 percent of the village work force is unemployed. Median household income is the lowest along the proposed railway at $6,875, and 56 percent live in poverty.
Native entities active in the area include Doyon Limited, Tanana Chiefs Conference, Village of Eagle, and Hungwitchin Corporation. Eagle Village received 92,160 acres in the Alaska Native Claims Settlement Act (DCCED, 2006).
Healy Lake The small, primarily Native community of Healy Lake is located along the Healy River, 29 miles east of Delta Junction. Healy Lake is not connected to the road system.
The majority of the population is Athabascan but there are non-Native residents in the community. Residents rely heavily upon subsistence for sustenance. Moose are hunted year-round; Dall sheep are taken in the fall and early winter; caribou and waterfowl are sought during the spring and fall. Fishing is primarily a summer subsistence activity. Wage employment is in the social services and public administration fields.
The population is 73 percent Native. Unemployment is 18 percent and nine percent of the community lives in poverty. Median household income is high in comparison to other communities in the area of the same size at $51,250 (DCCED, 2006).
Native entities active in the area include Doyon Limited, Tanana Chiefs Conference, Healy Lake Village Council, and Mendas Cha-ag Native Corporation. Healy Lake received 69,120 acres in the Alaska Native Claims Settlement Act (DCCED, 2006).
Mentasta Lake This primarily Athabascan community is located six miles off the Tok-Slana Cutoff of the Glenn Highway and connected to the Glenn Highway by a spur road. The area encompassing Mentasta Lake was utilized for Native immigration across the Alaska Range.
Subsistence activities are important; little wage earning employment is available. The population is 71 percent Native, and 28 percent of the work force is unemployed. Thirty-six percent of the community lives in poverty. Wage earning opportunities are available in the social services, education, and public administration classifications. Residents earn an average of $17,344 yearly (DCCED, 2006).
Native entities active in the area include: Ahtna Incorporated, Copper River Native Association, and Mentasta Lake Village Council. Mentasta Lake received 69,120 acres from the Alaska Native Claims Settlement Act (DCCED, 2006).
Northway The Northway community includes three distinct settlements: Northway Junction, Northway, and Northway Village. The unincorporated community of Northway is located 42 miles from the Canadian border in the Tetlin National Wildlife Refuge, 50 miles southeast of Tok. It connects to the Alaska Highway by a nine-mile spur road. Northway Village is located two miles from the Northway Airport, with Northway Junction 5.5 miles to the northeast.
Information Insights, Inc. 17

ACRL SEA Socio-economic Impact Assessment - Alaska
Darrell Kaase, Environmental Engineer for Northway Tribal Council (personal communication, June 12, 2006) felt there could be positive economic benefit for the area if a station was placed in the Northway area. Local crafts, an increase in traffic flow, and utilization of stores and local businesses were examples of possible benefits (Kaase, 2006).
In 1941-1942 The U.S. Army Corps of Engineers built the airport directly over Indian burial ground, and graves were dug up and burned (Wisniewski, 2003). Resentment continues as a result of the cemetery destruction and improper disposal of wastes as well as treatment Northway Natives experienced from the Army Corps of Engineers and the FAA during the construction of the FAA Station. Many fear that the animals around their hunting lands are contaminated with waste from the airport construction period. The possibility of infected animals has discouraged younger people from eating traditional foods and caused them to lose their heritage, according to local sources.
The community has a rich background in both the cultural and archeological sense. There are old hunting sites, camps, and gravesites located throughout the region; some gravesites are known only to family members, while others are known to the public (Kaase, 2006). Northway Native Village is surrounded by wetlands that support local waterfowl and provide an annual migration route for ducks, swans, cranes, and other bird species migrating. Some Northway residents fear construction may have a negative impact on caribou migration and moose calving and a general disturbance to the local animal and bird population (Kaase, 2006).
A traditionally Athabascan population represents between 41 percent and 95 percent of current residents for the communities. Subsistence activities are important to the Native population even with wage earning employment being significantly high. Residents of the City of Northway and Northway Junction annually earn a median household income of $59,000-$67,500 respectively. Northway Village however, dramatically lower median household earnings at $24,688 in comparison, yet still relatively high for their size in the region. The local airport provides the majority of the employment with an FAA Flight Service Station and a U.S. Customs office.
The population of Northway is 82 percent Native; 14 percent of the work force is unemployed, with 21 percent of the community residents living in poverty. Northway Junction population is 58 percent Native. Six percent of the work force is unemployed, and 16 percent of the community lives in poverty. The Village of Northway has a population that is 95 percent Native; 31 percent of the work force is unemployed, and 25 percent of the residents are living in poverty (DCCED, 2006).
Native entities active in the area include Doyon Limited, Tanana Chiefs Conference, Northway Natives Incorporated, and Northway Village Council. Northway Village received 115,200 acres in the Alaska Native Claims Settlement Act (DCCED, 2006).
Tanacross Located at Milepost 1324 of the Alaska Highway, Tanacross sits on the south bank of the Tanana River, approximately 12 miles northwest of Tok.
Tanacross has a predominantly Athabascan population, with 90 percent of area residents listed as all or part Alaska Native. Subsistence and summer employment comprise the local economy. A tribally owned washeteria and health clinic provide much of the wage
18 Information Insights, Inc.

ACRL SEA Socio-economic Impact Assessment - Alaska
employment. Two corporations, Orh Htaad Global Services and Dihthaad Construction, also employ members of the tribe.
Subsistence activities include harvesting moose, predominantly in September, and caribou from August to September. Trap lines run from January through March. Freshwater fishing for whitefish occurs primarily in June and July, and plants and berries are harvested April through September.
The population is 90 percent Alaska Native; 57 percent of the work force is unemployed, and 33 percent of the community residents live in poverty. A median yearly household income of $22,083 provides employed residents with cash incomes to supplement their subsistence activities (DCCED, 2006).
Native entities active in the area include Doyon Limited, Tanana Chiefs Conference, Native Village of Tanacross, and Tanacross Incorporated. Tanacross received 92,160 acres from the Alaska Native Claims Settlement Act (DCCED, 2006).
Tetlin Located within the Tetlin National Wildlife Refuge and along the Tetlin River, Tetlin is 20 miles southeast of Tok and connected by road to the Alaska Highway.
Athabascan people have utilized this area throughout history for seasonal hunting and fishing camps. The current population is 97 percent Native. The economy is based on subsistence, with Elder benefits providing a significant means of purchasing necessities to participate in hunting activities. Forty-six percent of the population is unemployed, with 48 percent living in poverty. Tetlin residents are the second lowest wage earners in the region with a median household income of $12,250 annually (DCCED, 2006).
Hunting for moose occurs in late summer and early fall. Fur trapping occurs when winter snowfall provides cover. Grouse, ptarmigan, and hare are hunted throughout the year, while waterfowl are primarily taken in the fall. Salmon does not reach Tetlin, leaving whitefish as the main species of fish harvested.
Native entities active in the area include Doyon Limited, Tanana Chiefs Conference, and the Native Village of Tetlin. Tetlin received 743,159 acres in the Alaska Native Claims Settlement Act (DCCED, 2006).
Tok Known as the “Gateway to Alaska,” Tok is located 93 miles from the Canadian border at the junction of the Alaska Highway and the Tok cutoff to the Glenn Highway.
Originally an Athabascan settlement, the current population is primarily non-Native. The unorganized community of Tok serves as the hub for the Upper Tanana region’s transportation, business, and government services. In addition to summer tourism traffic due to the Alaska Highway, construction, transportation, and health and social services provide wage-earning employment. Median annual household income is $37,941 annually, with subsistence activities supplementing purchased supplies (DCCED, 2006).
The population is 19 percent Alaska Native. Eighteen percent of the work force is unemployed, with 11 percent of the community living in poverty. Native entities active in the area include Doyon Limited and Tanana Chiefs Conference (DCCED, 2006).
Information Insights, Inc. 19
ACRL SEA Socio-economic Impact Assessment - Alaska
Chicken This very small unincorporated community is located 58 miles southwest of Eagle, at mile 66 of the Taylor highway on the right bank of Chicken Creek. Area residents only have road access during the summer months and rejoice in quiet winters and tourist-filled summers for employment. History of a bygone era provides employment for residents with the Chicken Creek Saloon, the Original Chicken Gold Camp Café, Chicken Outpost, and the historic Pedro Dredge drawing travelers off the Alaskan Highway and into their community.
Residents are all non-Native and there is no reported unemployment or percentage in poverty with a median household income of $66,250. Native entities active in the area include Doyon Limited and Tanana Chiefs Conference (DCCED, 2006).
2.2.2 Skagway and Haines
City and Port of Skagway Skagway is a First Class City located 90 miles northeast of Juneau at the northernmost end of Lynn Canal, near the Canadian border with British Columbia. The City of Skagway aims to increase year-around employment opportunities and develop new business areas, but not at the expense of the tourism market. Mayor Tim Bourcy and City Manager Robert Ward (personal communication, May 4, 2006) do not believe there would be philosophical opposition or an ecological reason to prohibit a year-round railroad coming into Skagway. The White Pass &Yukon Railroad currently operates as a tourist attraction in summer months.
There are several practical obstacles to rail expansion, however. The railroad dock was used for freight, but can no longer load or unload rail freight. Currently northbound freight comes in via Alaska Marine Life Barge and gets trucked out (Ward, 2006). The port access committee is working on the separation between freight and tourism docks. Previously, when freight came into Skagway it shared the same dock as tourists, causing a hazard. The current freight dock, known as the “ore” dock has less capacity than may be needed, depending on amount of freight to be processed. During winter months, the entire dock could be utilized. This would provide tremendous capacity, but would be unavailable during the tourist season (Bourcy, 2006).
Although Skagway owns the land, WP&YR holds the property lease on all but a minor piece of the port. The community has recently had contact from entities interested in shipping coal and mineral concentrates through Skagway from the Yukon; the gas pipeline also could ship pipe-building supplies via this port (Bourcy, 2006). At least two studies (one by KPMG and one by HDR) have provided redevelopment scenarios to increase port capacity, and the Skagway Development Corporation is tracking their results, according to Michael Catsi, the Executive Director. WP&YR currently handles scheduling of port traffic, but the railroad is primarily concerned with cruise passenger traffic in summer. Sherwood Copper plans to begin shipping at least six trucks per day of ore through the Port of Skagway. The possibility of operating as the trans-ship facility for 60 to 70 trucks of coal daily increases the urgency for the City to develop capacity for ore handling and storage, as well as dock space for larger ships, with a more flexible port schedule (Bourcy, 2006; Catsi, 2006).
20 Information Insights, Inc.

ACRL SEA Socio-economic Impact Assessment - Alaska
Information Insights, Inc. 21
Affordable housing in good condition is in short supply. Expansion of the existing rail facilities would require housing for construction crews, particularly in summer. Construction of new retail space, flood control and port facilities has provided a boost to the economy in recent years, but the housing shortage has become a concern even for winter construction crews (Ward, 2006; Catsi, 2006).
The population is 95 percent non-Native, with14 percent of the work force unemployed, and four percent of the community living in poverty. Median household income for area residents is $49,375 annually (DCCED, 2006).
Native entities active in the area include: Sealaska Corporation, Central Council Tlingit & Haida, and the Skaqua Traditional Council (DCCED, 2006).
City of Haines and Haines Borough Eighty air miles northwest of Juneau and located on the western shore of Lynn Canal, Haines sits just south of the Canadian border and is on the road system.
Originally Chilkat Indian territory, the area now hosts primarily a non-Native community. Tourism and traffic drawn as a result of the road connection to the Alaska Marine Highway System ferries are major factors in the community’s economy. Approximately 45,000 cruise ship passengers visit Haines yearly.
The ice-free, deep-water port, and dock offer year-round road access to Canada and Interior Alaska on the Haines and Alaska Highways. The area serves as the northern boundary for the Alaska Marine Highway (ferry) System, a cruise ship port-of-call, and a hub for transportation to and from southeast Alaska. The port also houses a State-owned seaplane base, two small boat harbors, a State Ferry terminal, and a cruise ship dock. Freight arrives by ship, barge, plane and truck.
Tourism and traffic drawn as a result of the road connection to the State Ferry are major factors in the community’s economy. In addition to the tourism industry, educational, health and social services, and construction provide a large quantity of the employment market.
The Chilkat Bald Eagle Preserve was created by the State of Alaska in1982 to protect 48,0000 acres for bald eagle habitat and salmon spawning activities. The preserve, with over 200 nesting eagles annually, captivates visitors from around the world. During the months of October to January thousands of eagles can be seen along the Chilkat River (City of Haines, 2006).
The population is 19 percent Native. Fourteen percent of the work force is unemployed, with 8 percent of the community living in poverty. Median household income for the community is $39,900 (DCCED, 2006).
Native entities active in the area include Sealaska Corporation, Central Council Tlingit & Haida Indian Tribes of Alaska, and Chilkoot Indian Association of Haines. Haines received 891 acres from the Alaska Native Claims Settlement Act (DCCED, 2006).
The maps on pages 11-12 provide graphic representation of percentages of Native population and unemployment in Upper Tanana communities and Haines and Skagway. In each figure, the size of the pie chart corresponds to the relative size of the community.

ACRL SEA Socio-economic Impact Assessment - Alaska
2.2.3 Alaska Railroad corridor
City of Fairbanks In the heart of Alaska, Fairbanks serves as the regional service and supply center for Interior Alaska. Located on the banks of the Chena River in the Tanana Valley, Fairbanks is 45 minutes from Anchorage by air, at a distance of 358 road miles.
Fairbanks offers a varied economy, including city, state, and federal branches of government, retail-trade, transportation, communications, tourism, finance, and regional medical services. Fort Wainwright, located in the city, and Eielson Air Force Base 30 miles southeast, bring thousands of family members into the community and workforce. Government services employ over one-third of Fairbanks residents. Summer tourism draws approximately 325,000 tourists to Fairbanks annually.
Currently the second-largest city in Alaska, the population of 30,000-plus has 13.3 percent residents who are all or part Alaska Native. Median household income for the area is $40,000 annually, with 10.5 percent of the population living in poverty. Unemployment for the city is 10.9 percent (DCCED, 2006).
Fairbanks North Star Borough The Fairbanks North Star Borough includes and surrounds the City of Fairbanks and comprises the second-largest population center in the state. Additional communities include College, Eielson Air Force Base, Ester, Fox, Harding Lake, Moose Creek, City of North Pole, Pleasant Valley, Salcha, and Two Rivers.
City, borough, state and federal government agencies, including the military, provide over one-third of borough employment. The Borough School District and the University of Alaska Fairbanks are the primary public employers. Approximately 6,000 residents are military. Retail services, gold mining, tourism, transportation, medical, and other services make up the primary private sector activities.
Fairbanks serves as a transportation hub for the northern communities of Alaska. Located at the convergence of the Richardson, George Parks, Steese, and Elliott Highways, Fairbanks connects the Interior to Anchorage, Canada and the Lower 48 states. Truck, rail and air services provide transportation of cargo. Eielson Air Force Base and Fort Wainwright also conduct flight operations in the area.
The communities in the borough are predominantly non-Native, with 9.9 percent of the 82,840 residents listed as Native; nearly eight percent of the population is living in poverty, and 9.1 percent of the workforce is unemployed (DCCED, 2006). Median household income for the borough, $49,000, exceeds that of the City of Fairbanks.
City of Nenana Fifty-five miles southwest of Fairbanks on the George Parks Highway, Nenana is located at mile 412 of the Alaska Railroad. The town sits on the south bank of the Tanana River, 304 road miles northeast of Anchorage.
The 1902 gold rush in Fairbanks greatly increased activity in the region. In 1915, construction of the Alaska Railroad doubled Nenana’s population. Completion of the railroad in 1923 was followed by an economic slump. In 1961, Clear Air Force Station was
22 Information Insights, Inc.

ACRL SEA Socio-economic Impact Assessment - Alaska
constructed 21 miles southwest, and many civilian contractors commuted from Nenana. In 1967 the community was devastated by one of the largest floods ever recorded in the valley.
Over 40 percent of year-round jobs are government-funded, including the City, Tribe, Nenana School District, Yukon-Koyukuk School District, and DOT highway maintenance. Strong seasonal private sector rail-to-river barge transportation services for the Interior assist the local economy. Yutana Barge Lines is the major private employer in Nenana, supplying villages along the Tanana and Yukon Rivers each summer with cargo and fuel. At least 27 residents hold commercial fishing permits.
Nenana is accessible via air, river, road and railroad access. The George Parks Highway connects the area to Fairbanks and Anchorage, with the rail system providing daily freight service. The local Nenana Port Authority operates the dry cargo loading and unloading facilities, dock, bulkhead, and warehouse. The Tanana River only allows a maximum draft for loaded river barges of 4.5 feet, limiting vessel types and sizes.
City population is evenly divided amongst Native and non-Native with 47 percent of the population being all or part Native. Median household income for residents is $33,333 annually. Unemployment is at 23.8 percent, and 17.8 percent of the population is living in poverty. A majority of Native residents rely on salmon, moose, caribou (by permit), bear, waterfowl and berries as subsistence foods (DCCED, 2006).
Denali Borough Communities in this Interior Alaska borough include Anderson, Cantwell, Ferry, Healy, and McKinley Park. The northern boundary of the Denali Borough is 110 miles south of Fairbanks; the southern boundary meets that of the Matanuska-Susitna Borough.
Creation of Denali National Park and construction of the Alaska Railroad brought non-Native settlers to the area in the early 1920s; the area incorporated as a borough in December 1990. Clear Air Force Base, the Usibelli Coal Mine and wilderness tourism have brought growth and development. Denali National Park hosts 350,000 visitors annually for recreational use. Hotels, cabins, RV campgrounds, rafting guides, sightseeing, restaurants and gift shops serve visitors. Roughly 82 percent of summer employees live outside the borough, of which 40 percent come from outside Alaska.
The George Parks Highway provides access to Anchorage and Fairbanks year-round. The Alaska Railroad also serves Interior Alaska. There are several airstrips within the borough, with tours available by bus, aircraft, and helicopter during the summer season.
Primarily a non-Native community, 8.6 percent of the area’s 1,893 residents are all or part Native. The many job opportunities available in the Borough provide a healthy median annual household income at $53,654 annually with 7.9 percent of the community living in poverty. Unemployment rate for the area is 11.6 percent (DCCED, 2006).
Matanuska Susitna Borough The twin population centers of Palmer and Willow anchor the south-central portion of the Mat-Su Borough approximately 42 miles northeast of Anchorage. At least 26 additional communities include:
Information Insights, Inc. 23

ACRL SEA Socio-economic Impact Assessment - Alaska
Big Lake Knik River Susitna
Buffalo Soapstone Knik-Fairview Sutton-Alpine
Butte, Lake Louise Talkeetna
Chase Lakes Tanaina
Chickaloon Lazy Mountain Trapper Creek
Farm Loop Meadow Lakes Wasilla
Fishhook Palmer Willow
Gateway Petersville Y
Glacier View Point MacKenzie
Houston Skwentna
By 1920, gold, coal mining, and construction of the Alaska railroad sustained the local population. Construction of the statewide road system assisted population growth. Low housing costs and relative location to Anchorage for employment and services has made the borough one of the fastest growing areas of Alaska in recent years, expected to overtake Fairbanks North Star Borough as the second-largest municipal entity in Alaska upon the next census.
The economy is varied, with residents employed in retail, professional and government services occupations. Approximately one-third of the Borough's labor force commutes to Anchorage for employment.
Air, road, and rail travel are available in the area. Both Glenn and George Parks Highways come through the borough, with a municipal airport providing private and chartered services. Ocean freight delivery arrives via the Alaska rail system.
The communities in the borough are predominantly non-Native, with 8.6 percent consisting of Native ethnicity; 11 percent of the population living in poverty, and 10.3 percent of the workforce unemployed. Median household income for the borough is $51,221 annually (DCCED, 2006).
2.2.4 Point MacKenzie and Port A spurline to the port facilities at Point MacKenzie is under consideration if an ACRL project goes forward. Port MacKenzie is logistically convenient for commercial and industrial expansion in close proximity to Anchorage.
Point MacKenzie Point MacKenzie is located between the south shore of Knik Arm of Cook Inlet and the Little Susitna River, 15 miles southwest of Wasilla in the Matanuska-Susitna Borough.
An unincorporated community of 244, the area will change dramatically with expansion of the Port and potential gas pipeline and railway system development. Current employment is provided through educational, health and social services, and service occupations. The area
24 Information Insights, Inc.
ACRL SEA Socio-economic Impact Assessment - Alaska
has no recorded unemployment. Median annual household income is $23,250, with 22 percent living in poverty (DCCED, 2006).
Port MacKenzie Port MacKenzie consists of a 500-foot bulkhead barge dock, a 1,200 long deep-draft dock, and 14 square miles of land available for commercial lease. According to the Matanuska-Susitna Borough web page on Port MacKenzie, several businesses have expressed interest in utilizing the port:
A new ferry system is scheduled to start operating between Anchorage and Port MacKenzie in summer 2007.
Alaska Manufacturing Contractors’ (AMC) have built and shipped 68 modular homes for rural Alaska communities since 2001 from Port MacKenzie.
VECO presented the borough with a Letter of Interest to construct the firm's oil/gas field modular units at Port MacKenzie. The Port MacKenzie facility offers competitive advantages for modular construction, which could provide additional employment opportunities for qualified Alaskans. The borough is working to identify capital improvements necessary for this project.
NPI, a wood chip company, executed a lease agreement with the borough and constructed a new 1.25 mile access road, 18 acre pad, and 3,000 foot conveyor system to the new deep-draft dock.
The borough is discussing cooperative efforts with partners who own land in the Port District and adjacent areas to actively market and develop the marine port and industrial complex. Primary partners include Cook Inlet Region Incorporated (CIRI) and the University of Alaska.
The Senate allocated $4.4 million in Federal Transportation Agency (FTA) and $6 million in Federal Highway Administration (FHWA)funds for continuing development. The funds have been earmarked to improve transportation between the existing port site and the labor/commercial centers.
Information Insights, Inc. 25

ACRL SEA Socio-economic Impact Assessment - Alaska
2.3 Literature review of potential socio-cultural impacts This section reviews U.S. and international railroad projects that offer parallels to ACRL, based upon the Environmental Impact Assessments/ Statements (EIA/EIS) conducted for these projects. Please note that any numbers in this section represent the estimated impact of the comparison project and not of the ACRL.
Predicted impacts are generally similar project-wide, whether the project is slated for construction in the United States or overseas. As the mitigation measures suggest, projects follow a fairly standardized way of minimizing the effects both construction and operations of rail projects have on communities and the environment.
The projects included in this section share similarities with the proposed ACRL. More specifically, each project has been proposed on the premise of increased economic development for a region. All projects propose the movement of natural resources (e.g. coal, timber) and forecast an increase in (or initiation of) tourism-related activities. Additionally, each project requires collaboration among political entities at the local, state, and regional levels. Lastly, all of the projects described in this section affect both rural and urban populations, and in some cases, populations living below the poverty line.
2.3.1 Project summaries
Alaska Railroad Extension Eielson to the Canadian Border (Alaska DOTPF 1983) The study provided a summary of expected impacts, including expanded transportation services, regional resource development, energy savings in transportation of goods and connection of Alaska’s defense installations to the American rail network. The report added insight about the complex human ecological relationships in rural Alaska, especially those among Alaska Native people of the Upper Tanana region.
The authors recognized the likelihood of significant human impacts, such as loss of wildlife habitat, noise and air quality impacts, and access to lands used for traditional uses, particularly subsistence activities. During the study, the Department of Transportation communicated with selected agencies, largely state and federal offices with environmental jurisdiction, such as U.S. Soil Conservation, U.S. Fish and Wildlife, Alaska Railroad, and the Alaska Departments of Fish and Game, Natural Resources and Environmental Conservation. A letter solicited for the 1983 study from Tanana Chiefs Conference expressed concerns about apparent lack of consultation or involvement of local people:
Our concern…goes beyond the identification of certain surface renewable resources, to the identification of user group patterns and user groups. We view that traditional uses of the lands in question could be significant and that this information must be developed and utilized in the planning of any surface transportation corridor and development.
Other agencies contacted for the study identified areas of concern that included activities of residents along the proposed route as they might conflict with railroad right of way as well as “permit acquisitions, potential cultural resource impacts, subsistence pattern changes, and effects on wildlife.”
26 Information Insights, Inc.

ACRL SEA Socio-economic Impact Assessment - Alaska
The DM&E Railroad’s Impact on the Great Sioux Nation (Whiteface 2000) This special report, written by Charmaine White Face in 2000, appeared on the Lakota Nation Journal October 28, 2000. The report is a response to a Draft Environmental Impact Statement (DEIS) on the Powder River Basin Expansion Project. The project proposes a 280-mile rail extension through Wyoming, South Dakota and Minnesota, providing access to coal mines in northeastern Wyoming for power plants in the Midwest. The extension would travel near Badlands National Park and the northwestern border of the Pine Ridge Reservation. It is expected that approximately 40-70 trains will travel along the new tracks through sensitive wildlife areas to deliver coal.
The author identifies several shortcomings in the DEIS and the project itself. The tone of the report is set in the first paragraph: “For Lakota people, this is another incursion into the Great Sioux Reservation and Indian land protected by treaties”. As White Face notes, the draft document, which contains over 12 volumes of material for public review and comment, contains very little references to impacts on indigenous populations of the region, especially with regards to the Lakota people.
White Face also claims that the DEIS leaves several critical questions unanswered, including satisfactory explanations of alternative energies (i.e. alternatives to coal), back haul commodities, and how regular train travel (every 20 minutes) will affect nearby communities/villages. The railroad is expected to travel within a mile of Pine Ridge Reservation, home to Red Shirt Village and the Oglala Sioux Tribal Council, yet the author claims there is little mention of the village, tribal council, and the opposition to the project by both the Oglala Sioux Tribal Council and the Black Hills Sioux Nation Treaty Council in 1998.
The report also draws attention to an 1868 Laramie Treaty, directing the United States Secretary of State to deliberate with Treaty Council members versus other government employees with regards to issues/projects that directly affect indigenous peoples. White Face argues that the 1868 Treaty is being ignored, as are the wishes of the Oglala Sioux Tribe, which has come out strongly in opposition of the project, which is not recognized in the DEIS.
The report concludes by restating past and present opposition to the Powder River Basin Expansion Project by the Oglala Sioux Tribe and the Black Hills Sioux Nation Treaty Council.
Final Supplemental Environmental Impact Statement: Powder River Basin Expansion Project (DMERC, 2005) As detailed in the Final Supplemental Environmental Impact Statement (EIS): Construction into the Powder River Basin (2006), the Powder River Basin Expansion Project consists of an approximately 280-mile rail line extension from Wall, South Dakota to existing coal mines in western Wyoming. The project would also entail upgrading of the current 598-mile rail link from Winona, Wisconsin to its terminating point at Wall, South Dakota.
Yucca Mountain Rail Corridor Impact Study (LAPB 2004) The Yucca Mountain Rail Corridor Impact Study is an assessment of potential impacts of a proposed Carlin Rail Alignment from the mainline Union Pacific Railroad to the Yucca
Information Insights, Inc. 27
ACRL SEA Socio-economic Impact Assessment - Alaska
Mountain repository in Eureka County, southern Nevada. The rail alignment would be approximately 323 miles long, with an impact width of 3 miles, 1.5 miles on each side.
According to the authors, the focus of economic activity in Eureka County historically has been ranching and mining, which accounts for a significant amount of land use in a county of approximately 4,182 miles. Over 80 percent of the area is managed by federal agencies, again with a focus on ranching, mining, some energy-related projects, and recreation.
Environmental Impact Assessment: Taiyuan-Zhongwei Railway Project (MRPRC, February 2006) The proposed new railway from Hefei to Xi’an will span 27 counties (16 poverty-level counties) and the four provinces of Anhui, Henan, Hubei, and Shaanxi. The project will connect the underdeveloped areas of western and central China with more developed eastern provinces. The project area will affect a population of approximately 22.4 million people, with almost 82 percent being comprised of rural residents. Additionally, the almost 31 percent of the affected population are living below the international poverty level, almost twice that of the People’s Republic of China (PRC) national average. Project is part of the Poverty Reduction Strategy of the Asian Development Bank.
Environmental Impact Assessment: Zhengzhou-Xi’an Railway Project in the People’s Republic of China (MRPRC, April 2005) In their 2005 Environmental Impact Assessment (EIA) of the Zhengzhou-X’ian railway project in the People’s Republic of China (PRC), the Ministry of Railways provides an assessment of a proposed project to construct a 458.9 km electrified class I passenger railway designed for electric motor unit that spans across two provinces (Henan and Shaanxi). The project was to include 61 km of tunnels and 151 km of bridges, passing through 170 rural villages, 13 urban neighborhoods in 19 counties and urban districts. The project also planned for the expansion of two existing stations in Zhengzhou and X’ian, as well as the construction of eight new stations.
The railway project is expected to pass through the Yellow River Wetlands National Class Natural Projection Area. This area is divided into two areas, the “buffer zone”, where no development is allowed, and the “experimental zone”, where any development must be approved. It is expected that over 50 million cubic meters of earth and stone works will be needed to complete the project in five years.
The project objectives are two-fold, to increase passenger traffic and the number of freight trains with the hopes of stimulating economic development in the region. Presently, tourism acts as a major economic driver for the people of the region. However, it is recognized that the current rail system has reached capacity, limiting the number of passenger/freight traffic. Additionally, it is widely known that most people in the PRC prefer to travel via rail versus the higher costs of air and road travel, particularly for distances between 200-800 km. Lastly, when compared to rail travel, air and road travel are both less fuel efficient (air), and emit more harmful toxins (road).
28 Information Insights, Inc.

ACRL SEA Socio-economic Impact Assessment - Alaska
Environmental Impact Assessment: Dali-Lijiang Railway Project in the People’s Republic of China (MRPRC, July 2004) The 2004 Summary of Environment Impact Assessment (EIA) of the Dali-Railway Project outlines the potential environmental impacts of a defined corridor that extends 200 meters (400 meters total) on either side of the proposed railway. Additionally, the EIA identifies issues that may affect the nationally protected areas of Cangshan Mountain and Erhai Lake, Lijiang City, and the Yulong Snow Mountain. Two cities and one country are considered project areas, while five counties are considered in the broader scope of the project assessment. The proposed railway is 166.2 kilometers, including new rail line in Dali Bai and Lijiang. Many new passenger stations will be constructed for the project (18), as well as reconstruction of preexisting structures (2). New bridges and tunnels will comprise approximately 43 percent of the proposed railway. Three routes are being explored.
The Dali prefecture has a population of 3.3 million people, 49.2 percent of which are Bai and Yi minorities. Lijiang has a population of 1.1 million people, with a minority representation of over 50 percent, comprised of people of Naxi, Yi, Bai, and Pumi background.
Environmental Impact Assessment of the Shenmu-Yanan Railway Project in the People’s Republic of China (MRPRC, October 1996) The 2006 Summary Environmental Assessment of the Shenmu-Yanna Railway Project in the People’s Republic of China details the background, potential impacts and mitigation measures of the construction of a new rail line that would traverse the Yulin and Yanan prefectures in Shaanxi Province. The proposed project would also connect existing rail lines between Shenmu and Yanan (approximately 386 km). The purpose of the rail is provide a means to transport natural resources (e.g. coal) from rural areas, providing a means of economic development for less developed areas of Shaanxi Province.
Technical Assistance to the People’s Republic of China for Preparing the Yichang-Wanzhou Railway Project (ADB, May 2002) The 2002 Technical Assistance (TA) document describes a process by which the Asian Development Bank has committed to assisting the People’s Republic of China (PRC) with an environmental impact assessment for development of the Yichang-Wanzhou Railway Project. As the TA describes, the transport sector in the PRC has played a large role in spurring economic growth over the past 18 years. Additionally, railways continue to be the major mode of transportation in the PRC, with train traffic increasing every year, including passenger traffic.
This project will use expansion of the railway network to spur economic growth in poor regions; encourage rail company joint ventures; upgrade and improve management; commercialize services. It also aims to provide institutional and structural change that supports more economic development through less regulation and greater non-government involvement in rail-related activities
The rail projects are part of the PRC’s series of Five-Year Plans. With the PRC’s accession to the World Trade Organization in 2001, the country can open its doors to foreign investment and competition in the rail system. The Yichang-Wanzhou railway link is expected to include approximately 377 km of electrified railway link, and the project will
Information Insights, Inc. 29

ACRL SEA Socio-economic Impact Assessment - Alaska
span eight counties and districts in three prefectures of the Hubei Province and Chongching Municipality.
2.3.2 Summary of potential impacts and proposed mitigation measures Common areas of possible impacts surfaced across all or most of the projects we reviewed. The table below incorporates impacts and mitigation identified in the preceding reports. Although the table depicts effects anticipated for the projects cited, these impacts may not apply to the ACRL.
Each entry in the following table includes the identifier and date for the project from which it came: Whiteface, DMERC, LAPB, MRPRC, ADB.
30 Information Insights, Inc.

Table 3: Summary of potential impacts and proposed mitigation measures
Air Quality
Potential impacts
Construction vehicle emissions would provide temporary impact, while railroad locomotives would permanently affect air quality, but should not exceed any standards (Alaska DOTPF 1983).
Dust and emissions from construction equipment will affect visual scope and air quality for local residents and wildlife during construction (LAPB 2004).
Smoke and other air pollutants from boiler stations and movement of coal from mines to destination (MRPRC, February 2006). Decreased air quality may cause some respiratory discomfort/illness for some residents. No air quality issues are expected to
arise after construction and during operations, as the trains are electric (MRPRC, April 2005). Dust and emissions during construction may raise respiratory issues for local residents. Alternative energy planned for rail-related
structures mean the only anticipated operational phase pollution will come from locomotives. However, as the EIA describes, when compared to other modes of transportation, emissions from rail are far less than buses and cars (MRPRC, July 2004).
Exhaust emissions from diesel locomotives, gas boiler houses at stations, and dust from coal haulage (MRPRC, October 1996). Proposed
mitigation Establish Air Quality Working Group comprised of agency staff with appropriate technical background; meet Environmental
Protection Agency standards; adopt fuel saving practices; minimize dust emissions and suppression of fugitive dust using water, magnesium chloride treatment, etc. Obtain proper federal/state permits for burning (DMERC, 2005).
Sprinkle water, isolate certain construction activities, store materials in contained spaces, and restrict work vehicles to construction areas; eventually replace diesel locomotives with electrical; install smoke reducing units (MRPRC, October 1996).
Biological Resources
Potential impacts
Loss of trees, shrubs, woody vegetation, prairies (DMERC, 2005). Forest clearance (MRPRC, February 2006). Land will be acquired during project construction (approx. 103.8 hectares), some of which will be permanently lost, some of which
will be used temporarily and restored. Several protected nature reserves in the project region (MRPRC, July 2004). Encroachment on terrestrial ecology. Clearance of 78 ha of trees from land (MRPRC, October 1996). Reclamation in the mountains (ADB 2002). Excavation of tunnels and blasting in natural habitat of multiple species (ADB 2002).
Proposed mitigation
Comply with USFWS Biological Assessment and Biological Opinion, ensuring that wildlife and natural environment are taken into account during all phases of project (DMERC, 2005).
Working with federal/state agencies, develop Habitat Restoration Plan (DMERC, 2005). Survey area for raptor nests and minimize commotion around active nests (DMERC, 2005). Consult with National Resource Conservation Service to develop plan for controlling noxious weeds (DMERC, 2005). Remove carcasses along rail line (DMERC, 2005). Afforestation of cleared areas and other areas along rail line (MRPRC, October 1996; February 2006).
Information Insights, Inc. 31

ACRL SEA Socio-economic Impact Assessment - Alaska
Cultural and Subsistence Resources
Potential impacts
Subsistence impacts could occur, concentrated along major waterways, trails and roads in game concentration areas, with little or no effect upon fishing. Trapping impacts could occur, in proportion to the furbearing animal habitat lost to railroad right of way. Access along existing roads adjacent to the rail alignment would be blocked, with some impact to off-road access. However, “While pre-railroad subsistence patterns could be adversely affected, additional subsistence activity would likely result from the project” A minimum loss of 1,300 acres of wildlife habitat would mean some adverse wildlife habitat impacts that could reduce wildlife populations. Alaska Fish and Game predicted train/moose accidents, particularly on the Ladue route. Known caribou calving grounds would not be affected. Alignment should avoid disturbing Dall Sheep. Both adverse and beneficial impacts could accrue to raptors along the route (Alaska DOTPF 1983).
The corridor includes many archaeological and historic sites, although a cultural resource field survey had not been conducted. Previous archaeological investigations include:
Frederick Johnson 1944 Alaska Highway survey; Alaska Division of Parks survey in 1976 between Delta and Tok; Northwest Gas Pipeline survey conducted by Anne Shinkwin and Jean Aigner.
Known sites include a winter cemetery and two prehistoric archaeological locations, none on the National Register of Historic Places at the time this report was published in 1983 (DOTPF 1983).
Protected properties in the corridor include several state recreation sites and two wildlife refuges (DOTPF 1983). Direct impacts have been unobserved in the DEIS, including air quality on Pine Ridge Reservation will be affected by coal dust
and diesel fumes from passing trains; the possibility of fire from overturned trains or wheel sparks; geographic scope of potential effects; and omission of Standing Rock Sioux from list of affected tribes (White Face 2000).
Unexplored historic sites may have vulnerable artifacts (MRPRC, Feb. 2006). People attach great importance to numerous cultural and historical sites along the corridor (MRPRC, July 2004; April 2005).
Proposed mitigation
Alignment that avoids the most sensitive habitat and attention during design and construction. Raptor mitigation should include avoiding high-noise activities within close range of nesting sites during the nesting season, but disturbance during operations cannot be avoided (Alaska DOTPF 1983).
Ensure rail project workers are educated on federal, state, local guidelines that protect archaeological resources, graves, other cultural resources, trespass laws, traffic regulations, regulations to waste disposal (DMERC, 2005).
Comply with Programmatic Agreement and Identification Plan (under Section 106 of National Historic Preservation Act) (DMERC, 2005).
Recognize and comply with Memorandum of Agreement established with Native American Tribes (DMERC, 2005). Ensure the 106 process is complete for affected archaeological sites and historic structures (DMERC, 2005). Prior to rail line construction assess all areas for archaeological potential. If sites are unearthed, inspect and contact proper
authorities (e.g. local government officials, university staff). Archaeological materials will not be moved without guidance (MRPRC, February 2006).
There are plans in place to protect existing sites, as well as specific guidelines for any new discoveries (MRPRC, April 2005). These areas will be avoided during both the construction and operational phases of the project. In the case of new findings, local
officials will be alerted, so to not disturb the discoveries (MRPRC, July 2004).

Economic Resources
Potential impact
Several hundred persons could be employed for construction, benefiting communities by spending wages there. General regional economic growth could result from railroad generated resource development. Some state monies would be used to construct the railroad extension. During construction, highway traffic disruption would occur where the railroad alignment crosses or closely parallels public roads. Community services could be burdened by construction workers (Alaska DOTPF 1983).
Potential economic losses on private property values and property tax revenues associated, and losses if there were a rail accident. Loss from regular operation estimated at $1 m, almost quadrupling if there were an accident ($3.6 m). Decreased tourism identified as potential impact of the project (LAPB 2004).
Environmental Justice
Proposed mitigation
Consult with Lakota Tribe to develop Hazardous Material Emergency Response Plan (DMERC, 2005). Establish Tribal Liaison that will work with affected Tribes (DMERC, 2005).
Land Use
Potential impacts
Physical separation of agricultural lands and loss of equipment access to isolated fields Alaska (DOTPF 1983). Scenery; quality of life; view; open space; isolation; peacefulness; rural character; quietness; independence (LAPB 2004:17). Land will be acquired for project development. Of 8.3 million people living in impact area, approximately 37,000 people will be
directly affected; 30,000 will need to be relocated (MRPRC, July 2004; April 2005). Acquisition of approximately 1,113 hectares of land (596 ha of cultivated land used for rice, wheat, corn and potato farming);
278,044 square meters of housing will be torn down, displacing 1,500 households (ADB 2002).
Information Insights, Inc. 33

ACRL SEA Socio-economic Impact Assessment - Alaska
Proposed mitigation
Suitable track crossing sites (DOTPF 1983). Relocation facilitated, monitored by PRC and Asian Development Bank; attention to low income / minorities (MRPRC, April 2005). Preserve/improve resettled population living standard through housing/compensation. Feedback forum (MRPRC, October 1996). Chinese government to compensate affected at levels equal to or better than current standard of living (MRPRC, July 2004). Establish Community Liaisons; special measures for working with specific land use groups (DMERC, 2005):
Residential and Business/Industrial No use of property unless settled with land owner; establish plan for dealing with damage to properties Do not interfere in access to local businesses
Minerals/Mining Use natural resources to maintain natural landscape; maintain necessary permits Consult with local mine and quarry owners; notify mineral lessees/claimants before construction/reconstruction
Federal / State Lands Secure permits: U.S. Bureau of Reclamation; right-of-way grant from BLM; U.S. Forest Service Special Use Permit No crossing of USFWS lands Consult with state agencies on any rail-related activities; limit use of state lands designed for public overnight use
Utility Corridors Identify affected utilities; contact owners to minimize potential damage during rail construction and operation Stop construction if an unidentified utility is unearthed Protect existing drainage tile systems; immediately repair damage Redistribute and develop new farmland to replace lost land (ADB 2002)

Noise and Vibration
Potential impact
The noise from a moving train lasts only briefly, but would impact residences, schools, churches, and public facilities in communities adjacent to the rail line (DOTPF 1983).
Construction and operation-related (MRPRC, February 2006). Noise is expected as a result of machinery operations; tunnel and quarry blasting; or larger equipment (MRPRC, April 2005). Construction phase blasting, equipment and transportation noise and vibration will have some effect on local residents, with no
significant impact. In the operational phase communities will be affected by the noise/vibration from trains, train whistles, as well as depot/station noise (MRPRC, July 2004).
Noise during construction will be louder than noise during full-time operational phase. Some areas, such as schools and hospitals have been identified as sensitive areas. Vibration impacts will be minimal (MRPRC, October 1996).
Impact on suburban areas along rail corridor (ADB 2002). Proposed
mitigation Noise barriers and/or acoustical construction within impacted buildings (DOTPF 1983). Consult with affected communities on project schedule, construction and operational phases (DMERC, 2005). Lubricate rail line curves to minimize noise; develop Construction Noise and Vibration Plan; comply with Federal Railroad
Administration regulations for decibel limits in operations; ensure rounded car wheels to minimize noise; construct rail line using continuously welded rail; maintain construction/maintenance vehicle mufflers; consolidate/remove unnecessary rail switches. In extremely noise sensitive areas, install noise barriers when/where necessary using following guides (DMERC, 2005): o American National Standard Methods for Determination of Insertion Loss of Outdoor Noise Barriers o Standard Guide for Field Measurements of Airborne Sound Insulation if Building Facades and Façade Elements
Contractors will meet with local officials to determine appropriate operating schedules. Noise from trains is expected to be minimal, as project managers are anticipating the use of Japanese train technology, minimizing noise/vibration for local residents. Several special cases will require special windows for proper ventilation and soundproofing (MRPRC, April 2005).
Some structures will be demolished and rebuilt further away from rail lines. Sound walls, tree planting and positioning the rail line appropriately will diminish some of the noise (MRPRC, October 1996).
Paleontological Resources
Proposed mitigation
On federal lands, test for paleontological resources Class 3 or higher and prepare report of identified resources (DMERC, 2005). During construction, cease if paleontological resources encountered; contact appropriate federal/state agencies (DMERC, 2005).
Recreation
Proposed mitigation
Safe navigation for recreational boats near construction area bridges; warning devices to alert boaters of construction activity (DMERC, 2005).
Consult with federal/state land managers (DMERC, 2005).
Information Insights, Inc. 35

ACRL SEA Socio-economic Impact Assessment - Alaska
Safety Issues
Potential impact
As a result of work crews and construction camps near project communities, there is an increased risk of sexually transmitted diseases. Additionally, there may be some human and livestock safety issues that arise as a result of faster trains (MRPRC, April 2005).
As mentioned in other Chinese rail impact studies, the introduction of new populations (construction workers) into local communities does carry some risk of increased socially transmitted diseases. Additionally, the health and safety of construction workers throughout the project is a concern, as well as the safety of local residents and animal populations with the introduction of faster trains (MRPRC, July 2004).
Multiple Safety Areas of Concern for Powder River Basin Extension Project (DMERC, 2005): o Highway/Rail Grade Crossings o Emergency Response o Track Warning Devices and Track Infrastructure o Hazardous Material Handling Issues o Fire Prevention
Proposed route is predominantly for the transport of nuclear waste; study shows potential impacts of transporting nuclear waste along proposed rail alignment, as well as potential ramifications of a rail accident involving the hauling of radioactive materials. The County has been designated an Affected Unit of Local Government under the Nuclear Waste Policy Act of 1982, receiving funding to conduct studies on rail alignment (LAPB 2004).
Proposed mitigation
Grade Crossing Mitigation Plan in place includes Personal Computer Accident Prevention System (PCAPS)-based-grade-crossing formula. Affected communities may have Negotiated Agreement with applicant to address grade crossings at specific community level. Agreements take precedent over other plans. Consult with appropriate federal and state agencies on maintenance of grade-crossing warning devices; supply community emergency response teams with detailed construction and operational activity schedules; provide community leaders with toll-free number in order to schedule meetings with EMS providers (DMERC, 2005).
Install electronic display board in community emergency-response centers, monitoring trains/grade cross warning signals; install temporary and then permanent signs/message boards/media campaign at public grade-crossings; work with local communities to identify alternative safety measures that eradicate train horn usage (DMERC, 2005); install reflective tape on back of passive cross warning devices (e.g. crossbucks); maintain all aspects of rail line properly (DMERC, 2005).
Develop Spill Prevention, Control, and Countermeasure Plan; comply with DOT Hazardous Materials regulations; work with federal/state agencies to map potential hazardous-material sites and steps for addressing spills; recycle/reuse applicable materials; develop plan for fire prevention and suppression (DMERC, 2005).

Soils and Erosion
Potential impacts
Soil erosion from creating tunnels and accumulating materials (MRPRC, February 2006). Numerous eroded and sensitive areas prone to soil erosion – as tunnels, bridges, culverts, new stations and yards are
constructed, additional erosion will occur (MRPRC, October 1996; July 2004; April 2005). Proposed
mitigation Limit ground disturbance; remove topsoil from subsoil for use in the recovery of the right-of-way, as soon as possible after project
completion; develop Restoration/Revegetation Plan for disturbed areas, ensuring no contaminants in fill; identify geologic potential to minimize slumping/ landslides (DMERC, 2005).
Engineers plan to plant grass seedlings along the alignment (creating a greenbelt), with new trees slated for depots. Special measures have been outlined for approaching the Yellow River Wetlands (MRPRC, April 2005).
Ground cover for areas exposed as result of construction. Vegetating, terracing dams, retaining walls (MRPRC, October 1996). Solid Waste
Potential Impacts
From construction camps, passenger trains, slag from boilers at train stations (MRPRC, February 2006).
Proposed mitigation
After approval, contractors dispose of construction waste daily in landfills operated by local governments (MRPRC, April 2005). Two forms of solid waste – spoils and refuse – will have minimal impact. Concern about minimal amount of unused land available
for disposal. During operations, solid waste from passenger trains could have negative tourism on tourism (MRPRC, July 2004). Transportation
Proposed mitigation
Restrict construction to temporary access road or established public roads; plan for closure of temporary routes; work with local/regional/state planning groups to make certain proposed project is in harmony with existing transportation plans; provide safe access alternatives for use local residents (as roads will be closed during construction phase) (DMERC, 2005).
Information Insights, Inc. 37

ACRL SEA Socio-economic Impact Assessment - Alaska
Water Quality
Potential impacts
Erosion/ sedimentation from disturbance of stream banks and stream channels. Potential for oil or fuel spills during in-stream construction equipment operations. Potential spillage of materials transported over operating railroad (Alaska DOTPF 1983).
The report identifies two 100-year floodplains; individual drainages may be affected along the alignment route (LAPB 2004). Runoff from construction camps/ tunnel construction (MRPRC, April 2005; February 2006). Wastewater from construction camps, staff housing, equipment/ vehicle cleaning – impact on local sewage treatment plants;
during operations, highest volumes of wastewater come from staff housing and passenger stations, with some impact on local treatment plants and no significant impact anticipated for water bodies (MRPRC, July 2004).
Two major rivers affected by discharge from operations. Some water trajectories altered, could affect locals. Sedimentation changes from equipment leakage (grease and oil); wastewater discharge from railway facilities (MRPRC, October 1996).
Discharge and disposal of waste from construction sites into water bodies (ADB 2002). Proposed
mitigation Stream crossings at least dynamic locations; re-contour and revegetate disturbed banks to prevent soil erosion into adjacent
waters; limit in-stream construction operation in contract provisions. Constrain timing of in-stream activity to avoid fish spawning or migration impacts; clean-up spills that would impact water quality; comply with water quality standards of the State of Alaska and acquire appropriate permits (Alaska DOTPF 1983).
Obtain proper permits from federal and state agencies and National Pollutant Discharge Elimination System from all affected states; use best management practice to decrease likelihood of sedimentation or any other form of disturbance of water bodies. Avoid environmentally sensitive areas for project staging, decreasing likelihood of soil erosion; laydown yards and other construction at least 300 yards from wetlands or waterways. Fix temporary stream crossings at right angle to stream; cofferdams/check dams consist of native materials; maintain clearance in culverts/bridges to avoid flooding (DMERC, 2005).
Regularly inspect equipment for petroleum product leaks; remove leaks; approval of herbicide use; ensure protection of wells, getting permission from private landowners when necessary; ensure protection of community-designed floodways; develop waterway crossings where they do not exist sufficient for 100-year flood without flood level increase of more than ½ foot; allow passage of fish; any fill position below high water line for a designated area is clean/free of fine materials (DMERC, 2005).
Researchers identified affected wells, springs, streams, seeps; used Eureka Country Water Database, U.S.G.S. information, Nevada Water Resource data, Cortez Environmental Impact Study, and field work, (LAPB 2004).
Water quality monitoring of residential water sources. Some wastewater during operations will be treated, not expected to affect local populations. Water will be reused/recycled, decreasing consumption (MRPRC, July 2004; April 2005).
Equipment maintenance; locate camps away from water bodies; wastewater treatment before discharge (MRPRC, October 1996).Protection of natural water bodies and ecosystem (ADB 2002).
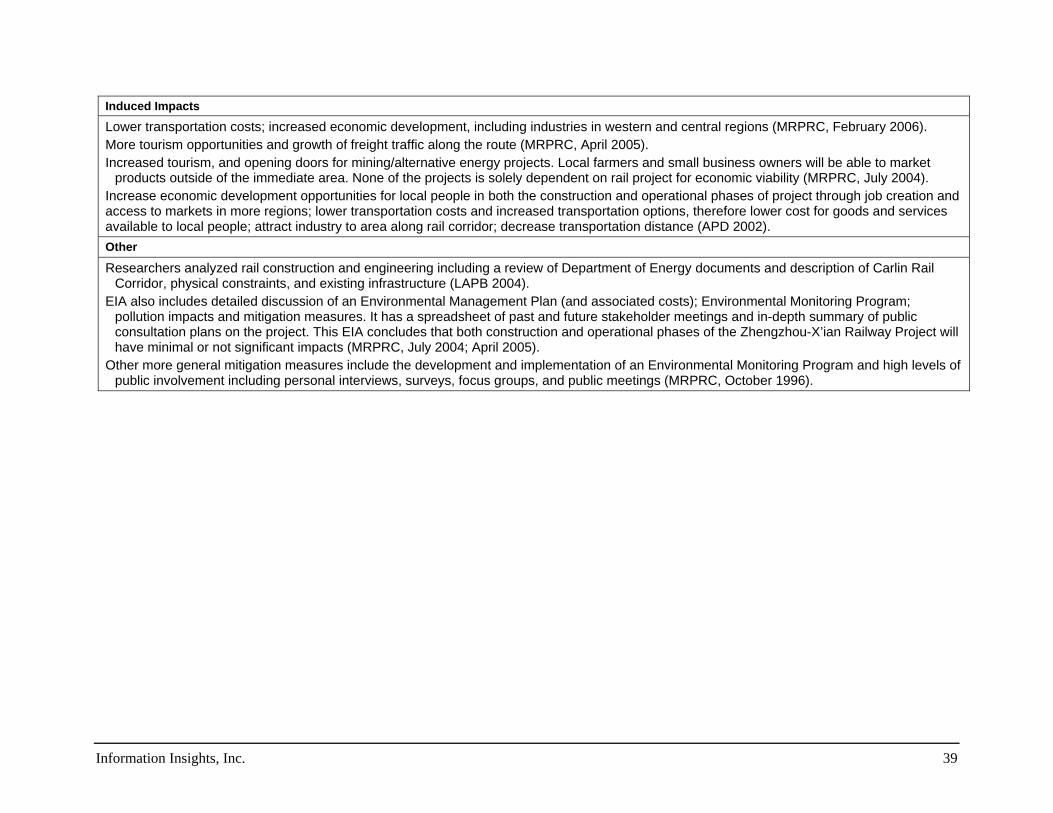
Induced Impacts
Lower transportation costs; increased economic development, including industries in western and central regions (MRPRC, February 2006). More tourism opportunities and growth of freight traffic along the route (MRPRC, April 2005). Increased tourism, and opening doors for mining/alternative energy projects. Local farmers and small business owners will be able to market
products outside of the immediate area. None of the projects is solely dependent on rail project for economic viability (MRPRC, July 2004). Increase economic development opportunities for local people in both the construction and operational phases of project through job creation and access to markets in more regions; lower transportation costs and increased transportation options, therefore lower cost for goods and services available to local people; attract industry to area along rail corridor; decrease transportation distance (APD 2002). Other
Researchers analyzed rail construction and engineering including a review of Department of Energy documents and description of Carlin Rail Corridor, physical constraints, and existing infrastructure (LAPB 2004).
EIA also includes detailed discussion of an Environmental Management Plan (and associated costs); Environmental Monitoring Program; pollution impacts and mitigation measures. It has a spreadsheet of past and future stakeholder meetings and in-depth summary of public consultation plans on the project. This EIA concludes that both construction and operational phases of the Zhengzhou-X’ian Railway Project will have minimal or not significant impacts (MRPRC, July 2004; April 2005).
Other more general mitigation measures include the development and implementation of an Environmental Monitoring Program and high levels of public involvement including personal interviews, surveys, focus groups, and public meetings (MRPRC, October 1996).
Information Insights, Inc. 39

ACRL SEA Socio-economic Impact Assessment - Alaska
2.4 Impacts of a proposed gas pipeline Alaskans have long planned for construction of a gas pipeline to transport gas from Alaska’s North Slope to market. Passage of the Stranded Gas Development Act (SGDA) in 1998 offered a contractual mechanism by which the State of Alaska would negotiate royalty and tax considerations with sponsors of a natural gas pipeline. In 2004 Information Insights published a study of impacts on municipalities from construction and operation of a gas pipeline project as proposed by the major Alaska North Slope oil producers under the SGDA (2004). The pipeline, estimated to cost $21 billion in 2005 dollars, would connect Alaska gas to the existing transport network in Alberta. The study estimated the socio-economic impacts of gas pipeline construction and operations on economically and revenue-impacted municipal and village governments, including those state government costs that would need to be born by local governments in the absence of new state spending. The report also looked at cumulative impacts of natural gas development on the North Slope.
The study determined that the gas pipeline project would bring fewer impacts to Alaska generally than did the Trans Alaska Oil Pipeline (TAPS) in the 1970s, in large part due to the greater population and degree of infrastructure development in Alaska. The portion of the pipeline that follows the Alaska Highway from Delta Junction to the Alaska/Canada Border – a region outside the corridor of TAPS – covers roughly the same area as proposed for the ACRL. In this section of the proposed gas pipeline, the only organized municipality is Delta Junction, a Second Class City.
Cost estimates for statewide impacts are included in the Economic Impact Assessment associated with this report. Types of impacts include: Population and labor increases during the construction period; Infrastructure improvements will be necessary prior to construction; Response to social service and health care and education demands as well as greater law
enforcement and emergency services needs will require additional funding; A mega-project will impact wages for municipal and village governments during
construction; Subsistence and socio-cultural concerns and cumulative impacts will require planning,
monitoring and evaluation to avoid, understand and/or mitigate impacts. No estimate was made for the costs associated with possible catastrophic impacts.
Sudden increases in population and money tend to bring a sharp rise in traffic accidents, crime, and substance abuse. Mitigation - in the form of funding for village safety officers, tribal courts and EMT staffing – can lessen the impacts (Information Insights, 2004).
40 Information Insights, Inc.

ACRL SEA Socio-economic Impact Assessment - Alaska
3 Regulatory and statutory frameworks
3.1 Strategic Environmental Assessment Strategic Environmental Assessment: A sourcebook and reference guide to international experience (May 2005) defines the purpose of an SEA as “identifying and addressing the environmental (and, increasingly, the associated social and economic) dimensions, effects and consequences of policies, plans and programs and other high-level initiatives.” According to the report, prepared for the Organisation for Economic Co-operation and Development (OECD) and the United Nations Environment Programme (UNEP), the SEA should “make a contribution to formulation and development” of such initiatives, rather than to focus on impacts at the implementation stage.
Strategic Environmental Assessments are a relatively new tool, and SEA concepts are still evolving, but the term is now widely used across the European Union. SEA differs from an EIA in that it attempts to integrate environmental considerations into development policy. International practitioners increasingly say an SEA should integrate environmental, social and economic considerations in public policy decision-making and increasingly is seen as a tool for assessing the sustainability of development. An SEA provides for consideration of a larger range of alternatives than is thought normal at the project level EIS. The U.S. participated in developing the UN's only SEA protocol in 2003, but has not ratified it1.
SEAs are expected to influence decision-making throughout the policy formulation process. For that reason, they are introduced at an early stage and applied to Policies, Procedures and Practices (PPPs in environmental assessment terminology) as well as to large scale or regional physical undertakings.
Integration is a major theme, although what is being integrated varies considerably. In recent examples, SEAs look to integrate assessments vertically at different stages of the PPP cycle, and / or they set out to integrate economic, social and environmental considerations to achieve a sustainability assessment.
SEAs tend to be iterative, as they provide sufficient information regarding actual impacts likely to arise from implementing a strategic decision and therefore inspire future planning or give decision-makers the latitude to adjust their plans in the light of study findings.
SEAs are participative. Again the degree of public participation varies. Participatory processes run the gamut from consultation after the fact, based on SEA results, to full inclusion of stakeholders in each stage of the study. At a minimum, study results are made available to the public to ensure transparency and to facilitate accountability on the part of public sector decision-makers.
The proposed ACRL crosses an international border; the SEA process offers a parallel, trans-boundary assessment process. In Canada, the SEA carries with it a Cabinet Directive that in 1 UN Protocol on Strategic Environmental Assessment to the Convention on Environmental Impact Assessment in a Transboundary Context. Known as the Kiev (SEA) Protocol, it was signed in May 2003 as a supplement to the EIA Convention referred to in its title. UN European Economic Commission sponsored the convention; the only non-European countries participating in it are Canada and the United States. However, neither Canada nor the U.S. has ratified the Kiev (SEA) Protocol.
Information Insights, Inc. 41

ACRL SEA Socio-economic Impact Assessment - Alaska
1990 established the tool as a non-statutory procedure to add flexibility and “to integrate environmental considerations into policy and programme proposals” (Dalal-Clayton and Sadler, 2005). In the United States, the SEA does not carry that authority, and projects must adhere to the requirements both of ANILCA and of NEPA.
3.2 Public lands in Alaska: ANILCA Section 810 of the Alaska National Interest Lands Conservation Act (ANILCA) directs federal agencies undertaking any project involving public lands in Alaska to study effects on the subsistence use of natural resources and to determine how to avoid or mitigate potential effects. Section 810 further outlines the process for evaluating impacts on subsistence use and needs. In order to satisfy both the letter and spirit of ANILCA, the following four steps must be undertaken:
Evaluation of the effect of proposed activities on subsistence; Preparation of a finding of effect/no effect of proposed activities on subsistence; Where there is a finding of effect (significant restriction) a public hearing is required; Where there is a finding of significant restriction on subsistence, an 810 determination
must be prepared. Note that the legal requirement for agencies to define and mitigate or avoid subsistence impacts is distinct from the National Environmental Policy Act (NEPA) mandate to study environmental impacts, although several court cases have embraced and supported NEPA to determine the significant impacts threshold under ANILCA. The result of ambiguous and conflicting court rulings is that existing federal agency guidelines are somewhat inconsistent and generally do not conform to section 810. Legislative history indicates Congress intended for Section 810 procedures to introduce subsistence early into project planning in order to protect subsistence resources and resource users from unnecessary adverse effects of a proposed federal undertaking or action.
3.3 National Environmental Policy Act (NEPA) In the United States, the National Environmental Policy Act remains the authority for impact studies. NEPA, which became law in 1970, requires federal agencies to take the lead in providing protection for the environment. The act sets out several broad environmental policies for the U.S. (42 USC 4331(b):
Fulfill the responsibilities of each generation as a trustee of the environment for succeeding generations.
Assure for all Americans safe, healthy, productive and aesthetically and culturally pleasing surroundings.
Attain the widest range of beneficial uses of the environment without degradation, risk to health or safety, or other undesirable and unintended consequences.
Preserve important historical, cultural, and natural aspects of our national heritage and maintain, wherever possible, an environment that supports diversity and variety of individual choice.
42 Information Insights, Inc.

ACRL SEA Socio-economic Impact Assessment - Alaska
Achieve a balance between population and resource uses that permits high standards of living and a wide sharing of life’s amenities.
Enhance the quality of renewable resources and approach the maximum attainable recycling of depletable resources.
Set among these broad policy goals is a requirement that federal agencies use a systematic, interdisciplinary approach to decision-making that takes into account natural sciences and social sciences – including economic factors and environmental issues. NEPA contains a series of action-forcing procedures to be evaluated through the preparation of an Environmental Impact Statement (EIS).
An EIS describes in detail the environmental impacts of a proposed action and alternative actions to the proposed project. The analysis must include evaluation of the “no action” alternative, allowing the proposed activity and the resulting environmental effects to be compared with the effects of taking no action.
3.3.1 EIS process under NEPA NEPA applies to federal actions, but a nonfederal activity may be subject to the law when it requires a permit, regulatory decision or funding from a federal agency. Although the guidelines do not clearly outline the extent of federal involvement that will trigger NEPA for a non-federal project, it is reasonable to assume this project will come under provisions of the Act.
NEPA has a three-step process that determines whether it is necessary to prepare an EIS: 1) establish whether the law applies to the proposed action; 2) decide whether an EIS is required by determining if the action will significantly affect the “quality of human environment”; 3) prepare the EIS.
Review process outline:
Determine lead agency Prepare environmental assessment (optional) Conduct Scoping process Prepare draft EIS Circulate draft EIS for review (agencies and public) Hold public hearings Prepare final EIS Circulate final EIS Adopt final EIS Make agency decision Prepare Record of Decision Agency Action
The law obliges an agency to begin preparation of an EIS while it is developing a proposal, or in the case of permit applications by a private entity, as soon as possible as the application is received. The intent is to prepare the EIS as early as possible so it serves as part of the decision-making, not as a mechanism to support decisions already made. In this respect,
Information Insights, Inc. 43

ACRL SEA Socio-economic Impact Assessment - Alaska
NEPA dovetails with the SEA, but does not carry the same sense of helping to inform policy formulation at the earliest stages, nor the same degree of integrated sustainability.
As a practical matter, preparing an EIS is a lengthy and costly endeavor. Project sponsors are likely to have conducted a significant amount of planning and to have secured major commitments for funding prior to preparing an EIS. Each proposed project (or action) under NEPA triggers a different set of related environmental requirements, depending on the proposal. The following actions typically apply:
Discharges into “waters of the U.S.” (including wetlands) – U.S. Army Corps of Engineers;
Construction activities in “navigable waters” – U.S. Army Corps of Engineers Activities proposed in floodplains – Federal Emergency Management Agency Activities affecting historical, cultural and archaeological resources –Section 106 of the
National Historic Preservation Act Transportation projects proposed in recreation areas and parks – Federal Highway
Administration Cleanup of hazardous waste sites – U.S. Environmental Protection Agency (EPA) Solid or hazardous waste generation, storage, transportation or disposal – U.S. EPA Activities affecting endangered species – U.S. Fish & Wildlife Service Environmental Justice – all categories of the EIS Projects in the coastal zone – National Oceanic and Atmospheric Administration
3.3.2 Public process: Requirements for consultation and involvement NEPA provides for public involvement at various steps, particularly in public opportunities for involvement during scoping and for public review of the draft EIS. Implementing regulations (40 CFR 1506(a)) require federal agencies to make diligent efforts to involve the public in the process. Public notice is required for all NEPA-related hearings. Public meetings and all environmental and other supporting documents related to the EIS are public information. Agencies must provide notice to those who have specifically requested it. NEPA recommends mechanisms, including publication in a local newspaper and other media, newsletters, direct mailings to property owners and posting of notices.
Public hearings must occur when the proposed project has drawn substantial environmental controversy; when there is substantial interest in holding a public hearing; or when another agency with jurisdiction over the proposed action requests a hearing. Although not required in all circumstances, most lead agencies choose to conduct public hearings to provide the public with an opportunity to comment during the process, rather than facing criticism later.
3.3.3 Cooperating agencies NEPA allows for the inclusion of cooperating agencies in the environmental review process, generally upon the request of the lead agency. A cooperating agency can be any federal, state, local or tribal government agency (other than the lead) that has jurisdiction by law or because the agency has special expertise on the environmental impacts expected to result from the proposed project.
44 Information Insights, Inc.

ACRL SEA Socio-economic Impact Assessment - Alaska
An agency has “special expertise” with respect to reasonable alternatives or significant environmental, social or economic impacts associated with a proposed action if it has statutory responsibility, agency mission or related program experience pertaining to a proposal. The Council on Environmental Quality urges the heads of federal agencies to actively solicit participation of state, tribal and local governments as cooperating agencies in implementing the EIS process (July 28, 1999 memo to Heads of Federal Agencies).
While the designation of cooperating agency adds important groups to the formal process, it also asks them to provide resources to the review process. As a cooperating agency, the entity must participate in the NEPA process as early as possible, must participate in the scoping process, and, on the lead agency’s request, must develop information to be included in the EIS. The agency also has a responsibility to provide staff support for preparation of the EIS.
The Council on Environmental Quality considers the benefits of granting cooperating agency status to include:
Disclosure of relevant information early in the process; Receipt of technical expertise and staff support; Avoidance of duplication with local or tribal procedures.
Tanana Chiefs Conference (TCC) is a potential cooperating agency. The nonprofit organization represents 42 tribal governments in Interior Alaska, including Upper Tanana villages in the proposed rail corridor. TCC has a Tribal Transportation program with program goals of coordinating with the State of Alaska Department of Transportation and Public Facilities to address regional transportation issues and concerns.
3.3.4 EIS scoping process Regulations specify the elements required for preparation of an EIS. Within those elements, the scoping process is of particular importance for identifying and addressing all issues that significantly affect the quality of the human environment. Adequate scoping plays an enormous role in public satisfaction with the overall process.
Scoping is intended to be a public process; the lead agency typically invites the views of agencies and the public about significant issues that need to be evaluated in the EIS. The scoping process also will identify and eliminate issues that are determined to be insignificant; allocate assignments among agencies; identify related environmental documents that may be relevant to the proposed project; and resolve other administrative issues. The lead agency may prepare a report that outlines decisions made during the scoping process, although it is not required.
The scope of an EIS consists of the types of actions to be included, the range of alternatives, and impacts (effects) to be considered. Actions to be evaluated in an EIS include connected, similar and cumulative actions. Considerations must include a “no-action” alternative, other reasonable alternatives, and mitigation measures. Direct, indirect and cumulative impacts need to be evaluated. NEPA regulations define the terms of actions, alternatives and impacts.
It is a requirement that agencies participate in the scoping process because of their scientific and technical expertise and their knowledge of relevant data and studies. It is equally
Information Insights, Inc. 45
ACRL SEA Socio-economic Impact Assessment - Alaska
important to involve the public in the scoping process to identify issues important to residents affected by the project, especially in the case of a project spanning many miles and communities.
3.4 Achieving meaningful consultation with Native communities and individuals
A comprehensive assessment of predicted impacts must include first-hand experiences of people who understand and have participated in the cycles of life in rural Alaska. As noted in the Information Insights report on impacts of a gas pipeline in the Upper Tanana valley, adequate testimony and interviews during the EIS process, combined with analysis of data, such as harvest reports, may begin to overcome the shortcomings of previous EIS activities (2004).
Peter Bowers, principal archaeologist with Northern Land Use Research, Inc. (NLUR), a prominent Alaska firm specializing in cultural resource surveys and mitigation planning, identified essential elements of consultation and coordination with Native American groups (Bowers, 2006). NLUR has found that a typical (western) meeting model does not work well in an Alaska Native context.
From experience working with communities and individuals under the Native American Graves and Repatriation Act and Traditional Cultural Properties provisions, Mr. Bowers recommends a gradual approach for setting up and conducting community meetings, starting with planning on a minimum of four meetings. Jerry Isaac, President of Tanana Chiefs Conference (personal communication, April 27, 2006), confirmed the NLUR approach and added details specific to successfully working with Upper Tanana Athabascan tribes and individuals. The following recommendations synthesize remarks made by Mr. Bowers (personal communication, May 12, 2006) and Mr. Isaac:
The recommended approach does not follow a linear progression, but revolves around establishing trust and good relations. At the first meeting, shake hands and demonstrate that project leaders intend to work within a framework of respect for the local traditions, needs and concerns. Any indication that the timeline is too short for meaningful interaction will seriously harm initial reactions to the initiative under consideration. Listen carefully to understand the community’s interests. Do not rush to ask questions. As trust develops, approach groups with information about the goals, concerns and possible benefits of the project. Only after the initial steps have resulted in respectful understanding should the project expect meaningful discussion about what information the local people might provide; but it remains crucial that project personnel work very carefully and let respect guide the conversations.
Of equal importance, the topics under consideration must include adequate time and preparation to talk with individuals. It is essential for project principals to begin during earliest phases of a proposed project’s policy development to identify the individuals to interview. Small communities have political and social divisions; it is imperative to conduct interviews and meetings in a way that provides for inclusion of different segments of each community – and to be certain to include Elders and tribal leadership.
46 Information Insights, Inc.

ACRL SEA Socio-economic Impact Assessment - Alaska
4 Socio-cultural and Human Ecological Impacts
4.1 Anticipated impacts on resident communities and individuals
Impacts in the ACRL corridor will be similar to those identified for the same area in the study of municipal impacts of an Alaska gas pipeline (Information Insights, 2005). Among chief concerns: Engagement of local people in policy and planning, beginning with the earliest stages of
project visioning and including consistent involvement and consultation. Of primary importance is to talk to people in affected areas about their concerns, getting their identification of important subsistence areas and cultural sites.
Military/HAZMAT sites – known contamination within the corridor fuels speculation that considerably more hazardous sites exist, having been abandoned following earlier projects. Hazardous wastes must be addressed in the earliest stages of project development, with a focus that includes addressing past injustices.
Construction crews could make minor purchases within the villages, bringing additional income; commodities could be purchased in Tok or Delta.
Housing availability during construction would be limited. Delta and Tok have motels that could be leased. Tanacross has expressed interest in erecting lodging for construction crews and developing ongoing use for such a facility as a railroad crew-change lodge.
4.1.1 Cultural impacts on Alaska Native communities and individuals Impacts on Alaska Native people and villages will provide one of the areas of greatest sensitivity in the proposed rail corridor.
Historic site analysis under the ANILCA Section 106 process (typically a multi-year effort) requires a basic inventory and evaluation of sites for inclusion in the National Register. The process includes development of a mitigation plan – either moving the route to avoid site(s) or taking mitigating actions, such as data recovery/excavation, archival research and/or photography.
Changes in resource availability or access to subsistence areas will affect the daily lives of people in the Upper Tanana region. Adequate involvement of tribes and individuals will help to avoid negative impacts, and mitigation measures can assist.
Tribal organizations and individuals in the Upper Tanana seek assurances that no “behind-the-back attempts” will be made to condemn or take lands in a way that abridges the rights of local people (Isaac, 2006). Right of way negotiations should be approached in a collaborative and sensitive manner. The original Alaska Railroad authorization allowed the use of eminent domain; under Public Law 69, the 63rd Congress provided authorization for the President to “locate, construct and operate a railroad in the Territory of Alaska
´…not to exceed in the aggregate one thousand miles, to be so located as to connect one or more of the open Pacific Ocean harbors on the southern coast of Alaska with the navigable waters in the interior of Alaska...to purchase or
Information Insights, Inc. 47

ACRL SEA Socio-economic Impact Assessment - Alaska
otherwise acquire all real and personal property necessary to carry out the purposes of this Act; to exercise the power of eminent domain in acquiring property for such use…’” (Fitch, 1967)
4.1.2 Potential impacts on Skagway of ACRL and port development According to Michael Catsi, Executive Director of Skagway Development Corporation, the current full-time population of between 700 and 800 people could easily absorb 50-100 permanent new jobs. A small number of additional residents would have a positive impact on year-round businesses.
Skagway’s school has the capacity to double its enrollment; the community has an active recreation center; and the city expects a new health clinic to begin construction in 2007. However, the housing shortage presents a major challenge, especially during the summer tourist season, even for small additional numbers of workers. This would present a relevant challenge to port development with an influx of construction crews.
With future development, leaders in Skagway would prefer to focus on diversification on a relatively small scale rather than seeking a single, large industry, with a goal of enhancing year-round business opportunity and success. It is important to the community that development does not occur at the expense of their tourism industry or tight-knit community (Catsi, 2006).
The Port of Skagway is currently used for both passenger and freight vessels, handling four to five large cruise ships per day during the busy summer months, as well as State of Alaska ferries, smaller cruise ships, fishing boats, and pleasure craft. Docks are available year-round for freight vessels. The Port provides access for the preponderance of Skagway’s tourism visitors, expected to be nearly one million people in 2006 – some drive to Skagway via the Klondike Highway from the Alaska Highway.
A report by HDR Engineering, Inc. (2006) recommends a $110 million capital investment in the Port of Skagway in conjunction with renovations to the WP&YR for development of ACRL. Alterations to the port would include a new bulk coal and mineral export facility on the Ore Dock site, a new rail-barge ramp, an intermodal dock, a floating dock extension for cruise ships, and upland storage facilities with equipment for handling material. The report provides operational details, including:
Freight ships would have strict storage times and would be required not to interfere with cruise ship loading and unloading on shared docks.
The new intermodal dock would be able to accommodate two of the largest cruise ships, bringing more visitors for Skagway’s tourism-based economy.
The dock would include easy and immediate access to trains, buses, and vans in front of the gangways. Components of the proposed concurrent WP&YR renovations have potential to be tourist attractions themselves, such as a three-rail track.
The increased freight transport would utilize current at-grade crossings instead of constructing new ones through the primarily pedestrian streets of town and jeopardizing pedestrian safety.
In addition to summer usage and sharing docks with passenger ships, freight docks would be available during the winter as well.
48 Information Insights, Inc.
ACRL SEA Socio-economic Impact Assessment - Alaska
At least one other study reported to be in process will provide additional scenarios for redevelopment of the Port.
4.1.3 Construction and operations impacts on corridor communities Rail corridor communities will experience a range of impacts during construction. Approximately 9,200 total construction jobs will be required for the Alaska segment of the ACRL mainline. In Southeast Alaska, a workforce of approximately 1,500 will be required to expand the WP&YR and Skagway port facilities. Employment impacts from ACRL operations will be minor, resulting in an average of 60 jobs per year (direct, indirect and induced).
Types and extent of some impacts will depend on several factors, including whether:
Construction crews will have trans-border work permits, allowing Alaska workers to stay on the job in Canada, and Canadian workers to cross into Alaska;
Local residents receive assistance with preparing for and accessing construction jobs; Construction crews stay in camps separated from local communities; During operations, crew change points and housing are provided within or adjacent to
one of the communities; Emergency facilities are provided and adequately meet the needs of construction crews; Crews will be required to meet zero tolerance rules for alcohol and drugs.
Positive and negative changes accrued to residents of Interior Alaska during oil pipeline construction in the 1970s. Residents noted jobs, better airline transportation, and better health care among benefits. Those were offset by impacts on subsistence, higher prices, more substance abuse and related fighting, and a major increase in problems with public safety. Many of the people surveyed in 1977-78 felt that village conditions were not better than prior to TAPS (Information Insights, 2004).
If rail construction crews must meet strict workplace bans, substance abuse in nearby communities may be less likely to rise as dramatically as it did during TAPS. Communities also have tools for controlling importation, sale and possession of alcohol. Municipalities and established villages in Alaska can vote to control importation and sale of alcohol within their jurisdictions. In a recently published study, researchers determined that fewer accidents, assaults and other alcohol-related injuries occur in villages where residents have voted to control possession of alcohol (Wood and Gruenewald, 2006).
In the rail corridor, two villages had local option laws in effect as of July 2005: Tanacross bans possession; Tetlin bans sale and importation of alcohol.
4.2 Human ecological and cultural resources As a central concept in understanding human ecology in Alaska, sense of place relates both to Native and to place-committed non-Native residents.
In Sense of Place in Natural Resource Recreation and Tourism, Farnum, Hall and Kruger (2005) consider sense of place influences due to user types, place-based process and
Information Insights, Inc. 49

ACRL SEA Socio-economic Impact Assessment - Alaska
conflicts. The development of deep meaning or value to users as it relates to sense of place can be viewed through three perspectives:
Biological/evolutionary Origins of place meaning in individual experiences Sociocultural formation via race and ethnicity and through politics of place
Farnum, Hall and Kruger also discuss differences between user groups and relationships, and find numerous definitions for sense of place circulating among social sciences. They note an expressed desire among natural resource management teams to use the concept of sense of place in the management of public lands, especially as it relates to the integration of public opinion in decision-making for land managers. The politics of sense of place and scales of importance attached to people’s opinions depend on their status in relation to a project (i.e. insider versus outsider). The same authors suggest a more in-depth analysis of sense of place that goes beyond simple descriptive statistics and incorporates people’s ethnic, social and cultural backgrounds, as well as individual experiences (Farnum, Hall and Kruger, 2005).
Athabascan people living in the proposed ACRL corridor share many cultural traditions with the Koyukon people slightly to the west, where traditional understanding includes the idea of interconnectedness. In his study of the Koyukon people, Make Prayers to the Raven, Richard Nelson wrote, “Everything that exists on Earth, whether it be human beings, animals, or plants; rocks or rivers or snowflakes—shares a spiritual kinship arising from shared origins” (Suzuki, 1992).
Jerry Isaac of Tanana Chiefs Conference noted the importance of studying all aspects of life in the region – taking a holistic approach – because big projects impact people, communities and the land in many interconnected ways. Any number of individual effects, positive, negative or neutral, can be documented in studies. Potential impacts get watered down because everybody wants to see the financial development of a project (Isaac, 2006).
Mr. Isaac asks that a project such as the ACRL should begin by asking: where is the balance? Where is the truthful, inclusive study that identifies issues in their broadest context? Among concerns, Mr. Isaac noted the importance of understanding what life was like in the Upper Tanana region before construction of the Alaska Highway began in the 1940s, and suggests a study that asks remaining Elders “What would you have changed about what was done if you could?” He would like to see a comparison of community life in Northway, Tetlin and Tanacross with three communities in northern Interior Alaska that still are not road-connected (Isaac, 2006).
4.2.1 Subsistence economy and resources People in many parts of Alaska define their relationship to the land, animals, and communities through economic, cultural, and nutritional patterns that together are called subsistence. This is true in the Upper Tanana valley, where a comprehensive assessment of predicted impacts must look at how construction and operation of a railroad will affect subsistence resources. Furthermore, such a study must involve Alaska Natives at the earliest stages of policy development, and must incorporate first-hand experiences of people who understand and have participated in the cycles of life in rural Alaska. The study conducted by
50 Information Insights, Inc.
ACRL SEA Socio-economic Impact Assessment - Alaska
Information Insights to identify municipal impacts of gas pipeline development identified the types of direct subsistence impacts of greatest concern in the Upper Tanana (2004):
Availability of resources: Changes in the abundance, displacement, contamination, or health of a resource.
Access to resources: New roads, industrial or residential development, and improved transportation and technology.
Competition for resources: Increased numbers of people with access to subsistence areas. Realignment within rural communities of subsistence priorities and supportive
technologies: Changes in time and space patterns of subsistence resource use. Effects of a railroad on game migrations, abundance or accessibility will alter the web of relationships between local people, the land and its resources. Employment of people who normally carry out subsistence activities has been shown to have long-term effects on daily life in Alaska Native communities, but the changes are not linear. “Greater economic activity in the villages will improve some aspects of quality of life, but may negatively affect other conditions” (Information Insights, 2004). Subsistence means more than food – the term embodies a complex system of production and distribution that includes “…values, desires and traditions in addition to ‘need’ or ‘dependency.’” The concept and practice of subsistence involve comprehensive kinship-bound systems within a community’s economic structure. Although wage earners have less time for subsistence activities, it may be less a question of money than of the integrity of communities (Lonner, 1980). Game harvest data sources are limited in scope, and those that exist are not comprehensive. The Alaska Department of Fish and Game provided subsistence reports in some areas in the 1980s, but budget reductions have reduced follow-up. Other agencies have conducted additional research on trends in harvest patterns, including the Alaska Department of Commerce, Community and Economic Development, the U.S. Fish and Wildlife Service, the National Park Service, and the Bureau of Land Management. Some related subsistence concerns include:
• Optimizing employment of people from villages along the railroad route with minimal disruption to the provision of traditional foods and cultural activities.
• Development impact scenarios can help to create an understanding that greater economic activity in villages will improve some aspects of quality of life, but may negatively affect other conditions.
• Climate change is discussed in a growing body of scientific work and traditional knowledge. Evidence shows that climate change is accelerating and impacting northern indigenous peoples.
• Complex interactions between climate change, industrial activity, subsistence resources and subsistence activities.
Upper Tanana Fortymile Advisory Committee This citizens advisory committee advises the Alaska Department of Fish and Game. At Advisory Committee meetings there have been questions about where the pipeline and railroad will be crossing their lands, and frustration expressed due to lack of information.
Information Insights, Inc. 51

ACRL SEA Socio-economic Impact Assessment - Alaska
Notes from the meetings of the advisory committee, while not necessarily representative of the feelings of all people in the area, may be a good indicator of concerns of people from Tok and the road system. They are available from the Fairbanks office of ADF&G.
4.2.2 Cultural resource sites Inventory, evaluation, and in some cases, mitigation of impacts on cultural resource sites will be required prior to construction of the proposed ACRL between Delta Junction and the Canadian border. Several federal and state laws and regulations mandate cultural resource studies – notably, Section 106 of the National Historic Preservation Act of 1966. A likely outcome of the Section 106 process will be the requirement to develop a Programmatic Agreement or Memorandum of Agreement regarding cultural resources. The Surface Transportation Board (STB) and the Alaska State Historic Preservation Officer (SHPO) would be required signers, with the probable inclusion of more parties. Other interested landowners and stakeholders would be invited to participate in development of the agreement document.
The State of Alaska maintains a database of known cultural resource sites, including those identified as sacred or archaeological. The database is confidential because of the need for protection from vandalism. The State Historic Preservation Office in the Department of Natural Resources maintains the database. Their website states:
The Alaska Heritage Resources Survey (AHRS) is an inventory of all reported historic and prehistoric sites within the State of Alaska and is maintained by the Office of History and Archaeology. This inventory of cultural resources includes objects, structures, buildings, sites, districts, and travel ways, with a general provision that they are over 50 years old. To date over 22,000 sites have been reported within Alaska (however, this is probably only a small percentage of the sites that may actually exist but are as yet unreported).[...]The AHRS is primarily a map based system. We maintain a complete set of USGS topographic maps at 1:250,000 scale and 1:63,360 (1" = 1 mile) scale with the site locations plotted on them. [...]Access to site location information contained in the AHRS is closed to the general public (as required by PL 96-95; AS 9.25.120, exception 4; Policy and Procedure No. 50200). Authorized users are representatives of federal, state, or local governments on official business; researchers engaged in legitimate scientific research; individuals or representatives of organizations conducting cultural resource surveys aimed at protection of such information or sites; or such individuals determined by the Chief of the office maintaining the Alaska Heritage Resources Survey as having a legitimate need for access.
Although the AHRS includes known sites, it is not comprehensive. Additional sites that are not well documented would likely be included as Traditional Use Areas and Traditional Cultural Properties under federal antiquities laws. Involvement of Native communities in the corridor will be necessary to identify these areas. The Alaska Highway Gas Pipeline group sponsored an archeological study of the gas pipeline right of way from Delta to the Canada Border in 2001. That study is proprietary and confidential. The AHRS database includes sites identified during that survey (personal communication, Bob Sattler of Tanana Chiefs Conference, May 1, 2006).
52 Information Insights, Inc.

ACRL SEA Socio-economic Impact Assessment - Alaska
Leaders from the Upper Tanana region met for a Cultural Resources Summit in March 2005 to discuss identification and protection of cultural sites. The specific information about graves, cabins and other resources is protected. However, most transcripts of speeches made at the summit are available, and at least some of the participants would be available as resources for further work on the rail corridor.
4.2.3 Legal mandates for historic preservation In addition to the Surface Transportation Board filing requirements, the important cultural resource2 laws and regulations affecting the project are:
National Historic Preservation Act of 1966 (as amended), (NHPA) NHPA implementing regulations (36 CFR 800) American Indian Religious Freedom Act of 1978 Archaeological Resources Protection Act of 1979 (ARPA) Native American Graves and Repatriation Act of 1990 (NAGPRA) Alaska Historic Preservation Act (AHPA) Local historic preservation ordinances
Of particular importance is the need for consultation. The revised (May, 1999) 36 CFR 800 regulations require increased Native American involvement in the Section 106 process. This is an important consideration with implications for project scheduling. On behalf of the applicant (Alaska Railroad Corporation), the lead federal agency (Surface Transportation Board) must consult with Native American organizations and agencies regarding identification of cultural and sacred sites during planning, and their evaluation and treatment during construction. Consultation with regional groups (e.g., Doyon Limited and Tanana Chiefs Conference) and local tribal governments (e.g., Healy Lake, Dot Lake, Northway, Tetlin) should begin as soon as a route is chosen to reduce delays.
Consultation regarding subsistence issues is required under Title VIII of ANILCA (Alaska National Interest Lands and Conservation Act). Government to government consultation between the federal government and federally recognized tribal governments is mandated under E.O. 13175 (65 FR 218).
Federal agencies are required to consider3 cultural resources affected by projects subject to federal funding, licensing or permitting. The underlying authority for historic preservation is derived from Section 106 of the National Historic Preservation Act of 1966, as amended (16 USC §470) and implementing regulations (36 CFR 800). Further federal requirements for historic preservation are mandated by the Archaeological and Historic Preservation Act of 1974, which requires that all federal agencies provide notice to the Secretary of the Interior of any planned project having federal funding or other involvement, such as licensing, so that significant archaeological data will be recovered from sites eligible for the National Register of Historic Places (NRHP). The NRHP (36 CFR 60) is the official list of properties 2 Paleontological sites are not addressed here, but will likely need to be managed, particularly on federal land. The Bureau of Land Management has inventoried some sites and has formulated policies for identification and protection of sites on lands they manage. 3 Technically, agencies are required to afford the Advisory Council on Historic Preservation, and by extension, the State Historic Preservation Office, an opportunity to comment on their undertakings.
Information Insights, Inc. 53

ACRL SEA Socio-economic Impact Assessment - Alaska
significant in American history, architecture, archaeology, engineering, and culture and is designed to assist local communities, state governments, and federal agencies in their preservation planning.
Federal agencies, in consultation with the State Historic Preservation Office (SHPO), evaluate the significance (i.e. determination of eligibility) of each property for possible eligibility to the NRHP. If the agency and SHPO agree that the property meets the established criteria, then the property is treated thereafter as if it were listed in the NRHP. Properties eligible for inclusion or listed in the NRHP may require future consideration if a development project is likely to have an adverse effect on the property. An important part of the entire Section 106 process is consultation among developers, agencies, and Native American organizations (36 CFR 800).
The Alaska Office of History and Archaeology (OHA) recognizes different levels of investigation used to evaluate archaeological and historic properties. Given that proposed project constitutes a federal undertaking, the appropriate level of cultural resources survey is an Evaluation Phase survey, approximately correlative with what is generally called a “Phase II” investigation. The goal of the Evaluation Phase is to "determine if archaeological or historic properties identified in the area of potential effect are eligible for inclusion in the National Register of Historic Places” (OHA 2000). Research design, archival research, field sampling, and building/structure evaluations are important parts of the evaluation process. The final report on Evaluation Phase investigations must enable pertinent agencies to evaluate determinations of eligibility.
4.2.4 Predictive model Northern Land Use Research (NLUR) has produced several heuristic site location models with goals of facilitating more efficient cultural resource surveys, keeping costs down, and optimizing survey strategies within stratified probability areas. NLUR produces models for cultural resource management plans (e.g., Red Dog Mine); for smaller installations (e.g., Eielson Air Force Base); for large-scale survey projects (e.g., railroad extension from Fairbanks to Delta Junction); and very large survey projects such as the proposed gas pipeline from Prudhoe Bay to the Canadian Border. While the details of modeling procedures vary for each project, the overall approach employs a Geographic Information System (GIS) to develop high vs. low probability areas for location of cultural materials. These probability areas are compared with previous archaeological survey coverage and methods to evaluate the efficiency with which previous and current survey approaches have been and can be used to determine cultural resource locations. The GIS model links to survey strategies that can be used during any proposed fieldwork.
GIS can identify patterns for a stratified sample of known site locations using environmental variables to predict (retrodict) site locations. Model inputs are independent variables represented by GIS thematic layers (geomorphology, surface geology, vegetation, etc.) and dependent variables are known site locations and site type distributions. Model outputs are heuristic digital images of areas of high and low potential for the discovery of cultural resources given the current state of knowledge (i.e., inductive models).
General procedures include:
54 Information Insights, Inc.

ACRL SEA Socio-economic Impact Assessment - Alaska
Assessment of previous archaeological work in the project area – site location digitization, quality control for site coordinates, and assessment of previous research strategies and implementation.
Selection and digitization of relevant and available environmental variables (aspect, surface geology, vegetation, waterfowl distribution, etc.)
Incorporation of prehistoric/historic site locations and random non-site points. Depending on the project size, area, and heterogeneity, sub-samples can be used (e.g., Native or Euro-American sites).
Statistical analysis of the relationship among site locations and random non-site points to determine optimum number and type of independent variables that can be used to predict site locations. Chi-square and Mann-Whitney U tests are normally used for nominal and ratio level variables respectively.
Construction of model parameters by weighting variable layers and calculating multiple variable layer values. Each pertinent variable is assigned a value or weight, positive if the variable is positively correlated with site locations, negative if they are negatively correlated, and zero if there is no correlation. Model output includes maps with high to low probability (or sensitivity) for site locations.
The resulting model serves as a guide for appropriate survey strategies. These protocols help to define and relate aspects of visibility, transect width, and subsurface testing frequency and depth. For large projects, we recommend a two-phase approach, with transect-based ground survey for areas of high probability and low-altitude aerial survey with limited ground testing for areas of low probability.
The State Historic Preservation Officer (SHPO) generally requires the report to include an assessment of model performance. This is normally done through statistical analysis of sites located during the survey with the model expectations.
4.2.5 Previous investigations This brief overview of requirements does not include an evaluation of known sites in the area. A detailed overview of a ten-mile wide corridor encompassing the proposed route of the Alaska natural gas pipeline was conducted in 2001 for the Alaska Gas Pipeline Producers Group (Potter et al. 2001) and a reconnaissance field survey was conducted the same year (Potter et al. 2002). Both of these confidential reports, which represent the most recent large-scale coverage of the area, are filed in the Office of History and Archaeology, Department of Natural Resources, Anchorage. In general, little is known about the prehistory of the area, so making statements about areas of high resource concentrations would be premature at this time.
Under Executive Order 13007 issued by President Clinton, federal agencies came under more stringent requirements for protection of Indian sacred sites. The order requires the government to accommodate access and use for Native Americans and mandates avoidance of “affecting the physical integrity of such sacred sites.” The practical effect of this order is to make mitigation much more difficult.
Information Insights, Inc. 55

ACRL SEA Socio-economic Impact Assessment - Alaska
4.2.6 Native allotments Lands that were chosen as Native allotments are more likely to have a long history of traditional use and therefore often have historic and cultural value. They may have a greater likelihood of having traditional cultural property or sacred site issues.
If allotments are sold and come out of Native ownership, the sale constitutes a federal action that triggers the Section 106 process. Since the entire rail corridor study will come under Section 106, sale of any allotments will be incorporated into that overview.
A map of land status in the ACRL corridor in Alaska, including native allotments and ANCSA lands, is available in PDF format as an appendix to this report.
4.3 Cumulative impacts The presence of a rail system will bring expansion of existing activities as well as new types of activity to the proposed railroad corridor and adjacent areas. The potential for cumulative impacts must be addressed as part of the scoping of this project. This study identifies some of the major issues, but as with construction impacts on subsistence, does not address costs or restitution for most cumulative impacts.
Looking back on historical development activities can provide a perspective on impacts that have long-term, far-reaching and exponential consequences. Areas that may have been used for subsistence harvest become inaccessible even though they are not technically part of railroad right-of-way. Although ancillary development is not part of the railroad extension project, the cumulative effects impact the lives of people living in the corridor.
Non-resident hunter activity results from increased accessibility provided by a rail bed. Reducing the supply of land available for subsistence activities and increasing access to previously remote land has the additional unintended effect of altering the way in which people think about land.
The concept of examining cumulative effects should include interaction between the impacts of former military activities, new gas pipeline activities, and subsistence resources and activities. In the Upper Tanana, military pipelines carried products northward from Whitehorse (CANOL) and Haines (Haines-Fairbanks pipeline). A suite of issues has emerged from those pipelines and should be integral to discussions with knowledgeable people in the region as part of the EIS process. In the Upper Tanana, as in other regions, there are additional on-going questions about hazardous waste liabilities remaining from past military activities; trespassing on Native allotments; rights-of-way; and gravel sales.
4.4 Preliminary engagement strategy For the purposes of this assessment, the primary message regarding engagement can be boiled down to a simple formula:
Start earlier than the EIS process to build relationships with Tanana Chiefs Conference, individual tribes and local municipalities that will be affected by the ACRL project.
Alaskans seem to have a general tendency to favor expansion of a railroad, based on anecdotal evidence and historic trends, but the project can be damaged by lack of
56 Information Insights, Inc.

ACRL SEA Socio-economic Impact Assessment - Alaska
information or the absence of invitations to be involved at the early stages of policy and program development.
Federal, state and other agencies will participate in the scoping process for an EIS because of their scientific and technical expertise and their knowledge of relevant data and studies. It is equally important to involve the public in the scoping process to identify issues important to residents affected by the project, especially in the case of a project spanning many miles and communities.
Information Insights, Inc. 57

ACRL SEA Socio-economic Impact Assessment - Alaska
5 Overview of Economic Impacts This half of the study takes a first look at the economic and fiscal impacts of an Alaska-Canada Rail Link on the Alaska economy. After a brief overview, it begins with a review of the literature and data sources developed during Phase I of the ACRL Feasibility Study that form the basis of the impact analysis. The next section summarizes base case projections for Alaska’s construction, mining and oil and gas industries in the absence of an ACRL project. Final sections present preliminary estimates of potential economic and fiscal impacts on the Alaska economy in greater detail, with a brief discussion of U.S. impacts outside Alaska.
There are still many areas where additional data is needed before a more comprehensive analysis of economic and fiscal effects can be performed. In areas where existing data or predictive models were unavailable or insufficient to serve as the basis of a quantitative analysis, we have provided a narrative assessment that tries to capture the relative scale and direction of impacts on regional and statewide economies. In these areas the study may serve as a scoping document that can assist decision-makers by framing the issues that require further study.
Construction and operations impact ACRL construction will provide an estimated 9,200 construction jobs in Alaska over a three-year period, with wages and benefits exceeding $500 million.4 An additional 5,800 jobs5 will be created in other sectors of the economy, for a total employment impact of 15,000 jobs. Total labor income from wages, benefits and self-employment income is estimated at $771 million. Jobs from ACRL construction would help offset an anticipated downturn in construction employment in Alaska.
Capital costs for the Alaska segment of the railroad are expected to total nearly $1.1 billion or ten percent of construction costs for the full route. The total economic output generated by this spending will top $1.7 billion. Operation of the ACRL mainline will add about 60 jobs to the economy, with wages and benefits of $3.1 million per year.
Necessary upgrades to the Port of Skagway and the White Pass and Yukon Railway will create an additional 1,450 construction jobs and 1,050 jobs in other economic sectors, with a combined labor income of $127 million. New capital investments of $110 million in the port and $74 million in the Alaska segment of the existing rail line would generate $294 million in economic output in the state. No economic impact has been calculated for increased freight operations at the Skagway harbor following construction of the ACRL.
Alaska resupply impact Of the approximately four million tons of freight imported to Alaska each year for the purpose of community resupply, about two million could be shipped competitively using the ACRL. Savings on resupply would average $107 million or 25.4 percent of the $422 million total spent on resupply transport. Annual savings on general merchandise entering Alaska would average $51.68 per ton or $162 per capita. 4 Prices are in 2003 dollars unless otherwise noted. 5 Jobs here and throughout this report are defined as person-years, where one job equals one full- or part-time position held for one year.
58 Information Insights, Inc.

ACRL SEA Socio-economic Impact Assessment - Alaska
The diversion of up to two million tons of marine freight to direct rail service would have profound impacts on port communities in Southcentral and possibly Southeast Alaska. Although the primary impact would be on the Port of Anchorage, negative impacts would also be possible in Whittier, Juneau and Ketchikan, while Skagway and Haines are likely to benefit economically from increased freight operations.
CPI impact Based on the estimates of freight volumes and prices, an ACRL could directly save $105 million on the cost of transporting goods typically included in the Anchorage consumer price index (CPI). This savings would result in a 1.0 percent decrease in the goods portion of the Anchorage CPI, for a net reduction to the Anchorage CPI of 0.38 percent. The total effect on the CPI will depend on what effect the savings in transportation costs has on services provided in Alaska. In theory, lower costs of goods would have a moderating effect on wages, but we do not have a current CPI model to estimate this effect. We can therefore say that the CPI effect would be between 0.38 and 1.0 percent.
Mining impacts A preliminary assessment of the potential for new Alaska minerals development associated with an ACRL project predicts at least 80 million tons of expected reserves could be developed in the rail corridor over a 30-year period, with a gross metal value totaling $41 billion. The estimate is based on probability, not on the location of specific deposits. This level of new mineral development would amount to a doubling of the production value of mines in the state, currently at $1.4 billion per year. New mining activity could provide an estimated 6,500 direct jobs per year on average with an annual payroll of $510 million. Total jobs, including indirect and induced effects, would average 11,000 annually. Economic output from new mining activity on this scale would total $52.6 billion over 30 years, for an average annual impact of $1.8 billion.
These impacts are based on preliminary estimates by University of Alaska Fairbanks researchers of probable new mineral development along the rail corridor. The impacts reported here may need to be adjusted once the final numbers from Phase I work on Alaska mining potential are released.
Alaska Highway gas pipeline impact The use of the ACRL to mobilize pipe and other materials for construction of the Alaska Highway gas pipeline could save the project $37.1 million, or 11 percent of total materials transportation costs. Mobilization for Alaska segments of the line could save the project $8.9 million, including a savings of $4.6 million off the cost of moving pipe and $4.3 million off fuel delivery to construction camps in Fairbanks, Delta Junction, and Tok. Materials destined for Prudhoe Bay and Dietrich camp would continue to go direct by ship or barge to Prudhoe Bay and from there by truck to Dietrich, so no savings on North Slope segments of the project are expected. Actual savings will be larger if the ACRL is also used to mobilize heavy equipment and other supplies for the project.
An 11 percent savings on transportation costs would increase the net present value (NPV) of oil and gas revenues to the State of Alaska by $17 million over the 35-year life of the project, while revenues to industry would increase by $13 million and federal tax receipts would go
Information Insights, Inc. 59

ACRL SEA Socio-economic Impact Assessment - Alaska
up $7 million over the same period.6 The timing of an ACRL project is critical if it is to have a positive impact on the economics of an Alaska natural gas project. The rail link would need to be operational one year before the start of construction to maximize the benefit to the pipeline project. If construction of the rail link overlaps with a gas pipeline project, it would have a negative impact as competition for resources drives up labor and materials costs for both projects.
The ACRL could also save the State of Alaska and North Slope producers a significant portion of the estimated $1.2 billion in transportation infrastructure costs related to construction of the pipeline.
Other oil and gas industry impacts Chemicals and metals account for 185,000 tons of rail-barge traffic entering Alaska each year, the great majority of which are used by Alaska’s oil and gas industry. Of this total 93,000 tons (50 percent) currently shipped from Canada by rail barge could be moved more efficiently by rail transport. Cost savings to the industry would average 8.5 percent on these commodities and could total up to $1.5 million annually. It may also be possible that the ACRL will the oil and gas industry with new sourcing options for inputs such as barite that can be produced in western Canada, saving money and lessening lead times on resupply.
Military defense and emergency management benefit The most important military defense and emergency management benefits to Alaska from the ACRL cannot be quantified. The rail link would provide a critical transportation link that could prove invaluable in the event that a major natural disaster or breech of security shuts down other transportation arteries connecting Alaska to the rest of the world. In particular, the expansion of freight facilities at the Port of Skagway would give Alaska another point of access in the Gulf of Alaska that is less vulnerable to seismic hazards. The ACRL communications system could improve the state’s emergency response capacity by providing a redundant communication link that could be tapped into in the event of an emergency.
The ACRL would benefit the military economically by providing savings on routine procurement. We estimated that the savings on military family resupply would average $2.6 million per year, or $1.1 million per year when family members are excluded.7.
Tourism No studies have been done to estimate ACRL passenger traffic or revenue on the Alaska side of the border. It is assumed that the rail link will draw the most tourists from those currently traveling to Alaska by air (52 percent) and highway (5 percent). We assume there will be a negative impact on Alaska companies currently providing bus packages, a positive impact on the Alaska Railroad and the White Pass & Yukon Route Railroad, and a positive impact on communities in the rail corridor. Passenger rail service would also attract additional tourists to Alaska who are rail enthusiasts.
6 Pipeline revenues are in 2005 dollars. The net present value is calculated using a five-percent discount rate for government revenue and a ten-percent discount rate for corporate revenue. 7 Estimates area based on FY 2005 military personnel data and exclude branches whose members are unlikely to live or work on military bases, including the Army and Air National Guard and the Army, Air Force, Navy, and Marine Reserves.
60 Information Insights, Inc.

ACRL SEA Socio-economic Impact Assessment - Alaska
The impact on Skagway’s tourist-based economy could be positive or negative depending on how well expanded freight facilities at the Port of Skagway can be designed around the needs of the cruise ship industry and related businesses. Tourist excursion operations could be enhanced if cruise ship business is linked to a modern passenger rail operation, while the three-rail track recommended for the White Pass &Yukon Route Railroad could become a tourist attraction in itself.
Highway maintenance savings Reduced heavy truck traffic on the Richardson, Alaska, Haines, and Klondike Highways due to a rail link would save the state an estimated $1,144,000 per year in annual maintenance costs, or over $22.9 million over twenty years. An even larger savings could be expected on the Parks, Glenn, and Seward Highways from the diversion of truck traffic associated with 1.6 million tons of marine freight that arrives at the Port of Anchorage each year. However, these savings cannot be estimated without data on the ultimate destination of goods shipped to the port.
The significant savings due to avoided transportation infrastructure projects related to the Alaska Highway gas pipeline has already been mentioned. Of the $1.2 billion in anticipated new spending on highways, bridges and ports, $800 million is estimated for post-construction repair of road damage due mainly to trucks carrying heavy pipe.
U.S. impacts outside Alaska Construction and operation of the ACRL will have a minimal impact on the U.S. outside Alaska. The most significant impact we anticipate is the reduction in surface freight transportation within the contiguous United States as marine freight flows to Alaska are diverted to direct rail service on the ACRL. Intermodal freight traveling by highway and rail to Seattle/Tacoma would be diverted to Chicago resulting in a net loss in transportation service within the U.S., a net gain in Canada, and a small negative impact on the U.S. balance of trade with Canada. A positive impact on the U.S. balance of trade could result from new mines or petrochemical plants developed in Alaska due to the ACRL, but there is little Phase I data on which to base an estimate. Further study is needed to assess the impact of lost business on U.S. ports, railways, and trucking services.
Information Insights, Inc. 61

ACRL SEA Socio-economic Impact Assessment - Alaska
6 Review of Literature and Data Sources for the Economic Impact Analysis
Measuring the economic impact of an existing development requires the availability of accurate data on the direct economic effects of the operation or industry being studied (e.g. workforce, payroll, local and regional expenditures). In assessing the economic impacts of a future development, real effects are not known and we must rely on the output of predictive models of a specific project proposal for our data. For the purposes of the current analysis, we use data compiled during the first phase of the ACRL feasibility study on construction and operating costs, mineral development, community resupply costs, and other market effects. Some of these reports were still in draft form at the time our analysis was done. We also reviewed feasibility studies completed as part of earlier efforts to link Alaska’s rail system with Canada, and we reviewed the 2004 Information Insights study of gas pipeline impacts on communities in the proposed pipeline corridor, which overlaps the ACRL corridor from Delta Junction to the Canadian border.
6.1 ACRL construction and operations As part of the ACRL feasibility study, Informetrica Limited (2006) studied the direct effects of the ACRL through an extensive literature and data review of Phase I findings. Data on capital expenditure and operation costs were analyzed, including cost models by Innovative Scheduling. Results of the Informetrica Limited analysis cover the direct effects of the ACRL capital expenditure and operations on the Canadian economy by region. The authors note that a limitation of the current data is that a single route scenario was not used for all analyses, so the direct effects reported may not be consistent between sections.
The study assumes that the cost of constructing the Alaska portion of the route will be approximately ten percent of the total capital expenditure, or almost $1.1 billion out of a total of $11 billion cost to build the rail route from Delta Junction to Ladue to Carmacks to Watson Lake to Hazelton.8 Capital expenditure for the Alaska segment of the mainline will be 10 percent of the total, even though it contains 14.9 percent of the total mileage (196 of 1,319 miles). Costs per mile in the U.S. are not given, but can be calculated at $5.34 million. Alaska costs are lower due to the relatively flat terrain through which most of the Alaska alignment would be constructed.
Capital costs for the spur from the Canadian border to Skagway are estimated at $42 million out of a total of $635 million for the Carmacks to Whitehorse to Skagway line. The Alaska portion of the spur covers 17 out of 217 miles (7.8 percent) and accounts for 6.6 percent of the projected cost.
8 Unless otherwise noted all monetary figures are in U.S. dollars.
62 Information Insights, Inc.

ACRL SEA Socio-economic Impact Assessment - Alaska
Table 4: ACRL capital expenditure for Alaska segments
Capital Expenditures AK Segments (US$ millions)
Full Route (US$ millions)
Annual Maintenance, AK
($US millions)
Annual Maintenance,
Total ($US millions)
ACRL Mainline (Delta Junction, Alaska, to Ladue Border to Carmacks, YT, to Watson Lake, YT, to Hazelton, BC)
$1,047 $10,315 $4.8 $47.9
ACRL Spur (Carmacks, YT, to Whitehorse, YT, to Skagway, AK)
$42 $635 $0.2* $3.0
Total Capital Cost $1,089 $10,950 $5.0 $50.9 Source: Informetrica Limited (2006); *calculated from data provided
The study allocates 90 percent of the total capital expenditure to structures (embankment track, etc.) and ten percent to machinery and equipment, since the route will run only a small number of locomotives and cars compared with other rail lines. The Informetrica model assumes approximately 18.6 percent of the initial capital expense is spent on maintenance and ROW costs over 40 years. The annual capital expense for maintenance is given in Table 4.
Projections for ACRL operating expenses are taken from Innovative Scheduling’s cost models (May 8, 2006 version). The routing from Hazelton, B.C., to Watson Lake, Yukon, used in capital expenditure analyses is not used in these models. Instead, several alignments are modeled including one that starts in Minaret and connects with the Northern or Tintina Trench route from Watson Lake through Carmacks to the Ladue Border, a route which is 104 miles shorter than the Hazelton alignment. Operations estimates for this route are shown in the top row of Table 5. Operating costs are not broken out by segment, but we can estimate them from the full route totals assuming a similar AK/CN cost ratio as was projected for capital expenditures, as shown in the bottom row of the table.
Table 5: ACRL operating costs
Operating Expenditures (US$ millions) Year 1 Year 2 Year 3 Year 4
Full Route $137.0 $133.4 $145.3 $144.3 Alaska Segment Estimate* (Assumed at 10% of total)
$13.7 $13.3 $14.5 $14.4
Source: Informetrica Limited (2006); *calculated from data provided
6.1.1 Workforce estimates of ACRL Innovative Scheduling (2006) has created a robust model to evaluate three ACRL routes under various cost and traffic scenarios. A summary report displays outcomes for each of route-cost-traffic scenario combination, including revenue, operating expenses by category,
Information Insights, Inc. 63

ACRL SEA Socio-economic Impact Assessment - Alaska
workforce, payroll and fringes, and costs per unit. It is not clear from the documentation provided what assumptions are built into the model components such as the detailed traffic forecast projections. Most of the data is not broken out by segment, but there are exceptions. Operating cost data available by segment are summarized in the table below for Alaska segments of the Minaret-Watson Lake-Carmacks-Ladue River-Delta Junction route under medium cost and traffic scenarios.
Table 6: Innovative Scheduling projections, Delta Junction to Canadian border
Notes Year 1 Year 2 Year 3 Year 4
Track mileage 196 Terrain type Normal Terrain MOW Multiplier 1.0
Track capital $1,092,845,000 Track capital per mile $5.59
Trains per week Loaded (LD) & empty (MT)
20 (10 LD, 10 MT)
20 (10 LD, 10 MT)
20 (10 LD, 10 MT)
20 (10 LD, 10 MT)
Crews per week 2 crews per train; 2 persons per crew
40 40 40 40
Total cars Loaded & empty 186,009 182,552 172,393 173,536
Fuel
Fuel Price Index 100%
Fuel Price Index 101%
Fuel Price Index 102%
Fuel Price Index 103%
Total Gallons 5,690,909 5,527,959 5,225,224 5,252,137 Fuel Cost $10,243,635 $ 10,049,829 $ 9,593,511 $ 9,737,461
Source: Innovative Scheduling (2006); Route 1 with medium cost-medium traffic assumptions.
Table 7: Innovative Scheduling traffic forecast, Delta Junction to Canadian border
Trains per week (loaded)
Trains per week (empty)
Carloads per year (loaded)
Carloads per year (loaded)
155,113 boxes; 77,557 flats
Intermodal
7 7
155,113 boxes; 77,557 flats
Minerals – – – – Coal – – – – Pipe 2 2 8,818 8,818
Industrial Products
1 1 6,668 6,668
Total 10 10 93,004 93,004 Source: Innovative Scheduling (2006); Route 1 medium cost-medium traffic assumptions.
64 Information Insights, Inc.

ACRL SEA Socio-economic Impact Assessment - Alaska
6.1.2 Skagway rail and port renovation projects HDR Engineering, Inc., in association with TEC Infrastructure, Inc., studied the feasibility of expanding existing port facilities in Skagway, Alaska, and modernizing the White Pass & Yukon Route Railroad (WP&YR) that links Skagway with Carcross, Yukon Territory (HDR Engineering, 2006). Modernization of the southern Yukon rail and development of additional port capacity in Skagway are integral components of the ACRL feasibility study. According to HDR, the resumption of rail freight service to southern Yukon and the improvements to the Port of Skagway would enhance economic growth of Alaska and Yukon generally and would, in particular, provide the economics necessary for Yukon mining to compete with other Pacific Rim regions. Skagway would benefit by becoming a major import and export port facility and an entry point to Yukon Territory. Transportation assets would include first-class intermodal and bulk materials port facilities in close proximity to Whitehorse. Rail barge access to Skagway would serve Yukon Territory with cargo forwarded from Prince Rupert and Vancouver.
The study concludes that recommended renovations of port and rail facilities would be profitable investments even under worst case scenarios, assuming that the facilities are jointly owned and operated. Competitive highway cargo transportation alternatives to the Port of Skagway are extremely expensive, and the railroad infrastructure is in place and underutilized. Skagway is a shorter sailing time and saves one day over using Prince Rupert, BC, as a waterfront. Currently all Prince Rupert cargo must be handled by rail from Prince Rupert to either Fort Nelson (approx. 995 miles), or to Dease Lake (approx. 450 miles), then transferred to truck, and freighted an additional 400 miles (from Dease Lake) or 600 miles (from Fort Nelson) to Whitehorse.
The challenges to the projects are considerable. The capital investment is significant, and project is dependent for rail and port cargo on mineral and coal exports and freight from large energy projects (the Alaska Highway and Mackenzie Valley gas pipelines), which face their own challenges. Mining has not been a sustainable component of the Yukon economy in the past.
Port of Skagway expansion The Port of Skagway is currently used for both passenger and freight vessels. The port handles four to five large cruise ships per day during the busy summer months as well as State of Alaska ferries, smaller cruise ships, fishing boats, and pleasure craft. Docks are available year round for freight vessels.
HDR Engineering, Inc. (2006) recommends a $110 million capital investment in Port of Skagway renovations. Alterations to the port would include a new bulk coal and mineral export facility on the ore dock site, a new rail-barge ramp, an intermodal dock, a floating dock extension for cruise ships, and upland storage facilities with equipment for handling material. Freight ships would have strict loading and unloading times in order to maximize efficiency. These times would not interfere with the cruise ship schedules on shared docks.
A new 1,560-foot intermodal dock would provide prime cruise ship berthing for two of the largest cruise ships, bringing in more visitors to the tourism-based economy. The dock would include a wide staging area allowing trains, busses, and vans to load and unload directly in front of the gangways. The authors believe the new facilities will have a positive ripple effect
Information Insights, Inc. 65
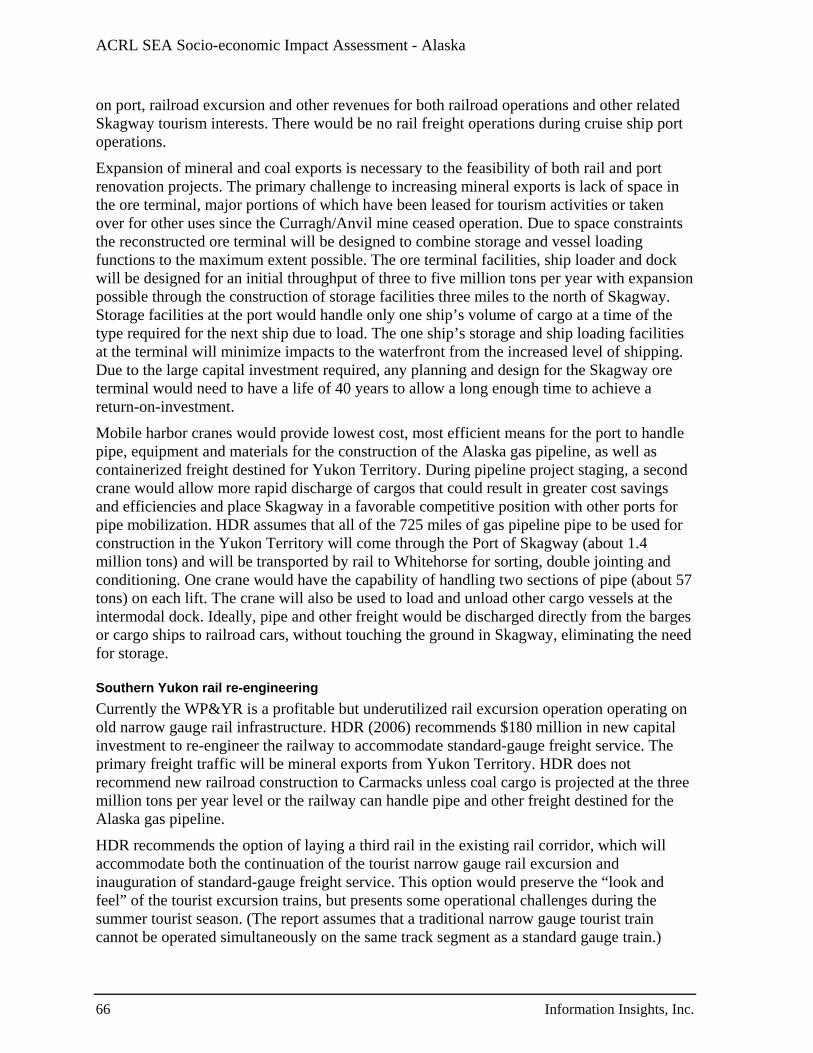
ACRL SEA Socio-economic Impact Assessment - Alaska
on port, railroad excursion and other revenues for both railroad operations and other related Skagway tourism interests. There would be no rail freight operations during cruise ship port operations.
Expansion of mineral and coal exports is necessary to the feasibility of both rail and port renovation projects. The primary challenge to increasing mineral exports is lack of space in the ore terminal, major portions of which have been leased for tourism activities or taken over for other uses since the Curragh/Anvil mine ceased operation. Due to space constraints the reconstructed ore terminal will be designed to combine storage and vessel loading functions to the maximum extent possible. The ore terminal facilities, ship loader and dock will be designed for an initial throughput of three to five million tons per year with expansion possible through the construction of storage facilities three miles to the north of Skagway. Storage facilities at the port would handle only one ship’s volume of cargo at a time of the type required for the next ship due to load. The one ship’s storage and ship loading facilities at the terminal will minimize impacts to the waterfront from the increased level of shipping. Due to the large capital investment required, any planning and design for the Skagway ore terminal would need to have a life of 40 years to allow a long enough time to achieve a return-on-investment.
Mobile harbor cranes would provide lowest cost, most efficient means for the port to handle pipe, equipment and materials for the construction of the Alaska gas pipeline, as well as containerized freight destined for Yukon Territory. During pipeline project staging, a second crane would allow more rapid discharge of cargos that could result in greater cost savings and efficiencies and place Skagway in a favorable competitive position with other ports for pipe mobilization. HDR assumes that all of the 725 miles of gas pipeline pipe to be used for construction in the Yukon Territory will come through the Port of Skagway (about 1.4 million tons) and will be transported by rail to Whitehorse for sorting, double jointing and conditioning. One crane would have the capability of handling two sections of pipe (about 57 tons) on each lift. The crane will also be used to load and unload other cargo vessels at the intermodal dock. Ideally, pipe and other freight would be discharged directly from the barges or cargo ships to railroad cars, without touching the ground in Skagway, eliminating the need for storage.
Southern Yukon rail re-engineering Currently the WP&YR is a profitable but underutilized rail excursion operation operating on old narrow gauge rail infrastructure. HDR (2006) recommends $180 million in new capital investment to re-engineer the railway to accommodate standard-gauge freight service. The primary freight traffic will be mineral exports from Yukon Territory. HDR does not recommend new railroad construction to Carmacks unless coal cargo is projected at the three million tons per year level or the railway can handle pipe and other freight destined for the Alaska gas pipeline.
HDR recommends the option of laying a third rail in the existing rail corridor, which will accommodate both the continuation of the tourist narrow gauge rail excursion and inauguration of standard-gauge freight service. This option would preserve the “look and feel” of the tourist excursion trains, but presents some operational challenges during the summer tourist season. (The report assumes that a traditional narrow gauge tourist train cannot be operated simultaneously on the same track segment as a standard gauge train.)
66 Information Insights, Inc.

ACRL SEA Socio-economic Impact Assessment - Alaska
The operations model projects that 100 trains per month would operate between Skagway and Whitehorse. Rail passenger would operate during the “high” hours of 7:00 a.m. to 7:00 p.m. Coal trains would operate one round trip every other day. Rail barge would arrive at the Port of Skagway every fourth or fifth day, requiring four round trips per barge. Gas pipeline pipe would require four or five round trips per ship or barge.
New AC locomotives would bring substantial economic and reliability benefits. They would provide more power and require less maintenance and fuel use. Meeting the latest EPA locomotive emission standards, the locomotives would produce less exhaust and cleaner exhaust.
The increased freight transport would utilize current at-grade crossings instead of constructing new ones through the primarily pedestrian streets of town and jeopardizing pedestrian safety.
6.2 Alaska resupply QGI Consulting produced three work products on freight movement for Phase I of the ACRL feasibility study. In its Traffic Data Development for Regional Re-supply (QGI Consulting, 2006a), QGI Consulting identified four modes of transport used: marine (container and trailer ships), rail barge, highway truck, and other (principally for the transportation of petroleum products and cement). The study identified a total of four million tons of freight entering Alaska each year for regional resupply. Marine transport accounted for 48.2 percent of the estimated annual tonnage, rail barge 7.6 percent, highway truck 2.9 percent, and other 41.3 percent. The study also estimated transportation rates for highway, container vessel, and trailer barge movements. QGI Consulting based its estimates on publicly available data as well summary data and rate quotes provided by transportation providers.
In Logistics for Regional Re-supply, QGI Consulting (2006b) provided an overview of the principal transportation flows and carriers to Alaska and summarized inbound freight volumes. QGI Consulting then identified where an ACRL could be competitive with alternative modes of transportation and forecasted freight volumes and revenues from an ACRL. Using the freight volumes data from the their (2006a) study, QGI Consulting determined that two million tons of the four million tons of freight shipped annually to Alaska for resupply was amenable to transport via the ACRL. They concluded that general merchandise shipped via marine container and trailer ships, along with freight transported via truck along the Alaska Highway, and rail-barge traffic originating in western Canada could competitively be transported via the ACRL.
QGI Consulting’s traffic analysis spreadsheet (2006c) provides rate calculations and detailed forecasts used in their Traffic Data Development and Logistics papers. The Microsoft Excel spreadsheet categorizes transportation costs by carrier, commodity, origin, destination, and mode of transport.
As part of its analysis to determine total inbound traffic involved in community resupply to Alaska, the Yukon and northern British Columbia, QGI Consulting also summarized data collected from the only two weigh scales in the Yukon Territory along the Alaska highway (QGI Consulting, n.d.). The data included tonnages for commodities, gross vehicle weight (GVW), and trip counts for truck freight flows traveling north and south along the highway
Information Insights, Inc. 67

ACRL SEA Socio-economic Impact Assessment - Alaska
for the years 2000 to 2003. Destination and origin of freight could only be determined in general terms of Alaska, Yukon Territory, or south of the 60th parallel. Similar data were collected for traffic along the Klondike highway traveling to and from Skagway and the Haines highway.
6.2.1 Highway traffic and maintenance costs No studies of Alaska Highway maintenance savings related to an ACRL project have been completed. The Informetrica Limited study noted generally that state and local governments would see a reduction in highway maintenance expenses, as roads require repair less often. However, revenue from taxes on diesel fuel will also be reduced when freight is hauled by more fuel-efficient means. Accommodations and restaurants that serve truckers will also see a negative impact on their businesses (Informetrica Limited, 2006). The freight traffic data and logistics analysis by QGI Consulting (2006a, 2006b, 2006c) and information provided by the Alaska DOT&PF personnel are the basis for our analysis of highway maintenance cost savings.
6.2.2 Port access and capacity Alaska-Canada Rail Link Study, Multimodel Port Access Work Package B2(d) Operations Evaluation prepared by DKA Marketing and Banjar Management Inc. (2006) assesses the current and potential ability of key ports to support outbound resources and inbound resupply shipments for Alaska, northern British Columbia, and Yukon Territory. The study divided ports into three geographic groups.
Port Group Area I includes Southcentral Alaska including ports of Anchorage, Mackenzie, Seward, and Whittier and Valdez. These ports are connected to the Alaska Highway network and in some cases to the Alaska Railroad system and have various degrees of deep-sea vessel access. They have existing terminal facilities with some potential to develop additional capacity.
Port Group Area II includes Skagway and Haines and represents the shortest access to tidewater for Southern Alaskan and much of the Yukon. Both can receive deep-sea vessels and have road access. Skagway has limited rail access. Skagway shifted their port focus from industrial use to tourism. Haines is 150 miles further, and its port configuration minimizes use conflicts between industrial port activity and that of tourism, cruise and recreational activity. The Haines terminal has significant capacity for growth and the alongside draft and length of berth are suitable for Panamax vessels.
Port Group Area III is located in northern British Columbia, including the bi-national port of Hyder/Stewart that is connected by common highway infrastructure to B.C., Alaska, and southern Yukon Territory. The other two ports, Prince Rupert and Kitimat, are connected by both highway and rail. All three ports have deep-sea vessel access with existing capacity and expansion potential.
6.3 Minerals development in Alaska A preliminary assessment of the potential for new Alaska minerals development associated with an ACRL project predicts at least 80 million tons of expected reserves could be
68 Information Insights, Inc.

ACRL SEA Socio-economic Impact Assessment - Alaska
developed in the rail corridor over a 30-year period, with a gross metal value totaling $41 billion. The gross value is based on a metallic content of 70 percent of total mineral concentrates. (Typically about 30 percent of concentrates consist of sulfur.) Dr. Paul Metz, professor of mining and geological engineering at the University of Alaska Fairbanks, directed the study.
Estimates of mineral potential in the area are based on probability, not on the location of specific deposits, according to Dr. Metz. His team has tabulated 600 mineral occurrences in the region, estimating the gross metal value at 50 and 90 percent probability based on tonnage and grade worldwide. The study corridor extends to 60 miles on either side of the proposed rail line. The majority are moderate-sized occurrences of base metals and ferro alloys. Base metals include copper, lead and zinc. Ferro alloys, including nickel, chromium, manganese, molybdenum, vanadium, tungsten, and tin, are used as additives and de-oxidizing and de-sulfurizing agents in steel manufacture.
It is possible that these deposits could be developed without a railroad, but they are currently considered stranded due to a lack of competitively priced transportation and low-cost energy. Metal mines are highly power-intensive, and low cost energy is considered critical to their competitiveness in the world market. (Exceptions to this rule are mines with high value deposits like gold that can be operated economically even on expensive power from diesel generators.) A railroad is also more critical for exporting base metal ores. The combination of a rail transportation and cheaper power would make it economic to develop many low-grade or marginal deposits in the Interior. Without the expectation that mineral deposits could be developed economically not much exploration has been done in the region, which is one reason for the lack of specific data on mineral reserves.
The 80 million tons of concentrates identified in the preliminary assessment represent the minimum that researchers expect would be exported from the region following construction of an ACRL. Overall Dr. Metz anticipates that new mineral development in Alaska would be one-fifth that of Yukon Territory and one-third to one-half that of British Columbia. The Alaska database only includes the undiscovered mineral potential, not known reserves. There is another $50 billion (100 million ounces) in drill-indicated and measured gold reserves in the Interior right now that are not included in the expected value database.
Mineral concentrates either would be hauled out to tidewater or – if processed to produce metallic products – shipped to Chicago to reach Midwest markets. In the latter scenario, economic activity and job creation in Alaska would be greater due to the additional value added processing required to turn ore concentrates into products.
According to Dr. Metz, this initial assessment most likely underestimates the potential for new mine development, because it is based on the Alaska Resource Data File of mines, prospects, and mineral occurrences. This U.S. Geological Survey (USGS) database includes only metallic minerals. Prospects for coal or industrial minerals could add significantly to the expected gross value of new mineral development made viable with a rail link. One limestone mine for portland cement could add more jobs to the Alaska economy than another Fort Knox gold mine. New mineral development in the Interior could be four times as high as the preliminary estimate – with 300 million tons of concentrates and a gross metal value of $160 billion (P. Metz, personal communication, June 28, 2006). The full report of Phase I findings on Alaska mineral development is expected to be released at the end of July 2006.
Information Insights, Inc. 69

ACRL SEA Socio-economic Impact Assessment - Alaska
6.3.1 Lack of detailed geologic data The lack of comprehensive geologic data for Alaska is one of the impediments to Alaska minerals development identified by the Alaska Minerals Commission in its 2005 report to the Governor and legislature. The commission wrote that Alaska is “one of the most poorly mapped regions of the world and ranks far behind many third world countries in spending for geologic data acquisition” (2006, p.7). According to the Commission, the federal government is carrying out little geological mapping and surveying and is not meeting its obligations under section 1010 of ANILCA to assess the oil, gas, and other mineral potential of all public lands in the state. The ANILCA requirement was initially met by the Alaska Mineral Resources Assessment Program (AMRAP), which was carried out by the USGS for several years after passage of ANILCA before its funding was first cut and then rolled into other USGS programs. The federal AMRAP program has effectively been dormant since about 1992.
The state has spent an average of $400,000 per year on airborne geophysical surveys and the geologic mapping necessary to “ground truth” the airborne surveys. By 2003, the geophysical surveys had covered approximately 8,515 square miles, or 1.3 percent of state lands. At that rate, it would take more than 100 years to complete a geological base map, according to the Alaska Mining Commission (2006).
6.4 Alaska Highway gas pipeline
6.4.1 Pipeline mobilization Informetrica Limited (2006) assumes that the rail link could be constructed starting in 2010 in time to be operational for pipeline mobilization for an Alaska natural gas pipeline beginning construction in 2015. The study estimates that the ACRL could be used to deliver over 1.1 million tons of pipe in 15,600 carloads to Fairbanks, Delta Junction, and Tok in the first two years of construction at a cost of $32.8 million. The rail link would be less useful for mobilizing pipe for the Canadian segments of the pipeline since trucking would be required to deliver pipe to Beaver Creek and Haines Junction if a Northern alignment is chosen. They estimate total 1.6 million tons of pipe could be shipped by rail to Canadian destinations during the first two years of construction at a cost of $42.7 million. The Informetrica Limited study does not estimate cost savings from transportation via ACRL.
Don Dean (2006) evaluated the freight volumes associated with the construction of an Alaska Highway natural gas pipeline that could be diverted to rail. As part of his evaluation he provided cost estimates for delivery of pipe, fuel and equipment to parts of Alaska that would be serviced by the ACRL, as well as the cost of transportation using alternative modes transportation for pipe and fuel. Pipe is assumed to be 52-inch pipe in 80-foot lengths. Equipment includes pipeline and facility construction and services equipment, such as bulldozers, backhoes, trucks, trailers, compressors and welding rigs.
70 Information Insights, Inc.

ACRL SEA Socio-economic Impact Assessment - Alaska
Table 8: Alaska gas pipeline freight volumes, inbound
Commodity Alaska (Tons)
Total Project (Tons)
Pipe 1,429,263 3,285,435 Equipment 106,920 216,590 Fuel 223,520 465,410 Total 1,759,703 3,967,435
Source: Dean, 2006
Dean estimates that 1.1 million tons of pipe, equipment and fuel could be transported via ACRL in 14,800 carloads to Fairbanks, Delta Junction and Tok over a two-year period. The total cost (or revenue for the ACRL) for these shipments is over $28.3 million. Of the total freight volume that could be moved by rail, 921,500 tons or 82 percent is pipe. An additional 637,400 tons destined for Alaska would go to Prudhoe Bay and Dietrich. Depending on port of origin this freight would most likely be transported directly by ship (from Asia) or barge (from U.S. West Coast) to Prudhoe Bay. Freight destined for Dietrich would be trucked from Prudhoe Bay.
Dean estimates that 1.5 million tons of pipe, equipment and fuel (20,300 carloads) destined for Yukon Territory and BC segments of the pipeline could be transported via the ACRL, for revenues of nearly $40 million.
Table 9: Potential traffic flows and revenues from Alaska gas pipeline
Commodity Alaska (Tons)
ACRL Revenue(U.S. dollars)
Yukon/BC (Tons)
ACRL Revenue(U.S. dollars)
Pipe 921,100 $19,572,880 1,310,000 $34,834,680Equipment 58,100 4,477,600 60,900 2,890,920Fuel 142,700 4,265,200 161,400 2,086,410Total 1,121,900 $28,315,680 1,532,300 $39,812,010
Source: Dean, 2006
Thus the total pipeline freight traffic for all segments would be nearly 2.7 million tons (35,100 carloads), according to Dean, with ACRL revenues of over $68 million. Dean’s estimates for both tonnage and revenues come quite close to numbers from Informetrica Limited, though Dean’s estimates are for pipe, equipment and fuel, while Informetrica looked at pipe alone. Both reports used current cost data in their analyses, but neither explicitly estimated cost savings to the pipeline project from lower transportation costs with an ACRL.
HDR Engineering, Inc. (2006) studied the feasibility of upgrading the Port of Skagway and the White Pass & Yukon Route Railroad (WP&YR) infrastructure as part of the larger ACRL project. In its estimates, HDR assumes that all of the 725 miles of pipe (about 1.4 million tons) required for construction of Yukon Territory segments of the Alaska gas pipeline would come through the Port of Skagway and be transported by rail to Whitehorse for sorting, double jointing and conditioning, if port and rail facilities are upgraded in time. According to HDR, this assumption is likely to prove accurate if pipe is imported from Asian markets, but
Information Insights, Inc. 71

ACRL SEA Socio-economic Impact Assessment - Alaska
should be reduced to approximately 600 miles if pipe comes from U.S. and Canadian sources.
6.5 Alaska North Slope oil and gas operations As part of the ACRL Phase I feasibility study, Lockheed Martin Space Operations (LMSO) prepared a Market Analysis of Supply and Demand for Current and Future North Slope Oil and Gas Activity (2006a). Their report assesses the rail transport market for oil and gas field supplies and equipment from the contiguous states and southern Canada to the North Slope of Alaska. The researchers consider ACRL impact on North Slope oil and gas activity as it currently exists and in a future scenario.
The Lockheed Martin team found that if oil and gas activity on the North Slope were to continue at the present level, a portion of the materials and equipment presently shipped to the North Slope via a combination of rail, barge and truck could be transported via the proposed ACRL. Current shipments of chemicals and tubular used by North Slope producers could be shipped directly from places of origin, decreasing the cost and inconvenience of shipping commodities by way of multiple transportation modes. LMSO research concluded that commodities originating from central and eastern regions of Canada and the United States would travel via ACRL, necessitating only one mode transfer from rail to truck in Fairbanks, Alaska, en route to Prudhoe Bay.
The LMSO report acknowledges certain research limitations, including data inconsistencies, lack of availability and non-current condition of some data. Most data provided limited time-series information.
In addition to impacting transport of materials, availability of ACRL would have some impact on future North Slope oil and gas development by providing more economical transportation of chemicals and tubular metals to the North Slope. ACRL could provide crucial transportation improvements being sought by major North Slope producers.The first area of expected North Slope development analyzed in the LMSO report, impact of ACRL on an Alaska natural gas pipeline, was discussed earlier in this report. The Lockheed team included two additional areas of expected development in their analysis of impacts on future ANS development:
6.5.1 Arctic National Wildlife Refuge (ANWR) and National Petroleum Reserve–Alaska (NPR-A)
Lockheed’s report explores the likelihood that development in ANWR and NPR-A will overcome decades-long political delays and reach production. The report states, “Once a gasline is actually sanctioned and development moves closer to Pt. Thomson, political pressure may very well increase to open ANWR’s 1002 area for development.”
NPR-A could have several fields in production by 2011. However, LMSO’s report cautions that “further western development would require both an oil transmission pipeline and production facility, plus a gas transmission line to the Prudhoe Bay area.” For NPR-A as well as ANWR, logistics will drive many development decisions; LMSO research indicates these fields sit “beyond what is considered to be practical for winter resupply via ice roads.”
72 Information Insights, Inc.
ACRL SEA Socio-economic Impact Assessment - Alaska
Recent trends favoring low-impact development argue against construction of permanent gravel roads. This may mean extensive use of barging rather than construction of permanent roads into this area, according to LMSO – creating some risk that development in ANWR and NPR-A would create less rail traffic than predictive models indicate.
6.5.2 Exploration/drilling for heavy oil Heavy oil formations overlie the Prudhoe and Kuparuk production areas. Recent research funded by the U.S. Department of Energy may finally provide the technology needed to move this type of undeveloped resource toward recovery, according to IHS, Inc. in a 2005 report. The projected 36 billion barrels of oil in the Ugnu, West Sak and Schrader Bluff areas could exceed the total from Prudhoe and Kuparuk oilfields.
The LMSO report indicates heavy oil development would increase drilling activity, but cautions that the technology necessary for heavy oil “has not developed as quickly as once anticipated and the West Sak and Ugnu prospects have often been deferred in the forecast.”
6.6 Military defense and emergency management benefit In another Phase I study, that of potential emergency management and military defense benefits to Alaska from ACRL, Lockheed Martin Space Operations (LMSO) analyzed risks Alaska communities face due to the current lack of alternative transportation routes (2006b). All communities in the state rely heavily on delivery of resources from other communities in Alaska, and more importantly, from the other states. A major natural disaster or breech of security could shut down the major transportation arteries connecting Alaska to the rest of the world. LMSO identified three types of critical transport flows: commodities (e.g. food, electricity), materials (e.g. industrial supplies, construction equipment), and communication (e.g. equipment monitoring, project coordination).
The authors explored potential risks to these routes by transportation node and transportation link. Transportation nodes are “the intersection points between multiple transportation routes and modes.” Five such nodes are identified in Alaska: Southcentral ports, Southeast ports, Anchorage intermodal facilities, Fairbanks intermodal facilities, and Tok-Glennallen-Delta Junction communities.
The report outlines each transportation node’s primary transport/purpose, principal risks, and railroad mitigation of such risks. Three major categories of principal risks:
Environmental/natural risks – such as seismic activity or inclement weather
Economic factors – resource costs, transportation reliability
Security – emergency response communication, military mobilization times
Transportation links are defined as “single mode routes that connect communities and nodes to each other.” Four transportation links are identified: Alcan Highway System, North/South Rail Line – Parks Highway, fiber optic connections, and the Trans-Alaska Pipeline System. As with each transportation node, the report outlines primary transport/purpose, principal risks, and rail mitigation to risks. Natural and environmental factors make up the principal risks common to all transportation links – these include earthquakes, forest fires, floods, and geographic isolation, any of which could cause significant disruption to one of these critical
Information Insights, Inc. 73

ACRL SEA Socio-economic Impact Assessment - Alaska
links. Damage to one link could produce a domino effect, compromising other links, and risking the health and safety of Alaskan communities.
Development of a rail link between Alaska and Canada would mitigate these risks by providing an alternative route for the transport of commodities, materials and communication, especially those that presently pass through the stressed Anchorage infrastructure. The ACRL would facilitate emergency response and military defense efforts by providing an alternative route for moving people, materials and equipment during a natural disaster or other emergency situation. ACRL communication system requirements could improve the state’s emergency response capacity by providing additional, redundant communication links for communities along the rail corridor.
6.7 Other direct impacts Informetrica Limited (2006) expects impacts from an ACRL to be light on other industries such as forestry and tourism. Forestry is a highly competitive industry and the authors do not believe the lower transportation costs afforded by rail would be enough to develop a competitive forest industry. It could play a role in supplying regional demand for lumber, however.
No studies have been done to estimate ACRL revenues from tourism. Informetrica Limited reports that tourist transportation in Alaska is provided by air (52 percent), private cars (4 percent), buses (1 percent), ferries (1 percent), and cruise ships (42 percent). A rail link to Canada could provide competition to all these modes of transport but is expected to draw the most tourists from those currently traveling by air and highway.
In its analysis of Port of Skagway and southern Yukon rail expansion options, HDR Engineering, Inc. (2006) contends that well-conceived development plans would have enhance Skagway’s tourist facilities and provide positive ripple effects throughout its tourism-based economy. According to HDR, summer tourist excursion operations will be more efficient once cruise ship business is linked to a modern passenger rail operation. In addition, the three-rail track recommended for WP&YR could be sufficiently different from other railways to become a tourist attraction in itself.
6.8 Previous impact studies Impact assessments conducted for previous projects to link the Alaska and Canadian rail systems have invested little in studying economic effects, at least on the Alaska side of the border. We looked at studies conducted in 1977 and 1983, in response to proposed projects for extending the Alaska railroad to Canada along the Alaska Highway corridor.
6.8.1 1983 Environmental Assessment by Alaska DOT&PF This 1983 report by the Alaska Department of Transportation and Public Facilities (DOT&PF) Northern Region was completed for a previous effort to extend the Alaska railroad from Eielson to the Canadian border. The report was commissioned by the Alaska legislature. Focused on environmental assessment, it provided decision makers with little useful guidance on social or economic impact issues. The report makes some general observations, but offers no quantitative or in-depth qualitative analysis of impacts:
74 Information Insights, Inc.

ACRL SEA Socio-economic Impact Assessment - Alaska
Beneficial impacts would occur as a result of construction employment. Several hundred persons could be employed during construction activities. Communities near the project would benefit from construction wages spent there. Likewise, an economic benefit to local shippers with siding access would result from the rate competition a rail facility would effect with nonrail carriers. As a regional benefit, general economic growth could result from railroad generated resource development. On the other hand, adverse project impacts would occur. A significant amount of State monies would be expended to construct the railroad extension. During construction, limited highway traffic disruption would occur where the railroad alignment crosses or closely parallels public roads. Also, local community services could be burdened by the influx of project construction workers (Alaska Department of Transportation and Public Facilities, 1983, p. 63).
6.8.2 1977 Preliminary feasibility study by Alaska DCED This study by the Alaska Department of Commerce and Economic Development was funded by the Alaska Legislature in response to a 1976 conference that concluded that: (1) Alaska was far behind the Yukon Territory and Northern Canada in researching a potential rail route; and (2) the concept of a rail connection between Alaska and Canada looked promising and should be pursued. The scope of the study was limited to currently existing data and did not include a cost-benefit or impact analysis. The 64-page study devoted less than one paragraph to potential social and economic impacts of a rail extension:
However, it is reasonable to assume that the benefits in the form of new jobs and businesses, lower costs for consumer and durable goods, increased revenue for government et al, might far exceed the cost for a through rail connection. The governments and people of Alaska, Canada and the Northern states of the “Lower 48” would be receiving most of these benefits (Walt, 1977, p.4).
6.8.3 Economic impact of the gas pipeline on corridor communities Information Insights conducted a 2004 study for the Alaska Department of Revenue Municipal Advisory Group of the anticipated impacts on local governments of the Alaska Highway gas pipeline project proposed by major North Slope oil producers.
The study estimated the socio-economic impacts of gas pipeline construction and operations on economically and revenue-impacted municipal and village governments, including those state government costs that would need to be covered by local governments in the absence of new state spending.
The study estimated Alaska population and workforce increases, and the resulting impacts on municipal services anticipated during construction and operation.
In general, the study reported impacts to local governments as statewide aggregates due to constraints posed by confidential industry data. For this reason, expected impacts to the communities in the ACRL corridor cannot be easily isolated. However, statewide estimates may be useful in further refining Alaska resupply requirements, and subsequent possible freight movement via the railway extension.
Information Insights, Inc. 75

ACRL SEA Socio-economic Impact Assessment - Alaska
In considering the following list of specific impacts identified in the Information Insights study, it is important to remember that, in terms of capital expenditure, the Alaska portion of the gas pipeline project ($7.7 billion) is seven times larger than the Alaska portion of the of the ACRL, which has been estimated at $1.1 billion (Informetrica Limited, 2006) not including possible Skagway port upgrades. In terms of mileage, an Alaska Highway gas pipeline project covers three and a half times more distance within the state than the rail project.
The gas pipeline study estimated the total economic impacts to local governments during planning and construction of an Alaska natural gas pipeline at approximately $120 million, which would be offset by eventual increases in oil and gas property taxes or by payments in lieu of taxes (PILT) under a Stranded Gas Development Act contract.
An average of 9,300 construction jobs per year during the construction period. A total population increase of 9,400 to 10,400 during pipeline construction, with $38.1
million in population-induced costs to municipalities. $19.1 million in infrastructure costs to municipalities and villages during construction. $25.9 million in municipal law enforcement and emergency services impacts, including
$5.8 million in new state trooper coverage. $4.9 million in municipal health and human services impacts during construction, with
additional impacts in the post-construction period. $3.4 million in local support for K-12 education during construction, and an increase of
$15.1 million in the public school foundation formula due to the increase in students. $11.2 million increase in municipal operations costs during construction. The study recommended $11.5 million in new state spending for planning, monitoring
and evaluating subsistence impacts, and mitigation of certain impacts during construction. The authors also recommended an endowment approach to ongoing subsistence monitoring at a cost of $5 million.
The study also highlighted the then-estimated $300 million in highway and port improvements that would be required to build the line. Subsequent work by the Alaska DOT/PF indicates those improvements will now cost $400 million prior to construction, and that wear and tear on Alaska’s highways during construction will cost an additional $800 million. Significant portions of these costs may be avoided if the heavy pipe can be transported by rail, rather than truck, transportation.
76 Information Insights, Inc.

ACRL SEA Socio-economic Impact Assessment - Alaska
7 Reference Case: Alaska economy without ACRL
7.1 Demographic and workforce trends The primary sources for Alaska demographic and workforce trends are the Alaska Department of Labor and Workforce Development and the State Demographer. According to their projections, Alaska will experience moderate population growth over the next twenty years while average annual growth will decrease. Most of the growth in population will be due to natural increase rather than migration. Starting in 2012 net migration is expected to have a negative effect on population, although migration trends can change direction quickly in a place like Alaska where boom and bust cycles can cause the health of the state’s economy to vary in relation to other states (Williams, 2005).
The population of Alaska in 2004 was estimated to be 655,435 with an average annual growth rate of 1.09 percent. This population is projected to grow to 713,393 by 2012 with average annual growth rate of 0.99 percent. The low and high population projections for 2012 are 676,684 and 753,297 respectively. (The low and high projections reflect the range in which there is a 95 percent confidence level that the actual population total will fall between these two numbers.) By 2029, the middle population projection is 801,904 with an average annual population growth rate of 0.39 percent. The low and high projections for 2029 are 730,231 and 888,604 respectively.
From 2005 to 2029, the median age of an Alaskan is projected to rise from 33.4 to 35.8 years of age (Williams, 2005). This aging of the population, coupled with expected high out-migration, will create employment opportunities for the 10,000 young Alaskans who enter the working age population each year (Hadland & Cannon, 2004).
The number of jobs in Alaska is expected to increase from 292,200 in 2002 to 335,500 by 2012 for a net gain of 43,000 (Hadland & Cannon, 2004). This forecast assumes construction of an Alaska gas pipeline will start in 2012 which means a large portion of the estimated growth in jobs occurs at the end of the forecast period. All new jobs are predicted to be in the private sector with a slight decline in public sector jobs. Overall job growth is estimated to be 14.8 percent, averaging 4,000 new jobs per year with significant differences across industries.
The biggest gains will be in the health care and social assistance industry with 9,700 new jobs and the trade industry with 10,100 new jobs (Hadland & Cannon, 2004). Other growth industries will be the transportation and warehousing industry (5,800 jobs, 30.7 percent growth), mining – spurred on by recent high mineral prices (2,100 jobs, 19.4 percent growth), and construction (2,500 jobs,15.7 percent growth). Direct and indirect pipeline employment is predicted to create an average of 4,000-5,000 jobs in 2012, the majority of which will be in the mining and construction industries.
7.2 Alaska Railroad operations The Institute of Social and Economic Research (ISER) conducted a study of the economic impact of the Alaska Railroad (ARR) on the state economy, which has been summarized in its Research Summary No. 63 (2005). With $108 million in annual spending, the Alaska
Information Insights, Inc. 77

ACRL SEA Socio-economic Impact Assessment - Alaska
Railroad supports nearly 1,900 jobs and $83 million in labor income in the Alaska economy, based on spending data from 2000 to 2003. Forty-two percent of the jobs and 53 percent of the payroll generated by railroad spending go to railroad employees; the remaining 58 percent of jobs and 47 percent of labor income supported by ARR activity go employees of other Alaska businesses.
In addition to the effects of ARR spending, ISER noted less easily quantifiable impacts of the ARR on the economy. The railroad promotes or even makes possible some economic developments in Alaska by providing cheaper, more efficient transportation for heavy, bulk commodities like gravel and coal. The railroad helps the state’s tourism industry by providing alternative options for tourists and ways to see areas not accessible by road.
If railroad spending were to increase in Alaska, it would support additional jobs and income. An additional $1 million in spending on operations would generate $630,000 in labor income, and 14 new jobs. Each additional $1 million in capital spending would generate $540,000 in payroll and 13 new jobs. The economic effects of increased railroad spending would vary depending on the mix of spending between operations and capital projects. Operations require relatively more railroad employees, with many of the non-railroad jobs occurring in health care and retail trade. Railroad capital projects, on the other hand, create more non-railroad jobs, including about a third in the construction industry and nearly a fifth in business services.
In recent years, about 40 percent of in-state spending by the railroad has been on capital projects, which are paid for almost entirely with federal grants and retained earnings. Both sources of funding can vary a lot from year to year. The level of retained earnings depends on the profitability of ARR operations and real estate holdings.
7.3 Mining industry Globally the mining industry is expanding rapidly in response to explosive demand for mineral commodities in developing countries, according to the Alaska Minerals Commission (2005). In 2005, Alaska set a record of $1.81 billion for the amount of exploration and development spending and the value of mineral production in the state – up from $1.62 billion in 2004. State geologist David Szumigala predicts that overall value of the Alaska’s mineral industry will remain in the $1.7 billion and $1.85 billion range, while other mining analysts believe it could top $2 billion per year with start up of the Pogo gold mine (Liles, 2006).
The Alaska mining industry produces zinc, lead, gold, silver and coal, as well as sand, gravel and rock. There are 73 open-pit, underground, mechanical placer, and suction dredge mines in Alaska, in addition to at least 37 rock quarries and 71 active sand and gravel operations. Zinc accounted for almost half of the total mineral production value in the state, and gold ranked second, at 14 percent. All metals combined accounted for 80 percent of the total $1.3 billion in mineral production value in 2004. Overall, $505 million worth of minerals were exported to Canada, Europe, and Asia in 2004 (McDowell Group, 2006).
Investment in mining exploration and development has been fueled in recent years by high metals prices. Exploration activities increased by 40 percent from 2004 to 2005, and mine
78 Information Insights, Inc.

ACRL SEA Socio-economic Impact Assessment - Alaska
development investment grew 60 percent over the same year, due largely to construction of the Pogo and Kensington mines. (Liles, 2006).
According to Robinson, Fried, Gilbertsen, Windisch-Cole (2006b), there is no sign of a slowdown in the near term. The Kensington gold mine, near Juneau, could employ 225 workers for 10 to 15 years. The Pogo mine, northeast of Delta Junction, expected to employ 240 jobs for at least 10 years (McDowell Group, 2006). This growth in metal mining will be partially offset by the closure of Fort Knox, Alaska’s largest gold mine, whose current mine life is estimated at eight years. Development of the Chuitna coal reserves being explored on the west side of Cook Inlet, would add 300 to 350 jobs to Alaska’s coal mining industry.
The Pebble project in Southwest Alaska seeks to develop North America’s largest known gold deposit and second-largest copper deposit, in addition to deposits of silver and molybdenum. Developing the resource could require a capital investment of $2 billion or more and a construction labor force of 2,000. Once operational, the mine could support a permanent workforce of 1,000 for up to 40 years (McDowell Group, 2006).
Other mining developments currently under exploration are Donlin Creek in Southwest Alaska, Rock Creek near Nome, and Nixon Fork near McGrath, and (Hadland and Cannon, 2004).
The state’s existing mining operations contribute significantly to the local and regional economies of their host communities and are steady providers of high-paying, year-round jobs, according to a recent McDowell Group report (2006) on the Alaska mining industry, prepared with 2004 data.
According to the report, the mining industry created 2,900 direct jobs in 2004, with $194 million in payroll. Including indirect and induced jobs, the total employment impact was 5,100 jobs and $280 million in annual payroll. The mining industry’s average wage was 83 percent higher than the statewide average of $38,616. Local spending from Alaska’s three largest working metal mines totaled $170 million for the year.
Mining industry companies are very significant taxpayers in their respective boroughs and in the state. For example, Red Dog paid $6.2 million to the Northwest Arctic Borough in payments in lieu of taxes, a figure which represents 75% of the Northwest Arctic Borough’s General Fund receipts. Fort Knox mine is the Fairbanks North Star Borough’s second largest employer, with an average employment of 411. The mine paid $3.5 million in property taxes to the borough in 2004.
The mining industry also pays a significant amount of rent, royalties, taxes and fees to the State of Alaska, amounting to $15.8 million in 2004. These fees are expected to increase with the increasing price of minerals.
7.4 Alaska Highway gas pipeline project Three of Alaska’s major oil producers – BP Exploration, ConocoPhillips, and ExxonMobil –have proposed a project to bring Alaska North Slope natural gas to North American markets. The project proposed by the producers, and subject to a pending agreement with the State of Alaska, would include construction of a large-diameter pipeline that would parallel the Trans-Alaska oil pipeline from Prudhoe Bay to Delta Junction, Alaska, and then follow the Alaska Highway corridor from Delta Junction to Alberta, Canada. From Alberta, Alaska
Information Insights, Inc. 79

ACRL SEA Socio-economic Impact Assessment - Alaska
natural gas would either flow through the existing network of pipelines or a new pipeline would be built to Chicago, Illinois. Known recoverable natural gas reserves on the North Slope are estimated at 35 trillion cubic feet (tcf). Project proponents count on an additional 18 tcf of natural gas being discovered over time to keep the pipeline operating at capacity over a 35-year life.
In addition to construction of a 2,140-mile pipeline from Prudhoe Bay to Alberta, other project components include a gas treatment plant (GTP) on the North Slope, a network of feeder lines from the gas fields to the GTP, compressor stations at intervals along the main pipeline to maintain pressure, and potentially a new 1,500-mile pipeline from Alberta to Chicago. The total project cost to Alberta is estimated at $21 billion (2005 dollars). Cost for the Alaska segment of the main pipeline is $5.1 billion, and the GTP is estimated to cost $2.6 billion (Alaska Department of Revenue, 2006).
Information Insights, Inc. (2006a) estimates that the producers’ project would generate an average of 11,000 direct jobs and 7,000 indirect and induced jobs per year during construction. The annual employment impact during the 35-year operating life of the pipeline averages 500 jobs from direct operations, plus 1,400 indirect and induced jobs, and an additional 22,000 jobs per year generated by state and local spending of gas revenues. The total employment impact is over one million jobs-years over the 45-year period of construction and operations (where one job-year equals a full- or part-time position for the course of one year).
State revenues from oil and gas taxes and royalties and from the state’s 20 percent ownership interest in the pipeline is projected to total $28 billion on a net present value basis (assuming a five percent discount rate for future revenues). The present value of all future local revenues from the project is estimated at $1.9 billion.
Industry spending on the pipeline in Alaska after construction is estimated at $400 million per year, a figure that is dwarfed by projected state and local government spending of project-related revenues, estimated at $1.6 billion per year (assuming the state deposits 25 percent of new oil and gas revenues in the Alaska Permanent Fund and spends the rest). Cumulative Permanent Fund earnings of project-related deposits are estimated at $30.7 billion over the life of the project.
7.5 Alaska North Slope oil and gas industry The oil and gas industry will continue to be responsible for providing 75 percent of the state’s General Fund revenue through FY2009 (Alaska Department of Revenue, 2006).
Employment in the oil and gas industry Total oil and gas industry employment, which includes the mining sector, is expected to grow 19.4 percent for the 10-year period ending in 2012 (Hadland and Cannon, 2004). Oil and gas employment averaged 8,700 jobs in 2005, an increase of 500 over the previous year. Several consecutive years of high prices have stimulated both exploration and development, and employment levels have nearly bounced back after a steep decline in 2003 due to unusually low prices. BP recently announced plans to hire 250 additional workers. ConocoPhillips is involved in several large projects, continuing development fields around Alpine as well as its West Sak heavy oil project (Robinson et al., 2006a).
80 Information Insights, Inc.

ACRL SEA Socio-economic Impact Assessment - Alaska
Construction spending by the oil and gas industry is expected to grow 19 percent in 2006. Total wells are forecast to increase from 243 to 257 and total well footage from 1.58 million to 1.67 million feet. Additionally, Shell Oil has returned to Alaska, purchasing offshore leases with the stated intention to begin drilling in 2007, and interest from smaller producers is growing. Overall, employment in the oil and gas industry is expected to grow by 300 in 2006 and an additional 200 in 2007 (Robinson et al., 2006b).
Oil and gas production and revenue forecast Two elements are critical to the oil revenue forecast: price and volume. All of Alaska’s oil production is delivered to refineries on the U.S. West Coast (including Alaska and Hawaii). Consequently, Alaska’s royalty and production tax revenue depends in large part on the average market price of ANS crude oil at U.S. West Coast refining centers. In FY 2005, Alaska North Slope output was 917,000 bbls/day compared to a peak of 2,006,000 barrels a day in FY 1988. While production has declined by 54.3 percent since the 1988 peak, the market price of oil per barrel has almost tripled. Although production continues to decline, near-term forecasts of oil prices remain high.
As a base case, the forecast for Alaska North Slope (ANS) production is to average slightly above 800,000 barrels per day for FY 2007 through FY 2011, according to Michael Williams, the Department of Revenue’s chief economist (2006). Oil production in Alaska is forecast to decline at a rate of about six percent in FY 2006 and about 1.5 percent per year thereafter. The base case anticipates gas pipeline construction beginning in 2011 or 2012, with the first gas flowing in 2016.
Production could increase beyond that projected in the base case under a number of scenarios:
The technology to deal with viscous oil develops more quickly than it has been. ANWR/NPR-A or Foothills development occurs. According to Williams, once a gas
pipeline contract is signed and development moves closer to Pt. Thomson, political pressure may increase to open ANWR’s 1002 area for development. The NPR-A is currently forecast to see some production by 2011. Further development to the west would require major new infrastructure development. The Foothills area currently has no development and is distant from both pipelines and production facilities. The presence of a gas pipeline may bring further exploration into the Foothills, but that may not occur for another decade.
Offshore exploration and development are increased. This is strongly opposed by residents of the North Slope Borough and is also very expensive and distant from infrastructure.
However, each of these variations is highly capital intensive and will be driven by a combination of the long-term fiscal regime, current oil and gas prices and the availability of steel and other resources.
Information Insights, Inc. 81

ACRL SEA Socio-economic Impact Assessment - Alaska
Figure 4: North Slope oil production forecast
Source: Alaska Department of Revenue, March 2006
82 Information Insights, Inc.

ACRL SEA Socio-economic Impact Assessment - Alaska
8 Economic Impact of the ACRL The impact analyses presented in this section are based on work completed as part of the ACRL Phase I feasibility study.9
8.1 Impacts of ACRL construction and operations Using ACRL budget projections provided by Informetrica Limited (2006) and the workforce model from Innovative Scheduling (2006), we modeled statewide economic impacts of the construction and operations of Alaska segments of the ACRL using impact analysis software from the Minnesota IMPLAN Group, Inc. A quantitative analysis of sub-regional impacts has not been performed at this point because the data is too coarse and the magnitude of the impacts is judged to be too small to provide an accurate or meaningful prediction of the impact on local economies.
Our analysis uses baseline data for the Alaska economy from 2003. This may introduce some inaccuracy in predicting the impacts of project that will not be built until 2010 or later.
8.1.1 Construction spending impacts Informetrica Limited estimates the capital costs for building U.S. segments of the ACRL will total nearly $1.1 billion, which is roughly ten percent of total construction costs for the full rail route. The route used in this analysis is from Delta Junction to Ladue border to Carmacks to Whitehorse to Watson Lake to Hazelton.
Table 10: Construction costs of Alaska segments
Capital Expenditures AK Segments (US$ millions)
Full Route (US$ millions)
Percent of Total Cost*
ACRL Mainline (Delta Junction, AK - Ladue Border - Carmacks, YT - Watson Lake, YT - Hazelton, BC)
$1,047 $10,315 10.2%
Skagway Spur (Carmacks, YT - Whitehorse, YT - Skagway, AK) $42 $635 6.6%
Total Capital Cost $1,089 $10,950 9.9% Source: Informetrica Limited (2006); *Calculated
Using $1,089,000,000 in capital spending as an input, we calculate that ACRL construction will provide over 9,000 jobs in Alaska with wages and benefits exceeding $500 million. Jobs are expressed as a total of full-time and part-time jobs lasting one year. Thus a total of 9,000 jobs would represent an average of 4,500 if construction were spread over two years, or 3,000 if construction were spread over three years. We assume construction in Alaska will last three years.
Almost any economic activity in a given jurisdiction will generate more economic activity, so the total effect of ACRL construction on the Alaska economy will be greater than that 9 Our analyses necessarily share any limitations of the earlier studies on which they are based. Where limitations are known, these have been noted in the text.
Information Insights, Inc. 83

ACRL SEA Socio-economic Impact Assessment - Alaska
represented by the direct impacts alone. An economic impact analysis traces spending through an economy and measures the cumulative impact of that spending, including direct and secondary (indirect and induced) effects of the project.
Direct impacts include the initial economic activities (in this case construction jobs and spending) generated by the project. Indirect impacts include the activities of subcontractors and vendors that supply inputs to the project. Induced impacts comprise the ripple effect from the first two as wages are spent by households on goods and services, in turn generating additional rounds of economic activity. The relationship between the direct impact and the total impact is called a multiplier. Multipliers vary by region and economic sector.
Because there is no railroad construction in the IMPLAN data-sectoring scheme, we use the multiplier for highway, street, bridge, and tunnel construction in Alaska, which is 1.59. This means that for every dollar spent directly by the project, $1.59 in economic activity is generated. Subtracting the original dollar, we see that $0.59 in additional spending on goods and services (indirect and induced effects) occurs for each dollar of direct project spending. Construction activities typically have fairly low multipliers, because a large portion of the budget leaks outside the region for purchases of steel, other raw materials, and large equipment. Spending multipliers in other sectors of the Alaska economy typically range between 1.5 and 2.5.
The results of the IMPLAN analysis are summarized in the Table 11. The total impact on Alaska, including secondary impacts (indirect and induced), is nearly 15,000 jobs during the construction period, with a total labor income of $771 million. The total economic output generated by this spending will be just over $1.7 billion.
Table 11: Economic impacts of ACRL construction on Alaska
Type of Impact Direct Indirect Induced Total Impact
Economic Output (US$ millions) $1,089 $284 $359 $1,732
Employment 9,228 2,048 3,706 14,982
Labor Income (US$ millions) $557 $93 $121 $771
Source: IMPLAN Group data, 2003. Notes: A job equals one full- or part-time job for one year. Labor income includes employee wages and benefits and self-employed income. Impacts expected to be split over three years.
A project of this scale will create significant economic opportunities for residents of communities in the rail corridor. Direct construction jobs will include skilled and semi-skilled positions for diesel mechanics, welders, machine operators, and truck drivers. In addition, jobs in clearing, bridge and tunnel construction, earth moving, gravel mining, food service and hospitality will need to be filled. A lot of drivers will be needed for both direct indirect activities.
8.1.2 Construction employment impact Jobs from ACRL construction would help offset an anticipated downturn in construction employment in Alaska. The Alaska Department of Labor and Workforce is projecting construction employment to slow over the next five to ten years with the end of the
84 Information Insights, Inc.

ACRL SEA Socio-economic Impact Assessment - Alaska
residential housing boom and the expected decline in federal funding to Alaska. We have already begun to see a significant dampening in the industry with average annual growth in construction jobs falling from 5.1 percent (2004-2005), to 3.8 percent (2005-2006), to 3.1 percent (2006-2007). Figure 5 shows what construction employment in Alaska could look like if a gas pipeline project and other government projects do not fill the gap created by the eventual bursting of the housing bubble and the decline in federal spending. The monthly employment figures are included to illustrate the extreme seasonality in construction employment in Alaska.
Figure 5: Construction employment in Alaska, 2000-2014
0
5,000
10,000
15,000
20,000
25,000
2000 2001 2002 2003 2004 2005 2006 2007 2008 2009 2010 2011 2012 2013 2014
Con
stru
ctio
n In
dust
ry J
obs
Monthly employment Monthly employment
Average annual employment Average annual employment
ProjectedActual
Sources: Actual data: Robinson, Fried, Gilbertsen, & Windisch-Cole (2006b), Hadland and Cannon (2004).
Preliminary ADOLWD forecasts for 2004-2014 assume construction on the gas pipeline will be at or near peak employment levels by 2014, and that pipeline construction and other government projects will keep the growth rate positive in the construction industry. ADOLWD assumes total construction employment in Alaska in 2014 will average 21,000, with annual job growth in the industry around two percent for 2004-2014. These are unpublished estimates by ADOLWD researchers and are subject to change (Yuancie Lee, personal correspondence, May 2006).
The following series of figures shows the impact of gas pipeline and ACRL construction in reversing the projected decline in construction employment. Figure 6a illustrates the preliminary forecast for the construction sector with peak pipeline employment of 4,200 jobs by 2014 (in these figures, a “job” is one full- or part-time job for one year). Figure 6b shows the additional impact of ACRL construction if it overlaps with pipeline construction. In this scenario, the ACRL could not be used to mobilize pipe; costs for both projects would be bid up; and the boom and eventual bust effect on the economy from these large construction projects would be accentuated. Figure 6c shows how early construction of the ACRL in time
Information Insights, Inc. 85

ACRL SEA Socio-economic Impact Assessment - Alaska
to mobilize pipe for the gas line would nearly eliminate the projected decline in jobs and smooth and stretch out the pipeline boom. Achieving this synergy would require fast action on funding and permitting of at least key segments of the rail link.
Figure 6: Impact of gas pipeline and ACRL construction on jobs
0
5,000
10,000
15,000
20,000
25,000
2006 2008 2010 2012 2014
Con
stru
ctio
n In
dust
ry J
obs
Gas pipeline impact
Figure 6a: Without ACRL
0
5,000
10,000
15,000
20,000
25,000
2006 2008 2010 2012 2014
Con
stru
ctio
n In
dust
ry J
obs
Gas pipeline impact ACRL impact
Figure 6b: Overlapping timing
0
5,000
10,000
15,000
20,000
25,000
2006 2008 2010 2012 2014
Con
stru
ctio
n In
dust
ry J
obs
Gas pipeline impact ACRL impact
Figure 6c: Sequenced timing
86 Information Insights, Inc.

ACRL SEA Socio-economic Impact Assessment - Alaska
0
5,000
10,000
15,000
20,000
25,000
2006 2008 2010 2012 2014
Con
stru
ctio
n In
dust
ry J
obs
Gas pipeline impact ACRL impact
Figure 6d: Sequenced timing with Skagway upgrades in 2010
In this series, the purple line represents the additional impact of ACRL jobs on construction employment – not total ACRL jobs. We assume 3,000 direct construction jobs per year for three years to build the Alaska segment of the ACRL mainline. Note that that only the first two years of pipeline construction are shown. Construction would continue for two more years at near peak levels. (Construction employment is shown through 2014 because this is the last year for which labor projections are available.) The bust following pipeline construction is also not shown. The post-construction decline in employment would be most severe in the scenario represented by Figure 6b, with both railroad and gas pipeline construction jobs ending within a two-year period.
If port and rail upgrades in Skagway were completed before construction starts on the ACRL mainline, construction employment in Alaska could look like the curve in Figure 6d. Early expansion of Skagway port and rail freight infrastructure would maximize the benefit of the ACRL for the gas pipeline project. Adding new jobs in the Skagway area in 2010 further extends the boom, which now looks more like a picture of steady growth.
8.1.3 Impacts of Skagway port and rail expansion The Port of Skagway would require major upgrades to handle rail cars, large ships and the loading and unloading equipment necessary for seaport operations. The port will be built up to export mining, fuel and forest products from Yukon Territory and British Columbia. The port will also need the ability to import fuel, 60-80 foot sections of pipe, concrete products, rail cars from barges, and other construction equipment. HDR Engineering, Inc. (2006) recommends an investment of $110 million to upgrade port facilities to meet these needs.
HDR also recommends an investment of $180 million to add a third rail to the existing narrow-gauge White Pass & Yukon Route Railroad, which would allow for standard gauge rail freight service from Skagway to Whitehorse. This project could probably be completed in one year. Combined, these port and rail projects would create a total employment impact of 2,500 new jobs in Alaska, including 1,448 direct jobs in construction.
Information Insights, Inc. 87

ACRL SEA Socio-economic Impact Assessment - Alaska
Table 12: Combined impact of Skagway area port and rail projects
Type of Impact Direct Indirect Induced Total Impact
Economic Output (US$ millions) $183.3 $51.2 $59.2 $293.7
Employment 1,448 432 612 2,492 Labor Income (US$ millions) $88.0 $19.3 $19.9 $127.1
Source: IMPLAN Group data, 2003. Note: A job equals one full- or part-time job for one year. Labor income includes employee wages and benefits and self-employed income.
8.1.4 Operations Impacts
Workforce requirements for ACRL operations In its analysis of workforce requirements for the ARCL, Innovative Scheduling projected employment numbers for three different routings, and for each route modeled four different cost scenarios (low, medium, high, other) and three different traffic scenarios (low, medium, high). Our analysis of operations impacts used the Minaret-Watson Lake-Carmacks-Ladue River-Delta Junction route projections with medium cost and traffic scenarios. While this may or may not be the ultimate alignment chosen, the Alaska segment costs should be relatively consistent regardless of the scenario for Canadian alignment chosen. Employment projections are based on averages for railroads of similar size, as well as calculations specific to the ACRL based on functions of terrain, traffic density, route, and cost scenarios.
Table 13: Workforce projections for ACRL operations
Year 1 Year 2 Year 3 Years 4-10
Maintenance of Way 112 112 112 112 Maintenance of Equipment 75 73 91 90 Transportation 254 254 298 282 General and Administrative 24 24 24 24 Total 465 463 525 508
Source: Innovative Scheduling (2006)
Innovative Scheduling calculated workforce requirements for the entire rail system and did not isolate the workforce needs for operating Alaska segments of the ACRL. To get a rough order of magnitude estimate of economic impacts of ACRL operation in Alaska, we assumed that ten percent of the total workforce requirements would be filled in Alaska based on the percentage of capital expenditures for the Alaska segments (although this may be a conservative assumption, as discussed below).
Assumptions on the U.S. percentage of ACRL employees Under various cost-traffic scenarios Innovative Scheduling estimates that two to three crews per train will be needed to operate the segment from Delta to the border. Each crew will consist of two persons. The number of trains per week on the Alaska segment of the mainline varies from 20 to 24 under different route-cost-traffic scenarios. In the Innovative Scheduling model, this segment of the ACRL will be the only segment to use U.S. crews. No U.S. crews
88 Information Insights, Inc.

ACRL SEA Socio-economic Impact Assessment - Alaska
are employed on the Whitehorse to Skagway spur (only 17 miles of which are in the U.S.) in the operations model.
The percentage of U.S. crews employed (of the total crews employed over the full route) varies by route, year, cost and traffic scenario, ranging from a low of five percent to a high of 20 percent in the Innovate Scheduling crew requirements model. On the Minaret-Watson Lake-Carmacks-Ladue River-Delta Junction routing under medium cost and traffic scenarios, the percent of U.S. crews for the first ten years of operation is as follows:
Table 14: Percent U.S. crews under one route-cost-traffic scenario
Year 1 Year 2 Year 3 Years 4-10
Percent U.S. Crews Minaret-Watson Lake-Carmacks-Ladue River-Delta J. Medium Cost – Medium Traffic
13% 13% 10% 11%
Source: Innovative Scheduling (2006)
Training for locomotive engineers and signal system technicians is typically one year of education plus one year of on-the-job training.
Transportation employees (including crews) are only one of four categories of employees in the operating workforce model. Others are maintenance of way (MOW), maintenance of equipment (MOE), and general and administrative (G&A). We do not know what percentage of the total ACRL workforce requirements U.S. employees will fill. We assume that the percentage employed for maintenance of way activities will be a function of track mileage per segment as well as terrain, with segments with more densely forested, mountainous or curvy terrain requiring more labor for track maintenance and ROW clearing than straight, level segments. Innovative Scheduling used terrain multipliers for each route alternative to calculated MOW workforce requirements. It gives the Delta to the border segment its lowest terrain MOW multiplier (1.0) and the Skagway to Whitehorse spur the highest multiplier (2.0), indicating a more difficult route requiring more workers to maintain. The Alaska segments of the route on which we based our impact modeling cover 13.9 percent of the total mileage for the full route.
We assume that some Alaskans will also be employed in general and administrative capacities in Fairbanks, Delta, the interim border terminal, or Skagway. At this point we do not know what percentage of G&A positions Alaskans may fill nor the U.S. percentage of MOE employees. Either could be higher or lower than ten percent depending on where along the route those functions are centralized. For this reason, we chose to use a lower U.S. percentage of total employment in the IMPLAN model (ten percent) than might be indicated by looking at either crew requirements (12 percent) or track mileage (14 percent), even though the bulk of ACRL operations employment will be in the MOE and transportation categories.
Information Insights, Inc. 89

ACRL SEA Socio-economic Impact Assessment - Alaska
Table 15: Alaska portion of total impact calculations
Alaska Segments Full Route Percent of Total*
Crew Requirements Varies Varies 5-20% Track Mileage Delta Junction- Ladue River-Carmacks-Watson Lake-Hazelton; Skagway spur
213 1,536 13.9%
ACRL Mainline 196 1,319 14.9% Skagway Spur 17 217 7.8%
Capital Expenditures (US$ millions) $1,089 $10,950 9.9%
Sources: Informetrica Limited (2006); Innovative Scheduling (2006); *Calculated
Economic analysis of Alaska operations impacts Using ten percent of total workforce requirements as inputs, we estimate that ACRL operations will contribute around 60 jobs (direct, indirect, and induced) to the Alaska economy, with an annual labor income near $3.1 million. The impact of ACRL operations on the Alaska economy is summarized below.
Table 16: Economic impacts of ACRL operations on Alaska
Type of Impact Year 1 Year 2 Year 3 Years 4-10
Employment
Direct 46 46 52 50
Indirect and Induced 10 10 11 11
Total 56 56 63 61 Labor Income (US$ thousands)
Direct $ 2,582 $ 2,582 $ 2,919 $ 2,807 Indirect and Induced $ 323 $ 323 $ 355 $ 355
Total $ 2,905 $ 2,905 $ 3,274 $ 3,162 Source: IMPLAN data, 2003; Labor income figures are based on analysis of Alaska Railroad data by the Institute of Social and Economic Research, 2005. Notes: A job equals one full- or part-time job for one year. Labor income includes employee wages and benefits and self-employed income.
8.1.5 Regional impacts from ACRL construction and operations While we do not have enough information at this point to accurately model how local and regional economies will be impacted by ACRL operations, we can make some general assumptions. Crew positions and MOW jobs are likely to be filled primarily by individuals from Fairbanks and the ACRL corridor communities, including villages in the Upper Tanana region. Although some of the $3.2 million annual output generated by the ACRL will reach other parts of the state, as the economic hub of Interior Alaska, Fairbanks will likely receive the lion’s share of the direct and indirect output. Employees living in the Interior will spend a
90 Information Insights, Inc.

ACRL SEA Socio-economic Impact Assessment - Alaska
portion of their paychecks on goods and services in Fairbanks. As these businesses make purchases and pay employees, more of the output will leak out of the Interior to Anchorage and Mat-Su and communities across the state.
The Innovative Scheduling model predicts no U.S. crews will be employed on trains operating on the Whitehorse to Skagway spur, although we can assume that some individuals from Southeast Alaska will fill MOW jobs on the Alaska segment of the spur and others may fill administrative positions, especially at the port. Skagway and Haines are likely to see a much greater economic impact from redevelopment and operations of expanded port facilities than from the operations of the spur line itself. However, due to the lack of available data, our impact analysis includes only construction impacts on the region. We recommend additional study of the potentially significant impacts on the region from increased inbound and outbound freight traffic and port activity.
Below is a table summarizing the expected construction and operations impacts from the ACRL mainline and from construction projects in Skagway by year. We assume that port and rail renovations needed for the spurline to Skagway could be completed in one year and that construction of Alaska segments of the mainline would take place over three years. No on-going impacts are included for freight operations at the Skagway harbor. The table assumes construction in the Skagway area would occur in 2010 and that mainline construction would begin the following year, in time for all sections to be available for mobilizing materials for the Alaska Highway gas pipeline, if pre-construction activities on that project begin in 2014.
Table 17: Summary of ACRL mainline and Skagway area impacts on Alaska
Type of Impact 2010
(Year 1)2011
(Year 2)2012
(Year 3)2013
(Year 4)2014
(Year 5)2015
(Year 6) 2016
(Year 7)
Year 8+
Direct Jobs 1,448 3,076 3,076 3,076 46 46 52 50
Indirect and Induced Jobs 1,044 1,918 1,918 1,918 10 10 11 11
Total Employment 2,492 4,994 4,994 4,994 56 56 63 61
Labor income (US$ millions) $127.1 $256.7 $256.7 $256.7 $ 2.91 $2.91 $3.27 $3.16
Total economic output (US$ millions) $293.7 $577.3 $577.3 $577.3 N/A N/A N/A N/A
Source: IMPLAN Group data, 2003. Notes: A job equals one full- or part-time job for one year. Labor income includes employee wages and benefits and self-employed income. No operations impacts are included for Skagway.
Information Insights, Inc. 91
ACRL SEA Socio-economic Impact Assessment - Alaska
8.2 Freight transportation savings There are several ways in which the ACRL could benefit Alaskans by providing competitively priced freight transportation service. The ACRL would:
Provide lower cost transportation for some existing freight traffic from Canada and the Lower 48, resulting in savings to Alaska business, government and consumers when traffic is diverted to rail.
Provide downward pressure on freight rates on competing modes of transportation, including trucking and container vessels and barges, resulting in savings even on freight that is not moved to rail.
Encourage new inbound freight flows to the state, bringing in products or raw materials not previously economic to transport to Alaska and stimulating economic growth and industrial development.
Provide Alaska industry with new sourcing options for inputs such as barite that can be produced in western Canada, saving money and lessening lead times on resupply.
Encourage new outbound freight flows to Canada and the eastern and Midwest U.S. by making Alaska commodities more competitive, further stimulating economic growth and industrial development.
The following section estimates the savings from existing inbound freight flows that could be competitively moved by the ACRL. The economic benefit resulting from new freight flows is more speculative in nature and less easy to quantify. The economic benefit to the military and the oil and gas industry from lower freight costs is discussed elsewhere in the report, as is the impact of competitive-priced transportation on mineral development in the rail corridor.
8.2.1 Community resupply Alaska currently imports about four million tons of freight annually for the purpose of community resupply using a variety of modes of transport – truck, container vessel or barge, roll-on/roll-off (RO/RO) barge, and rail barge.10 Although labeled community resupply this freight includes industrial materials such as chemicals, minerals, metals, and petroleum products, as well as general merchandise, construction materials, vehicles, foodstuffs and other consumer goods.
According to the logistics analysis by QGI Consulting, approximately two million tons of community resupply freight could be shipped competitively using the ACRL. The great majority of this “divertible” freight currently arrives in containers or trailers on container vessels and barges. The remainder arrives by truck on the Alaska Highway or by rail barge from Canada. QGI Consulting (2006a, 2006b, 2006c) compiled and analyzed freight traffic and rate data for the years 2000-2003. We assume these years are representative of the annual flow of community resupply freight into Alaska.
We estimate that the ACRL could save Alaska business, government and consumers between $40 million and $176 million on existing freight transportation costs. This represents an 10 Included in this amount are 1.5 million tons of petroleum products and over 100,000 tons of bulk cement) entering the Port of Anchorage. Not enough information on cost and origin were known to include these freight flows in the ACRL logistics analysis. Most of the petroleum products actually originate in Alaska according to Port of Anchorage officials.
92 Information Insights, Inc.

ACRL SEA Socio-economic Impact Assessment - Alaska
average savings of $107 million or 25.4 percent of the $422 million in inbound freight costs for the years analyzed. The wide range in savings comes primarily from the use of two different methods of estimating future intermodal freight rates on the ACRL. Community resupply savings are summarized in the tables on pages 96 and 97.
The QGI Consulting estimates make several key assumptions that may overestimate the competitiveness of the ACRL. Shipping rates and revenues were based on other railroads that likely have a higher traffic density than the ACRL. The ACRL will probably have less directional balance than other railroads (more freight cars returning empty), which may increase northbound freight rates. Capital and operating costs of the proposed rail link are unknown at this time. Resupply savings could be lower or higher if actual rates for ACRL freight service differ substantially from estimated rates.
It is not known how the addition of the ACRL will affect the rates of other modes of transportation. Existing pricing structures likely reflect captive market positioning providing some ability to reduce rates to meet direct competition presented by rail (QGI Consulting, 2006b). The downward pressure on rates across all transportation modes will result in additional savings for Alaska households and businesses from community resupply.
The diversion of marine freight (other than U.S. rail-barge service) to the ACRL accounts for over 70 percent of the estimated Alaska savings on community resupply. QGI Consulting estimates that nearly 100 percent of freight currently shipped from Seattle and Tacoma to Alaska ports would be diverted to the ACRL. This assumption may overstate the potential savings from containerized cargo and RO/RO barge freight. We believe that while freight originating outside the region will be likely to divert to ACRL, freight originating closer to Seattle/Tacoma may continue to use established marine freight services, especially if these services reduce their rates to remain competitive. The QGI analysis assumes that the majority of marine freight originates within the region and that it is still cost competitive to shift that freight to rail. However, no public data is available at this time that identifies the true origin of containerized cargo and trailers shipped from the Pacific Northwest to Alaska.
The amount of marine freight that is diverted to direct rail service will also depend on how construction of the ACRL changes the pricing strategies of competing services. In particular, it is not known how railways involved in inland rail service associated with both rail-barge and container shipments to Alaska will respond if forced to compete with themselves. They may seek financially neutral positions in the pricing of their direct rail service so as not to lose existing market positions in rail-barge and container traffic (QGI Consulting, 2006b).
Container and RO/RO vessels and barges Ninety percent of community resupply freight enters Alaska by marine transport services from the ports of Seattle and Tacoma, either by rail barge or container and RO/RO vessels and barges. About 1.6 million tons of general merchandise cargo enters Alaska annually on container and RO/RO vessels and barges through the port of Anchorage (QGI Consulting, 2006a). Using an average cost per ton from three marine transportation providers (Totem Ocean Trailer Express, Horizon Lines, Alaska Marine Lines), the cost of transporting this freight is estimated to be $351 million (QGI Consulting, 2006c). QGI (2006b) has estimated direct rail rates for shipping freight via the ACRL in two ways, using the cents per ton-mile methodology and average revenue per line haul mile based on revenues from other North American railroads. The two approaches provide a range of estimates for transportation costs
Information Insights, Inc. 93

ACRL SEA Socio-economic Impact Assessment - Alaska
on the ACRL. Using QGI Consulting’s estimates, the ACRL could cut $11 million to $141 million from transportation costs for freight currently shipped by container vessels and barges from Seattle and Tacoma.
QGI Consulting (2006b) predicts the 360,000 tons of marine freight destined for southeast Alaska ports could also be shipped via railroad. However, comparable cost estimates to Southeast Alaska via marine and rail transport were not available, so no savings from these freight flows have been included. Without supporting cost data, we cannot agree with the assumption that marine traffic to Southeast Alaska ports would be diverted to the ACRL.
Trucking Of the 118,000 tons of freight brought into Alaska via truck from western Canada, about 85,000 tons (72.3 percent) of general merchandise, household goods, and timber are most likely to convert to direct rail, according to the Phase I logistics analysis by QGI Consulting (2006b). Another 32,600 tons of commodities (27.7 percent) were eliminated from the analysis, because they were considered “not easily containerized in a rail scenario,” and thus less likely to switch modes. These commodity types excluded from the savings analysis were machinery and equipment, construction materials, petroleum products, iron, steel and pipe, mobile homes, and livestock. We disagree with this conclusion. With the exception of livestock, these commodities could easily and more efficiently be moved on flat-bed or tanker cars by rail than by highway on trucks (Robert Kollmar of HDR Engineering, Inc., personal communication, July 20, 2006). However, without cost data, we were not able to calculate any savings for these shipping these commodities by direct rail. An additional 3,000 tons of inbound freight originating in Yukon Territory were omitted from the analysis because transportation cost estimates from the Territory were not available.
Using QGI Consulting estimates (2006c) of truck and direct rail costs from Edmonton, Alberta, and Vancouver, BC, to Fairbanks and Anchorage, Alaska, the ACRL would save from $27 million to $31 million per year on nearly 82,000 tons of inbound freight. These represent savings of 66 percent to 76 percent off the cost of trucking these commodities – an average savings of 71 percent. Once again, the variability derives from the two methods of predicting ACRL freight rates. With either method, the potential savings on highway freight are huge. This is due primarily to the fact that railroads use one quarter of the diesel fuel trucks consume on average to move a ton of freight one mile (Association of American Railroads, 2006).
Rail barge Rail-barge transportation accounts for 309,000 tons of freight shipped to Alaska each year. Canada is the origin for 142,000 tons of this freight with the remaining 167,000 tons originating in the Lower 48 United States (QGI Consulting, 2006b). QGI’s shipping costs per ton estimates (2006c) show that ACRL is primarily competitive with freight shipped by the Canada National Railway’s (CNA) rail-barge service from Prince Rupert, B.C., but is not competitive with the overwhelming majority of U.S. rail-barge traffic, which is shipped on the Alaska Railbelt Marine (ARM) service from Tacoma, Washington. A direct rail link from Canada would save an estimated $2.3 million (19 percent) off rail-barge shipping costs on freight originating in Canada, but only $14,000 (0.1 percent) on rail-barge traffic originating in the Lower 48 United States.
94 Information Insights, Inc.

ACRL SEA Socio-economic Impact Assessment - Alaska
The cost savings for freight shipped to Fairbanks were substantially higher than for freight bound for Anchorage. In order to estimate cost savings using the ACRL we assumed freight shipped from the USA and Canada would use the lowest cost method (rail barge or direct rail). We assumed rail-barge freight originating in Canada would go 30 percent to Anchorage and 70 percent to Fairbanks. We assume that 39 percent of the rail-barge freight originating in the contiguous United States is delivered to Anchorage and 61 percent to Fairbanks. These estimates are very close to those found in the QGI Consulting traffic data, although in reality four percent of the freight originating in the USA and 19 percent of freight originating in Canada had a destination other than Anchorage or Fairbanks.
ACRL will be cost competitive with only one segment of rail-barge traffic from the Lower 48 states: mixed freight originating in Chicago and bound for Fairbanks could cost $11.24 less per ton to ship via ACRL, a savings of 9.5 percent. In 2004, this traffic amounted to approximately 1,220 tons of goods, or 0.7 percent of all rail-barge traffic to Alaska from the Lower 48. Freight originating in Chicago and bound for Anchorage would be still be cheaper to ship by rail barge. So of the 167,000 tons per year shipped by rail barge from the Lower 48, we should expect only 1,220 tons to be diverted to direct rail, while we expect up to 100 percent, or 142,000 tons per year, of Canadian rail-barge traffic to be diverted to ACRL. Thus, the ACRL could result in an annual savings of $2.3 million, or 7.8 percent of the $30 million total for current rail-barge transportation costs.
Information Insights, Inc. 95

ACRL SEA Socio-economic Impact Assessment - Alaska
Table 18: Comparison of container vessels and RO/RO barges with intermodal rail
Mode Destination Origin / Carrier Ave. cost per ton Tonnage
Marine Freight Cost
Rail IM Freight Cost
Savings using ACRL
Percent Savings
Container vessel/barge* Anchorage
Tacoma (Horizon / TOTE / AML) $221.31 1,587,719** $351,378,433
Rail IM (Method 1) Anchorage Seattle, WA (ACRL) $132.56 1,587,719** $210,463,320 $140,915,113 40.1%Rail IM (Method 2) Anchorage Seattle, WA (ACRL) $214.08 1,587,719** $339,898,884 $11,479,549 3.2%Average Cost/Savings $176.94 1,587,719** $280,931,000 $76,197,331 21.7%Sources: 2004 cost data from QGI Consulting; Savings analysis by Information Insights. Notes: *Includes RO/RO (roll-on, roll-off) barges and container vessels and barges. **An estimated 360,000 additional tons of containerized traffic destined for ports other than the Port of Anchorage have not been included in the cost/savings analysis due to a lack of comparable data.
Table 19: Comparison of truck freight costs with intermodal rail
Mode Destination Origin / Carrier Ave. cost per ton Tonnage
Truck Freight Cost
Rail IM Freight Cost
Savings using ACRL
Percent Savings
Truck Alaska W. Canada (various) $493.30 81,753* $40,328,940 Rail IM (Method 1) Alaska W. Canada (ACRL) $116.79 81,753* $9,547,807 $30,781,134 76.3%Rail IM (Method 2) Alaska W. Canada (ACRL) $168.25 81,753* $13,755,228 $26,573,712 65.9%Average Cost/Savings $142.52 81,753* $11,651,518 $28,677,423 71.1%Sources: 2004 cost data from QGI Consulting; Savings analysis by Information Insights. Notes: *An additional 3,000 tons of inbound freight originating in Yukon Territory were omitted from the analysis because transportation cost estimates from the Territory were not available. Another 32,600 tons of highway freight considered not easily containerized were excluded from analysis based on commodity type.

Table 20: Comparison of rail-barge freight costs with intermodal rail
Mode Destination Origin / Carrier Ave. cost per ton Tonnage
Rail barge Freight Cost
Lowest Cost Option
Savings using ACRL
Percent Savings
Rail barge Anchorage - 39% Fairbanks - 61%
Contiguous U.S. (ARM) $106.99 167,000 $17,867,669
Rail IM Contiguous U.S. (ACRL) $106.91 $17,853,956 $13,713 0.1%
Rail barge Anchorage - 30% Fairbanks - 70%
W. Canada (CNA) $86.18 142,000 $12,236,950
Rail IM W. Canada (ARCL) $69.73 $9,901,022 $2,335,928 19.1%
Rail barge Alaska USA & Canada (ARM, CNA) $97.43 309,000 $30,104,618
Rail IM Alaska USA & Canada (ACRL) $89.82 309,000 $27,754,978 $2,349,640 7.8%
Sources: Cost data from QGI Consulting; Savings analysis by Information Insights.
Table 21: Summary of community resupply savings
Mode Total Tonnage
Analyzed Divertible Tonnage
Actual Cost 2003-05
Lowest Cost Option
Savings using ACRL
Percent Savings
Truck 81,753 81,753 $ 40,328,940 $ 11,651,518 $ 28,677,423* 71.1%Container vessel/barge 1,587,719** 1,587,719 $ 351,378,433 $ 280,931,000 $ 76,197,331 21.7%
Rail barge (U.S.) 167,000 2,000 $ 17,867,669 $ 17,853,956 $ 13,713 0.1%
Rail barge (Canada) 142,000 142,000 $ 12,236,950 $ 9,901,022 $ 2,335,928 19.1%
Total 1,978,472 1,813,472 $ 421,811,992 $ 320,337,496 $ 107,224,395 25.4% Sources: Cost data from QGI Consulting (2006a,b,c); Savings analysis, Information Insights. Notes: *Does not include potential savings on freight trucked from Yukon Territory. **Does not include 360,000 tons of containerized freight and trailers shipped to ports other than Anchorage for which comparable cost data was not available.
Information Insights, Inc. 97
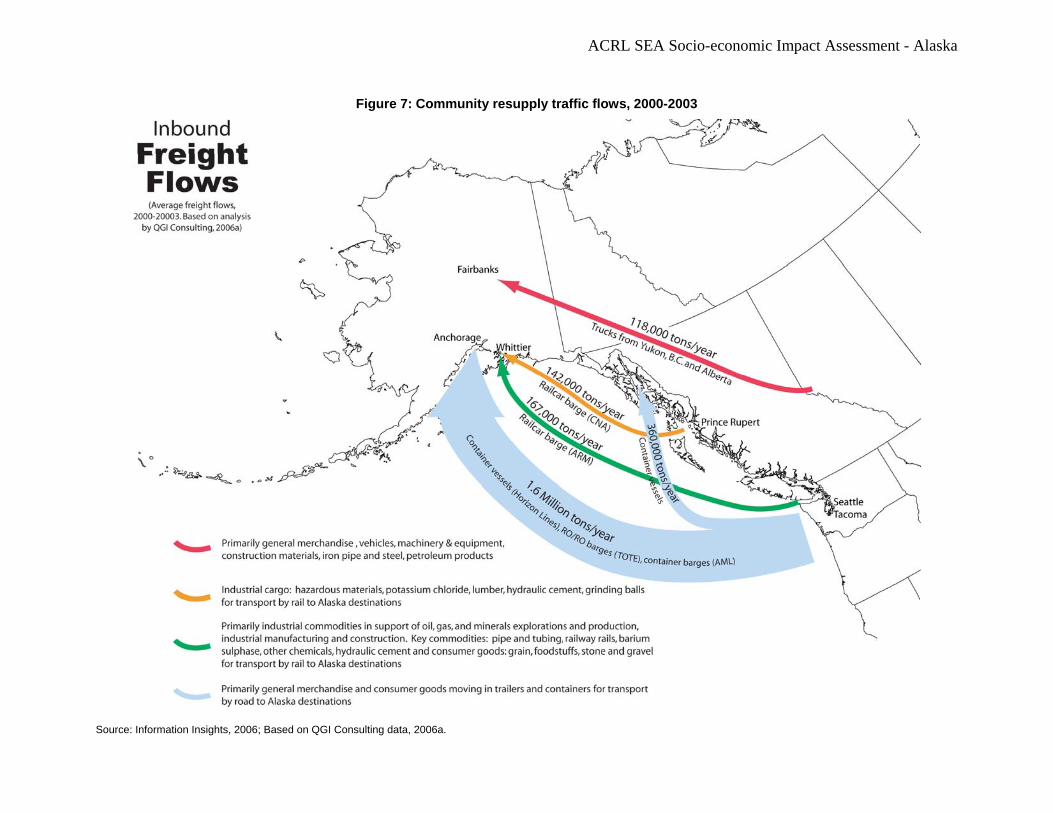
ACRL SEA Socio-economic Impact Assessment - Alaska
Figure 7: Community resupply traffic flows, 2000-2003
Source: Information Insights, 2006; Based on QGI Consulting data, 2006a.
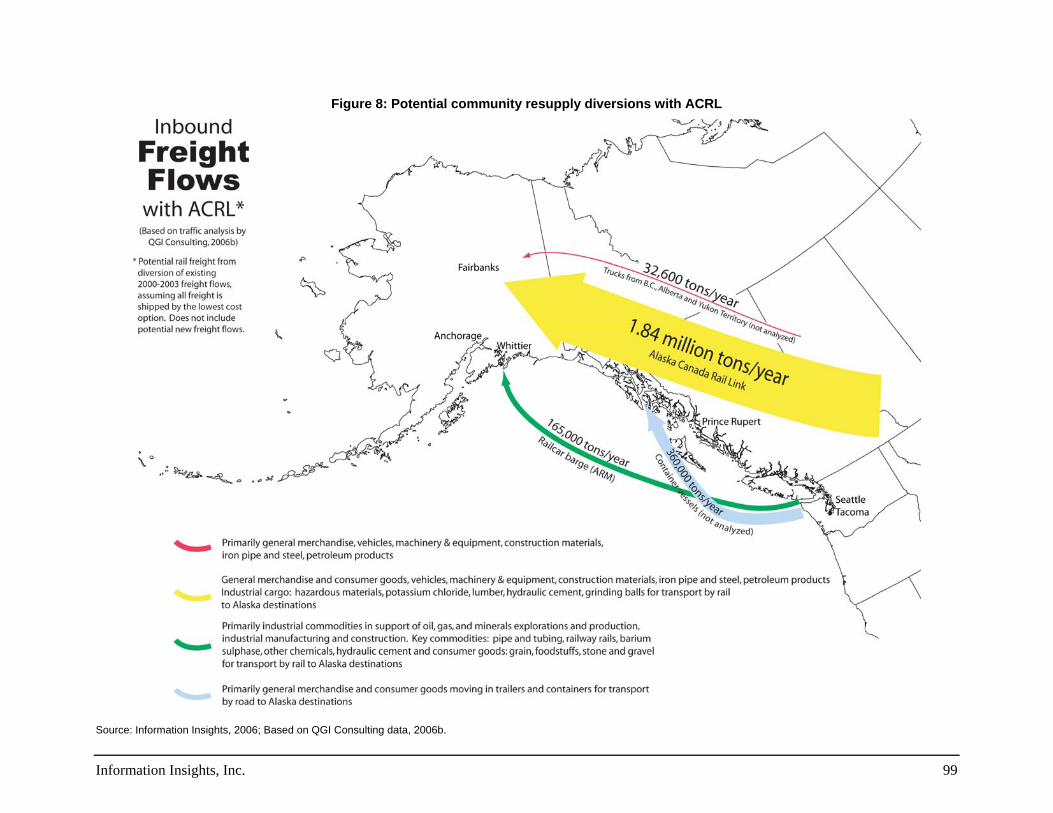
Figure 8: Potential community resupply diversions with ACRL
Source: Information Insights, 2006; Based on QGI Consulting data, 2006b.
Information Insights, Inc. 99

ACRL SEA Socio-economic Impact Assessment - Alaska
Savings by mode and commodity type The ACRL could save Alaskans an average of 25 percent on goods and supplies brought into the state. The maps on pages 98 and 99 and the table below show which inbound freight flows and commodities are most likely to benefit from cheaper direct rail service.
This analysis does not take into account shifts in commodity sourcing or other factors besides cost that might cause a shipper to choose an alternate mode of transport. Two examples: (a) the source of barite used on the North Slope, currently shipped by rail barge from the U.S., could shift to Canadian sources and thus shift modes from rail barge to ACRL, and (b) automobile dealers in Alaska may choose to ship vehicles by rail instead of rail barge or highway for frequency of supply or condition of freight reasons.
Table 22: Resupply savings by mode and commodity type.
Resupply Savings No Savings
Highway Freight – 71% savings (commodities shifted to rail)
Agricultural Products General Merchandise Household Goods
Sources: QGI Consulting (2006 b, c).
Timber
Highway Freight – 0%* (commodities not shifted)
Bus and Taxi Service Construction Materials Iron, pipe and steel Livestock Mine ore Mobile homes Petroleum products Vehicles, machinery & equipment
*These items were left out of the QGI analysis, but could be efficiently moved by rail on flatbeds or tanker cars. (See discussion on Page 94.)
Containerized cargo and trailers to Port of Anchorage - 22% savings General merchandise Consumer goods Vehicles
Containerized cargo and trailers to Southeast Alaska ports - ?
General merchandise Consumer goods Vehicles
Comparable cost data was not available to determine if this freight would switch modes.
Rail barge from Canada - 19% savings Rail barge from U.S. – 0%
Hazardous materials Hazardous materials Lumber and oriented strand board Potassium chloride, other chemicals Metals and products Hydraulic cement Grinding balls Stone, clay and glass products Agricultural and farm products
Pipe and tubing Railway rails Barium Sulfate Hydraulic cement Forest products, grain, food stuffs, stone
and gravel
Telephone Poles This freight would be more expensive to ship by inland rail service.
100 Information Insights, Inc.
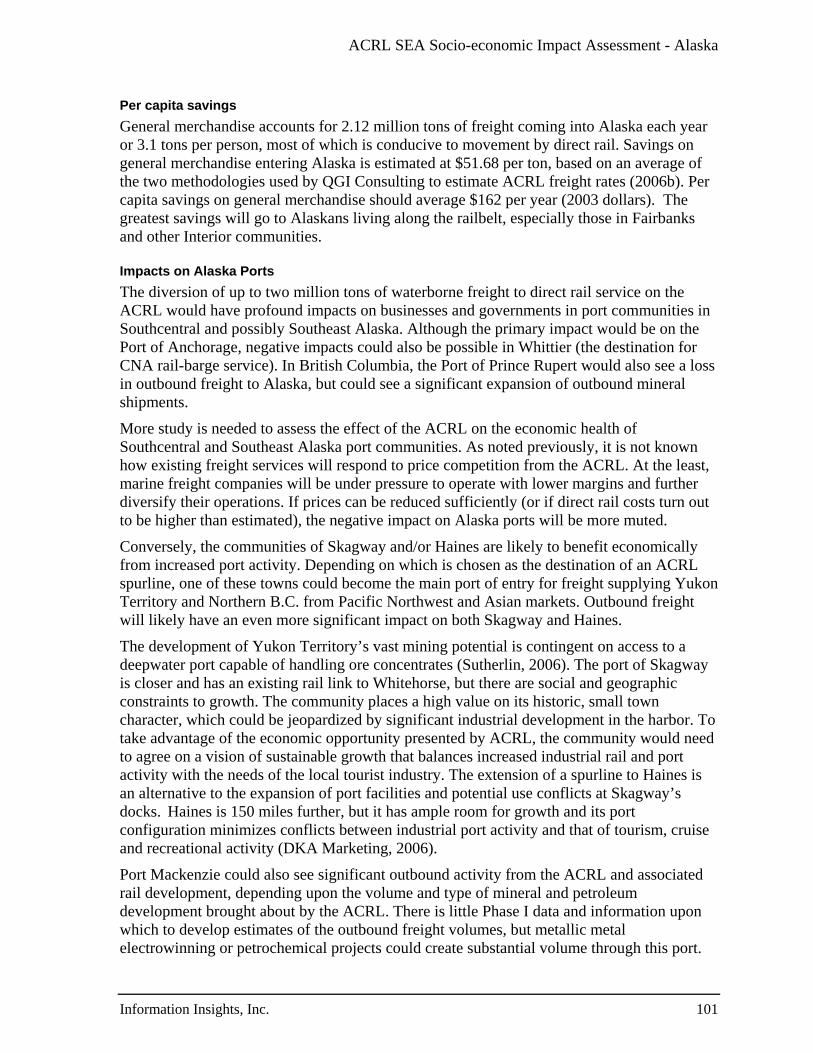
ACRL SEA Socio-economic Impact Assessment - Alaska
Per capita savings General merchandise accounts for 2.12 million tons of freight coming into Alaska each year or 3.1 tons per person, most of which is conducive to movement by direct rail. Savings on general merchandise entering Alaska is estimated at $51.68 per ton, based on an average of the two methodologies used by QGI Consulting to estimate ACRL freight rates (2006b). Per capita savings on general merchandise should average $162 per year (2003 dollars). The greatest savings will go to Alaskans living along the railbelt, especially those in Fairbanks and other Interior communities.
Impacts on Alaska Ports The diversion of up to two million tons of waterborne freight to direct rail service on the ACRL would have profound impacts on businesses and governments in port communities in Southcentral and possibly Southeast Alaska. Although the primary impact would be on the Port of Anchorage, negative impacts could also be possible in Whittier (the destination for CNA rail-barge service). In British Columbia, the Port of Prince Rupert would also see a loss in outbound freight to Alaska, but could see a significant expansion of outbound mineral shipments.
More study is needed to assess the effect of the ACRL on the economic health of Southcentral and Southeast Alaska port communities. As noted previously, it is not known how existing freight services will respond to price competition from the ACRL. At the least, marine freight companies will be under pressure to operate with lower margins and further diversify their operations. If prices can be reduced sufficiently (or if direct rail costs turn out to be higher than estimated), the negative impact on Alaska ports will be more muted.
Conversely, the communities of Skagway and/or Haines are likely to benefit economically from increased port activity. Depending on which is chosen as the destination of an ACRL spurline, one of these towns could become the main port of entry for freight supplying Yukon Territory and Northern B.C. from Pacific Northwest and Asian markets. Outbound freight will likely have an even more significant impact on both Skagway and Haines.
The development of Yukon Territory’s vast mining potential is contingent on access to a deepwater port capable of handling ore concentrates (Sutherlin, 2006). The port of Skagway is closer and has an existing rail link to Whitehorse, but there are social and geographic constraints to growth. The community places a high value on its historic, small town character, which could be jeopardized by significant industrial development in the harbor. To take advantage of the economic opportunity presented by ACRL, the community would need to agree on a vision of sustainable growth that balances increased industrial rail and port activity with the needs of the local tourist industry. The extension of a spurline to Haines is an alternative to the expansion of port facilities and potential use conflicts at Skagway’s docks. Haines is 150 miles further, but it has ample room for growth and its port configuration minimizes conflicts between industrial port activity and that of tourism, cruise and recreational activity (DKA Marketing, 2006).
Port Mackenzie could also see significant outbound activity from the ACRL and associated rail development, depending upon the volume and type of mineral and petroleum development brought about by the ACRL. There is little Phase I data and information upon which to develop estimates of the outbound freight volumes, but metallic metal electrowinning or petrochemical projects could create substantial volume through this port.
Information Insights, Inc. 101

ACRL SEA Socio-economic Impact Assessment - Alaska
We recommend further studies of the feasibility of, and potential volumes from, such projects in future ACRL analysis phases.
8.3 Effect on Alaska consumer price index The study team did not undertake an in-depth review of the impact of the ACRL on the Alaska consumer price index because of the lack of region-specific CPI data and the lack of a detailed CPI model.11 We did, however, develop a rough estimate of what the ACRL might mean in consumer prices and on the Alaska CPI.
According to the Bureau of Labor Statistics (U.S. Bureau of Labor Statistics, 2005, table 3), Alaska gross state product (GSP) for 2003 totaled $26.6 billion. Of this amount, about $10 billion was spent on goods, with the remaining $16.6 billion spent on services. Based on the estimates of freight volumes and prices above, an ACRL could directly save $105 million on the cost of transporting goods typically included in the Anchorage consumer price index (CPI). This savings would result in a 1.0 percent decrease in the goods portion of the Anchorage CPI, for a net reduction to the Anchorage CPI of 0.38 percent.
The total effect on the CPI will depend on what effect the savings in transportation costs has on services provided in Alaska. In theory, lower costs of goods would have a moderating effect on wages, but we do not have a current CPI model to estimate this effect. We can therefore say that the CPI effect would be between 0.38 and 1.0 percent.
8.4 Impact on mineral development
8.4.1 Probability of new mine development Final numbers from Phase I work on Alaska mining potential from the ACRL had not been released at the time this study was prepared. The following analysis is based on preliminary findings by researchers at the University of Alaska Fairbanks. For this reason, the impacts reported here should also be considered preliminary in nature and may require adjustment following release of the final Phase I report on probable new mineral development along the rail corridor.
A preliminary assessment of new Alaska mineral development estimates a minimum of 80 million tons of metals and mineral concentrates, with a gross metal value of $41 billion dollars, would be exported over a 30-year period following construction of the ACRL. Dr. Paul Metz, professor of mining and geological engineering at the University of Alaska Fairbanks, is conducting the study. The projection is based on undiscovered mineral potential in the rail corridor, not known reserves, and is considered a conservative estimate by researchers at the University of Alaska Fairbanks. According to Dr. Metz, the upper limit of probable new development could be as high as 300 million tons of concentrates or $160 billion in gross metal value (P. Metz, personal communication, June 28, 2006).
Dr. Metz’ team has tabulated 600 mineral occurrences in the region, estimating the gross metal value (GMV) at 50 and 90 percent probability based on tonnage and grade worldwide. The study corridor extends to 60 miles on either side of the proposed rail line. The majority 11 The Bureau of Labor Statistics calculates CPI for Anchorage, but no other locations in Alaska.
102 Information Insights, Inc.

ACRL SEA Socio-economic Impact Assessment - Alaska
are moderate-sized occurrences of base metals and ferro alloys. Base metals include copper, lead and zinc. Ferro alloys, including nickel, chromium, manganese, molybdenum, vanadium, tungsten, and tin, are used as additives and de-oxidizing and de-sulfurizing agents in steel manufacture.
Even at the lower estimate of $41 billion in gross metal value, the impact of new development on the state’s mining industry would be significant. With production averaged over 30 years, new mines would account for $1.4 billion per year in gross metal value, which represents a doubling of the production value of mines in the state over 2004 levels.
Table 23 shows the employment impact from this level of mineral development. Assuming mine expenditures equal the value of mine production, an input-output analysis using the IMPLAN model of the Alaska economy predicts that a gross metal value in the range of $41 billion would produce an average of 6,600 mining jobs per year with an annual payroll of $510 million (in 2003 dollars). An additional 4,700 jobs will be produced in other sectors of the economy, for a total employment impact of over 11,000 jobs annually.12 Figure 9 shows the expected distribution of indirect and induced jobs from new mine expenditures. The total economic output from this level of new mineral development would be $52.6 billion over 30 years, for an annual impact of $1.8 billion.
Table 23: Employment impact of new mine development
Type of Impact 30-year life Annual Impact
Gross Metal Value (US$ millions) $ 41,000 $ 1,367 Mining Employment (direct jobs) 198,500 6,617 Mining Industry Labor Income (US$ millions) $ 15,313 $ 510 Additional Employment (indirect and induced) 142,000 4,733 Additional Labor Income (indirect and induced) (US$ millions) $ 5,777 $ 193 Total Labor Income (US$ millions) $ 21,090 $ 703 Total Employment 340,500 11,350 Total Economic Output (US$ millions) $ 52,563 $ 1,752 Source: IMPLAN Group data, 2003. Notes: Monetary figures are in 2003 dollars. A job equals one full- or part-time job for one year. Labor income includes employee wages and benefits and self-employed income.
Each dollar in mineral value generated by a new mine creates an impact on other sectors of the Alaska economy as mine operators purchase new materials and supplies and employees of mining companies and support industries spend their wages on good and services. Each additional billion dollars in metal production, supports 5,500 direct mining jobs and nearly 4,000 indirect and induced jobs in other sectors. The distribution of these jobs is illustrated in Figure 9.
12 It is important to keep in mind that these numbers are annual averages and do not represent the employment picture for any specific year. Because estimates are based on undiscovered mineral potential rather than known mineral occurrences, it is impossible to predict when individual mines will come online, how long they will remain in production, and what their workforce needs and operating expenses will be.
Information Insights, Inc. 103
ACRL SEA Socio-economic Impact Assessment - Alaska
Figure 9: Indirect and induced effects of $1 billion in new mine expenditure
Services24%
Retail trade13%
Health care11%
Real estate3%
Other33%
Restaurants10%
Wholesale trade &
transportation6%
Source: IMPLAN Group data, 2003. Notes: Other includes telecommunications, air transportation, building maintenance, oil and gas extraction, tourism, insurance, and security services.
Multipliers used to calculate the economic impact of the mining industry vary with the type of operation. The multiplier used in the calculations above is applied to base metal mines in Alaska such as lead and zinc. The federal Bureau of Economic Analysis (BEA) publishes multipliers for U.S. industries by region for use in the Regional Input-Output System (RIMS II). BEA multipliers published for the Alaska mining industry (metals and coal combined) in 2003 were 2.05 for employment impacts and 1.61 for earnings impacts (McDowell Group, 2006). These are generally higher than multipliers applied to the Alaska mining industry in IMPLAN as shown in the table below.
Table 24: Employment multipliers for Alaska’s mining industry
Sector Employment
Multiplier Earnings Multiplier
Coal mining 1.89 1.46 Lead and zinc mining 2.03 1.62 Gold and silver mining 1.78 1.48 Rock quarrying 1.65 1.43 Sand and gravel mining 1.3 1.32
Source: IMPLAN 2002 data, as published in McDowell Group, 2006.
Multipliers for mining operations in Alaska are generally lower than for other states, because so many materials must be purchased from out of state (Information Insights, 1999). Similarly multipliers used to estimate local and regional impacts are lower than statewide multipliers because more of the mine’s purchases and payroll dollars will leak from the local economy.
8.4.2 Employment and productivity at existing mining operations The employment impact of new Alaska mines can also be illustrated by looking at the effect of existing mining operations on Alaska’s economy. A February 2006 McDowell Group
104 Information Insights, Inc.

ACRL SEA Socio-economic Impact Assessment - Alaska
study on the economic impacts of Alaska’s mining industry shows average number of direct production jobs created per mine in 2004:
Metals mining - 1,130 jobs per mine Coal mining - 92 jobs per mine Construction materials mining (sand, gravel, rock) - 136 jobs per mine
The mining industry’s average monthly earnings are 83 percent above the statewide average for all industries of $38,616. The mining industry also has a high resident hire rate. In 2003, 83 percent of mine workers were Alaska residents, as compared with 80 percent in construction, 77 percent in oil and gas extraction, 73 percent in food services and accommodations, and 29 percent in seafood processing. The McDowell Group also points out that Alaska’s largest mines provide steady year-round employment with almost no seasonal variation (McDowell Group, 2006).
Currently, Alaska mineworkers are very productive – producing substantially more value per worker than the national average, as illustrated in Table 25. The main reason for this is the lack of low-cost transportation and energy, which has made only larger, more efficient mines with high-value deposits competitive (P. Metz, personal conversation, July 20, 2006). With access to rail transportation and the possibility of cheaper fuel inputs from coal and natural gas, smaller mines and those with lower-grade deposits will become feasible. As this happens productivity per worker will come down until it approaches the U.S. average for mining.
Table 25: Production value per employee
Alaska average
(2003) U.S. average
(2003) Alaska average
with ACRL
Annual production value $ 1,000,700,000 $ 57,000,000,000 $2,367,700,000 Mining employment 1,754 320,149 8,374 Production value per worker $ 570,525 $ 178,042 $ 282,744 Sources: National Mining Association (n.d.); Szumigala (2006); IMPLAN Group data, 2003.
8.5 Impact on oil and gas development
8.5.1 Effect on gas pipeline construction The Alaska North Slope gas pipeline project will transport natural gas from Prudhoe Bay through Delta Junction and along the Alaska Highway to Alberta, Canada. The project is estimated to cost $21 billion and generate Alaska state revenues of $28 billion (2005 dollars) over a project life of 35 years (Information Insights, 2006a). Spending on Alaska segments of the pipeline is projected at $5.1 billion, with an additional $2.6 billion spent on the gas treatment plant in Prudhoe Bay (Alaska Department of Revenue, 2006).
The materials cost for the pipeline is estimated at 33 percent of total project cost. This amounts to $1.68 billion for Alaska segments of the mainline. (Over 80 percent of this is the cost of pipe itself.) The cost of transportation accounts for nearly nine percent of materials
Information Insights, Inc. 105

ACRL SEA Socio-economic Impact Assessment - Alaska
cost and three percent of the total project cost.13 Materials transportation costs for Alaska segments of the pipeline are estimated at $148 million. More efficient direct rail transportation of pipe and fuel could result in an average savings of 6.7 percent on transportation costs for Alaska segments and 11 percent on transportation costs for all segments if an Alaska Canada Rail Link were operational prior to the start of pipeline construction. These savings rates are based on Alaska Highway gas pipeline freight volume and cost data compiled by Don Dean (2006) for Phase I of the ACRL feasibility study.
In his analysis, Dean used a base case cost of $132.5 million for transportation of pipe, equipment and fuel to Alaska. Dean provides cost estimates for delivery of these commodities to Fairbanks, Delta Junction, and Tok. Using these figures, we calculate that the ACRL would save $4.6 million (7.3 percent) off the cost of transporting pipe for these segments over a two-year period. Delivering fuel to these destinations by rail would save $4.3 million (36.9 percent) over two years versus combinations of barge/truck/rail transportation, for an average savings on pipe and fuel shipments for these segments of 11.8 percent. Dean omits comparison cost data for the transportation of equipment, so no savings have been calculated, although we assume direct rail transportation will be cheaper than alternative modes. Transportation savings to Fairbanks, Delta Junction and Tok are summarized in Table 26 on page 108.
Materials destined for Prudhoe Bay and Dietrich camp would continue to go direct by ship or barge to Prudhoe Bay, and from there by truck to Dietrich, so no savings on North Slope segments of the project are expected. Overall savings on materials shipments to Alaska are reduced to 6.7 percent when North Slope segments are included.
Savings on pipe and fuel transport for all pipeline segments in Alaska and Canada will average 11 percent or $37.1 million over competing transportation modes. Once again, this should be considered a conservative estimate since it includes no savings for heavy equipment or other supplies, which could be more cheaply and efficiently moved by rail. We anticipate actual savings on pipeline mobilization will exceed 11 percent.
The timing of an ACRL project is critical if it is to have a positive impact on the economics of an Alaska natural gas project. The rail link would need to be operational one year before the start of construction to maximize the benefit to the pipeline project. Procurement and pre-construction activities will begin the summer before the start of construction and include the right-of-way clearing, construction of camps and pads, staging of pipe and equipment, etc. (Information Insights, 2004). If, however, the construction of the rail link overlaps with a gas pipeline project, it could have a negative impact as competition for resources drives up labor and materials costs for both projects.
8.5.2 Other oil and gas industry cost savings
Chemicals and tubular metals Chemicals and metals account for 185,000 tons of the 309,000 tons of rail-barge traffic entering Alaska each year, the great majority of which are used in Alaska’s oil and gas 13 Percentages are based on 2001 estimates by project sponsors. Due to sharp rises in steel and fuel prices since 2001, pipe and transportation costs may make up bigger components of overall project cost, increasing the potential impact of the ACRL on the project.
106 Information Insights, Inc.

ACRL SEA Socio-economic Impact Assessment - Alaska
industry. Commodities shipped from Canada account for 93,000 tons (50 percent) of this traffic and could be competitively shipped by direct rail (QGI Consulting, 2006c). The savings to Alaska industry importing these materials would be $1.5 million or 8.5 percent. For chemicals and metals originating in Seattle/Tacoma, rail-barge costs were judged to be lower than estimated direct rail rates for all points of origin, so no cost savings should be expected for industrial materials rail barged from the contiguous United States.
Barite On occasion, Alaska operators have purchased barite directly from Canada for use on the North Slope. A recent purchase resulted in savings of roughly 20 percent on the cost of goods by purchasing barite direct from Canada. The material was barged to Prudhoe from Canada. The purchase was for approximately 7,000 tons of chemicals. The savings translated to over $140,000 (about $1 per 100 lbs. bag). Considering the total chemicals used for 2005 (89,627 tons or 179,254,000 lbs.) purchasing directly from the Canadian manufacturers could save the industry approximately $1,792,540 (about seven cents per pound).
In this case, the material was barged to the North Slope. Whether or not these groups would use the ACRL would be another issue, especially considering the fact that the material would still need to be trucked to Prudhoe Bay via the Dalton highway. This was an unusual purchase, as barite is not normally purchased in volumes beyond amounts that are required immediately. Stockpiled materials are subject to governmental accountability standards and therefore have “economic shelf lives.” If they are not used within a certain time period, they are labeled as “excess and obsolete” and can no longer be considered company assets.
Information Insights, Inc. 107

ACRL SEA Socio-economic Impact Assessment - Alaska
Table 26: Transportation savings on Interior Alaska segments of a gas pipeline
Commodity Destination Mode Ave. cost
$/ton Tonnage Base case
cost Cost with
ACRL Savings with
ACRL Percentage
savings
Pipe Mixed (base case) $69.99 921,500 $64,497,080
Fairbanks, Delta Junction, and Tok Mixed with ACRL $64.90 $59,802,320 $4,694,760 7.3%
Fuel Barge with rail or truck $81.11 142,700 $11,574,030
Fairbanks, Delta Junction, and Tok
Direct Rail $51.14 $7,297,950 $4,276,080 36.9%Equipment N/A 58,100 N/A
Fairbanks, Delta Junction, and Tok Direct Rail $220.17 $12,791,710 N/A N/A
Base case $71.48 1,064,200 $76,071,110 Total (w/o equipment)
Fairbanks, Delta Jct., and Tok With ACRL $63.05 $67,100,270 $8,970,840 11.8%
Source: Dean, 2006
Table 27: Transportation cost savings for chemicals and metals
Mode Destination Origin / Carrier Ave. cost per ton Tonnage
Rail barge Freight Cost
Lowest Cost Option
Savings using ACRL
Percent Savings
Rail barge Anchorage - 39% Fairbanks - 61%
Contiguous U.S. (ARM) $108.15 92,000 $9,949,854
Rail IM Contiguous U.S. (ACRL) 92,000 $9,949,854 $0 0.0%
Rail barge Anchorage - 30% Fairbanks - 70% W. Canada (CNA) $86.14 93,000 $8,011,446
Rail IM W. Canada (ACRL) $69.66 93,000 $6,478,022 $1,533,424 19.1%
Rail barge Alaska USA & Canada (ARM, CAN) $97.09 185,000 $17,961,300
Rail IM USA & Canada (ACRL) Alaska $88.80 $16,427,876 $1,533,424 8.5%
Sources: Cost data from QGI Consulting; Savings analysis by Information Insights. Note: Tonnage included in this table is part of the rail barge traffic in Table 20.
ACRL SEA Socio-economic Impact Assessment - Alaska
8.6 Impact on military defense and emergency management The most important military defense and emergency management benefits to Alaska from the ACRL cannot be quantified. The rail link would provide a critical transportation link that could prove invaluable in the event that a major natural disaster or breech of security shuts down other transportation arteries connecting Alaska to the rest of the world. In particular, the proposed expansion of the Port of Skagway and resumption of freight service on the White Pass & Yukon Route Railway would give Alaska another point of access in the Gulf of Alaska, and one which is less vulnerable to seismic hazards. The port, spurline and ACRL mainline could become a critical link for emergency response and community resupply in the event of a major seismic event in Southcentral Alaska, like the 1964 earthquake that devastated Valdez and Anchorage.
The ACRL would also mitigate risks from fires, floods, violent storms, industrial spills, terrorist incidents and other emergencies that fall short of threatening the state’s major transportation links. Whenever aid is required from outside the state or affected region, the ACRL would facilitate emergency response and military defense efforts by providing an efficient means for moving people, materials and equipment. The ACRL communications system could also improve the state’s emergency communication and response capacity by providing a redundant communication link – between communities along the rail corridor and between Alaska, Canada and the contiguous United States – that could be tapped into in the event of an emergency.
The ACRL would benefit the military economically by providing savings on routine procurement. Using the per capita savings rate for general merchandise imported to Alaska ($51.68 per year), we estimated that the savings on military family resupply would average $2.6 million per year. Excluding family members, annual resupply savings for enlisted military personnel would total $1.1 million.14 Numbers of military personnel and family members are based on FY 2005 data and information provided by Neal Fried of the Alaska Department of Labor and Workforce Development (Personal communication, June 2006).
8.7 Impact on tourism No studies have been done to estimate ACRL passenger traffic or revenue on the Alaska side of the border. According to Informetrica Limited (2006), tourist transportation in Alaska is provided by air (52 percent), private cars (4 percent), buses (1 percent), ferries (1 percent), and cruise ships (42 percent). A rail link to Canada could provide competition to all these modes of transport but is expected to draw the most tourists from those currently traveling by air and highway.
In its analysis of Port of Skagway and southern Yukon rail expansion options, HDR Engineering, Inc. (2006) contends that well-conceived development plans would enhance Skagway’s tourist facilities and provide positive ripple effects throughout its tourism-based economy. Summer tourist excursion operations will be more efficient once cruise ship
14 Estimates exclude branches whose members are unlikely to live or work on military bases, including the Army and Air National Guard and the Army, Air Force, Navy, and Marine Reserves.
Information Insights, Inc. 109

ACRL SEA Socio-economic Impact Assessment - Alaska
business is linked to a modern passenger rail operation. The three-rail track recommended for the White Pass & Yukon Route Railroad could become a tourist attraction in itself.
Almost 10,000 busses transport passengers between Alaska and Canada each year (468 on the Alaska Highway and nearly 9,500 on the Klondike Highway). We assume a significant percentage would choose to travel by train if passenger rail service is available at competitive rates, and that the service would attract additional tourists to Alaska who are rail enthusiasts.
More work needs to be done to assess the impact on tourism from ACRL passenger service. We assume a negative impact on companies currently providing bus packages, a positive impact on the Alaska Railroad and the White Pass & Yukon Route Railroad, and a new positive impact on communities in the rail corridor. The impact on Skagway’s tourist-based economy could be positive or negative depending on how well new Port of Skagway freight facilities and scheduling can be designed around the needs of the cruise ship industry and related businesses.
8.8 U.S. impacts outside Alaska Construction and operation of the ACRL will have a minimal impact on the U.S. outside Alaska. There could be a positive impact on the U.S. balance of trade if new mines or petrochemical plants develop in Alaska due to the ACRL, but as noted above there is little Phase I data on which to base an estimate.
The shift of Alaska resupply freight now shipped from Seattle/Tacoma to the Port of Anchorage will have impacts on these ports and on railroad and trucking services delivering freight to the Pacific Northwest. The Port of Seattle is currently the fastest growing port in the United States. In 2004 alone, the port’s container cargo volume grew by 25 percent, and an estimated two million containers moved through the port in 2005. In this rapid growth scenario, the loss of Alaska-bound freight may have minimal impact on the port.
Two Western U.S. railroads – the Union Pacific and the Burlington Northern and Santa Fe (BNSF) – currently bring freight into Seattle/Tacoma. These railways would stand to lose up to 1.6 million tons per year in intermodal freight business destined for Alaska. This intermodal freight would instead be shipped to Chicago, then north on the CN Railway and the ACRL. The railways carrying freight to Chicago would see a corresponding increase in freight volumes. Overall, we would expect to see a net loss of freight transportation services within the U.S. and a net gain in Canada, resulting in a negative impact on the U.S. balance of trade with Canada.
Further study is needed to assess the impact of lost business on Lower 48 railway and trucking services. It may also be necessary to study whether the additional Chicago freight due to an ACRL would materially affect existing rail freight congestion in Chicago or other hubs along the route, but the likely answer is that the relative volume would be tiny in comparison with existing freight volumes.
110 Information Insights, Inc.

ACRL SEA Socio-economic Impact Assessment - Alaska
9 Miscellaneous Fiscal Effects of the ACRL
9.1 Impact on government revenues
9.1.1 Mineral lease revenues In addition to state income tax paid by corporations in all industries, mining operations in Alaska pay an additional seven percent net profits interest (NPI) mining license tax to the state, regardless of where the mine is located. Operations on state land pay an additional three percent NPI royalty. In 2005, the mining license tax contributed $10.3 million to the state General Fund, or 0.35 percent of state revenues. Not enough data are available to estimate the amount of additional royalties and taxes the state could expect to receive from new mining operations that become economic and feasible with transportation available on the ACRL, but if the ratio of mining license tax to gross metal value were consistent with the current ratio, state revenues would increase by about $8 million annually.
9.1.2 Motor fuel taxes and other fees In addition to reducing the cost of freight transportation to and from Alaska, the ACRL would reduce consumption of diesel fuel along the route of the rail link. On average railroads use one quarter of the diesel fuel trucks consume to move a ton of freight one mile (Association of American Railroads, 2006). Assuming an average of six miles per gallon (mpg) for a loaded truck and 13 mpg for an empty truck, using traffic data provided by QGI Consulting (n.d.), we estimate diesel fuel consumption would be reduced by 416,000 gallons per year along the Alaska section of the rail link if all truck freight was transported by railroad. This estimate does not include a reduction in fuel consumption in Southcentral Alaska due to the diversion of marine freight traffic entering the Port of Anchorage.
A decrease in diesel consumption will reduce state and federal government fuel tax revenues. Given a State of Alaska highway motor fuel tax of 8 cents per gallon and an effective 2 cents per gallon tax on fuel used off-highway by railroads (State of Alaska Department of Revenue Tax Division, 2005), state motor fuel tax revenues would fall by an estimated $41,600 per year if all inbound truck freight converted to rail. With a federal excise tax of 24.4 cents per gallon for diesel fuel, U.S. government revenues would decrease by about $101,000 per year due to an ACRL project.
The State of Alaska Division of Measurement Standards and Commercial Vehicle Enforcement also collects fees for oversize and overweight permits, and hourly fees for engineering reviews of oversize and overweight loads. Since we do not know how many trucks currently entering Alaska by highway are typically pay oversize and/or overweight fees, no cost to state government has been calculated due to the loss of these fees.
9.1.3 Impact of pipeline mobilization savings on state revenues Using cost data provided by Dean (2006), we estimate the ACRL could save the project $37.1 million (11 percent) on the cost of transporting pipe and fuel for all segments of the pipeline. This is equivalent to a 0.2 percent savings on total project costs of $21 billion (2005
Information Insights, Inc. 111

ACRL SEA Socio-economic Impact Assessment - Alaska
dollars). As noted earlier, this number does not include savings on the transport of construction equipment or other supplies. Actual savings will be higher.
The net effect of any reduction in project costs is to reduce the pipeline tariff and increase the wellhead price of natural gas, which will result in an increase in gas revenues to the companies operating the pipeline (the producers) and to the State of Alaska. An 11 percent savings on transportation costs would increase the net present value of state revenues by $17 million and increase revenues to the producers by $13 million over the 35-year life of the pipeline. Federal taxes on pipeline revenues will increase by an estimated $7 million.15
The timing of an ACRL project is critical if it is to have a positive impact on the economics of an Alaska natural gas project. Any increase in gas pipeline costs due to competition for resources would have the reverse impact on the gas pipeline – increasing tariffs and decreasing wellhead value and total revenues.
9.2 Impact on government expenditures
9.2.1 Highway maintenance savings
Savings from diversion of highway resupply Although motor fuel tax revenue would decrease slightly if freight were moved by train instead of truck, there is a much more significant potential for savings to the state due to a reduction in highway maintenance costs. With intermodal freight costs estimated to be at least 70 percent lower than trucking costs from Canada and the Lower 48, the ACRL could virtually replace long-haul truck traffic on 337 miles of road in Alaska, including parts of the Richardson Highway, Alaska Highway, Klondike Highway (to Skagway), and Haines Highway.16
We estimate the resulting reduction in highway maintenance costs to average over $1,144,000 per year on the on the Richardson, Alaska, Klondike and Haines Highways, or $22.9 million over a twenty year period.17 The Alaska Highway is responsible for the largest portion of this savings, with its 198-mile length in Alaska. In contrast the Klondike Highway and Haines Highway have only 15 and 30 miles respectively in Alaska. (If significant numbers of bus passengers who now cross between Alaska and the Yukon opt to travel by passenger rail, the highway maintenance savings on these three routes could increase by $100,000 per year.)
Assessing the cost of highway damage due to truck traffic depends on many factors including pavement design, number of highway lanes, and the number, weight, and axle configuration
15 Net present value is calculated using a five percent discount rate for government revenues and a ten percent discount rate for corporate earnings. Pipeline revenues are expressed in 2005 dollars. 16 An even larger savings can be anticipated on the Parks, Glenn, and Seward Highways if 1.6 million tons of containerized freight and truck trailers were diverted from the Port of Anchorage. However, we were unable to obtain data to estimate the impact of the ACRL on reduced truck traffic in Southcentral Alaska. 17 Estimating highway maintenance savings is challenging for a number of reasons. Road conditions and maintenance schedules vary according to road type, traffic volume, and vehicle class/type. The frequency with which roads are maintained is affected by numerous factors including weather and the competition for local, state and national funding. Despite these caveats, we believe this is a conservative estimate of potential savings.
112 Information Insights, Inc.

ACRL SEA Socio-economic Impact Assessment - Alaska
of trucks. The impact of different classes of vehicles on roads is typically measured in terms of Equivalent Single Axle Load (ESAL) and ESAL passes over the road in a given time frame. Heavy trucks are generally considered to cause most of the damage to roads, so much so that in some pavement design methodologies trucks are considered to be the sole cause of pavement deterioration. Pavement damage calculations by the American Association of State Highway and Transportation Officials have shown that one 80,000-pound five-axle truck does the same road damage as 9,600 automobiles. Pavement damage increases exponentially with weight. A 100,000-pound five-axle truck does as much damage as more than 27,000 automobiles.
To come up with a rough estimate of maintenance savings on selected highway routes we assumed an average ESAL of 1.55 per truck and an average highway maintenance cost of $0.13 per ESAL per lane-mile based on estimates provided by Alaska DOT/PF engineer Scott Gartin (personal communication, June 2006). The number of lanes for each highway was also determined with ADOT/PF data (2006a).
Highway maintenance savings calculated for this study are based on removing approximately 107,000 tons of inbound and 104,000 tons of outbound freight per year from the Richardson, Alaska, Klondike and Haines Highways. These volumes represent the weight of the freight only. For each truck trip, an associated gross vehicle weight equal to one and a half to two times the freight weight has been included for the purpose of calculating pavement load.
Our calculations underestimate the total savings to the state from the diversion of highway freight. We expect additional savings will come from the following areas, which were not included in the analysis due to lack of data:
Savings from trucks entering Alaska from Canada are calculated only to Fairbanks. An unknown percentage will continue south on the Parks Highway, but no savings have been calculated for this traffic.
The ACRL will divert up to 1.6 million tons of containerized marine freight, trailers and vans from the Port of Anchorage. Because it is not known how much of this freight remains in Anchorage and how much is trucked to other communities, no savings have been calculated for reduced traffic on the Parks, Glenn and Seward highways related to displaced marine freight flows.
No savings have been estimated for the diversion of trucks bringing outbound freight to the Port of Anchorage.
The diversion of truck traffic from Alaska highways would also extend the life of highway bridges, on ramps and off ramps, resulting in additional savings.
Avoided highway improvement and repair costs related to gas pipeline construction A more significant savings on highway spending due to the ACRL would result from its use in pipeline mobilization. The Information Insights’ Municipal Impact Analysis (2004) conduced for the Alaska Highway gas pipeline project identified an estimated $300 million in highway and port improvements throughout the state that would be required to build the pipeline. Subsequent work by the Alaska DOT/PF indicates those improvements will now cost $400 million prior to construction, and that wear and tear on Alaska’s highways during construction will cost an additional $800 million. If the heavy pipe can be transported by rail, rather than truck, a significant portion of the $1.2 billion in transportation infrastructure costs
Information Insights, Inc. 113

ACRL SEA Socio-economic Impact Assessment - Alaska
can be avoided, resulting in significant savings to North Slope oil producers and the State of Alaska. (The producers and the State have not yet developed a Highway Use Agreement to govern how these costs will be shared.) These road, bridge and port projects have not been included in the estimated cost of the pipeline, but any reduction in the cost of the overall project that results in an increase in the wellhead price of gas will increase state revenues from the pipeline.
114 Information Insights, Inc.

ACRL SEA Socio-economic Impact Assessment - Alaska
10 Works Cited Alaska Department of Commerce and Economic Development, Division of Business
Development (1988, February). The Alaska Railroad update 1988: a report to the Legislature regarding the status of railroad privatization; including a bibliography of publications pertaining to the railroad (1914-1987). Juneau, AK: Author.
Alaska Department of Fish and Game, Division of Subsistence (1984). Subsistence Based Economies. MMS: 14-12-0001-29076. Juneau, AK: Author.
Alaska Department of Natural Resources, Division of Mining, Land & Water, Resource Assessment & Development Section (2002, October 15). Northern Southeast Area Plan. Juneau, AK: Author.
Alaska Department of Natural Resources, Division of Parks and Outdoor Recreation, State Historic Preservation Office (n.d.). Alaska Heritage Resources Survey. Retrieved June 2006, from http://www.dnr.state.ak.us/parks/oha/ahrs/htm
Alaska Department of Public Safety (2005, July 29). Alcohol Beverage Control Board, Schedule of Local Option Communities. Retrieved June 2006, from http://www.dps.state.ak.us/abc/LocalOption.htm
Alaska Department of Revenue Tax Division. (2005). Fiscal Year 2005 Annual Report of Division Operations. Juneau, Alaska: Author.
Alaska Department of Revenue. (2006). Preliminary Findings and Determination As required by the Stranded Gas Development Act For a Contract between the State of Alaska and BP Alaska (Exploration), Inc., ConocoPhillips Alaska, Inc., and ExxonMobil Alaska Production, Inc. Juneau, Alaska: Author.
Alaska Department of Revenue (2006, March 7). State of Alaska: Spring 2006 Revenue Sources Book Preview. Retrieved May 2006, from http://www.tax.state.ak.us/sourcesbook/2006/Spr2006/index.asp
Alaska Department of Transportation & Public Facilities (n.d.). State Transportation Improvement Program 2006-2008 Final STIP. Juneau, AK: Author.
Alaska Department of Transportation & Public Facilities, Interior Region (1982, April update). Alaska Railroad Extension: Route Selection: Project X20089 & R51033: Eielson to Canadian Border. (Revised). Fairbanks, AK: Author.
Alaska Department Of Transportation and Public Facilities, Northern Region (1983). Alaska Railroad Extension Eielson to the Canadian Border. Environmental Assessment. Fairbanks, AK: Author.
Alaska Department of Transportation and Public Facilities. (2006a). Northern Region General Log. Juneau, Alaska: Author.
Alaska Department of Transportation and Public Facilities. (2006b). Southeast Region General Log. Juneau, Alaska: Author.
Alaska Division of Community Advocacy (2006). Community Online Database. Accessed May 2006, from http://www.commerce.state.ak.us/dca/commdb/CF_BLOCK.cfm.
Information Insights, Inc. 115
ACRL SEA Socio-economic Impact Assessment - Alaska
Alaska Division of Geological and Geophysical Surveys (2001, February). East Central Alaska Geologic Resources and Access Corridors. Fairbanks, AK: Author.
Alaska Highway Pipeline (1977). Interim Report of the Environmental Assessment Panel to the Honourable Romeo Leblanc, Minister of Fisheries and the Environment. Retrieved May 2006, from www.epe.lac-bac.gc.ca/100/200/301/ceaa-acee/alaska_hwy_interim-e/AHPIPE1E.PDF
Alaska Minerals Commission. (2005). Report of the 2005 Alaska Minerals Commission. Retrieved June 21, 2006 from http://www.dced.state.ak.us/oed/minerals/pub/web05.pdf.
Alaska Oil and Gas Conservation Commission (2004, August through 2006, February). Drilling Data Index, Monthly Drilling Reports. Juneau, AK: Author.
Alaska Railroad Corporation (1987, November 24). Alaska Railroad Corporation Legislative Briefing, (Vol. 1 chart). Anchorage, AK: Author.
Alaska Railroad Transfer Advisory Commission (1983, April). Interim report ( 3, iii, pp. 760-761). Juneau, AK: Author.
Asian Development Bank (2000, July). Report and Recommendation of the President to the Board of Directors on a Proposed Loan to the People’s Republic of China for the Hefei-Xi’an Railway Project. Metro Manila, Philippines: Ministry of Railways, People’s Republic of China.
Asian Development Bank (2002). Technical Assistance to the People's Republic of China for Preparing the Yichang-Wanzhou Railway Project. Metro Manila, Philippines: Author.
Association of American Railroads. (2006). Railroad Fuel Efficiency and the Environment. [Powerpoint presentation]. Washington, DC: Author.
Baker, M. M. (2001, November 23). The Al-Can Rail Corridor: Infrastructure Development. The Schiller Institute, Retrieved May 2006, from http://www.schillerinstitute.org/economy/phys_econ/al-can_eir_nov23_01.html
Bass, R.E. & Iherson, A. (1993). Mastering NEPA: a Step-by-Step Approach. Solano Press.
Beardsley, D. (2004). Law of Easements In Alaska: Legal Issues and Practical Considerations. Eau Claire, WI: Author.
Berkowitz, R. (2005, December 6). Statement of Richard Berkowiz, Director, Pacific Coast Operations of the Transportation Institute. U.S. Senate Foreign Relations Subcommittee of East Asia and the Pacific U.S. Senate.
Bowers, P. M., & Potter, B. A. (2006, May). An Overview of Cultural Resources Requirements for the Proposed Alaska Railroad Extension, Delta Junction to the Canadian Border. Northern Land Use Research, Inc., unpublished report. Fairbanks, AK: Northern Land Use Research, Inc.
Canalog Logistics Ltd., Canadian Pacific Consulting Services Ltd. (1975, September). Yukon Railway Study: Working Paper Number 1 (Final Version) Rail Construction and Maintenance. Retrieved May 2006, from http://www.repjames.org/index2.htm.
116 Information Insights, Inc.

ACRL SEA Socio-economic Impact Assessment - Alaska
Charles River Associates for Yukon Economic Development (2005, February). Proposed Alaska-Canada Rail Link: A Review of Potential Benefits. Retrieved May 2006, from www.economicdevelopment.gov.yk.ca/documents/AlasCanRailLinkFinalRep.pdf
Clifford, H. (1981). Rails North, The Railroads of Alaska and the Yukon. Washington: Superior Publishing Company.
Clinton, President B. (1996, May 24). Executive Order No. 13007: Indian Sacred Sites. Retrieved June 2006, from http://www.achp.gov/EO13007.html
Commonwealth North (1988, April). The Alaska Railroad and its future. Anchorage, AK: Author.
Cooper, Jr., H. B., PhD PE & Trueblood, T. B., PE (2000, January 20). Proceedings of Alaska-Canada Rail Link Conference ’00: Market Development Potential for the Commodity Cargo Transport between Alaska, Canada and the Northern Tier. Kirkland, WA.
Cox, V.R., & McIntyre, A.G., (1969, June). Yukon Railway Feasibility Report: Final Reconnaissance Report. Office of Engineer of Location & Construction, Canadian National Railway Company. Retrieved May 2006, from http://www.repjames.org/index2.htm.
Dakota, Minnesota & Eastern Railroad Corporation (2005, December 30). Final Supplemental Environmental Impact Statement: Powder River Basin Expansion Project. Retrieved May 2006, from http://www.stb.dot.gov/decisions/readingroom.nsf/WebDecisionID/ 20743?OpenDocument
Dalal-Clayton, B., & Sadler, B. (2005). Strategic Environmental Assessment: A Sourcebook and Reference Guide to International Experience. International Institute for Environment and Development. London, England: Earthscan.
Dean, D. (2006). Alaska Highway Natural Gas Pipeline Freight Volumes [Powerpoint presentation]. Retrieved from the Gartner Lee GeoPortal website, May 2006, restricted access.
Delta Junction, City of (2006, May). City of Delta Junction, Alaska. Retrieved May 12, 2006, from http://www.ci.delta-junction.ak.us/
DKA Marketing, & Banjar Management Inc. (2006, January). Alaska-Canada Rail Link Study: Multimodel Port Access Work Package B2(d) Operations Evaluation. Toronto, Ontario: author.
Earlywarning Online Magazine (2005, June 7). Shipping Bottleneck: The Port Problem. Retrieved May 2006, from www.earlywarning.com/articles/2005_06_07_shipping_bottleneck
Energy Information Administration (2002, February). The Effects of the Alaska Oil and Natural Gas Provisions of H.R.4 and S.1766 on U.S. Energy Markets. Washington, DC: Department of Energy.
Information Insights, Inc. 117

ACRL SEA Socio-economic Impact Assessment - Alaska
Farnum, J., Hall, T., & Kruger, L. (2005, November). Sense of Place in Natural Resource Recreation and Tourism: An Evaluation and Assessment of Research Findings. Portland, OR: U.S. Department of Agriculture Pacific Northwest Research Station.
Fay, G. (2003). Where the Rubber Meets the Road: Annual Road Maintenance Costs. Anchorage, Alaska: Author.
Federal Highway Administration, Office of Freight Management & Operation (1990-2005). Expenses per Mile for the Motor Carrier Industry: 1990 through 2000 and Forecasts through 2005. Retrieved May 2006, from http://ops.fhwa.dot.gov/freight/documents/bts.pdf
Federal Highway Administration (n.d.). Official NHS Inter-modal Connector Listing: Alaska. Retrieved May 2006, from www.fhwa.dot.gov/hep10/nhs/intermodalconnectors/alaska.html
Fitch, E. M. (1967). The Alaska Railroad. New York, NY: Frederic A. Praeger, Publishers.
Frampton, G.T. Jr., (1999, July 28). Designation of Non-Federal Agencies to Be cooperating Agencies in implementing the Procedural Requirements of the National Environmental Policy Act. Memorandum. Washington, DC: Executive Office of the President, Council on Environmental Quality.
Gimbel, B. (2006, March 16). What It Takes to Build a (21st Century) Railroad. Retrieved May 2006, from http://www.CNNMoney.com
Goldsmith, S. (2005, September 30). Economic Projections for Alaska and the Southern Railbelt: 2005-2030. Institute for Social and Economic Research, Anchorage: AK.
Gray, J.T. & Bivens, J.A. Jr. (1981, July). An Assessment of the Alaska Railroad: Ownership and Operational Alternatives. Juneau, AK: Alaska Department of Transportation and Public Facilities, Southeast Region, Division of Planning and Programming.
Hadland, J., & Cannon, J. (2004). Ten-year industry forecast. Alaska Economic Trends, 24(9), 3-6.
HDR Engineering, Inc., & TEC Infrastructure, Inc. (2006, March 28). Alaska-Canada Rail Link Feasibility Study: Southern Yukon and Port of Skagway Analysis. Chicago, Illinois: Author.
Hedlin, Menzies & Associates, Ltd. (n.d.). The Canadian Northwest Transportation Study. Ministry of Transport, Government of Canada Printing Office.
IFC Consulting and HLB Decision-Economics (2002, January). Economic Effects of Transportation: The Freight Story (Final Report). Retrieved May 2006, from http://www.icfi.com/Publications/transportation.asp.
Information Insights, Inc. (2006a, May). Economic, Fiscal and Workforce Impacts of Alaska Natural Gas Projects. Fairbanks, Alaska: Author.
Information Insights, Inc. (2006b, May). Economic, Fiscal and Workforce Impacts of Alaska Natural Gas Projects: 4.5bcf AlCan PPT Model. [Excel spreadsheet]. Fairbanks, Alaska: Author.
118 Information Insights, Inc.

ACRL SEA Socio-economic Impact Assessment - Alaska
Information Insights, Inc. (2004, November 8). Stranded Gas Development Act: Municipal Impact Analysis. Fairbanks, AK: Author.
Information Insights, Inc., & McDowell Group (1999, February 1). Economic Impact of the Fort Knox Mine on the Fairbanks North Star Borough. Fairbanks and Juneau, Alaska: Author.
Informetrica Limited (2002, May). Ancillary Spending: Working Paper No. 3.2.1 from Yukon Papers for the Alaska Highway Gasline Project (May 2002). Ottawa, Ontario, Canada: Author.
Informetrica Limited (2006, May). The Direct Effects of the ACRL: Literature and Data Review (Work Package D1c – Economic Impacts Assessment). Ottawa, Ontario, Canada: Author.
Institute of Social and Economic Research (2005, March). Alaska Railroad Pulls Jobs and Income into State Economy. Research Summary No. 63. Anchorage, Alaska: University of Alaska Anchorage.
James, J. (2001, September 24). Report of the office of Republican Jeannette James on a railroad/transportation-utility corridor to connect Alaska with the rest of North America: EIS, route, economic, additional reports. (Third printing). Juneau, AK: Author.
K Slack Associates, Inc.(1999, November 4). Impact of the Transportation Industry on the Manufacturing Sector in Alaska. The Alaska Human Resource Investment Council. Palmer, AK: Author.
Karl, H. A. & Turner, C., (2002). A Model Project for Exploring the Role of Sustainability Science in a Citizen-Centered, Collaborative Decision-Making Process. Human Ecology Review, 9(1).
Kellogg, J. E. (1975). The impact of the railroad upon a frontier region: the case of Alaska and the Yukon. (Thesis, Indiana State University, 1975). Ann Arbor, MI: University Microfilms, 1982. 22 cm.
Koumal, G. (Ed.). (2001, November). Proceedings of VGSPC ’01:Unifying Four Continents: A Modern Railroad Linking the World Through the Bering Strait, Virtual Global Super Projects Conference. Norcross, GA: World Development Federation.
Larry Orsini Associates (1980, December 10). Feasibility Study, Proposed Extension of the Alaska Railroad from Eielson AFB to the Canadian border. Juneau, AK: Alaska Department of Legislative Affairs.
Liles, P. (2006, July). Mining Industry May Top $2 Billion in Exploration and Development. Alaska Business Monthly, 20-24.
Lockheed Martin Space Operations (2006a, May). Alaska Canada Rail Link Feasibility Study, Phase I: Market Analysis of Supply and Demand for Current and Future North Slope Oil and Gas Activity. Anchorage, Alaska: Author.
Lockheed Martin Space Operations (2006b, June). Potential market development risk reductions made possible by rail service between Fairbanks, AK and continuous North American rail system. Anchorage, Alaska: Author.
Information Insights, Inc. 119

ACRL SEA Socio-economic Impact Assessment - Alaska
Lonner, T.D. (1980, November 3). Subsistence as an Economic System in Alaska: Theoretical and Policy Implications. Technical Paper Number 67. Retrieved June 2006, from http://www.subsistence.adfg.state.ak.us/TechPap/tp067.pdf
Lumos and Associates, & Brinkeroff, P. (2004, May). Yucca Mountain Rail Corridor Impact Study. Retrieved May 2006, from http://www.yuccamountain.org/railstudy.htm
Joint Review Panel for the Mackenzie Gas Project, Proceedings (2006, March 16). Mackenzie Gas Project, Volume 11. Retrieved May 2006, from www.ngps.nt.ca/documents/06/0316_TSCRPT_Vol_11.PDF
Marine Exchange Alaska (n.d.) Southcentral and Southeast port information retrieved May 2006, from http://www.mxak.org/
Matanuska-Susitna Borough (n.d.). Port MacKenzie. Retrieved May 26, 2006, from http://www.matsugov.us/port/index.cfm
McDowell Group, Inc. (2006). The Economic Impacts of Alaska’s Mining Industry. Juneau, Alaska: Author.
Ministry of Railways (2006, February). Summary Environmental Impact Assessment: Taiyuan-Zhongwei Railway Project. Metro Manila, Philippines: Asian Development Bank.
Ministry of Railways (2005, April). Summary of Environmental Impact Assessment: Zhengzhou-Xi’an Railway Project in the People’s Republic of China. Metro Manila, Philippines: Asian Development Bank.
Ministry of Railways (2004, July). Summary of Environmental Impact Assessment: Dali-Lijiang Railway Project in the People’s Republic of China. Metro Manila, Philippines: Asian Development Bank.
Ministry of Railways (1996, October). Summary Environmental Impact Assessment of the Shenmu-Yanan Railway Project in the People’s Republic of China. Metro Manila, Philippines: Asian Development Bank.
National Mining Association (n.d.). Mining in the United States. Retrieved July 14, 2006, from http://www.nma.org/pdf/states_03/us2003.pdf
National Park Service (1979). Denali National Park and Preserve: North Access Feasibility Study. Retrieved June 2006, from http://www.nps.gov/dena/home/planning/study/nafs/summary.html
National Resources Planning Board (1942, October 2). Certain Economic Factors Relating to the Location, Construction and Future Usefulness of the Trans Canada Alaska Railroad. Retrieved May 2006, from http://www.repjames.org/index2.htm
Nederveen, A.A.J. (1997-2001). Social Aspects and Citizen Participation in Decision Making of Road and Railroad Planning (Doctoral dissertation, Delft University of Technology, 2001).
Northern Land Use Research, Inc. (2004). Subsistence Issues and Impacts: Upper Tanana Community Profiles, Interim Draft Report. Fairbanks, AK: Author.
120 Information Insights, Inc.
ACRL SEA Socio-economic Impact Assessment - Alaska
Parker, James (2001). Fishery management report for sport fisheries in the upper Tanana River drainage in 1999 and 2000. Juneau, AK: Alaska Fish and Game, Division of Sport Fish, Research and Technical Services.
Parsons & Associates, Inc. (2000, June). Tanana Forestry Lands: Periodic Sustained Yield Analysis. Fairbanks, AK: Author.
Peapples, Paige (2004). Summary of coalbed methane studies, Delta Junction area, Alaska. Juneau, AK: Alaska Natural Resources, Division of Geological & Geophysical Surveys.
Potter, B. A., Bowers, P. M., Wooley, C. B., Reuther, J. D., Farmen, K. W., & McIntosh, S. J. (2001). Cultural Resources Data Assessment for the North American Natural Gas Pipeline Project Area. Confidential report prepared for B.P. Exploration, Alaska, Inc. Fairbanks, AK: Northern Land Use Research, Inc.
Potter, B. A., et al. (2002). Results of the 2001 Phase I Cultural Resources Survey of the Proposed Alaska Gas Pipeline Project Area, Southern Route. Confidential report prepared for Alaska Gas Producers Pipeline Team. Fairbanks, AK: Northern Land Use Research, Inc., and Chumis Cultural Resource Services, Anchorage.
PROLOG Canada Inc. (2003, January). Arctic Gas Pipeline Construction Impacts on Northern Transportation. Calgary, Alberta, Canada: Author.
QGI Consulting. (n.d.). Alaska Canada Rail Link Traffic Data Development for Regional Re-supply (Alaska) (Work Package: A-1 (A)). Edmonton, Alberta: Author.
QGI Consulting. (2006a, March 4). Alaska Canada Rail Link Traffic Data Development for Regional Re-supply (Alaska) (Work Package: A-1 (A)). Edmonton, Alberta: Author.
QGI Consulting. (2006b, March 17). Alaska Canada Rail Link Logistics for Regional Re-supply (Work Package: A-1 (D). Edmonton, Alberta: Author.
QGI Consulting. (2006c, March). Traffic Analysis (WP1dTrafficAnalysis.xls). [Excel spreadsheet]. Edmonton, Alberta: Author.
Robinson, D., Fried, N., Gilbertsen, N., & Windisch-Cole, B. (2006a). The Year 2005 in Review. Alaska Economic Trends, 26(4), 4-19.
Robinson, D., Fried, N., Gilbertsen, N., & Windisch-Cole, B. (2006b). Employment Projections for 2006 and 2007. Alaska Economic Trends, 26(5), 4-22.
Sahr, R.S. (n.d.). Consumer Price Index (CPI) Conversion Factors 1800 to Estimated 2016 [Excel spreadsheets]. Retrieved June 2006, from http://oregonstate.edu/Dept/pol_sci/fac/sahr/cv1997.xls and http://oregonstate.edu/Dept/pol_sci/fac/sahr/cv2003.xls
Skagway, City of (1999). Skagway Community Comprehensive Plan. Retrieved May 10, 2006, from http://www.skagway.org/index.asp?Type=B_BASIC&SEC={D2A1F511-7994-49C3-AC28-ABB050A06D6A}
Southerlin, S. (2006, June). Mining News: Yukon Exploration Spending Up 141 Percent. Retrieved June 28, 2006 from http://www.petroleumnews.com.
Suzuki, D. & Knudtson, P. (1992). Wisdom of the Elders. Honoring Sacred Native Visions of Nature. New York, NY: Bantam Books.
Information Insights, Inc. 121
ACRL SEA Socio-economic Impact Assessment - Alaska
Szumigala, D.J. & Hughes, R.A. (2006, May). Alaska’s Mineral Industry 2005: A Summary. Information Circular 52, Division of Geological & Geophysical Surveys. Retrieved July 14, 2006 from http://www.dced.state.ak.us/oed/minerals/pub/IC52.pdf
Taylor, M. (2002). White Pass Standard Gauge Conversion. Fairbanks, AK: University of Alaska Fairbanks.
TransCanada (2004, June 1). Application of TransCanada Corporation and Alaskan Northwest Natural Gas Transportation Company. Calgary, Alberta, Canada: Author.
Transport Canada (2001, August 2). Issues Identification Report on the Canada-Alaska Rail Link, Final Report. Retrieved May 2006, from http://www.tc.gc.ca/.
Tuck, B. & Killorin, M. (2004, December). Economic Significance of Alaska Railroad. Retrieved May 2006, from http://www.iser.uaa.alaska.edu/Publications/RR02%5F05.pdf.
U.S. Census Bureau (2000). Census Data, State of Alaska. Retrieved May 2006, from http://www.census.gov/
U.S. Congress & Senate Committee on Commerce, Science, and Transportation (1982). Alaska Railroad Transfer Act: Report (p. 35). Washington, DC: U.S. Government Printing Office.
U.S. Department of Agriculture (n.d.). General Technical Report PNW-GTR-653. 2005. Forest Service Social Conditions and Trends in Southeast Alaska. Washington, DC: U.S. Government Printing Office.
U.S. Department of Agriculture (2003, November). Report on Geographically Disadvantaged Farmers and Ranchers: Transportation Issues Affecting Farmers and Ranchers in Non-Contiguous U.S. States and Territories. Washington, DC: U.S. Government Printing Office.
U.S. Department of Environmental Protection Agency (2002). Community Culture and the Environment: A Guide to Understanding a Sense of Place, United States. Washington, DC: U.S. Government Printing Office.
U.S. Department of Environmental Protection Agency, National Environmental Policy Act (1981, March 23) amended (1986, April 25). Source 46 Federal Register 18026, 51 Federal Register 15618. Council on Environmental Quality’s Regulations for Implementing the Procedural Provisions of the National Environmental Policy Act., 40 CFR Parts 1500-1508. Washington, DC: U.S. Government Printing Office.
U.S. Department of Fish & Wildlife Services (1993, August). Tetlin National Wildlife Refuge Public Use Management Plan Draft. Washington, DC: U.S. Government Printing Office.
U.S. Department of Interior (1999, November). Proposed Expansion of the Alaska Railroad Depot Denali. Washington, DC: U.S. Government Printing Office.
U.S. Department of Labor Bureau of Labor Statistics. (2005). Relative Importance of components in the Consumer Price Indexes: Selected metropolitan areas, December 2005, Washington, DC: US Government Printing Office.
122 Information Insights, Inc.

ACRL SEA Socio-economic Impact Assessment - Alaska
U.S. Department of Transportation, Bureau of Transportation Statistics (2005, December). State Transportation Statistics 2005. Washington, DC: U.S. Government Printing Office.
U.S. Department of Transportation, Bureau of Transportation Statistics (2002). Individual State-to-State Flows Merchandise Trade from Alberta to U.S. State Destination by All Surface Modes. Washington, DC: Government Printing Office.
U.S. Department of Transportation, Bureau of Transportation Statistics (2000). Alaska Transportation Profile. Washington, DC: U.S. Government Printing Office.
U.S. Department of Transportation, Bureau of Transportation Statistics (1996, October). Freight Transportation in Alaska: Selected Data from Federal Sources. Washington, DC: U.S. Government Printing Office.
U.S. Department of Transportation, Federal Highway Administration, Office of Freight Management and Operations (2005). Freight Facts and Figures 2005. Washington, DC: U.S. Government Printing Office.
U.S. Department of Transportation, Federal Highway Administration, Office of Freight Management and Operations (2002, November). Freight Shipments To, From, and Within Alaska. Retrieved May 2006, from http://www.ops.fhwa.dot.gov/freight
U.S. Department of Transportation, Federal Highway Administration, Office of Freight Management and Operations (n.d.). Freight Carriers: From Modal Fragmentation to Coordinated Logistics. Washington, DC: U.S. Government Printing Office.
U. S. Department of Transportation, Federal Highway Administration (2002). Freight Transportation: Improvements and the Economy. Washington, DC: U.S. Government Printing Office.
U.S. Department of Transportation, Federal Highway Administration (2002). Status of the Nation’s Highways, Bridges and Transit: 2002 Conditions and Performance Report. Washington, DC: U.S. Government Printing Office.
U.S. Department of Transportation & State of Alaska (1983, July 14). Alaska Railroad Transfer Report (V. 1, various pages). Alaska: State of Alaska Printing Office.
U. S. Engineer Office, War Department (1942, May 15). Aerial Reconnaissance of Trans-Canada Alaska Rail Route. Retrieved May 2006, from http://www.repjames.org/index2.htm
U.S. Geological Survey (2002). U.S. Geological Survey 2002 Petroleum Resource Assessment of the National Petroleum Reserve in Alaska (NPRA) USGS Fact Sheet. Retrieved May 2006, from http://geopubs.wr.usgs.gov/fact-sheet/fs045-02/
University of Alaska-Anchorage, Arctic Environmental Information and Data Center (1990). Alaskan OTH-B radar system (ARS) environmental handbook: an introduction to the Gulkana and Tok project areas and concerns and rules for their protection. Anchorage, AK: University Printing Office.
University of Alaska-Anchorage, Institute of Social and Economic Research (2004, December). Economic Significance of Alaska Railroad. Anchorage, AK: University Printing Office.
Information Insights, Inc. 123

ACRL SEA Socio-economic Impact Assessment - Alaska
University of Alaska-Fairbanks (n.d.). GINA GIS system; Native allotment maps & other geographic data. Retrieved May 2006, from www.gina.alaska.edu
Virgin, B. (2006, February 16). Alaska No longer Needs Seattle as Its Big Brother. Seattle Post-Intelligencer. Retrieved May 2006, from www.seattlepi.nwsource.com/virgin/259665_virgin16.html
Walt, R. (1977). Alaska-Canada Transcontinental Rail Connection to Contiguous United States, A Preliminary Study. Juneau, AK: Alaska Department of Commerce and Economic Development.
Washington State Department of Transportation (2004, October). Washington Transportation Plan: Moving Freight. Retrieved May 2006, from http://www.wsdot.wa.gov/planning/wtp/documents/Freight.htm
White Face, C. (2000, October 28). The DM&E Railroad’s Impact on the Great Sioux Nation. Special Report to the Lakota Nation Journal. Retrieved May 2006, from http://www.thepeoplespaths.net/News2000/1000/WhiteFace001028DMEimpact.htm
Wilbur Smith Associates (2002). Kentucky Statewide Rail Plan. Retrieved May 2006, from http://transportation.ky.gov/planning/modal_programs/rail.asp
Williams, G. (2005). Population projections. Alaska Economic Trends, 25(2), 4-14.
Williams, M. (2006, March 7). Testimony before the Senate Finance Committee, March 7, 2006. Juneau, AK. Wisniewski, J. (2003). Understanding the Effects of FAA Field Stations on Rural Alaska:
Perspectives from Employees and Communities. Washington, DC: U.S. Government Printing Office.
Wood, D.S. & Gruenewald, P.J. (2006, March). Local Alcohol Prohibition, Police Presence and Serious Injury in Isolated Alaska Native Villages. Retrieved June 2006, from http://justice.uaa.alaska.edu/research/articles/0426dsw-localalcohol.html
Yukon Economic Development (2004, January 30). A New Direction: Building a Sustainable and Competitive Yukon Economy. Whitehorse, Yukon, Canada: Author.
124 Information Insights, Inc.

ACRL SEA Socio-economic Impact Assessment - Alaska
Appendix: Land Status in the ACRL Corridor, Alaska A 36 by 48 inch map showing land status in the ACRL corridor in Alaska is available as a separate PDF file.
Information Insights, Inc. 125