alaska regional ports - alaska district, u.s. army corps ... › portals › 34 › docs... ·...
TRANSCRIPT

Wisdom • Trust • Relevance • Innovation
Alaska Regional Ports
Planning for Alaska’s
Regional Ports and HarborsFinal Report
Prepared for the
U.S. Army Corps of Engineers
and
Alaska Department of Transportation
and Public Facilities
January 2011
Under Contract to
URS Corporation


Planning for Alaska’s Regional Ports and
Harbors
Final Prepared for
U.S. Army Corps of Engineers Alaska District and
Alaska Department of Transportation and Public
Facilities
January 2011
Prepared by
Under contract to URS Corporation

Preparers
Team Member Project RolePat Burden Project DirectorMichael Fisher Project ManagerAlexus Bond Principal AuthorTerri McCoy Editor
Please cite as: Northern Economics, Inc. Planning for Alaska’s Regional Ports and Harbors. Prepared for U.S. Army Corps of Engineers Alaska District and Alaska Department of Transportation and Public Facilities. January 2011.

Final 1
The Call to Action
In 2008 the first Alaska Regional Ports Conference convened to discuss issues faced by Alaska’s ports and harbors. Local, state, and federal government officials discussed infrastructure and service needs with statewide port and harbor managers, staff, and users.
The overwhelming mandate from this group was the need for ongoing collaboration, comprehensive planning, and leadership to meet Alaska’s future needs.
To achieve this goal, the U.S. Army Corps of Engineers (USACE) and Alaska Department of Transportation and Public Facilities (ADOT&PF) championed a multi-staged research effort to lay the groundwork for developing a statewide port and harbor plan. This report is the summary of that independent research and analysis, and incorporates feedback from the 2010 Regional Ports Conference attendees and conceptual revisions and suggestions made by USACE, ADOT&PF, and the Denali Commission.
Challenges Facing Alaska’s Marine and Riverine Infrastructure
Port and harbor maintenance and development are impeded by several challenges, among them:
� High construction costs and intense competition for limited statewide funding
� Pressure from global trends in shipping and maritime transportation
� Rural population centers with a lack of existing infrastructure due largely to geographic and seasonal constraints and small populations and financial bases
� Poor communication among stakeholders; poor alignment of agency policies and priorities
� The absence of a long-term marine and riverine transportation plan
Addressing these challenges requires an understanding of both the existing transportation network and of the policies that influence the agencies within the port and harbor realm. The following synopsis and the analyses attached provide this understanding and outline the steps toward development of a statewide port and harbor plan.
Document Organization
The following sections collectively paint a picture of Alaska’s current and anticipated port and harbor needs. The summary concludes with a suggested path forward for leadership in USACE, ADOT&PF, and other maritime stakeholders to face the challenges outlined above.
Section 1: Global trends and the Alaskan transportation network
Section 2: Baseline assessment of Alaskan ports and harbors
Section 3: Regional and subregional hubs: the marine and riverine infrastructure most influential in supporting outlying communities
Section 4: Proposed policies, strategies and actions: stakeholders overcoming obstacles
Section 5: Project prioritization: the project list and criteria
An appendix contains four reports that were prepared as interim deliverables for the project.

Planning for Alaska’s Regional Ports and Harbors
2 Final
1 Global Trends and the Alaska Transportation Network
Alaska’s unique characteristics include a resource-based economy, geographic remoteness, limited transportation infrastructure, and harsh weather conditions. Given these characteristics, transportation infrastructure has the crucial role of supporting resource development in the state and of safely transporting people, resources, and goods to markets. In the following subsections we discuss the future demands on Alaska ports and harbors that result from the intersection between the state’s distinctive characteristics and the trends taking place worldwide. The results of this analysis should be considered in the development of a long-range ports and harbors plan.
Port Privatization and Global Terminal Operators: Privatization and public/private partnerships are on the rise around the world. Similar trends may emerge in Alaska. For example, leasing part or all of a facility to a major terminal operator could be one alternative for completing a project.
Shipping Routes and Transshipment Hubs: Alaska sits astride the North Pacific great circle route, which is the most economic pathway for commerce between northern ports of the west coast of North America to ports in eastern Asia. In the future, one or more ports in western Alaska could become transshipment points for vessels transiting the North Pacific great circle route with cargo destined for potential new Arctic Ocean routes. Examples include the Northern Sea Route and Northwest Passage, which could become useable navigation routes in the next 40 to 50 years due to Arctic sea ice melt.
Alaska Resupply Cargo: Resupply cargo consists of freight and goods shipped into Alaska to supply the needs of in-state businesses and population. Since Alaska has a very small manufacturing sector, virtually all producer and consumer goods must be imported. Though the Port of Anchorage is unlikely to become a major transshipment container terminal for non-Alaska bound cargo, it will likely see an increase in inbound containers to meet the needs of a growing population and increased economic activity.
Intermodal Transportation: Levels of intermodal connectivity vary widely in Alaska. In many communities, the absence of one or more types of connectivity can be offset by the remaining modes providing enhanced service and facilities. Recognizing this situation is vital when developing comprehensive transportation planning documents.
Fuel Efficiency: Shipping lines worldwide struggled as crude oil prices reached unprecedented highs in 2008. Fuel costs represent as much as 50 to 60 percent of a ship’s total operating costs. The prospect of rising fuel costs and fuel shortages has underscored the importance of using the most fuel efficient modes of transport. Maritime transportation is generally considered the most energy efficient of all transport modes in terms of distance traveled per unit of energy consumed.
Shipping companies can undertake several actions to reduce fuel cost and maintain their margins, including reducing speed, seeking shorter routes and limiting the number of tug and barge trips to small remote villages to one per year rather than two per year. In Alaska communities, this last step could require provision or construction of additional fuel storage.
Port and Harbor Infrastructure and Increasing Vessel Size: Containerization, transshipment, and larger vessels have placed new demands on port facilities and services. New demand for improvements in Alaskan port facilities may involve a variety of infrastructure investments, such as increasing the depth

Planning for Alaska’s Regional Ports and Harbors
Final 3
of water in entrance channels and alongside berths, extending and supporting existing harbors, providing breakwaters, and better cargo handling equipment and storage facilities, among others.
One issue with funding port infrastructure improvements will be ensuring that benefits from investing public dollars are not captured solely by private industry but are shared with residents of the region.
Facility Expansion and Dredging: Dredging is critical to a number of ports in Alaska, needed on a regular basis to maintain access to existing facilities that would otherwise be impeded by shallow water or build-up of sediment.
Dredging needs will increase as shipping companies employ larger ships that require deeper water or a larger space for maneuvering or docking. Proper port and harbor design can help minimize the amount of dredging. Increases in the number of recreational vessels as well as changes in the size of commercial fishing fleets may require new or expanded harbors. Modular design concepts that could be used in multiple locations around the state might be developed to reduce engineering and construction costs. Expansion plans should be tempered with a realistic assessment of infrastructure needs in each region to avoid under-utilization of maritime infrastructure.
Industry Development: More than any other mode, maritime transportation is linked to the primary industries that are the foundation of Alaska’s economy, including oil and gas, commercial fishing, mining, and cruise ship/tourism industries. The main advantage of maritime transportation is its economies of scale, making it the cheapest per unit of all transportation modes for long distances, and a good fit for Alaska’s heavy industrial activities.
If commercial discoveries of oil and gas occur in the Chukchi or Beaufort Seas, vessel traffic in these waters and in the Bering Sea will increase significantly. Supply vessels for offshore platforms will need to be built with ice-breaking capabilities so they can operate year-round.
Harbors of Refuge and Emergency Response: Ports and harbors play an important role in maritime safety and pollution prevention. The lack of places of refuge and emergency response resources on Alaska’s North Slope and northwest regions may become a particular area of concern if the anticipated increase in the number of freighters, cruise ships, oil and gas tankers, dry bulk cargo vessels, and resupply barges passing through the Bering Strait and plying the waters of the Arctic Ocean occurs.
In coming years, the provision of Arctic port facilities or harbors suitable for refuge for medium to deep draft vessels may become both a national and international imperative. National defense and emergency response needs may result in ports being developed even though the benefits may be limited due to small resident populations, seasonality, and modest levels of vessel traffic.
2 Baseline Assessment of Alaska’s Ports and Harbors
In order to understand how the aforementioned trends will affect Alaska’s individual ports and harbors, we needed to assess the current status of infrastructure in the state’s various regions and communities. This section summarizes the major regional themes that resulted from this work. These points were chosen both to take a snapshot of Alaska ports and harbors and to highlight the differences in the regional characteristics of the state.
Ports are areas where ships are brought alongside land to load and discharge cargo. Harbors are natural or manmade places in which vessels may find shelter, load or unload passengers or goods, or obtain fuel, water, or supplies. There are significant differences between ports and harbors in terms of

Planning for Alaska’s Regional Ports and Harbors
4 Final
scale, users, financing, and administration. Ports often have a broader, statewide significance and require economic capital and strategic investment, while state support for harbors traditionally means empowering local governments with the tools needed to take care of their own local needs, along with financial and administrative support. Whereas ports form logistical networks, harbors are less connected and are traditionally located in proximity to either population or seafood resource bases.
Regional Analysis Findings
� In remote areas, one port facility often serves as a regional hub for distribution to several smaller communities.
� Many Alaskan communities with publicly owned port and harbor infrastructure run their facilities as enterprise funds. Enterprise funds are business-like entities expected to support their operations through charges levied for services. The majority of enterprise funds reviewed in this study included their depreciation expense as part of their operating costs; in almost all cases, the burden of depreciation outweighed revenues, resulting in operational losses for port and harbor facilities.
� Though individual ports and harbors show operating losses after depreciation, they may provide substantial financial gains in the form of employment, tax revenue, and other income for their communities.
� Waterways are vitally important to the state. Most communities depend heavily on water transportation for the movement of general cargo, building materials, and petroleum. These regions also see high volumes of outgoing commodities. Seafood (Southeast and Southwest), crude oil (Prince William Sound), ore (Northwest), and ore and timber (Southeast) are exported both abroad and to the Lower 48 via barge and vessel.
� In the Southeast and Southwest regions, most communities are on islands, limiting road access to outside communities. The story is similar in the Arctic; the geography of the region and the high cost of building roads to small communities limit road construction.
� Almost half of the communities in the Northwest, the Yukon-Kuskokwim, and the Interior regions lack a road connection to another community, reflecting the fact that these regions have a limited amount of road and rail infrastructure.
� The Alaska Marine Highway System provides service to the Southeast, Prince William Sound, Southcentral, and Southwest regions. Residents depend on the state ferry system for both personal and cargo transportation.
� Communities in the Northwest, Yukon-Kuskokwim, and Interior have a smaller percentage of port and harbor facilities than other regions. Many communities in these areas rely on summer barge service and tend to have small populations. The brief operating period during ice-free months, small number of residents, and high construction costs hinder the development of ports and harbors.
In addition to contributing to the baseline assessment of the state’s port and harbor infrastructure, the survey results also provided the foundation for a first draft of the statewide ports and harbors project list, discussed further in Section 5.

Planning for Alaska’s Regional Ports and Harbors
Final 5
3 Identification of Regional Port Hubs
This section summarizes criteria for identifying regional and subregional hubs, and presents a preliminary list of hubs in each of the eight regions used in the Alaska Regional Ports project.
Hub Criteria
The primary criterion for hub status is the maritime industry’s use of the port as a hub. We developed other criteria as well, including whether a port handles fuel and cargo for the region (rather than just the local community), the presence of major cargo generating industries, the degree of infrastructure development, and the presence of an administrative structure for port operations. While the distinction between regional and subregional hubs is relative to the region under consideration, these criteria can be used to identify where each port falls on a spectrum.
For this study, we have defined two tiers of hubs: regional and subregional. Regional hubs represent the primary ports of entry for goods moving into or out of the state and region. Shipments into regional hubs tend to include a significant quantity of goods that are to be distributed elsewhere within the region or state, and shipments from regional hubs tend to be consolidated from multiple locations. Each region has at least one regional hub and some have more than one, based on the networks used for transportation of different types of goods.
Subregional hubs represent smaller ports of entry that tend to receive shipments from the regional hubs and distribute goods elsewhere in the region. Generally, subregional hubs do not directly send or receive goods from outside the state, though they can be used as staging areas for consolidation of intra-regional shipments.
3.1 Preliminary List of Regional and Subregional Hubs
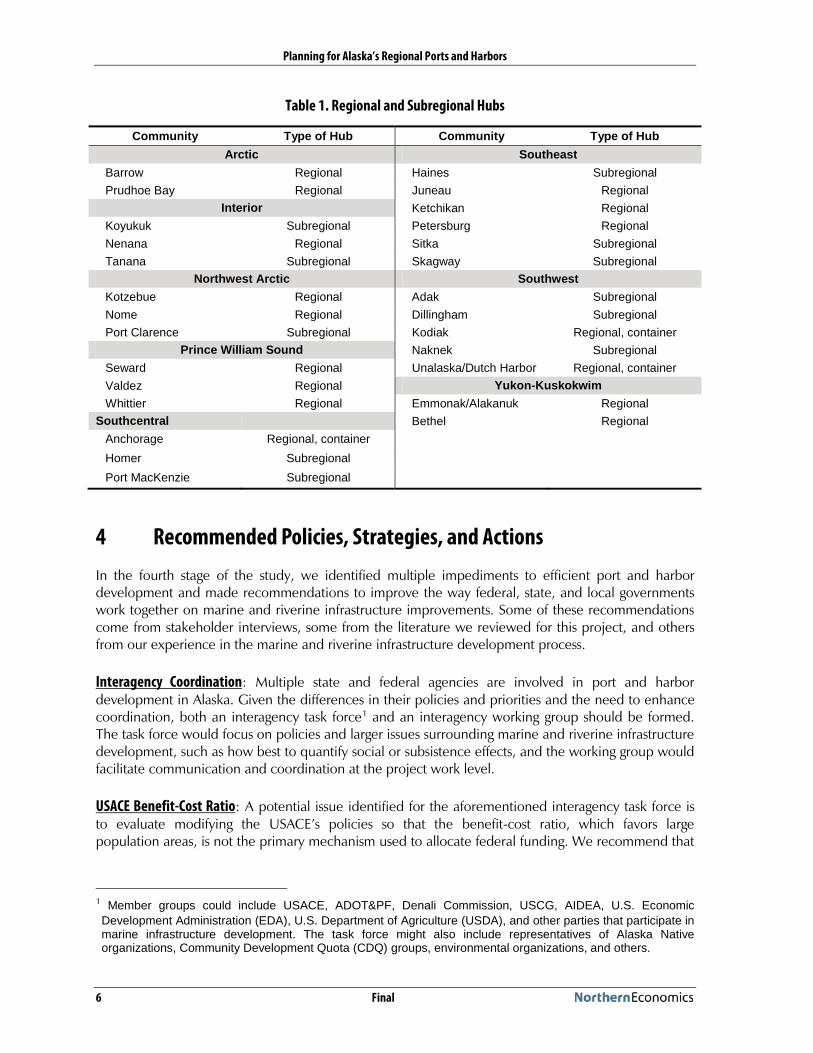
We divided the selection of regional and subregional hubs into eight regions: Arctic, Interior, Northwest Arctic, Prince William Sound, Southcentral, Southeast, Southwest, and Yukon-Kuskokwim Delta. Table 1 provides the resulting list of regional and subregional hubs by region. This is a preliminary list and will be defined through the planning process.
Planning for Alaska’s Regional Ports and Harbors
6 Final
Table 1. Regional and Subregional Hubs
Community Type of Hub Community Type of HubArctic Southeast
Barrow Regional Haines SubregionalPrudhoe Bay Regional Juneau Regional
Interior Ketchikan RegionalKoyukuk Subregional Petersburg RegionalNenana Regional Sitka SubregionalTanana Subregional Skagway Subregional
Northwest Arctic SouthwestKotzebue Regional Adak SubregionalNome Regional Dillingham SubregionalPort Clarence Subregional Kodiak Regional, container
Prince William Sound Naknek SubregionalSeward Regional Unalaska/Dutch Harbor Regional, containerValdez Regional Yukon-KuskokwimWhittier Regional Emmonak/Alakanuk Regional
Southcentral Bethel RegionalAnchorage Regional, containerHomer SubregionalPort MacKenzie Subregional
4 Recommended Policies, Strategies, and Actions
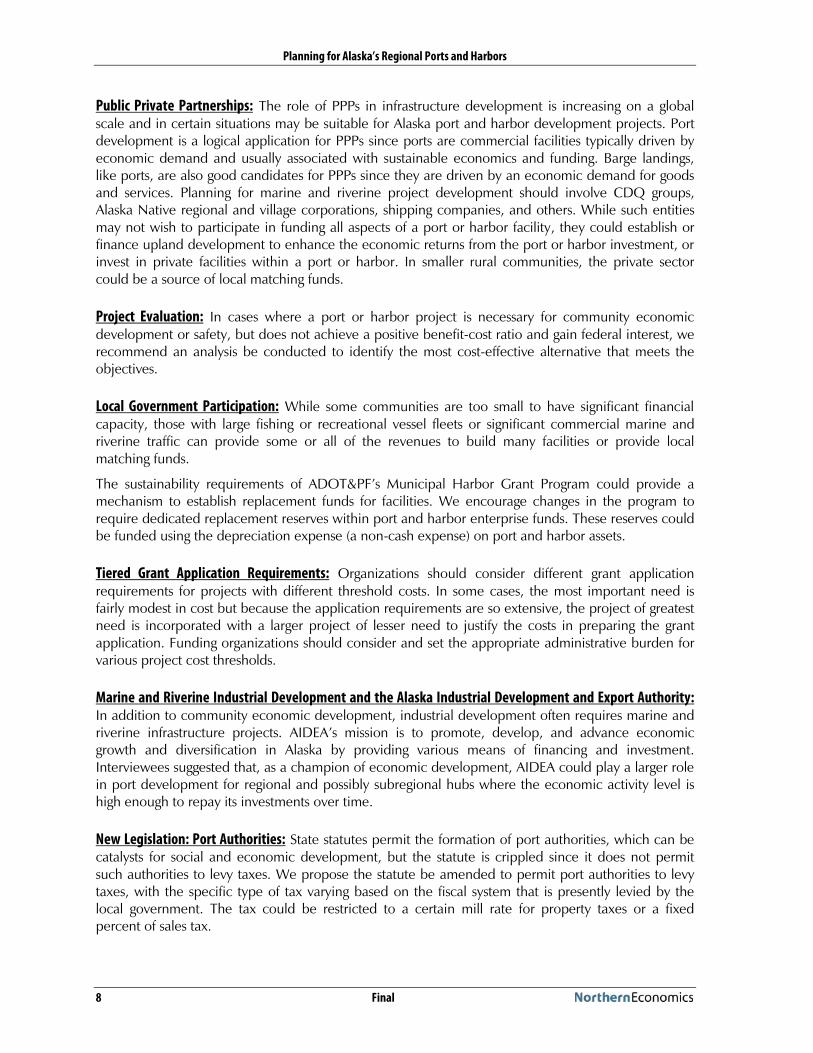
In the fourth stage of the study, we identified multiple impediments to efficient port and harbor development and made recommendations to improve the way federal, state, and local governments work together on marine and riverine infrastructure improvements. Some of these recommendations come from stakeholder interviews, some from the literature we reviewed for this project, and others from our experience in the marine and riverine infrastructure development process.
Interagency Coordination: Multiple state and federal agencies are involved in port and harbor development in Alaska. Given the differences in their policies and priorities and the need to enhance coordination, both an interagency task force1
USACE Benefit-Cost Ratio: A potential issue identified for the aforementioned interagency task force is to evaluate modifying the USACE’s policies so that the benefit-cost ratio, which favors large population areas, is not the primary mechanism used to allocate federal funding. We recommend that
and an interagency working group should be formed. The task force would focus on policies and larger issues surrounding marine and riverine infrastructure development, such as how best to quantify social or subsistence effects, and the working group would facilitate communication and coordination at the project work level.
1 Member groups could include USACE, ADOT&PF, Denali Commission, USCG, AIDEA, U.S. Economic Development Administration (EDA), U.S. Department of Agriculture (USDA), and other parties that participate in marine infrastructure development. The task force might also include representatives of Alaska Native organizations, Community Development Quota (CDQ) groups, environmental organizations, and others.

Planning for Alaska’s Regional Ports and Harbors
Final 7
such issues be brought forward by the Alaska District office, with support from the congressional delegation, for discussion at the national level.
Funding for ADOT&PF Planning and Creation of a Transportation Infrastructure Development Program: ADOT&PF should pursue authorization of a regular state-funded, multi-year transportation program—separate from federal highways, transit, and aviation programs—that includes marine and riverine infrastructure projects. Inclusion of marine and riverine infrastructure projects in the multi-year program will result in a systematic approach to identifying, selecting, coordinating, and funding such infrastructure, and potentially improve the likelihood of project funding .
The current regional planning studies and the Long-range Transportation Plan (LRTP) focus on state-owned facilities and vessels. The next update of these reports should provide a comprehensive description of the marine and riverine transportation system and a baseline assessment of marine and riverine infrastructure owned by the state and other entities that provide such infrastructure.
Interagency Project List and Project Integration: To improve the value of ADOT&PF planning documents, other parties involved with marine and riverine infrastructure development will need to communicate their planned or potential projects to ADOT&PF to ensure that these projects are included in the regional planning studies and the LRTP.
Stakeholder Coordination: Improved communications with project communities could allay some of the frustration that is often felt with USACE’s lengthy process.
Regional Prioritization: Communities should prioritize projects on a regional basis. Regional port and harbor development groups could follow the model used by Alaska Regional Development Organizations. Whether created formally by the Alaska Legislature or informally through regional efforts, these groups could provide single points of contact for communicating regionally supported, prioritized, and coordinated lists of needed port and harbor projects. This approach would benefit both individual communities and the funding agencies through greater efficiencies in project nomination, selection, and funding. We recommend that projects subjected to such evaluation be given additional weight in funding organizations’ project ranking.
Coordinated Planning and Creative Solutions for Communities: This report focuses on marine and riverine infrastructure, but good planning should recognize that there may be other, more cost-effective means of achieving a goal rather than development or improvement of marine and riverine infrastructure. In some cases, another mode of transportation may provide the most cost-effective solution and best meet local, regional, and state needs.
A statewide transportation plan should address all elements of the transportation system, including the private sector’s role in providing facilities or equipment for the system. Having knowledge of all available infrastructure, including private sector investments, could facilitate coordination among stakeholders, reducing the cost of moving from one mode to another, or between communities, and revealing where the state may not need to build facilities or supply equipment.
Funding or Financing: Part of the stimulus for undertaking the Alaska Regional Ports study was the recognition that there are not enough funds available to meet the needs that have already been identified for marine and riverine infrastructure projects. The project decision-making process must explore the possibility of funding projects through other parties or with several organizations as partners.
Planning for Alaska’s Regional Ports and Harbors
8 Final
Public Private Partnerships: The role of PPPs in infrastructure development is increasing on a global scale and in certain situations may be suitable for Alaska port and harbor development projects. Port development is a logical application for PPPs since ports are commercial facilities typically driven by economic demand and usually associated with sustainable economics and funding. Barge landings, like ports, are also good candidates for PPPs since they are driven by an economic demand for goods and services. Planning for marine and riverine project development should involve CDQ groups, Alaska Native regional and village corporations, shipping companies, and others. While such entities may not wish to participate in funding all aspects of a port or harbor facility, they could establish or finance upland development to enhance the economic returns from the port or harbor investment, or invest in private facilities within a port or harbor. In smaller rural communities, the private sector could be a source of local matching funds.
Project Evaluation: In cases where a port or harbor project is necessary for community economic development or safety, but does not achieve a positive benefit-cost ratio and gain federal interest, we recommend an analysis be conducted to identify the most cost-effective alternative that meets the objectives.
Local Government Participation: While some communities are too small to have significant financial capacity, those with large fishing or recreational vessel fleets or significant commercial marine and riverine traffic can provide some or all of the revenues to build many facilities or provide local matching funds.
The sustainability requirements of ADOT&PF’s Municipal Harbor Grant Program could provide a mechanism to establish replacement funds for facilities. We encourage changes in the program to require dedicated replacement reserves within port and harbor enterprise funds. These reserves could be funded using the depreciation expense (a non-cash expense) on port and harbor assets.
Tiered Grant Application Requirements: Organizations should consider different grant application requirements for projects with different threshold costs. In some cases, the most important need is fairly modest in cost but because the application requirements are so extensive, the project of greatest need is incorporated with a larger project of lesser need to justify the costs in preparing the grant application. Funding organizations should consider and set the appropriate administrative burden for various project cost thresholds.
Marine and Riverine Industrial Development and the Alaska Industrial Development and Export Authority: In addition to community economic development, industrial development often requires marine and riverine infrastructure projects. AIDEA’s mission is to promote, develop, and advance economic growth and diversification in Alaska by providing various means of financing and investment. Interviewees suggested that, as a champion of economic development, AIDEA could play a larger role in port development for regional and possibly subregional hubs where the economic activity level is high enough to repay its investments over time.
New Legislation: Port Authorities: State statutes permit the formation of port authorities, which can be catalysts for social and economic development, but the statute is crippled since it does not permit such authorities to levy taxes. We propose the statute be amended to permit port authorities to levy taxes, with the specific type of tax varying based on the fiscal system that is presently levied by the local government. The tax could be restricted to a certain mill rate for property taxes or a fixed percent of sales tax.

Planning for Alaska’s Regional Ports and Harbors
Final 9
5 Project Prioritization: New Criteria
Based on the project list created as part of this study, the study team went on to create a master project list with input from other agencies. This section describes the process used in its creation and suggests steps for its maintenance and prioritization.
The list began with a survey instrument distributed by the USACE. The survey asked statewide marine and riverine facility owners and representatives to list projects that were ‘planned or underway, but not yet completed’ as well as projects ‘not yet planned but needed.’ These responses were summarized and distributed from USACE to ADOT&PF and the Denali Commission. The latter two agencies responded by sharing their existing lists of needed projects. ADOT&PF also submitted their Municipal Harbor Grant Program applicants, their deferred maintenance inventory, and their running list of port and harbor needs. The Denali Commission provided the results of Phase I and Phase II of the Alaska Barge Landing System study, as well as projects submitted by grant applicants. The various project lists were combined to form a master list of statewide port and harbor needs. Projects on this list are candidates for regional and agency prioritization.
The project list was distributed to attendees at the 2010 Alaska Regional Ports Conference. The following is a summary of our suggestions for maintaining the list and includes valuable input and suggestions received from conference attendees.
Maintenance of the Project List
� Attendees made clear that the projects on the list do not always reflect the current reality. The list must undergo a local review to ensure that it is correct and up to date.
� Many of the projects on the list are duplicates because multiple agencies may be involved and each nominated the project. Many projects have similar but slightly different names and there is insufficient information to differentiate between them. A lead agency should be identified to condense the list by merging comparable projects, identify all agencies involved, and provide coordination.
� A column containing the type of need addressed by the project may prove useful in allocating resources. Categories might include new or expansion projects, improvements to existing facilities, and maintenance. Maintenance projects should be the responsibility of local communities.
� The project list should be posted in a public location for a one-month comment period during which local facility owners and stakeholders will have the opportunity to comment on and correct the data that it contains. This step will also allow for survey respondents to delete duplicates and add projects which were omitted.
� Going forward, the list of marine and riverine infrastructure projects developed for this study should be updated at least annually so that it is useful to the congressional delegation, the state legislature, and others funding such projects.
� A single agency should be responsible for maintaining the list. While ADOT&PF is the most likely candidate for this task, this list maintenance needs to be appropriately funded and staffed. The viability of the project list depends on community interest generated by a reasonable expectation that worthy projects may receive state and/or federal funding support.
� A status or notes column may prove useful for tracking progress as projects move through feasibility, engineering and design, and construction.

Planning for Alaska’s Regional Ports and Harbors
10 Final
� Projects deemed infeasible by any of the participating entities should be grouped and noted as such in an effort to avoid duplicate feasibility studies. These projects should be reevaluated only when relevant circumstances change.
� Projects listed by private entities should be restricted to only those which share a public interest and have the potential for collaborative funding.
An interagency review of policies and procedures should be conducted periodically to determine if changes could be made to eliminate apparent conflicts. This review should include an evaluation of the criteria each organization uses to rank marine and riverine infrastructure projects.
Criteria:
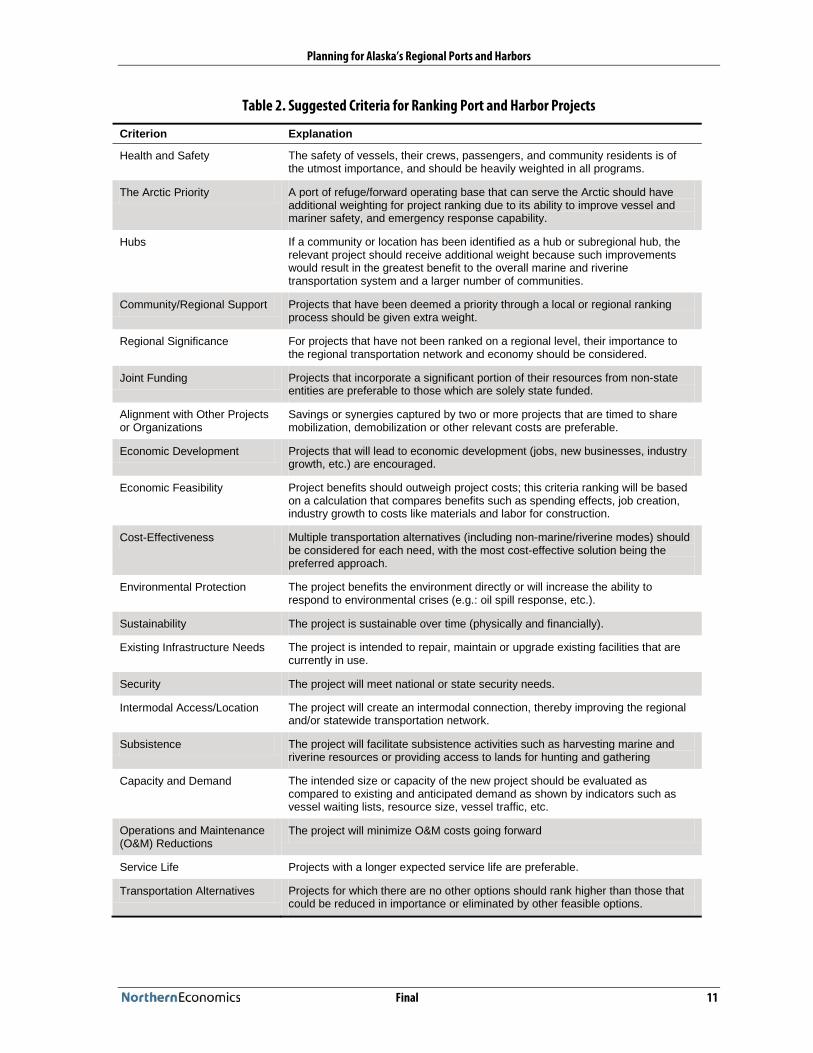
Though the criteria used to evaluate these projects may vary by organization and community, we suggest that all groups within the state consider the items in Table 2. These criteria are based on interview and research findings of this study, as well as input by conference attendees. Input from the conference attendees suggests the following criteria are the most important based on the number of times the criterion was nominated:
1. Public Safety 2. Economic Development 3. Regional Support / Impact to Communities 4. Existing Infrastructure Needs 5. Operations and Maintenance 6. Cost / Benefit 7. Sustainability 8. Intermodal Access / Location
Planning for Alaska’s Regional Ports and Harbors
Final 11
Table 2. Suggested Criteria for Ranking Port and Harbor Projects
Criterion Explanation
Health and Safety The safety of vessels, their crews, passengers, and community residents is of the utmost importance, and should be heavily weighted in all programs.
The Arctic Priority A port of refuge/forward operating base that can serve the Arctic should have additional weighting for project ranking due to its ability to improve vessel andmariner safety, and emergency response capability.
Hubs If a community or location has been identified as a hub or subregional hub, the relevant project should receive additional weight because such improvements would result in the greatest benefit to the overall marine and riverine transportation system and a larger number of communities.
Community/Regional Support Projects that have been deemed a priority through a local or regional ranking process should be given extra weight.
Regional Significance For projects that have not been ranked on a regional level, their importance to the regional transportation network and economy should be considered.
Joint Funding Projects that incorporate a significant portion of their resources from non-state entities are preferable to those which are solely state funded.
Alignment with Other Projects or Organizations
Savings or synergies captured by two or more projects that are timed to share mobilization, demobilization or other relevant costs are preferable.
Economic Development Projects that will lead to economic development (jobs, new businesses, industry growth, etc.) are encouraged.
Economic Feasibility Project benefits should outweigh project costs; this criteria ranking will be based on a calculation that compares benefits such as spending effects, job creation, industry growth to costs like materials and labor for construction.
Cost-Effectiveness Multiple transportation alternatives (including non-marine/riverine modes) should be considered for each need, with the most cost-effective solution being the preferred approach.
Environmental Protection The project benefits the environment directly or will increase the ability to respond to environmental crises (e.g.: oil spill response, etc.).
Sustainability The project is sustainable over time (physically and financially).
Existing Infrastructure Needs The project is intended to repair, maintain or upgrade existing facilities that are currently in use.
Security The project will meet national or state security needs.
Intermodal Access/Location The project will create an intermodal connection, thereby improving the regional and/or statewide transportation network.
Subsistence The project will facilitate subsistence activities such as harvesting marine and riverine resources or providing access to lands for hunting and gathering
Capacity and Demand The intended size or capacity of the new project should be evaluated as compared to existing and anticipated demand as shown by indicators such as vessel waiting lists, resource size, vessel traffic, etc.
Operations and Maintenance (O&M) Reductions
The project will minimize O&M costs going forward
Service Life Projects with a longer expected service life are preferable.
Transportation Alternatives Projects for which there are no other options should rank higher than those that could be reduced in importance or eliminated by other feasible options.

Wisdom • Trust • Relevance • Innovation
Alaska Regional Ports
Appendix A:
Strategic Trends AnalysisFinal Report
Prepared for the
U.S. Army Corps of Engineers
and
Alaska Department of Transportation
and Public Facilities
January 2011
Under Contract to
URS Corporation


Strategic Trends Analysis
Final Prepared for the
U.S. Army Corps of Engineers Alaska District and the
Alaska Department of Transportation & Public Facilities
January 2011
Prepared by
Under contract to URS Corporation

Preparers
Team Member Project Role Mike Fisher Project Manager, Analyst, and Author Patrick Burden Project Director Donald Schug Project Analyst and Principal Author Alexus Bond Project Analyst and Author Phillip Jolly Project Analyst Terri McCoy Editor
Please cite as: Northern Economics, Inc. Strategic Trends Analysis. Prepared for the U.S. Army Corps of Engineers Alaska District and the Alaska Department of Transportation & Public Facilities. January 2011.
Final i
Contents
Section Page
Abbreviations ....................................................................................................................................... iv
Executive Summary ............................................................................................................................ ES-1
1 Introduction ........................................................................................................................... 1 1.1 Definition of Terms Used in This White Paper .................................................................... 1 1.2 Organization of this White Paper ........................................................................................ 1
2 International Developments in Maritime Operations and Facilities ............................................ 3 2.1 Global Trade Patterns and Current Trends .......................................................................... 3 2.1.1 Containerization ................................................................................................................. 5 2.1.2 Port Privatization and Global Terminal Operators ............................................................... 6 2.1.3 Shipping Line Consolidation and Alliances .......................................................................... 8 2.1.4 Transshipment Hubs ........................................................................................................... 8 2.1.5 Vessel Size .......................................................................................................................... 9 2.1.6 Port Infrastructure ............................................................................................................. 12 2.1.7 Regional Hubs .................................................................................................................. 13 2.1.8 Intermodal Transportation Systems ................................................................................... 14 2.2 Shipping Routes ................................................................................................................ 15 2.3 Fuel Efficiency .................................................................................................................. 19
3 Trends in Demand for Alaska Maritime Operations and Facilities .............................................. 22 3.1 The Roles of Ports and Harbors ......................................................................................... 23 3.1.1 Transportation .................................................................................................................. 23 3.1.2 Economic and Community Development ......................................................................... 25 3.2 Alaska Industry Development ........................................................................................... 26 3.2.1 Oil and Natural Gas Production ........................................................................................ 27 3.2.2 Minerals and Metals Mining .............................................................................................. 35 3.2.3 Seafood Industry ............................................................................................................... 41 3.2.4 Tourism ............................................................................................................................ 46 3.2.5 Agriculture and Forestry .................................................................................................... 51 3.2.6 Transportation .................................................................................................................. 53 3.3 Alaska Resupply Cargo ...................................................................................................... 54 3.4 Harbors of Refuge and Emergency Response..................................................................... 58
4 Assessment of Shipping and Port Development Issues in Alaska ............................................... 61 4.1 Climate Change Issues ...................................................................................................... 61 4.2 Environmental Protection Issues ........................................................................................ 62 4.3 Sociocultural Issues ........................................................................................................... 66 4.4 Construction Issues ........................................................................................................... 67
5 Port and Harbor Investment Needs and Financing Opportunities.............................................. 69

Strategic Trends Analysis
ii Final
5.1 Types of Port and Harbor Investment Needs ..................................................................... 69 5.2 Federal, State and Local Maritime Transportation Investment Programs and Policies .......... 72 5.2.1 Federal ............................................................................................................................. 72 5.2.2 State of Alaska .................................................................................................................. 75 5.2.3 Local ................................................................................................................................ 78 5.2.4 Public-Private Partnerships ................................................................................................ 79 5.3 Port Governance and Investment in Other States, Provinces, and Countries ...................... 81 5.3.1 Governance Models .......................................................................................................... 81 5.3.2 Country Case Studies ........................................................................................................ 82 5.4 Port and Harbor Investment Needs in Alaska .................................................................... 86 5.4.1 Facility Maintenance ......................................................................................................... 86 5.4.2 Northwest and Northern Alaska Port Infrastructure ............................................................ 87 5.4.3 Dredging .......................................................................................................................... 87 5.4.4 Facility Expansion ............................................................................................................. 87
6 References ........................................................................................................................... 89 Table Page
Table 1. Development of International Seaborne Trade, Millions of Tons Loaded, Selected Years ....... 3 Table 2. World Seaborne Trade, Billions of Ton-miles, Selected Years ................................................ 4 Table 3. Approximate Vessel Size Groups ......................................................................................... 12 Table 4. Illustrative Comparison of Mileage and Unconstrained Sailing Time via Arctic Sea Routes
and Existing Canal Routes .......................................................................................................... 17 Table 5. Foreign and Domestic Waterborne Shipments of Crude Petroleum and Petroleum
Products from the Port of Valdez, Thousands of Short Tons, 1994–2007 .................................... 28 Table 6. Foreign and Domestic Waterborne Shipments of Crude Petroleum and Petroleum
Products from the Port of Anchorage, Thousands of Short Tons, 1994–2007 .............................. 29 Table 7. Foreign and Domestic Waterborne Shipments of Crude Petroleum, Liquefied Natural Gas
and Petroleum Products from the Port of Nikiski, Thousands of Short Tons, 1994–2008 ............ 30 Table 8. Undiscovered Economically Recoverable Resources of the Beaufort Sea and Chukchi Sea .. 32 Table 9. Waterborne Shipments of Non-Ferrous Ore and Non-Ferrous Metal Products from the
Port of Kivalina, Thousands of Short Tons, 1997–2007 ............................................................... 36 Table 10. Waterborne Shipments of Coal from the Port of Seward, Thousands of Short Tons,
1994–2007 ............................................................................................................................... 36 Table 11. Waterborne Shipments of Seafood Products from the Port of Dutch Harbor, Thousands
of Short Tons, 1994–2008 ......................................................................................................... 43 Table 12. Waterborne Shipments of Seafood Products from the Port of Anchorage, Thousands of
Short Tons, 1994–2008 ............................................................................................................. 44 Table 13. Alaska Cruiseship Passengers by Port, 1996-2009 ............................................................. 47 Table 14. Foreign and Domestic Waterborne Shipments of Lumber, Logs, Wood Chips, and Pulp
Originating in Alaska, Thousands of Short Tons, 1997–2006 ...................................................... 52 Table 15. Port of Anchorage Inbound Cargo, 1994–2008 ................................................................. 56 Table 16. Examples of Infrastructure Improvements .......................................................................... 69 Table 17. Examples of Intermodal Facility Improvements ................................................................. 70

Strategic Trends Analysis
Northern Economics, Inc. Final iii
Table 18. Examples of Environmental Improvements........................................................................ 71 Table 19. Municipal Harbor Facility Grant Funding History .............................................................. 76 Figure Page
Figure 1. Growth in World Trade, Maritime Trade, OECD Industrial Production, and GDP, 1994–2009 ................................................................................................................................. 5
Figure 2. Containership Characteristics, 1956 to present .................................................................. 11 Figure 3. Containership Characteristics, 1956 to present .................................................................. 11 Figure 4. Cargo Transit Routes from Asia to the U.S. East Coast ........................................................ 16 Figure 5. Distance Traveled With One Ton of Cargo Using One kWh Energy for Different
Transport Modes ....................................................................................................................... 20 Figure 6 . Carbon Dioxide Emissions for Different Transport Modes ................................................. 20 Figure 7. Alaska Oil and Natural Gas Production and Average Annual Price per Barrel, 1987–2008 . 31 Figure 8. World Metal Prices and Alaska Mining Exploration Expenditures, 1986–2007 .................... 39
Strategic Trends Analysis
iv Final
Abbreviations
AAPA American Association of Port Authorities
ADEC Alaska Department of Environmental Conservation
ACMP Alaska Coastal Management Program
ADCCED Alaska Department of Commerce, Community, and Economic Development
ADOL&WD Alaska Department of Labor and Workforce Development
ADOT&PF Alaska Department of Transportation and Public Facilities
AIDEA Alaska Industrial Development and Export Authority
AMBBA Alaska Municipal Bond Bank Authority
AMHS Alaska Marine Highway System
ATB Articulated Tug Barge
B&I Business and Industrial Loan Guarantee Program
BBO Buy-Build Operate
BDO Build/Develop/Operate
BOO Build-Own-Operate
BOT Build/Operate/Transfer
BTO Build/Transfer/Operate
CDQ Community Development Quota Program
CQE Community Quota Entity Program
CIAP Coastal Impact Assistance Program
CMAQ Federal Congestion Mitigation and Air Quality
CPA Canadian Port Authority
CRB Commodity Research Bureau
DBO Design-Build-Operate
DMTS DeLong Mountain Transportation System
EDA Economic Development Association
EEZ Exclusive Economic Zone
EPA Environmental Protection Agency
ESPO European Sea Ports Organisation
GDP Gross domestic product
GO General obligation (bond)
IT Information technology
LDO Lease/Develop/Operate

Strategic Trends Analysis
Northern Economics, Inc. Final v
LNG Liquefied natural gas
LOA Length overall
MARAD U.S. Maritime Administration
MBOE Thousand barrels of oil equivalent
MLLW Mean lower low water
RBOG Rural Business Opportunity Grants
SOT Skagway Ore Terminal
TEU Twenty-foot equivalent unit
UMC Unalaska Marine Center
USACE U.S. Army Corps of Engineers
USCG U.S. Coast Guard
USDA U.S. Department of Agriculture

Strategic Trends Analysis
vi Final

Final ES-1
Executive Summary
This white paper identifies and analyzes the strategic trends considered in the development of a long-range ports and harbors plan for Alaska. This work element consists of synthesizing and drawing conclusions from the existing body of research and prior studies that evaluate trends in maritime operations and facilities pertinent to Alaska.
The paper provides a broad, worldwide perspective of trends in maritime operations and facilities, focusing on recent developments and emerging issues, and then links these global developments to trends in Alaska. Shipping and market statistics for exports and imports essential to Alaska’s economy are used to forecast future demand for maritime operations and facilities. A number of other issues relevant to future development of Alaska maritime operations and facilities are also assessed, including climate change, environmental protection, and sociocultural issues. The paper concludes with a broad overview of port and harbor investment needs, using various examples of port-related investments in the United States and abroad, and includes descriptions of existing and emerging funding sources for port improvements.
Global trends discussed in this paper include:
Containerization. Containerized cargo has increased the efficiency of maritime transportation and now represents more than one-quarter of marine cargo traffic. Containerization is expected to continue its growth as globalization marches on. The number of containers coming to Alaska is also expected to increase over time, primarily to meet the needs of increasing population and increased economic activity.
Prince Rupert, B.C. opened its container terminal a few years ago and has plans to expand the infrastructure to handle 5 million twenty-foot equivalent units (TEUs) by 2015. Southeast Alaska exports to Asia could move through Prince Rupert, but the rest of state is more likely to continue to use the Port of Dutch Harbor to move containerized exports to Asia, or to transship through Puget Sound ports. However, the development of Prince Rupert as a major transshipment container terminal with Canadian Northern Railroad providing a dedicated rail line to Chicago for containers from Prince Rupert and with direct rail service to Memphis, Minneapolis, and Pittsburgh, makes it difficult to see the Port of Anchorage emerging as a transshipment container terminal in the foreseeable future.
Port Privatization and Global Terminal Operators. Most port facilities in the world were originally owned or controlled by governments, municipalities, and other public parties. While a number of port authorities around the globe have responded to competitive pressures by turning over port ownership and management to the private sector, U.S. ports were largely established by the private sector, but over time the ownership has evolved into a mix of private and public ownership. The more or less standard port model in the United States is the “landlord” port, which is operated such that the majority of its facilities and services are leased to private vendors through various types of contractual arrangements. Nevertheless, during the past several years an increasing number of U.S. port authorities have joined the worldwide trend of leasing their marine terminals to large, multinational corporations. In Alaska, the key marine infrastructure may be owned by local governments, the state government, or the private sector.
In other countries, privatization of many terminals can be attributed to the inability of public entities to raise capital needed to maintain or expand their facilities; privatization was a means to ensure that the port infrastructure remained competitive in the global port network. Alaska may see privatization or public/private partnerships in the future. A new dock and cold storage facility in Dutch Harbor owned and operated by Kloosterboer, Inc. has substantially reduced revenues at the Unalaska Marine

Strategic Trends Analysis
ES-2 Final
Center (UMC), which, prior to the opening of the new facility, generated surplus revenues for the Port of Dutch Harbor that were used to maintain the UMC and other facilities. General fund revenues will likely be needed to support the Port enterprise fund in the future and at some point in time the City of Unalaska could seek to sell or lease the UMC to others in order to reduce costs to the general fund.
The Port of Anchorage is undergoing a very large expansion, which has run into funding difficulties. While Senator Stevens was in office it was possible to receive large federal grants for capital construction, and these federal funds were supplemented with state grants. Substantial sums of money are still required to complete the project, and the schedule may be delayed until concrete plans for funding and financing the facility are completed. Leasing part or all of the facility to a major terminal operator could be one alternative for completing the project.
Shipping Line Consolidation and Alliances. Traditionally, ocean shipping has been a highly fragmented industry. However, over the past decade the industry has seen substantial consolidation. In 2005, about 6 percent of carriers controlled more than 80 percent of global container fleet capacity. As in the port terminal operating industry, the expectation is that the consolidation movement in the container shipping sector will continue. In Alaska, consolidation in tug and barge companies operating in western Alaska occurred in the 1990s and earlier this decade. The development of the U.S. Postal Services bypass mail program reduced freight volumes for tug and barge companies and was part of the reason for the reduction in the number of firms operating in the region.
Transshipment Hubs. Transshipment centers or hubs are specialized ports or terminals handling mainly containers that do not enter or originate from the country itself. The hub and spoke concept is intended to maximize use of large containerships while providing market coverage to a maximum number of ports. By using a transshipment hub, a carrier can service marginal markets that do not justify a direct call with large linehaul ships, interchange containers between liner strings at strategic crossing points, and realize economies from improved port asset utilization. Transshipment hubs also provide local importers and exporters access to linehaul service, thereby reducing transportation time and possibly freight rates to and from overseas markets. Ocean carriers have been increasingly using regional hubs for transshipment of containers. This is a worldwide trend that is accelerating as larger containerships come into service and the advantages of hub and spoke operations become more apparent. The most important attribute carriers look for in a transshipment hub is its strategic location relative to the primary origins and final destinations of container traffic. Beyond location, other attributes include the ability to safely accept large ships, extent of terminal facilities, efficiency of container handling operations, availability of frequent feeder services with an appropriate geographical coverage, and attractive cargo handling charges.
Vessel Size. Port customers are getting larger since the deployment of larger ships enables the realization of economies of scale. Global alliances have proven to be especially successful in benefiting from the economies of scale achieved through the employment of larger ships. Over the past few years, there has been a rapid increase in the size of containerships servicing the world’s densest maritime routes. The share of containerships in excess of 5,000 TEU (commonly called “post-Panamax vessels”) increased from 1 percent in 1996 to 30 percent in 2006. Problems with the larger ships include the massive surge of containers (or passengers) discharged at a single port of call and the expense involved in providing sufficient channel and berth depth, terminal area, gantry cranes of adequate size, and the dynamic loads that large ships place on docks and dolphins during periods of high winds. The question is whether future growth in the volume of maritime trade will justify the continued construction of “mega-ships”�these ships can be only deployed efficiently on the major trade lanes if they are full. The new building orders for these ships indicate that shipping companies are wagering that they will be.

Strategic Trends Analysis
Northern Economics, Inc. Final ES-3
Vessels employed in the Alaska trade are depth-constrained at most Alaska ports. In many locations, vessels or barges come in light loaded to meet the depth available. AMHS Alaska class vessels need about -25 feet at mean lower low water (MLLW) while ocean going fuel barges need about -20 feet MLLW. Cargo barges require less draft than fuel barges. Vessels and barges entering the mouths of the Yukon or Kuskokwim Rivers must deal with shoals that significantly limit carrying capacity of ocean-going barges. For example, the Coast Pilot indicates that the south entrance to the Yukon River has a maximum depth at high water of 15 feet, so an ocean going fuel barge would need to lighter at least 5 feet of fuel before entering the south entrance.
Port Infrastructure. In recent years, larger vessels have placed new demands on the physical facilities and services in ports. In some cases, improvements in port facilities may involve infrastructure investments, such as providing better access to the port by increasing the depth of water in entrance channels and alongside berths, extending and supporting existing wharfs, or providing breakwaters. In terms of superstructure, better cargo handling equipment and storage facilities may be needed. Container liner shipping is not the only sector placing a greater demand on port facilities and services; the combination of large cruiseships and quick turnarounds required by cruise lines also adds significant strain.
The mechanization of cargo handling and increased storage requirements (because of greater vessel capacities) have greatly extended the space demands for port activities. Transshipment activities also contribute to the need for a large area to temporarily store containers that are between two journeys on carriers. Whereas a large container terminal several years ago would have been about 100 acres, transshipment terminals under construction today typically range from 200 to 300 acres each. Container terminals that involve high capital costs and intensive deployment of cargo handling equipment and other facilities have led to an increase in the number of specialized ports that only accommodate containerships.
With the exception of dedicated container handling equipment at Anchorage, Kodiak, and Dutch Harbor, and dedicated cruiseship docks in various ports in Southeast and Southcentral Alaska, publicly owned port and harbor infrastructure throughout much of the state is tied to servicing a mix of barges and coastal freighters, fishing vessels, recreational boats, and other vessels. The marine infrastructure is typically general-purpose and not specialized. As a result, load and unload times, as well as waiting times to access the dock are longer than at more specialized docks and can increase transportation costs and the price of the related commodity or good.
It should be noted that private sector interests with existing marine infrastructure may not want to see public port improvements, since this could result in or increase competition.
Regional Hubs. For international shipping, transshipment centers or hubs are specialized ports or terminals handling mainly containers that do not enter or originate from the country itself. The hub and spoke concept is intended to maximize use of large containerships while providing market coverage to a maximum number of ports. By using a transshipment hub, a carrier can service marginal markets that do not justify a direct call with large linehaul ships, interchange containers between liner strings at strategic crossing points, and realize economies from improved port asset utilization. Transshipment hubs also provide local importers and exporters access to linehaul service, thereby reducing transportation time and possibly freight rates to and from overseas markets. Ocean carriers have been increasingly using regional hubs for transshipment of containers. This is a worldwide trend that is accelerating as larger containerships come into service and the advantages of hub and spoke operations become more apparent. The most important attribute carriers look for in a transshipment hub is its strategic location relative to the primary origins and final destinations of container traffic. Beyond location, other attributes include the ability to safely accept large ships, extent of terminal

Strategic Trends Analysis
ES-4 Final
facilities, efficiency of container handling operations, availability of frequent feeder services with an appropriate geographical coverage, and attractive cargo handling charges.
Similar concepts but different types of equipment are used in much of Alaska. Regional and subregional hubs are located throughout Alaska. With the exception of container ships that call at the regional hubs of Anchorage, Kodiak, and Dutch Harbor, much of the remaining marine cargo to western Alaska moves via tug and barge to designated hubs and then is transported in smaller equipment to outlying villages similar to the hub and spoke system noted above. In Southeast Alaska the primary hub is Puget Sound but marine cargo mainly moves in a linear fashion with limited use of regional hubs at Ketchikan, Sitka, and Juneau. Coastal freighters also serve Kodiak Island and communities on the south side of the Alaska Peninsula west of Kodiak and along the Aleutian Islands as far as Atka. This service is primarily a linear service out to Dutch Harbor, which functions as a regional hub for communities in proximity to, or located west or north of, Unalaska. On the Yukon River, Nenana receives cargo via rail or truck, which is then transshipped on barges to Yukon River communities. Emmonak and Alakanuk also serve as hubs for cargo that enters via the mouth of the Yukon River.
This study focuses on hubs for several reasons. First, it is recognized that the available funding for marine infrastructure is limited and cannot begin to provide the marine infrastructure that is desired in every community. Second, marine infrastructure is expensive and the costs are even higher in remote communities. Third, the cost to maintain large capital investments in marine infrastructure in small communities can be much larger than could be captured by a reasonable tariff on cargo moving across a dock or other infrastructure. Fourth, some Alaskans have an opinion that the state should ensure hub communities remain economically viable, since it is believed that if the hub communities decline, then the villages that they support cannot remain viable.
It is anticipated that investments in regional and subregional hubs could result in lower costs for shipping companies, which might translate into improved service and lower costs for residents of the hub communities as well as the outlying villages that they support. Thus, a larger number of Alaska residents could benefit from the limited resources that are available. One issue will be ensuring that the benefits from investing public dollars are not captured solely by the transportation companies or the terminal operators, but are at least shared with residents of the region.
Intermodal Transportation Systems. While a port is defined as a facility for receiving ships and transferring cargo to and from them, many ports today do not merely handle ships. A modern port interconnects and offers a choice between various transportation modes. Goods are transferred from sea to rail, road, and inland navigation, and vice versa. With inland accessibility becoming a cornerstone in port competitiveness, a number of terminals are being designed with intermodality in mind, from handling equipment to intermodal information technologies that provide continuous real-time access to cargo- and equipment-status information. In addition, the deregulation of many transportation modes in the early 1980s facilitated intermodal contractual agreements. Without the restrictive guidelines of government regulation, carriers were provided an incentive to combine and acquire broad services that could be applied across transportation modes and throughout the supply chain.
Alaska has a limited road and rail network and intermodal connections are limited to a few ports, mostly in Southcentral Alaska but also at Nenana and Prudhoe Bay. Anchorage, Whittier, Seward, and Valdez are the primary ports in Southcentral Alaska with intermodal connections. Over the years, there has been discussion about connecting villages to reduce the need for infrastructure and improve service delivery to residents of multiple communities. However, a draft report being prepared for ADOT&PF suggests that typically the benefits of connectivity only justify building roads that are at most about 10 miles in length; at greater distances the capital cost of the road and road maintenance

Strategic Trends Analysis
Northern Economics, Inc. Final ES-5
exceed the benefits. This finding suggests that there are a limited number of communities where road connections would be beneficial.
The U.S. Department of Transportation, Maritime Administration (MARAD) has recently established America’s Marine Highway Program to increase short haul sea shipping as an alternative to congested highways and rail lines. The AMHS routes are identified as part of the Marine Highway Program. MARAD recently awarded grants to port authorities and others in the Gulf of Mexico, along the eastern seaboard, and on the Mississippi River to improve the infrastructure needed to facilitate growth of short haul sea shipping. Alaska highways and rail lines are not congested presently and it is doubtful if the state would be awarded grants in the foreseeable future unless the goals of the program are modified.
Shipping Routes. Maritime shipping lines try to offer the most direct services possible. For vessels transiting an ocean between two continents, this goal is typically accomplished by following a “great circle,” such as the North Pacific great circle route, which is the most economic pathway for commerce between northern ports of the west coast of North America to ports in eastern Asia and is a major trans-oceanic shipping route. Alaska sits astride the great circle route. A segment of the route extends from the western Gulf of Alaska, westward offshore from the Alaska Peninsula, and through the Aleutian Islands including the passes at Unimak Pass and west of Tanaga Island. As a result of increasing maritime trade between North America and Asia, the North Pacific great circle route receives considerable vessel traffic. An estimated 2,760 large vessel-transits used Unimak Pass in 2004. The number of chemical carriers and containerships transiting the North Pacific great circle route is forecasted to more than double in the next 25 years.
In recent years, possible alternative global trade routes that pass along the Alaska coastline have received considerable interest, including the Northern Sea Route across Russia and the Northwest Passage across Canada. Historically, these routes have received little vessel traffic because of Arctic sea ice conditions, but it is anticipated that the Northern Sea Route and Northwest Passage could become useable navigation routes in the next 40 to 50 years due to Arctic sea ice melt. However, a number of issues and impediments to the use of Arctic sea routes exist, including seasonality and year-to-year variability, ice-class vessel requirements, vessel support and safety considerations, and geopolitical issues. The U.S. Coast Guard is evaluating locations for possible forward operating bases in the Arctic for emergency response and national defense purposes. Residents in many parts of Alaska use frozen rivers as transportation corridors or travel across frozen tundra in winter. Warming temperatures are decreasing the length of time that this mode of transportation can be used.
Fuel Efficiency. Shipping lines worldwide struggled as crude oil prices reached unprecedented highs in 2008. Fuel costs represent as much as 50 to 60 percent of total ship operating costs, depending on the type of ship and service. Recovery of fuel cost from cargo customers is a challenge when one considers that vessel capacity utilization is not 100 percent, that trades are not evenly balanced, and that different trades and commodities can handle different levels of shipping rates. While oil prices dropped substantially in 2009, they are expected to again increase with the recovery of the global economy. There are also growing concerns about the dependence of the U.S. on oil, a non-renewable resource, and the security of energy supply. The issue of energy security is particularly significant for the transportation sector, where the price elasticity of demand for petroleum-based fuel is low and transport services are critical to the economy. The prospect of rising fuel costs and fuel shortages has underscored the importance of using the most fuel efficient modes of transport. Maritime transportation is generally considered the most energy efficient of all transport modes if energy efficiency is measured in terms of the distance one ton of cargo travels using 1 kWh of energy. To date, carbon dioxide reduction imperatives have taken a back seat to fuel cost and fuel security

Strategic Trends Analysis
ES-6 Final
imperatives, yet energy policy at the beginning of the twenty-first century is increasingly being shaped by efforts to combat global climate change.
As noted above, the cost of fuel is a large part of marine transportation costs, and shipping companies can undertake several actions to reduce fuel cost and maintain their margins: 1) reduce sailing speeds; 2) seek shorter routes; 3) incorporate new technology as the AMHS has done on its ferry fleet which has reduced fuel consumption by 10 to 15 percent; and 4) limit the number of tug and barge trips to small remote villages to one per year rather than two per year. This last step could require additional fuel storage in a community.
The above global developments can be linked to trends in demand for Alaska maritime operations and facilities. These trends include the following:
Industry Development. More than any other mode, maritime transportation is linked to the primary industries that are the foundation of Alaska’s economy, including the oil and gas, commercial fishing, mining, and cruiseship/tourism industries. Alaska’s resource industries generally operate in high production cost environments where distances to markets are great. The main advantage of maritime transportation is its economies of scale, making it the cheapest per unit of all transportation modes for long distances, which fits well for Alaska’s heavy industrial activities. Forecasting future demand for Alaska’s natural resources is difficult, because most of the products produced by Alaska’s resource industries are sold in international markets, and these products generally account for only a small percentage of the overall world supply. Consequently, Alaska industries typically have a very limited ability to influence prices for their products, and resource development in Alaska is subject to the volatility of international commodity markets.
As mentioned earlier, Alaska has limited surface transportation networks and this sparse transportation system has constrained resource development for decades. Even world-class mineral deposits cannot be developed because the cost of constructing roads or rail lines to ports can be too expensive for a single mine to support. While gold and a few other resources can afford the cost of air transport, most other Alaska resources depend on surface transportation (truck, rail, or pipeline) to ports and then marine shipping to markets. In addition, the seasonality of marine shipping in much of western and Arctic Alaska hinders industrial development.
Development of a world-class mine is very capital intensive, and most large mining firms would rather pay an annual charge for transportation services than borrow more capital, if they can, for transportation infrastructure. The DeLong Mountain Transportation System owned by the Alaska Industrial Development and Export Authority is an example of these forces at work. Other mines such as Greens Creek and Kensington built their own marine infrastructure, but they also had very short roads to build to connect the mine and their docks. Tolls on resource developers for use of a road may be a tool for building new roads in the state.
If commercial discoveries of oil and gas are found in the Chukchi Sea or further west in the Beaufort Sea, the amount of vessel traffic operating in these waters and in the Bering Sea will increase significantly. Supply vessels for the offshore platforms will need to be built with ice-breaking capabilities so that they can operate for a large part of, if not the entire year in ice conditions. Those very conditions will make it difficult for other vessels that may respond to an emergency, particularly if the response vessels are located some distance from the area and are not ice capable.
Alaska Resupply Cargo. Alaska resupply cargo consists of freight and goods shipped into Alaska to supply the needs of businesses and the population of the state. Since Alaska has a very small manufacturing sector, virtually all producer and consumer goods must be imported from outside the state. Moreover, businesses in Alaska have limited warehousing capability, which means supplies of food, fuel, and other essential goods must arrive on a continuous basis. The dependence of Alaska

Strategic Trends Analysis
Northern Economics, Inc. Final ES-7
residents on an uninterrupted flow of waterborne goods was underscored in 2002, when a lock-out of dockworkers by shippers caused the closure of 29 west coast ports. During a one-week period, convoys of as many as 80 trucks traveled along the Alaska Highway to bring goods to Anchorage from Washington. Typically, a much smaller number of trucks operate along that route.
Harbors of Refuge and Emergency Response. In addition to serving as facilities for receiving ships and transferring cargo to and from them, ports and harbors play an important role in maritime safety and prevention of pollution through technical-nautical assistance to ships and boats, maritime traffic monitoring systems, and facilities to collect vessels’ waste to avoid discharges at sea. Central to the objective of providing a vessel in distress assistance and protection, is the concept of a harbor of refuge, where a vessel in need of assistance can take action to enable it to stabilize its condition, reduce the hazards to navigation, and protect human life and the environment. A vessel in need of assistance means a ship in a situation, apart from one requiring rescue of persons on board, which could give rise to the loss of the vessel or an environmental or navigational hazard. For example, a disabled ship carrying large volumes of hazardous cargo and fuel could pose a significant threat to the marine environment and interests of an affected coastal state. Most remote coastal Alaska communities lack the infrastructure and capabilities to respond to vessel disasters. The threat to life and property is most profound when vessels are unable to locate refuge from severe weather along the Alaska coastline.
The lack of places of refuge and emergency response resources on Alaska’s North Slope and northwest regions may become a particular area of concern if the anticipated increase in the number of freighters, cruiseships, oil and gas tankers, dry bulk cargo vessels, and resupply barges passing through the Bering Strait and plying the waters of the Arctic Ocean comes about within the next couple of decades. Already, the number of vessels in the region exceeds the emergency response capabilities of local communities. A study now underway by the U.S. Coast Guard is expected to determine whether the agency needs a full forward operating base in the Arctic as a way of dealing with the increased vessel traffic in Arctic waters. Russia has already announced plans to build 10 rescue and monitoring stations to support increased vessel traffic along the Northern Sea Shipping Route. In coming years, the provision of Arctic port facilities or harbors suitable for refuge for medium to deep draft vessels may become both a national and international imperative. National defense and emergency response needs may result in ports being developed even though the benefits may be limited due to small resident populations, seasonality, and modest levels of vessel traffic.
Some of the broader categories of port and harbor investment that may be needed in Alaska include:
Northwest and Northern Alaska Port Infrastructure. The Arctic Council and PAME note navigational hazards in the proposed Arctic shipping routes. The absence of major Arctic ports, except for those in northern Norway and northwest Russia, and other critical infrastructure are significant limitations, as is the lack of hydrographic data on these routes. Northwest and northern Alaska need port infrastructure to support shipping and carry out emergency response and search and rescue activities. Ports of refuge are also needed so that vessels have a safe place to wait out storms, handle emergencies, and wait for assistance. Port Clarence, near Teller on the Seward Peninsula, has been identified as a potential port of refuge, but the nearest deep water is still a mile or so offshore and dredging would be required to enable a vessel to get closer to shore.
The recently formed Northern Waters Task Force comprises 11 local, state, and federal officials from Alaska coastal regions. It is tasked with evaluating the creation of a joint-state/federal commission that would be responsible for overseeing the development of northern ocean waters. The task force was formed in recognition of the strategic and security importance of Arctic waters and the need to provide comprehensive support and infrastructure should new development take place. It is uncertain

Strategic Trends Analysis
ES-8 Final
of the resources that such a commission would have to support new marine infrastructure in the region.
Dredging. Dredging is needed on a regular basis to maintain access to a number of ports in Alaska. River ports have issues with deposition of sediment along their facilities, and in some cases the deposited material can be the result of erosion of barge landings and other improvements upstream. Glacier-fed rivers also contribute a great deal of sediment that ports must dredge. Reasons often cited for the need to dredge include additional demand at the port that cannot be served due to shallow water along dock faces, access to existing facilities that is impeded by shallow water or build-up of sediment, and increased vessel sizes that require deeper water or a larger space for maneuvering or docking. Two examples of the effect of sediment on port activities are seen with the Port of Anchorage and the Port of Dutch Harbor. At the Port of Anchorage, regular dredging is required to maintain the approach up Cook Inlet to access port facilities. At the Port of Dutch Harbor, containerships often have to operate at weights below their full capacity to access port facilities. As shipping companies employ larger containerships in the future, the need for dredging will increase.
Facility Expansion. A common improvement project for ports is to expand or reconfigure their infrastructure to address market needs. As demand increases, facilities may become inadequate and unable to accommodate users in a timely manner. This can lead to increased waiting times or encourage potentially dangerous practices such as rafting of large vessels. Alternatively, while the number of vessels using port facilities may remain steady over time, design changes may lead to a suboptimal use of port facilities. As vessels become wider, for instance, individual stalls may be sufficiently long to accommodate vessels but lack the width and maneuvering space for safe moorage. As market needs change, expansions and reconfigurations will continue to be a major category of improvement. These factors point to the need for modular design, portability, and interchangeability between marine facilities in rural Alaska.
Expansion plans should be tempered, however, with a realistic assessment of infrastructure needs in each region. Some regions have experienced a major build-up in moorage and dock space due to each community expanding according to its local demand. However, when this is done in the absence of consideration for other ports and potential rationalization of local fishing fleets, it can lead to an excess supply of maritime infrastructure, making each community susceptible to downturns in demand and raising the question of what communities should do with their excess capacity and what this means in terms of the revenues needed to maintain their facilities. Available port and harbor infrastructure in a region is an issue that must be considered when evaluating future development, though it should not take away from communities that have legitimate needs.

Strategic Trends Analysis
Final 1
1 Introduction
This white paper identifies and analyzes the strategic trends considered in the development of a long-range ports and harbors plan. This work element consists of synthesizing and drawing conclusions from the existing body of research and prior studies that evaluate trends in maritime operations and facilities pertinent to Alaska.
The impetus for this project was the Corps of Engineers’ first Alaska Regional Ports Conference in January 2008 in Anchorage. The conference brought together state, local, and federal government officials with port and harbor users throughout the state to determine future needs for the coastal and riverine waters in the state. The overwhelming mandate from this group was the need for a collaborative effort to develop comprehensive planning to meet the future needs of Alaska. In addition to the many issues faced by ports and harbors located throughout Alaska, many of the state’s facilities act individually and do not form functional systems. This white paper and subsequent white papers for the Alaska Regional Ports Phase I project are intended to lay the groundwork for this interagency and inter-facility coordination.
1.1 Definition of Terms Used in This White Paper
The following definitions are used in this white paper.
Dock For ships, a cargo handling area parallel to the shoreline where a vessel normally ties up (MARAD 2008).
Dockage Refers to the charge assessed against the vessel for berthing at the facility or for mooring to a vessel so berthed (MARAD 2008).
Harbor Any place to which ships may resort for shelter, or to load or unload passengers or goods, or to obtain fuel, water, or supplies. This term applies to such places whether proclaimed public or not and whether natural or artificial (MARAD 2008).
Hub A location where freight is consolidated to attain economic or operational efficiencies from advantages of infrastructure, location, management and administration, or costs (Lirn et al 2004)
Mooring Attaching to a fixed object in the water to secure a vessel position.
Moorage Charge for mooring; typically assessed by length of vessel and amount of time moored.
Port Area where ships are brought alongside land to load and discharge cargo; usually a sheltered deep water area such as a bay or river mouth (Stopford 1997).
Wharfage Charge assessed by a pier or dock owner against freight handled over the pier or dock or against a steamship company using the pier or dock (MARAD 2008).
1.2 Organization of this White Paper
Section 2 of the paper provides a broad, worldwide perspective of trends in maritime operations and facilities, focusing on recent developments and emerging issues.
Section 3 links these global developments to trends in demand for Alaska maritime operations and facilities. Shipping and market statistics for exports and imports essential to Alaska’s economy are used

Strategic Trends Analysis
2 Final
to forecast future demand for maritime operations and facilities. Also included in this chapter is a discussion of the interrelated impact on the need for harbors of refuge and emergency response.
Section 4 assesses a number of issues relevant to future development of Alaska maritime operations and facilities, including climate change, environmental protection, sociocultural issues, and port infrastructure.
Section 5 provides a broad overview of port and harbor investment needs, using various examples of port-related investments in the United States and abroad to illustrate those needs. This section also includes descriptions of existing and emerging funding sources for port improvements, and discusses port governance issues elsewhere in the United States and the world.
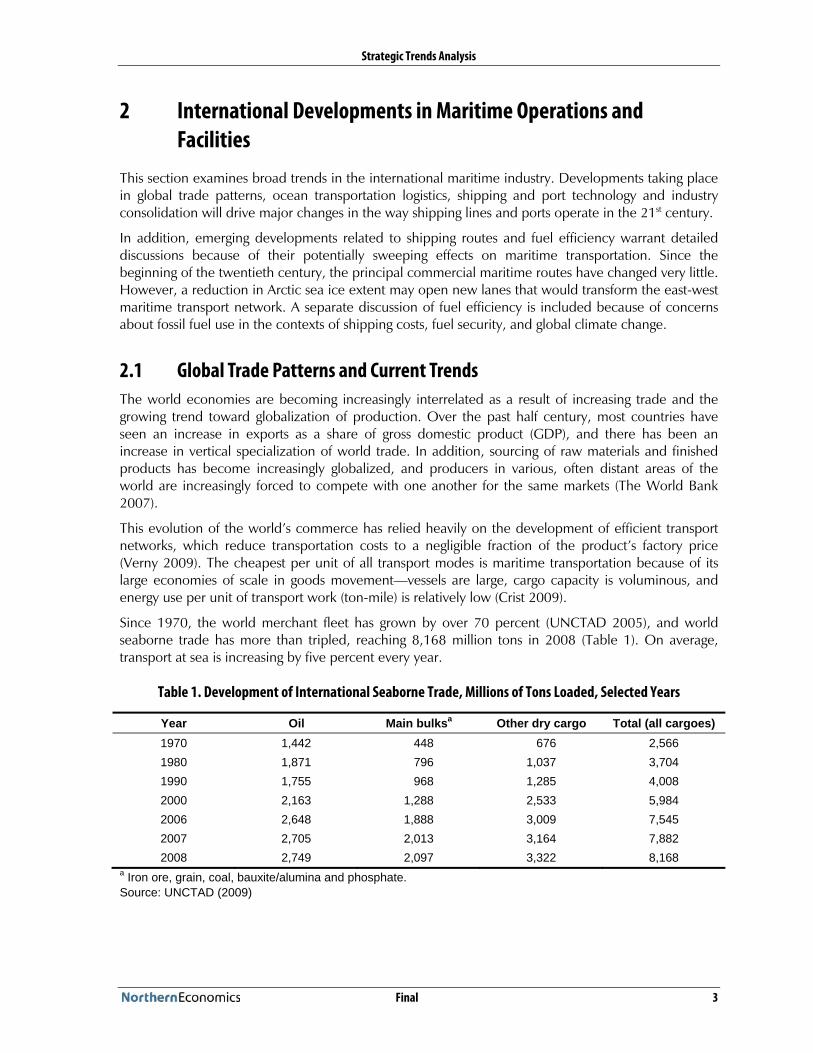
Strategic Trends Analysis
Final 3
2 International Developments in Maritime Operations and
Facilities
This section examines broad trends in the international maritime industry. Developments taking place in global trade patterns, ocean transportation logistics, shipping and port technology and industry consolidation will drive major changes in the way shipping lines and ports operate in the 21st century.
In addition, emerging developments related to shipping routes and fuel efficiency warrant detailed discussions because of their potentially sweeping effects on maritime transportation. Since the beginning of the twentieth century, the principal commercial maritime routes have changed very little. However, a reduction in Arctic sea ice extent may open new lanes that would transform the east-west maritime transport network. A separate discussion of fuel efficiency is included because of concerns about fossil fuel use in the contexts of shipping costs, fuel security, and global climate change.
2.1 Global Trade Patterns and Current Trends
The world economies are becoming increasingly interrelated as a result of increasing trade and the growing trend toward globalization of production. Over the past half century, most countries have seen an increase in exports as a share of gross domestic product (GDP), and there has been an increase in vertical specialization of world trade. In addition, sourcing of raw materials and finished products has become increasingly globalized, and producers in various, often distant areas of the world are increasingly forced to compete with one another for the same markets (The World Bank 2007).
This evolution of the world’s commerce has relied heavily on the development of efficient transport networks, which reduce transportation costs to a negligible fraction of the product’s factory price (Verny 2009). The cheapest per unit of all transport modes is maritime transportation because of its large economies of scale in goods movement—vessels are large, cargo capacity is voluminous, and energy use per unit of transport work (ton-mile) is relatively low (Crist 2009).
Since 1970, the world merchant fleet has grown by over 70 percent (UNCTAD 2005), and world seaborne trade has more than tripled, reaching 8,168 million tons in 2008 (Table 1). On average, transport at sea is increasing by five percent every year.
Table 1. Development of International Seaborne Trade, Millions of Tons Loaded, Selected Years
Year Oil Main bulksa Other dry cargo Total (all cargoes)1970 1,442 448 676 2,5661980 1,871 796 1,037 3,7041990 1,755 968 1,285 4,0082000 2,163 1,288 2,533 5,9842006 2,648 1,888 3,009 7,5452007 2,705 2,013 3,164 7,8822008 2,749 2,097 3,322 8,168
a Iron ore, grain, coal, bauxite/alumina and phosphate.Source: UNCTAD (2009)

Strategic Trends Analysis
4 Final
Maritime transport demand (expressed as ton-miles) increased by a factor of three between 1970 and 2000, and expanded by 43 percent between 2000 and 2008 (Table 2).1
Table 2. World Seaborne Trade, Billions of Ton-miles, Selected Years
Rapid growth in world ton-miles reflects the growing importance of emerging developing economies, such as China and India. Industrialization in these economies, their fast-growing demand for raw materials required for industrial production, and their desire to diversify sources of supply have led these economies to tap into resources found in distant locations such as Latin America and Africa.
Year
Oil
Iron Ore Coal Graina
Five Main Dry
Bulkb
Other Dry
CargoWorld Total
Crude Oil
Petroleum Products
Crude Oil Plus Petroleum Products
1970 5,597 890 6,487 1,093 481 475 2,049 2,118 10,6541980 8,385 1,020 9,405 1,613 952 1,087 3,652 3,720 16,7771990 6,261 1,029 7,290 1,978 1,849 1,073 5,259 3,891 16,4402000 8,180 1,319 9,499 2,545 2,509 1,244 6,638 6,790 22,9272001 8,074 1,345 9,419 2,575 2,552 1,322 6,782 6,930 23,1312002 7,848 1,394 9,898 2,731 2,549 1,241 6,879 7,395 23,5162003 8,390 1,460 9,850 3,035 2,810 1,273 7,118 7,810 25,1242004 8,795 1,545 10,340 3,444 2,960 1,350 9,521 8,335 26,8142005 8,875 1,652 10,527 3,918 3,113 1,686 9,119 8,730 28,3762006 8,983 1,758 10,741 4,192 3,540 1,822 9,976 9,341 30,0582007 9,214 1,870 11,084 4,544 3,778 1,927 10,676 9,665 31,4252008 9,300 1,992 11,292 4,849 3,905 2,029 11,209 10,245 32,746
a Includes wheat, maize, barley, oats, rye, sorghum and soya beans.b Includes iron ore, coal, grain, bauxite/alumina and phosphate.Source: UNCTAD (2009)
Figure 1 highlights the strong interdependence between industrial production, economic growth, global trade and international seaborne trade. These variables are moving in tandem, including falling in 2008 and 2009 as a result of the global financial crisis and economic downturn. A contraction in industrial production reduces output and trade, and by extension, reduces demand for maritime transport services and depresses global seaborne trade (UNCTAD 2009).
While the impact of the global economic recession of 2008–2009 has reduced overall maritime trade, international maritime activity is projected to grow strongly in the future. In particular, maritime trade will continue to grow with rising demand for oil, coal, steel and other primary resources by China (and, to a lesser extent, India) and with the growth of China as an emerging export market (Crist 2009). Overall maritime transport demand is estimated to grow by ~30–46 percent by 2020 and by ~150–300 percent by 2050. Container shipping activity will grow by much more: 65–95 percent by 2020 and 425–800 percent by 2050 (Crist 2009).
1 Demand for maritime transport services is best expressed in ton-miles, as this reflects the evolution of both the cargo volumes as well as the distances travelled and the geographical distribution of suppliers and consumers and buyers and sellers (UNCTAD 2009).

Strategic Trends Analysis
Final 5
Figure 1. Growth in World Trade, Maritime Trade, OECD Industrial Production, and GDP, 1994–2009
Note: GDP is indexed to 1994=100.Source: UNCTAD (2009)
The following sections describe key global trends in the maritime transportation sector that are the result of industry attempts to achieve even greater economies of scale and improve shipping and port efficiency. Many of these trends are interrelated�for example, Cullinane and Khanna (2000) argue that given the current business environment of liner shipping, increasingly characterized by major global alliances and the deployment of ever-larger containerships operating between major transshipment ports, heightened levels of investment in expensive port infrastructure improvements appear inevitable, with more ports gaining “mega-port” status.
2.1.1 Containerization
Containerized cargo, in particular, has increased the efficiency of maritime transportation. Prior to containerization, loading or unloading a ship was an expensive and time consuming task�a cargo ship typically spent more time docked than at sea (Rodrigue et al. 2009). The containerization of breakbulk cargo eliminated the need for smaller packages to be loaded individually at each transportation point, and allowed the shipping unit to be sealed for its entire voyage. This attribute of containerized cargo, together with a change in the composition of international trade, with a shift away from basic commodities towards processed primary products and manufactured goods, favored growth in container volumes (Economic and Social Commission for Asia and the Pacific 2005).2
2 The greatest benefits arise from containerizing cargo with a high ratio of value to weight. However, large wheeled vehicles—one of the highest value types of marine freight—do not fit in standard containers and are often loaded and unloaded without cranes, using special roll-on/roll-off terminals, and ramps to vessels (Helling and Poister 2000).

Strategic Trends Analysis
6 Final
Furthermore, standard containers can just as easily be loaded on a ship, train, truck, or plane, greatly simplifying intermodal transfers (Rodrigue et al. 2009).
Over the last two decades, global container trade is estimated to have grown at an average annual rate of about 10 percent. Containerized trade represented 25.4 percent of all maritime trade by weight in 2008, up from 5.1 percent in 1980 (UNCTAD 2009). In terms of value, containerized trade represents a much larger share of all maritime trade�over 70 percent of the value of world seaborne trade is currently carried by container (Crist 2009). In 2008, the world total of containerized trade reached an estimated 137 million twenty-foot equivalent units (TEU),3
Prince Rupert, B.C. opened its container terminal a few years ago and has plans to expand the infrastructure to handle 5 million TEUs by 2015. Southeast Alaska exports to Asia could move through Prince Rupert, but the rest of state is more likely to continue to use the Port of Dutch Harbor to move containerized exports to Asia, or to transship through Puget Sound ports. However, the development of Prince Rupert as a major transshipment container terminal with Canadian Northern Railroad providing a dedicated rail line to Chicago for containers from Prince Rupert and with direct rail service to Memphis, Minneapolis, and Pittsburgh, makes it difficult to see the Port of Anchorage emerging as a transshipment container terminal in the foreseeable future.
or 1.3 billion tons (UNCTAD 2009). The increasing containerization of maritime trade is a trend that is widely expected to continue into the future. The number of containers coming to Alaska is also expected to increase over time, primarily to meet the needs of increasing population and increased economic activity.
2.1.2 Port Privatization and Global Terminal Operators
Originally, most port facilities were owned or controlled by governments, municipalities, and other public parties. By the end of the 1980s, public sector operators of ports were no longer able to keep up with the developments in international business and the growing demand for their facilities. To raise investments and professionalize operations, many of these public terminals were offered to private parties to improve and operate them. In some cases, whole ports�including land�were sold on a freehold basis to private sector interests (The World Bank undated).4
While a number of port authorities have responded to competitive pressures by turning over port ownership and management to the private sector, U.S. ports have largely watched the port privatization trend from the sidelines (Stubbs 2007).
5 Smaller, special-purpose ports, often handling just one type of bulk cargo such as minerals, forest products, or oil, are more commonly found in private hands,6
3 A Twenty-foot Equivalent Unit (TEU) is a nominal unit of measure equivalent to a 20’ x 8’ x 8’ shipping container.
but large general cargo seaports have remained largely in public hands (Fawcett 2006). On the other hand, although most U.S. ports are not private, they are not altogether public either. The more or less standard port model in the United States is the “landlord” port, which is operated such that the majority of its facilities and services are leased to private vendors through
4 The number of public ports that have been fully privatized is relatively small; they can be found mainly in the United Kingdom and New Zealand (The World Bank and Public-Private Infrastructure Advisory Facility 2007).
5 Many contemporary U.S. ports were created by private entities, particularly railroad companies, during the nineteenth century, but resentment toward the monopolistic control over cargo movement in private ports led communities to begin shifting port ownership and control from the private sector to the public sector (Fawcett 2006).
6 Privately-owned marine terminals account for approximately two-thirds of the deep-draft marine terminal facilities in the United States (Fritelli and Lake 2006).

Strategic Trends Analysis
Final 7
various types of contractual arrangements.7
There are a number of reasons why public ownership of general cargo ports in the United States is unlikely to change, the most important being the continuing skepticism of outright private ownership of such economically critical infrastructure (Fawcett 2006). In addition, U.S. ports are generally well managed, and many have adequate resources to meet the future demands on their facilities (Stubbs 2007). In particular, the public financing capability of port authorities gives them unique access to capital markets and allows them, in some cases, to float bond issues that are tax-free to the buyer (Fawcett 2006).
Furthermore, the public owners of these ports compete aggressively with neighboring ports to secure market share, market their services like private companies, borrow capital, fund major infrastructure development, and manage themselves in a manner resembling private companies (Fawcett 2006). At the same time, port owners must be cognizant of their responsibility as public entities to protect the public interest with respect to community development (including local employment), environmental quality, recreation, etc. (Fawcett 2006).
Nevertheless, during the past several years an increasing number of U.S. port authorities have joined the worldwide trend of leasing their marine terminals to large, multinational corporations.8
The emergence of global terminal operators is illustrated by the development of their market share. In 1993, 42 percent of world container throughput passed through publically-owned terminals, but by 2006 this figure was down to 19 percent (UNCTAD 2007). The trend is toward market concentration of the global terminal operators, with the larger operators acquiring more ports and handling an increasing share of the global container traffic (The World Bank undated). In 2008, the seven largest global terminal operators accounted for a third of the market share of world container throughput. Further consolidation within the port terminal operating industry is expected in the future as ports benefit from a rebounding global economy, thereby creating attractive investment opportunities, and as shipping lines become more consolidated (UNCTAD 2009).
For some private investors terminal operation has become the prime focus of their business, and they have acquired an interest in terminals in more than one region in the world, becoming what are known as global terminal operators (The World Bank undated). All global terminal operators run terminals as profit centers. Some companies engage in specialized terminal management, while others engage in terminal management in the context of a liner shipping operation (The World Bank undated). It is not uncommon for more than one global terminal operator to be involved in a particular terminal (UNCTAD 2009).
In other countries, privatization of many terminals can be attributed to the inability of public entities to raise capital needed to maintain or expand their facilities; privatization was a means to ensure that the port infrastructure remained competitive in the global port network. Alaska may see privatization or public/private partnerships in the future. A new dock and cold storage facility in Dutch Harbor owned and operated by Kloosterboer, Inc. has substantially reduced revenues at the Unalaska Marine
7 The types of services that may be privatized in landlord ports include waterside maintenance [dredging], land acquisition and disposal, marketing of location, development strategies and planning, maintenance of port access, port security, land acquisition and disposal, cargo and passenger handling, pilotage and towing, line handling, facilities security, maintenance and repair, marketing of operations, waste disposal, and landside and berth capital management (Fawcett 2006).
8 A survey by the U.S. Maritime Administration found that at the 17 largest U.S. container ports, 45 terminals (66 percent) were operated by a foreign based company, 5 terminals (7 percent) were operated by a joint venture between a domestic and foreign based company, and 18 terminals (26 percent) were operated by a purely domestic terminal operating company. While the Maritime Administration compiled information on the operation of container terminals at the largest U.S. container ports, similar information regarding other types of marine terminals is not readily available (Fritelli and Lake 2006).

Strategic Trends Analysis
8 Final
Center (UMC), which, prior to the opening of the new facility, generated surplus revenues for the Port of Dutch Harbor that were used to maintain the UMC and other facilities. General fund revenues will likely be needed to support the Port enterprise fund in the future and at some point in time the City of Unalaska could seek to sell or lease the UMC to others in order to reduce costs to the general fund.
The Port of Anchorage is undergoing a very large expansion, which has run into funding difficulties. While Senator Stevens was in office it was possible to receive large federal grants for capital construction, and these federal funds were supplemented with state grants. Substantial sums of money are still required to complete the project, and the schedule may be delayed until concrete plans for funding and financing the facility are completed. Leasing part or all of the facility to a major terminal operator could be one alternative for completing the project.
2.1.3 Shipping Line Consolidation and Alliances
Traditionally, ocean shipping has been a highly fragmented industry. However, over the past decade the industry has seen substantial consolidation. The boom in world seaborne trade has helped raise shipping profits and stoked investor interest, which in turn has led to new capital for expansion and acquisition. While concentration has been occurring in all sectors of the ocean shipping industry, it is most apparent in container shipping where it is estimated that in 2005, 25 carriers out of more than 400 controlled more than 80 percent of container fleet capacity. As in the port terminal operating industry, the expectation is that the consolidation movement in the shipping sector will continue (The World Bank 2007).
In Alaska, consolidation in tug and barge companies operating in western Alaska occurred in the 1990s and earlier this decade. The development of the U.S. Postal Services bypass mail program reduced freight volumes for tug and barge companies and was part of the reason for the reduction in the number of firms operating in the region.
An alternative to an outright merger is the formation of a “global alliance,” whereby major liner companies achieve economies of scale by joining forces to share resources on a worldwide scale but maintain their separate corporate identities. Under a global alliance, for example, companies may pool their containerships, combine their feeder networks, utilize common terminals, and jointly purchase containers to reduce costs and provide more flexible service. In addition, global alliances may offer shipping firms better leverage in negotiations with ports, inland transport, and maintenance and repair suppliers (Clarke 1997). This form of cooperation in the shipping industry has become very common in the major shipping routes and is likely to continue as carriers strive to achieve operating efficiencies and better service (Cullinane and Khanna 2000; The World Bank 2007).9
2.1.4 Transshipment Hubs
Transshipment centers or hubs are, in an international context, specialized ports or terminals handling mainly containers that do not enter or originate from the country itself.10
9 Global alliances among shipping companies can develop into mergers��ntil 1990, both Maersk and Sea-Land Service operated as separate entities, each a major player in its own right. In 1991, they formed a global alliance to improve service and generate operating efficiencies. In 1999, Maersk purchased Sea-Land’s international services for $800 million. The combined Maersk Line company is almost twice the size of its nearest competitor (The World Bank and Public-Private Infrastructure Advisory Facility 2007).
The hub and spoke concept is intended to maximize use of large containerships while providing market coverage to a maximum number of ports. This is accomplished via a network of regional and subregional hubs with onward
10 In an Alaskan context, hubs are defined with different criteria, as outlined in the third white paper for the Alaska Regional Ports project.

Strategic Trends Analysis
Final 9
service to outlying locations. Generally, large linehaul ships (often with capacity in excess of 4,000 TEU) provide service between regional hubs. Progressively smaller ships (or barges) are used to pick up and distribute containers within the region (The World Bank 2007). The increased deployment of large ships designed to make fewer port calls has boosted the concept of high-capacity transshipment ports (Cullinane and Khanna 2000).
By using a transshipment hub, a carrier can service marginal markets that do not justify a direct call with large linehaul ships, interchange containers between liner strings at strategic crossing points, and realize economies from improved port asset utilization. All of these advantages ultimately result in greater profit to the ocean carrier (The World Bank 2007). In addition, transshipment hubs provide local importers and exporters access to linehaul service, thereby reducing transportation time (and possibly freight rates) to and from overseas markets. Reduced transport time increases the competitiveness of exporters, which, in turn, can benefit local economies through job and income creation (The World Bank 2007).
Ocean carriers have been increasingly using regional hubs for transshipment of containers. This is a worldwide trend that is accelerating as larger containerships come into service and the advantages of hub and spoke operations become more apparent (The World Bank 2007). Currently, 17.6 percent of liner shipping port calls are direct, whereas 82.4 percent require at least one transshipment port and 17.2 percent two or more (UNCTAD 2007). The double handling of containers that transshipment operations entail has substantially contributed to growth in port throughput in recent years (particularly when expressed in TEU) (The World Bank 2007).
The most important attribute carriers look for in a transshipment hub is its strategic location relative to the primary origins and final destinations of container traffic. Beyond location, other attributes include the ability to safely accept large ships, extent of terminal facilities, efficiency of container handling operations (including adequate numbers of cranes and sufficient container handling and storage areas), availability of frequent feeder services with an appropriate geographical coverage, and attractive cargo handling charges (The World Bank 2007).
At least in the near term, rivalry for transshipment business will continue to be intense�even the strategic location of ports to trade routes and proximity to regional origin and destination centers does not preclude rivalry for business. An issue confronting transshipment hubs is how to prevent “hub hopping,” a situation where the number of competing hub facilities is growing rapidly and carriers have the ability to take their business elsewhere. The owner of a port facility can be faced with the dilemma of a $100–$200 million investment lying idle if port customers decide to use an alternative facility (The World Bank 2007).11
The long term trend in transshipment is difficult to predict. While the advantages of hubs have resulted in greater profits for ocean carriers, a number of future developments could lead to less transshipment, including more shipping routes, more port development, and more trade per maritime region (The World Bank 2007).
2.1.5 Vessel Size
Port customers are getting larger since the deployment of larger ships enables the realization of economies of scale in ship size (The World Bank 2007). The rule of thumb is that as ships get larger, construction and operation and maintenance costs rise at only two thirds the rate of increases in vessel carrying capacity (Helling and Poister 2000). The global alliances discussed in Section 2.1.3
11 One way to retain hub traffic is to involve one or several carriers in the equity structure of the port facility (The World Bank 2007).

Strategic Trends Analysis
10 Final
have proven to be especially successful in benefiting from the economies of scale achieved through the employment of larger ships.12
Over the past few years there has been a rapid increase in the size of containerships servicing the world’s densest maritime routes.
An important corollary of increasing ship size, therefore, will be the further concentration of mainstream liner business into the hands of fewer main players (Cullinane and Khanna 2000).
13 The share of containerships in excess of 5,000 TEU (commonly called “post-Panamax vessels”) increased from 1 percent in 1996 to 30 percent in 2006 (The World Bank 2007).14 Figure 2 Containership characteristics are shown in and Figure 3 both by generation and vessel type. Vessels in other sectors of the shipping industry are also getting larger. For example, there has been growth in the number of “mega-cruiseships,” which carry 2,000–3,000 passengers or more (The World Bank 2007).
Problems with the larger ships include the massive surge of containers (or passengers) discharged in a single port call and the expense involved in providing sufficient channel and berth depth, terminal area, gantry cranes of adequate size, and other items of equipment and infrastructure. These problems are fading rapidly, however, as ports (especially those in major trading areas) invest in infrastructure to respond to the market demand of carriers (Cullinane and Khanna 2000). The larger question is whether future growth in the volume of maritime trade will justify the continued construction of “mega-ships”�these ships can be only deployed efficiently on the major trade lanes if they are full. The burgeoning new building orders for these ships indicate that shipping companies are wagering that they will be.
Table 3 presents approximate vessel size groups accordingly to generally used shipping terminology, based on dead weight tonnage or moulded breadth.
Vessels employed in the Alaska trade are depth-constrained at most Alaska ports. In many locations, vessels or barges come in light loaded to meet the depth available. AMHS Alaska class vessels need about -25 feet at mean lower low water (MLLW) while ocean going fuel barges need about -20 feet MLLW. Cargo barges require less draft than fuel barges. Vessels and barges entering the mouths of the Yukon or Kuskokwim Rivers must deal with shoals that significantly limit carrying capacity of ocean-going barges. For example, the Coast Pilot indicates that the south entrance to the Yukon River has a maximum depth at high water of 15 feet, so an ocean going fuel barge would need to lighter at least 5 feet of fuel before entering the south entrance. 12 The introduction of large size tonnage not only provides a catalyst for the formation of global alliances, it also increases the interdependence among alliance partners as they seek to procure sufficiently high load factors to fully reap the benefits that come from economies of scale (Cullinane and Khanna 2000).
13 In 2006, the largest containership ever built, Emma Maersk, was launched with a reported 12,508 TEU capacity.
14 Containerships in excess of 4,500--5,000 TEU are called post-Panamax vessels because the size of these vessels precludes them from transiting the Panama Canal. The current expansion of the Panama Canal through the construction of a third set of locks, which is scheduled for completion around 2014, will permit larger vessels to navigate through the canal (Panama Canal Authority 2006). One of the expansion’s greatest impacts will be felt in the fast-growing container trade where expansion will enable larger vessels to transit the canal (Knight 2008). However, the expansion plans are not compatible with the largest (e.g., 14,000 TEU-capacity) containerships expected to be in service by 2014. Because such vessels are most suited to the Asia-Europe trades, it is likely that vessels ranging in capacity between 12,000 and 13,000 TEU will become the “new Panamax” containerships (Lloyd’s Register 2007). Knight (2008:7) discusses a number of constraints that may limit the size of containerships: “The Suez Canal could take in a hypothetical ‘Suezmax’ vessel capable ofcarrying 14,000 TEUs while the Straits of Malacca (separating Malaysia and Indonesia) could support a ‘Malaccamax’ vessel carrying 18,000 TEU. Engineers from Delft University in the Netherlands have already designed an 18,000 TEU vessel. The biggest constraint of this design would be the propeller(s) needed for power. Other constraints, such as time in port and flexibility of service routes are similar to the constraints that eventually limited the growth in size of supertankers.”

Strategic Trends Analysis
Final 11
Figure 2. Containership Characteristics, 1956 to present
Source: EURANS, Ltd. (2010)
Figure 3. Containership Characteristics, 1956 to present
Source: EURANS, Ltd. (2010)

Strategic Trends Analysis
12 Final
Table 3. Approximate Vessel Size Groups
Size GroupDefinition of Vessel Size: Dead Weight Tonnage (dwt) or Breadth
Dead Weight Tonnage Moulded Breadth (meters)Crude Oil TankersULCC, double-hull 350,000–ULCC, single hull 320,000–VLCC, double-hull 200,000-349,999VLCC, single hull 200,000–319,999Suezmax crude tanker 125,000–199,999Aframax crude tanker 80,000-124,000 > 32.31 mPanamax crude tanker 50,000–79,999 < 32.31 mDry Bulk and Ore CarriersLarge capesize bulk carrier 150,000–Small capesize bulk carrier 80,000–149,999 > 32.31 mPanamax bulk carrier 55,000–84,999 < 32.31 mHandymax bulk carrier 35,000–54,999Handy-size bulk carrier 10,000–34,999Ore/Oil CarrierVLOO 200,000ContainershipsPost-Panamax Containership > 32.31 mPanamax Containership < 32.31 mSource: UNCTAD (2009)
2.1.6 Port Infrastructure
In recent years, larger vessels have placed new demands on the physical facilities and services in ports. In some cases, improvements in port facilities may involve infrastructure investments, such as providing better access to the port by increasing the depth of water in entrance channels and alongside berths, extending and supporting existing wharfs, or providing breakwaters.15
The mechanization of cargo handling and the storage requirements because of greater vessel capacities have greatly extended the space demands for port activities. Transshipment activities also contribute to the need for a large area to temporarily store containers that are between two journeys on carriers. Whereas a large container terminal several years ago would have been about 100 acres, transshipment terminals under construction today typically range from 200 to 300 acres each.
In terms of superstructure, better cargo handling equipment and storage facilities may be needed (UNCTAD 2009). For example, container cranes capable of spanning at least 18 rows and 6 tiers of containers on deck will be required to handle the 8,000 TEU or larger ships now in service. There is already a demand from carriers to install ship-to-shore container cranes with an outreach capable of handling 22, and even 23, rows of containers across (The World Bank 2007
15 Most carriers believe 15 meters (49 feet) depth is adequate to accept the largest containerships in service in the foreseeable future, although some carriers have recently specified 16 meters (52 feet) depth for entrance channels (The World Bank and Public-Private Infrastructure Advisory Facility 2007). The largest containership, Emma Maersk, requires a depth of 16 meters. Bulk cargo ships of Capesize class can require 17 meters or more of water depth.

Strategic Trends Analysis
Final 13
Because most ports are situated in urban or semi-urban locations where land costs are high, acquiring additional storage space is often problematic.16
Finally, to make the most use of the port infrastructure and superstructure, these need to be woven together by an effective operational system (UNCTAD 2009). Information technology (IT)�both proprietary and Internet-based�is increasingly employed throughout the ocean transport sector to manage the flow of cargo. IT systems electronically link port administration, terminal operators, truckers, customs, freight forwarders, carriers, ship agents, and other members of the port community. The technology provides port users with real time data on the status of cargo, paperwork, and availability of port facilities, and enables ships and terminals to be part of an integrated office infrastructure. IT reduces time for delivering cargo; provides more accurate transfer and recording of information; reduces manpower for port operation paperwork; offers advance information on ship, barge, truck, wagon, container, and cargo movements; and improves planning and coordination of berths, handling equipment, and storage facilities (The World Bank 2007).
To achieve a high productivity in a relatively small space, ports must have an array of efficient yard cranes that may include automatic stacking cranes, rail mounted cranes used for yard stacking and in-stack transportation of containers in the storage area. Container terminals that involve high capital costs and intensive deployment of cargo handling equipment and other facilities have led to an increase in the number of specialized ports that only accommodate containerships.
17
With the exception of dedicated container handling equipment at Anchorage, Kodiak, and Dutch Harbor, and dedicated cruiseship docks in various ports in Southeast and Southcentral Alaska, publicly owned port and harbor infrastructure throughout much of the state is tied to servicing a mix of barges and coastal freighters, fishing vessels, recreational boats, and other vessels. The marine infrastructure is typically general-purpose and not specialized. As a result, load and unload times, as well as waiting times to access the dock are longer than at more specialized docks and can increase transportation costs and the price of the related commodity or good.
It should be noted that private sector interests with existing marine infrastructure may not want to see public port improvements, since this could result in or increase competition.
2.1.7 Regional Hubs
For international shipping, transshipment centers or hubs are specialized ports or terminals handling mainly containers that do not enter or originate from the country itself. The hub and spoke concept is intended to maximize use of large containerships while providing market coverage to a maximum number of ports. By using a transshipment hub, a carrier can service marginal markets that do not justify a direct call with large linehaul ships, interchange containers between liner strings at strategic crossing points, and realize economies from improved port asset utilization. Transshipment hubs also provide local importers and exporters access to linehaul service, thereby reducing transportation time and possibly freight rates to and from overseas markets. Ocean carriers have been increasingly using regional hubs for transshipment of containers. This is a worldwide trend that is accelerating as larger containerships come into service and the advantages of hub and spoke operations become more
16 All but one of the 30 U.S. ports handling the largest amount of foreign commerce by weight are located in census-defined metropolitan statistical areas. Historically, urban areas hosting maritime ports benefited directly from investment and local employment at the port and in port-related industries, from access to a wider supply of imported goods at lower prices than elsewhere, and from ready access to extended markets for their exports (Helling and Poister 2000).
17 The reductions in both transport cost and uncertainty provided by IT allow distribution facilities to locate fartherfrom markets, permitting them to seek sites outside metropolitan areas where land and labor costs are lower(Helling and Poister 2000).

Strategic Trends Analysis
14 Final
apparent. The most important attribute carriers look for in a transshipment hub is its strategic location relative to the primary origins and final destinations of container traffic. Beyond location, other attributes include the ability to safely accept large ships, extent of terminal facilities, efficiency of container handling operations, availability of frequent feeder services with an appropriate geographical coverage, and attractive cargo handling charges.
Similar concepts but different types of equipment are used in much of Alaska. As described in the Regional Hubs White Paper, there are regional as well as subregional hubs located throughout Alaska. With the exception of container ships that call at the regional hubs of Anchorage, Kodiak, and Dutch Harbor, much of the remaining marine cargo to western Alaska moves via tug and barge to designated hubs and then is transported in smaller equipment to outlying villages similar to the hub and spoke system noted above. In Southeast Alaska the primary hub is Puget Sound but marine cargo mainly moves in a linear fashion with limited use of regional hubs at Ketchikan, Sitka, and Juneau. Coastal freighters also serve Kodiak Island and communities on the south side of the Alaska Peninsula west of Kodiak and along the Aleutian Islands as far as Atka. This service is primarily a linear service out to Dutch Harbor, which functions as a regional hub for communities in proximity to, or located west or north of, Unalaska. On the Yukon River, Nenana receives cargo via rail or truck, which is then transshipped on barges to Yukon River communities. Emmonak and Alakanuk also serve as hubs for cargo that enters via the mouth of the Yukon River.
This study focuses on hubs for several reasons. First, it is recognized that the available funding for marine infrastructure is limited and cannot begin to provide the marine infrastructure that is desired in every community. Second, marine infrastructure is expensive and the costs are even higher in remote communities. Third, the cost to maintain large capital investments in marine infrastructure in small communities can be much larger than could be captured by a reasonable tariff on cargo moving across a dock or other infrastructure. Fourth, some Alaskans have an opinion that the state should ensure hub communities remain economically viable, since it is believed that if the hub communities decline, then the villages that they support cannot remain viable.
It is anticipated that investments in regional and subregional hubs could result in lower costs for shipping companies, which might translate into improved service and lower costs for residents of the hub communities as well as the outlying villages that they support. Thus, a larger number of Alaska residents could benefit from the limited resources that are available. One issue will be ensuring that the benefits from investing public dollars are not captured solely by the transportation companies or the terminal operators, but are at least shared with residents of the region.
2.1.8 Intermodal Transportation Systems
While a port is defined as a facility for receiving ships and transferring cargo to and from them, many ports today do not merely handle ships. A modern port interconnects and offers a choice between various transport modes. Goods are transferred from sea to rail, road, and inland navigation, and vice versa. This intermodality enhances the economic performance of a transport chain by using modes in the most productive manner. Thus, the linehaul economies of rail may be exploited for long overland distances, with the efficiencies of trucks providing flexible local pickup and delivery. Intermodalism is a logical consequence of containerization because standardization of the size and design of the containers themselves led to the standardization of all other aspects of containerization as well, including the design of vessels, materials-handling equipment, and container-hauling trucks, railcars, and planes (Bates 2005).

Strategic Trends Analysis
Final 15
With inland accessibility becoming a cornerstone in port competitiveness, a number of terminals are being designed with intermodality in mind, from handling equipment such as transtainers18
Alaska has a limited road and rail network and intermodal connections are limited to a few ports, mostly in Southcentral Alaska but also at Nenana and Prudhoe Bay. Anchorage, Whittier, Seward, and Valdez are the primary ports in Southcentral Alaska with intermodal connections. Over the years, there has been discussion about connecting villages to reduce the need for infrastructure and improve service delivery to residents of multiple communities. However, a draft report being prepared for ADOT&PF suggests that typically the benefits of connectivity only justify building roads that are at most about 10 miles in length; at greater distances the capital cost of the road and road maintenance exceed the benefits. This finding suggests that there are a limited number of communities where road connections would be beneficial.
and straddle carriers to intermodal information technologies that provide continuous real-time access to cargo- and equipment-status information. In addition, the deregulation of many transport modes in the early 1980s facilitated intermodal contractual agreements. Without the restrictive guidelines of government regulation, carriers were provided an incentive to combine and acquire broad services that could be applied across transportation modes and throughout the supply chain. In effect, carriers were able to create value-added services to meet the needs of their customers (Stank and Roath 1998). Shipping lines, in particular, have started to offer integrated rail and road service to customers (Rodrigue et al. 2009).
The U.S. Department of Transportation, Maritime Administration (MARAD) has recently established America’s Marine Highway Program to increase short haul sea shipping as an alternative to congested highways and rail lines. The AMHS routes are identified as part of the Marine Highway Program. MARAD recently awarded grants to port authorities and others in the Gulf of Mexico, along the eastern seaboard, and on the Mississippi River to improve the infrastructure needed to facilitate growth of short haul sea shipping. Alaska highways and rail lines are not congested presently and it is doubtful if the state would be awarded grants in the foreseeable future unless the goals of the program are modified.
2.2 Shipping Routes
Maritime shipping lines try to offer the most direct services possible. For vessels transiting an ocean between two continents this goal is typically accomplished by following a “great circle,” which is the shortest distance between two points on a sphere. For example, the North Pacific great circle route is the most economic pathway for commerce between northern ports of the west coast of North America to ports in eastern Asia and is a major trans-oceanic shipping route. Alaska sits astride the great circle route�a segment of the route extends from the western Gulf of Alaska, westward offshore from the Alaska Peninsula, and through the Aleutian Islands including the passes at Unimak Pass and west of Tanaga Island.19
18 A transtainer is “a type of crane used in the handling of containers, which is motorized, mounted on rubber tires and can straddle at least four railway tracks, some up to six, with a lifting capacity of 35 tons for loading and unloading containers to and from railway cars” (AAPA, 2009a).
As a result of increasing maritime trade between North America and Asia, the North Pacific great circle route receives considerable vessel traffic. An estimated 2,760 large vessel-transits used Unimak Pass in 2004 (Nuka Research & Planning Group, LLC and Cape International,
19 There is also a more southern great circle route across the North Pacific. This route passes south of the Aleutians and is generally used for voyages from the ports of the Far East to ports south of Portland, Oregon. However, shipmasters will sometimes use the northern route in the winter months to avoid storms in the North Pacific (Nuka Research & Planning Group, LLC and Cape International, Inc. 2005).
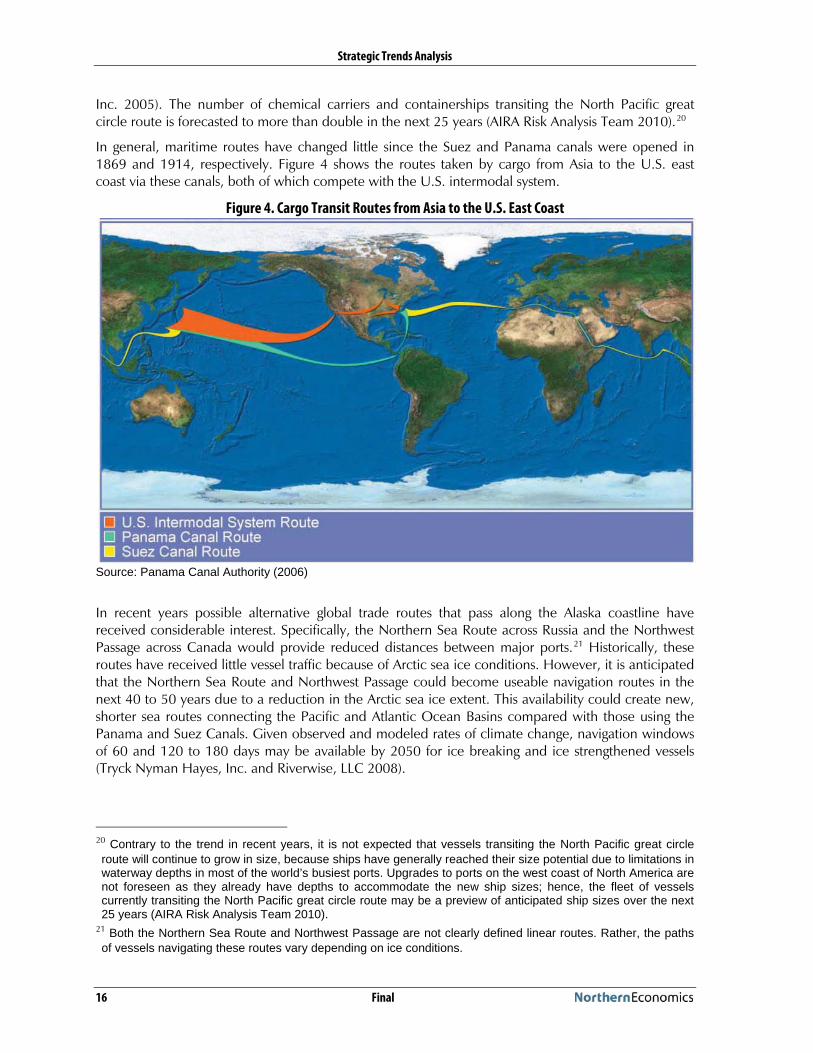
Strategic Trends Analysis
16 Final
Inc. 2005). The number of chemical carriers and containerships transiting the North Pacific great circle route is forecasted to more than double in the next 25 years (AIRA Risk Analysis Team 2010).20
In general, maritime routes have changed little since the Suez and Panama canals were opened in 1869 and 1914, respectively.
Figure 4 shows the routes taken by cargo from Asia to the U.S. east coast via these canals, both of which compete with the U.S. intermodal system.
Figure 4. Cargo Transit Routes from Asia to the U.S. East Coast
Source: Panama Canal Authority (2006)
In recent years possible alternative global trade routes that pass along the Alaska coastline have received considerable interest. Specifically, the Northern Sea Route across Russia and the Northwest Passage across Canada would provide reduced distances between major ports.21
20 Contrary to the trend in recent years, it is not expected that vessels transiting the North Pacific great circle route will continue to grow in size, because ships have generally reached their size potential due to limitations in waterway depths in most of the world’s busiest ports. Upgrades to ports on the west coast of North America are not foreseen as they already have depths to accommodate the new ship sizes; hence, the fleet of vessels currently transiting the North Pacific great circle route may be a preview of anticipated ship sizes over the next 25 years (AIRA Risk Analysis Team 2010).
Historically, these routes have received little vessel traffic because of Arctic sea ice conditions. However, it is anticipated that the Northern Sea Route and Northwest Passage could become useable navigation routes in the next 40 to 50 years due to a reduction in the Arctic sea ice extent. This availability could create new, shorter sea routes connecting the Pacific and Atlantic Ocean Basins compared with those using the Panama and Suez Canals. Given observed and modeled rates of climate change, navigation windows of 60 and 120 to 180 days may be available by 2050 for ice breaking and ice strengthened vessels (Tryck Nyman Hayes, Inc. and Riverwise, LLC 2008).
21 Both the Northern Sea Route and Northwest Passage are not clearly defined linear routes. Rather, the paths of vessels navigating these routes vary depending on ice conditions.

Strategic Trends Analysis
Final 17
Examples of the approximate reductions in distance traveled and sailing time that the Northern Sea Route and Northwest Passage would provide are shown in Table 4. In the Pacific Northwest/North Europe trade (Seattle-Rotterdam), the Northern Sea Route offers a significant distance savings—in this case 1,700 nm or 20 percent compared with the Panama Canal. The potential mileage savings in the Alaska/North Europe trade (Anchorage-Rotterdam) is even greater—3,800 nm, or 38 percent. Use of the Northwest Passage would also result in substantial cost savings�it is estimated that a single containership using the route to reach New York City from Asia could save up to $2 million on fuel and Panama Canal tolls (Reiss 2010).
Table 4. Illustrative Comparison of Mileage and Unconstrained Sailing Time via Arctic Sea Routes and
Existing Canal Routes
Existing Route Potential Alternative Miles Saved Days SavedNorth Europe–North Asia (Yokohama–Rotterdam) via Suez Canal
North Sea Route 3,590 8–11
North Europe–Pacific Northwest (Seattle–Rotterdam) via Panama Canal
North Sea Route 1,740 3–6
North Asia–United States East Coast (Yokohama–New York) via Panama Canal
Northwest Passage 2,240 4–7
Source: Tryck Nyman Hayes, Inc. and Riverwise, LLC (2008)
However, a number of issues and impediments to the use of Arctic sea routes exist, including the following:
Seasonality and Year-to-Year Variability—Because of the relatively short duration of the Arctic navigation season, ship owners cannot necessarily recoup their investment over a full year of operation nor can ship operators and shippers rely on consistent year round scheduling. The high year-to-year variation in the navigation further limits the ability of ship operators and shippers to plan schedules and deliveries using the Arctic (Tryck Nyman Hayes, Inc. and Riverwise, LLC 2008). Given this unpredictability, it would be difficult for shipping companies to guarantee reliable transit times, which are key to the economic viability of the shipping industry.22
Ice-Class Vessel Requirements—The higher construction and operating costs associated with ice-classed vessels, together with the higher insurance premiums due to climatic hazards, require premium shipping rates, which are not necessarily offset by shorter distances (Tryck Nyman Hayes, Inc. and Riverwise, LLC 2008; Verny 2009).
23
Vessel Support and Safety Considerations—Maintaining the pace of a regular shipping line requires guarantees that a ship can receive assistance with minimal delay (Verny 2009). The absence of major ports, except for those in northern Norway and northwest Russia, and other critical infrastructure will be significant limitations. For example, the U.S. Beaufort Sea coast has no port facilities or harbors suitable for refuge for medium to deep draft vessels. Moreover, gaps in hydrographic data important
22 Future shipping levels in the Northwest Passage are expected to be less than in the Northern Sea Route because the oldest and thickest sea ice in the Arctic is pushed into the western edge of the Canadian Arctic Archipelago, making the Northwest Passage particularly dangerous to navigate and delaying future reductions in sea ice (Arctic Council and PAME 2009).
23 Insurance costs can also be high for other sea routes. For example, ships that transit via the Gulf of Aden and Suez Canal currently have to purchase war risk insurance coverage at $20,000 per ship per voyage (excludinginjury, liability and ransom coverage), as compared with the $500 required a year ago to purchase additionalinsurance coverage (UNCTAD 2009).

Strategic Trends Analysis
18 Final
to support safe navigation exist for significant portions of the proposed shipping routes (Arctic Council and PAME 2009).
Geopolitical Issues—Russia and Canada claim formal jurisdiction over the Northern Sea Route and Northwest Passage, respectively, based on Article 234 of the 1982 United Nations Convention on the Law of the Sea (also called the Law of the Sea Treaty). Article 234—Ice Covered Areas—allows coastal states to establish laws and regulations to prevent, reduce, and control marine pollution within ice covered areas of their Exclusive Economic Zone (EEZ).24 Under this provision, Russia has unilaterally prescribed and enforced extensive jurisdiction over the Northern Sea Route. Since 1991, for example, when the Northern Sea Route was opened to foreign vessels, the Northern Sea Route Administration in Russia’s Transport Ministry has imposed multiple fees and taxes to travel the route.25
It is uncertain whether Russia’s and Canada’s claims of jurisdiction over the Arctic Sea routes will be disputed by the United States and other countries, and, if so, whether the disputes can be successfully resolved in an international framework.
For comparable ships, these fees are about two times higher than those for passage through the Suez Canal, as they include payment for the assistance of an ice-breaker ship, meteorological forecasts, and other costs (Verny 2009). There is some thought that Article 234 may also be used by Canada to regulate international vessel transits through the Northwest Passage (Arctic Council and PAME 2009).
26
The U.S. Coast Guard (USCG) is currently conducting a study to assess whether the creation of a vessel routing system is advisable in the Bering Strait area. Establishing predictable and charted routing may address some of the issues and impediments listed above by reducing congestion and making vessel movements more predictable, thereby decreasing potential for collisions, oil spills, and other threats to the marine environment. The study will take a minimum of two years to complete and results may validate the status quo (no routing measures) or may conclude that changes are needed to enhance the navigational safety and efficiency of vessels (Federal Register, 2010).
While the United Nations has jurisdiction, through the Law of the Sea Treaty, to consider various claims, the United States has not yet ratified the Treaty and could maintain exemption from any resolution (Tryck Nyman Hayes, Inc. and Riverwise, LLC 2008).
24 Article 234 states: “Coastal States have the right to adopt and enforce non-discriminatory laws and regulationsfor the prevention, reduction and control of marine pollution from vessels in ice-covered areas within the limits of the exclusive economic zone, where particularly severe climatic conditions and the presence of ice covering such areas for most of the year create obstructions or exceptional hazards to navigation, and pollution of the marine environment could cause major harm to or irreversible disturbance of the ecological balance. Such laws and regulations shall have due regard to navigation and the protection and preservation of the marine environment based on the best available scientific evidence.”
25 Russia’s fee system for use of the Northern Sea Route includes the cost of icebreaker assistance, irrespective of whether the services of Russia’s icebreaker fleet are needed for a vessel’s passage along the route or not. The Murmansk Shipping Company, the private firm that owns and operates the icebreaker fleet, maintains that this fee system is necessary to finance fleet operations (Aker Arctic Technology 2006; Laiho et al. 2005). However, Russia’s Transport Ministry has indicated that it is considering lowering the flat fee in order to encourage international vessel traffic along the route. In 2009, as part of Russia’s promotion of the Northern Sea Route, two German ships became the first non-Russian merchant vessels to receive a permit to travel the route. Carrying 3,500 tons of construction materials, the ships began their voyage in South Korea and ended it in Rotterdam. Russian ships have long moved goods along the country’s Arctic coastline, and two tankers, one Finnish and the other Latvian, have hauled fuel between Russian ports using the route (Kramer and Revkin 2009).
26 Questions have been raised with respect to the breadth of coastal state regulatory powers under Article 234 and to the consistency of Article 234 with other provisions in the United Nations Convention on the Law of the Sea such as the right of “innocent passage” (Article 17) and right of “transit passage” (Article 38) (Arctic Council and PAME 2009; Pharand 2007; Stepanov and Brubaker 2005).

Strategic Trends Analysis
Final 19
2.3 Fuel Efficiency
Shipping lines worldwide struggled as crude oil prices topped an unprecedented $145 per barrel in 2008, in turn pushing marine bunker fuel prices to a record $767 per ton. Fuel costs represent as much as 50 to 60 percent of total ship operating costs, depending on the type of ship and service. Recovery of fuel cost from cargo customers is a challenge when one considers that vessel capacity utilization is not 100 percent, that trades are not evenly balanced (e.g., U.S. trans-Pacific exports may utilize only half of a vessel’s capacity), and that different trades and commodities can handle different levels of rates (World Shipping Council 2008).27
There are also growing concerns about our dependence on oil, a non-renewable resource, and the security of energy supply. The issue of energy security is particularly significant for the transportation sector, where the price elasticity of demand for petroleum-based fuel is low and transport services are critical to the economy. In this day and age an oil shortage wouldn’t be a mere inconvenience, it would be nearly catastrophic (Fisk 2004). While it is debatable as to when worldwide production of conventional crude oil will peak, there is little disagreement that all or very nearly all of earth's major petroleum basins have been identified, all or nearly all of the largest oil fields in these basins have been discovered and are being produced, and production is clearly past its peak in some of the most prolific basins.
While oil prices dropped substantially in 2009, they are expected to again increase with the recovery of the global economy.
The prospect of rising fuel costs and fuel shortages has underscored the importance of using the most fuel efficient modes of transport. Maritime transportation is generally considered the most energy efficient of all transport modes, above all if energy efficiency is measured in terms of the distance one ton of cargo travels using 1 kWh of energy (Figure 5).28
To date, carbon dioxide (CO2) reduction imperatives have taken a back seat to fuel cost and fuel security imperatives (Crist 2009). Yet, energy policy at the beginning of the twenty-first century is increasingly being shaped by efforts to combat global climate change. It is also noteworthy that reducing carbon emissions is, in many cases, an inadvertent byproduct of reducing fuel consumption in order to lower operational costs (Crist 2009).
Maritime transport compares favorably to other modes of transport in terms of “climate-friendliness.” Figure 6 indicates a range of relative CO2 intensities (measured as grams CO2 per tonne-kilometer) for freight transport for indicative purposes. Large container vessels compare extremely well with air transport (although the amount of overlapping cargo is limited to relatively high-value goods), whereas smaller container vessels’ CO2 emissions are within the range of rail but well below truck transport.
27 In order to improve the way with which shipping lines handle fluctuations on fuel costs, some are adopting a floating fuel surcharge component known as the Bunker Adjustment Factor. By charging fuel as a percent of transportation costs, they are able to insulate themselves (at least in part) from rising fuel prices (Notteboom, 2009).
28 Not all modes displayed below are interchangeable (e.g. bulk oil products not transported by sea are likely tobe transported by pipeline rather than by road or rail and non-maritime carriage of bulk dry goods will occur by rail rather than by road), and for intercontinental trade, maritime transport is the only available transport option. Nonetheless, some trade characteristics and transport distances are somewhat similar (e.g., intra-continental rail vs. large container vessel and inter-continental container transport vs. air) (Crist 2009).

Strategic Trends Analysis
20 Final
Figure 5. Distance Traveled With One Ton of Cargo Using One kWh Energy for Different Transport Modes
Source: Maersk Line (undated)
Figure 6 . Carbon Dioxide Emissions for Different Transport Modes
Source: Maersk Line (undated)
Further significant improvements in fuel efficiency and CO2 emissions are obtainable by changing shipping practices. Perhaps the most important trend in shipping today is “slow steaming,” which simply means running at a slower speed. Slow steaming can not only significantly cut CO2 emissions, but it also reduces fuel consumption and costs. For example, increasing service speed from 23 to 26 knots for an 8,000 TEU container vessel increases its fuel consumption by as much as 80 tons per day (Notteboom and Vernimmen 2009).29 Assuming a bunker price of about $450 per ton, this translates into a daily cost increase of $36,000. For a 12,500–13,000 TEU container vessel, which will become the workhorse on the Far East–Europe trade route within the not too distant future, the daily cost increase would even amount to $51,750 when service speed is increased from 23 to 26 knots. Furthermore, a slower vessel speed does not necessarily mean poorer service. With new information technology that provides the shipping industry with a real time view of the entire supply chain, contracts can now be renegotiated to minimize use of the term "utmost dispatch" when it is not applicable (World Food Programme 2009).30
29 These are typical figures that might slightly vary depending on factors such as the draft and trim of the vessel, the hull roughness, fouling, propeller condition, sea state, wind force and direction and currents (Notteboom and Vernimmen 2009).
30 At "utmost dispatch" is a contractual term used for many years to ensure vessels sailed at their maximum speed, not necessarily their most efficient speed, and did not lose time moving goods from one port to the next(World Food Programme 2009).
0 10 20 30 40 50 60 70 80
PS-type container vessel (11,000 TEUs)
S-type container vessel (6,600 TEUs)
Rail - electric
Rail - diesel
Heavy truck
Boeing 747-400
Kilometers
0 100 200 300 400 500 600
PS-Type Container Vessel (11,000 TEU)
S-Type Container Vessel (6,600 TEU)
Rail (Electric)
Rail (Diesel)
Heavy Truck
Air (Boeing 747-400)
Grams of CO2 per Tonne-Kilometer

Strategic Trends Analysis
Final 21
Slow steaming is only one of many ways in which the maritime transport industry could make notable improvements to energy efficiency and CO2 emissions (Crist 2009). Many of the operational and technical measures that could result in improvements are available for implementation on existing vessels, while other measures are available (or will be available in the foreseeable future) for newbuildings. It is estimated that the combined technical and operational measures have the potential to reduce CO2 emissions by up to 43 percent per tonne-kilometer by 2020 and by up to 63 percent per tonne-kilometer by 2050 (Crist 2009).

Strategic Trends Analysis
22 Final
3 Trends in Demand for Alaska Maritime Operations and Facilities
No other state in the continental U.S. depends on water transportation to the extent Alaska does. Access to water was a critical factor in the development of the state and often dictated the location of communities. Today, Alaska‘s ports and harbors remain an essential element of the state‘s economy. They are critical for the import and export of goods as well as bulk commodities. Alaska waterways provide the transportation corridors for the movement of the majority of the cargo delivered to Alaska, as well as the majority of exports, including all of the state’s oil and gas exports and much of the seafood and minerals.
Alaska’s dependence on waterborne commerce is the result of its geography and isolation from the rest of the nation. Alaska’s 33,900 miles of coastline is far greater than that of the entire Lower 48. Commercial shippers serve this extensive coastline as far north as Prudhoe Bay. The Yukon, Tanana, and Kuskokwim rivers and some of their tributaries are also important shipping routes for communities along these drainages (Fried and Keith 2005). There are approximately 476 ports and harbors in Alaska, with 240 in Southeast Alaska and 236 in Southwest and Western Alaska combined (Alaska Department of Transportation and Public Facilities 2008).31 Of the 123 public ports and harbors in Alaska, 28 are owned by the Alaska Department of Transportation and Public facilities, and 95 are owned by local governments (Alaska Department of Transportation and Public Facilities 2008).32
In contrast, other transportation modes exist on a modest scale in Alaska. The state is connected to the rest of the nation via the Alaska Highway and the Taylor Highway farther to the north, but it does not have any direct connections to the Lower 48’s interstate highway system except through Canada. With only 1,082 miles of highway, most of which form the triangle between Fairbanks, Anchorage and Tok (an area that represents one-fifth the size of the state), the largest state in the nation ranks 47th in terms of highway mileage (Fried and Keith 2005; Inboundlogistics.com 2004).
33
31 This does not include barge landing and boat haulout facilities along the riverine communities of the Kuskokwim and Yukon Rivers.
Alaska’s one year-round rail system operates along the 470-mile Seward–Anchorage–Fairbanks corridor with no outside connection. The Alaska Railroad Corporation is the sole rail freight carrier operating in Alaska. The airports of many Alaska communities lack terminal facilities, paved runways, and runways long enough for jet service, thus restricting the type of air service that is available. Generally, propeller-operated aircraft service is the only option, and passenger and cargo space is limited on these aircraft. In short, Alaska’s reliance on waterborne commerce is largely out of necessity�other transportation modes do not have the capability of exporting or importing the full range of goods upon which the state’s economy depends.
32 In the past, the Alaska Department of Transportation and Public Facilities had a larger role in the construction, maintenance, and operation of harbors. The agency built 98 of the 123 public ports. Starting in 1984, during a time of economic downturn and cost cutting by the state government, the Department of Transportation and Public Facilities began a program of divesting itself of its waterfront infrastructure facilities. Local governments,in exchange for the payment of deferred maintenance funds, took over ownership and responsibility for many of these important port and harbor facilities (Alaska Department of Transportation and Public Facilities 2008)
33 In total, Alaska has 12,700 miles of roads (about the same as Vermont), but only about 30 percent are paved(National Research Council 2008).

Strategic Trends Analysis
Final 23
3.1 The Roles of Ports and Harbors
We discuss ports and harbors in this report and the reader should be aware that these terms describe different concepts. Ports are generally focused on the movement of freight and people on larger vessels (ships) and selected to optimize access to land and navigable water. A port has supporting infrastructure such as, wharfs, jetties, piers, storage yards, warehouses, and slips with cranes or ramps, and typically has intermodal connections with railways, roads, pipelines, or aviation facilities to move goods and people to and from other locations beyond the port area. A port can consist of one or more harbors, but the purpose of the port is not protection of the vessel as much as the efficient transportation of goods and people.
A harbor, as used in this report, is a place where, generally, smaller vessels (boats) seek shelter from the weather or are moored. Harbors can be man-made using breakwaters or sea walls and may require dredging. A natural harbor is surrounded on most sides by land. Harbors can also provide transportation functions, but for smaller volumes of cargo and passengers that are moved via smaller vessels and generally for distances much shorter than for ships operating from ports. Harbors provide slips or berths for moorage and can also have docks, ramps, and smaller cranes for offloading freight, seafood, and equipment. Harbors are public facilities that are necessary for some economic sectors, but harbors may not generate a revenue stream. Harbors are not necessary in all communities, particularly for riverine communities where skiffs can be dragged up the river banks if necessary to find safe moorage.
There are significant differences between ports and harbors in terms of scale, users, financing, and administration. Ports often have a broader, statewide significance and require economic capital and strategic investment, while state support for harbors traditionally means empowering local governments with the tools needed to take care of their own local needs, along with financial and administrative support. Whereas ports form logistical networks, harbors are less connected and are traditionally located in proximity to either population or seafood resource bases.
In the following subsections we discuss the roles that ports and harbors play in the transportation of goods and people throughout Alaska, and the economic activity that they generate or facilitate in the local community and region.
3.1.1 Transportation
At the theoretical level, ports and harbors function as nodes between modal transportation links. A node is a connecting point in a network or transportation system. The transportation links can be multi-modal and represent marine, rail or road, aviation, or pipeline transport. In the real world, many Alaska ports are the nodes or hubs in a hub-and-spoke concept for on-forwarding goods and people to smaller communities in the region. Since there is a limited road and rail network in the state, most of the links to the smaller communities are provided via marine or air transportation. The following subsections discuss these concepts in the context of Alaska ports and harbors.
3.1.1.1 Intermodal Nodes
There is a large range in the intensity of intermodal connectivity in Alaska. The Port of Anchorage is at one end of the spectrum, with scheduled container service from Puget Sound, road connections to the continental highway system, rail connections to the Railbelt communities, pipeline connections for petroleum products, and one of the busiest cargo airports in the world in terms of landed weight (Ted Stevens Anchorage International Airport, 2008). Most of the consumer goods used by rural
Strategic Trends Analysis
24 Final
communities located north and west of Anchorage arrive via container ships and are then transported by plane under the bypass mail program to their final destinations.
At the other end of the range are ports such as Kotzebue, which has ocean-going barge service but freight must be lightered 10 miles or so to shore via smaller barges and shallow draft tugs. Kotzebue has a jet-capable airport, but no surface connections to other communities. Other ports such as Haines and Skagway have ferry and barge service in addition to road connections, but smaller airports. It seems in many communities that the absence of one or more types of modal connectivity results in the remaining available modes providing enhanced service and facilities to offset the absence of another mode. It is important to recognize this situation when developing comprehensive transportation planning documents.
Harbors also have a role in intermodal connectivity, but with smaller equipment and smaller volumes. People may commute from their residence to work via boat and have a reserved slip to moor the vessel while at work. A number of communities with harbors in Southcentral Alaska have connectivity to the continental highway system, and some harbors, primarily in Southeast Alaska have slips for float planes, which provide air service to and from nearby communities. While ocean-going tugs and barges generally can’t be accommodated in harbors, large landing craft are capable of moving substantial volumes of freight to and from other communities, construction sites, and resource extraction sites by using ramps that are designed into many harbors.
As indicated by these examples, there is a wide range of intermodal connectivity required in moving people, goods and materials around the state. Thus, it is important that a statewide transportation plan address all elements of the transportation system, even recognizing the role played by the private sector in providing facilities or equipment for the system. The objective of including information for the private sector investments would be to ensure that intermodal connectivity is optimized. The state may not need to build facilities or supply equipment; information alone could facilitate coordination and potentially reduce the cost of moving from one mode to another, or between communities.
3.1.1.2 Regional and Subregional Hubs
Ports and harbors also function as transshipment centers, or transportation hubs for their hinterlands. The hinterland can extend inland from the hub community as well as along the coastline in a region. Typically the regional and subregional hubs are the largest or at least a larger community in a region because of the level of economic activity in the community, which is partly derived from the presence of the port or harbor.
The state and federal governments can effect improvements in publicly-owned regional and subregional hubs, which could result in greater efficiencies and resultant cost savings in the supply chain for much of rural Alaska. Good bulkhead docks and adequate water depths are important in regional and subregional hubs, as are sufficient storage areas. Projects that improve the operating efficiency of these facilities and potentially reduce the cost of transshipment would benefit an entire region and not just the regional or subregional hub community.
As noted above, the Port of Anchorage has the largest hinterland of any port in the state, with goods that are brought into the port moving by air transportation and the bypass mail program to supply most of the communities located north and west of Anchorage. The bypass mail from Anchorage is moved via large aircraft to postal hubs in regions around the state where the cargo is then loaded into smaller aircraft for transport to the final destination community. A similar system is used for marine transportation, where large ocean-going barges move fuel and material from Puget Sound ports, Cook Inlet ports, or other locations to larger communities or locations in western and Arctic Alaska. From there, the freight is then brought to regional and subregional hub ports for offloading and then placed

Strategic Trends Analysis
Final 25
on smaller barges or landing craft for final delivery to coastal and riverine communities. In some situations, the fuel or cargo is transferred at sea from the large ocean-going barges to smaller equipment for final delivery.
Regional and subregional hubs play an important role in the marine transportation system and the re-supply of rural communities by providing storage capacity that is sufficient to take a large ocean-going fuel barge and hold the fuel while it is delivered over time with multiple trips to local communities. Similarly, they have large storage yards sufficient to hold multiple containers and other material from ocean-going barges, which may require several trips on smaller vessels to the final destination. Regional and subregional hubs generally have large equipment for efficiently offloading and loading containers as well as heavy and bulky construction materials. These attributes reduce costs for residents of the hub communities as well as residents of outlying communities.
The equipment used to transport the fuel and freight is operated by private firms, so the state and federal governments have limited ability to affect improvements in that segment of the marine transportation system since private industry already has an incentive to decrease costs and maximize profits. However, industry indicated there were several areas where dredging programs could make it possible to bring fully loaded barges into hub communities rather than lighter the load or come in only partly loaded. Lightering or arriving at less than maximum capacity increases the transportation costs to local residents and dredging could reduce those costs.
3.1.2 Economic and Community Development
Ports and harbors are centers of economic activity and contribute to the economic vitality of their communities. The following subsections describe the current and future roles of ports and harbors in community waterfront development and community economic development in general, followed by a discussion of opportunities where ports and harbors can facilitate or contribute to basic industry (e.g., tourism, fisheries, mining, and oil and gas) growth.
3.1.2.1 Waterfront Development
Ports and harbors are the interface of marine-oriented activities such as transportation and fishing, and land-based activities such as manufacturing, resource extraction, and agriculture. At the interface, development is required to support the vessels and landside transportation networks and the goods and material that flow between maritime shipping and landside transportation. This waterfront development can consist of a wide range of activities and businesses ranging from those catering to recreational or small commercial vessel owners and parts and supplies for those vessels, to large warehouses and storage yards to consolidate goods and materials being shipped to or from the port.
If we consider the trends that were discussed previously in this report there are several changes in the roles of ports and harbors that may occur in certain locations in Alaska. The change that will be most widely realized in the state is an increase in the density and intensity of development on the waterfront. This trend is evident over the past several decades in many ports around the state. Restaurants and businesses catering to cruiseship passengers or visitors taking a day cruise are now found in many ports. Charter boats are found in many harbors, and fish processing plants provide increased economic activity in the communities where they are located. Smaller and remote communities may not see large cruiseships or even day-cruise boats, but the interface is still there and economic activity can be found around the port or harbor, albeit on a smaller scale.
Part of this trend to higher density and intensity of use can be seen in the replacement of industrial and freight transportation activities in many ports around the world by uses that can pay higher land prices. In a number of instances, commercial, office, and even residential uses have replaced

Strategic Trends Analysis
26 Final
traditional port uses and tenants. This portion of the trend is only likely to occur in a few Alaska cities (e.g., Juneau and Seward) that are constrained by land availability, and where renewal of older elements of a community is presently ongoing.
Twenty years ago, many vessel owners had to take large vessels to Puget Sound ports for maintenance and repair. Today, with haul-out facilities for large vessels at Naknek, Kodiak, Unalaska/Dutch Harbor, Seward, and Ketchikan, most Alaskan vessels can now be worked on in local boat yards. Similarly, there has been an increase in the breadth of services supplied to the maritime industry and an expansion of maritime activity. The state’s labor force has grown and Alaska workers now provide many of the skills required to service the vessels located in the state or calling at Alaska ports. This trend is likely to continue as the cruise industry positions more ships in the Alaska trade, the number of mega-yachts calling in Alaska waters increases, and population growth requires larger volumes of fuel and supplies for Alaska residents. The amount of land surrounding waterfronts is limited, so the best option is to increase the density and intensity of this development.
Various federal and state agencies could assist local governments in developing the waterfront interface through construction of infrastructure and encouragement of business. We’ve discussed the roles of the USACE and the ADOT&PF in constructing harbors and conducting dredging projects. ADOT&PF can also construct the road connector to such ports or harbors and provide funds through the harbor improvement grant program to address deferred maintenance and other issues. The ADCCED has several grant programs that can be used for waterfront or upland development projects. The Denali Commission can provide road or other connectors as well as provide funding for smaller ports and harbor projects. The EDA participates in projects where it can be demonstrated that jobs will be created. The EDA is more likely to contribute grant funds for waterfront and upland development projects. The USDA has several grant and loan programs that can be used to plan and construct waterfront and upland infrastructure, utilities. There are a number of examples that can be cited where these organizations have funded waterfront and associated uplands development throughout Alaska. The number of such projects demonstrates the level of interest from federal and state parties in making investments in these centers of economic activity.
As noted above, the presence of a port or harbor contributes to the total economic activity in a community. This contribution extends beyond the activities and businesses that are located on the waterfront and extends to businesses located elsewhere in the community and the local government(s) that are present. Other businesses, defined as those that are not located on the waterfront, receive additional revenue from the expenditures by vessel owners and crew, and their families, in grocery stores and other commercial entities. Employees at the seafood processing plant spend money in the community and the owner of the plant purchases goods and services from local vendors. Visitors to the community purchase goods and services at local businesses, including charter fishing firms, restaurants, hotels, etc. The local government may have sales taxes and fish taxes that form the primary source of income to the city or borough. In addition to this spending, further expenditures by other business owners, their families, and employees round out the multiplier effect to increase the level of economic activity in the community. The web of interconnected expenditures emanating from ports and harbors is wide and pervasive.
3.2 Alaska Industry Development
More than any other mode, maritime transportation is linked to the primary industries that are the foundation of Alaska’s economy, including the oil and gas, commercial fishing, mining, and cruiseship/tourism industries. Alaska’s resource industries generally operate in high production cost environments where distances to markets are great. The main advantage of maritime transportation is

Strategic Trends Analysis
Final 27
its economies of scale, making it the cheapest per unit of all transport modes for long distances, which fits well for Alaska’s heavy industrial activities.
New ports will need to be developed to serve the needs of new resource extraction industries or expansion of current industry into new areas of the state. In some instances, this may result in new ports being developed in existing communities or new enclaves similar to the industrial support center at Prudhoe Bay. In other instances, ports or harbors that have tourism and/or fishing as their major economic activity may see a change in the types of vessels calling at their facilities, creating a need for infrastructure that does not presently exist. While private industry could probably supply such infrastructure, economic development efforts to attract new or better jobs may be the basis for local communities to finance such infrastructure with public funds.
In general, Southeast Alaska communities have harbors adequate to meet local demand. Other regions of the state are still developing their marine and riverine infrastructure so most new harbors would be in these regions.
The following sections examine the connection of Alaska’s major industries to maritime transportation. Each section then forecasts future demand for maritime operations and facilities based on industry production trends and other factors, including the international developments in maritime transportation discussed in Chapter 2.
It is important to note that forecasting future demand for Alaska’s natural resources is difficult. Most of the products produced by Alaska’s resource industries are sold in international markets, and these products generally account for only a small percentage of the overall world supply. Consequently, Alaska industries typically have a very limited ability to influence prices for their products, and resource development in Alaska is subject to the volatility of international commodity markets.
Several of the tables in the sections below show the movement of commodities through Alaska ports based on data compiled by the U.S. Army Corps of Engineers. These data may not match data from port records, but the U.S. Army Corps of Engineers is the only source of readily available, comprehensive, and consistent information on the type of products that move through ports.
3.2.1 Oil and Natural Gas Production
The oil and gas industry is by far Alaska’s single most important industrial sector. It generates more than a quarter of the state’s gross state product and supports about one-third of all the jobs held by Alaska residents (Fried 2008; Goldsmith 2008). Oil revenue makes up 88 percent of the state general fund’s unrestricted revenue (Fried 2008).
The oil and gas industry is a high-margin business and in Alaska the returns on investment are great enough that the industry and its related contractors have built most of the infrastructure that is required, with a few notable exceptions such as the Dalton Highway and the Deadhorse airport. BP Alaska operates the West Dock at Prudhoe Bay, while ConocoPhillips operates the East Dock in the same area. In both cases, these firms operate the facilities on behalf of all operators that have an investment in the Prudhoe Bay unit. In some cases, an oil and gas industry contractor will step forward to fill the need for marine infrastructure, such as Crowley did in building the Rig Tender dock in Cook Inlet when offshore oil and gas activity began there. Alaska’s Arctic Coastal Plain, commonly referred to as the North Slope, is where the state’s oil production is concentrated. With the discovery of the Prudhoe Bay oil field in 1967 and the ongoing drilling programs on the North Slope, tugs and barges have delivered living quarters, power stations, and service buildings of modular construction

Strategic Trends Analysis
28 Final
(Haglund 1983).34
Table 5
Most North Slope crude oil is transported by the Trans-Alaska Pipeline System to the Port of Valdez, where it is loaded onto crude oil tankers (vessels designed to transport crude oil in bulk) for shipment to U.S. West Coast refineries ( ).35
Table 5
Valdez is the state’s leading port in terms of tonnage, with outbound shipments of petroleum products accounting for nearly all freight traffic at the port (Fried and Keith 2005). The port includes storage facilities with a total capacity of 9.18 million barrels (Alyeska Pipeline Service Company 2010). As shown in , crude oil shipments from the Port of Valdez have steadily declined. This decline is the result of decreasing oil production on the North Slope. After years of pumping, North Slope fields are drawing less oil from the ground (although the North Slope Prudhoe Bay field still pumps more oil than any other site in the United States).
Table 5. Foreign and Domestic Waterborne Shipments of Crude Petroleum and Petroleum Products from the
Port of Valdez, Thousands of Short Tons, 1994–2007
YearForeign Domestic
TotalCrude Petro. Prods. Crude Petro. Prods.1994 0 8 84,975 69 85,0521995 0 0 80,620 223 80,8431996 1,920 139 74,652 291 77,0021997 3,485 37 69,759 347 73,6281998 3,080 0 58,569 292 61,9411999 3,922 6 49,126 268 53,3222000 1,667 0 46,067 341 48,0752001 0 0 50,635 340 50,9752002 0 0 50,081 427 50,5082003 0 0 49,527 324 49,8512004 0 0 46,440 315 46,7552005 0 0 44,058 389 44,4472006 0 0 35,675 478 36,1532007 0 0 37,412 362 37,774
Source: U.S. Army Corps of Engineers (2010)
Other ports in Alaska also handle petroleum products. Bulk petroleum, delivered to the Port of Anchorage either by rail or pipeline, comprises the port’s primary outbound cargo (Table 6). An extensive tank farm on Alaska Railroad Corporation land adjacent to the port stores liquid fuels that are transported by rail tankers generally originating from refineries near Fairbanks that process North Slope crude oil (VZM/TranSystems–Tryck Nyman Hayes Inc. 1999). Tonnage of petroleum products shipped overseas through the Port of Anchorage is down since 2006 because the refinery, Flint Hills Resources Alaska, LLC in North Pole stopped exporting naptha to Asian and South American markets (Demer 2008; Port of Anchorage 2009).
34 The main supply route for the Prudhoe Bay oilfields is the 360-mile Dalton Highway, formerly the North Slope Haul Road. The road was built in 1974 to truck supplies for the oil development at Prudhoe Bay.
35 The lifting of the export ban on Alaska crude oil has led to infrequent and limited shipments to East Asia. However, the vast majority of oil transported via the Trans-Alaska Pipeline System is still being sent to the U.S. West Coast (U.S. Minerals Management Service 2007).

Strategic Trends Analysis
Final 29
Table 6. Foreign and Domestic Waterborne Shipments of Crude Petroleum and Petroleum Products from the
Port of Anchorage, Thousands of Short Tons, 1994–2007
YearForeign Domestic
TotalCrude Petro. Prods. Crude Petro. Prods.1994 0 581 0 353 9341995 0 672 8 658 1,3381996 0 554 0 700 1,2541997 0 652 0 741 1,3931998 15 850 0 509 1,3741999 215 703 0 371 1,2892000 78 409 0 583 1,0702001 0 428 0 518 9462002 0 491 0 714 1,2052003 0 458 0 668 1,1262004 0 583 0 556 1,1392005 0 493 0 746 1,2392006 0 285 0 569 8542007 0 49 0 566 615
Source: U.S. Army Corps of Engineers (2010)
Port Nikiski (also known as Nikishka), located on the Kenai Peninsula, is the site of a Tesoro Alaska oil refinery, where crude oil from Cook Inlet, the North Slope and, to a lesser extent, foreign locations such as Indonesia is processed into jet fuel, gasoline, and diesel (Table 7). Most of the refined products are sold in-state, although some products have occasionally been shipped to Russia. In addition, a liquefied natural gas (LNG) plant at Nikiski that is jointly owned by ConocoPhillips Alaska Natural Gas Corporation and Marathon Oil Company ships Cook Inlet gas to Japan in special purpose LNG tankers. Cook Inlet gas was also used by Agrium U.S., Inc.’s plant at Nikiski to manufacture ammonia-urea fertilizer for export until 2007, when gas price and supply issues forced the closure of the plant.

Strategic Trends Analysis
30 Final
Table 7. Foreign and Domestic Waterborne Shipments of Crude Petroleum, Liquefied Natural Gas and
Petroleum Products from the Port of Nikiski, Thousands of Short Tons, 1994–2008
YearCrude
PetroleumLiquefied
Natural GasAmmonia-Urea
FertilizerOther Petroleum
Products Total1994 1,582 1,233 687 806 4,3081995 1,745 1,279 548 1,098 4,6701996 1,828 1,447 489 1,266 5,0301997 2,707 1,283 731 1,857 6,5781998 2,191 1,200 1,513 1,982 6,8861999 1,578 1,117 1,122 1,293 5,1102000 1,170 1,325 1,116 1,459 5,0702001 2,147 1,324 1,287 1,601 6,3592002 2,329 1,366 1,589 1,951 7,2352003 2,284 1,453 1,326 2,802 7,8652004 5,637 1,656 1,220 3,747 12,2602005 2,748 1,374 1,060 3,652 8,8342006 2,779 1,371 657 2,734 7,5412007 2,990 1,181 319 3,009 7,4992008 2,745 910 5 1,377 5,037
Source: U.S. Army Corps of Engineers (2010)
3.2.1.1 Future Demand for Maritime Operations and Facilities
Alaska’s oil and natural gas industries stand apart from other resource industries with respect to the relationship between production and world prices. Alaska’s oil and natural gas resources require substantial long-term infrastructure investment. Consequently, once a field comes on stream, the production from that field does not generally change in response to the world price unless the price drops far enough below the field’s marginal cost of production that it is cheaper for the producer to close the well than continue producing.
Inflation-adjusted oil prices reached an all-time low in 1998 as the “Tiger Economies” of East Asia spiraled into crisis, cutting oil demand; but just ten years later they reached a record high, possibly due to oil price speculation or other factors. As shown in Figure 7, however, Alaska’s oil production decreased even as prices rose. Alaska’s oil production has dropped from nearly 2 million barrels per day in 1989 to just under 685,000 barrels per day in 2007.

Strategic Trends Analysis
Final 31
Figure 7. Alaska Oil and Natural Gas Production and Average Annual Price per Barrel, 1987–2008
Source: Energy Information Administration (2010)
Figure 7 shows that marketed natural gas production remained relatively constant at just under 250 MBOE (thousand barrels of oil equivalent) per day until 2007, when Agrium closed and LNG production at the ConocoPhillips-Marathon facility began to decline due to restrictions on production imposed by the facility’s U.S. Department of Energy LNG export license.36 In addition to being exported as LNG, Cook Inlet gas has supplied all of Southcentral Alaska’s residential and commercial demand since the late 1960s. There are increasing concerns over how long Cook Inlet fields will be able to continue to meet this in-state demand, as gas production has gradually fallen after peaking in 1996. With the Cook Inlet Basin natural gas reserves declining, it will become harder to deliver gas to consumers as they need it on a daily basis, assuming no new investments in exploration or development. The export permit of the ConocoPhillips-Marathon LNG facility expires in 2011. The facility owners have stated that they intend to apply for another two-year extension on their permit, but a condition to the U.S. Department of Energy's approval of an export permit extension requires a showing that gas supplies are surplus to regional gas needs. Given the depletion of the Cook Inlet gas fields, that showing may be difficult to demonstrate (Bailey 2009; Bradner 2009). In addition, it is estimated that by 2011 the LNG plant will have reached the end of its useful life without significant investment to modernize key elements of the plant (Shaw Alaska 2006).37
Estimates of future North Slope oil production differ�a recent report prepared for the U.S. Department of Energy predicts that Trans-Alaska Pipeline System minimum flow rate of about 200,000 barrels of oil per day will be reached in about 2045, absent new developments or reserves
36 One barrel of oil is generally deemed to have the same amount of energy content as 6,000 cubic feet of natural gas.
37 LNG export is the only remaining “industrial” user of Cook Inlet gas since the Agrium fertilizer plant has closed. Industrial use has insulated Cook Inlet production from the substantial swings between residents’ summer and winter gas needs. Ending LNG exports could have broad implications for the region.
0
20
40
60
80
100
120
0
250
500
750
1,000
1,250
1,500
1,750
2,000
2,250
1987 1989 1991 1993 1995 1997 1999 2001 2003 2005 2007
Aver
age
Ann
ual
Oil
Pric
e ($
per
bar
rel)
Prod
uctio
n (M
B/M
BO
E pe
r da
y)
YearGas Production Oil Production Oil Price

Strategic Trends Analysis
32 Final
growth beyond the forecasted technically remaining reserves (Thomas et al. 2009).38
In addition, offshore oil and gas fields in the Chukchi and Beaufort Seas have the potential to substantially expand Alaska’s oil and gas industry.
While the belief that oil prices will show an upward trend has stimulated exploration and development in Alaska, few geologists genuinely expect to find more Prudhoe Bay-sized fields in the North Slope, but many see a high potential for undiscovered fields of more modest sizes. Today, oil fields of 100 to 200 million barrels are routinely developed, and satellite fields (sharing existing infrastructure) of only 30 to 50 million barrels are seriously considered for commercial development. With the minimum commercial-field thresholds lowered to these levels because of technological advances in drilling and reservoir development, it is clear there are abundant exploration opportunities throughout northern Alaska (U.S. Bureau of Land Management 2008).
Table 8 shows the U.S. Minerals Management Service’s mean estimate of undiscovered economically recoverable oil and gas resources in the Chukchi and Beaufort Seas.39
Table 8. Undiscovered Economically Recoverable Resources of the Beaufort Sea and Chukchi Sea
As prices increase, the potential recoverable resources increase since higher prices enable industry to explore and produce in deeper water and extend infrastructure to more distant discoveries. The potential resources in the Chukchi Sea are much larger than those for the Beaufort Sea, but with limited infrastructure in the region, large discoveries and high prices are needed to overcome the cost of development. By way of comparison, total North Slope oil production from 1977 through 2009 was 16 billion barrels (Alyeska Pipeline Service Company 2010). There have been no documented commercial discoveries in the Chukchi Sea, but oil production is occurring in the Beaufort Sea.
Area
$46/barrel$6.96/thousand cubic feet
$60/barrel$9.07/thousand cubic feet
$80/ barrel$12.01/thousand cubic feet
Oil(billion barrels)
Gas (trillion
cubic feet)
Oil(billion barrels)
Gas (trillion
cubic feet)
Oil(billion barrels)
Gas(trillion
cubic feet)Beaufort Sea 4.12 8.79 5.97 15.94 6.92 19.97Chukchi Sea 2.37 7.91 8.38 34.43 12.00 54.44Source: U.S. Minerals Management Service (2006)
There are no current plans to use a sea route to move oil and gas out of the North Slope. Consequently, in the extraction and shipping phase, producers are likely to transport North Slope oil and gas southward by pipeline. The Trans-Alaska Pipeline System would continue to be used to transport oil to the marine terminal facilities in the Port of Valdez. The physical life of this pipeline is virtually unlimited assuming continued appropriate maintenance and surveillance (Norton and Miller 2002). In addition, there are proposals to build a new pipeline to transport gas from the North Slope.40
38 The minimum flow rate of the Trans-Alaska Pipeline System varies depending on many factors, including temperature. Tax cut advocates have claimed the minimum flow rate is 300,000 barrels per day, whereas state officials say the minimum flow is between 100,000 and 200,000 barrels per day (Forgey 2010).
North Slope oil and gas producers believe they have, or will have through exploration, enough gas supply to support the construction of a pipeline that would either tie into an existing gas distribution system in Alberta, Canada or would parallel the Trans-Alaska Pipeline System to Valdez,
39 Oil fields already have been developed in state waters of the Beaufort Sea, including the Endicott, Northstar, Oooguruk, and Nikaitchuq fields.
40 The prospects for the natural gas pipeline appear to be dimming due to the rapid development of unconventional gas in shale formations in the continental United States (Bluemink 2009c; Budzik 2009).

Strategic Trends Analysis
Final 33
where the gas would be chilled to liquid form in a proposed LNG facility for transfer to U.S. or international markets on tanker ships (Federal Energy Regulatory Commission 2010).41
In the near term, shipping activity related to North Slope oil and gas development is likely to remain predominately composed of re-supply and destinational traffic. However, the longer period of ice-free conditions that is occurring in the Arctic could lead to expanded onshore and offshore oil and gas development in the region. As described in Section
2.2, ice-free conditions in the Arctic would facilitate marine traffic, thereby providing increased and more convenient support for North Slope oil and gas producers.42 During the exploration phase of oil and gas development, a small fleet of seismic survey vessels and drill ships is typically involved. During the construction phase, a wide variety of vessel activity is involved, including project cargo and heavy lift ships delivering construction materials and components, ocean barges, other construction vessels, and supply vessels. In addition, oil and gas project modules would likely be barged into the project sites from various fabrication locations. The potential availability of the Northern Sea Route could conceivably result in module deliveries by that route. In the past, U.S. Gulf Coast module builders had to use the Panama Canal for delivery to the North Slope via the Pacific Basin. The Northern Sea Route could provide an alternative delivery route via the Atlantic Basin (Tryck Nyman Hayes, Inc. and Riverwise, LLC 2008). Because a number of the most promising offshore oil and gas prospects in the Beaufort and Chukchi Seas are located some distance from existing facilities at Prudhoe Bay, new marine terminal and support bases may be constructed to support the offshore platforms (Northern Economics, Inc. 2009).43
Over the longer term it is possible that Arctic sea routes will be used to ship oil and gas from the North Slope. These routes were seriously considered after the discovery of the Prudhoe Bay oil field in 1967, when it was an open question of how to best transport the oil to markets further south.
44
41 LNG shipped from Alaska to U.S. West Coast ports would have to meet Jones Act requirements for U.S.-built, owned, and crewed tankers. Various entities involved in the proposed Valdez LNG facility are examining ways to reduce the cost of U.S. LNG tanker construction or to re-flag vessels (Nelson 2006).
However, increases in the amount and duration of open water due to the climate change-related retreat of the Arctic ice cap could make Arctic sea routes available for increased ship traffic. For
42 To date, exploration, development, and operations on the North Slope has been dominated by three major oil companies (BP, ConocoPhillips, and ExxonMobil), or their predecessors, which own varying proportions of the unitized fields, the facilities, and the Trans-Alaska Pipeline System. However, some observers believe Alaska's North Slope oil fields are entering a new phase of increased activity�one in which independent, small to medium-sized operators are working beside and with the three majors (Thomas et al. 2009). Unlike the large oil firms, the small to medium-sized companies are expected to need assistance in the form of staging emergency response vessels to protect environmentally sensitive areas or barge landings to facilitate the movement of cargo and personnel (U.S. Army Corps of Engineers 2008). In an example of the supply chain difficulties in developing large Arctic oil and natural gas deposits as commercially profitable ventures, Budzik (2009) notes that the Italian-based petroleum company Eni S.p.A. originally announced that the Nikaitchuq oil field on the North Slope would start production by year-end 2009. More recently, Eni announced that the field would not begin production until year-end 2010 partly because the company had missed the summer season opportunity to ocean barge the field’s processing and operations modules to the North Slope from a Louisiana fabrication yard. Such supply chain delays increase project costs and reduce the rates of return as expensive equipment remains idle.
43 For development of Chukchi Sea oil and gas resources, the supply base could be located anywhere along the Chukchi Sea coast, or even south of the Chukchi Sea. Dutch Harbor has been used to support Shell’s exploration activities in the region. Shell has suggested that Kivalina or Kotzebue could also serve as a support base. The location of the onshore service base would be influenced by the location of the first major commercial discovery in the Chukchi Sea and the actual location is uncertain at this time (Northern Economics, Inc. 2009).
44 In 1969 and 1970, the tanker S.S. Manhattan, the largest and most powerful commercial ship built in the United States, made experimental voyages through the Northwest Passage to Prudhoe Bay. Based on the difficult ice conditions experienced during these voyages, it was deemed unfeasible to utilize the Northwest Passage for oil transport by tanker, and the pipeline option was chosen (Gedney and Helfferich 1983; Haglund 1983).

Strategic Trends Analysis
34 Final
example, the U.S. Minerals Management Service (2007a) has postulated that one way of transporting Chukchi Sea oil and gas to markets would be to construct an offshore platform capable of storing and loading crude oil and LNG in the Chukchi Sea, and shipping the LNG and oil by tankers. Another alternative identified by the U.S. Minerals Management Service involves construction of a LNG plant at the port terminal of the DeLong Mountain Transportation System, which ships concentrates from the Red Dog mine.45
The development of other untapped oil and gas resources could also lead to greater demand for maritime services in Alaska. In particular, the offshore area of the North Aleutian Basin is considered to have important hydrocarbon reserves, especially natural gas. If an oil and gas lease sale in the North Aleutian Basin occurs,
46
The USCG, USACE, ADOT&PF, and others are evaluating possible locations for ports of refuge in the Beaufort Sea and Chukchi Sea, and these sites could potentially function as sites for resupply of Outer Continental Shelf oil and gas production platforms. Although proximity to the platforms is preferred, the scarcity of suitable deepwater sites may necessitate longer transits than desired to and from the platforms. The Roads to Resources program conducted by ADOT&PF several years ago evaluated the possibility of building public roads to areas with high oil and gas potential to reduce the transportation and capital cost for industry and encourage more exploration and development. Industry representatives were generally opposed to the public road concept due to the increased security risks that they would face; in general they preferred private roads where they could restrict access. We envision that the same issues would arise with any proposed public dock or launching ramp in the vicinity of the onshore or offshore oil fields.
it is anticipated that two major shore-based facilities would be required to develop the area’s oil and gas resources. A supply base would be needed on the Bering Sea side of the Alaska Peninsula for the supply boats and helicopters. A second facility, located on the Pacific Ocean side of the Peninsula perhaps near Sand Point, would include an LNG plant and provide marine terminals for tankers, which would transport the oil and LNG to markets (Northern Economics, Inc. 2009; U.S. Minerals Management Service 2007b).
The one area where public sector involvement might be acceptable would be for dredging a channel to East Dock or West Dock so that larger vessels could call at those facilities. Water depths in the Arctic Ocean are very shallow for a number of miles offshore, particularly in the Beaufort Sea, and supply vessels that are capable of dealing with winter ice conditions in those waters will need to be very large (approximately 350 feet in length) and with icebreaking features. These vessels will have drafts that are much deeper than current depths alongside either dock at Prudhoe Bay; thus, dredging or extension of a causeway would be needed to achieve the necessary water depth.
It is important to keep in mind that forecasts of oil and gas development in Alaska are highly uncertain; policies and markets that affect oil and gas exploration and production can evolve in
45 The final U.S. Minerals Management Service lease stipulations for Chukchi Sea Oil and gas Lease Sale 193 state the following: “Pipelines will be required: (a) if pipeline rights-of-way can be determined and obtained; (b) if laying such pipelines is technologically feasible and environmentally preferable; and (c) if, in the opinion of the lessor, pipelines can be laid without net social loss, taking into account any incremental costs of pipelines over alternative methods of transportation and any incremental benefits in the form of increased environmental protection or reduced multiple-use conflicts. ...In selecting the means of transportation, consideration will be given to recommendations of any Federal, State, and local governments and industry.”
46 Congress removed the North Aleutian Basin Planning Area from the Congressional moratorium on offshore drilling in 2003. In 2007, President George W. Bush rescinded the executive leasing withdrawal for the North Aleutian Basin Planning Area. In 2007, the U.S. Minerals Management Service announced its Final 5-Year OCS Oil and Gas Leasing Program, which included a lease sale in the North Aleutian Basin Planning Area scheduled for 2011. In 2010, however, the Obama Administration barred oil and gas exploration in the North Aleutian Basin Planning Area.

Strategic Trends Analysis
Final 35
unforeseen ways (Thomas et al. 2009). Consequently, any projections of changes in maritime operations and facilities in Alaska related to oil and gas development are equally uncertain.
3.2.2 Minerals and Metals Mining
The mining industry is a builder and user of port facilities in the state. Most facilities are privately owned, but several major facilities, such as the DeLong Mountain Transportation System (DMTS) for the Red Dog Mine and the Skagway Ore Terminal, are owned by AIDEA. The USACE, with AIDEA as the local sponsor, has conducted studies to evaluate a dredged deep draft channel to the DMTS among other alternatives. AIDEA has also conducted other studies to improve the productivity of the DMTS. The Skagway Ore Terminal and associated dock have been the subject of a number of studies conducted by Alaska and Yukon Territory interests over the years.
After fueling much of Alaska's employment and population growth during its first 50 years as a territory, mining activity decreased in the years following statehood due to low metal prices, high costs, and lack of infrastructure (Tromble and Windisch-Cole 1997). Although it continues to represent only a small portion of the state's economy, Alaska’s mining industry has the potential for significant growth (Alaska Department Commerce, Community and Economic Development 2009; Tromble and Windisch-Cole 1997). Exploration expenditures were $347.3 million in 2008, more than $18 million higher than the record $329.1 million spent in the previous year. Development expenditures for 2008, reported for 33 projects, totaled $396.2 million, up 24.3 percent from the $318.8 million spent in 2007 and the fifth year with development expenditures exceeding $200 million.
Most of Alaska’s mineral and coal exports are dependent on maritime transport. Port facilities are often closely connected to the mine operations. In particular, the weight/value ratio of ore concentrate is generally quite low, and long land transport is avoided to minimize costs. The descriptions below of four large-scale mining operations illustrate the connections between the mining industry and maritime transportation.
Red Dog Mine—The Red Dog mine, which is operated by Teck Alaska, Inc., is located about 50 miles from the Chukchi Sea coast to the east of the community of Kivalina and is one of the largest zinc mines in the world. Starting operations in 1989, Red Dog produces more than one million tons of zinc and lead concentrates annually. All concentrates are exported to world markets via the DeLong Mountain Transportation System (DMTS), which consists of a 52-mile haul road from the mine and millsite to the Chukchi Sea, a shallow water dock, offshore conveyor concentrate loading facility, fuel distribution and storage systems, and other port facilities. The road and port site facilities were developed and are owned by the Alaska Industrial Development and Export Authority (AIDEA), which has provided Teck Alaska a priority, non-exclusive right to use the DMTS (AIDEA 2010; Northern Economics, Inc. 2007).47 Due to the shallow port conditions, small barges and tugboats lighter the concentrates to ore ships anchored offshore. The concentrates are shipped to smelters in Canada, Europe, and Asia during the 100-day ice-free shipping season.48
47 Initially, AIDEA invested $180 million in developing the DMTS, which was completed in 1990. That investmenthas grown to $267 million through various upgrades to the port and studies to determine the impacts and alternative uses for the DMTS. To finance the DMTS, AIDEA issued $105 million in bonds in 1987 and provided a loan portfolio to support the bonds. The state provided a further appropriation to AIDEA to meet the required funding level. In 1997, AIDEA sold $150 million in bonds, in part to fund DMTS expansion, and in part to refund a portion of higher-cost bonds originally issued in 1987. The investment in the DMTS is being repaid by Teck Cominco Alaska through user tolls on the use of the road (AIDEA 2010; Northern Economics, Inc. 2007).
Because Red Dog produces very
48 Because mining operations occur year-round, bulk carrier traffic is frequently very high in the summer in order to transport all of the lead/zinc mined during the year. Some of the ore from the Red Dog mine is shipped to

Strategic Trends Analysis
36 Final
large amounts of ore, the ice-free season means the use of large bulk carriers, heavy vessel traffic, and carefully planned shipments to maximize ore exports before the fall ice forms (Arctic Council and PAME 2009).
Table 9. Waterborne Shipments of Non-Ferrous Ore and Non-Ferrous Metal Products from the Port of
Kivalina, Thousands of Short Tons, 1997–2007
YearNon-Ferrous
Ores and ScrapPrimary Non-Ferrous
Metal Products Total1997 871 0 8711998 6,686 1,074 7,7601999 695 1,148 1,8432000 1,246 1,263 2,5092001 1,322 1,325 2,6472002 1,509 1,511 3,0202003 1,358 1,457 2,8152004 1,364 1,514 2,8782005 1,631 1,079 2,7102006 1,373 1,373 2,7462007 1,468 546 2,014
Source: U.S. Army Corps of Engineers (2010)
Usibelli Mine—The Usibelli coal mine, located near the town of Healy, has been mining subbituminous coal since 1943; the company started exporting coal in 1985 (Fried 2009). Slightly less than half of the 1.8 million tons of coal currently mined is shipped to Chile, South Korea, China, and other Pacific Rim destinations. Coal is loaded on train cars and transported to the Port of Seward located at the head of Resurrection Bay on the Kenai Peninsula. At the Seward Coal Loading Facility, which is owned by the Alaska Railroad Corporation, the coal is loaded onto dry-bulk vessels for export. The Alaska Railroad Corporation has entered into an agreement with Aurora Energy Services LLC, an affiliate of the Usibelli coal mine, to operate and maintain the facility (Alaska Railroad Corporation 2010).49
Table 10. Waterborne Shipments of Coal from the Port of Seward, Thousands of Short Tons, 1994–2007
1994 1995 1996 1997 1998 1999 2000 2001 2002 2003 2004 2005 2006 2007719 833 664 740 313 546 690 622 370 188 570 505 403 226
Source: U.S. Army Corps of Engineers (2010)
Teck Resources’ smelter in Trail, British Columbia, which is the world's largest integrated zinc and lead smelting and refining complex.
49 In the early 1980s, Suneel Alaska Corporation—the purchaser of the coal for the South Korean domestic market—negotiated with the State of Alaska for construction of the coal dock and a loan from AIDEA. The Alaska Department of Transportation and Public Facilities built the dock and Suneel installed the conveyor and loading systems. Hyundai Merchant Marine succeeded Suneel as the coal purchaser and owner of the Seward Coal Loading Facility in the early 1990s. AIDEA became a co-owner in 1995. In 2003, the Alaska Railroad Corporation received a grant from the Federal Railroad Administration to buy the coal export facility from AIDEA and Hyundai Merchant Marine (Alaska Railroad Corporation 2010).

Strategic Trends Analysis
Final 37
Greens Creek Mine—Hecla Mining Company's Greens Creek mine in Southeast, which started operations in 1989, is a polymetallic mine with a current production mix of silver, gold, zinc, and lead. The mine operates a concentrate storage and loading terminal located at Hawk Inlet on Admiralty Island. Concentrate is transported approximately 9 miles by haul trucks from the Greens Creek mill facilities to the Hawk Inlet concentrate storage and load-out facilities. Some 12 to 18 bulk cargo ships are loaded annually to transport the concentrates to various smelters throughout the world for processing (SRK Consulting 2009).
Minto Mine—In January 2007, AIDEA executed a 7-year user agreement with the Sherwood Copper Corporation (now Capstone Mining Corporation) and began constructing a new concentrate storage building and support structures at the Skagway Ore Terminal (SOT) located in the Port of Skagway (AIDEA 2008; Szumigala et al. 2009).50
Not all of Alaska’s mining operations use port or harbor facilities to export products. For example, the operations of the Fort Knox and Pogo gold mines involve on-site mill and gold extraction processes, and the gold bars produced are shipped out by air.
In October 2007, for the first time in 10 years, mineral concentrates were loaded and shipped from the reactivated SOT. The terminal is used by Minto Explorations Ltd., a subsidiary of the Capstone Mining Corporation, to ship copper–gold concentrates extracted from its mine in Canada’s Yukon Territory. The concentrates are exported to smelters in Asia for treatment and sale.
3.2.2.1 Future Demand for Maritime Operations and Facilities
Depending on the outlook of the feasibility study for a particular mine, mining companies may decide to build their own marine facilities—particularly in the case where there is no organized local government to provide such facilities. However, low commodity prices or other factors may determine that ownership of such facilities by others is more cost effective. As noted above, mining companies in Alaska and Canada have partnered with AIDEA, which built and owns the facilities mentioned above, and the mining companies pay user fees for moving their export products to market. Very large mining companies with very strong projects will likely not need public sector support in developing mines and related infrastructure. However, smaller companies and more economically challenged projects may need public investment to be viable. Thus, projects that the public sector may be involved in may have greater risk than purely private-sector projects. Most local governments in Alaska do not have the capability to fully assess the risk of infrastructure investments for a mining project, and given this situation, it may be more prudent for AIDEA or a similar agency that has the necessary expertise to be involved in financing, owning, and operating such facilities.
The mining industry in Alaska (and elsewhere) has large barriers to entry because finding, developing, and producing the minerals and metals is time consuming and expensive. The development of new mines can take years or even decades and requires large amounts of venture capital. In addition, mineral and metal prices are highly cyclical; therefore, companies must time their exploration, development, and production so that mines do not become active as mineral and metal prices decline. Furthermore, mining raises a number of environmental challenges, including soil erosion, dust, noise pollution, water pollution, and impacts on local biodiversity. Numerous state, federal, and local government permits and approvals are required before construction and operation of a large mine in Alaska can begin. Court challenges stemming from environmental concerns can extend the permitting process, thereby significantly increasing mining project schedules and costs. Recent
50 The SOT was constructed in 1968 and purchased by AIDEA in 1993. The Anvil Range Mining Corporation re-opened the Faro mine in Canada’s Yukon Territory, shipping lead and zinc ore concentrates through the SOT until 1997, when mining was suspended (AIDEA 2008).

Strategic Trends Analysis
38 Final
examples of proposed large mining projects that have encountered substantial legal obstacles include the Kensington mine and proposed Pebble mine (Bluemink 2009a; Bluemink 2009b).51
Relatively strong prices during the past few years have helped to sustain Alaska’s high level of metal export values (Fried and Robinson 2008). However,
Figure 8 shows how base metal and precious metal prices have cycled over the last twenty years. The price fluctuation in the current cycle is much greater than in previous cycles. The emergence of rapidly developing economies around the world, including Brazil, Russia, India, and China, as well as increased liquidity in financial markets resulted in increased demand for, and speculation in, base and precious metals. As one might expect with such high prices, exploration and development have increased dramatically (Fried and Robinson 2008). Figure 8 shows that exploration expenditures in Alaska are highly correlated with world metal prices. From 1987 through the early years of this decade, changes in exploration expenditures lagged behind the Commodity Research Bureau (CRB) metals index by a year or two. However, evidence of a lag has faded in recent years.
World metal prices fell sharply in the latter half of 2008 after reaching record highs in the earlier part of the year. The decline in world metal prices is the result of two primary factors: a decline in demand associated with the current global economic downturn and the removal of upward price speculators from the market. Following the burst of the tech bubble in early 2000 and the housing bubble in 2006/2007, the commodities markets were some of the remaining bull markets for global asset classes. The money which had previously flowed into equities and real estate flowed into commodities and helped create the commodity bubble of 2007/2008. The removal of that money deflated the bubble, and metal prices fell precipitously and languished for several months before moving upward toward former levels.
Notwithstanding these price fluctuations, the long-term market outlook for metals continues to be positive. It is expected that prices of lead and zinc will remain strong over the medium-term, with periods of price volatility. The global market assessments for these metals suggest that economic growth and production capacity in China will continue to be a major factor influencing the global supply and demand for these products. Moreover, the promise of high-paying jobs in rural communities will continue to exert pressure for the expansion of Alaska’s mining industry (U.S. Army Corps of Engineers 2008).
51 Although most of the Kensington mine facilities were completed in 2007, court battles on permitting and construction of a tailings disposal facility postponed the mine’s production. The U.S. Supreme Court ruled in favor of the mine in 2009, and the mine is expected to begin production in 2010 (Robinson et al. 2010). In 2010, concerns about the potential environmental impacts of the proposed Pebble mine led the Alaska Board of Fisheries and state legislators to seek an independent study of Alaska's large mine permitting standards and environmental safeguards (Bohrer 2010).

Strategic Trends Analysis
Final 39
Figure 8. World Metal Prices and Alaska Mining Exploration Expenditures, 1986–2007
Source: Commodity Research Bureau (2010); Swainbank et al. (1999); Szumigala and Hughes (2004); Szumigala et al. (2008)
Longer ice-free seasons in the future would allow greater access and longer navigation seasons at the Red Dog mine, but the annual amount shipped is not expected to significantly change over the life of the mine. The mine is currently producing at capacity, and no increase in capacity is expected through 2037 due to agreements among AIDEA, Teck Alaska, Inc., and NANA Development Corporation (Northern Economics, Inc. 2007).
However, if the aforementioned economic and regulatory obstacles to large-scale mining in Alaska can be surmounted, there are a number of potential new mining projects that would provide the catalyst to improve and expand infrastructure throughout the state (Alaska Department Commerce, Community and Economic Development 2009), including shipping infrastructure. Possible large scale mining projects include the following:
Kensington Mine—Coeur Alaska Inc.’s gold mine in Southeast Alaska about 45 miles from Juneau includes new industrial port facilities at Berners Bay to handle barges carrying supplies, fuel containers, and many thousands of tons of ore concentrate that will be shipped elsewhere for processing.52
Donlin Creek Mine—Major infrastructure for Donlin Creek LLC’s proposed gold mine in Southwest Alaska would include a port on the Kuskokwim River. Cargo and supplies would be shipped on ocean
The mine began producing gold in mid-2010. It is anticipated that the mine will produce 50,000 ounces of gold during the remainder of 2010 and will average about 125,000 ounces of gold annually over the mine’s initial 12.5 year life. Coeur Alaska has entered into a contract with China National Gold Group Corporation, China’s largest gold producer, for the purchase and processing of about half of the gold concentrates produced at Kensington (North of 60 Mining News 2010).
52 In 2003, the Alaska Legislature authorized AIDEA to issue conduit revenue bonds for docking facilities and atailings management facility at the Kensington Mine. The AIDEA Board of Directors approved staff to undertake feasibility activities (Alaska Industrial Development and Export Authority undated).
0
50
100
150
200
250
300
350
0
100
200
300
400
500
600
700
800
900
1986 1988 1990 1992 1994 1996 1998 2000 2002 2004 2006
Infla
tion
Adj
uste
d Ex
plor
atio
n
Ex
pend
iture
s (M
illio
ns o
f US
$)
Reu
ters
-CR
B B
ase
Met
als
Sub-
Inde
x
Year
CRB Metals Index AK Exploration Expenditures

Strategic Trends Analysis
40 Final
barges to Bethel and moved from Bethel to the new port on new river barges (Donlin Creek LLC 2008).
Pebble Mine—The Pebble Limited Partnership’s proposed gold-copper-molybdenum mine in the Bristol Bay region would require the construction of a new, deepwater, multi-modal port on Iniskin Bay for loading mineral-bearing concentrates onto ocean-going vessels and receiving freight and operating consumables (Pebble Limited Partnership 2010).53
Point Lay Mine—The proposed joint venture between BHP Billiton and the Arctic Slope Regional Corporation to extract bituminous coal resources south of Point Lay on the Chukchi Sea includes construction of an overland transportation corridor to move coal south to a port with a reasonable ice free season for shipping coal to Asian markets. If this project comes to fruition, it could involve a high volume of Panamax and Capesize bulk vessel voyages from the Chukchi Sea south through the Bering Strait (Tryck Nyman Hayes, Inc. and Riverwise, LLC 2008).
Chuitna Mine—PacRim Coal LP has proposed a surface subbituminous coal mining and export development located in the Beluga coal field in Southcentral Alaska, approximately 45 miles west of Anchorage. The crushed coal initially would be hauled in trucks from the mine service area to a port on Cook Inlet at either Ladd or Granite Point. After two years of mine operation, coal would be moved from the mine service area to the port on a conveyor. At lower production levels, the coal would be loaded from a short trestle at the port onto barges for transport to market. At higher production levels, coal would be loaded from a long trestle onto ocean-going coal transport ships.
Niblack Project—Niblack Mining Corporation’s copper-zinc-gold-silver prospect is in an advanced exploration phase of development. The proposed underground exploration project is located off Moira Sound on southeastern Prince of Wales Island, approximately 30 miles southwest of the town of Ketchikan. It will require development of a marine access and camp barge facility on the adjacent tide and submerged lands.
In addition to the potential mining projects described above, new mining opportunities may develop as a result of the proposed highway corridor near the Bradfield Canal that would connect Southeast Alaska to the continental highway system. The corridor would provide a much shorter distance to tidewater for several Canadian mining companies in the Iskut-Stikine region, one of the richest mineralized areas in British Columbia, Canada.54
53 Initially, it was suggested that the port at Homer could be used as a staging area. Under this option, shuttle barges would be used to transport equipment and materials from Homer to a smaller unloading facility at Iniskin Bay (Bradner 2004).
However, in order for the proposed road corridor to be considered by the mining companies, a port with adequate infrastructure to accommodate large ocean-going ships would be needed (Northern Economics, Inc. and Parametrix 2009). The potential for commercial, deep draft, ocean shipping to access possible ports that might develop at or near the access road end was assessed in a report by The Glosten Associates, Inc. (2009). The report indicated that it would be feasible for ocean shipping to navigate Bradfield Canal, at least to Duck Point, and possibly a mile or so beyond. Ocean shipping vessels could likewise navigate the Eastern Passage. The preliminary finding was that Blake Channel could be navigated by handysize ocean shipping, but probably not by anything larger due to restricted passages on either side of Blake Island.
54 Currently, most of the mining activities near the proposed road corridor are still in the pre-application or exploration phase. The Eskay Creek Mine, located 50 miles northwest of Stewart B.C., was a large gold and silver mining project that recently closed. When it was operating, the mine was the fifth largest silver producer in the world. According to the British Columbia Ministry of Energy, Mines and Petroleum Resources, it is likely that future mining exploration activity in the Iskut-Stikine region will be high (Northern Economics, Inc. and Parametrix 2009).

Strategic Trends Analysis
Final 41
New mining opportunities may also develop as a result of the proposed Alaska Canada Rail Link, which would provide rail service between Alaska and northern British Columbia. Currently, landlocked mineral resources in portions of Alaska, Yukon Territory, and British Columbia have no means to be economically mined and shipped to market. The proposed Alaska Canada Rail Link, together with the existing Alaska rail line and the Alaska Railroad Corporation’s planned Delta Junction extension, would link new and existing mining operations in Alaska and Canada to North Pacific Rim markets via a U.S. port. Potential annual volume estimates range between 35 and 51 million tons, if all potential mining projects came on line (Tryck Nyman Hayes, Inc. and Riverwise, LLC 2008).
While some of this market potential may not be realized for several decades, if ever, it appears that a significant potential exists for bulk material export movement by rail and water if the Alaska Canada Rail Link or some portion of it were built. A number of Alaska ports would compete for these mineral exports. Port MacKenzie, on the western shore of Knik Arm across from the Port of Anchorage, currently provides deep water port access with sufficient back-up land to support large-scale mineral exports. Rail access linking it to the Alaska Railroad is currently under study. Other Alaska ports competing for mineral exports if the Alaska Canada Rail Link is built will include Haines and Skagway. The feasibility of these port options depends on the Alaska Canada Rail Link development strategy implemented. If an initial phase rail option from Carmacks, Yukon Territory to Haines/Skagway is implemented, the Southeast Alaska ports will have a substantial cost advantage over Port MacKenzie for Yukon origin minerals. If the entire Alaska Canada Rail Link from Delta Junction to British Columbia is built at once, Port MacKenzie will be the low-cost option (Tryck Nyman Hayes, Inc. and Riverwise, LLC 2008).
3.2.3 Seafood Industry
The seafood industry is the predominant industry in most ports and harbors around the state. In many cases, the local community was founded by people who moved into the area to harvest or process local seafood resources. That tradition has been maintained over time, although the harvested species and fishing methods may have changed over time.
There have been substantive reductions in the number of fishing vessels participating in the halibut and groundfish fisheries off Alaska’s coast due to rationalization of the fisheries. This has resulted in less demand from commercial vessels for moorage at a number of local harbors. In communities without large numbers of recreational vessels, this has resulted in lower occupancy rates for moorage and lower revenues in many harbors.
Many processing plants were built decades ago to process locally caught seafood. Over time, the number of plants has been reduced as local harvests declined or because high cost locations were not competitive with other plants. There have been few new seafood processing plants built in the last 30 years, although a number of plants have been upgraded and improved. Some of the newer plants have been the results of actions by CDQ groups in attempting to provide higher ex-vessel prices to residents in the CDQ group’s region. The CDQ program began in 1992 with the goal of generating fishery-related economic development for communities in proximity to the major groundfish fisheries in federal waters off Alaska’s coast. CDQ groups have also built docks, vessel repair facilities, and other marine infrastructure in local communities.
Global terminal operators have also begun to build facilities in Alaska for the fishing industry. The new Kloosterboer facility in Dutch Harbor has a 1,000 foot wharf, and a 25,000 metric ton cold storage facility. The facility offers improved facilities for catcher-processors and Kloosterboer will offer direct sailings to Korea for the Asia market, Netherlands for the European market, and to the east coast of

Strategic Trends Analysis
42 Final
the U.S. This private-sector facility has reduced the number of vessels calling at the city-owned Unalaska Marine Center (UMC) and reduced cargo volumes moving across the UMC.
The Alaska Seafood Marketing Institute (2005) notes that Alaska's location has been a blessing and a curse for the seafood industry. While the cold, clean waters of the north Pacific support some of the world's most productive commercial fisheries, the seafood is caught and processed thousands of miles from its major markets. Nevertheless, seafood is Alaska’s top international export—Alaska seafood exports topped $1.98 billion in 2007, accounting for over half of the state’s total export value (ADCCED 2008).55
Both land-based and at-sea seafood processing facilities are important to the state’s seafood industry.
The catch is sold in both U.S. and foreign markets.
56
As the location of Alaska’s premier fishing port, the community of Unalaska has an economy based on commercial fishing, fish processing, and fleet services, such as fuel, repairs, maintenance, and transportation. The port provides a natural protection for fishing vessels and enjoys a strategic position as the center of a rich fishing area and for transferring cargo between Pacific Rim trading partners�the North Pacific great circle route serving marine traffic between the U.S. West Coast and Asia passes within 50 miles of Unalaska (ADCCED 2010). The Port of Dutch Harbor is the only deepwater, ice-free port from the Unimak Pass to Adak that is open year-round, which allows for hundreds of thousands of tons of frozen fish and shellfish to be shipped annually to export markets, both nationally and internationally (
Since 1997, Unalaska-Dutch Harbor has been the leading U.S. fishing port in quantity of commercial fishery landings. In total, Alaska accounted for 14 of the National Marine Fisheries Service’s top 100 U.S. ports based on volume for 2008: Unalaska-Dutch Harbor (1st); Kodiak (5th); Naknek-King Salmon (12th); Cordova (14th); Sitka (18th); Ketchikan (20th); Seward (22nd); Petersburg (26th); Juneau (37th); Anchorage (43rd); Kenai (53rd); Wrangell (67th); Yakutat (74th); and Homer (78th) (National Marine Fisheries Service 2009). Furthermore, were it not for data confidentiality restrictions for ports with three or fewer seafood processing companies, Akutan, King Cove, and Sandpoint would also be listed in the top 20 ports. Due to the importance of commercial fishing in many of these coastal communities, the predominant marine facilities are geared to accommodate the offloading, servicing, and supplying of fishing vessels and shipping of seafood products.
Table 11). The most commonly shipped-to markets from Unalaska are located in North America, Europe, and Asia—with South Korea, Japan, Denmark, and the United Kingdom as a few of the most popular (St. Onge 2009).
55 The Alaska Department of Commerce, Community, and Economic Development’s (ADCCED) export figures may understate the importance of Alaska’s seafood industry due to the way in which the U.S. Census Bureau monitors exports. Unlike Alaska’s mineral and timber resources, which are for the most part shipped directly from Alaska ports, much of Alaska’s seafood harvest, including most canned and frozen salmon, is first transported to Seattle and other Puget Sound area cities before being shipped to foreign countries. As a result, these products of Alaska origin are counted as Washington exports. Northern Economics, Inc. (2010) estimated that the value of Alaska seafood exported from Seattle in 2007 was $619.67 million.Japan remains the single largest export market for Alaska seafood, but retains that distinction by an increasingly narrow margin as the value of Alaska seafood exports to other markets continues growing. Export value to Japan has been relatively steady for several years, remaining in the $800-$900 million range between 2000 and 2006. In contrast, the value of Alaska seafood exports to all other destinations more than doubled during the same period, from $656 million in 2000 to $1.6 billion in 2006 (Seafood Market Bulletin 2007).
56 A substantial portion of the total allowable catch in Alaska’s fisheries is allocated to catcher-processors. For example, 40 percent of the adjusted total allowable catch in the Bering Sea pollock fishery, which accounts for nearly 60 percent of Alaska fish harvests and one-third of all U.S. fish harvests by weight, is allocated to at-sea processors. As their name implies, catcher-processors process their catch on board. However, these vessels typically offload their processed product at Unalaska-Dutch Harbor, where it is shipped to various markets.

Strategic Trends Analysis
Final 43
Table 11. Waterborne Shipments of Seafood Products from the Port of Dutch Harbor, Thousands of Short
Tons, 1994–2008
YearForeign Domestic
TotalFish Shellfish Fish, Prepared Fish Shellfish Fish, Prepared1994 342 28 0 85 6 0 4611995 200 14 8 74 3 3 3021996 200 8 14 25 29 1 2771997 167 13 4 40 18 0 2421998 274 18 8 39 11 0 3501999 250 15 21 58 20 4 3682000 137 2 21 119 2 4 2852001 278 4 125 31 0 0 4382002 568 8 133 22 0 0 7312003 391 7 131 48 1 0 5782004 453 11 130 29 0 3 6262005 492 12 108 26 2 1 6412006 481 9 130 37 1 5 6632007 433 5 84 35 4 6 5672008 392 15 99 29 3 3 541
Source: U.S. Army Corps of Engineers (2010)
Over the years the Port of Dutch Harbor has undergone a number of major infrastructure improvements. In 1991, for example, the Unalaska city government and two private firms�Sea-Land Service, Inc. (now Horizon Lines, Inc.) and Petro Marine Services�formed a public/private partnership to expand the city's dock, construct a new warehouse and install a crane for handling containerized cargo. The total cost of the port improvements was about $15 million, with the City of Unalaska investing $7.6 million from AIDEA bonds to cover dock construction (Collins 1991). More recently, DH Ports LLC opened a new facility in 2009 that provides the fishing industry with a 1,000-foot deep draft dock, 25,000 square feet of cold storage, and sheltered areas for offloading (Welch 2007). Construction of the cold storage facility began in March 2009 with Kloosterboer as a partner (KUCB News 2009). The DH Ports LLC-Klooseterboer facility offers customers the opportunity to readily ship their cargo to Kloosterboer's facilities in international hub ports, including Busan, South Korea for the Asian market; Bayside, Canada for the eastern U.S. market; and Ijmuiden-Amsterdam, Netherlands for the European market (Kloosterboer 2009).
It is also important to note that Unalaska-Dutch Harbor is an important regional hub port servicing smaller neighboring Bering Sea communities. For example, barges convey fish from the Port of Bristol Bay at Naknek-King Salmon (which is itself a central transfer point servicing communities around Bristol Bay) to the Port of Dutch Harbor, where it is shipped to domestic and foreign markets. The Port of Anchorage is another central distribution point for Alaska seafood shipped to outside markets (Table 12). For example, fresh seafood is trucked or shipped from Southcentral Alaska communities to Anchorage, then loaded on ships for delivery to Tacoma (McDowell Group, Inc. 2001a).

Strategic Trends Analysis
44 Final
Table 12. Waterborne Shipments of Seafood Products from the Port of Anchorage, Thousands of Short Tons,
1994–2008
YearForeign Domestic
TotalFish Shellfish Fish, Prepared Fish Shellfish Fish, Prepared1994 53 9 1 23 0 3 891995 26 2 0 19 0 2 491996 39 2 4 17 0 2 641997 48 2 0 23 0 0 731998 52 1 1 18 0 1 731999 58 3 1 18 0 3 832000 6 0 4 20 0 2 322001 24 0 2 17 0 11 542002 31 1 3 15 0 7 572003 20 0 5 11 0 8 442004 15 0 5 9 0 8 372005 20 0 17 0 23 0 602006 127 0 17 10 0 3 1572007 63 0 6 17 0 6 922008 13 0 10 13 0 3 39
Source: U.S. Army Corps of Engineers (2010)
The demand for maritime operations and facilities by the seafood industry has been affected not only by changes in seafood production, but also by management measures intended to enhance the economic efficiency of fishing fleets. A primary objective of these measures is to reduce the so-called “race for fish,” which compels fishermen to apply an excessive level of operating inputs (e.g., labor, fuel, and time) and capital inputs (e.g., vessel and gear improvements) as they compete with each other for shares of harvest quotas. Since these measures were enacted, the Bering Sea pollock and crab fleets have become substantially smaller as marginally profitable vessels exit the fisheries. With the consolidation of the fishing fleets, there has been a lessening of demand for shoreside services in Unalaska-Dutch Harbor, Kodiak, and some other Alaska ports (Hughes 2005).
Fishery management trends related to quota allocation have, in some instances, tried to compensate for the effects of industry consolidation and rationalization by addressing the needs of remote, seafood industry dependent communities. Many of Alaska’s small coastal villages maintain participation in the seafood industry through federal fisheries quota programs. The Western Alaska Community Development Quota (CDQ) Program gives eligible communities a portion of all Bering Sea and Aleutian Islands quotas for groundfish, prohibited species, halibut, and crab for the purpose of supporting fisheries related economic development in Western Alaska (NOAA 2010; ADCCED 2010d). The program began in 1992 and currently involves 65 communities that are grouped into 6 regional organizations (CDQ Groups) (ADCCED 2010d). CDQ groups use their quotas in various ways, including acquisition of ownership interests in processing facilities and vessels and investment in small-scale fishing operations. Such enterprises have produced benefits of local employment, training and educational opportunities, as well as funding for rural infrastructure (Northern Economics 2002b).
The Community Quota Entity Program (CQE), like the CDQ program, is intended to distribute the benefit of fisheries to small and remote communities in Alaska; however, the CQE program applies to communities in the Gulf of Alaska rather than the Bering Sea and Yukon-Kuskokwim Delta. The CQE

Strategic Trends Analysis
Final 45
program developed in response to the implementation of a halibut and sablefish Individual Fishing Quota Program (IFQ), which issued quota shares (QS) to qualified applicants in the gulf’s fixed gear halibut and sablefish fisheries. Over time, local conditions and market forces encouraged QS holders in small and remote Gulf of Alaska communities to transfer their shares, which led to an overall decline in the amount of quota held in remote villages. In 2002 the CQE program was developed to allow 42 eligible communities to form non-profit corporations called Community Quota Entities (CQEs) to purchase QS, thus allowing the QS to become a permanent asset for the community. Each CQE community determines their criteria for distributing the IFQ among residents; these criteria reflect local aims and priorities (North Pacific Fishery Management Council 2010).
3.2.3.1 Future Demand for Maritime Operations and Facilities
Commercial harvests in all major fisheries in Alaska have fluctuated over the years due to environmental and other causes. While most Alaska fish and shellfish stocks remain healthy, due to limits on the amount of fishery resources available for harvest, most fisheries-related forecasts indicate no change, or very modest change in seafood tons shipped in the future. Similarly, no increase in the fishing fleet is forecasted as the current fleet is adequate in size to harvest the amount of fish and shellfish available (AIRA Risk Analysis Team 2010).
In addition, the bulk of Alaska's seafood harvest will continue to be frozen, packed in freezer vans, and hauled to the Lower 48 on barges or transferred directly to freighters heading for Japan and other foreign markets (Alaska Seafood Marketing Institute 2005). Air shipments of fresh seafood from Alaska boomed when freight rates tumbled with federal deregulation of the airline industry and wide body jetliners specializing in cargo were introduced (McDowell Group 2001a). However, only a fraction of the overall harvest gets this kind of royal treatment—perhaps three percent of Alaskan salmon, for example. Because of the unreliable weather in Alaska’s remote locations, freezing and shipping is much less risky—and lowers the cost of transport dramatically (to both processor and consumer) (Miller 2008).57
As discussed in Section
2.3, an increasingly important advantage of transporting goods by maritime transport is its lower carbon footprint. In recent years, consumer-based ocean conservation efforts have focused attention on seafood that is produced in an “eco-friendly” manner. With growing concerns about global climate change and energy security, greenhouse-gas emissions and energy efficiency have begun to be factored into the sustainable seafood movement (Wright 2008). A recent study compared the estimated carbon impact of air transporting a Copper River king salmon (headed and gutted on shore to a average weight of 25 pounds) the 1,738 miles from Cordova to Anchorage and on to Seattle, versus shipping it the same route�delivery by air produced about 57 times more CO2 (Miller 2008). The results of such studies have been noted by those in the food service industry interested in capitalizing on market trends among eco-conscious consumers. For example, Bon Appétit Management Company launched its Low Carbon Diet in 2007 at all of its 400 restaurants located in corporate offices, universities, and other specialty venues nationwide. As part of this
57 In addition, it is possible to ship fresh seafood via containership. With a transit time of roughly 66 hours from Anchorage to Tacoma, Washington, these ships can deliver fresh halibut and salmon in a controlled, chilled environment at an economical rate. Seafood is stored on ice in refrigerated trailers and then loaded on the ships. While on the vessel, refrigerated trailers are monitored on a scheduled basis in order to maintain strict temperature control of the seafood. At the destination, seafood arrives in Tacoma in excellent shape, ready for the final market or the next link in the supply chain (McDowell Group 2001a).

Strategic Trends Analysis
46 Final
marketing effort, the company pledged to ban air freight of seafood to any of its restaurants by April 2009 (Wright 2008).58
Another factor that could alter maritime operations and facilities supporting Alaska’s seafood industry is changing markets. Japan remains the single largest export market for Alaska seafood, but retains that distinction by an increasingly narrow margin as the value of Alaska seafood exports to markets such as Europe and China grows (Seafood Market Bulletin 2007). Much of the Alaska-caught fish sent to China is re-processed, after which it is re-exported to the United States, Europe, and other overseas markets.
59
Much of the Alaska seafood exports bound for Europe currently use a trans-Atlantic shipping route after crossing the United States in railcars. However, in the future it may be possible to ship Alaska seafood to European markets by means of the Northern Sea Route if Arctic Ocean ice conditions continue to become less severe.
The declining catch quotas available for whitefish species in European Union waters, coupled with the depreciation of the dollar against the Euro, led to an increase of U.S. exports of Alaska-caught pollock and Pacific cod to the European market. The single most important export market for pollock fillets has been Germany since 2001. Another important European destination for Alaska-caught pollock is the Netherlands because it has two of Europe’s leading ports (Rotterdam and Ijmuiden-Amsterdam) and is in close proximity to other countries in Western Europe; most product imported by the Netherlands is further processed and re-exported to other EU countries (Chetrick 2007).
60 In addition, the potential for offshore commercial fishing in a less icy Arctic Ocean has drawn serious attention from U.S. fishery managers. Commercial species such as Arctic cod and yellowfin sole are found in these waters, and they could conceivably support commercial fisheries if exploitable biomass levels were sufficiently high. However, the North Pacific Fishery Management Council has taken a risk-averse approach to managing Arctic fishing activities in the U.S. Exclusive Economic Zone, adopting in 2009 a fishery management plan to close the Arctic Ocean to all commercial fishing until additional research into its unique characteristics can be evaluated (Stram and Evans 2009).61
3.2.4 Tourism
Alaska’s cruiseship industry is a marine-based component of its tourism industry. Cruiseship passenger volume in Alaska began to accelerate in the late 1990s as cruises became more affordable (Table 13).
58 According to Bon Appétit representatives, the company’s carbon-reduction goal for seafood proved to be harder than anticipated because of seafood traceability problems. The company estimates that about 90 percent of the seafood it currently buys is regionally procured or frozen at sea (SeaFood Business 2009).
59 In recent years, Alaska has lost processing capacity to low-cost countries in Asia as a result of outsourcing of some fish processing operations, including cleaning, filleting, and packaging (DCCED 2002; Sánchez et al. 2008). In particular, an increasing amount of headed and gutted Alaska-caught pollock, Pacific cod, and chum and pink salmon is being exported to China, which has been rapidly expanding imports of raw material fish as the world's “seafood processing plant” since the latter half of the 1990s (Redmayne 2007). Transport costs to China can be offset by significant presentational and yield improvements achieved by use of a highly skilled, but comparatively low-cost labor force. Much of the U.S. seafood staying in China is also from Alaska�Chinese processors estimate that about 30 percent of Alaskan seafood sent to China is actually consumed by the Chinese domestic market (Sánchez et al. 2008).
60 Two decades ago, in the early 1990s, there was a proposed venture between the City of Unalaska and SovietUnion in which Alaska seafood products would be transferred to a Soviet ice-breaker and then shipped to Europe via the Northern Sea Route (Collins 1991).
61 Some commercial fishing already occurs above the Bering Strait, but only in the state-managed inshore waters. It includes chum salmon and sheefish harvests on the edge of the Chukchi Sea at Kotzebue, and a small cisco fishery in the Colville River delta, which opens into the Beaufort Sea (North Pacific Fishery Management Council 2009).

Strategic Trends Analysis
Final 47
With the expansion of Alaska’s cruiseship industry, it has come to represent a significant portion of the state’s overall visitor market. In the summer of 2009, approximately 1.6 million out-of state visitors came to Alaska; 63 percent of these visitors spent at least one night on a cruiseship while in Alaska (McDowell 2009).
Table 13. Alaska Cruiseship Passengers by Port, 1996-2009
Year Haines Juneau Ketchikan Point Sophia Seward Sitka Skagway Whittier Wrangell1996 95,988 464,484 425,104 0 230,042 252,256 268,443 0 24,4261997 116,982 524,842 497,808 0 208,900 183,562 435,554 0 8,3471998 153,355 568,524 523,108 0 280,543 161,351 486,528 0 12,2551999 159,734 595,959 565,005 0 280,229 168,024 514,940 0 11,9872000 195,466 640,477 572,464 0 274,733 156,019 563,669 0 6,7022001 45,804 690,648 665,221 0 337,241 206,279 610,145 0 4,8052002 90,595 741,512 703,130 0 316,888 250,241 621,331 0 6,1362003 28,479 776,991 770,805 0 293,230 256,782 628,006 0 39,0962004 29,566 876,203 848,969 67,620 141,902 232,399 716,453 186,682 45,9472005 30,832 948,226 921,429 77,498 152,557 229,793 774,361 208,703 44,7602006 32,896 951,431 838,880 140,670 134,579 267,026 767,404 228,971 5,7662007 27,659 1,017,341 901,595 161,920 156,014 233,936 820,829 225,071 5,1922008 50,121 1,032,274 941,910 126,381 165,959 289,753 781,676 220,117 4,0022009 43,550 1,020,706 937,419 134,685 163,056 224,335 785,116 212,598 3,842
Note: Annual passenger volumes cannot be summed across ports because cruiseships often call on more than one port.Source: Alaska Department of Law (2010)
The cruise industry is a large seasonal user of port facilities. However, dedicated port facilities are not required, as demonstrated by the fact that in communities without adequate berthing capacity, the cruiseships anchor and use their small lighter vessels to bring passengers ashore. The cruise industry in Alaska is likely to continue to grow, though at lesser rates than experienced in the past, due primarily to the relatively few communities that can accommodate large cruiseships and offer shore excursions and other venues for large numbers of visitors, and competition from other locations around the globe that can produce higher revenues and lower operating costs.
The cruiseship industry is particularly well established within Southeast and Southcentral Alaska. As noted in the above table, cruiseships routinely dock in Juneau, Ketchikan, Skagway, Sitka, Whittier, and Seward (U.S. Army Corps of Engineers 2008). Whittier and Seward are frequently labeled as “Anchorage” in Alaska cruise marketing materials. However, the Port of Anchorage is developing a secured cruiseship terminal to accommodate routine calls from cruiseships (Port of Anchorage 2010). In May 2010, the first cruiseship in a quarter century made a regular port call in Anchorage (Bluemink 2010a). Holland America has scheduled its 1,380-passenger cruiseship The Amsterdam to stop nine more times in Anchorage during the 2010 season and is planning to bring the ship back next year (Associated Press 2009; Bluemink 2010a).
The cruise industry is slowly expanding to other communities in Alaska, as demonstrated by the recent addition of Anchorage, Kodiak, and other Southcentral Alaska communities to a cruiseship itinerary. Cruise lines with smaller vessels have also entered the trade and are calling at smaller communities that can’t meet the needs of large cruise vessels. More of the smaller cruiseships are also cruising through the Bering Sea to the Arctic Ocean, and a few are transiting the Northwest Passage.

Strategic Trends Analysis
48 Final
These ships have stopped at Nome and other communities in western Alaska and more port calls should be expected in the future with additional vessels entering this trade.
Alaskan cruise itineraries can vary widely, as the various cruise lines try to appeal to a broad market by offering different activity types, cruise lengths, ports of call, etc. Most out-of-state cruises destined for Alaska begin in Vancouver or Seattle;62
The cruise lines making port calls in Alaska rely on both public and privately-owned infrastructure to support their operations (U.S. Army Corps of Engineers 2008). In 2006, Alaska began to impose a $50 fee on passengers arriving by cruiseship, consisting of a $46 Commercial Passenger Vessel Excise Tax (passenger tax) and a $4 Ocean Ranger Fee. The passenger tax is earmarked for port facilities and other infrastructure improvements and generated roughly $38 million per year over the past few years (Bluemink 2010b).
those that are not round-trip voyages usually end in Whittier or Seward. Similarly, cruises beginning in-state set out from Whittier or Seward and typically finish in Vancouver or Seattle (Princess 2010; Holland America 2010; Carnival 2010). Cruise tours, which are land-based tourism excursions that may be taken either before or after the associated cruise, are offered by many of the cruise lines operating in Alaska. These trips may last for days or weeks and extend the tourism impact of cruise vessel passengers beyond the port communities. Typical cruise tour itineraries include bus and/or rail transportation to locations such as Denali National Park, Fairbanks, the Kenai Peninsula, and Anchorage.
In 2009, the Alaska Cruise Association, which represents the nine major cruise lines operating in Alaska, filed suit against the state in U.S. District Court claiming that the portion of the tax earmarked for infrastructure improvements violated the U.S. Constitution as well as federal law (Bluemink 2010b).63
Funding for port and harbor development has also come from sources other than the passenger tax. The Alaska Railroad Corporation, a public corporation, has made substantial investments in port infrastructure that supports cruiseship activities in Seward and Whittier, both of which are terminals of the Alaska Railroad and major ports of call for cruiseships (Alaska Railroad Corporation 2007a: Alaska Railroad Corporation 2007b).
. The lawsuit never reached a court room; an agreement was reached in which the suit was dropped in exchange for a reduction of the head tax. On April 18, 2010, the legislature approved a measure to lower the head tax to $34.50 (Bohrer 2010b). The decrease removes the 25 percent portion of the tax used to fund infrastructure projects that are unrelated to port facilities.
64
An example of a private-public partnership to develop cruiseship-related port infrastructure is Icy Strait Point, Alaska's first dedicated cruiseship port. Opened in 2004, Icy Strait Point is a collaboration
Cruiseship passengers use either the passenger rail or the road systems in these port communities, en route to or from Anchorage, Fairbanks and other Alaska destinations.
62 The port of departure depends on whether the cruiseship will end in a U.S. or foreign port. Most cruiseships are foreign-flagged vessels and depart from Vancouver to comply with the Passenger Vessel Services Act of 1886. In many cases, cruise passengers depart from Seattle on buses and actually board the ship in Vancouver.
63 The Association's primary argument against the tax is that it violates the "tonnage clause" of the U.S. Constitution. The clause limits a state’s authority to impose fees or taxes measured by the capacity of a vessel for the privilege of entering a port unless those fees or taxes defray the cost of services provided to the vessel. The lawsuit argues the tax "produces revenues that far exceed the expenses the state incurs to provide services or facilities to cruise ships; it was imposed without consideration of any specific services being provided to cruise ships; it has been earmarked in part for localities that are not even ports of call; it has been used to fund future projects that provide no benefits to the passengers who actually pay the fee; and its proceeds have been appropriated to projects that do not have the legally-required relationship to services or facilities provided to cruise ships" (Sloan 2009).
64 In 2004, Whittier Dock Enterprises, a private company, constructed a cruiseship terminal in Whittier on land leased from the Alaska Railroad Corporation.

Strategic Trends Analysis
Final 49
between major cruiseship lines and the Huna Totem Corporation, the for-profit Alaska Native Claims Settlement Act corporation for the Village of Hoonah in Southeast Alaska (Swagel 2007).65
Data on visitor volume in Alaska show that the state’s tourism industry, including the cruiseship component, is subject to exogenous forces and events. As shown in
Table 13, the global economic downturn caused several cruiseships to move out of the Alaska market in 2009, and the number of cruise visitors in 2010 is expected to drop by about 15 percent from preliminary 2009 numbers of slightly less than 1 million (Fried 2010a).66
It is also important to note that although there has been an overall increase in cruiseship traffic in Alaska, in some cases one port's gains may have partly resulted from another's losses. Valdez in particular has seen cruiseship traffic fall dramatically in the past few years, as Holland America, Princess Cruises and Carnival Cruise Lines left for other Alaska ports (Prince William Sound Economic Development District 2006).
The Ports of Whittier and Seward are expected to experience an even greater decline in cruiseship traffic. About 400,000 passengers were brought across the Gulf of Alaska into Southcentral Alaska in 2009, but the cruiseship industry said it would bring about 120,000 fewer passengers in 2010�a 30 percent drop (Fried 2010b).
67
Cruiseship activities related to ecotourism along the Aleutian Islands and into the Arctic Ocean continue to increase (U.S. Army Corps of Engineers 2008). The cruiseship industry considers Arctic voyages to be a vital and especially lucrative part of their international tourism product. This is apparent when considering the price that tourists pay to travel to this region. In 2008, the prices for Arctic cruises ranged between $2,900 and $55,000 per person (Arctic Council and PAME 2009). An example of a port that has benefitted from this ecotourism segment of the cruiseship industry is Nome, which has become a port of call for small, expedition-class cruiseships (ships that carry a maximum of approximately 100 passengers) (ADCCED 2007).
Similarly, the increase in cruiseship port calls at Icy Strait Point reportedly resulted in a reduction in Sitka (Swagel 2007).Cruise passenger volumes have also been down in Wrangell (Jensen Yorba Lott Inc. et al 2006), though Petersburg saw growth in 2007 after a decline in 2006 (Petersburg Economic Development Council 2008).
68
3.2.4.1 Future Demand for Maritime Operations and Facilities
These cruiseships often dock just long enough to pick up and off-load passengers that are flown by charter jet, and to refresh supplies (Land Design North 2003).
Despite the recent decline in cruiseship passenger volume in Alaska ports due to the global economic recession, Alaska is expected to remain among the dominant markets for the international cruiseship
65 To develop Icy Strait Point, the Huna Totem Corporation received a loan from AIDEA through the U.S. Bureau of Indian Affairs.
66 According to cruise line representatives, the imposition of the head tax also contributed to their decision to send fewer ship to Alaska (Bluemink 2010b). The existence of such taxes has factored in the decision by cruise operators to send ships to ports in other parts of the world. Some years ago, for example, Carnival Cruise Lines decided to reduce cruiseship visits to Grenada as a protest to the imposition of cruise taxes by the government, an action that seriously affected the economy of the small nation (The World Bank 2007). However, some Alaska legislators have argued that the decision to move vessels from Alaska to other markets was due to profit potential, not the head tax; the shift of vessels from Alaska to Europe occurred simultaneously with worsening economic conditions in the United States (Joling 2009).
67 One of the major factors in the reduction of cruiseship calls in Valdez was the lack of shore excursions for visitors to the community. Other factors included a lack of appeal in the downtown area and the distance between the downtown area and the cruiseship dock (Northern Economics, Inc. 2002).
68 Large cruiseships offering trips into the Arctic Ocean are also using Nome as a port of call. In 2009, for example, a 644-foot residential cruiseship docked in Nome (Murphy 2009).

Strategic Trends Analysis
50 Final
industry. Many cruiseship lines have responded to the economic crisis with special promotions, and the cruiseship industry will likely continue to expand its Alaskan presence over the long term.
As mentioned in Sections 2.1.5 and 2.1.6, cruise vessels are increasing in size and placing additional strains on the port facilities that service them. Docks must be extended or modified, vessel channels and berths are being dredged to deeper depths, and port communities are enhancing public infrastructure to handle the influx of passengers. In addition, tightening environmental regulations may require changes in cruiseship operations and port modifications. In 2001, Alaska was the first state to regulate cruiseship pollution.69 In 2006, Alaskan voters approved a ballot measure that requires owners/operators of large commercial passenger vessels to obtain a wastewater discharge permit from the Alaska Department of Environment Conservation for the discharge of any treated sewage, treated graywater, or other treated wastewater into marine waters of the state. In addition, reacting to complaints from Juneau residents concerning visible smoke emissions from visiting cruiseships, the Alaska Electric Light and Power Company and Princess Cruises joined forces to construct a shoreside power station on the South Franklin docks. The $4.5 million power facility allows cruiseships to shut down their diesel generators while docked in Juneau (Alaska Electric Light and Power Company 2006).70
VZM/TranSystems and Northern Economics, Inc. (1999) note that ship schedules may limit increases in cruiseship traffic in some Alaska ports. For example, the Port of Anchorage does not fit into the 7-day itineraries of most existing (or planned) cruiseships serving the Pacific Northwest-Alaska coast. A 10-day voyage is necessary to serve Anchorage from Vancouver, Canada or Puget Sound ports, and that segment of the market is losing share.
71
Moreover, growth of cruiseship traffic in some Alaska ports is deliberately constrained by local communities seeking to mitigate perceived negative environmental and social impacts of the cruiseship industry. The decision by Sitka residents not to construct a cruiseship dock has been successful in limiting the number of cruiseships that visit Sitka in any given day or season (Dugan et al. 2007).
72
Other Alaska ports that are seeking to increase the number of cruiseship calls may be able to take advantage of industry trends. For example, the cruiseship industry has indicated that it not only intends to maintain an Arctic presence, but to expand in terms of ship passenger capacity, destinations, and extended seasons of operations (Arctic Council and PAME 2009). Incidents like the sinking of the cruiseship MS Explorer in 2007 highlight the continuing dangers of transporting passengers to the polar regions.
Icy Strait Point has a policy that no more than one large cruiseship can call at a time (Swagel 2007).
73
69 Based on the results of monitoring done during 2000, Alaska Governor Tony Knowles introduced the Alaska Cruise Ship Initiative to strengthen state monitoring of the cruise industry’s waste disposal practices. The law provides: 1) A verified program of sampling, testing, and reporting of wastewater and air discharges from cruiseships; 2) An enforceable standard for what cruiseships may discharge into Alaska waters; and 3) A method of payment for the program (a $1 surcharge per cruiseship passenger).
However, sea ice retreat and the opening of Arctic sea routes would
70 In California, requirements for “cold ironing” are already being implemented. These regulations require vessels to plug into shore-side power while at dock to reduce air pollution (Denning and Kustin 2010).
71 VZM/TranSystems and Northern Economics, Inc. (1999) include the following quote from the Cruise Lines International Association publication, The Cruise Industry: "Reflecting North America’s shorter vacation patterns, the cruise industry’s hottest growth category has been the 2-5 day cruise category.”
72 Because there is no deepwater dock in Sitka, cruiseships drop anchor offshore and passengers lighter in on 120-person-capacity vessels (Dugan et al. 2007).
73 The Explorer was the first cruiseship to sink in polar waters, off the coast of the Antarctic Peninsula. The ice-strengthened vessel was designed and purposely outfitted for polar travel. The Explorer was also the first

Strategic Trends Analysis
Final 51
facilitate use of the Arctic by cruiseships (U.S. Army Corps of Engineers 2008).74
While public docks owned by local governments were the primary facilities used by cruiseships in the past several decades, over the past 10 years the private sector has emerged as a provider of berthing facilities in several locations. Local governments and the private sector have been able to arrange financing for facilities that are primarily dedicated to cruiseships in the summer months. Examples include Huna Totem’s Icy Straits Point cruiseship destination, and the privately-owned cruiseship dock in Whittier. Given this situation, it is unlikely that federal or state assistance is needed to develop future facilities for the cruise industry, unless AIDEA or another state entity is involved with financing. However, certain organizations will likely pursue grant funds if they are available to reduce financing costs and risk.
Nome, in particular, may be able to capitalize on these potential developments by selling itself as a “gateway” to the Arctic Ocean�it could become the center for Arctic cruises, much in the way Ushuaia, Argentina serves the portion of the cruiseship industry that markets Antarctic tours. However, other Alaska communities may try to compete with Nome for this component of Alaska’s tourist industry. To the north, Kotzebue would like to build its own deep-water port to accommodate cruiseships and other vessels (Murphy 2009).
3.2.5 Agriculture and Forestry
Alaska’s agricultural resources have traditionally served local markets. Recent studies have concluded that production by agricultural producers in the state is too limited and at too high a price to compete outside of Alaska. The failed Delta barley project and Valdez and Seward grain terminal projects are testaments to the difficulties Alaska agricultural producers face competing in export markets.75
The timber industry in Alaska is primarily located in the southeast portion of the state. Southeast Alaska is one of the last areas in North America that supports and harvests stands of large, old-growth timber of white wood species (hemlock and Sitka spruce). However, Alaska forestry and forest product industries have been challenged by external events that have occurred over the last two decades. In particular, increased supplies of raw material in the global marketplace drove prices down and increased competition. Gilbertsen and Robinson (2003) note that a series of mergers and consolidations within the international wood products industry have seen the emergence of several dominant corporations whose business perspective is global in scope. In seeking efficiencies, these companies have closed or consolidated plants in high cost areas and shifted investments to lower cost areas. In addition, during the 1990s an economic recession caused housing construction to decline in Japan, which at the time was the major market for Alaska forest products (Brackley et al. 2006; Gilbertsen and Robinson 2003).
Both projects were victims in part of depressed commodity prices—costs of Alaska production were too high to weather any period of depressed prices (McDowell Group 2003).
cruiseship to offer Arctic trips, carrying passengers through the Northwest Passage in 1984 (Stewart and Draper 2008).
74 In the summer of 2008, two German cruiseships made trips through the Northwest Passage, which included stops at Barrow; travel agents are now booking reservations for additional trips through the passage (Murphy 2009; Reiss 2010).
75 In 1996, following a year when there was a surplus of barley grown in Alaska’s Delta region and continental U.S. feed grain prices were unusually strong, two railcars of Alaska-grown barley were transported from Seward to a feed mill at Tacoma, Washington via railcar-barge service. This was the first and only export of barley out of Alaska for the commercial market. Alaska farmers also had some limited experience during the late 1990s exporting seed potatoes to Taiwan; the potatoes were trucked to the Port of Anchorage and shipped overseas (McDowell Group 2001b). Problems associated with a blight disease limit opportunities for additional potato exports (University of Alaska Fairbanks Cooperative Extension Service 2006).

Strategic Trends Analysis
52 Final
Another factor that had a significant negative effect on Alaska forestry and forest product industries was the cutting restrictions unilaterally imposed by the U.S. Forest Service in the early 1990s that effectively ended the long-term harvest contracts upon which Alaska mills depended (Gilbertsen and Robinson 2003). Furthermore, environmental groups have continued litigation efforts to halt all timber harvest within the Tongass National Forest.
Table 14 presents an overview of Alaska shipments of forest products. Round logs and rough-sawn green lumber are the traditional products shipped from the state; in general, both products are at the low end of the scale in terms of wholesale value and profitability (Brackley et al. 2006; Gilbertsen and Robinson 2003). While some Alaska forest products are shipped from ports such as Ketchikan and Sitka, others are not shipped from a port per se�logs are often trimmed, graded, and assembled into wire-bound bundles and rafted by boom boats and tugs to holding areas, where they are hoisted aboard log export ships. In addition, forest products are shipped from Viking Lumber Company, Inc.’s private dock at Klawock, which borders the Tongass National Forest.
Table 14. Foreign and Domestic Waterborne Shipments of Lumber, Logs, Wood Chips, and Pulp Originating
in Alaska, Thousands of Short Tons, 1997–2006
1997 1998 1999 2000 2001 2002 2003 2004 2005 2006Foreign 2,580 1,331 1,880 657 1,179 833 657 332 815 653
Domestic 3,618 2,504 1,874 1,592 193 32 67 35 39 96
Total 6,198 3,835 3,755 2,248 1,372 865 724 367 853 749Source: U.S. Army Corps of Engineers (2010)
There has also been a limited forest product industry in Southcentral Alaska. In 2005, NPI, LLC began shipping wood chips from Port MacKenzie using Panamax-size woodchip vessels. Birch chips were sold to a Korean cardboard manufacturer, and spruce chips were shipped to a Japanese newsprint manufacturer (U.S. Army Corps of Engineers 2008). NPI invested more than $20 million to expedite construction of deep-water dock and to install a commodities storage pad and conveyor system at the port. A decision in 2008 to ban logging on Matanuska-Susitna Borough lands for three years forced NPI to shut down its wood chip operation (White 2008). Other harvest operations have taken place in Southcentral Alaska for specific purposes, such as the removal of beetle killed spruce in the 1990s and early 2000s.
3.2.5.1 Future Demand for Maritime Operations and Facilities
Alaska has a viable grain industry but exports are dependent on strong prices and the ability of Alaska’s grain production to achieve economies of scale. Given the economic difficulties that Alaska’s farmers face in exporting bulk agricultural commodities with a relatively low value per ton, it is unlikely that the demand for marine transportation services by the state’s agricultural industry will increase in the near future.
Extrapolating the historical data would lead to a future of declining quantities of forest products shipped from Southeast Alaska. However, Brackley and Haynes (2008) identify opportunities for expanded lumber production in Alaska. The authors note that Alaska producers should be able to compete in specialty markets for high-value forest products. In addition, there is continued interest in the Matanuska-Susitna and Kenai Peninsula Boroughs in exporting wood chips and round logs. The Afognak Native Corporation is planning to export 40 million board feet of logs in 2010, though their port will just be a transfer facility rather than a more developed port (Engel 2010).

Strategic Trends Analysis
Final 53
3.2.6 Transportation
Given that Alaska is central to the North Pacific great circle route connecting North America with Asia, there has been interest in using Alaska ports as transshipment points for cargoes moving from Asia to the U.S. West Coast. As discussed in Section 2.1.4, the strategic location of a transshipment hub relative to the primary origins and final destinations of vessel traffic is the most important attribute carriers look for.
Alaska already has a well-established air cargo transshipment industry�Ted Stevens Anchorage International Airport handles more cargo than any other airport in the nation (and has the third highest amount of cargo landed weight of any airport in the world) (Fried and Keith 2005; Inboundlogistics.com 2004).76
According to VZM/TranSystems and Northern Economics, Inc. (1999), transshipment of containers at the Port of Anchorage continues to have potential. The authors note that although just-in-time transportation still dominates the thinking of most shippers and consignees in the U.S., low interest rates and the resulting lower inventory carrying costs have made longer transit times more acceptable. One scenario for transshipping containers is to use bulk ships configured to carry containers on deck, or on deck and in the hold (conbulkers), on the backhaul leg for the Asia–Anchorage trip, and use existing container carriers for the Anchorage–Tacoma trip. VZM/TranSystems and Northern Economics, Inc. conclude that a transshipment business using bulk carriers through Anchorage will not occur unless a third party develops the market and interests bulk carriers in responding to the demand.
The concept assumes that bulk carriers transporting coal or other bulk cargoes from Alaska will backhaul cargoes to Alaska ports, using marginal cost pricing (VZM/TranSystems and Northern Economics, Inc. 1999). These backhaul cargoes would then be transshipped at Alaska ports as backhaul cargo aboard liner vessels to the Lower 48. The lower marginal cost pricing that is assumed for both backhaul legs could provide compelling rates for shippers. An early study concluded that high cargo-handling costs would preclude the transshipment of breakbulk commodities at the Port of Anchorage, but that there was potential to transship containers (VZM/TranSystems and Northern Economics, Inc. 1999).
77
There is also the potential for sea-air movements of cargo through the Port of Anchorage. Air freight capacity from Asia to Alaska is full, but capacity from Alaska to the Lower 48 is available. The idea would be to ship high-value freight to Anchorage by sea, where it can be transferred to Ted Stevens Anchorage International Airport for a just-in-time delivery system to the Lower 48 (Inboundlogistics.com 2004). Major volumes of coal and timber exports were deemed essential to make sea-air movements feasible (VZM/TranSystems and Northern Economics, Inc. 1999).
In addition, the authors note that a substantial amount of coal or other exports would have to move through the Cook Inlet area to make conbulker transshipment a possibility. Weekly conbulker service would be a necessity for developing any substantial amount of transshipment cargo.
Other studies have examined the potential for Alaska ports to provide intermodal land-bridge service to the midwestern and eastern areas of the United States and Canada. For example, Tryck Nyman Hayes, Inc. and Riverwise, LLC (2008) discuss the findings of the Alaska Canada Rail Link feasibility study, which included an analysis of Asia/North America container land-bridge traffic via the Port of
76 An advantage of Alaska as an air cargo transshipment center is that it lies equidistant between Europe and Asia. In addition, Ted Stevens Anchorage International Airport has the lowest landing fees and terminal rental rates among major cargo airports (Inboundlogistics.com 2004).
77 VZM/TranSystems and Northern Economics, Inc. (1999) note that bulk carrier owners usually know little about the container business and are not organized to market liner service or to own and keep track of an inventory of containers. They are willing to lease out deck space and shift their vessels for loading, but little else. Accordingly, for this transshipment opportunity to be realized, a third-party operator or logistics company must take the initiative, generate the business, and maintain container control.

Strategic Trends Analysis
54 Final
Anchorage. The concept is that the Port of Anchorage intermodal expansion project currently underway and the construction of the Alaska Canadian Rail Link would provide a ready-made land-bridge alternative to relieve the congestion in U.S. West Coast ports that has been created by U.S. consumers’ demand for Chinese import goods.
The Alaska Canada Rail Link study concluded, however, that a Port of Anchorage container land-bridge from Asia to the U.S. midwest faces major impediments, aside from development of the Alaska Canada Rail Link�it would be more expensive than service via existing west coast gateways with no time savings.78
The opening of Arctic sea routes could increase interest in using Alaska ports as transshipment points. In 2005, the Institute of North, in cooperation with the City of Adak, contracted with Aker Arctic Technology, Inc. of Norway to perform a prefeasibility study to evaluate the technological and economic aspects of a container shuttle link between the Aleutian Islands and Europe using the Northern Sea Route (Aker Arctic Technology, Inc. 2006). Such a link would allow cargoes in the trans-Pacific and trans-Atlantic trades to transship to the other ocean, thereby providing service in the Europe/Asia and Europe/U.S. West Coast trade routes. The preliminary findings of the research indicate that current ship technology, including the “Double Acting” operation mode, which improves icebreaking capability and reduces fuel costs, has improved the economic feasibility of trans-Arctic commercial cargo traffic. However, Aker Arctic Technology, Inc. (2006) notes that an Arctic container shuttle link between Alaska and Europe would still face a number of major economic obstacles, including Russia’s current fee system for use of the Northern Sea Route described in Section
The study also concluded that only a “perfect storm” of circumstances at existing U.S. West Coast ports would cause Anchorage to be considered as an alternative based on capacity or congestion constraints. These circumstances included realization of the highest forecast volumes, failure of U.S. West Coast ports to proceed with productivity improvements and expansion plans, failure of other U.S. West Coast port alternatives to materialize, and failure of the current Panama Canal expansion project to result in competitive all-water service into the Ohio Valley via northeast U.S. container ports (Tryck Nyman Hayes, Inc. and Riverwise, LLC 2008).
2.2.
3.3 Alaska Resupply Cargo
Whereas the above section described current trends in exports affecting shipping and port development in Alaska, this section focuses on the effects of trends in imports. Alaska resupply cargo is freight and goods shipped into Alaska to supply the needs of businesses and the population of the state. Since Alaska has a very small manufacturing sector, virtually all producer and consumer goods must be imported from outside the state (Goldsmith and Schwoerer 2009). Moreover, businesses in Alaska have limited warehousing capability, which means supplies of food, fuel, and other essential
78 VZM/TranSystems and Northern Economics, Inc. (1999) argued that “If regularly scheduled container service can be established, there is potential for providing intermodal land-bridge service to the midwestern and eastern areas of the U.S. and Canada. Trucks currently carry produce, some household goods, and higher-value products from the Lower 48 states to Alaska. There are limited backhaul opportunities for trucks at present. Because of the potential for balance of inbound to outbound movements, trucking costs to and from the Midwest can be very competitive with marine transportation, and delivery time is much faster. For example, a vessel traveling at 16 nautical miles per hour from Asia to Anchorage arrives 58 hours earlier than a vessel traveling to Seattle. Assuming 10 hours to offload a container and deliver to the linehaul carrier, a truck traveling an average of 50 miles per hour will arrive in Edmonton, Alberta (Canada), or Shelby, Montana, before an analogous vessel arrives in Seattle. Both Edmonton and Shelby are major intermodal (truck/rail) centers, and the container could continue by truck to its final destination or be placed on a rail car to its ultimate destination. Using either city, a container moving from Anchorage can reach a Midwest destination several days before a similar shipment would arrive from Seattle or other Puget Sound ports. Improvements in the highway system connecting Anchorage and the Lower 48 have reduced driving time, and these improvements are expected to continue reducing travel time and making the trucking industry more competitive in the future.”

Strategic Trends Analysis
Final 55
goods must arrive on a continuous basis.79 The dependence of Alaska residents on an uninterrupted flow of waterborne goods was underscored in 2002, after a lock out of dockworkers by shippers caused the closure of 29 west coast ports. During a one-week period, convoys of as many as 80 trucks traveled along the Alaska Highway to bring goods to Anchorage from Washington State. Typically, a much smaller number of trucks operate along that route (McPherson 2002). Horizon Lines LLC and Totem Ocean Trailer Express (TOTE), the two major companies currently providing containership service to Alaska, point to the speed and efficiency of their services in meeting customers’ supply chain requirements (Tryck Nyman Hayes, Inc. and Riverwise, LLC 2008).80
The primary marine transportation modes used to supply the state are container and trailer services to the Port of Anchorage and barge services to various Alaska ports. The Port of Anchorage, located at the head of Cook Inlet directly north of the Anchorage downtown central business district, is primarily a receiving port, with the tonnage of inbound cargo far exceeding that of outbound cargo. Inbound cargo spans the full range of goods, materials, and equipment needed by Anchorage and the remainder of Alaska, including groceries, medical supplies, retail goods, vehicles, and construction materials. Altogether, the Port of Anchorage serves over 80 percent of the state’s population and handles over 90 percent of all consumer goods sold in Alaska except for the Panhandle (Anchorage Port Expansion Team 2005).
They each currently provide 3-day service from Tacoma to Alaska on a twice-weekly basis. In addition, inbound cargo generally does not stay in the yard for more than 48 hours; it is received and delivered to other facilities prior to the arrival of the next shipment.
81
Another major attribute of the Port of Anchorage is the modal flexibility it affords shippers. With convenient access to Ted Stevens Anchorage International Airport, the Alaska Railroad Corporation’s main terminal, and Alaska’s highway system, the port ensures quick and efficient intermodal movement. Shippers can mix and match modes depending on the needs of their customer. Recently, the port has added a new intermodal rail connection to the railroad terminal which allows for the movement of containers and trailers on flat cars rather than by truck. In addition, the port has added new road access improvements to reduce truck queuing at the port gate.
The role of the Port of Anchorage in the state economy is critical because there are no alternatives to the services that the port provides. Other Southcentral Alaska ports are located at a significant distance from the greater Anchorage area, which is the center of population and commerce for the state. Furthermore, these other ports have limited dock, storage, and crane facilities (Goldsmith and Schwoerer 2009).
The Port of Anchorage’s resupply trade is dominated by consumer goods, which include petroleum products, primary manufactured goods, and groceries (Table 15). With the exception of petroleum products, almost all general cargo and consumer goods demanded by the state’s population are now transported in containers. Petroleum tankers and fuel barges deliver petroleum products to the Port of Anchorage primarily from refineries in Alaska, Puget Sound, and California, with some inbound product from foreign suppliers (AIRA Risk Analysis Team 2010).
79 The Port of Anchorage’s Director, Former Governor Sheffield, has claimed that Alaska has only a one-week supply of most consumer goods. In the event of supply disruptions, many items would face shortages.
80 TOTE has been serving Alaska’s marine freight and cargo market since 1975, while Horizon Lines, Inc. began serving Alaska as Sea-Land Service, Inc. in 1964.
81 Goods that move through the Port of Anchorage are circulated through all populated areas of Alaska north of Cordova. Over 140 Alaskan villages receive fuel, groceries, and cargo that originate from approximately 5 million tons of goods that transfer through the port each year (Anchorage Port Expansion Team 2005).

Strategic Trends Analysis
56 Final
Table 15. Port of Anchorage Inbound Cargo, 1994–2008
Year
Commodity (Thousands of Short Tons) Approximate TEU Count
(Thousands)Petroleum Products Lumber
Primary Manufactured. Goods Groceries
Manufactured Equipment, Machinery and Products
1994 518 19 147 347 325 ---1995 674 21 167 340 378 ---1996 728 20 167 345 332 ---1997 827 24 185 339 357 ---1998 644 42 232 346 791 ---1999 690 44 215 354 852 1842000 500 62 247 339 1,100 2292001 493 61 264 309 973 1972002 513 62 239 320 892 2702003 351 92 297 323 1,012 2632004 418 82 243 335 1,022 2762005 662 155 283 342 1,055 2832006 520 127 219 342 1,004 2122007 307 120 215 326 1,020 2732008 281 111 216 312 1,043 305
Source: Port of Anchorage (2009); U.S. Army Corps of Engineers (2010)
While the Port of Anchorage and its intermodal connections keep a large portion of Alaska’s population supplied with essential goods, most of the state’s 350-plus communities lack road or rail access. Inclement weather conditions and limited air transportation infrastructure often block access to rural Alaska communities, and these conditions sometimes last for days (U.S. Army Corps of Engineers 2008). Barging is the dominant resupply method for many coastal and riverside communities outside of the Railbelt.82
Several larger ports of call are regular stops for a number of barge carriers, either on a seasonal or year-round basis in Southeast and Southcentral Alaska. Many other communities, particularly those along the west coast and on navigable rivers in Alaska, are served by a regional barge line only once or twice each summer due to seasonal ice, a delivery that provides a year's worth of goods at one stop. Other communities receive barge service only on special request since the level of business doesn't warrant regular, repeated stops by the barge lines (Jones 2002).
In addition, barges carrying items that don't easily fit in containerized cargo carriers stop in Valdez, Whittier, Seward, or Anchorage, where the items are then put on trucks or rail cars bound for other areas of Alaska (Jones 2002).
82 The primary competitor to barge shipments is the United States Postal Service’s (USPS) bypass mail/air cargoprogram. Bypass mail is mail that is transported on private air carriers with minimal USPS supervision. Therefore, the system creates cost savings by bypassing many of the USPS’s handling and administrative activities. Moreover, air carriers are able to serve businesses in rural Alaska on a frequent (often daily), year-round basis. These businesses need this level of service because they don’t have enough space to warehouse large amounts of groceries and other goods. However, barges are often preferred or required for certain types of shipments. Low value-to-weight, non-perishable items are suitable for barge traffic, including soft drinks, beer, and paint. Hazardous materials and anything that exceeds the allowable dimensions for air transport must go by barge (Northern Economics, Inc. 2006). In addition, it is important to note that a significant portion of in-state bypass mail originates from large discount stores in Anchorage that receive their goods by marine transport (VZM/TranSystems and Northern Economics, Inc. 1999).

Strategic Trends Analysis
Final 57
Tug/barge operations in Alaska have typically consisted of a tug towing up to three barges, although Crowley Maritime Corporation now offers bulk fuel transportation through its new articulated tug barge fleet.83
Depending on conditions, a traditional tug/barge train can be a kilometer or more in length (Arctic Council and PAME 2009). This method of marine transport is the most suitable for rural Alaska. Larger communities may have sufficient barge landing facilities, but in most communities shoreside receiving facilities are primitive or entirely absent and water depth is limited. In many villages, especially at sites exposed to severe weather, or where the landing sites are unconsolidated beach materials and/or are subject to rapidly changing ocean conditions, barge operations land when and where practical, holding firm through tug maneuvering (URS Corporation 2009). Besides lacking wharfs or docks, many barge loading/offloading areas are also deficient in basic infrastructure (sewer, water, electricity, and garbage disposal).
Articulated tugs sit within a notch in the stern of a barge and attach to it using a flexible connection system resembling a hinge. The tug can attach and detach from the barge, ideally allowing it to work multiple barges. Crowley operates articulated tug barges on the east, gulf, and west coasts. By the end of 2010, Crowley expects to have a total of 14 within their fleet (Buls 2007). Besides coastal petroleum transportation, ATBs are also being used on the Great Lakes for dry bulk commodities (Walsh 2009).
Fuel and heating oil are the primary products delivered by barge to rural communities. Deck freight, delivered along with fuel orders or separately on regular scheduled barges, is the second highest volume of products delivered. Deck freight is generally delivered in steel shipping containers or as breakbulk cargo (loose non-containerized material such as long lengths of pipe and timber, vehicles, palletized cargo, etc.). The third key delivery product is construction materials delivered by chartered barges. These products are generally associated with community construction projects like schools, fuel tank farms, health clinics, and airports (URS Corporation 2009). Most barge shipments originate in the Puget Sound area or Southcentral Alaska.84
Although containerships and barges carry much greater volumes of marine freight to Alaska ports than do ferries, the Alaska Marine Highway System (AMHS)—the state-operated ferry system—provides a critical modal alternative to air travel for residents of Southwest, Southcentral, and Southeast Alaska. The service it provides is part of the National Highway System (Alaska Department of Transportation and Public Facilities 2008).
Scheduled linehaul freight service is provided to the major regional hubs (Ketchikan, Juneau, Sitka, Yakutat, Valdez, Cordova, Seward, Kodiak, Unalaska-Dutch Harbor, Naknek, Dillingham, Bethel, Nome, and Kotzebue), with feeder service by smaller barge to the smaller communities in each region (Northern Economics, Inc. 2006).
85
83 In 2009, Crowley’s 155,000-barrel articulated tug barge, Sea Reliance/550-1, became the largest of its kind to transit Alaska waters. The 600-foot long vessel delivered a load of fuel from the U.S. West Coast to the Port of Anchorage (The Journal of Commerce Online 2009).
The Alaska Marine Highway System’s fleet of eleven vessels serves 30
84 Fuel and heating oil in tank barges pulled by tugs transit from refineries at Nikiski in Cook Inlet and at Valdez as well as from U.S. West Coast refineries. Additionally, Tesoro, Flint Hills, and Chevron terminals in the Port of Anchorage can off-load to fuel delivery barges (Nuka Research & Planning Group, LLC and Cape International, Inc. 2005; Szymoniak et al. 2010). Deliveries of petroleum products to Prudhoe Bay are also made by Canadianbarge service via the Port of Hay River on the MacKenzie River, which is supplied by rail from Edmonton (Tryck Nyman Hayes, Inc. and Riverwise, LLC 2008). In the case of some Yukon River communities, fuel is trucked to the Nenana terminal from a North Pole refinery. From the Tanana River at Nenana, fuel is barged to the Yukon River, supplying fuel to communities as far downstream as Mountain Village and as far upstream as Fort Yukon.Communities nearer the mouth of the Yukon River receive fuel by ocean-going barges (Szymoniak et al. 2010).
85 The history of Alaska’s ferry system began in territorial days when a privately owned company, the Chilkoot Motorship Lines, began operating a small, surplus, amphibious assault ship, the M/V Chilkoot, between Juneau, Haines and Skagway in 1949. By 1951, the Territory of Alaska purchased the ship and assumed operations of the economically failing run. In 1957 the aging Chilkoot was replaced with the M/V Chilkat. When Alaska entered into statehood in 1959, the Chilkat was transferred to the new state along with other territorial assets

Strategic Trends Analysis
58 Final
different Alaska ports and two outside ports. It carries approximately 300,000 passengers and 100,000 vehicles every year (Alaska Department of Transportation and Public Facilities 2008; Fried and Keith 2005). While the ferries carry relatively little freight, they offer faster and more frequent service than barge, and are less expensive and less capacity-constrained than air. They are used by many businesses to move mobile construction equipment to and from job sites, and to ship various types of industrial supplies and spare parts (Alaska University Transportation Center 2008; Northern Economics, Inc. 2006). Inconsistent service schedules, typically a result of long routes, tidal restrictions and vessel repairs, have been a constraint on ferry-based business development. Where service schedules have been steady, such as Ketchikan–Metlakatla and Juneau–Hoonah, local businesses have benefitted (Alaska University Transportation Center 2008).
3.3.1.1 Future Demand for Maritime Operations and Facilities
As the state’s population continues to increase, the need for expanded port facilities also increases. Anchorage resupply trade is dominated by consumer merchandise, which fluctuates with population change. Although the historical average annual growth rate of container traffic through the Port of Anchorage has been more than twice the population growth rate in Alaska, both major liner carriers serving the port anticipate that future growth will more closely parallel population growth. According to forecasts by the University of Alaska Anchorage Institute of Social and Economic Research (Northern Economics, Inc. et al. 2010), the population of the area of Alaska served by the Port of Anchorage is expected to increase at an average annual rate of about one percent over the next ten years. The quantity of resupply cargo received by the Port of Anchorage will likely increase at a comparable rate. As noted above, much of the general cargo and consumer goods arrives in the port in containers. Community resupply through barging operations is expected to expand in the coming years due both to population increases in rural Alaska communities and increasing economic development in some regions, stimulating demand for goods and construction materials (Arctic Council and PAME 2009).
While the Alaska Marine Highway System is considered a critical part of Alaska‘s transportation system, continuation of the ferry system faces a number of major economic challenges, including aging ships, highly seasonal demand, and high crew and fuel costs (Alaska University Transportation Center 2008). The current level of ferry service is heavily dependent on a continuing and increased operating subsidy from the general fund (Alaska Department of Transportation and Public Facilities 2008). A proposed change to the ferry system would result in fewer long-haul routes and more short connector or shuttle ferries (Alaska Department of Transportation and Public Facilities 2008).
3.4 Harbors of Refuge and Emergency Response
In addition to serving as facilities for receiving ships and transferring cargo to and from them, ports play an important role in maritime safety and prevention of pollution through technical-nautical assistance to ships, maritime traffic monitoring systems, and facilities to collect ships’ waste to avoid discharges at sea.
Central to the objective of providing a ship in distress assistance and protection is the concept of a place of refuge (or harbor of refuge). According to International Maritime Organization’s Guidelines on Places of Refuge for Ships in Need of Assistance, a place of refuge means a location where a ship in need of assistance can take action to enable it to stabilize its condition, reduce the hazards to
becoming the first state-owned ferry. In 1963, Alaska formally established the Division of Marine Transportation,and the Alaska Marine Highway System began operations (Alaska University Transportation Center 2008).

Strategic Trends Analysis
Final 59
navigation, and protect human life and the environment. A ship in need of assistance means a ship in a situation, apart from one requiring rescue of persons on board, which could give rise to the loss of the vessel or an environmental or navigational hazard (Arctic Council and PAME 2009). For example, with modern ships carrying large volumes of hazardous cargo and fuel, a disabled ship can pose a significant threat to the marine environment and interests of an affected coastal state. Remote Alaska villages rely on subsistence activity to feed their families, and any impairment to these marine habitats and wildlife can cause grave consequences (Reiss 2010; U.S. Army Corps of Engineers 2008).
Most remote coastal Alaska communities lack the infrastructure and capabilities to respond to vessel disasters. The threat to life and property is most profound when vessels are unable to locate refuge from severe weather along the Alaska coastline. Even limited exposure to cold air and water temperatures quickly reduces chances of survival for shipwrecked individuals in lifeboats and rafts (U.S. Army Corps of Engineers 2008). Moreover, studies point to the many long-term and unexpected negative effects of ship-based pollution, such as oil spills, on Alaska coastal ecosystems (Li and Boufadel 2010; Peterson et al. 2003). It is also important to note that the scarcity of places of refuge has economic as well as safety and environmental implications. Because the availability of port infrastructure and support directly influences the level of risk associated with transiting a particular waterway, it affects the levels of marine insurance rates (Arctic Council and PAME 2009).
Harbors of refuge are not normally required through Southeast Alaska and along the Aleutian Chain because there are a large number of natural anchorages and sheltered bays in these regions. However, the coastlines of the Chukchi and Beaufort Seas are generally too shallow for large ships seeking shelter. The lack of places of refuge and emergency response resources on Alaska’s North Slope is likely to become a particular area of concern given the increased number of freight ships, cruiseships, oil and gas tankers, mineral cargo vessels, and resupply barges that may be passing through the Bering Strait and plying the waters of the Arctic Ocean within the next couple of decades. Already, the number of vessels in the region exceeds the emergency response capabilities of local communities (Arctic Council and PAME 2009). A study now underway by the USCG is expected to determine whether the agency needs a full forward operating base in the Arctic as a way of dealing with the increased vessel traffic in Arctic waters (U.S. Army Corps of Engineers 2008).86
Harbors of refuge in the Chukchi and Beaufort Seas will depend on national interest designation and large federal investment due to their remote location and high capital, operating, and maintenance costs. Alaska Miners Association recommended evaluation of Cape Darby and Port Clarence as possible mineral export port sites in their comments on the draft Northwest Alaska Transportation Plan and they would have suitable characteristics for harbors of refuge. These sites have the advantage of natural deep water compared to Nome or Kotzebue, but lack community infrastructure.
In addition, the U.S. Navy initiated Task Force Climate Change in 2009 to assess the Navy’s preparedness to respond to emerging requirements due to global climate change, including humanitarian assistance and disaster relief. The task force’s first deliverable will be a strategic roadmap proposing actions for the Navy regarding the Arctic region (U.S. Department of Defense 2009).
Another recent development related to harbors of refuge and emergency response was the introduction of legislation by U.S. Representative Don Young and U.S. Senator Lisa Murkowski to examine the feasibility of constructing a deepwater port in Alaska near the western entrance to the Northwest Passage (Boswell 2010; Young 2010).87
86 In 2008, the Coast Guard opened temporary bases in Prudhoe Bay and Barrow, where it tested various types of response vessels to determine how they operate under Arctic conditions (U.S. Coast Guard 2009).
In coming years the provision of Arctic port facilities or harbors suitable for refuge for medium to deep draft vessels will likely become both a
87 The Canadian government has announced plans to construct a deepwater port near the eastern entrance to the Northwest Passage, at Nanisivik on northern Baffin Island (Boswell 2010).

Strategic Trends Analysis
60 Final
national and international imperative; in 2008, the five countries that border on the Arctic Ocean (Russia, the United States, Canada, Denmark, and Norway) adopted the Ilulissat Declaration, which reaffirmed their commitment to work together through the International Maritime Organization to strengthen existing measures and to develop new measures to improve the safety of maritime navigation and prevent or reduce the risk of ship-based pollution in Arctic waters (Ministry of Foreign Affairs of Denmark 2009).

Strategic Trends Analysis
Final 61
4 Assessment of Shipping and Port Development Issues in Alaska
This chapter assesses specific issues associated with shipping and port development in Alaska. These issues could constrain the development of new maritime operations and facilities in the state or the expansion of existing ones.
4.1 Climate Change Issues88
The Alaskan Arctic and sub-Arctic are recognized as the area of the world where changes to the climate are likely to be among the greatest, leading to significant impacts (National Research Council 2008). According to the National Assessment Synthesis Team of the U.S. Global Change Research Program (2000), over the past 50 years, Alaska has warmed at more than twice the rate of the rest of the United States’ average. The state’s average annual temperature since the 1950s has increased 4°F. The observed change is part of a larger trend through most of the Arctic corroborated by many independent measurements of sea ice, glaciers, permafrost, vegetation, and snow cover. While future temperature changes are uncertain, the National Assessment Synthesis Team of the U.S. Global Change Research Program states that climate models project that rapid Arctic warming will continue, increasing by 3.5 to 7°F by the middle of this century.
Already, the most severe environmental stresses in Alaska are climate-related (National Assessment Synthesis Team of the U.S. Global Change Research Program 2000). These climate-related stresses have important implications for Alaska’s maritime operations and facilities. Maritime transport systems are likely to be both directly and indirectly impacted by various climate change factors such as rising sea levels, extreme weather events, and rising temperatures. Direct impacts may affect maritime transport infrastructure, operations and maintenance, and shipping patterns, while indirect impacts could result from changes in demand for maritime transport services. These may be induced by climatic changes affecting trade, investment decisions, demographics, fishery and agricultural production, forests, and energy exploration.
McBeath (2003) provides examples of noticeable direct effects of climate change on Alaska’s maritime operations and facilities. He notes that extended periods of broad ice-free fetches caused by higher temperatures, together with changes in wind patterns, have increased the amount of storm surge activity in Alaska in the last decade. Storm surges have been most frequent in coastal areas of Northern, Northwestern, and Western Alaska. Increased storm surge frequency and severity increase coastal erosion, inundation, and threats to community harbors, airports, roads, and commercial structures. In addition, more energetic waves may be generated by more frequent and intense storms that are predicted to accompany global climate change.89
88 This section concentrates on climate change and adopts the 1994 United Nations Framework Convention on Climate Change definition: “a change of climate which is attributed directly or indirectly to human activity that alters the composition of the global atmosphere and which is in addition to natural climate variability observedover comparable time periods.” According to the U.S. Environmental Protection Agency, climate change is defined as “major changes in temperature, rainfall, snow, or wind patterns lasting for decades or longer” and may result from “natural factors, such as changes in the Sun’s energy or slow changes in the Earth’s orbit around the Sun; natural processes within the climate system (e.g., changes in ocean circulation); human activities that change the atmosphere’s makeup (e.g, burning fossil fuels) and the land surface (e.g., cutting down forests, planting trees, building developments in cities and suburbs, etc.)” (U.S. EPA, 2010).
89 Although some researchers (e.g., McCabe et al. 2001) report that increased storm activity is already occurring at northern latitudes, a recent study by Mesquita et al. (2010) found no discernable trends in the number or intensity of storms in the Bering Sea. However, Mesquita et al. note that Bering Sea trends are difficult to identify because of high interannual variability and other factors.

Strategic Trends Analysis
62 Final
McBeath further notes that, although ocean level increases of 1–2 inches in the last decade appear small, they have affected Northern, Northwestern, and Western Alaska coastal communities, which tend to be built adjacent to the ocean or large rivers draining into the ocean, and which are not much higher than sea level. Sea level changes, together with thaw subsidence of permafrost shores, exacerbate the serious impacts of increased wave energy at the coast on docks and wharf facilities (such as tank farms, usually located near water) and potentially on roads and airports (McBeath 2003; Smith and Levasseur 2002). However, not all the effects of climate change are deleterious to Alaska’s maritime operations and facilities. For example, less sea ice reduces dangers to shipping and extends the shipping season (McBeath 2003). In addition, fewer days below freezing reduces problems with ice accumulation on vessels, decks, riggings, and docks; the occurrence of dangerous ice fog; and the likelihood of ice jams in ports (National Research Board 2008).
An example of the indirect effects of climate change on Alaska’s maritime operations and facilities is the changes in the abundance and distribution of important commercial fishery resources that have occurred in recent decades. For example, stocks of pollock, crab, and other demersal species on the eastern Bering Sea shelf moved further north from 1982 to 2006 in response to recent climate change (Mueter and Litzow 2008; Mueter et al. 2009a; Orensanz et al. 2004; Zheng and Kruse 2006). This northward population shift has also been reported anecdotally by trawlers, which have had to travel farther from Unalaska-Dutch Harbor to find pollock (Eaton 2006; Weiss 2008; Sackton 2009). According to Mueter et al. (2009b), biological response to past temperature changes provides some basis for predicting future changes, but extrapolating observed relationships beyond historical ranges of temperatures is difficult because they cannot account for potential thresholds or nonlinearities. However, the researchers conclude that what can be predicted with some certainty is that further shifts in spatial distribution and northward range extensions are inevitable and that the species composition of fish communities will continue to change under a changing climate. Over time, the most productive commercial fisheries in Alaska are likely to become more distant from existing fishing ports and processing infrastructure, requiring either relocation or greater investment in transportation time and fuel costs (Kruse 2007).
Knapp et al. (1999) note that how fishery managers respond to climate change may either amplify or smooth out the effects of climate change on harvests. In recognition of that fact, the North Pacific Fishery Management Council has recently undertaken several risk-averse management actions, in light of uncertainty about the ecosystem effects of climate change trends and resulting changes to fishing activities in the North Pacific. These actions include adopting a fishery management plan to close the Arctic Ocean to all commercial fishing until additional research into its unique characteristics can be evaluated, and establishing extensive trawl area closures to protect vulnerable crab habitat and to slow the northern expansion of the trawl fleet into newly ice-free waters (Stram and Evans 2009).
4.2 Environmental Protection Issues
In recent years public concerns regarding the environmental impacts of maritime transport have been increasing. This is due to the fact that, despite the greater fuel efficiency of maritime transport in comparison to other modes of transport (Section 2.3), its benefits will be outweighed by the expected increase in the volume of ship movements as global seaborne trade increases (Miola et al 2009).
As discussed in Section 2.3, air pollution is a major environmental issue because of concerns over global climate change, acid rain, and atmospheric ozone depletion. For economic reasons, many vessels use heavy fuel oil which has very high sulfur content (90 percent higher than gasoline or

Strategic Trends Analysis
Final 63
conventional diesel).90
The health and environmental impacts of the above air pollutants are highly dependent on the proximity of the emission sources to sensitive receptor sites. This means that, compared to land-based sources, at least some of the maritime emissions have fewer health and environmental impacts because they may be released far from populated areas or sensitive ecosystems. However, as for all other sources, emissions from ships are transported in the atmosphere over hundreds of miles, and thus can contribute to air quality problems on land. This pathway is especially relevant for deposition of sulfur and nitrogen compounds (Miola et al 2009). On the other hand, as discussed in Section
The main air emissions from burning this type of fuel are CO2, nitrogen oxides (NOx), volatile organic compounds, particulate matter (“black carbon”), and sulfur dioxide (SO2) (Miola et al 2009). In 2007, CO2 emissions from shipping are estimated to account for 3.3 percent of world CO2 emissions from fuel combustion (International Maritime Organization 2009). As a result of the expected growth in shipping, CO2 emissions from shipping are projected to increase by 150 to 250 percent by 2050 (International Maritime Organization 2009).
2.3, significant improvements in ship emissions are obtainable by changing shipping practices. In the near future, these technical and operational measures with CO2 reduction potential may be supported by an international regulatory regime for greenhouse gas emissions.91
Port activities also have a range of potential impacts on the environment, although these impacts will vary across ports. Ports may require large amounts of coastal and estuarial land and usually need to dredge to keep navigational channels open; excavation and dredging may result in the suspension of sediments and pollutants. Eutrophication and anoxia are also water pollution risks in ports due to poor water turnover (European Sea Ports Organisation 2001; Miola et al. 2009). Discharge from ships, including bilge and fuel leakage, leaching of antifouling paints, and dumping of contaminated ballast water and other wastewater, can contribute to water degradation in ports (Miola et al. 2009). Most ports operate on a 24-hour basis, and the constant noise, dust, emissions, and intensive lighting from ships, container and bulk handling facilities, and the transport modes converging on the port are other important adverse impacts (European Sea Ports Organisation 2001). At major ports along the U.S. West Coast, these serious environmental issues and community livability concerns have emerged as a result of expanded port activity. As a result, community and environmental groups have opposed numerous port developments and initiated legal actions to do so (Tryck Nyman Hayes, Inc. and Riverwise, LLC 2008).
An example of an existing port facility in Alaska that has been the focus of environmental concerns is the coal export facility at the Port of Seward. Local residents complain that the coal dust blowing off coal stockpiles at the Seward Coal Loading Facility impedes air quality, creating a public health 90 Heavy fuel oil accounts for approximately 77 percent of maritime transport fuel used and almost all fuel used by ocean-going ships. Heavy fuel oil is a viscous residual product remaining at the end of the crude oil refining chain and as such, contains an elevated share of impurities (e.g. oxides, sulfur, and water). Nonetheless, it is an available and relatively cheap refinery by-product and well-suited for use in current large marine engines�hence its popularity (Crist 2009).
91 The MARPOL Convention 1973/78 is the main international convention dealing with various types of pollution from ships. MARPOL’s Annex VI, which includes regulations for the prevention of air pollution from ships, came into force in 2005, and as of October 2009, it had been ratified by 56 countries, representing approximately 83 percent of the gross tonnage of the world’s merchant fleet. A revised Annex VI came into force in 2010. Annex VI deals with SO2 and NOx emissions and particulate matter, but it does not cover CO2 emissions, which are subject to separate discussions within the International Maritime Organization (UNCTAD 2009). Following legislation by the European Commission, the first Sulfur Emission Control Area (SECA) came into force in 2006 in the Baltic. The next SECA became effective in 2007 in the North Sea area. The main effect of this legislation is to reduce the maximum sulfur content of marine bunker fuel oil consumed within the SECA. In the United States, the U.S. EPA adopted exhaust standards for the largest marine diesel engines in 2010. These standards, along with designation of a North American Emission Control Area, are a two-part strategy to reduce ocean-going vessel emissions and air pollution.

Strategic Trends Analysis
64 Final
concern.92
A recent proposed port development project in Alaska that has also raised environmental concerns is the proposed expansion of the Port of Anchorage. The expansion would involve a landfill in Knik Arm that would more than double the land area of the port. There is concern that the $700 million public works project, the largest in the history of Anchorage, could harm salmon and beluga whale populations.
In 2009, two environmental groups filed a lawsuit to urge Alaska Railroad Corporation and Aurora Energy Services to reduce coal dust emissions at the facility (Ritchie 2010). The Alaska Railroad Corporation has also received two Notices of Violation from the Alaska Department of Environmental Conservation on the subject of coal dust at the coal export facility—one in April 2007 and the other in March 2008 (Alaska Railroad Corporation 2010).
93
Perhaps the single most significant threat from maritime operations and facilities to the marine environment is the release of oil from ships through accidental discharge. The Exxon Valdez oil spill that occurred in Prince William Sound in 1989 while the ship was en route from Valdez to Los Angeles is the largest ship-based oil spill in U.S. waters. Recent studies show that a significant amount of the spilled oil still persists, and the long-term impacts on the marine environment may be more devastating than previously thought (Li and Boufadel 2010; Peterson et al. 2003).
In addition, residents of Anchorage neighborhoods adjacent to the port worry that the new land might be used to store noxious materials such as coal (Demer 2008a). Two environmental groups and a public interest organization are seeking to halt the expansion project by requesting that the U.S. Army Corps of Engineers revoke a permit that allows the project to move forward (Demer 2008b). However, the project is also expected to have positive environmental effects. For example, the proposed longer container dock would enable carriers to replace their existing containerships with larger capacity vessels that use only marginally more fuel to move significantly more cargo, thereby reducing fuel use and emission levels (Goldsmith and Schwoerer 2009).
Since the Exxon Valdez incident, increasing attention has been paid to the dangers of oil spills to Alaska ecosystems and coastal communities. Much of that concern is centered on the high level of ship traffic that passes through the Aleutian Islands along the North Pacific great circle route discussed in Section 2.2. The area around the Aleutian Islands is notorious for adverse weather and sea conditions; it is strongly influenced by a persistent atmospheric low pressure system that produces intense storm activity and strong ocean currents, particularly through the Aleutian Island passes (Arctic Council and PAME 2009; Nuka Research & Planning Group, LLC and Cape International, Inc. 2005). The large majority of the transits through the Aleutian Islands along the North Pacific great circle route are by vessels that have no state oil spill contingency plans and no state certificate of financial responsibility because they are in innocent passage (Nuka Research & Planning Group, LLC and Cape International, Inc. 2005).94
92 According to the Alaska Railroad Corporation, one of the main problems is that while coal ships can hold up to 90,000 tons, the average coal train can only hold about 7,500 tons. This means that for every ship loaded, nine to 12 train shipments from the Usibelli coal mine in Healy must be received and stockpiled at the port (Ritchie 2010).
In 2004, for example, the M/V Selendang Ayu, a 738-foot bulk grain ship, ran aground off the coast of Unalaska Island while transiting the North Pacific great circle route from
93 In 2008, the Cook Inlet beluga whale population near Anchorage was listed as an endangered species under the Endangered Species Act.
94 After an incident in 1997, during which the 368-foot frozen seafood freighter M/V Kuroshima broke away from its anchorage during a storm and ran aground near Unalaska Island, spilling approximately 40,000 gallons of bunker C fuel oil, the State of Alaska passed a law requiring nontank vessels greater than 400 gross tons that operate in Alaska waters (which generally extend 3 miles from the outermost shorelines and head-lands) to file oil spill contingency plans with the state (AS 46.04.055). The federal government followed suit with a law requiring oil spill contingency plans for nontank vessels calling at all U.S. ports (Nuka Research & Planning Group, LLC and Cape International, Inc. 2005).
Strategic Trends Analysis
Final 65
Seattle to China. An estimated 335,000 gallons of persistent fuel oil were spilled.95 The ship was engaged in innocent passage through Alaska waters and therefore exempt from state and federal oil spill planning requirements (Nuka Research & Planning Group, LLC and Cape International, Inc. 2005).96
Following the Selendang Ayu spill, a number of nongovernmental organizations came together to create the Shipping Safety Partnership. This coalition of groups is working to improve shipping safety standards for tankers and freighters transiting the North Pacific great circle route (Alaska Oceans Program 2005).
97
An emerging major environmental issue of concern is the effect of increased vessel traffic in the Beaufort and Chukchi Seas on fragile Arctic ecosystems. Potential impacts of Arctic shipping include the discharge of oil and other pollutants both from routine ship discharge and accidents, ship strikes on marine mammals (particularly the endangered North Pacific right whale, the introduction of alien species, anthropogenic noise produced from marine shipping activity, and harmful emissions (Arctic Council and PAME 2009).
Given the prospects for extensive Arctic oil and natural gas production, much of the concern regarding Arctic shipping has focused on the risk of an oil spill and the ability to adequately respond should a spill occur.98
95 The highest risks for environmental damage from oil spills are from vessels carrying persistent fuel, such as #6 bunker oil, bunker C, and IFO 380, which have low dissipation and evaporation rates. These fuel types will remain on the surface of marine waters or along shorelines much longer than non-persistent fuel such as diesel, gasoline, and aviation fuel. For example, up to 90 percent of a diesel spill will evaporate or disperse into the water column within a couple of hours to a couple of days. By contrast, 70 percent of bunker C fuel oil will persist as floating or beached oil for a week or longer (Nuka Research & Planning Group, LLC and Cape International, Inc. 2005).
According to the Arctic Council and PAME (2009), the risk of an oil spill is high if vessel traffic in the Arctic continues to increase. The authors point out that for safe shipping operations in the Arctic, there is a need for the same suite of meteorological and oceanographic data, products, and services as in other oceans, plus comprehensive information on sea ice and icebergs. However, gaps exist in data important to support safe navigation for significant portions of Arctic shipping routes. The authors further note that there is a lack of emergency response capacity for pollution mitigation. The serious limitations to radio and satellite communications and current lack of
Of the 2,700 estimated ship voyages that occur through the Aleutian Islands each year, as many as 1,600 are by containerships with a typical fuel capacity of 1.8 million gallons of persistent fuel, and as many as 30-40 are by tank ships that may carry as much as 800 million gallons of persistent fuel. Most of the remaining voyages are by freight ships, similar to the Selendang Ayu, with a typical fuel capacity of 400,000 gallons of persistent fuel (Nuka Research & Planning Group, LLC and Cape International, Inc. 2005).
96 Similarly, in 2006, the MV Cougar Ace, a 650-foot roll-on/roll-off auto carrier, almost capsized while transferring ballast approximately 200 nautical miles southwest of the Aleutian Islands. The ship was in international waters transiting the southern great circle route across the North Pacific and therefore not subject to state and federal oil spill planning regulations (Nuka Research & Planning Group, LLC and Cape International, Inc. 2005).
97 The safety measures proposed by the Shipping Safety Partnership include a risk assessment for the Aleutian Islands, stationing adequately powered rescue tugs along the route to provide emergency towing assistance to disabled vessels, implementation of real-time satellite vessel tracking, emergency tow packages on vessels, clear communication protocols between ship and shore, better spill response capability in-region, routing agreements that protect sensitive shoreline habitats, attention to rat-free shipping, improvement of vessel construction standards, and imposition of a fee on all cargo hauled across U.S. ports to fund prevention and response measures for cargo vessels (Alaska Oceans Program 2005).
98 According to the U.S. Geological Survey (2008), the Arctic holds about 22 percent of the world’s undiscovered conventional oil and natural gas resource base, about 30 percent of the world’s undiscovered natural gas resources, about 13 percent of the world’s undiscovered oil resources, and about 20 percent of the world natural gas liquid resources.

Strategic Trends Analysis
66 Final
marine infrastructure in all but a limited number of areas, coupled with the vastness and harshness of the environment, makes conduct of emergency response significantly more difficult in the Arctic (Arctic Council and PAME 2009).99
The marine and coastal ecosystems in high latitudes are more vulnerable to the destructive effects of oil spills than those in southern areas due to, for instance, lower biodiversity, which has been suggested to be associated with lower resilience (Forsgren et al. 2009). Moreover, ice-dependent marine mammals in the Bering Strait and Chukchi and Beaufort areas, such as polar bear, walrus, and seals, are already stressed due to sea ice retreat; they may be at increased risk from any additional ship-sourced stressors or contamination, as populations will become increasingly concentrated around retreating sea ice (Arctic Council and PAME 2009).
100
Recent court challenges highlight environmental concerns over Arctic oil and gas development. For example, Shell Oil has paid over $2.2 billion since 2005 to secure federal oil and natural gas development leases offshore of Alaska in the Beaufort and Chukchi Seas, and was planning to drill wells in its Beaufort Sea leases during the summer of 2007. However, those plans were suspended later that year by the Ninth Circuit Court of Appeals in response to law suits filed by the North Slope Borough, Alaska Eskimo Whaling Commission, and environmental groups regarding the potential impact of Shell’s offshore drilling on subsistence hunting and on the environment. Shell currently hopes to begin its Beaufort Sea and Chukchi Sea drilling program in 2010 (Budzik 2009). However, the exploration plan and future activity are the subjects of ongoing litigation, and the outcome is uncertain.
4.3 Sociocultural Issues
As discussed in Section 3.2, many of Alaska’s rural communities are dependent on resupply trips carried out by barges. The fuel and other goods that are delivered by marine transport allow rural Alaskans to continue their subsistence lifestyle, which is among the most highly valued aspects of the Alaska Native culture and an important part of the economy of these rural communities.101
On the other hand, Alaska’s rural residents express concern for the social, cultural, and environmental effects of an expansion in commercial shipping and marine transportation, which could occur from reduced amounts of sea ice, the opening of new shipping lanes, and an extended navigation season.
99 The relative difficulty of cleaning up marine oil spills in the Arctic is a point of debate. Forsgren et al. (2009)cite studies that indicate that oil degradation in high latitude seas is likely to be slower than in temperate regions due to lower temperature, less light (in winter), and the presence of ice. Hence, there is an increased persistence of petroleum hydrocarbons in Arctic seas. The studies further indicate that even the most volatile components will not escape from oil trapped under sea ice. Instead, many of them would dissolve in sea water and become toxic for the marine flora and fauna. However, a recent study funded by seven oil companies suggests that cleaning up oil spills in Arctic ice is in many respects easier than cleaning it from open water because ice can act as a natural blockade that traps the oil and gives responders more time to clean it up (Bluemink 2009d). The U.S. Arctic Research Commission (2010) has called for a comprehensive research program to address spill response in broken ice, as shipping moves into the Arctic Ocean and offshore oil drilling moves forward.
100 In 2008, polar bears were listed as a threatened species under the Endangered Species Act. One of the principal reasons for the listing is the predicted global decrease in the total area of polar bear sea ice habitatdue to climate change. There have been petitions and proposals to protect several other of the Arctic's at-risk, ice-dependent marine mammals under the Endangered Species Act. For example, the National Marine Fisheries Service is considering listing ringed, bearded, spotted, and ribbon seals, and petitions have been filed to list the Pacific walrus.
101 The Alaska Natives Commission (1994) found that social, emotional, spiritual, cultural, and nutritional benefits are important aspects of subsistence food harvesting and sharing that contribute to personal and community health in rural Alaska.

Strategic Trends Analysis
Final 67
Many rural residents today depend heavily on marine resources for subsistence and the local economy. The possibility of more oil spills due to increased marine shipping is a major concern, given the potentially devastating effects a spill could have on marine species and subsistence activities. It is likely that many residents of Alaska coastal communities believe that increased marine shipping would inevitably lead to a major oil spill, with the Exxon Valdez spill given as an example of a low-probability event becoming certain within a sufficiently long period of time.
What is important is that rural residents believe that they exercise some power over the way expansion of marine transportation systems proceeds, and that this expansion, together with the industry development that it supports, such as oil and gas development and mining, offer them economic benefits that are commensurate with the environmental risks.102
Native peoples will be an important factor in planning for polar development. Through their corporations, they may prove to be a significant source of investment. They can also contribute a limited amount of manpower to construction projects. There is no doubt that increasing power and sense of self-control of native groups will require that northern developers carefully consider Natives' demands for compensation both for losses of hunting areas and for qualitative changes in their lives (biological, social, and economic) resulting from polar development. It is likely, further, that they will demand a direct stake in development and may attempt to impose taxes on real property, vehicles, vessels, and incomes within their legal boundaries.
The following passage from Haglund (1983) regarding social issues that will affect polar development and maritime transportation remains true today not only for the Arctic, but for greater rural Alaska:
4.4 Construction Issues
Geographic characteristics of Alaska pose a challenge to regional deep water port development, especially in the more northern regions. For example, shallow coastal waters occur along much of the Bering Sea (including Norton Sound), Chukchi Sea, and Beaufort Sea. Nearly all potential port development locations in these areas would require a dredged channel at least one to two miles in length to accommodate vessels that are Panamax-size or larger. For example, Teck Alaska, Inc. is considering constructing a direct load out facility for zinc concentrate from the Red Dog mine. The facility would require a 3- to 4-mile long ship channel dredged to about 53 feet (AIDEA 2009).
In addition, constructing and maintaining infrastructure projects across Alaska is expensive, particularly in rural areas. For example, the cost of constructing buildings in remote areas is on the order of twice as much per square foot as in Anchorage. The higher construction costs in rural Alaska are due to a combination of higher input costs. Construction aggregate, such as crushed rock or gravel, are often barged to the construction site because they are difficult to source locally. Transportation of building materials is expensive; limited road and rail networks mean that goods must be barged or flow in. Additional challenges include a limited supply of specialty labor (mechanical, electrical); challenging foundation conditions—including areas with abundant permafrost; weather delays; remote logistics; and the high cost of fuel. Moreover, the harsh winter climate of Alaska significantly shortens both the construction season and the useful life of roads and
102 The economic benefits of contemporary industrial-scale extraction of natural resources to rural Alaska communities are mixed. Despite efforts to facilitate employment of Alaska Natives in the oil industry on the North Slope, the current number of oil industry employees who are North Slope residents is so small as to be statistically negligible (U.S. Minerals Management Service 2007a). On the other hand, the experience of the Red Dog mine in the Northwest Arctic Borough suggests that mineral development can substantially increase jobs and personal income in local communities, particularly if there are local hire preferences and job training programs (Tetra Tech, Inc. 2009).

Strategic Trends Analysis
68 Final
other infrastructure. The day-to-day operating costs of water, sewer and electric utility systems in rural Alaska are also high.

Strategic Trends Analysis
Final 69
5 Port and Harbor Investment Needs and Financing Opportunities
This chapter provides a broad overview of port and harbor investment needs, using various examples of port-related investments in the United States and abroad to illustrate those needs. Also included are brief descriptions of existing and emerging funding sources for port improvements in Alaska. The chapter concludes with a discussion of examples of governance and privatization issues in the United States and elsewhere and a general discussion of port and harbor investment needs in Alaska.
5.1 Types of Port and Harbor Investment Needs
As discussed in Section 2.1.5, the growing trend to use larger ships, including post-Panamax vessels, in transcontinental routes is likely irreversible because of the economies of scale achieved. Consequently, the main ports in these routes are investing in capacity, location, and maritime and land infrastructure in order to serve these vessels and handle their cargo volumes. The table below illustrates the types of investment major ports on the U.S. East Coast are making to handle larger vessels.103 5.4 Section discusses general port investment needs for Alaska.
Table 16. Examples of Infrastructure Improvements
Port
Capacity(Millions of TEU) Current
Maximum Depth Improvements2005
Post-Improvement
New York and New Jersey
4.60 6.20 46 feet Channel deepening to 50 feet, additional storage space, 4 post-Panamax cranes
Savannah 2.41 4.37 42 feet Channel deepening to 48 feet, 2,100-foot dock length, additional storage space, post-Panamax cranes
Charleston 2.00 4.00 45 feet Construction of new terminal, 4 super post-Panamax cranes, yard equipment
Virginia 2.40 10.22 45 feet Channel deepening to 55 feet, Construction of new terminal by APM, 29 post-Panamax cranes
Source: Panama Canal Authority (2006)
According to some observers, among the most important infrastructure improvements a port can make is to deepen navigation channels and berths such that new, deep draft vessels can make port calls. The U.S. Army Corps of Engineers estimates that full channel dimensions at the nation’s busiest 59 ports are available less than 35 percent of the time. This situation can increase the cost of shipping
103 U.S. East Coast ports anticipate that the current project to expand the Panama Canal (Footnote 14) will enhance their competitiveness vis-à-vis West Coast ports in capturing Asian cargo and, thus, their interest in dredging (and other port infrastructure improvements) to accommodate larger ships has intensified (Frittelli 2010). Following expansion of the Panama Canal, vessel calls on the East and Gulf Coasts are expected to increase significantly as the growing quantity of U.S.-bound cargo originating in Asia shifts away from the congested West Coast (Knight 2008). More than a dozen East and Gulf Coast ports have already signed agreements with the Panama Canal Authority to improve and increase the infrastructure required to meet these new cargo loads. It is uncertain how much cargo the expansion project will divert from West Coast ports�some studies estimate that West Coast ports may experience a loss of market share as high as 25 percent, but other studies predict the impact will be much less. The actual shift in container traffic will ultimately depend on several factors, including market conditions, canal charges, port and rail pricing strategies, and the ability of East and Gulf Coast ports to accommodate larger vessels (Penfold 2007; Solomon 2009).

Strategic Trends Analysis
70 Final
as vessels carry less cargo in order to reduce their draft or wait for high tide before transiting a harbor (Frittelli 2010). Carriers may seek alternate ports at which to call, resulting in lost business for port agencies (Fawcett 2006). Moreover, inadequately dredged channels can increase the risk of a ship grounding or collision, possibly resulting in an oil spill (Frittelli 2010).
Section 2.1.8 noted that a modern port interconnects and offers a choice between various transport modes. This intermodality enhances the economic performance of a transport chain by using modes in the most productive manner. However, ports are only one element of an intermodal distribution system. Roads and rail lines can act as critical choke points, creating severe land-side congestion that threatens to impede the continued competitiveness of ports and raises the transportation costs of goods moving through them. Port-related intermodal facilities pose a particular challenge in that they require new and innovative approaches to utilize limited property available along the waterfront. In the case of most legacy port cities, investigations into agile port systems and other initiatives have become more numerous as the country copes with its current capacity issues (Steele 2007).
Table 17. Examples of Intermodal Facility Improvements
Port Project ImprovementsBoston Gate and Yard
Automated SystemMassport's Conley Terminal, the main container facility at the Port of Boston, is configured to allow fast, continuous, and simultaneous loading and unloading of multiple container vessels. Turnaround times for container pick up or drop off have been reduced, thanks to a state-of-the-art gate facility and computerized tracking system, which gives carriers and shippers real-time information about their container's movements through the terminal.Massport has instituted an efficient gate processing system, with several pre-gates available to process multiple trucks at any one time. Using computers and remote cameras, the Conley Terminal dispatchers can process a trucker’s request for pick up or drop off within a couple of minutes and then direct the truckers to the appropriate location for the cargo container. The system is efficient, resulting in few occasions of queuing at the gate and reduced truck idling in adjacent neighborhoods.
Savannah Chatham Yard Intermodal Container Transfer Facility
The dedicated, on-terminal facility features three working tracks at 2,145 feet each and a total of 12,406 feet of storage tracks. It will enhance the port’s rail capacity and improve overall terminal efficiency.
Oakland Virtual Container Yard
Phase I of the program provided equipment visibility and opportunities for collaboration that reduced road and gate congestion at local marine and rail terminal facilities. Phase II integrated ocean carriers with motor carriers through a virtual container yard to perform mutually beneficial street turns that reduce costs and ease port congestion.
Source: Denning and Kustin (2010); U.S. Environmental Protection Agency (2009)
As mentioned in Section 2.1.2, port owners in the United States that are public entities must be cognizant of their responsibility to protect the full range of public interests, including providing for a safe environment. Ports have also started to become increasingly conscious of their environmental impacts (Section 4.2). This is most relevant in the Ports of Los Angeles and Long Beach, which were the first U.S. ports to adopt a comprehensive plan to curb pollution in all sectors of port operations. Strict environmental regulations are scheduled to take effect in the coming months and years, with limits on the types of fuel and number of trucks into and out of the port, among some of the more stringent guidelines.

Strategic Trends Analysis
Final 71
Table 18. Examples of Environmental Improvements
Port Environmental Program/PoliciesLos Angeles and LongBeach
All 16,800 “dirty” diesel trucks will be retrofitted or retired by 2011 through the Clean Trucks Program.All major container and cruiseship terminals will be equipped with shoreside power within five to ten years.104
All cargo handling equipment will be replaced or retrofitted by 2011 to meet the most stringent EPA emissions standards.
Ships are required to reduce their speed within 24 nautical miles of the ports and switch to 2,000 ppm sulfur marine fuel in the auxiliary engines. Ships are also requested to use low sulfur fuels at berth when not using shore power.
All switching locomotives will meet the most stringent EPA emissions standards, use cleaner diesel and employ automatic anti-idling devices within the first five years of the plan.A “Technology Advancement Program” identifies and evaluates emerging technologies. It is a collaboration between the ports, the California Air Resource Board, the South Coast Air Quality Management District, U.S. EPA, and tenants.
Seattle Cargo handling equipment: Working with U.S. EPA, the Washington Department of Ecology and the Puget Sound Clean Air Agency, the port has retrofitted and replaced cargo handling equipment at privately operated container terminals. As of 2009, all eligible cargo handling equipment has been retrofitted with cleaner engines. Burlington Northern Santa Fe Railway is using four wide-span, electric, rail-mounted gantry cranes at its Seattle International Gateway intermodal yard.Marine terminals: Prior to EPA’s ULSD regulations, terminal operators voluntarily switched to ULSD and biodiesel blends for non-road equipment, adopted anti-idling practices and opted for cleaner on-road engines for new equipment.At-Berth Clean Vessels Incentive Program (ABC Fuels): This program provides a $1,500 percall incentive to vessels that use 0.5% (or lower) sulfur fuel in auxiliary engines while at berth, which is 80% cleaner than the heavy fuel oil typically used. Since the program’s inception in January 2009, eight shipping lines representing more than 35% of all vessel calls made in 2008 (265 out of 755) have signed up to participate in ABC Fuels.Clean Truck Plan: Partnering with the Puget Sound Clean Air Agency, the Port’s Clean Truck Plan is fee-free, allowing truck drivers to turn their old trucks in for scrap. Truckers receive $5,000 or the Kelley Blue Book value, whichever is greater. All trucks must meet federal 1994 PM2.5 standards by 2010; 80% of trucks must meet federal 2007 standard by 2015; and 100% must meet the 2007 standard by 2017.Shore power for cruise terminals. Power provided by the local utility.
Oakland As part of its Air Quality Mitigation Program, the port created a program to encourage marine terminal operators to reduce emissions from diesel–powered equipment. Because this equipment is owned by tenants at the port and not by the port itself, the port encouraged equipment owners to participate by offering them financial incentives which were based on amount of emissions reductions achieved.
Seattle All eligible heavy-duty cargo handling equipment, a total of 169 units, have been retrofitted with diesel oxidation catalysts to reduce emissions. In addition, the terminals have voluntarily switched their operations from high sulfur off-road fuel to ultra low sulfur diesel fuel and biodiesel blends.
Rotterdam APM Terminals opened a power distribution network that sources electricity from wind power.The switch from to “green” electricity reduces the terminal’s CO2 emissions by 45% per year.The wind energy comes from two windmill farms in the Netherlands and is expected to power 14 gantry shore cranes, all refrigerated containers stored on the terminal, light poles, workshops, and other needs.
Source: APM Terminals (2009); Denning and Kustin (2010); U.S. Environmental Protection Agency (2009)
104 In 2007, the California Air Resources Board issued a regulation that requires all container, refrigerated cargo, and passenger ocean-going vessels to use shoreside power at the Ports of Los Angeles, Long Beach, Oakland, San Francisco, San Diego, and Hueneme. This regulation begins in 2010, with a goal of 80 percent shoreside power by 2020 (Denning and Kustin 2010).

Strategic Trends Analysis
72 Final
5.2 Federal, State and Local Maritime Transportation Investment Programs
and Policies
Funding for port and harbor projects is available from a variety of sources including federal agencies, state departments, legislative acts, grant and loan programs, etc. Funding sources are in many cases interrelated; they can overlap as financial support is channeled through various programs and administrations, or they may be used in combination to finance one project. The following sections provide an overview of the major funding sources available for port and harbor developments within Alaska at the federal, state, and local levels.
5.2.1 Federal
Federal support for port and harbor improvements includes assistance for three general categories: transportation infrastructure, environmental protection, and economic development. These areas are not mutually exclusive; a project may fit one, two, or all three of these purposes. The subsections below discuss the federal entities and programs that have financed (and will likely to continue to finance) Alaskan port and harbor projects.
5.2.1.1 Maritime Administration
MARAD is the agency within the U.S. Department of Transportation dealing with waterborne transportation. Among the purposes of the agency is to ensure that the United States maintains efficient ports and effective intermodal water and land transportation systems.
The Maritime Administration provides expertise on port financing and port infrastructure and supports major ports in their recent redevelopment plans. An example of this support is the partnership the agency established in 2003 with the Municipality of Anchorage to assist in implementing the Port of Anchorage Intermodal Expansion Project. This 10-year, $700 million infrastructure development project will add 135 acres of real estate, provide direct rail access, and improve road access to the port. It is expected to be completed in 2013 and will double the economic capacity of the port. The Maritime Administration’s role has been to provide federal oversight and coordination of projects, and to act as a central procurement organization, leveraging federal and non-federal funding resources and streamlining the environmental review and permitting process.
5.2.1.2 U.S. Army Corps of Engineers
Empowered under Section 10 of the Rivers and Harbors Act of 1899 (2003), the U.S. Army Corps of Engineers is responsible for maintaining the navigability of “federal navigation channels” in the United States. The Corps of Engineers annually identifies for Congress those dredging projects needing federal funding either for maintenance or new construction. The projects are aggregated into the Water Resources Development Act, providing the federal share of funds for the maintenance or construction. The federal government does not bear the full burden of this maintenance or construction�virtually all of the projects are cost-shared with state government, local government, or both (Fawcett 2006).
In 1986, Congress enacted the Harbor Maintenance Tax to recover the federal costs of dredging harbor channels to their authorized depths and widths.105
105 To increase a channel’s authorized depth or width (which is referred to as construction or “new work” by the Corps) requires an act of Congress, and is funded from the General Treasury, not the trust fund (Frittelli 2010).
The tax, which is paid by the shipper rather

Strategic Trends Analysis
Final 73
than the carrier, is levied on the value of cargo (0.125 percent) as it is loaded or unloaded from a commercial vessel in a U.S. port. Cargo entering or leaving some ports is exempt, such as those in Alaska (except for domestic shipments of Alaska crude oil, which is subject to the tax), Hawaii, Puerto Rico, and possessions of the United States. Due to a Supreme Court decision in 1998, foreign exports of waterborne cargo are no longer taxed because it was found unconstitutional. The tax revenues are deposited into the Harbor Maintenance Trust Fund from which Congress appropriates funds for maintenance harbor dredging (Frittelli 2010).
Despite a large surplus in the trust fund due to rising import volume, there are always more claims from ports for dredging than Congress will fund (Fawcett 2006; Frittelli 2010).106
In addition to the maintenance of navigation channels, the Corps of Engineers is involved in the construction and maintenance of coastal structures such as breakwaters and jetties. The amount of funds available for these civil projects fluctuates widely from year to year. Since Ted Stevens lost his seat in the U.S. Senate, the U.S. Army Corps of Engineers Alaska District has had more difficulty acquiring funds for civil projects because none of the state's current congressional delegation possesses the level of seniority that Stevens had (Manget 2010).
To make matters worse, a significant portion of annual trust fund disbursements is directed towards harbors that handle little or no cargo (Frittelli 2010). Consequently, local political influence in Congress often determines which projects are selected from among the many seeking federal funding. Indeed, port agencies spend a great deal of time and political capital ensuring that their projects are successful in obtaining Congressional funding, thus assistance from the Corps of Engineers (Fawcett 2006).
5.2.1.3 Federal Highway Administration
Intermodal access projects can be implemented by making use of highway user tax funding sources including FHWA and Surface Transportation Program programs, including Federal Congestion Mitigation and Air Quality (CMAQ) Program, High-Priority, Section 1118, and National Highway System funds, as well as the Transportation Infrastructure Finance and Innovation Act (TIFIA) loan program (Shafran and Strauss-Wieder 2003). By way of example, among the innovative cargo hub access projects to which the CMAQ Program has been applied is the Red Hook Container Terminal/Port Inland Distribution Network at the Port of New York and New Jersey. CMAQ funds of $1.9 million were matched in a 50:50 ratio to purchase a barge service as an alternative to trucking freight containers between the congested Brooklyn waterfront and Port Newark, New Jersey (Shafran and Strauss-Wieder 2003).
5.2.1.4 Environmental Protection Agency
EPA’s Clean Ports USA and SmartWay Transport Partnership supply grants for air pollution control programs. Clean Ports USA is an incentive-based, innovative program designed to reduce emissions from existing diesel engines and nonroad equipment at ports. The SmartWay Transport Partnership program identifies products and services that reduce transportation-related emissions and greenhouse gases. The program specifically addresses freight transport, with different partnership requirements for truck stops, drayage trucks, shippers, freight and rail carriers, and logistics companies. Many of the projects listed in Table 18 received funding from these EPA programs.
106 Because the trust fund is not a separate, or “off-budget,” account within the federal budget, the “surplus” in the fund has, in effect, already been spent on general government activities (Frittelli 2010).

Strategic Trends Analysis
74 Final
The EPA/West Coast Collaborative is another source of funding, as are the Department of Energy’s Clean Cities Program and the Federal Highway Administration’s Congestion Mitigation and Air Quality Improvement Program (Denning and Kustin 2010).
5.2.1.5 Economic Development Administration
The Economic Development Administration (EDA) is an agency within the U.S. Department of Commerce that partners with distressed communities throughout the United States to foster job creation, collaboration, and innovation. The EDA recently helped improve Alaskan ports by providing funding for both infrastructure and equipment. The City of Port Lions received a $1.5 million grant to renovate 35 slips and increase the capacity of the Port Lions Small Boat Harbor with an additional 21 slips (U.S. Economic Development Administration 2010). Bristol Bay Borough received $2.4 million for the purchase of a crane and two forklifts for its dock in Naknek (U.S. Economic Development Administration 2009). Each of these projects will support development of the local fishing and eco-tourism industries.
EDA requires funding applications to show jobs that are created or legitimately saved as a result of proposed improvements. The rule of thumb for funding is that EDA will provide $10,000 for each full-time equivalent job created or saved.
5.2.1.6 United States Department of Agriculture
The United States Department of Agriculture (USDA) Rural Development section oversees several programs intended to improve the social and economic conditions in rural America, offering business and cooperative loans and grants to promote business and employment. Of the various programs USDA administers, two stand out as programs that could provide financial support to Alaskan port and harbor design and construction projects: the Rural Business Opportunity Grants (RBOGs) and the Business and Industrial Loan Guarantee Program (B&I). RBOGs are intended to improve economic conditions in rural cities or towns with 50,000 people or fewer through the provision of technical, planning, and training assistance (U.S. Department of Agriculture 2010a). The B&I Loan Program guarantees loans107
5.2.1.7 The Denali Commission
by eligible lenders to businesses to benefit rural areas (U.S. Department of Agriculture 2010b). B&I gives priority to rural communities of 25,000 or less and limits loans to a maximum of $25 million per borrower (U.S. Department of Agriculture 2010b).
The Denali Commission is an independent federal agency that was created by Congress in 1998 to promote development in rural Alaska through the construction of infrastructure and the provision of job training and other economic development services (42 USC 3121). In 2010, the Denali Commission invested approximately $8.2 million in Alaskan waterfront development. Projects supported include the design of ferry terminals, passenger facilities, and small boat harbors, as well as the construction of launch ramps, floats, and docks (Denali Commission 2010).
The Denali Commission receives funding through federal appropriations and disburses these funds via the administration of social and economic programs that address the needs of rural Alaska. Waterfront development is addressed by the Commission’s transportation program, and emphasis is placed on improvements to regional ports and the construction of barge landings and dock facilities (Denali Commission 2010).
107 USDA Rural Development can guarantee losses up to 80 percent of the original loan amount (USDA 2005).

Strategic Trends Analysis
Final 75
5.2.1.8 American Recovery and Reinvestment Act
The American Recovery and Reinvestment Act of 2009 appropriated $1.5 billion of discretionary grant funds to be awarded by the U.S. Department of Transportation for capital investments in surface transportation infrastructure under the Surface Transportation Discretionary Grants (commonly called “TIGER Grants”) program. Projects that are eligible for grants under the Act include port infrastructure investments, including projects that connect ports to other modes of transportation and improve the efficiency of freight movement. For example, the Port of Everett (Washington) is applying for a $43.1 million TIGER Grant in order to upgrade its South Terminal Intermodal Freight Shipping Facility to accommodate containerized and break bulk cargoes (Port of Everett 2010).
The American Recovery and Reinvestment Act also provided $4.6 billion for the U.S. Corps of Engineers Civil Works Program, of which $2.3 billion was appropriated for operation and maintenance. Based on an August 1, 2009, project listing by the Corps, it appears that roughly $500 million is slated for maintenance dredging of coastal and Great Lakes harbors (Frittelli 2010).
5.2.2 State of Alaska
Port and harbor projects can be financed at the state level in the form of partnerships, grants, loans, legislative appropriations, or bonds. Funding may come directly from the state or be federal funds that are administered by or channeled through state agencies and programs. The following subsections describe state level funding available in Alaska for the purpose of port and harbor development.
5.2.2.1 Alaska Department of Transportation and Public Facilities
The Alaska Department of Transportation and Public Facilities (ADOT&PF) provides several means of assisting locally-owned port and harbor facilities. ADOT&PF partners with local communities and the U.S. Army Corps of Engineers for the planning, design, and construction of port and harbor facilities and channel navigation improvements, thereby maximizing the federal investment in Alaska‘s marine facilities. This program has allowed the construction of navigation improvement projects that have significant local investment, are economically justified, and are environmentally acceptable (Alaska Department of Transportation and Public Facilities 2008).
ADOT&PF also supports harbors through a Municipal Harbor Facility grant program established in 2006. Subject to an annual legislative appropriation, this harbor grant program matches local government funds, dollar for dollar, with state general funds up to a limit of $5 million, for municipal port and harbor rehabilitation and improvement projects (Alaska Department of Transportation and Public Facilities 2008). The grant program consists of two tiers. Harbor facilities that were transferred from the state to local ownership, especially those in need of major maintenance and repair, are given priority and a Tier I status. All other municipal harbor facility projects are considered Tier II projects. A harbor facility may only receive one Tier I grant, but may apply for multiple Tier II grants (Alaska Department of Transportation 2010).
Applications for funding from the Municipal Harbor Facility grant program are scored by committee. Within the annual funding limit, Tier I applications are given priority. Tier I applications receive funding, within the funding limit each year, in descending order of their score. Once adding a Tier I application would bring the total over the appropriated amount, no further Tier I applications are added and the Tier II applications are then added to the request, up to the program’s limit. No partial funding is allowed, so funding is all-or-nothing. Facilities eligible for Tier I status are not obligated to apply under that tier. Due to the ability to choose the tier under which to apply and the method by

Strategic Trends Analysis
76 Final
which projects are selected for funding, communities have developed strategies to try to obtain necessary funding.
A funding request, based on the selected applications, is submitted to the legislature. The legislature is not obligated to fund requests, and thus far financial support for the program has been inconsistent. As shown below in Table 19, the program was fully funded in 2008, but in 2009, no projects were funded (Lukshin 2010b).
Table 19. Municipal Harbor Facility Grant Funding History
Year Amount Request ($ millions) Amount Funded ($ millions)2007 9.2 5.02008 10.4 10.42009 12.9 0.02010 17.3 TBD
Source: Lukshin (2010b)
Applications to the Municipal Harbor Facility grant program are due approximately one year before the year in which funding is requested. For fiscal year 2012, applications are due by July 15, 2010, which is the start of the 2011 fiscal year (Lukshin 2010a).
ADOT&PF has several entities supporting port and harbor development (Taylor et al 2010). The Coastal Engineering section in Anchorage provides interdepartmental support for coastal transportation projects including roads, airports, dock and harbors, barge landings, and marine transportation. This support group also provides coastal engineering support to other state and federal agencies and local municipalities on issues such as coastal erosion108
The other primary entity within ADOT&PF is the Ports and Harbors program management function, located in Juneau. This includes administration of municipal grants, harbor transfers from state to municipal ownership, managing partnership agreements with municipalities and federal government, and overall management of existing state ports and harbors infrastructure.
, shore protection, and preliminary engineering and design of ports and harbors. The Coastal Engineers also act as liaisons and perform in-kind services for the state, coastal communities and other non-federal sponsors, on USACE projects.
Additionally, there is a marine design group in department’s Southeast Region that provides design support for the Alaska Marine Highway System, as well as port or inner harbor design work.
5.2.2.2 Alaska Department of Commerce, Community and Economic Development
The ADCCED’s Division of Community and Regional Affairs administers several state and federal grants that have potential to be used for port and harbor development. Community Development Block Grants are single-purpose project grants awarded to communities at a maximum of $850,000 per community. At least 51 percent of project beneficiaries must be low to moderate income persons as defined by the U.S. Department of Housing and Urban Development (Davis 2010; ADCCED 2010b). The Coastal Impact Assistance Program (CIAP) and the Alaska Coastal Management Program (ACMP) are potential sources of funding if the port or harbor project has environmental benefits or enhances the coastal zone within the guidelines of each program (Cox 2010; ADCCED 2010b). The
108 ADOT&PF is only involved with erosion along river banks or the coast where state facilities are impacted, or where others’ projects may adversely affect state facilities.

Strategic Trends Analysis
Final 77
planning and design of a harbor or dock for oil spill response vessels intended to protect coastal areas from damage caused by offshore petroleum development emergencies would be an example of an eligible project under the CIAP program (Cox 2010). Eligible projects under the ACMP are determined by the individual coastal management plans of each community and would generally be awarded for the enhancement or protection of the coastal zone.
5.2.2.3 Legislative Appropriations
Alaskan communities and organizations may receive direct sponsorship for projects by appealing directly to the state legislature. Legislative grants, once awarded and approved by the Governor, are administered by ADCCED (ADCCED 2010b). As discussed in section 3.1.4, legislative funds from the collection of cruise vessel passenger taxes are available specifically for cruise vessel related projects. In the past, legislative appropriations have been used to support the ongoing expansion project at the Port of Anchorage.
5.2.2.4 The Alaska Industrial Development and Export Authority
As shown in Section 3.1, the Alaska Industrial Development and Export Authority (AIDEA) has played a prominent role in the financing of various port facilities in Alaska, particularly those supporting the state’s mining industry. The mission of the public corporation is to promote, develop, and advance economic growth and diversification in Alaska by providing various means of financing and investment. AIDEA has assisted Alaska business through its ability to develop, own, and operate basic installations and facilities within the state, with the purpose of advancing the prosperity of a region (Alaska Industrial Development and Export Authority undated).
AIDEA can provide funding for port and harbor facilities. AIDEA does not provide grants; instead, they finance programs considered commercially viable and able to produce revenues to cover costs (AIDEA 2010a). The public corporation administers three relevant credit programs: the Loan Participation, Development Finance, and Conduit Revenue Bond Programs.
AIDEA’s Loan Participation program provides permanent financing to borrowers for the purpose of developing, acquiring, or enhancing Alaska business enterprises. AIDEA does not originate loans, but instead purchases up to 90 percent of a commercial loan (up to a maximum of $20 million) on which it is able to extend the loan term, giving the borrower the benefit of lower scheduled payments (AIDEA 2010b). In 2008, the loan participation program provided assistance to the Ketchikan Dock Company by financing 90 percent of a $13 million business loan to build the infrastructure required to host world class cruise vessels.
AIDEA also aids in the development, ownership, and operation of projects within Alaska through the Development Finance program. Ports, roads, and other infrastructure and facilities are eligible for this program if they are economically advantageous to the state and public welfare, contribute to economic growth, and are economically and financially able to produce revenue to repay the amount financed (AIDEA 2010b). AIDEA financed the Delong Mountain Regional Transportation System (DMTS), which connects the Red Dog mine to its port site on the Chukchi Sea, with this program. AIDEA has invested more than $250 million in DMTS, making the development of the mine possible (AIDEA 2010b).
A third program resource for port and harbor development funding is the AIDEA Conduit Revenue Bond Program, which assists businesses or nonprofit corporations in issuing tax-exempt and taxable revenue bonds to obtain project financing. In this program, AIDEA assets and credit are not at risk, and the underwriting and placement of the bonds are based on the creditworthiness of the project and borrower strength (AIDEA 2010b). Though the conduit bond program has not yet been used for

Strategic Trends Analysis
78 Final
port or harbor development projects, it is a resource that can be considered going forward (Walker 2010).
Outside of these programs, other financing arrangements have been made in the past. As mentioned in Section 3.1.3, the Ballyhoo dock in Unalaska, Alaska was partially financed through AIDEA bonds. Bond issuance and debt financing are discussed further in section 5.2.3.2.
5.2.3 Local
Local resources for funding port and harbor developments are heavily dependent upon the financial sustainability of the project at hand. As discussed below, lenders are concerned with the viability of their investments. Credit ratings, revenue streams, and evidence of sustainability are helpful in securing local funding.
5.2.3.1 Port Revenues
Ports and harbors may finance their own projects using income generated through operations, either using the proceeds directly or using them to cover debt service costs or provide a local match to other funding sources. Port revenues are generated through usage charges for space and facilities in the form of dockage, wharfage, passenger fees, equipment rental, storage, etc. When a port levies charges sufficient to cover operating costs and depreciation, it has the capacity to pay for the necessary maintenance and the eventual capital replacement of its facilities.
Many port facilities around the state are subsidized with local revenue and other funding sources. The investment climate has been changing over the past several years and many lenders now require a plan demonstrating sustainability. For many communities, this has led to often sizeable rate increases at their harbor facilities.
Although port revenues can be used to support the capital and operating costs of improvements, revenues are often leveraged to cover a greater amount of the capital costs of improvements. The use of debt for port and harbor projects is discussed next.
5.2.3.2 Debt Financing
Debt financing is used to cover some or all of a project’s cost. Debt financing can be used to generate matching funds, making a project eligible for specific funding programs or demonstrating a community’s commitment to a project. Some funding agencies view the assumption of debt as a demonstration of commitment to a project, which can in turn improve grant application scores (ADCCED 2010c). Two basic forms of bonds are available for Port and Harbor projects at the local level, general obligation and revenue bonds.
General obligation (GO) bonds are issued by a state or local government and are intended for capital improvement projects (ADCCED 2010c). They are secured by the taxing and borrowing power of the issuing jurisdiction, rather than the revenue from a given project. Revenue bonds are issued by a state or local government to finance projects that can generate revenue to repay the debt (ADCCED 2010c). Revenue bonds are secured by the revenues of a given project. While revenue bonds are commonly used for utility projects, for which the user rates are set to cover costs, they are rarely used in Alaska for port and harbor projects due to the prevalence of subsidies. Elsewhere in the United States, revenue bonds are more commonly used for port and harbor projects.
Alaska Municipal Bond Bank Authority (AMBBA) is a public corporation that assists local governments with the financing of capital projects through the issuance of both GO and revenue bonds. AMBBA

Strategic Trends Analysis
Final 79
provides several advantages: it pools bonds to harness economies of scale, contracts for professional services at rates that would be prohibitively expensive for individual borrowers, and offers many borrowers better rates than they would otherwise have access to (AMBBA 2009). The AMBBA has an A rating from Moody’s and Standard & Poor’s, allowing it to borrow money at lower rates than many Alaskan communities. The bond bank effectively acts as an intermediary between the borrower and the financial markets, as it sells its bonds on the national market and utilizes the proceeds of its sales to purchase the bonds of Alaskan municipalities (Alaska Department of Revenue 2010). The issuance of revenue bonds may not exceed $75 million per year unless the legislature authorizes a higher amount and, in any given year, the bond bank is restricted to no more than $750 million of bonds or notes outstanding.
As discussed above, bonds are typically the only form of debt used to fund public port projects (Byrne, Sipsas, and Thompson 1996). In addition to the issuance of bonds, prospective port projects can also be financed with commercial loans. However, this is generally done through a state-level lending program (similar to a loan through AIDEA), a special lending arrangement (such as a pension program investing in a specific port project), or through a public-private partnership (in which the private party could get a loan) (AAPA 2009b). Most other examples of lending activity directly to a government entity are in other countries.
5.2.4 Public-Private Partnerships
Funding for marine infrastructure projects cannot come from the government alone. In a time of tight federal, state, and local government budgets for the foreseeable future, improved and innovative private financing methods are an absolute necessity. Public-private partnerships are increasingly viewed as a major component of funding and developing a seamless, reliable, and cost-effective twenty-first century transportation system (MARAD 2007). As discussed in Section 2.1.2, some of these partnerships are also involved in the actual management of these assets, such as terminals.
A traditional public-private funding mechanism for port infrastructure improvements has been the use of a combination of port cash and cash from a port user, such as a warehouse operator, who agrees to lease or buy a facility if the port builds it. More recently, ports have begun looking at joint venture financing, in which port tenants assume most of the debt of major capital expense of a project. In the case of the Jacksonville (Florida) Port Authority's TraPac marine terminal completed at the end of 2008, the port provided the land and $20 million for initial property development, which was offset by grants, including a $5 million Florida Department of Transportation grant to help pay for roads. The terminal operator, Mitsui OSK Lines, assumed the balance of the approximately $305 million project debt, including proceeds from bonds and a State Infrastructure Bank loan to pay for property development and cranes (American Association of Port Authorities 2009).
The newest type of infrastructure funding that has emerged is third-party financing, in which an entity invests large sums in project design and construction, but may not actually operate the facility. In this financing model, the port may start by working with a financial advisor to determine if a viable entity exists to underwrite a desired project or program. Investors in this model may run the gamut from a terminal operator that would take over and invest in an existing port-owned facility, to one or more investment groups, such as the Ontario Teachers’ Pension Plan, that believe there is enough potential return in a port project or facility that they are willing to invest in it. Jacksonville Port Authority's

Strategic Trends Analysis
80 Final
concept for a new, high-capacity intermodal container yard may be financed using this type of third-party, public-private partnership (American Association of Port Authorities 2009).109
There are many different types of public-private partnerships. The U.S. General Accounting Office (1999) defines the following varieties of partnerships:
Build-Own-Operate (BOO): Under a BOO transaction, the contractor constructs and operates a facility without transferring ownership to the public sector. Legal title to the facility remains in the private sector, and there is no obligation for the public sector to purchase the facility or take title. A BOO transaction may qualify for tax-exempt status as a service contract if all Internal Revenue Code requirements are satisfied.
Build/Operate/Transfer (BOT) or Build/Transfer/Operate (BTO): Under the BOT option, the private partner builds a facility to the specifications agreed to by the public agency, operates the facility for a specified time period under a contract or franchise agreement with the agency, and then transfers the facility to the agency at the end of the specified period of time. In most cases, the private partner will also provide some, or all, of the financing for the facility, so the length of the contract or franchise must be sufficient to enable the private partner to realize a reasonable return on its investment through user charges. At the end of the franchise period, the public partner can assume operating responsibility for the facility, contract the operations to the original franchise holder, or award a new contract or franchise to a new private partner. The BTO model is similar to the BOT model except that the transfer to the public owner takes place at the time that construction is completed, rather than at the end of the franchise period.
Buy-Build Operate (BBO): A BBO transaction is a form of asset sale that includes a rehabilitation or expansion of an existing facility. The government sells the asset to the private sector entity, which then makes the improvements necessary to operate the facility in a profitable manner.
Design-Build-Operate (DBO): In a DBO project, a single contract is awarded for the design, construction, and operation of a capital improvement. Title to the facility remains with the public sector unless the project is a design/build/operate/transfer or design/build/own/operate project. The DBO method of contracting is contrary to the separated and sequential approach ordinarily used in the United States by both the public and private sectors. This method involves one contract for design with an architect or engineer, followed by a different contract with a builder for project construction, followed by the owner’s taking over the project and operating it. A simple design-build approach creates a single point of responsibility for design and construction and can speed project completion by facilitating the overlap of the design and construction phases of the project. On a public project, the operations phase is normally handled by the public sector or awarded to the private sector under a separate operations and maintenance agreement. Combining all three phases into a DBO approach maintains the continuity of private sector involvement and can facilitate private-sector financing of public projects supported by user fees generated during the operations phase.
Lease/Develop/Operate (LDO) or Build/Develop/Operate (BDO): Under these partnership arrangements, the private party leases or buys an existing facility from a public agency; invests its own capital to renovate, modernize, and/or expand the facility; and then operates it under
109 In 2006, the Ontario Teachers’ Pension Plan bought two marine container terminal leases in the Port of New York as well as two box terminals in Vancouver, British Columbia, from Orient Overseas (International) Ltd. (U.S. Maritime Administration 2010).

Strategic Trends Analysis
Final 81
a contract with the public agency. A number of different types of municipal transit facilities have been leased and developed under LDO and BDO arrangements.
5.3 Port Governance and Investment in Other States, Provinces, and
Countries
Over the last twenty years there has been a trend toward the commercialization and privatization of ports and port services. It has been widely accepted that free market incentives encourage port operators and service providers to implement a more efficient and self-sustaining business model. Increased private sector involvement is associated with improved external trade competitiveness through more cost-effective port operations and services, reduced port costs, lower prices for consumer goods, and a reduction in the national financial burden, among others (World Bank 2007). In contrast, centralized government-run models have been criticized for being costly to operate and slow to respond to market demands.
Proponents of a more centralized system remind us that private sector priorities do not always agree with those of the general public. For example, port facilities may only realize full cost recovery in the long term, and private sector ownership may mistakenly sacrifice long-term benefits for short-term profits. In addition, it has been argued that ports are developed hand-in-hand with capital infrastructure; their operation and development have implications that extend into the public realm and should therefore be kept under the control of public port authorities (Industry Commission 1993 as cited in Everett and Robinson 2007).
Despite this argument, many ports under federal control systems have been reformed, resulting in a stronger market orientation. Though the influence and regulation of the federal government persists, much of the decision-making and policy control has been decentralized. The following sections describe some of the forms in which port reform has materialized.
5.3.1 Governance Models
The entity that governs, manages, and/or administers most modern-day ports is referred to as a port authority. Port authorities are usually public entities, under federal, state, or local control. Depending on the role the private sector plays at a port, the port authority may or may not oversee the daily operations of the port.
Port governance models vary in design and functionality. Few ports are exactly the same, each having developed for particular needs and circumstances. To facilitate discussion of port governance models, the World Bank has aggregated ports into four basic categories: service ports, tool ports, landlord ports, and fully privatized ports (The World Bank 2007).
Service ports resemble the structure of many ports before they underwent reform in the 1980s and 1990s. They are the public port example; they own and operate the land and all of the available assets of the port. The port authority is likely part of a federal entity, such as a ministry, and retains responsibility for the simultaneous oversight, development, and operations of the port (The World Bank 2007). Tool ports are similar to service ports, but allow for the operation of private cargo-handling firms onboard vessels, on the wharf, and on the apron. In this system, the private cargo-handling firm is reliant upon the port equipment and port equipment operators to move their cargo. Private firms have been frustrated at the lack of control tool ports offer; the split operational responsibilities have the potential to create conflict (The World Bank 2007).
Strategic Trends Analysis
82 Final
The landlord port model is the most common public-private port relationship. As the name implies, the port authority retains ownership of the port land and leases infrastructure to private operators. The private operators are responsible for their own equipment and labor, resulting in increased efficiency and responsiveness (The World Bank 2007; Brooks and Cullinane 2007).
Fully privatized ports operate under the total control of the private sector. Port land is transferred to private ownership and the state no longer retains interest in the port sector. In some cases, such as in the UK, regulatory functions are also transitioned to the private sector. Though this model affords agility and market adherence, it also diminishes public influence and limits the implementation of long term economic development policy (The World Bank 2007; Brooks and Cullinane 2007).
5.3.2 Country Case Studies
The governance model of a port is very much a reflection of the relationship between the public and private sectors of the area in which the port is located. Port policy is influenced by political and economic dynamics; accordingly, it varies from state to state, and nation to nation.
As mentioned previously, ports have trended away from centralized control and toward privatization and commercialization. Though few have made the transition to a fully privatized system, there are distinctly varying degrees of privatization that have been implemented. In the following subsections we present country case studies that describe the evolution and status of port models in various parts of the world.
5.3.2.1 United States
The trend of port governance in the United States runs somewhat contrary to other countries’ experience. U.S. ports have an established history of private sector ownership and operation; they have never been controlled by a federal port authority. Over the last century, however, private ownership has evolved into a mix of public and private control, layered with federal regulation. This transition, and the contemporary roles of the public and private sectors that resulted, are described in general terms below.
In accordance with the capitalist American tradition, many of today’s ports and harbors were initially developed by private entities (Fawcett 2007; Sherman 2008). The original construction and operation of the ports were undertaken by private businesses that recognized the value of American gateways for imports and exports. In the 1800s, states frequently allocated dry port land to private railroad companies for the purpose of port development. At the time, the railroad industry had both the capital and incentive to undertake such projects; ports were a valuable part of their larger intermodal network (Fawcett 2007).
Over time, the priorities of the private sector began to conflict with public interest. Monopolistic control over cargo movement and a lack of concern for pollution and congestion at port sites led to public discontent (Hershman 1988 as cited in Fawcett 2007). The public port entity was created in reaction to these concerns, and communities began transitioning harbor ownership from the private to the public sector (Fawcett 2007; Sherman 2008).
As described by Fawcett (2007), “the port is responsible for facilitating economic development via private enterprise but is also often a public agency responsible for its actions as it manages the port in the public interest.” In the U.S., a variety of governance structures have developed to fill this role. Hawaii, Maryland, and Virginia have port organizations that operate within their state transportation departments. Others, such as the ports of Long Beach and Oakland, are run by municipal port departments (Sherman 2008). The Port Authority of New York and New Jersey was the nation’s first

Strategic Trends Analysis
Final 83
bi-state agency (established in 1921), and today the two states continue to jointly operate their ports through the semi-autonomous, self-sustaining public body (Sherman 2008; The Port Authority of New York & New Jersey 2010).
The governance structure of contemporary U.S. ports is notably varied by location; however, it can be said that most major U.S. ports are under a mix of public and private control (Fawcett 2007). A common relationship between the public and private sectors is one of landlord-and-tenant. As described above, in this scenario the state or municipality owns the land on which the port is located and leases the ports, docks, and/or terminals to private entities for operation. In some cases, the public entity owns and operates the port, managing the day-to-day activities of its own terminals. This is less common than the landlord-tenant relationship (Fawcett 2007).
In Alaska, port authorities are authorized under Title 29 of the Alaska Statues (AS), which covers the powers of municipalities. AS 29.35.600 states, “the purpose of a port authority is to provide for the development of a port or ports for transportation related commerce within the territory of the authority.” A port authority may be created by ordinance. Once established, an authority must have a board of directors and a Chief Executive Officer appointed by the board. Details about the number of seats, qualifications, and term lengths are determined through the ordinance used to create the Port Authority.
Municipalities with a port authority can specify a set of powers, boundaries, and limitations of the authority. However, creation of the board under AS 29.35.680 can create an operational burden on the municipality because of the additional administrative layer. Further, while the authority would have the ability to regulate land use within its boundaries under AS 29.35.620(15), it appears the authority would be prohibited from levying a property tax under the limitation imposed by AS 29.35.665.
Federal control over U.S. ports is exercised through agency regulation. The USCG, U.S. Department of Homeland Security, Transportation Security Agency, Federal Emergency Management Agency, and Citizenship and Immigration Service all oversee aspects of U.S. port operations (Fawcett 2007). The federal government also retains jurisdiction over the nation’s navigable waters. Though federal policies and oversight may influence a port, the federal government cannot appoint or dismiss port commissioners, staff members of the port, or alter port authority charters (Sherman 2008). Control over the U.S. port system remains in the hands of state and local governments.
5.3.2.2 Canada
The Canadian port system has undergone a gradual transition away from a centralized structure to one in which individual ports are able to cater to the local market. From the 1930s through the 1980s, Canadian ports were controlled by one of three types of entities: National Harbors Boards, local harbor commissions, or Transport Canada.110
Canada’s approach to decentralizing its ports came in stages. In the 1980s, the Canada Ports Corporation Act facilitated the transition of National Harbors Boards to Local Port Corporations. The
The National Harbors Board ports were the most economically significant and handled about half of all of Canada’s seaborne trade by the 1980s; they functioned as centrally controlled entities for which the board decided policy and applied a standard set of port charges nationwide (Brooks 2007). This centralized approach proved impractical as it prevented ports from meeting local needs and in the 1990s Canada adopted principles of deregulation and commercialization in an effort to make their transportation sector economically competitive (Brooks 2007).
110 Transport Canada is the national body responsible for transportation policies and programs in Canada.

Strategic Trends Analysis
84 Final
corporations resembled publicly-owned companies in that they were run by a Board of Directors who appointed a Chief Executive Officer. However, unlike companies, the corporations were not in control of their own finances. Budgets remained subject to federal approval and capital financing decisions were subject to broader political concerns (Brooks 2007).
In 1995, a second set of reforms came in the form of a new marine policy, and the government passed legislation (as part of the Canada Marine Act) which remodeled the Canadian port structure (ACPA 2010). The legislation was intended to shift the financial burden of port operation from the taxpayer to the user, while also ensuring affordable and effective transportation services through the encouragement of fair competition (Brooks 2007). Under this structure, ports fell into three new classifications: national port system ports, regional/local ports, and remote ports (Westac 1999).
National port system ports are those considered vital to domestic and international trade (Westac 1999). There are currently 19 Canada Port Authorities (CPAs), which are federally run commercial entities collectively known as the National Ports System (Transport Canada 2010). As part of their advanced corporate-like structure, CPAs were given increased freedom in setting tariffs and fees, as well as room to develop contracts and leases regarding port operation.
At their inception, CPAs could not access government funding or guaranteed loans. They were required to support themselves with revenues from their own operation and were expected to pay stipends to the government in return for the past investments made by taxpayers in ports infrastructure (Leroux 2009; Westac 1999). Though the self-sufficiency and stipend requirements remain, in 2008 the Canadian government amended the Canada Marine Act to allow Port Authorities access to federal funding for infrastructure, security, and environmental projects (Leroux 2009).
The other two types of ports, regional/local and remote, were treated differently. Most regional/local ports have been transferred to local interests through the Port Divestiture Program (Transport Canada 2010). The program allows local entities (federal departments, provincial governments, community organizations, etc.) to assume ownership and operation of the ports under the expectation that they will be managed more efficiently and with greater sensitivity to local needs (Transport Canada 2010; Westac 1999). If no local stakeholders are interested, a public tender may be used. New owners have access to a Port Divestiture fund that provides funding assistance for operations or to bring port property to minimum safety and operating standards (Transport Canada 2010). Remote ports are those that service isolated communities, meeting their basic transportation needs. These continue to be run by the federal government, though local groups can acquire them if the interest exists (Transport Canada 2010; Westac 1999).
In line with U.S. ports, most Canadian ports have a landlord-tenant relationship with private sector port operators. The day-to-day port operations and cargo handling are leased out to specific terminal operators or shippers, who often supply the buildings and equipment necessary for operations.
As part of the 2008 Canada Marine Act modification easing the restrictions on access to federal funding, Canadian ports are creating new opportunities to combine public and private financial resources to fund port projects. For example, the port of Prince Rupert is working to expand its container terminal to accommodate larger amounts of Asia-Canadian cargo traffic. Project participants include the Prince Rupert Port Authority, Maher Terminals, the Canadian National Rail, the Canadian federal government, and the province of British Columbia (Hearn and Murphy 2008).
5.3.2.3 China
China’s macroeconomic shift away from central government planning and toward market oriented principles has been echoed in its port policy (Cullinane and Wang 2007). China’s ports are vital links to the global economy; they allow for imports of raw materials and technology while also allowing for

Strategic Trends Analysis
Final 85
exports of Chinese steel, textiles, and other manufactures. As the Chinese government strengthens ties with foreign markets and investors, the importance of an adequate and efficient port system increases. To meet these needs the government has turned to local governments and foreign investment.
The Chinese port governance system developed from centralized control and vertical integration (Wang 2004; Cullinane and Wang 2007). Even after the implementation of the economic reforms and “open door” policies of the late 1970s, Chinese ports continued to be run by the Ministry of Communications, which controlled all port planning, policies, and activities. Though this allowed for standardization and national coordination, it did little to improve operations or management at the local level. In addition, allocations for port funding from the central government proved insufficient, resulting in inadequate infrastructure and equipment, which lead to cargo congestion (Cullinane and Wang 2007).
In the mid 1980s the Chinese government responded to these issues by decentralizing the management of its ports, expanding the resources for port funding, and encouraging foreign investment. Most large ports were put under the joint control of central and local governments while some smaller ports were put under the control of local governments only. Local governments, commercial banks, and foreign investors were added to the list of port funding sources. Though foreign ownership of any Chinese port was restricted to 49 percent, foreign investment in China’s port sector was considerable (Cullinane and Wang 2007).
China’s port system was further reformed in 2004, when the Port Law and Rules on Port Operation and Management came into effect (Wang 2004; Cullinane and Wang 2007). These regulations pushed for further decentralization and mandated that the Chinese central government relinquish ownership of all ports. The Port Law removed the 49 percent restriction on foreign ownership and allowed any foreign or Chinese qualified party to apply for investment in port construction and/or operations (Cullinane and Wang 2007). In addition, to address concerns of port authorities both regulating and participating in the market, ports operated by local port authorities were separated into two entities, a Port Administration Bureau and a port business enterprise (Cullinane and Wang 2007).
Today China’s cargo volumes are surging with the recovery in international trade, and strong growth is forecasted for the remainder of 2010. China continues to reach out for foreign firms to promote economic growth through port investments. Chang Dechuan, chairman of the board of Qingdao Port Group, recently commented on a joint venture agreement to construct a new container terminal in Qingdao. He stated, “The shortcut for succeeding in the competition among the international ports is to join hands with global shipping powerhouses” (Chuanjiang and Yan 2009). Partners on the project include China Merchants Group, the Qingdao Port Group, COSCO Pacific, and A.P. Moller Maersk, among others (Chuanjiang and Yan 2009).
5.3.2.4 Australia
The Australian experience of the 1990s – 2000s has been one of corporatization and privatization.111
111 Privatization is defined as the transfer of public assets to the private sector. Corporatization is defined as the formation of a government-owned corporation. Corporatization indicates a reduction of public presence, a transition toward market-oriented policies and, in some cases, the transfer of commercial operations to the private sector (Everett and Robinson 2007).
The reduction of the public role in port operations came as a reaction to perceived inefficiencies noted during the 1980s, when Australian ports functioned as statutory authorities under the jurisdiction of state governments. In the 1990s, Australia began a period of microeconomic restructuring as part of a national effort to improve economic performance. A National Competition Policy was adopted, which placed emphasis on productivity at the firm and industry level; market-

Strategic Trends Analysis
86 Final
oriented reforms were implemented which included a strong push for deregulation in transportation and other industries (National Competition Council 2010; Everett and Robinson 2007).
The Australian port reforms resulted in the corporatization of most of the ports in Queensland, the Northern Territory, Tasmania, Western Australia, and New South Wales, as well as the privatization of ports in South Australia (Queensland 2010a; Everett and Robinson 2007). Some of the ports in Victoria were corporatized, while others were privatized (Everett and Robinson 2007). Port reforms continue as initial corporation structures are modified and changed as needs arise (Queensland 2010b; Port of Melbourne 2010).
The structure and policies of port corporations in Australia vary by state and port, but most seem to blend private sector needs with public oversight. Queensland ports, for example, are owned by the government through a shareholding agreement between ministries. In 2009 the Queensland Government formed a five port structure (each its own corporation) to oversee the administration and management of the ports. Each port authority (corporation) has a board of directors and operates as a commercial entity (Queensland 2010b).
In Victoria, as mentioned above, some ports were corporatized while others were privatized. The Port of Melbourne is a corporation that owns all of the land within the port boundaries, and leases the port channels from the Government of Victoria. Private sector companies provide loading/unloading services, container stevedoring services, rail services, and pilotage, while the Port of Melbourne is responsible for land, roadways, utility services, navigation aids, safety and environmental supervision, etc. (Port of Melbourne 2010b). In contrast, the Victorian Port of Geelong is owned by two private-sector companies, GeelongPort and GrainCorp. They manage the port’s land assets, which include 14 commercial shipping berths, and have a strategic partnership with Patrick Stevedoring as part of an effort to market a “seamless, cost-effective supply chain” to its clients (GeelongPort 2010).
The impacts that corporatization and privatization have had on Australian ports are difficult to measure given the broad nature of the Australian reforms. Industries and services that influence port performance were overhauled at the same time that the ports were undergoing corporatization and privatization, making it difficult to see which change produced which result (Everett and Robinson 2007). In general, there is agreement that the market-oriented reforms have increased efficiency and productivity. However, complaints of government influence persisting and hindering the flexibility needed by the commercial sector continue (Everett and Robinson 2007). This conclusion is supported by the Council of Australian Government’s push for further competition and regulatory reform for ports and other infrastructure sectors (Central Queensland Ports Authority 2007).
5.4 Port and Harbor Investment Needs in Alaska
This paper has discussed strategic trends affecting Alaska’s maritime industries and infrastructure. This section highlights some of the broader categories of port and harbor investment that may be needed in the future to address these trends.
5.4.1 Facility Maintenance
While improvements in oil tanker safety and navigation have been realized in recent years through the use of funds from the Exxon Valdez settlement, the majority of Alaska‘s public ports and harbors have steadily deteriorated due to lack of funding for upkeep and improvement (Alaska Department of Transportation and Public Facilities 2008). Moreover, as discussed in Section 3.2, shoreside receiving facilities for barge operations are primitive or entirely absent in many rural Alaska communities. Inadequate or poorly maintained port or harbor facilities limit delivery capacities and increase the risk

Strategic Trends Analysis
Final 87
to the carrier, resulting in higher shipping fees and delivery via alternate, more expensive modes. The result is an increased cost of goods for Alaskans (Alaska Department of Transportation and Public Facilities 2008).
5.4.2 Northwest and Northern Alaska Port Infrastructure
The Arctic Council and PAME (2009) note navigational hazards in the proposed Arctic shipping routes. The absence of major Arctic ports, except for those in northern Norway and northwest Russia, and other critical infrastructure are significant limitations, as is the lack of hydrographic data on these routes. Northwest and northern Alaska need port infrastructure to support shipping and carry out emergency response and search and rescue activities. Ports of refuge are also needed so that vessels have a safe place to wait out storms, handle emergencies, and wait for assistance.
5.4.3 Dredging
Dredging is needed on a regular basis to maintain access to many ports in Alaska. River ports have issues with deposition of sediment along their facilities, and in some cases the deposited material can be the result of erosion of barge landings and other improvements upstream. Glacier-fed rivers also contribute a great deal of sediment that ports must dredge.
Reasons often cited for the need to dredge include:
� Additional demand at the port that cannot be served due to shallow water along dock faces
� Access to existing facilities that is impeded by shallow water or build-up of sediment
� Increased vessel sizes that require deeper water or a larger space for maneuvering or docking
Two examples of the effect of sediment on port activities are seen with the Port of Anchorage and Port of Dutch Harbor. At the Port of Anchorage, regular dredging is required to maintain the approach up Cook Inlet to access port facilities. At the Port of Dutch Harbor, containerships often have to operate at weights below their full capacity to access port facilities. As shipping companies employ larger containerships in the future, the need for dredging will increase.
5.4.4 Facility Expansion
A common improvement project for ports is to expand or reconfigure their infrastructure to address market needs. As demand increases, facilities may become inadequate and unable to accommodate users in a timely manner. This can lead to increased waiting times or encourage potentially dangerous practices such as rafting of large vessels. Alternatively, while the number of vessels using port facilities may remain steady over time, design changes may lead to a suboptimal use of port facilities. As vessels become wider, for instance, individual stalls may be sufficiently long to accommodate vessels but lack the width and maneuvering space for safe moorage. As market needs change, expansions and reconfigurations will continue to be a major category of improvement. These factors point to the need for modular design, portability, and interchangeability between marine facilities in rural Alaska.
Expansion plans should be tempered, however, with a realistic assessment of infrastructure needs in each region. Some regions have experienced a major build-up in moorage and dock space due to each community expanding according to its local demand. However, when this is done in the absence of consideration for other ports and potential rationalization of local fishing fleets, it can lead to an excess supply of maritime infrastructure, making each community susceptible to downturns in demand and raising the question of what communities should do with their excess capacity and what this means in terms of the revenues needed to maintain their facilities. The availability of port and

Strategic Trends Analysis
88 Final
harbor infrastructure in a region must be considered when evaluating future development, though it should not take away from communities that have legitimate needs.
For example, many harbors and some public port facilities in Southwest Alaska have struggled with lower utilization due to new facilities being brought online and rationalization of major fisheries. The Spit Dock at Dutch Harbor, Crowley’s dock in Captain’s Bay, the Unalaska Marine Center, and King Cove’s harbor facilities are some of the major facilities facing lower utilization. Once the Carl E. Moses harbor in Unalaska and the harbors in False Pass and Akutan are completed, utilization rates will likely drop further. With many of the fisheries rationalized, there are fewer vessels fishing and lower demand for dock space for unloading or moorage outside of the fishing seasons. This low utilization has raised questions about what communities should do with their excess capacity and how they can raise the revenues needed to maintain their facilities. One potential scenario that could alter this trend is the continuing purchase of Seattle-based groundfish and crab vessels by CDQ groups which could transfer the vessels to Alaska and increase employment opportunities for their residents.

Strategic Trends Analysis
Final 89
6 References
AIRA Risk Analysis Team. Aleutian Islands Risk Assessment. Phase A - Preliminary Risk Assessment Aleutian Islands Alaska. Prepared for National Fish and Wildlife Foundation. January 2010.
Aker Arctic Technology, Inc. Arctic Shuttle Container Link from Alaska, US to Europe. March 2006.
Alaska Department of Commerce, Community and Economic Development (ADCCED). Strategic Economic Concepts for the Alaska Fishing & Seafood Industry. November 2002.
Alaska Department of Commerce, Community and Economic Development. Alaska Rural Visitor Industry Product Development Project: Final Report. June 2007.
Alaska Department of Commerce, Community and Economic Development. Alaska Economic Performance Report 2007. September 2008.
Alaska Department of Commerce, Community and Economic Development. Community Database Online. Available at http://www.commerce.state.ak.us/dca/commdb/CF_COMDB.htm. March 2010.
Alaska Department of Commerce, Community and Economic Development, Division of Community and Regional Affairs. Grants Section webpage. Available at http://www.commerce.state.ak.us/ dca/grt/grantsMenu.cfm. Accessed April 19, 2010b.
Alaska Department of Commerce, Community and Economic Development. Financial Management: Debt and Investments. Available at http://www.commerce.state.ak.us/dca/LOGON/finmgt/ finmgt-debt.htm. Accessed April 14, 2010c.
Alaska Department of Commerce, Community and Economic Development. Community Development Quota Program (CDQ). Available at http://www.commerce.state.ak.us/bsc/ CDQ/cdq.htm. Accessed September 3, 2010d.
Alaska Department of Commerce, Community and Econoic Development. Community Quota Entity Program (CQE). Available at http://www.commerce.state.ak.us/bsc/CDQ/cqe/ communities_cqe.htm. Accessed September 3, 2010e.
Alaska Department of Law. Cruise ship passenger data (by port) supplied at the request of Northern Economics, Inc. January 8, 2010.
Alaska Department of Revenue, Treasury Division. Alaska Municipal Bond Bank Authority. Available at http://www.revenue.state.ak.us/treasury/programs/programs/index.aspx?60000. Accessed April 14, 2010.
Alaska Department of Transportation and Public Facilities (ADOT&PF). Let’s Get Moving 2030. Available at http://dot.alaska.gov/stwdplng/areaplans/lrtpp/SWLRTPHome.shtml. February 2008.
Alaska Department of Transportation and Public Facilities. Ports and Harbors: Municipal Harbor Facility Grant. Available at http://www.dot.state.ak.us/stwddes/desports/harbor_grant.shtml. Accessed April 13, 2010.
Alaska Electric Light and Power Company. Shore Power = Cleaner Air: AEL&P powers docked Princess Cruise Liners. Available at http://www.aelp.com/princess.htm. 2006.
Alaska Industrial Development and Export Authority. 1985-2008. 23 Years of AIDEA Support for Alaska's Mining Industry. Available at http://www.aidea.org/PDF%20files/ AIDEA2008mining23yearsofsupport.pdf. Undated.
Strategic Trends Analysis
90 Final
Alaska Industrial Development and Export Authority. Annual Report, 2009. Available at http://www.aidea.org/PDF%20files/2009AIDEAAnnualReport.pdf. Accessed April 13, 2010b.
Alaska Industrial Development and Export Authority. DeLong Mountain Transportation System Red Dog Road and Port. Available at http://www.aidea.org/PDF%20files/DMTSFactSheet.pdf. April 2010.
Alaska Industrial Development and Export Authority. Project Fact Sheet: Delong Mountain Terminal (DMT) Port Federal Feasibility Study of Direct Loading Facility. Available at http://www.aidea.org/PDF%20files/DMTFeasibilityFactSheet.pdf. November 2009.
Alaska Industrial Development and Export Authority. Skagway Ore Terminal. Information Sheet. Available at http://www.aidea.org/PDF%20files/Skagway_Ore_Terminal_Info_Sheet_ %20April_2008.pdf. April 2008.
Alaska Municipal Bond Bank Authority (AMBBA). 2009 Annual Report. Available at http://www.revenue.state.ak.us/treasury/programs/documentviewer/viewer.aspx?463. Accessed April 14, 2010.
Alaska Natives Commission. Alaska Natives Commission, Final Report. Available at http://www.alaskool.org/resources/anc_reports.htm. May 1994.
Alaska Oceans Program. Shipping Safety Partnership (SSP). Available at http://www.alaskaoceans.net/ sao/ssp.htm. 2005.
Alaska Railroad Corporation. "Seward Docks and Intermodal Facility." Project Facts. January 2007a.
Alaska Railroad Corporation. "Whittier Master Plan." Project Facts. January 2007b.
Alaska Railroad Corporation. “Seward Coal Loading Facility.” Facility Facts. February 2010.
Alaska Seafood Marketing Institute. Handle With Care: The Alaska Shipper's Guide To Seafood Quality. Available at http://www.alaskaseafood.org/industry/qc/pages/pub-hwcs.html. Undated.
Alaska University Transportation Center. Alaska Marine Highway System Analysis - Phase 1 - Establishment of System Baseline. Prepared for Alaska Department of Transportation, Office of the Commissioner. Available at http://www.alaska.edu/uaf/cem/ine/autc/reports_docs/ AMHS_Systems_Analysis_-Phase_I_Report.pdf. September 2008.
Alyeska Pipeline Service Company. Pipeline Facts. Available at http://www.alyeska-pipe.com/Pipelinefacts/Throughput.html. 2010.
American Association of Port Authorities (AAPA). Glossary of Maritime Terms. Available at http://www.aapa-ports.org/industry/content.cfm?itemnumber=1077&navitemnumber=545. 2009a.
American Association of Port Authorities. Infrastructure Improvements: Public/Private Partnerships. Available at http://aapa-ports.org/Industry/content.cfm?ItemNumber=1025. 2009b.
Anchorage Port Expansion Team. Marine Terminal Redevelopment Project Environmental Assessment. 2005.
APM Terminals. Europe Report. Client Newsletter. Available at http://www.apmterminals.com/uploadedFiles/corporate/Media_Center/091201_APMT_newsletter_All_Audiences%5B1%5D.pdf. Fall 2009.

Strategic Trends Analysis
Final 91
Arctic Council and PAME. Arctic Marine Shipping Assessment 2009 Report. Available at http://pame.arcticportal.org/images/stories/PDF_Files/AMSA_2009_Report_2nd_print.pdf. 2009.
Associated Press. “Cruise ship makes Anchorage a port of call.” Available at http://www.msnbc.msn.com/id/30730951. May 13, 2009.
Association of Canadian Port Authorities (ACPA). Industry Information – Canadian Port Industry. Available at http://www.acpa-ports.net/industry/industry.html. Accessed April 4, 2010.
Bailey, Alan. “Future of Nikiski LNG plant in limbo over gas supplies.” Anchorage Daily News. Available at http://www.adn.com/2009/09/15/936506/future-of-nikiski-lng-plant-in.html. September 15, 2009.
Bailey, Alan. “Gas Price Cap.” Petroleum News. November 9, 2008.
Black & Veatch. Alaska Railbelt Electrical Grid Authority (REGA) Study. Available at http://www.aidea.org/aea/REGAFiles/9-12-08_AlaskaRailbeltREGAStudy_MasterFinalReport.pdf. September 12, 2008.
Bluemink, Elizabeth. “Coalition sues to block Pebble mine permits.” Anchorage Daily News. Available at http://www.adn.com/2009/07/29/880648/coalition-sues-to-block-pebble.html. July 29, 2009b.
Bluemink, Elizabeth. “Court allows gold mine to dump waste in lake.” Anchorage Daily News. Available at http://www.adn.com/2009/06/22/840031/court-allows-gold-mine-to-dump.html. June 22, 2009a.
Bluemink, Elizabeth. “Cruise ship makes first of nine Anchorage calls.” Anchorage Daily News. Available at http://www.adn.com/2010/05/24/1292461/25-cruise.html. May 24, 2010a.
Bluemink, Elizabeth. “Gas pipeline project faces 'fierce' competition.” Anchorage Daily News. Available at http://www.adn.com/2009/09/15/936521/gas-pipeline-project-faces-fierce.html. September 15, 2009c.
Bluemink, Elizabeth. “Icy oil spill easier to clean, scientists say.” Anchorage Daily News. Available at http://www.adn.com/2009/11/17/1017452/icy-oil-spill-easier-to-clean.html. November 17, 2009d.
Bluemink, Elizabeth. “Parnell pursues slashing cruise tax.” Anchorage Daily News. Available at http://www.adn.com/2010/03/19/1190783/governor-calls-for-cut-in-cruise.html. March 19, 2010b.
Bohrer, Becky. “Alaska House approves cruise passenger tax cut.” Anchorage Daily News. Available at http://www.adn.com/2010/04/18/1239308/alaska-house-approves-cruise-passenger.html. April 18, 2010b.
Bohrer, Becky. “Alaska legislators weigh study of mine permitting.” Anchorage Daily News. Available at http://www.adn.com/2010/03/19/1191469/alaska-legislators-weigh-study.html. March 19, 2010.
Brackley, Allen and Richard Haynes. Timber Products Output and Timber Harvests in Alaska: An Addendum. U.S. Department of Agriculture, Forest Service, Pacific Northwest Research Station. Available at http://www.fs.fed.us/pnw/pubs/pnw_rn559.pdf. August 2008.
Brackley, Allen, Thomas Rojas, and Richard Haynes. Timber products output and timber harvests in Alaska: projections for 2005-25. U.S. Department of Agriculture, Forest Service, Pacific

Strategic Trends Analysis
92 Final
Northwest Research Station. Available at http://www.fs.fed.us/pnw/pubs/pnw_gtr677.pdf. July 2006.
Bradner, Tim. “Future of state's LNG plant to flame out?” Peninsula Clarion. Available at http://www.peninsulaclarion.com/stories/071909/new_359283397.shtml. July 19, 2009.
Bradner, Tim. “Homer port could be staging area for Pebble mine.” Alaska Journal of Commerce. Available at http://alaskajournal.com/stories/111404/loc_20041114030.shtml. November 14, 2004.
Brooks, Mary R. and Kevin Cullinane. Chapter 18: Governance Models Defined. Research in Transportation Economics 17:405-435. 2007.
Brooks, Mary R. Chapter 11: Port Devolution and Governance in Canada. Research in Transportation Economics 17:237-257. 2007.
Budzik, Philip. Arctic Oil and Natural Gas Potential. Washington, D.C., U.S. Energy Information Administration, Office of Integrated Analysis and Forecasting, Oil and Gas Division. Available at http://www.eia.doe.gov/oiaf/analysispaper/arctic/index.html. October 19, 2009.
Buls, Bruce. “Growth Chart.” WorkBoat Magazine. Available at http://www.workboat.com/ newsdetail.aspx?id=4294974715. September 2007.
Byrne, Martin, Helen Sipsas, and Tess Thompson. Financing port infrastructure. International Advances in Economic Research 2(4):471-476. November 1996.
Carnival. Alaska Cruises. Available at http://www.carnival.com/cms/fun/destination/Alaska/. Accessed April 15, 2010.
Central Queensland Ports Authority. Council of Australian Governments (COAG) Review of Port Competition and Regulation: Submission in response to the Queensland Transport Discussion Paper. Available at http://www.transport.qld.gov.au/resources/file/eb79e207e684358/ Pdf_coag_port_review_cqpa_submission.pdf. October 2007.
Chetrick, Joel. “Sales of premium products to EU drive record U.S. seafood exports.” FAS Worldwide. Available at http://www.fas.usda.gov/info/fasworldwide/2007/03-2007/EUSeafood.htm. March 2007.
Chuanjiang, Ju and Dai Yan. “Qingdao Port, China Merchants for JV.” China Daily. Available at http://www.chinadaily.com.cn/business/2009-12/19/content_9202185.htm. December 19, 2009.
Clarke, Richard. An analysis of the international ocean shipping conference system. Transportation Journal 36(4):17-29. 1997.
Collins, Gloria. “Going Dutch: a public/private-sector partnership is expanding Dutch Harbor's city dock.” Alaska Business Monthly. April 1, 1991.
Commodity Research Bureau. CRB DataCenter. Available at http://www.crbtrader.com/ datacenter.asp. 2010.
Cox, Sally. Program Manager of Community Coastal Impact and Climate Change Programs, Alaska Department of Commerce, Community, and Economic Development. Personal communication with Northern Economics, Inc. April 19, 2010.
Crist, Philippe. Greenhouse Gas Emissions Reduction Potential from International Shipping. Joint Transport Research Centre of the OECD and the International Transport Forum. Available at http://ideas.repec.org/p/oec/itfaaa/2009-11-en.html. May 2009.

Strategic Trends Analysis
Final 93
Cullinane, Kevin and Mahim Khanna. Economies of scale in large containerships: optimal size and geographical implications. Journal of Transport Geography 8(3):181-195. 2000.
Cullinane, Kevin and Teng-Fei Wang. Chapter 15: Port Governance in China. Research in Transportation Economics 17:331-356. 2007.
Davis, Jill. Grants Manager, Alaska Department of Commerce, Community, and Economic Development. Personal communication with Northern Economics, Inc. April 19, 2010.
Demer, Lisa. “Does Alaska need a $700 million port?” Anchorage Daily News. Available at http://www.adn.com/2008/03/23/353533/does-alaska-need-a-700-million.html. April 2, 2008a.
Demer, Lisa. “Engineers urged to revoke permit for port project.” Anchorage Daily News. Available at http://www.adn.com/2008/04/03/364119/engineers-urged-to-revoke-permit.html. April 3, 2008b.
Denali Commission. Fiscal Year 2010: Budget Justification. Available at http://www.denali.gov/ index.php?option=com_docman&task=doc_download&gid=217&Itemid=253. May 2009.
Denali Commission. The Denali Commission Website. Available at http://www.denali.gov/. Accessed April 13, 2010.
Denning, Carrie and Camille Kustin. The Good Haul: Innovations That Improve Freight Transportation and Improve the Environment. Available at http://www.infrastructureusa.org/edf-the-good-haul/. March 23, 2010.
Donlin Creek LLC. Donlin Creek LLC website. Available at http://www.donlincreek.com/. Accessed April 15, 2010. 2008.
Dugan, Darcy, Ginny Fay, and Steve Colt. Nature-Based Tourism in Southeast Alaska: Results from 2005 and 2006 Field Study. Institute of Social and Economic Research, University of Alaska Anchorage and Eco-Systems. Available at http://www.iser.uaa.alaska.edu/Publications/ SEnbt_final.pdf. March 2007.
Eaton, S. 2006. Special Report: Frozen Assets. First to Fall. American Public Media: Marketplace. Available at http://marketplace.publicradio.org/features/frozenassets/frozenassets_eaton_ firsttofall.html. January 29, 2010.
Economic and Social Commission for Asia and the Pacific. Regional Shipping and Port Development Strategies: Container Traffic Forecast. Available at http://www.unescap.org/ publications/detail.asp?id=1136. 2005.
Engel, Gerry. Personal communication with Northern Economics, Inc. April 2010.
EURANS LTD. Container Ships website. Available at http://www.eurans.com.ua/eng/faq/ containerships/. Accessed April 15, 2010.
European Sea Ports Organisation. ESPO Environmental Review and Follow-up to the ESPO Code of Practice. Available at http://www.espo.be/downloads/archive/fecf3ddf-a692-4f4a-a0d1-d12cb64567ca.pdf. 2001.
Everett, Sophia and Ross Robinson. Chapter 12: Port Reform: The Australian Experience. Research in Transportation Economics 17:259-284. 2007
Fawcett, James. Chapter 10: Port Governance and Privatization in the United States: Public Ownership and Private Operation. Research in Transportation Economics 17:207-235. 2006.

Strategic Trends Analysis
94 Final
Forgey, Pat. “Pipeline operators go with the flow.” Juneau Empire. Available at http://juneauempire.com/stories/031010/loc_580923692.shtml. March 10, 2010.
Fried, Neal and Dan Robinson. “Alaska’s Economy Since 2000.” Alaska Economic Trends. Available at http://labor.alaska.gov/trends/apr08.pdf. April 2008.
Fried, Neal. “Alaska’s Oil Industry.” Alaska Economic Trends. Available at http://labor.alaska.gov/ trends/sep08.pdf. September 2008.
Fried, Neal. “The Denali Borough.” Alaska Economic Trends. Available at http://labor.alaska.gov/ trends/sep09.pdf. September 2009.
Frittelli, John and Jennifer Lake. Terminal Operators and Their Role in U.S. Port and Maritime Security. Congressional Research Service. Available at http://www.hlswatch.com/sitedocs/ RL33383.pdf. April 20, 2006.
Frittelli, John. Harbor Maintenance Trust Fund Expenditures. Congressional Research Service. Available at http://assets.opencrs.com/rpts/R41042_20100125.pdf. January 25, 2010.
Geelong Port. Welcome to Geelong Port. Available at http://www.geelongport.com.au/index.html. Accessed April 22, 2010.
GeelongPort. Patrick Ports, GrainCorp & Victorian Regional Channels Authority: GeelongPort Safety and Environmental Management Plan, 2009 Update. Available at http://www.geelongport.com.au/downloads/SEMP%20Executive%20Summary%202009%20GeelongPort,%20VRCA%20&%20Graincorp.pdf. April 2009.
Gilbertsen, Neal and Dan Robinson. “Natural Resources: Mining and Timber.” Alaska Economic Trends. Available at http://labor.alaska.gov/trends/dec03.pdf. December 2003.
Goldsmith, Scott and Tobias Schwoerer. Anchorage Port Intermodal Expansion Program (PIEP). Benefit Cost Analysis of Proposed TIGER Discretionary Grant Funds. Prepared for the Port of Anchorage. Available at http://www.iser.uaa.alaska.edu/Publications/POA_Benefit_Cost_ Analysis_v12sept92009.pdf. September 2009.
Goldsmith, Scott. What drives the Alaska economy? UA Research Summary No. 13. Available at http://www.iser.uaa.alaska.edu/Publications/researchsumm/UA_RS_13.pdf. December 2008.
Haglund, Donn. Maritime Transport in Support of Arctic Resource Development. Cold Regions Science and Technology 7 (June): 231-249. 1983.
Hearn, Bill and Tim Murphy. Port Infrastructure Renewal: The Canadian Experience. Presented to the American Association of Port Authorities (AAPA) Meeting in Toronto. Available at http://aapa.files.cms-plus.com/SeminarPresentations/2008JuneTorontoSeminar/ 08_TorontoSeminar_Hearn_Murphy.pdf. June 25, 2008.
Hiatt, Terry et al. Stock Assessment and Fishery Evaluation Report for the Groundfish Fisheries of the Gulf of Alaska and Bering Sea/Aleutian Islands Area: Economic Status of the Groundfish Fisheries off Alaska, 2007. National Marine Fisheries Service, Alaska Fisheries Science Center. November 2008.
Holland America. Alaska Cruise Options. Available at http://www.hollandamerica.com/cruise-destinations/Destination.action?explore=false&destCode=AC. Accessed April 15, 2010.
Inboundlogistics.com. Alaska: Cargo Crossroads of the World. Available at http://www.inboundlogistics.com/articles/features/0804_feature03.shtml. August 2004.

Strategic Trends Analysis
Final 95
International Maritime Organization. Multi-year Expert Meeting on Transport and Trade Facilitation: Maritime Transport and the Climate Change Challenge. Available at http://www.unctad.org/ sections/wcmu/docs/cimem1p03_en.pdf. February 2009.
Jensen Yorba Lott, Inc., McDowell Group, and Jones & Jones Architects and Landscape Architects, Inc. Wrangell Downtown Revitalization, Final Report. Available at http://www.wrangell.com/ reports/revitalization/wrangell-final-oct06.pdf. October 2006.
Joling, Dan. “Cruise company to move ship out of Alaska waters.” Anchorage Daily News. Available at http://www.adn.com/2009/04/27/775276/cruise-company-to-move-ship-out.html. April 27, 2009.
Jones, Patricia. “Barge companies bring world to doorstep: Barge lines transport everything from food to vehicles to construction equipment to all parts of the state, offering both chartered and scheduled service.” Alaska Business Monthly. Available at http://www.allbusiness.com/north-america/united-states-alaska/329266-1.html. November 1, 2002.
Knapp, Gunnar, Cathy Roheim, and James Anderson. The Great Salmon Run: Competition Between Wild and Farmed Salmon. TRAFFIC North America, World Wildlife Fund. Available at http://www.traffic.org/species-reports/traffic_species_fish25.pdf. January 2007.
Knapp, Gunnar, Patricia Livingston, and Al Tyler. Human Effects of Climate-Related Changes in Alaska Commercial Fisheries. Institute of Social and Economic Research, University of Alaska Anchorage. Anchorage, AK. Available at http://www.besis.uaf.edu/besis-oct98-report/ Fisheries.pdf. 1999.
Knight, Kevin. The Implications of Panama Canal Expansion to U.S. Ports and Coastal Navigation Economic Analysis. Prepared for U.S. Army Corps of Engineers. Available at http://www.iwr.usace.army.mil/inside/products/pub/iwrreports/WhitePaperPanamaCanal.pdf. December 2008.
Kramer, Andrew and Andrew Revkin. “Arctic Shortcut Beckons Shippers as Ice Thaws.” The New York Times. Available at http://www.nytimes.com/2009/09/11/science/earth/11passage.html?_r=1. September 11, 2009.
Kruse, Gordon. The Written Testimony of Gordon Kruse, Ph.D., University of Alaska Fairbanks School of Fisheries and Ocean Sciences, Juneau Center, Juneau, Alaska. Hearing on the Effects of Climate Change and Ocean Acidification on Living Marine Resources before the Senate Committee on Commerce, Science, and Transportation, Subcommittee on Oceans, Atmosphere, Fisheries, and Coast Guard. Washington, D.C. Available at http://www.sfos.uaf.edu/news/2007/gordon-kruse-2007-senate.pdf. May 10, 2007.
KUCB News. DH Ports moves into new phase for large cold storage facility. Available at http://www.publicbroadcasting.net/kial/news.newsmain?action=article&ARTICLE_ID=1478688§ionID=1. March 3, 2009.
Land Design North. Nome Area Tourism Demand, Potential, and Infrastructure Study. Prepared for the Alaska Department of Transportation. Available at http://www.landdesignnorth.com/doc/ Nome/DOT_Tourism_Study.pdf. October 2003.
Leroux, Gary. “The Canada Marine Act: Moving Forward.” Canadian Ports Magazine. Available at http://acpa-ports.net/pr/pdfs/cdnports2009.pdf. 2009.
Li, Hailong and Michel Boufadel. Long-term persistence of oil from the Exxon Valdez spill in two-layer beaches. Nature Geoscience 3:96–99. 2010.
Strategic Trends Analysis
96 Final
Lind, Sharon. Public Information Officer at The Denali Commission. Personal communication with Northern Economics, April 13, 2010.
Lirn, TC, HA Thanopoulou, MJ Beynon, and AKC Beresford. “An Application of AHP on Transhipment Port Selection: A Global Perspective.” Maritime Economics & Logistics, 6 (70-91). 2004.
Lloyd’s Register. Container Ship Focus: Technical News and Information on Container Ships, Issue 4. Available at http://www.lr.org/Images/CS%20Focus4_tcm155-175188.pdf. October 2007.
Lukshin, Michael. Statewide Ports and Harbors Engineer, Alaska Department of Transportation and Public Facilities. Municipal Harbor Facility Grant Program - FY 12 applications. E-mail communication to the Alaska Association of Harbormasters and Port Administrators mailing list. April 9, 2010a.
Lukshin, Michael. Statewide Ports and Harbors Engineer, Alaska Department of Transportation and Public Facilities. Personal communication with Northern Economics, Inc. January 14, 2010b.
MacPherson, James. “Alaska feels lockout squeeze.” Alaska Journal of Commerce. Available at http://alaskajournal.com/stories/101402/loc_squeeze.shtml. October 14, 2002.
Maersk Line. Constant Care for the Environment. Available at http://www.maerskline.com/globalfile/ ?path=/pdf/environmental_brochure. Undated.
Manget, Sean. “Harbor projects across Alaska to start construction soon.” Alaska Journal of Commerce. Available at http://www.alaskajournal.com/stories/032610/fis_12_001.shtml. March 26, 2010.
McBeath, J. Institutional Responses to Climate Change: The Case of the Alaska Transportation System. Mitigation and Adaptation Strategies for Global Change 8 (1): 3-28. 2003.
McCabe, Gregory, Martyn Clark, and Mark Serreze. Trends in Northern Hemisphere surface cyclone frequency and intensity. Journal of Climate 14(13):2763-2768. 2001.
McDowell Group. A Fresh Seafood Distribution Center: An Assessment of Need. Prepared for World Trade Center Alaska. Available at http://www.ams.usda.gov/AMSv1.0/getfile? dDocName=STELDEV3102606. October 2001a.
McDowell Group. Alaska Potato Export Market and Storage Facility Assessment Study. Prepared for Alaska Department of Community and Economic Development. Available at http://gov.state.ak.us/trade/2003/tad/pub/potatoreport.pdf. 2001b.
McDowell Group. Alaska Visitor Statistics Program V: Interim Visitor Volume Report. Summer 2007. Prepared for Alaska Department of Commerce, Community and Economic Development. Available at http://www.commerce.state.ak.us/oed/toubus/pub/AVSP_Summer_2007.pdf. December 2007.
McDowell Group. Alaska Visitor Statistics Program V: Interim Visitor Volume Report, Summer 2009. Prepared for State of Alaska, Department of Commerce, Community and Economic Development, Office of Economic Development. Available at http://www.dced.state.ak.us/ oed/toubus/pub/AVSP_V_Summer_2009revised.pdf. December 2009.
McDowell Group. Analysis of Southeast Alaska Commercial Salmon Fishing Infrastructure. Prepared for Alaska Department of Fish & Game. August 2003.
Mesquita, Michel, David Atkinson, and Kevin Hodges. Characteristics and Variability of Storm Tracks in the North Pacific, Bering Sea, and Alaska. Journal of Climate 23(2):294-311. 2010.

Strategic Trends Analysis
Final 97
Ministry of Foreign Affairs of Denmark. Denmark hosts the five nations: Arctic Ocean Conference in Greenland. Available at http://www.ambwashington.um.dk/en/menu/TheEmbassy/News/ NewsArchive2008/DenmarkHoststheFiveNationsArcticOceanConferenceInGreenland.htm. February 24, 2009.
Mueter, Franz and Michael Litzow. Sea Ice Retreat Alters the Biogeography of the Bering Sea Continental Shelf. Ecological Applications 18 (2): 309-320. 2008.
Mueter, Franz, Cecilie Broms, Kenneth Drinkwater, Kevin Friedland, Jonathan Hare, George Hunt, Webjørn Melle, and Maureen Taylor. Ecosystem responses to recent oceanographic variability in high-latitude Northern Hemisphere ecosystems. Progress in Oceanography 81 (1-4): 93-110. 2009b.
Mueter, Franz, Michael Litzow, and Robert Lauth. Spatial Distribution of Groundfish Stocks in the Bering Sea. In Jennifer Boldt and Stephani Zador. North Pacific Groundfish Stock Assessment and Fishery Evaluation Reports for 2010: Appendix C. Ecosystem Considerations for 2010. Anchorage. AK: North Pacific Fishery Management Council. Available at http://www.afsc.noaa.gov/refm/docs/2009/ecosystem.pdf. 2009a.
Murphy, Kim. “A new route beyond the Last Frontier.” Los Angeles Times. Available at http://articles.latimes.com/2009/oct/11/nation/na-arctic-shipping11. October 11, 2009.
National Assessment Synthesis Team, U.S. Global Change Research Program. 2000. Climate Change Impacts on the United States. The Potential Consequences of Climate Variability and Change. Overview: Alaska. Available at http://www.usgcrp.gov/usgcrp/Library/nationalassessment/ overviewalaska.htm#SensitivityofMarineEcosystemsandFisheries. December 11, 2009.
National Competition Council of Australia. Website of National Competition Policy. Available at http://www.ncp.ncc.gov.au/. Accessed April 22, 2010.
National Marine Fisheries Service. Total Commercial Fishery Landings At Major U. S. Ports Summarized By Year And Ranked By Poundage. NMFS Office of Science and Technology. Available at http://www.st.nmfs.noaa.gov/st1/commercial/landings/lport_yearp.html. 2009.
National Oceanic and Atmospheric Administration (NOAA) Fisheries, Alaska Regional Office. Community Development Quota (CDQ) Program. Available at http://www.fakr.noaa.gov/ cdq/. Accessed on September 3, 2010.
National Research Council. Potential Impacts of Climate Change on U.S. Transportation. Special Report 290. Available at http://onlinepubs.trb.org/onlinepubs/sr/sr290.pdf. 2008.
Nelson, Kristen. “Port authority solves Jones Act tanker issues.” Petroleum News 11(9). Available at http://www.petroleumnews.com/pntruncate/656724200.shtml. February 26, 2006.
North of 60 Mining News. 2010. “Kensington starts gold production; China to get output.” 6(25). Available at http://www.miningnewsnorth.com/index.shtml. June 24, 2010.
North Pacific Fishery Management Council. Public Review Draft Environmental Assessment/ Regulatory Impact Review/Initial Regulatory Flexibility Analysis for the Arctic Fishery Management Plan and Amendment 29 to the Fishery Management Plan for Bering Sea/Aleutian Islands King and Tanner Crabs. Available at http://www.fakr.noaa.gov/ npfmc/current_issues/Arctic/ArcticEA109.pdf. January 2009.
North Pacific Fishery Management Council. Review of the Community Quota Entity (CQE) Program under the Halibut/Sablefish IFQ Program. Available at http://www.fakr.noaa.gov/npfmc/ current_issues/halibut_issues/CQEreport210.pdf. March 2010.

Strategic Trends Analysis
98 Final
Northern Economics, Inc. An Assessment of the Socioeconomic Impacts of Western Alaska Community Development Quota Program. Prepared for Alaska Department of Community and Eonomic Development, Division of Community and Business Development. November 2002b.
Northern Economics, Inc. and Parametrix. Southeast Alaska Mid-Region Access Traffic Projections Technical Memorandum. Prepared for Federal Highway Administration. April 2009.
Northern Economics, Inc. Benefits of Valdez City Dock Improvements. Prepared for the City of Valdez. June 2002a.
Northern Economics, Inc. Economic Analysis of Future Offshore Oil and Gas Development: Beaufort Sea, Chukchi Sea, and North Aleutian Basin. Prepared for Shell Exploration and Production. March 2009.
Northern Economics, Inc. Port of Anchorage Consolidation and Distribution Concept Feasibility Study. Prepared for Anchorage Economic Development Corporation. April 2006.
Northern Economics, Inc. The Economic Impacts of International Trade Exports on the Alaskan Economy. Prepared for World Trade Center Alaska. April 2010.
Northern Economics, Inc. Valuation Assessment of the DeLong Mountain Transportation System. Prepared for Northwest Arctic Borough. May 2007.
Northern Economics, Inc., SAIC, Inc., and Institute of Social and Economic Research, University of Alaska Anchorage. In-State Gas Demand Study. Prepared for TransCanada Alaska Company, LLC. 2010.
Norton, J. David and Janna Miller. Useful Life of the Trans-Alaska Pipeline. Available at http://cedb.asce.org/cgi/WWWdisplay.cgi?131163. 2002.
Notteboom, Theo and Bert Vernimmen. The effect of high fuel costs on liner service configuration in container shipping. Journal of Transport Geography 17(5):325-337. 2009.
Nuka Research & Planning Group, LLC. And Cape International, Inc. Vessel Traffic in the Aleutians Subarea. Prepared for Alaska Department of Environmental Conservation. Available at http://www.dec.state.ak.us/spar/perp/docs/060920vesselreport_p.pdf. April 2005.
Orensanz, J. (Lobo), Billy Ernst, David Armstrong, Phyllis Stabeno, and Pat Livingston. Contraction of the geographic range of distribution of snow crab (Chionoecetes opilio) in the eastern Bering Sea: An environmental ratchet? California Cooperative Oceanic Fisheries Investigations Reports 45: 65-79. Available at http://www.calcofi.org/newhome/publications/ CalCOFI_Reports/v45/pdfs/Vol45_Orensanz.pdf. 2004.
Panama Canal Authority. Proposal for the Expansion of the Panama Canal. Third Set of Locks Project. Available at http://www.pancanal.com/eng/plan/documentos/propuesta/acp-expansion-proposal.pdf. April 24, 2006.
Penfold, Andrew. Impact of Panama Impact of Panama Canal Expansion on Asia-North America Container Trades. ACP-PICU Conference. Available at http://www.pancanal.com/common/maritime/conf-acp-umip/osc-presentation.pdf. 2007.
Petersburg Economic Development Council. Economic Trends – 2008. Available at http://www.ci.petersburg.ak.us/vertical/Sites/%7B6795A51C-8710-4546-B2D2-2A07534E232 B%7D/uploads/%7B544601B2-C560-4E96-98B3-934B4084F643%7D.PDF. 2008.

Strategic Trends Analysis
Final 99
Peterson, Charles, Stanley Rice, Jeffey Short, Danial Esler, James Bodkin, Brenda Ballachey, and David Irons. Long-Term Ecosystem Response to the Exxon Valdez Oil Spill. Science 302(5653):2082-2086. 2003.
Pharand, Donat. The Arctic Waters and the Northwest Passage: A Final Revisit. Ocean Development and International Law 38(1-2):3–69. 2007.
“Port Access Route Study: In the Bering Strait (Proposed Rules).” Federal Register 75:215 (November 8, 2010) p. 68568.
Port Authority of New York & New Jersey. Port History. Available at http://www.panynj.gov/about/ history-ports.html. Accessed April 30, 2010.
Port of Anchorage. 2008 Port of Anchorage Annual Tonnage Report. Available at http://www.muni.org/Departments/port/Documents/2008AnnualTonnageReport.pdf. 2009.
Port of Melbourne. Port Corporation. Available at http://www.portofmelbourne.com/portcorp/. Accessed April 22, 2010.
Port of Melbourne. Who does what in the port? Available at http://www.portofmelbourne.com/ business/aboutport/whodoeswhat.asp. Accessed April 22, 2010b.
Prince William Sound Economic Development District. Comprehensive Economic Development Strategy. Available at http://www.commerce.state.ak.us/oed/ardor/pub/2006_PWS_CEDS.pdf. 2006.
Princess Cruises. Alaska 2010 Overview. Available at http://www.princess.com/downloads/pdf/ alaska/Alaska_2010_overview.pdf. Accessed April 15, 2010.
Queensland Government. About Us website. Available at http://www.transport.qld.gov.au/ Home/About_us/. Accessed April 22, 2010.
Queensland Government. Ports. Available at http://www.transport.qld.gov.au/Home/Industry/Ports/. Accessed April 22, 2010c.
Queensland Government. Who We Are: Fact Sheet. Available at http://www.tmr.qld.gov.au/About-us.aspx. Accessed April 22, 2010b.
Redmayne, Peter. “China Seafood: The Whole Inside Story.” Simply Seafood Newsletter. Available at http://www.simplyseafood.com/newsletters/0807/editorsletter.html. Summer 2007.
Reiss, Bob. Barrow, Alaska: Ground Zero for Climate Change. Smithsonian.com. Available at http://www.smithsonianmag.com/science-nature/Barrow-Alaska-Ground-Zero-for-Climate-Change.html. March 2010.
Robinson, Dan, Neal Fried, Alyssa Shanks, and Joy Wilkinson. Employment Forecast for 2010. Alaska Economic Trends 30 (1): 4-20. Available at http://labor.alaska.gov/trends/jan10.pdf. January 2010.
Rodrigue, Jean-Paul, Claude Comtois and Brian Slack. The Geography of Transport Systems. Available at http://people.hofstra.edu/geotrans. 2009.
Sackton, John. N. “Pacific Council SSC votes 813,000 tons as recommended 2010 Bering Sea pollock TAC.” SeafoodNews.com. Available at http://www.seafoodnews.com/sub/newsstory.aspx? StoryId=719051. December 9, 2009.
Sánchez, Jorge, Tanya Franke, and Amy Zecha. China, Peoples Republic of, Fishery Products, U.S. Seafood Exports to China are Re-exported to Third Countries. USDA Foreign Agricultural

Strategic Trends Analysis
100 Final
Service GAIN Report Number CH8002. Available at http://www.fas.usda.gov/gainfiles/ 200801/146293479.pdf. January 16, 2008.
SeaFood Business. Bon Appétit nears low-carbon goal. Available at http://www.sourceseafood.com/ index.asp?ItemID=4088&pcid=196&cid=197&archive=yes. June 19, 2009.
Seafood Market Bulletin. “Alaska Seafood Exports: Changing Market Destinations.” Seafood Market Bulletin. Available at http://www.alaskaseafood.org/fishingprocessing/seafoodweb_june07/ exports.html. June 2007.
Shafran, Isaac and Anne Strauss-Wieder. Financing and Improving Land Access to U.S. Intermodal Cargo Hubs. NCHRP Report 497. Available at http://onlinepubs.trb.org/onlinepubs/nchrp/ nchrp_rpt_497.pdf. 2003.
Shaw Alaska, Inc. Commercial Future of the Kenai LNG Plant. Prepared for Alaska Natural Gas Development Authority. Available at http://www.angda.state.ak.us/ANGDA_Reports/Kenai_ LNG_Plant_final_report.pdf. 2006.
Sherman, Rexford B. Seaport Governance in the United States and Canada. American Association of Port Authorities. Available at http://www.aapa-ports.org/files/PDFs/governance_uscan.pdf. September 1985. Updated December 2008.
Smith, Orson and George Levasseur. Impacts of Climate Change on Transportation Infrastructure in Alaska. The Potential Impacts of Climate Change on Transportation: Workshop Summary and Proceedings. U.S. Department of Transportation, Center for Climate Change. Available at http://climate.dot.gov/documents/workshop1002/smith.pdf. 2002.
Solomon, Mark. “Panama project threatens West Coast ports' lock on Asia trade.” DC Velocity. Available at http://www.dcvelocity.com/print/article/20091004panama_canal_west_coast_ ports/. October 4, 2009.
SRK Consulting. Environmental Audit of the Greens Creek Mine. Prepared for Alaska Department of Environmental Conservation, Alaska Department of Natural Resources, U.S. Department of Agriculture Forest Service and Hecla Greens Creek Mining Company. Available at http://dnr.alaska.gov/mlw/mining/largemine/greenscreek/pdf/gcaudit2009.pdf. March 2009.
St. Onge, Michaela. The City of Unalaska: Heart of the Aleutian Islands. Available at http://www.energydigital.com/The-City-of-Unalaska---Heart-of-the-Aleutian--Islands_26517.aspx. 2009.
Stank, Theodore and Anthony Roath. Some propositions on intermodal transportation and logistics facility development: shippers' perspectives. Transportation Journal 37(3):13-24. 1998.
Stewart, E.J. and D. Draper. The Sinking of the MS Explorer: Implications for Cruise Tourism in Arctic Canada. InfoNorth 61(2):224-228. 2008.
Stopford, Martin. Maritime Economics. 2nd ed. 1997.
Stram, D. and D. Evans. Fishery management responses to climate change in the North Pacific. ICES Journal of Marine Science 66 (7): 1633–1639. 2009.
Swagel, Will. “Icy Strait Point: a destination of economy: tourist attraction in Southeast declares success.” Alaska Business Monthly. Available at http://www.highbeam.com/doc/1G1-165939737.html. April 1, 2007.
Swainbank, R., K. Clautice and J. Nauman. “Alaska's Mineral Industry 1998.” Special Report 53. Alaska Division of Geological & Geophysical Surveys. 1999.

Strategic Trends Analysis
Final 101
Szumigala, D. and R. Hughes. “Alaska's Mineral Industry 2003.” Special Report 58. Alaska Division of Geological & Geophysical Surveys. 2004.
Szumigala, D., R. Hughes and L. Harbo. “Alaska's Mineral Industry 2008.” Special Report 63. Alaska Division of Geological & Geophysical Surveys. 2009.
Szymoniak, Nick, Ginny Fay, and Alejandra Villalobos-Melendez. Components of Alaska Fuel Costs: An Analysis of the Market Factors and Characteristics that Influence Rural Fuel Prices. Prepared for Alaska State Legislature Senate Finance Committee. Available at http://www.iser.uaa.alaska.edu/Publications/componentsoffuel3.pdf. February 2010.
Taylor, Eric et al. ADOT&PF Statewide Plan Manager, Division of Program Development, Alaska Department of Transportation and Public Facilities. Description of ADOT&PF entities supporting port and harbor development, as part of ADOT&PF consolidated comments on draft white paper. E-mail communication with Northern Economics, Inc. June 7, 2010.
Tetra Tech, Inc. Red Dog Mine Extension Aqqaluk Project Final Supplemental Environmental Impact Statement. Volume 1. Prepared for U.S. Environmental Protection Agency. Available at http://www.reddogseis.com/Final_SEIS.asp. October 2009.
The Alaska Industrial Development and Export Authority (AIDEA). AIDEA website. Available at http://www.aidea.org. Accessed April 13, 2010.
The Glosten Associates, Inc. Southeast Alaska Mid-region Access Task 7 – Port and Ferry Terminal Feasibility Study. Prepared for Federal Highway Administration and Alaska Department of Transportation and Public Facilities. April 2009.
The Journal of Commerce Online. Press Release: Crowley Articulated Tug Barge (ATB) is Largest to Ever Transit Alaskan Waters. Available at http://www.joc.com/crowley-articulated-tug-barge-atb-largest-ever-transit-alaskan-waters. December 15, 2009.
The Port of Anchorage. Intermodal Expansion Project: Project Description. Available at http://www.portofanchorage.org/ov_project.html?19,13. Accessed April 15, 2010.
The World Bank and Public-Private Infrastructure Advisory Facility. Port Reform Toolkit. Available at http://rru.worldbank.org/Toolkits/PortReform/. 2007.
The World Bank. Chapter 9: Global Terminal Operators. Available at http://siteresources.worldbank.org/INTRANETTRADE/Resources/Internal-Training/ Global_terminal_operators.pdf. Undated.
Thomas, Charles, Davis Faulder, Tom Doughty, and David Hite. Alaska North Slope Oil and Gas: A Promising Future or an Area in Decline? Addendum Report. DOE/NETL-2009/1385. Available at http://www.netl.doe.gov/technologies/oil-gas/publications/AEO/ANS_Potential.pdf. April 8, 2009.
Transport Canada. Port Divestiture Program. Available at http://www.tc.gc.ca/eng/mediaroom/ backgrounders-b06-m001e-1837.htm. Posted July 2007. Modified February 1, 2010.
Tromble, Kristen and Brigitta Windisch-Cole. “Metal Mining: Revival of a Basic Industry.” Alaska Economic Trends. Available at http://labor.alaska.gov/trends/nov97.pdf. November 1997.
Tryck Nyman Hayes, Inc. and Riverwise, LLC. Alaska Regional Ports Harbors/Ports of Refuge and Port of Anchorage Rail Link Analysis. Prepared for U.S. Army Corps of Engineers, Alaska District. March 2008.

Strategic Trends Analysis
102 Final
U.S. Arctic Research Commission. White Paper: U.S. Arctic Research Commission Recommends Steps to Expanded U.S. Funding for Arctic/Subarctic Oil Spill Research. Available at http://www.arctic.gov/publications/usarc_oilspill_2-24-10.pdf. February 24, 2010.
U.S. Army Corps of Engineers. Alaska Regional Ports 905(b) Reconnaissance Study. Available at http://www.poa.usace.army.mil/en/cw/AK%20Regional%20Ports%20Study/AK%20Regional%20Ports%20905b%20FINAL_May2008.pdf. May 2008.
U.S. Army Corps of Engineers. Navigation Data Center: Part 4 Pacific Coast. Available at http://www.iwr.usace.army.mil/ndc/wcsc/webpub/Part4_Ports_tonsbyTT_Dr_Yr_comm.htm. 2010.
U.S. Bureau of Land Management. Northeast National Petroleum Reserve������������� �����������Integrated Activity Plan/Environmental Impact Statement. Available at http://www.blm.gov/ ak/st/en/prog/planning/npra_general/ne_npra/northeast_npr-a_final.html. May 2008.
U.S. Coast Guard. Operation Salliq 2008: The Coast Guard Arctic Initiative. Available at http://uscgalaska.blogspot.com/2009/02/operation-salliq-2008-coast-guard_19.html. February 19, 2009.
U.S. Department of Agriculture (USDA), Rural Development. “Agriculture Under Secretary Tonsager Announces Availability of Funds To Achieve Long-Term Economic Growth, Business Development and Sustainability in Rural Areas.” News Release. Available at http://www.rurdev.usda.gov/RD/newsroom/USEC%20RBOG%20NOFA%20press%20release%20April%202010WM.doc. April 5, 2010.
U.S. Department of Agriculture, Rural Development. “Business & Cooperative Programs: Business and Industry Loan Guarantee Program.” Available at http://www.rurdev.usda.gov/ia/rbcs_B&I_G_Fact_Sheet.pdf. October 2005.
U.S. Department of Defense. News: Navy Task Force Assesses Changing Climate. Available at http://www.defense.gov/news/newsarticle.aspx?id=55327. July 31, 2009.
U.S. Department of Transportation, Maritime Administration (MARAD). Glossary of Shipping Terms 2008. Available at http://www.marad.dot.gov/documents/Glossary_final.pdf. May 2008.
U.S. Economic Development Administration. “U.S. Commerce Secretary Locke Announces $2.2 Million Recovery Act Grant to Create Jobs, Boost Development in Bristol Bay Borough, Alaska.” News Release. Available at http://www.eda.gov/xp/EDAPublic/NewsEvents/ PressReleases/PRBristolBayAK082809.xml. August 28, 2009.
U.S. Economic Development Administration. New Investments. Available at http://www.eda.gov/ NewsEvents/NewInvestments.xml. 2010.
U.S. Environmental Protection Agency (U.S. EPA). Frequent Questions – Science | Climate Change. Available at http://www.epa.gov/climatechange/fq/science.html. Last updated February 16, 2010.
U.S. Environmental Protection Agency. Clean Ports USA: Case Studies and Success Stories. Available at http://www.epa.gov/otaq/diesel/ports/casestudies.htm. 2009.
U.S. General Accounting Office. Public-Private Partnerships: Terms Related to Building and Facility Partnerships. Available at http://www.gao.gov/special.pubs/Gg99071.pdf. April 1999.
U.S. Geological Survey. News Release: 90 Billion Barrels of Oil and 1,670 Trillion Cubic Feet of Natural Gas Assessed in the Arctic. Available at http://www.usgs.gov/newsroom/ article_pf.asp?ID=1980. July 23, 2008.
Strategic Trends Analysis
Final 103
U.S. Maritime Administration. Port Investment and Finance. Available at http://www.marad.dot.gov/ ports_landing_page/infra_dev_congestion_mitigation/port_finance/Port_Fin_Home.htm. 2010.
U.S. Minerals Management Service. Chukchi Sea Planning Area: Oil and Gas Lease Sale 193 and Seismic Surveying Activities in the Chukchi Sea Final Environmental Impact Statement. OCS EIS/EA MMS 2007-026. Available at http://www.mms.gov/alaska/ref/EIS%20EA/Chukchi_FEIS_ 193/feis_193.htm. 2007a.
U.S. Minerals Management Service. Outer Continental Shelf Oil & Gas Leasing Program: 2007-2012 Final Environmental Impact Statement. Available at http://www.mms.gov/5-year/2007-2012FEIS.htm. 2007b.
U.S. Minerals Management Service. Planning Area Resources Addendum to Assessment of Undiscovered Technically Recoverable Oil and Gas Resources of the Nations’ Outer Continental Shelf, 2006. Available at http://www.mms.gov/revaldiv/PDFs/ NA2006BrochurePlanningAreaInsert.pdf. 2006.
United Nations Conference on Trade and Development (UNCTAD). Globalization of port logistics: opportunities and challenges for developing countries. Available at http://www.unctad.org/ en/docs/tdxiibpd3_en.pdf. 2007.
United Nations Conference on Trade and Development (UNCTAD). Review of Maritime Transport 2009. Available at http://www.unctad.org/en/docs/rmt2009_en.pdf. 2009.
University of Alaska Fairbanks Cooperative Extension Service. The Agricultural Industry in Alaska: A Changing and Growing Industry – Identification of Issues and Challenges. May 2006.
URS Corporation. Alaska Barge Landing System Design. Data Gathering Study and Preliminary Design. Planning Various Locations, Statewide, Alaska Phase 1. Prepared for U.S. Army Engineer District, Alaska. Anchorage, AK. Available at http://www.poa.usace.army.mil/en/cw/ 2009.01.20%20Barge%20Landing%20System%20Design%20Final%20Report/BargeReport_FINAL.pdf. January 2009.
VZM/TranSystems and Northern Economics, Inc. Final Report of the Master Plan for the Regional Port of Anchorage. Strategic Marketing Plan. 1999.
Walker, Valorie. Deputy Director, Alaska Industrial Development and Export Authority. Personal communication with Northern Economics, Inc. April 16, 2010.
Walsh, Gregory M. “Andrie Introduces ATB-unit for Asphalt Trade on Great Lakes” Professional Mariner. Issue #126, ATR 2009. Available at http://www.professionalmariner.com/ ME2/dirmod.asp?sid=420C4D38DC9C4E3A903315CDDC65AD72&nm=Archives&type=Publishing&mod=Publications%3A%3AArticle&mid=8F3A7027421841978F18BE895F87F791&tier=4&id=7C9CD02E82E74F309443F93E7FE9784D.
Wang, James. Port Governance in China. Presented at INRETS, Paris, France. Available at http://www.inrets.fr/fileadmin/ur/splott/Evenements/EMAR/Presentations/Presentation_Wang.pdf. October 8, 2004.
Warren, Debra. “Production, prices, employment, and trade in Northwest forest industries, all quarters of 2007.” Resource Bulletin PNW-RB-256, U.S. Department of Agriculture, Forest Service, Pacific Northwest Research Station. Available at http://www.fs.fed.us/pnw/pubs/ pnw_rb256.pdf. June 2008.

Strategic Trends Analysis
104 Final
Weiss, Kenneth “U.S. fishing fleet pursues pollock in troubled waters.” Los Angeles Times. Available at http://articles.latimes.com/2008/oct/19/nation/na-pollock19. October 19, 2008.
Welch, Lanie. “Dutch Harbor marine facility gets makeover.” Anchorage Daily News. October 7, 2007.
Western Transportation Advisory Council (Westac). The Canada Marine Act: Creating Canada Port Authorities (briefing). Available at http://www.westac.com/pdfs/pub_cma.pdf. March 1999.
White, Rindi. “Timber-cutting ban encourages new NPI venture.” Anchorage Daily News. Available at http://www.adn.com/2008/03/05/335364/timber-cutting-ban-encourages.html. March 5, 2008.
Young, Don. Press Releases: Rep. Young Introduces Arctic Port Bill. Available at http://donyoung.house.gov/News/DocumentSingle.aspx?DocumentID=169096. February 3, 2010.
Zheng, J. and G. Kruse. Recruitment variation in eastern Bering Sea crabs: climate-forcing or top-down effects? Progress in Oceanography 68 (2-4): 184-204. 2006.

Wisdom • Trust • Relevance • Innovation
Alaska Regional Ports
Appendix B:
Baseline Assessment of Alaska’s Ports and Harbors
Final ReportPrepared for the
U.S. Army Corps of Engineers
and
Alaska Department of Transportation
and Public Facilities
January 2011
Under Contract to
URS Corporation


Baseline Assessment of Alaska’s Ports
and Harbors
Final Prepared for
U.S. Army Corps of Engineers Alaska District and the
Alaska Department of Transportation & Public Facilities
January 2011
Prepared by
Under contract to URS Corporation

Preparers
Team Member Project Role Patrick Burden Project Director Michael Fisher Project Manager Alexus Bond Analyst, Author Eric Davis Analyst Terri McCoy Editor
Please cite as: Northern Economics, Inc. Baseline Assessment of Alaska’s Ports and Harbors. Prepared for U.S. Army Corps of Engineers Alaska District and the Alaska Department of Transportation & Public Facilities. January 2011.

Final i
Contents
Section Page
Abbreviations .......................................................................................................................................... iv
1 Introduction ............................................................................................................................. 1
2 A Regional Analysis: Survey Results ............................................................................................ 2 2.1.1 Transportation Regions ....................................................................................................... 2 2.2 Survey Results by Region .................................................................................................... 5 2.2.1 Marine Assets, their functional role and operational capability ............................................ 5 2.2.2 Intermodal Connections ..................................................................................................... 7 2.3 Facility Attributes and Services ............................................................................................ 9 2.3.1 Equipment Availability ...................................................................................................... 10
3 Regional Analysis of Ownership and Fiscal Characteristics ......................................................... 12 3.1 Ownership ....................................................................................................................... 12 3.2 Southeast ......................................................................................................................... 13 3.2.1 City and Borough of Juneau .............................................................................................. 13 3.2.2 Sitka ................................................................................................................................. 14 3.2.3 Pelican ............................................................................................................................. 15 3.3 Prince William Sound ....................................................................................................... 15 3.3.1 Whittier ............................................................................................................................ 15 3.3.2 Valdez .............................................................................................................................. 16 3.3.3 Cordova ........................................................................................................................... 17 3.4 Southcentral ..................................................................................................................... 18 3.4.1 Anchorage ........................................................................................................................ 18 3.4.2 Homer ............................................................................................................................. 19 3.4.3 Nikiski .............................................................................................................................. 20 3.5 Southwest ......................................................................................................................... 21 3.5.1 Unalaska/Dutch Harbor .................................................................................................... 21 3.5.2 Kodiak .............................................................................................................................. 22 3.5.3 Naknek ............................................................................................................................ 23 3.6 Yukon-Kuskokwim ............................................................................................................ 24 3.6.1 Bethel............................................................................................................................... 24 3.6.2 Chefornak ........................................................................................................................ 25 3.6.3 Saint Mary’s ...................................................................................................................... 25 3.7 Northwest ........................................................................................................................ 26 3.7.1 Nome ............................................................................................................................... 27 3.7.2 Kotzebue .......................................................................................................................... 27 3.7.3 Galena ............................................................................................................................. 28 3.8 Arctic ............................................................................................................................... 28 3.8.1 Barrow ............................................................................................................................. 29 3.9 Interior ............................................................................................................................. 29

Baseline Assessment of Alaska’s Ports and Harbors
ii Final
3.9.1 Fairbanks .......................................................................................................................... 29 3.9.2 Nenana ............................................................................................................................ 29 3.9.3 Tanana ............................................................................................................................. 30
4 Regional Needs and Improvements .......................................................................................... 31 4.1 Southeast .......................................................................................................................... 31 4.2 Prince William Sound ....................................................................................................... 34 4.3 Southcentral ..................................................................................................................... 35 4.4 Southwest ......................................................................................................................... 36 4.5 Northwest ......................................................................................................................... 37 4.6 Interior ............................................................................................................................. 38
5 References .............................................................................................................................. 39
Appendix A: Planned and/or Underway Projects ....................................................................................... 42
Appendix B: Projects Needed but Not Yet Planned .................................................................................... 49
Table Page
Table 1. Respondent Communities by Region .................................................................................... 4 Table 2. Number of Survey Respondents by Region ........................................................................... 5 Table 3. Marine Facilities by Respondent ........................................................................................... 6 Table 4. Marine Facilities by Community ........................................................................................... 6 Table 5. Intermodal Connections, by Respondent .............................................................................. 7 Table 6. Intermodal Connections by Community ............................................................................... 8 Table 7. Facility Capabilities, by Respondent ...................................................................................... 9 Table 8. Facility Capability, by Community ...................................................................................... 10 Table 9. Equipment Availability by Respondent ................................................................................ 10 Table 10. Equipment Availability by Community .............................................................................. 11 Table 11. Ownership of Facilities, by Respondent ............................................................................ 12 Table 12. Juneau Docks and Harbors Enterprise Funds, Operating Revenues and Expenses,
Dollars, 2009 ............................................................................................................................. 13 Table 13. Sitka Harbor Enterprise Fund, Operating Revenues and Expenses, Dollars, 2009 .............. 14 Table 14. Whittier Small Boat Harbor Enterprise Fund, Operating Revenues and Expenses,
Dollars, 2008 ............................................................................................................................. 16 Table 15. Valdez Port and Harbor, Operating Revenues and Expenses, Dollars, 2008 ...................... 17 Table 16. Cordova, Port Enterprise Fund, Operating Revenues and Expenses, Dollars, 2009 ............ 17 Table 17. Port of Anchorage, Enterprise Fund Operating Revenues and Expenses, Dollars, 2009 ...... 19 Table 18. City of Homer, Port and Harbor Enterprise Fund Operating Revenues and Expenses,
Dollars, 2009 ............................................................................................................................. 20 Table 19. City of Unalaska, Ports and Harbors Enterprise Funds, Operating Revenues and
Expenses, Dollars, 2009 ............................................................................................................. 21 Table 20. City of Kodiak, Select Enterprise Funds, Operating Revenues and Expenses, Dollars,
2009 ......................................................................................................................................... 22 Table 21. Port of Bristol Bay, Operating Revenues and Expenses, 2009 ............................................ 23 Table 22. Bethel Municipal Dock, Operating Revenues and Expenses, 2009 .................................... 24

Baseline Assessment of Alaska’s Ports and Harbors
Final iii
Table 23. Marine Facility Improvement Cost Estimates, Bethel ......................................................... 25 Table 24. Saint Mary’s Port Operating Revenues and Expenses, 2008 .............................................. 26 Table 25. Nome Port Facility Enterprise Fund, Operating Revenues and Expenses, Dollars, 2009 ..... 27 Table 26. Nenana Port Authority (Airport and Marine Facilities), Revenues and Expenses, Dollars,
2008 ......................................................................................................................................... 30 Table 27. Southeast Port Needs ....................................................................................................... 31 Table 28. Southeast Harbor Needs .................................................................................................. 32 Table 29. Prince William Sound Port Needs ..................................................................................... 34 Table 30. Prince William Sound Harbor Needs ................................................................................ 34 Table 31. Southcentral Port Needs ................................................................................................... 35 Table 32. Southcentral Harbor Needs .............................................................................................. 35 Table 33. Southwest Port Needs ...................................................................................................... 36 Table 34. Southwest Harbor Needs ................................................................................................. 37 Table 35. Northwest Port Needs ...................................................................................................... 37 Table 36. Northwest Harbor Needs ................................................................................................. 38 Table 37. Interior Port Needs ........................................................................................................... 38 Table 38. Planned and/or Underway Projects Listed by Survey Respondents .................................... 42 Table 39. Projects Needed but Not Yet Planned, as Listed by Survey Respondents ........................... 49 Figure Page
Figure 1. Transportation Regions ........................................................................................................ 3

Baseline Assessment of Alaska’s Ports and Harbors
iv Final
Abbreviations
ADCCED Alaska Department of Commerce, Community, and Economic Development
ADOLWD Alaska Department of Labor and Workforce Development
ADOT&PF Alaska Department of Transportation and Public Facilities
AIDEA Alaska Industrial Development and Export Authority
CBJ City and Borough of Juneau
EDA U.S. Economic Development Administration
DCRA Division of Community and Regional Affairs
FY Fiscal Year
LNG Liquefied Natural Gas
NOAA National Oceanic and Atmospheric Administration
PILT Payment-in-lieu-of-taxes
SWAMC Southwest Alaska Municipal Conference
TIGER Transportation Investment Generating Economic Recovery
USACE U.S. Army Corps of Engineers

Baseline Assessment of Alaska’s Ports and Harbors
Final 1
1 Introduction
This analysis serves as a baseline assessment of the condition, function, and use of Alaska’s ports and harbors. The study is divided into three main sections. It begins by describing the regional distribution of infrastructure, then transitions into an overview of ownership and fiscal characteristics, and finishes with a description of current and foreseeable projects and needs. This study is based primarily on responses from a survey conducted by the U.S. Army Corps of Engineers (USACE) in late 2009 and early 2010. Results of the survey were intended for use in planning future port and harbor development within Alaska.
The survey results provide the basis for a regional analysis of existing infrastructure, attributes, and needs. Secondary material was used to supplement the survey and was sourced from USACE publications and relevant city and borough departments. Additional financial information was gathered from records of legislative appropriations, community audited financial statements, and community budgets.
For the purpose of this analysis, ‘port’ and ‘harbor’ are loosely defined; survey respondents categorized their own marine facilities and no strict criteria were applied. Ports generally refer to marine facilities that can handle large commercial vessels and are equipped with docks, dolphins, cranes, forklifts or other equipment used to move cargo or passengers in large volumes. Harbors typically provide shelter and services for vessels, and cater to community needs by providing boat slips, vessel storage space, boat ramps, etc.

Baseline Assessment of Alaska’s Ports and Harbors
2 Final
2 A Regional Analysis: Survey Results
In December of 2009 the USACE, in cooperation with ADOT&PF, sent surveys to 855 facility managers, port and harbor administrators, and other community stakeholders. Recipients were identified through several sources including the Alaska Association of Harbormasters and Port Administrators, the Waterborne Commerce Statistics Center, and the State of Alaska. The survey instrument consisted of 44 questions, and topics included facility location, type, ownership, and condition; intermodal connectivity; facility attributes and services; and view of state and federal policies. Responses to the survey were gathered from December 2009 through February 2010.
The quality of the responses varied greatly. Some surveys were completed fully while others were only partially complete. A few lacked basic information such as the name or location of the facility. Of the 300 surveys returned, 2 respondents did not list facility location and 33 did not list the facility name. This regional analysis omits the survey responses that did not list a facility location, reducing the total number of surveys analyzed to 298.
USACE Alaska District completed a preliminary analysis of their survey results in April 2010. The report, entitled “Alaska Regional Ports Facilities Survey Results,” discusses survey responses in detail and includes an analysis of results by both respondent and region. This study expands upon the initial regional analysis, focusing on facility and community responses by region. This approach highlights geographic trends and facilitates the grouping of infrastructure and needs by region1
2.1.1 Transportation Regions
.
Survey respondents were grouped into regions using the map2 Figure 1 shown in on the following page.
1 Several modifications were made to facilitate analysis of the data:
1. Unalaska and Dutch Harbor were grouped together.2. The Ocean Beauty Seafoods, LLC response, which listed location as “Nikiski, AK (plant) Docks in Kenai &
Kasilof” was modified to represent the community of Kasilof only. It was verified that the Nikiski location does not have a dock while Kenai and Kasilof both have docks. This was the only response from Kasilof. In an effort to represent the most communities possible while not double counting the response, it was listed for Kasilof only.
3. The Kenai LNG facility response was modified to represent Nikiski only. Nikiski is the actual location of the LNG marine facilities.
4. The location for “NOAA’s Little Port Walter” facility was changed from ‘remote site’ to “Little Port Walter” and assigned to Southeast Alaska. Little Port Walter is located 110 miles south of Juneau on Baranof Island.
2 A high resolution version of this map is available on the Alaska Regional Ports website at http://www.poa.usace.army.mil/en/cw/AKPortsStudy.htm.

Baseline Assessment of Alaska’s Ports and Harbors
Final 3
Figure 1. Transportation Regions
Source: USACE (2011).

Baseline Assessment of Alaska’s Ports and Harbors
4 Final
The 298 included responses were from the Alaskan communities listed in Table 1.
Table 1. Respondent Communities by Region
Southeast Southwest Yukon-Kuskokwim Southcentral
Angoon (2) Akhiok Aniak Anchorage (5)
Auke Bay (2) Akutan Anvik Glacier View
Coffman Cove Atka Bethel (4) Homer (4)
Douglas Cold Bay Chefornak Houston
Elfin Cove Dillingham (4) Kipnuk Kachemak
Glacier Bay National Park
Dutch Harbor/Unalaska (11)
Lower Kalskag Kasilof
Gustavus Igiugig Mekoryuk Kenai (4)
Haines (8) King Cove (8) Napaimute Lime Village
Hollis King Salmon (3) Napakiak Muddy Creek
Hoonah (8) Kodiak (14) Pilot Station Nikiski (2)
Hydaburg Larsen Bay (2) St. Mary's (2) Ninilchick
Juneau (20) Naknek (7) Stony River Palmer
Kasaan Newhalen Tuntutuliak Point MacKenzie
Ketchikan (21) Nondalton Tununuak Port Graham
Klawock Old Harbor (4) Upper Kalskag Tyonek
Kupreanof Pedro Bay Northwest Wasilla
Little Port Walter Perryville Allakaket InteriorMetlakatla (2) Platinum Cape Nome Anderson
Pelican (3) Port Alsworth Crooked Creek Chitina
Petersburg (8) Port Lions (2) Deering Copper Center
Point Baker Port Moller Elim Delta Junction
Port Alexander (2) Sand Point (2) Galena Eagle (2)
Port Protection St. George Island Gambell Fairbanks (3)
Saxman St. Paul Island (3) Huslia Lake Minchumina
Sitka (11) Togiak Kivalina Manley Hot Springs
Skagway (5) Prince William Sound Kotzebue McCarthy
Tenakee Springs (2) Cordova (11) Koyuk Nenana (2)
Thorne Bay Lake Louise Nome (2) North Pole
Whale Pass Seward (9) Nulato Tanana
Wrangell (4) Valdez (4) White Mountain Tetlin
Yakutat (2) Whittier (2) Wiseman Tok
Arctic
Barrow
Source: Northern Economics, Inc. using USACE, 2010Note: The number in the parenthesis indicates the number of surveys received from the community, if more than one.
In many cases, separate facilities within the same community submitted responses to the survey. In Southeast Alaska, for example, Juneau had 20 responses and Ketchikan had 21. As shown in Table 2,

Baseline Assessment of Alaska’s Ports and Harbors
Final 5
Prince William Sound submitted 27 responses from 5 separate communities. In all, the 298 responses came from 122 separate communities.
Table 2. Number of Survey Respondents by Region
Arctic Interior NorthwestPrince William
SoundSouthcent
ral Southeast SouthwestYukon-
Kuskokwim TotalIndividual Facilities
1 18 16 27 27 116 74 19 298
Communities 1 14 15 5 16 31 25 15 122
Source: Northern Economics, Inc. using USACE, 2010
2.2 Survey Results by Region
Survey response data were organized into responses by region, calculated as both a percentage of respondents and a percentage of communities. The two calculations address instances where a large number of respondents from a single community skewed the regional analysis.
In cases where a community has more than one respondent, answers may or may not agree with one another. For the purpose of the community response analysis, a positive response took priority. For example, four out of nine respondents in Seward noted rail access to their facility, so Seward is considered to have rail access in our community analysis. The same would have held true had only one facility in Seward reported having rail access.
2.2.1 Marine Assets, their functional role and operational capability
Questions 1 – 3 of the survey asked the respondent for facility name, location, and type. As shown in Table 3, of the five options provided (port, harbor, dock, mooring buoy, and other), most respondents described their facilities as docks. A significant percentage also indicated having no marine facilities. This may be indicative of a barge landing site and would be consistent with the responses received from communities located in the Northwest, the Yukon-Kuskokwim, and the Interior—areas which are shallow-draft and have little marine infrastructure. When docks are unavailable or non-existent, barges pull up directly onto beaches and cargo is unloaded to the shore. When the draft is too shallow to allow for barge service, cargo vessels moor offshore and lighter goods to the beach.

Baseline Assessment of Alaska’s Ports and Harbors
6 Final
Table 3. Marine Facilities by Respondent
RegionPorts Harbors Docks
Mooring Buoys and
Other Facilities
No Marine Facilities
No Response
Percent of Facility Types by RespondentSoutheast 7 25 46 21 1 1Prince William Sound 7 15 63 11 4 0Southcentral 18 11 33 11 22 4Southwest 8 20 45 15 11 1Yukon-Kuskokwim 0 0 37 21 37 5Northwest 6 6 6 19 56 6Arctic 0 0 0 100 0 0Interior 11 0 6 28 56 0Source: Northern Economics, Inc. using USACE, 2010Note: No Response represents respondents who answered false to all options presented for facility type,including No Marine Facilities.
The analysis of marine facilities by community (rather than respondent) as shown in Table 4 supports the finding that communities in the Northwest, Yukon-Kuskokwim and the Interior have a smaller percentage of marine facilities than other regions. Many communities in these areas rely on summer barge service and tend to be small in population. The brief period of accessibility, small number of residents and high construction costs hinder the construction of marine infrastructure.
Table 3 shows that only a small percent of respondents in the Southeast, Southwest, and Prince William Sound regions are ports. Table 4 paints a different picture by showing that between 16 and 20 percent of the respondent communities in these regions have ports. In Alaska, most communities are not large enough to support more than one port. In remote areas, one port facility often serves as a regional hub for distribution to several smaller communities. Therefore, a small number of port respondents is not necessarily indicative of a need for more ports.
Table 4. Marine Facilities by Community
RegionPorts Harbors Docks
Mooring Buoys and
Other Facilities
No Marine Facilities
Percent of Respondent Communities with Facility TypesSoutheast 16 45 61 42 3Prince William Sound 20 40 100 40 20Southcentral 19 6 44 19 38Southwest 16 36 56 28 32Yukon-Kuskokwim 0 0 33 20 47Northwest 7 7 7 20 60Arctic 0 0 0 100 0Interior 7 0 7 29 64Source: Northern Economics, Inc. using USACE, 2010Note: Rows do not total to 100 percent because a community may have more than one type of facility.

Baseline Assessment of Alaska’s Ports and Harbors
Final 7
2.2.2 Intermodal Connections
Survey questions 4 – 6 asked the survey respondent to name their facility operator and list the name and distance to the nearest marine facility. This information was used to support the data analysis for other variables.
Survey questions 7 – 14 addressed issues of transportation connectivity. Respondents were asked about available road, rail, and air transportation linkages. Many responses to this question were blank, which was interpreted as an indication that the facility did not have connective roads or rail to another community.
Table 5 summarizes the responses to the intermodal questions by region and respondent. Almost half of the communities in the Northwest, the Yukon-Kuskokwim and the Interior regions did not indicate a road connection to another community, reflecting the fact that these regions have a limited amount of road and rail infrastructure.
Table 5. Intermodal Connections, by Respondent
Region
Road Network
Rail Connection
Connected to rail and
outside road or highway
Trans-shipment of
cargo to alternative transporta-tion mode
Not connected to outside
communities
Directly connects facility to one or more
outside communities
Connected to state highway or
other major highway system
Percent of Facilities with Intermodal ConnectionsSoutheast 58 27 12 2 2 28Prince William Sound 41 4 52 22 22 30Southcentral 15 4 59 19 19 44Southwest 78 8 0 0 0 38Yukon-Kuskokwim 47 11 0 0 0 32Northwest 38 0 0 0 0 25Arctic 100 0 0 0 0 0Interior 11 0 33 11 0 17Source: Northern Economics, Inc. using USACE, 2010
The high percentage of Southeastern and Southwestern respondents that report not being connected to outside communities is explained, in great part, by the geography of these regions. In the Southeast and Southwest regions most communities are on islands, limiting road access to outside communities. The story is similar in the Arctic; the geography of the region and the high cost of road construction to small communities limit road construction. Prudhoe Bay is the only Arctic community with road access to outside communities and no responses were received from this location.
Table 6 illustrates the results of the community intermodal analysis. Twelve of the 122 communities that responded to the intermodal questions had individual facilities that submitted contradicting information; some respondents claimed a connection to outside communities and/or highways while others stated they were not connected to outside communities. The 12 communities where this happened were in four different regions: Prince William Sound (Valdez), Southcentral (Anchorage and Kenai), Southeast (Haines, Juneau, Ketchikan, Sitka, and Skagway), and Southwest (King Salmon, Kodiak, Naknek, and St. Paul Island).

Baseline Assessment of Alaska’s Ports and Harbors
8 Final
Discrepancies in the Southeast and Southwest are explained, at least in part, by the respondents’ interpretations of an outside community. In Juneau, for example, 8 respondents claimed that there are no roads connecting to any outside communities while 12 attested that there were roads connecting to outside communities. Juneau is connected to the unincorporated town of Douglas via the Juneau-Douglas Bridge. Some Juneau residents may consider Douglas a separate community while others consider it an extension of the same community. Similar situations exist with Ketchikan, Sitka, and the Southwest communities listed above.
Table 5 revealed that 41 percent of respondents from the Prince William Sound do not have road access to outside communities. These results are misleading; the figures are skewed by the reporting sample. The community analysis shown in Table 6 paints a more accurate picture. Only one of the five respondent Prince William Sound communities reported not being connected to an outside community. Cordova, which represents 11 of the 27 responses from the region, is accessible only by air and water.
Table 6. Intermodal Connections by Community3
Region
Road Network
Rail Connection
Trans-shipment of
cargo to alternative
transportation mode
No roads connecting to any
outside communities
Connected to one or more outside
communities
Connected to state highway or other major highway
systemPercent of Communities with Intermodal Connections
Southeast 55 19 19 3 39Prince William Sound 20 0 80 40 13Southcentral 19 0 44 6 38Southwest 56 12 0 0 40Yukon-Kuskokwim 40 7 0 0 20Northwest 33 0 0 0 20Arctic 100 0 0 0 0Interior 14 0 29 1 2Source: Northern Economics, Inc. using USACE, 2010
Much like the road variables, the percentage of rail connections in Prince William Sound as shown in Table 5 (22 percent) is also skewed by the numbers of respondents from each location. In this case Table 5 somewhat understates the reality; Table 6 shows that 40 percent of the respondent communities from this region have rail access. Both Whittier and Seward transfer cargo and cruise vessel passengers to and from the Alaska Railroad. These two communities submitted 11 of the 27 responses from the region, with 6 of the 11 facilities reporting rail access.
Regional transshipment points in Alaska are sometimes referred to as hubs. Hubs either develop or are selected because of carriers’ terminal costs, geographic location, port physical and technical infrastructure, and port management and administration (Lirn, et al 2004). As shown in Table 6, few port hubs exist in the Arctic and the Interior. Most community respondents that transship cargo to 3 Individual facilities within the same community often reported having different types of road connectivity; in these instances, the highest level of road accessibility is counted to display the maximum capability of a given location. For example, one out of five facilities in Anchorage reported being connected to one or more outside communities while the remaining four respondents reported being connected to outside communities and a state highway. In the community analysis, Anchorage is counted as having highway access.

Baseline Assessment of Alaska’s Ports and Harbors
Final 9
alternative transportation modes are in Southwest, Southcentral, and Southeast Alaska. Each of these regions has their major transshipment point; in the Southwest, Unalaska/Dutch Harbor handles large volumes of seafood, in Southcentral, Anchorage is the dominant port for cargo and fuel, and in the Southeast, Juneau and Ketchikan are heavily used by barge companies for general cargo deliveries. Regional hubs in Alaska are discussed further in the Regional Hubs White Paper.
2.3 Facility Attributes and Services
Survey question 15 asked the respondent to provide details about the attributes and services available at their facility. Respondents were asked to review a list of services and equipment and check off the relevant items. Choices were non-exclusive; a respondent could have checked some, all, or none of the options offered, or could have filled in a unique response. Table 7 shows the responses received.
Table 7. Facility Capabilities, by Respondent
Region
Receipt or shipment of cargo
by waterRoll on/Roll off
capability Cruiseship dockAccess to State
FerryPercent of Facilities with Capability
Southeast 43 10 16 28Prince William Sound 52 15 22 15Southcentral 59 19 26 15Southwest 66 12 11 26Yukon-Kuskokwim 42 11 0 0Northwest 25 6 6 0Arctic 0 0 0 0Interior 17 0 0 0
Source: Northern Economics, Inc. using USACE, 2010
A large number of respondents report the receipt or shipment of cargo by water. As confirmed by the community analysis in Table 8, waterways are particularly important in the Southeast, Prince William Sound, Southcentral, and Southwest. These regions contain the population centers of the state; each depends heavily on water transportation for the movement of general cargo, building materials, and petroleum. Anchorage, located in the Southcentral region, is the primary gateway for goods coming into the state.
These regions also see high volumes of outgoing commodity volumes. Seafood (Southeast and Southwest), crude oil (Prince William Sound), and ore and timber (Southeast) are exported both abroad and to the Lower 48 via barge and vessel.
Table 8 highlights the large percentage of Southeast communities that have cruiseship docks relative to the rest of the state. The largest cruise vessel ports of call are located in this region. Ports in the Southeast are popular with tourists as they offer glaciers, wildlife, and scenic beauty, while also being closest to the Lower 48. Cruise lines are able to schedule 7 to 10 day round-trip itineraries from Seattle and Vancouver, B.C., or elsewhere on the West Coast. Those cruises that begin or end in Alaska usually start in Whittier or Seward and also transit through Southeast.
Access to the Alaska Marine Highway System is most prevalent in the Southeast and Southwest regions. Both areas are largely comprised of remote coastal communities where road access is unavailable. Residents depend on the state ferry system for both personal and cargo transportation.

Baseline Assessment of Alaska’s Ports and Harbors
10 Final
Table 8. Facility Capability, by Community
Region
Receipt or shipment of cargo
by waterRoll on/Roll off
capability Cruiseship dockAccess to State
FerryPercent of Communities with Capability
Southeast 61 26 32 52Prince William Sound 80 30 13 15Southcentral 50 13 19 6Southwest 60 12 12 28Yukon-Kuskokwim 27 7 0 0Northwest 20 7 7 0Arctic 0 0 0 0Interior 61 26 32 52Source: Northern Economics, Inc. using USACE, 2010
2.3.1 Equipment Availability
The analyses of equipment availability by respondent and community as shown in Table 9 and Table 10 produce similar results. Cranes, boat haul outs and launch ramps are the most widely distributed equipment types while container cranes are least common.
Table 9. Equipment Availability by Respondent
RegionTravel Lift Crane
Container Crane
Boat Haul Out Boat Grid
Boat Launch Ramp
Percent of Facilities with Equipment Available
Southeast 11 34 14 19 27 30Prince William Sound 19 44 0 7 15 22Southcentral 4 56 15 11 19 33Southwest 15 41 9 26 16 38Yukon-Kuskokwim 5 26 0 26 0 11Northwest 0 6 0 6 0 6Arctic 0 0 0 100 0 100Interior 6 11 0 11 0 39Source: Northern Economics, Inc. using USACE, 2010
4 The research team is unaware of any community in Southeast Alaska with a true container crane. This response was received from the Port of Skagway and is likely for a crawler crane used to move containers. The Port’s website notes intent for the Ore Dock to be outfitted for the installation of a modern container crane (Municipality of Skagway 2010a).

Baseline Assessment of Alaska’s Ports and Harbors
Final 11
Table 10. Equipment Availability by Community
RegionTravel Lift Crane
Container Crane
Boat Haul Out Boat Grid
Boat Launch Ramp
Percent of Facilities with Equipment AvailableSoutheast 16 39 3 35 55 52Prince William Sound 40 20 0 10 4 10Southcentral 6 50 6 19 13 38Southwest 20 40 20 32 20 52Yukon-Kuskokwim 7 13 0 20 0 13Northwest 0 7 0 7 0 7Arctic 0 0 0 100 0 100Interior 7 7 0 14 0 36Source: Northern Economics, Inc. using USACE, 2010
Container cranes are concentrated in Southcentral and Southwest; Anchorage is Alaska’s major container port for general goods and cargo while Unalaska/Dutch Harbor is the state’s major consolidation point for containerized seafood. Kodiak, another major seafood processing center, also has a container crane.
Boat haul outs, grids, and launch ramps are primarily used by smaller watercraft. These facilities were not intended for large cruise vessels, container vessels, catcher-processors, or larger fishing vessels, but rather are needed in areas where commercial and recreational vessels are frequently stored or transported. The high percentages of communities in the Southeast and Southwest regions with boat haul outs, grids, and launch ramps are a result of geography and the local economy. As mentioned previously, many of these coastal communities have limited road access and rely heavily on boats for both transportation and their livelihoods, including commercial and sport fishing.

Baseline Assessment of Alaska’s Ports and Harbors
12 Final
3 Regional Analysis of Ownership and Fiscal Characteristics
This section discusses the ownership and fiscal characteristics of facilities within each region of Alaska. Each region is briefly described, and details regarding specific port and harbor finances, projects, and funding sources are presented. Communities included in this section are but a small sample of those which responded to the survey; the list is not comprehensive. The facilities were chosen to provide insight as to the status and governance of facilities typical of each region.
As the analysis was conducted, some financial trends came to light. It appears that most Alaskan communities with publicly owned port and harbor infrastructure run their facilities as enterprise funds. Enterprise funds are business-like entities expected to support their operations through charges levied for services. The majority of enterprise funds reviewed in this study included their depreciation expense as part of their operating costs; in almost all cases, the burden of depreciation outweighed revenues, resulting in operational losses for port and harbor facilities.
It should be mentioned that port and harbor operating revenues are direct charges for goods and services and do not include indirect revenues generated for the community through taxes. Seafood sales tax, general sales tax, fisheries business tax, fisheries resource landing tax, etc. are, at least in part, indirectly attributable to the provision of public port and harbor facilities. Though individual ports and harbors show operating losses, they may provide substantial financial gains for the communities in which they reside.
3.1 Ownership
The USACE Regional Ports survey asked respondents to categorize their facility ownership as either public or private. Table 11 summarizes the responses received from this question. Some facilities that reported private ownership are publicly owned but have restricted access or a long-term, exclusive use agreement with a private operator. This discrepancy is attributed to interpretation of ownership as meaning management or accessibility.
Table 11. Ownership of Facilities, by Respondent
RegionNumber of
Respondents
Private Public No Response
Count Percent Count Percent Count PercentSoutheast 116 33 28 79 68 4 3Prince William Sound 27 12 44 13 48 2 7Southcentral 27 10 37 11 41 6 22Southwest 74 24 32 40 54 10 14Yukon-Kuskokwim 19 2 11 7 37 10 53Northwest 16 1 6 5 31 10 63Arctic 1 0 0 1 100 0 0Interior 18 0 0 7 39 11 61
Source: Northern Economics, Inc. using USACE, 2010
Of the survey responses received, 82 were from privately owned facilities and 163 were from publicly owned facilities. Over half (58 percent) of the collective respondents from the Northwest, Yukon-Kuskokwim, and Interior did not respond to the ownership inquiry. This corresponds to the high

Baseline Assessment of Alaska’s Ports and Harbors
Final 13
number of respondents from these regions that reported not having marine facilities (49 percent); in many of these communities, there is no facility to own.
3.2 Southeast
The economy of Southeast Alaska can be divided into two main sectors. The first sector is based on the City and Borough of Juneau and is driven by government activity and Juneau’s role as a regional service and transportation hub. The second sector is based in other Southeast communities and is driven by commercial fishing and tourism (Colt 2007). Some economic activity continues to be generated by timber harvesting on private lands, but overall the economic contribution of forestry to the Southeast economy has decreased sharply over the last decade.
Ownership and investment in marine infrastructure in Southeast Alaska has been funded thorough a mixture of public and private resources that vary by community. The major cruise vessel destinations of Juneau, Ketchikan, and Skagway have financed large dock projects using both public and private investment. The Alaska Marine Highway System provides transportation for passengers and goods through a combination of passenger and vehicle fares and contributions from the state general fund. Private businesses such as Alaska Marine Lines, Alaska General Seafoods, Trident Seafoods, Taku Oil Sales, Inc., and Angoon Oil and Gas Co. reported operating private facilities in the Southeast used for the transportation of commercial goods such as seafood, petroleum, and general cargo. Secondary research confirmed that these businesses own or lease facilities in the region (USACE 2003).
3.2.1 City and Borough of Juneau
Juneau is Alaska’s capital and the largest community in Southeast. The City and Borough of Juneau (CBJ) is home to 30,700 people and sits within the Inside Passage, approximately 900 miles northwest of Seattle and 600 miles southeast of Anchorage (ADCCED 2010). Juneau’s marine facilities are extensive, offering large and small cruise vessel berths, a ferry terminal, and numerous harbors and floats.
The USACE received 20 survey responses from Juneau. Three of the 20 survey responses indicated private facilities owned by fuel, seafood, and logistics companies. Additional privately owned facilities in Juneau include two of the four large cruise vessel berths and various small vessel docks.
The State of Alaska and CBJ own a large number of the marine facility assets in Juneau (USACE 2003). CBJ facilities are run by the Juneau Docks and Harbors Department, which is managed by a nine person citizen board appointed by the CBJ assembly. The CBJ runs its harbors and docks as separate enterprise funds (CBJ 2009). Table 12 highlights the enterprise funds’ operating revenues and expenses for FY 2009 as presented in the CBJ 2009 Comparative Statements of Revenues, Expenses, and Changes in Net Assets.
Table 12. Juneau Docks and Harbors Enterprise Funds, Operating Revenues and Expenses, Dollars, 2009
Functions/Programs Operating RevenuesOperating Expenses
and Depreciation Net Operating Income Boat Harbors 2,630,220 3,445,202 (814,982)Docks 1,762,619 2,126,482 (363,863)Source: CBJ (2009)

Baseline Assessment of Alaska’s Ports and Harbors
14 Final
The Boat Harbor and the Docks are individual business-type activities intended to be financially self-sufficient. Charges levied for user fees, lease fees, fisheries business taxes, state and federal grants, and specific local taxes are used to finance the departments. No funds come from local property or sales tax subsidies (CBJ 2010). User fees do not include the CBJ’s marine vessel passenger fees, which produced $5,062,231 in revenue for the CBJ in 2009 (CBJ 2009).
The CBJ Docks and Harbors Department is currently moving forward on a plan to expand Juneau’s most heavily used facility, Statter Harbor. According to Port Director John Stone, between 35,000 and 40,000 people took tours out of the harbor in 2009 (Martin 2010). The project’s recently released draft Environmental Assessment was a cooperative effort between the Docks and Harbors Department and the Alaska Department of Fish and Game. At this time, total funding for the $20 million project is uncertain. In 2005, voters approved a total of $7.5 million (Martin 2010). Federal funds are expected from the Federal Aid in Sport Fish Restoration Act and from state matching funds via the grant administrator, U.S. Fish and Wildlife Service (CBJ 2010a). Some state funds were expected from the state’s docks and harbors grant fund, but half of the $10 million appropriated to the fund was cut this year (Forgey 2010).
3.2.2 Sitka
The City and Borough of Sitka is substantially smaller than Juneau, with 8,600 residents. Sitka operates and maintains five boat harbors, with customers including commercial fishing, recreation, and charter vessels, as well as yachts (City and Borough of Sitka 2010). Unlike most other major ports of call for cruise vessels in Southeast, Sitka does not have a cruise vessel dock. Instead, passengers are lightered from vessels moored outside of the harbor.
Sitka submitted eleven responses to the USACE survey, most of which came from public facilities. The City of Sitka reported owning seven of the facilities and the State of Alaska reported owning one, the Sitka Ferry Terminal.
The City and Borough of Sitka operates its harbor facilities as an enterprise fund. Revenue primarily comes from moorage fees, which amounted to $1,347,807 in 2009. Approximately $759,000 worth of depreciation was charged to the Harbors Enterprise Fund in 2009 (City and Borough of Sitka 2009). As shown in Table 13, the Harbors Enterprise Fund is operating at a loss.
Table 13. Sitka Harbor Enterprise Fund, Operating Revenues and Expenses, Dollars, 2009
Functions/Programs Operating RevenuesOperating Expenses
and Depreciation Net Operating IncomeHarbors Enterprise Fund 1,698,769 2,274,947 (576,178)Source: City and Borough of Sitka (2009)
Despite the loss noted above, in 2009 the enterprise fund’s net assets increased by $0.7 million. The operating loss is offset from outside sources related to vessels using the harbor, such as the raw fish tax, resulting in a positive net income (City and Borough of Sitka 2010).
Within the last decade, ADOT&PF oversaw federal contributions for dock, harbor, and pedestrian improvements in Sitka. Some funds were allocated directly to projects while others were channeled through programs such as the ADOT&PF Community Transportation and Surface Transportation Programs (State of Alaska 2009). Additional funds for marine infrastructure were provided through the Denali Commission, the Division of Community and Regional Affairs (DCRA), and the Department of Commerce, Community and Economic Development (DCCED 2010).

Baseline Assessment of Alaska’s Ports and Harbors
Final 15
3.2.3 Pelican
Pelican is a small fishing community located within the Sitka recording district. It is home to 120 people who rely on local fisheries as commercial and subsistence resources. Inter-community road access is unavailable in Pelican and the primary forms of transportation in this community are float planes and the Alaska Marine Highway System ferry (ADCCED 2010).
The three survey responses received from Pelican were all from the publicly owned boat harbor. Unlike Juneau and Sitka, the City of Pelican does not operate its public boat harbor as an enterprise fund. Harbor revenues and expenses are paid through the city’s general fund. In fiscal year 2009, the harbor generated income of $64,143, more than 60 percent above what was budgeted (City of Pelican 2009).
According to the state’s capital enacted appropriations data, Pelican received funding to upgrade its facilities between 2001 and 2005. Listed projects were overseen by the ADOT&PF and improvements included upgraded terminal mooring structures and dolphins, as well as a renovation of the harbor.
3.3 Prince William Sound
The economy of Prince William Sound depends upon the petroleum, seafood, and tourism industries. The close link to petroleum comes from the location of the terminal for the Trans-Alaska Pipeline System (TAPS). TAPS transports crude oil 800 miles from Prudhoe Bay on the North Slope down to the Valdez Marine Terminal (VMT) in Prince William Sound. The VMT is the ice-free port from which the crude is shipped to the Lower 48 for refining. The VMT employs approximately 320 people directly, and contributes indirect jobs and significant tax revenues to the region (Alyeska 2010).
Both seafood and tourism are supported by the rich waters of the Gulf of Alaska that flow into the Sound. The ecosystem supports commercial fishing for species like salmon, halibut, and shrimp; it also provides a food source for marine mammals such as whales, otters, and sea lions. Tour operators attract visitors with advertisements for wildlife and glacier viewing, as well as outdoor activities like sport fishing and kayaking. Road and rail connections are utilized through packages for cruise-and-coach tours and rail-and-cruise packages.
3.3.1 Whittier
Whittier sits on the west side of Prince William Sound, 60 miles south of Anchorage off of the Seward Highway. The community is unique in that road and rail access to Whittier are only available through a 2.5-mile tunnel that is shared between the two transportation modes—daily rail and road traffic alternate use of the tunnel based on a set schedule. The city’s resident population is 160, while annual visitor counts are estimated at over 700,000, dwarfing the local population (ADCCED 2010; City of Whittier 2010). Whittier serves as a transfer point for cruise vessel passengers moving from vessel to railroad and vice versa. State figures show more than 200,000 cruise vessel passengers arriving in Whittier each year between 2005 and 2009 (Department of Revenue 2010), which accounts for about 30 percent of annual visitors.
There are ten recorded piers, wharves and docks in Whittier, most of which are owned by the City of Whittier, the State of Alaska, or the Alaska Railroad Corporation (USACE 2005). Private facilities include a float owned by CIRI Alaska Tourism and a private cruise vessel dock. Whittier uses its marine facilities to accommodate ferry passengers, cruise vessel passengers, general cargo, and small commercial and recreational vessels. Whittier has a long wait list for permanent moorage in the harbor. Its proximity to Anchorage and its northern access to Prince William Sound make it a popular port.

Baseline Assessment of Alaska’s Ports and Harbors
16 Final
The City of Whittier operates its small boat harbor facilities as an enterprise fund. The most recently available audited financial statements show the small boat harbor operating at a loss.
Table 14. Whittier Small Boat Harbor Enterprise Fund, Operating Revenues and Expenses, Dollars,
2008
Functions/Programs Operating RevenuesOperating Expenses
and Depreciation Net Operating Income Small Boat Harbor 1,077,808 1,191,934 (114,126)
Source: City of Whittier (2008)
Small boat harbor revenues consist mostly of preferential and transient moorage, generating $463,000 and $396,000 in 2008, respectively. The expenses noted in Table 14 include $274,000 in depreciation (City of Whittier 2009).
The state’s Capital Project Database shows three major waterfront projects taking place in Whittier over the last decade. ADOT&PF led projects to improve the ferry terminal, USACE funded the design and construction of a breakwater, and the City of Whittier received a legislative grant administered by the DCRA for boat harbor and waterfront development (DCRA 2010). Two survey responses were received from facilities in Whittier—one from the privately owned CIRI dock, and the other from the Alaska Railroad barge slip. The CIRI dock did not list any existing or future projects. The barge slip is currently converting their stern road ramp from a rail-only ramp to a rail and forklift traffic ramp. The project is expected to cost $4 million and will be finished this year.
3.3.2 Valdez
Valdez is a city of 4,500 residents located on Prince William Sound and is well known for being the southern terminus of the Trans-Alaska Pipeline. Valdez’s economy relies heavily on this link; large tax revenues and hundreds of local jobs are generated by the pipeline and terminal (ADCCED 2010). In addition to the petroleum industry, both commercial fishing and tourism contribute to the economy.
Private ownership of facilities in Valdez is concentrated in the petroleum industry. Of the 21 reported piers, wharves, and docks in Valdez, 8 (or 38 percent), are owned by the Alyeska Pipeline Service Company and are used for the storage and transportation of petroleum and related equipment (USACE 2005). In addition to Alyeska, Petro Star uses the Valdez Petroleum Terminal to transport jet fuels, marine diesels, home heating oil, and turbine fuels. Customers include the Air Force, Coast Guard, and the Anchorage Airport (Petro-Star Inc., 2010). Those facilities not involved in petroleum distribution transport seafood, general cargo, and passengers.
Four survey responses were received from Valdez. Three reported private ownership and one reported public ownership. None of the facilities listed planned or ongoing projects, though one of the private sector respondents did indicate a need to complete the sheet pile installation for their dock and expected the project to cost $500,000. No estimated year of completion was supplied.
The City Dock, ferry terminal, small boat harbor, and container terminal are owned by either the City of Valdez or the State of Alaska (USACE 2005). Valdez does not operate its port or harbor as an enterprise fund; both are included as governmental activities of the city (City of Valdez 2009). The operating revenues and expenses of the Port and Harbor are outlined in Table 15.

Baseline Assessment of Alaska’s Ports and Harbors
Final 17
Table 15. Valdez Port and Harbor, Operating Revenues and Expenses, Dollars, 2008
Functions/ProgramsOperating Revenues
Operating Expenses
Depreciation Net Operating Income
Port 393,498 504,091 1,227,829 (1,338,422)Harbor 806,634 788,163 423,094 (404,623)
Source: City of Valdez (2008).
In 2008, depreciation of the city’s port assets was a significant expense, more than doubling other operating expenses.
Approximately $40 million worth of marine infrastructure in Valdez has been renovated, upgraded, or constructed since 1999. In the past two years alone, dock and harbor improvements totaled $8.3 million. This includes a legislative grant for $3.3 million for City Dock enhancements; $800,000 for an information and interpretive center at the City Dock, $2.0 million for harbor and uplands development, $1.7 million for cruiseship dock renovations, and $500,000 for a small boat harbor expansion. According to the Capital Projects Database, the DCRA was the lead agency on all of the recent projects. In the past, ADOT&PF, the U.S. Economic Development Administration (EDA) and the USACE have also been leading agencies (State of Alaska 2010; DCRA 2010).
3.3.3 Cordova
Cordova is located 150 miles southeast of Anchorage on the east side of Prince William Sound. It is home to 2,100 people, a large percentage of whom work in the seafood industry. The city supports several processing plants and fishing fleets, and many residents hold commercial fishing permits (ADCCED 2010). Unlike Whittier and Valdez, Cordova is not accessible by road or rail and transportation is restricted to plane or boat.
Eighteen piers, wharves, and docks are recorded for Cordova (USACE 2005). Cordova submitted eleven responses to the USACE survey, the largest number of survey responses from any community in the Prince William Sound. Respondents included seafood processors with private facilities and numerous public facilities. Of the eleven responses that were submitted to the survey, three came from facilities not included in the eighteen listed by the USACE.
The City of Cordova’s small boat harbor facility has enough capacity for 727 boats and is equipped with two tidal grids, two launch ramps, and a travel lift. The city’s port consists of three docks, each of which is used for a different purpose. The Municipal Dock is the main commercial facility, the City Dock is used for transfer of light freight and fishing gear, and the T-Dock is used for moorage of a buoy tender (City of Cordova 2010a).
Cordova combines the operations of its port and harbor into one department consisting of 6 full-time employees and some seasonal help. The city accounts for the two operations in a single Port Enterprise Fund. Table 16 outlines the fund’s operating revenues and expenses.
Table 16. Cordova, Port Enterprise Fund, Operating Revenues and Expenses, Dollars, 2009
Functions/Programs Operating RevenuesOperating Expenses
and Depreciation Net Operating Income Port Enterprise Fund 931,498 1,459,834 (528,336)
Source: City of Cordova (2009).

Baseline Assessment of Alaska’s Ports and Harbors
18 Final
The majority of Cordova’s operating revenue comes from slip fees ($703,173) which are levied at $30.75 per foot per year (City of Cordova 2010; City of Cordova 2010a). Rents, leases, and storage fees generated an additional $112,678. The largest operating expenses borne by the fund were for depreciation ($629,424) and salaries and benefits ($432,498) (City of Cordova 2010).
Investment in marine infrastructure as tracked by the state Capital Project Database shows relatively few (five) marine infrastructure projects to have taken place in Cordova in recent years. The most significant marine infrastructure related capital expenditure in the last decade was the construction of a $3 million dock, staging area, and access road for the Eyak/Shepard Point oil spill recovery facility in 2001. Since then, a total of $1.2 million has been spent on breakwater design and boat haul out facilities. Lead agencies on these projects were the DCRA, Denali Commission, and EDA (DCRA 2010).
3.4 Southcentral
Southcentral Alaska is the most populous region of the state. The region includes the Municipality of Anchorage, the Matanuska-Susitna Borough, and the southern and eastern portions of the Kenai Peninsula Borough. Most communities in this region have well developed transportation networks and are accessible by major highway or road.
The economy of the Southcentral region is diverse and well developed compared with other regions of the state. The Municipality of Anchorage is home to more than 40 percent of the state’s population and functions as the financial, commercial, and cultural center of Alaska. Anchorage also serves as the major distribution center for cargo entering the state; general cargo, construction materials, and fuel are channeled through Anchorage for distribution via road, rail, and air connections (ADOLWD 2010). The Matanuska-Susitna Borough (MSB), which lies north of Anchorage, is the fastest growing region of the state and the state’s leading agricultural area. The Kenai Peninsula Borough, just south of Anchorage, has an economy based on seafood harvesting and processing, tourism, and the oil and gas industry (ADOLWD 2010).
3.4.1 Anchorage
The Municipality of Anchorage is home to 291,000 residents and is the most populated municipality in Alaska. It is the center of commerce for the state and functions as the gateway for general cargo. The Port of Anchorage handles 85 percent of the general cargo for the railbelt area; goods arriving by containership and barge are distributed across the state using road, rail, and air transportation networks (ADCCED 2010).
Five survey responses were received from facilities in Anchorage, four of which were from facilities at the Port of Anchorage. The fifth survey respondent is the North Star Terminal/Anderson Dock located 0.5 miles south of the Port of Anchorage. Though the facility described itself as being privately owned, secondary research shows that it is owned by the Alaska Railroad Corporation and is privately operated by North Star Terminal & Stevedore Company (USACE 2005).
Within Anchorage there are ten piers, wharves, and docks on record with the USACE, all of which are within one mile of Ship Creek. The purpose descriptions of the facilities in Anchorage reflect the municipality’s role as a general cargo gateway: three of the facilities specialize in the receipt and shipment of containerized general cargo, two are for the receipt of sand, gravel, and bulk cement, two are intended for receipt and shipment of petroleum products, and one is for the mooring of tugs (USACE, 2005).

Baseline Assessment of Alaska’s Ports and Harbors
Final 19
The Northland Services Dock is the only Anchorage marine facility recorded under private ownership. The remaining nine are owned by the Municipality of Anchorage or the Alaska Railroad and are run entirely or in conjunction with private companies. Some companies lease the property and operate as a private facility would (e.g. Cook Inlet Tug & Barge Company, Inc.), while others conduct their operations in conjunction with the Port of Anchorage. (e.g., Totem Ocean Trailer Express, Inc. and Horizon Lines, Inc.), (USACE 2005).
The Port of Anchorage is run by the municipality as a major enterprise fund. As with many local governments in Alaska, the municipality is finding it difficult to cover its annual depreciation expense with operating revenues and is currently operating at a loss. Table 16 presents the port’s 2009 operating revenues and expenses.
Table 17. Port of Anchorage, Enterprise Fund Operating Revenues and Expenses, Dollars, 2009
Functions/Programs Operating RevenuesOperating Expenses
and Depreciation Net Operating Income Port Enterprise Fund 9,685,523 9,779,474 (93,951)
Source: Municipality of Anchorage (2009).
The port’s depreciation and amortization costs were $4.7 million in 2009 and accounted for nearly half of all operating expenses (MOA 2010).
The Port of Anchorage is currently undergoing a major intermodal expansion project. Plans include road and rail extensions as well as redevelopment of the marine terminal. The improvements are expected to stimulate the local and regional economies by allowing for the accommodation of larger cargo and passenger vessels, supporting new military requirements, enhancing intermodal transportation systems and serving a wider range of users (Port of Anchorage 2010). Project funding is primarily administered by the USDOT Maritime Administration, and includes money from grants, port profits, port revenue bonds, and federal funding. Federal funds are paying for more than half of the total project costs (Port of Anchorage 2010).
3.4.2 Homer
Homer is a city of 5,600 people on the southwestern edge of the Kenai Peninsula, 230 road miles south of Anchorage. The city is accessible by water, air, and road. It sits at the terminus of the Sterling Highway and is used as a jumping off point for more remote destinations like Kachemak Bay State Park and Lake Clark National Park and Preserve (ADCCED 2010). Homer is also the starting port for Alaska Marine Highway System service to Kodiak and communities as far west as Unalaska.
Homer’s economy depends mostly on the seafood and tourism industries. Homer’s port and harbor support both commercial and sport fishing activity in the lower Kenai Peninsula. The city is the number one commercial halibut port in Alaska for pounds landed (City of Homer 2010a). The city’s marine facilities include the Small Boat Harbor, the Fish Dock (offering eight cranes), an ice plant, a five-lane boat launch ramp, and a barge/landing craft loading ramp, as well as the Deep Water Dock, the Pioneer Dock, mooring dolphins, and buoys (City of Homer 2010b). In addition to fishing vessels, Homer’s marine facilities accommodate large cruise vessels, recreational craft, and boats used by local tour operators.
Homer has a total of eight piers, wharves, and docks recorded by the USACE. The City of Homer owns six of the eight listed; the remaining two are owned by Petro Marine Services (USACE, 2005). The four survey responses received from Homer were from publicly owned facilities.

Baseline Assessment of Alaska’s Ports and Harbors
20 Final
Homer combines the operations of its port and harbor into a single enterprise fund. The fund had an operating loss of $1.46 million in 2009, as shown in Table 18.
Table 18. City of Homer, Port and Harbor Enterprise Fund Operating Revenues and Expenses, Dollars, 2009
Functions/Programs Operating RevenuesOperating Expenses
and Depreciation Net Operating Income Port of Homer 3,347,738 4,793,655 (1,445,917)
Source: City of Homer(2009).
Operating revenues increased by $150,000 in 2009, but were offset by expense increases of $308,000. The city attributed the increased expenses to rising utility and fuel costs. Port of Homer expenses included $2.1 million for operations, $1.2 million for administration, and $1.46 million for depreciation (City of Homer 2010).
The state’s Capital Funding Database shows ten marine infrastructure related projects to have taken place in Homer over the last decade. The largest of these were a $3.1 million dollar project led by EDA in 2000 for dock repair, and a recently approved $2 million dollar project to construct a pathway for the ferry terminal and cruise vessel dock. All other dock and harbor projects were below $500,000. Lead agencies on these projects included ADOT&PF, DCRA, USACE, EDA, Alaska Industrial Development and Export Authority (AIDEA), and HUD (DCRA 2010). Going forward, Homer will need to replace and upgrade existing equipment. Within the next five years, survey respondents anticipate needing shore power upgrades, as well as float, crane, and SeaCom card reader replacements.
3.4.3 Nikiski
Nikiski is located between Anchorage and Homer on the northwest side of the Kenai Peninsula. The community is unincorporated and the census designated place is home to 4,500 residents. The local economy is tied closely to the oil and gas industry. Nikiski is home to the Tesoro Alaska oil refinery, and also serves as a base for Alaska Petroleum Contractors and Natchiq Inc., which construct and transport equipment to the oil fields of the North Slope (ADCCED 2010). Agrium, which owns a large fertilizer plant, is also in Nikiski, though it shut down several years ago when it was no longer able to secure a local supply of inexpensive natural gas. ConocoPhillips and Marathon own a liquefied natural gas (LNG) plant in Nikiski which exports LNG to Japan.
The USACE lists four facilities for Nikiski, all of which are privately owned. Two of the private facilities responded to the survey. One reported being a dock facility while the other reported being an unlisted facility type (LNG facility). Neither respondent listed any ongoing or needed improvements.
The community of Nikiski does not provide a public dock. Residents travel to the nearby community of Kenai for access to marine facilities. The well-developed road network in the Southcentral region makes this possible. In other regions of the state, publicly owned infrastructure must be provided locally as limited road networks prevent the sharing of marine infrastructure.
As noted above, Nikiski is unincorporated and public funding comes from the Kenai Peninsula Borough. Since the community does not own any public marine infrastructure, there are no operating costs to report.

Baseline Assessment of Alaska’s Ports and Harbors
Final 21
3.5 Southwest
The harvesting and processing of fishery resources is the mainstay of the economy in Southwest Alaska. Residents depend upon commercial fishing, sport fishing, and subsistence. Marine infrastructure supports these activities, and communities in the region must maintain and provide the equipment and facilities necessary to sustain their local economy (SWAMC 2010). High construction costs, small populations, and qualified personnel constraints are common challenges faced by local governments.
3.5.1 Unalaska/Dutch Harbor
Unalaska is a city of 3,700 residents located 800 air miles from Anchorage on the Aleutian Chain. The city spans two islands, with the portion of the city on Amaknak Island commonly referred to as Dutch Harbor (ADCCED 2010). Unalaska’s economy is tied closely to the Bering Sea fisheries. The community is the number one fishing port in the United States when ranked by quantity of fish landed. In 2008, approximately 55 percent of the nation’s fish resources were harvested and processed in the State of Alaska, and Unalaska’s local plants handled 13 percent of the state’s landings (City of Unalaska 2010a).
In 2005, Unalaska/Dutch Harbor had 34 listed piers, wharves, and docks in a regional summary of infrastructure published by the USACE. Of these, 24 listed seafood cargo handling and/or fueling vessels as their purpose for which used (USACE 2005). Responses from the eleven completed surveys from Unalaska/Dutch Harbor indicated public ownership by the City of Unalaska as well as private ownership by seafood processing companies. The response data were supported by published data which noted that ownership of marine facilities in Unalaska/Dutch Harbor is both public and private (USACE 2005).
The City of Unalaska’s Department of Ports and Harbors manages, maintains, and operates five city owned facilities (City of Unalaska 2010). Piers, wharves, and docks that are not part of the city’s facilities are under private control; most are owned by companies involved in seafood processing and fuel distribution (e.g. UniSea, Inc., Alyeska Seafoods, Inc., Westward Seafood, Inc., Delta Western, Inc., and Offshore Systems, Inc.) (USACE 2005).
The City of Unalaska accounts for its ports and harbors as an enterprise fund. Table 19 shows the fund’s 2009 operating revenues and expenses. With depreciation included as an expense, the Ports and Harbors Enterprise Fund operated at a loss in 2009.
Table 19. City of Unalaska, Ports and Harbors Enterprise Funds, Operating Revenues and Expenses,
Dollars, 2009
Functions/Programs Operating RevenuesOperating Expenses
and Depreciation Net Operating Income Ports and Harbors 3,681,207 4,062,778 (381,571)Source: City of Unalaska (2009).
The revenues shown in Table 19 are from charges levied for services provided at the port and harbor and do not include indirect revenues generated through seafood sales taxes, fisheries business taxes, fisheries resource landing taxes, etc. Port and harbor depreciation ($1.3 million) was the largest depreciation expense of any of the departments and functions of the city government.

Baseline Assessment of Alaska’s Ports and Harbors
22 Final
Unalaska has received funding for marine infrastructure improvements from a variety of sources. It was a recipient of federal funding for harbor improvements through the USACE and a recipient of state funds through an ADCCED grant (State of Alaska 2010). The state’s Capital Projects Database also shows past funding for marine infrastructure projects being administered through the ADOT&PF, DCRA, EDA, and AIDEA (DCRA 2010).
The USACE is currently looking for contractors interested in making navigation improvements at Unalaska; a Sources Sought Notice for provision of two concrete floating breakwaters to protect the Carl E. Moses Harbor was released in May of 2010. The project is estimated at $10-$25 million and is contingent upon the availability of funds (FBO 2010).
3.5.2 Kodiak
The City of Kodiak is home to 6,600 residents and is located in the Gulf of Alaska on Kodiak Island (ADCCED 2010). As with most southwestern communities, Kodiak residents are economically dependent on fishing and seafood processing. The city estimates more than one-third of the jobs in Kodiak to be directly involved in the fishing industry (City of Kodiak 2009). In addition to the seafood industry, the local government, hospital, and Kodiak Launch Complex (operated by the Alaska Aerospace Corporation) are significant sources of employment (ADCCED 2010).
Fourteen survey responses were received from Kodiak, eleven of which reported being public facilities. In all, the City of Kodiak has 33 different piers, wharves, and docks. The publicly owned facilities belong to the U.S. Government and the City of Kodiak, and are used for both public and commercial purposes. Public purposes include ferry docking, Coast Guard operations, the mooring of government vessels, and the mooring of recreational crafts. The city facilities not used for public purposes are operated by private companies and serve commercial uses such as cargo and seafood transportation, supply handling for fishing vessels, and mooring commercial vessels (USACE 2005). Most of the private facilities in Kodiak are owned by seafood processors (USACE 2005).
The City of Kodiak operates the elements of its port and harbor system as four separate enterprise funds, shown in Table 20. With the exception of the Boat Yard/Lift Fund, all enterprise funds include depreciation as an expense.
Table 20. City of Kodiak, Select Enterprise Funds, Operating Revenues and Expenses, Dollars, 2009
Functions/Programs Operating RevenuesOperating Expenses
and Depreciation Net Operating Income Cargo Pier 1,264,758 1,045,747 219,011Boat Harbor 2,183,999 2,780,977 (596,978)Boat Yard/Lift - 35,004* (35,004)Harbor Electric Utility 708,714 611,129 97,585Note: * Does not include depreciation expense since the facility was under construction in 2009.Source: City of Kodiak (2009).
Both the Cargo Pier Fund and the Harbor Electric Utility Fund5 generate operating revenues sufficient to cover all operating expenses. The Boat Harbor Fund6
5 Enterprise fund that accounts for the electricity used at the city’s harbors
and the Boat Yard/Lift do not cover their operating expenses and are operating at a loss (City of Kodiak 2009).
6 Enterprise fund that accounts for all activities of smaller crafts and all boat harbors with the city limits

Baseline Assessment of Alaska’s Ports and Harbors
Final 23
For the past five years alone (2005-2009) the City of Kodiak has nine entries in the Capital Projects Database for marine infrastructure and equipment projects. Lead agencies on these projects included ADOT&PF, DCRA, EDA, and the Denali Commission. Funding varied from project to project, and included matching funds from the local community (DCRA 2010).
3.5.3 Naknek
The community of Naknek is located on the north bank of the Naknek River and is home to the Port of Bristol Bay, one of the major consolidation points for seafood harvested from the Bristol Bay fishery. South Naknek, which sits just across the river, is home to only 60 residents and has one cargo dock facility (ADCCED 2010; USACE 2005). There is no bridge between Naknek and South Naknek and a boat or plane is needed to make the crossing. Naknek is connected to King Salmon via road.
Naknek is home to only 520 residents, but large volumes of cargo pass through its port each year (ADCCED 2010). The Bristol Bay Borough (BBB) is the largest commercial-freight dock in the Bristol Bay area and it operates from April to November. Within these eight months, the port services more than 150 barges and over 400 commercial vessels, small ships, and tenders (Port of Bristol Bay 2010a). The port caters primarily to the transportation needs of the local salmon industry and its cargo volumes depend heavily on the annual harvests of sockeye salmon. During the hectic fishing season, peak harvests of sockeye salmon in the entire Bristol Bay fishery can reach 1.8 million fish per day (ADFG 2009).
Ten piers, wharves, and docks are recorded as existing facilities in Naknek, including the one facility in South Naknek (USACE 2005). Of these ten, seven (70 percent) responded to the survey. Respondents included the Port of Bristol Bay (with two responses), three seafood processers, a cannery, and a fuel distribution company.
Privately owned seafood company assets in Naknek are considerable. Peter Pan Seafoods Inc., Trident Seafoods Corp.; Ocean Beauty Seafoods, Inc.; Yard Arm Knot Fisheries, LLC.; and Alaska General Seafoods all own and operate private facilities. The publicly owned facilities in Naknek and South Naknek are operated by the Bristol Bay Borough; the Naknek Cargo Dock, the Fisherman’s Dock, and the South Naknek Dock are collectively referred to as the Port of Bristol Bay. The Port is run as an enterprise fund, and Table 21 highlights its 2009 operating revenues and expenses.
Table 21. Port of Bristol Bay, Operating Revenues and Expenses, 2009
Functions/Programs Operating RevenuesOperating Expenses
and Depreciation Net Operating Income Port of Bristol Bay 1,310,615 1,213,423 97,192Source: Bristol Bay Borough (2009).
In contrast to most publicly owned facilities, in 2009 the Port of Bristol Bay earned sufficient revenues to cover all operating costs, including a depreciation expense of nearly $400,000.
The Port of Bristol Bay is currently undergoing a renovation to expand its capacity by increasing dock face and surface space. The project has been divided into two phases to allow for the continuation of cargo activity. Phase I began in 2009 with the construction of a new dock. Project costs were approximately $9 million and funding was provided by the Bristol Bay Borough, The Bristol Bay Economic Development Corporation, State Legislative grants, the Denali Commission, and the EDA (State of Alaska 2010a). Phase II of these improvements is expected to cost an additional $16 million,

Baseline Assessment of Alaska’s Ports and Harbors
24 Final
of which $5 million has been approved as part of the State’s 2011 capital budget (State of Alaska 2010a). The remaining funding sources are unidentified at this time.
3.6 Yukon-Kuskokwim
The communities of the Yukon-Kuskokwim region are typically small and remote. Economies are based on some seafood harvesting and processing, government employment, and subsistence. Few road networks exist in this area and inter-community travel is done mainly by airplane, boat, or snow machine/all-terrain-vehicle (ATV). In the summer months, when the rivers are navigable, shallow-draft barges and landing craft are used to deliver cargo to villages. Small populations and shallow waters make it difficult for large amounts of cargo to be transported at once. Goods are typically delivered to a central city or village (a hub) and then distributed to smaller, outlying communities. Marine infrastructure along the river systems is basic; in many locations, barges and landing craft pull directly onto the shore for offloading.
3.6.1 Bethel
Bethel is a community of 5,800 residents located on the Kuskokwim River and is considered a major hub for the consolidation and distribution of fuel, freight, and services in the Yukon-Kuskokwim region (ADCCED 2010; URS 2009). Bethel’s facilities consist of a medium draft port, a petroleum facility operated by Crowley Maritime Corporation, beaches, and small boat harbor floats (NEI 2010; USACE 2005). The only facility reported under private ownership is the Knik Construction Co. Dock (USACE 2005).
Four survey responses were received from Bethel. Respondents were docks and beach facilities owned by the city. Reported equipment included boat haul outs, launch ramps, cranes, and roll on/roll off capability; no container cranes or travel lifts were noted. Survey results confirmed that Bethel is accessible only by air and land; no rail or road connections to outside communities were reported.
Bethel’s publicly owned marine facilities are collectively known as the Port of Bethel and are managed by the Department of Port and Harbor (City of Bethel 2010a). Bethel’s Municipal Dock is run as an enterprise fund and generated a positive net operating income in 2009. It also showed a positive net cash flow of $665,000 and an increase of $847,000 in net assets. The fund’s operating revenues and expenses are outlined in Table 22.
Table 22. Bethel Municipal Dock, Operating Revenues and Expenses, 2009
Functions/Programs Operating RevenuesOperating Expenses
and Depreciation Net Operating Income Municipal Dock 1,170,078 1,060,972 109,106
Source: City of Bethel (2009).
The largest line-item operating expenses were depreciation and amortization costs of $625,000, and personnel costs of $251,000. All other line item expenses were below $75,000 (City of Bethel 2010).
Despite the large impact that Bethel’s marine facilities have on the region, relatively few projects have been recorded by the state over the last decade to maintain or upgrade these facilities. The Capital Project Database lists 189 different capital projects worth over $390 million for Bethel since 2000. Of these, only three were related to docks. ADOT&PF and the Denali Commission were involved in

Baseline Assessment of Alaska’s Ports and Harbors
Final 25
dock construction and upgrades worth $7.3 million in 2004, 2007, and 2008. At least $4 million in funding for these projects came from the USACE (DCRA 2010).
Currently under discussion are possible improvements to Bethel’s facilities including an extension to the City Dock, the expansion of East Harbor, beach replenishment, Petro Dock expansion and replacement of the East Timber Wing Wall. Rough order of magnitude construction cost estimates for these projects were developed in 2006 by PND Engineers and are outlined in Table 23.
Table 23. Marine Facility Improvement Cost Estimates, Bethel
Item Cost ($)City Dock West Extension 3,266,000East Harbor Expansion 18,168,000Beach Replenishment 354,000Petro Dock Expansion 7,258,000
Replacement of East Timber Wing Wall 4,166,000Source: Northern Economics, Inc. 2010 using cost estimates supplied by PND Engineers, Inc.
3.6.2 Chefornak
The village of Chefornak is located within the Bethel recording district on the south bank of the Kinia River 98 air miles southwest of Bethel. The 480 village residents travel to and from Chefornak by air and small watercraft only; there are no roads or docking facilities available. In the winter snow machine trails are marked to the communities of Kipnuk and Kasigluk (ADCCED 2010).
Goods are transported to Chefornak via barge and airplane. Accessing the barge landing site is reportedly difficult; large rocks obstruct the approach. Fuel barge operators avoid the danger presented by the rocks by landing at high tide on a flat shelf downstream of the landing. Cargo barges that do use the gravel barge landing report that the site has become worn down and suggest installing protection against erosion (URS 2009). This assessment was supported by the survey response received from Chefornak. The respondent noted erosion problems and highlighted the need for a long-term solution.
The most recent set of audited financial statements available are for 2008. The documents show no revenue or expenses directly related to the barge landing or any other marine assets (City of Chefornak 2009). The Capital Funding Database, the Denali Commission’s Project Database System, and the state’s capital enacted appropriations data show no capital projects to have taken place in Chefornak related to marine infrastructure (DCRA 2010; Denali Commission 2010; State of Alaska 2010). At least one of these databases (Capital Funding Database) reaches back to the mid-1980s. Airport, utility, and housing improvements are the most frequently listed projects for Chefornak (DCRA 2010).
3.6.3 Saint Mary’s
Saint Mary’s is a Yup’ik Eskimo community of 550 residents located on the bank of the Andreafsky River, near the Yukon confluence. A local road network provides access to the communities of Andreafsky, Pitka’s Point, and Mountain Village. Travel outside of the immediate region is restricted to air and water travel (ADCCED 2010). Saint Mary’s operates a port facility and provides the only deep-water dock in the area (ADCCED 2010). According to a URS study done for the USACE in 2009, local barge operators describe the Saint Mary’s low profile dock design as being convenient for both freight

Baseline Assessment of Alaska’s Ports and Harbors
26 Final
and fuel operations. They also noted that maintenance and repairs are needed at the facility; specifically mentioned were new dolphins, improved mooring points, and a cap to cover sharp sheetpile at the dock face (URS 2009).
Two survey responses were received from Saint Mary’s; one from the publicly owned City Dock and the other from Boreal Fisheries Inc.’s private dock. Boreal Fisheries Inc. is a small, family owned business that specializes in selling fresh and smoked Yukon King Salmon. The City Dock is used for fuel and freight operations and is run by the city as a major enterprise fund. Table 24 shows the fund’s operating revenues and expenses for 2008 (the most recent year available from the state).
Table 24. Saint Mary’s Port Operating Revenues and Expenses, 2008
Functions/Programs Operating RevenuesOperating Expenses
and Depreciation Net Operating Income Port 13,058 20,325 (7,267)
Source: City of Saint Mary’s (2009).
The Port of Saint Mary’s expenses are few, and consist of $20,275 in depreciation and $50 in dues and fees. No personnel, repairs, or maintenance costs were noted (City of Saint Mary’s 2009). As Table 24 highlights, port service charges are not sufficient to cover depreciation costs.
Few capital projects related to marine infrastructure are recorded for St. Mary’s. The only projects shown in any of the three databases used for this analysis were two $25,000 grants from the DCRA in 1994 and 1995 for cold storage renovation and improvements to a dock facility (State of Alaska 2010; Denali Commission 2010; DCRA 2010).
3.7 Northwest
The Northwest region encompasses the Nome Census Area, the Northwest Arctic Borough, and that part of the Yukon-Koyukuk Census Area that is west of the Dalton Highway. Together they are home to more than 35 communities and cover a vast expanse of land. The Nome Census Area and the Northwest Arctic Borough alone encompass about 59,000 square miles (ADOLWD 2010). As with the Yukon-Kuskokwim region, road networks are limited and transportation is mainly by air and boat. Nome does have a local road network, but the system does not connect outside of the region.
The economy of the Nome Census Area is driven by the government and service sectors; most residents work for the local government, provide education and health services, or are involved in trade, transportation, and utilities (ADOLWD 2010). The situation is similar in the Northwest Arctic Borough. Though the Red Dog Mine (one of the world’s largest zinc concentrate producers) is located within the borough, the two top local employers ranked by number of workers are the Manillaq Association Inc. and the Northwest Arctic Borough School District. Teck Alaska, owner of the Red Dog Mine, ranks third (ADOLWD 2010). The mine supports the local government through payments-in-lieu-of-taxes (PILT). PILT payments to the Northwest Arctic Borough amounted to $6.7 million in 2009 (NANA 2010).
The public sector also plays a large role in the Yukon-Koyukuk Census Area. Four of the five top employers are school districts, and 55 percent of the resident workforce is employed by local governments (ADOLWD 2010).

Baseline Assessment of Alaska’s Ports and Harbors
Final 27
3.7.1 Nome
Nome is a city of 3,500 located along the Bering Sea, 540 miles northwest of Anchorage and just 100 miles south of the Arctic Circle. It serves as a regional hub for communities within the Norton Sound Area. Local roads allow for transportation to and from the communities of Teller, Solomon, and Council. However, travel outside of these areas requires a plane or boat. Barges are able to access the Port of Nome in the summer, and delivered goods are distributed to area communities via lighterage service (ADCCED 2010).
Two major facilities exist in Nome: the Port of Nome and the Nome Small Boat Harbor (URS 2009). Together they consist of a cargo dock, a float, and two wharves. Both marine facilities are owned by the City of Nome and together they seem to cover all the basic needs of a rural community. They are used for receipt and shipment of seafood, general cargo, sand and gravel, and petroleum products (USACE, 2005).
Both of Nome’s marine facilities are grouped together and run as the Nome Port Facility Enterprise Fund. Table 25 outlines the fund’s 2009 operating revenues and expenses, and shows that the port is operating at a loss.
Table 25. Nome Port Facility Enterprise Fund, Operating Revenues and Expenses, Dollars, 2009
Functions/Programs Operating RevenuesOperating Expenses
and Depreciation Net Operating Income Port Facility 1,166,940 1,700,015 (533,075)
Source: City of Nome (2009).
The Nome Port Facility expenses of $1.7 million include $1.1 million in depreciation, accounting for 66 percent of total port expenses.
Both the Port of Nome and the Nome Small Boat Harbor responded to the survey and included lists of current and needed projects at their facilities. The projects ranged from additional dock space estimated to cost between $1.5 and $2 million to security systems and seasonal toilets costing between $15,000 and $25,000. In addition to the projects outlined by respondents, barge operators recommend installing pilings or posts at the corners of the new breakwaters and marking the channel through the harbor (URS 2009).
Over the last decade, capital projects in Nome were led by ADOT&PF, the Denali Commission, USACE, EDA, and DCRA. The USACE was the lead agency on the most expensive projects including the design of a new harbor channel entrance and breakwater design in 2002 at $10 million, and harbor improvements, dredging, and the construction of a new main breakwater in 2003 at $36 million. The most recent capital project listed was a $3.6 million port and harbor improvement effort led by the Denali Commission in 2008.
3.7.2 Kotzebue
Kotzebue is a city of 3,154 in the Northwest Arctic Borough, located on the end of the Baldwin Peninsula in Kotzebue Sound (ADCCED 2010). Like Nome, the city functions as a service and transportation hub for communities in the region and receives barge calls in the summer months when port facilities are ice-free. The water depth in Kotzebue Sound is prohibitively shallow and deep draft barges cannot call directly. Cargo is either delivered to Nome and lightered to Kotzebue, or lightered directly from the deep draft barges as they moor offshore (URS 2009).

Baseline Assessment of Alaska’s Ports and Harbors
28 Final
In contrast to most Alaskan communities dependent upon barge service, the City of Kotzebue does not own a dock or harbor. The two local docks are privately owned by Crowley Marine and Drake Construction; general cargo is usually transported via the Crowley dock while construction materials such as sand and gravel are brought to the Drake Construction dock (USACE, 2005). Drake Construction was the only respondent to the USACE survey and noted the need to sheet pile a portion of their landing. They estimate this project to cost $1 million and will be completed within the next 5 years.
Local governments and community groups are exploring the possibility of constructing a deep water port at Cape Blossom, just south of Kotzebue, in hopes of reducing commodity costs. Development of Cape Blossom would require dredging, port construction, and the building of a road to link the deep water port to the city. ADOT&PF is examining the costs of undertaking the road building aspect of this project. Efforts to locate a local source of gravel, which would reduce construction costs, are currently underway.
3.7.3 Galena
Like Kotzebue, Galena also functions as a service and transportation center for the Northwest Region. Galena is located inland, between Koyukuk and Ruby on the Yukon River, and is sometimes referred to as part of the Western Interior. It is home to 560 people. According to the Alaska Department of Labor, 69 percent of Galena’s resident workforce is employed in local government, and another 6 percent are employed in the state government (ADOLWD 2010).
Travel to and from Galena is done by air or water; the community has no connecting roadways and travel to nearby communities is done by boat or barge in the summer and dogsled, ATV and snow machine in the winter (City of Galena 2010). One survey response was received from Galena, and the respondent recorded having ‘no marine facilities.’. Local barge operators list three landing sites in Galena. The first is the old town tank farm, the second is a freight barge landing site near the center point of the community, and the third is a public landing where the city has plans to build a sheet pile dock (URS 2009). The new dock will be 120 feet long with a 40-foot vertical dock face (DCRA 2010).
The state’s Capital Funding Database shows Denali Commission funding going to this project in the amount of $100,000 in 2008 and $1.4 million in 2009 (DCRA 2010). These sums are only partially reflected in Galena’s financial documents as the most recent audited financial statements available are for 2008. The 2008 statements do not show line item revenues or expenses for marine facilities. The only marine facility reference included in the financials is a Dock Project Capital Project fund, and its balance sheet shows a grant receipt in the amount of $84,691 recorded for FY 2008. This is likely the entry for part of the Denali funds received in 2008.
3.8 Arctic
The boundaries of the Arctic region, as identified in Figure 1, are the same as those for the North Slope Borough. The region covers about 89,000 square miles of the northernmost territory in Alaska. Oil production facilities at Prudhoe Bay contribute greatly to the local economy through the payment of oil and gas property taxes. In 2009, $239 million in property taxes were paid to the borough, of which oil and gas property taxes accounted for $235 million, or 98 percent. The Prudhoe Bay facilities also employ a large number of workers, but most employees are not local residents. Only two percent of the North Slope Borough resident workforce is employed in natural resources and mining. The majority (60 percent) are employed by the local government (ADOLWD 2010).

Baseline Assessment of Alaska’s Ports and Harbors
Final 29
3.8.1 Barrow
Barrow is home to 4,100 residents and is the northernmost community in Alaska. It is located on the Chukchi Sea and is part of the North Slope Borough. The Arctic conditions are harsh; the Chukchi Sea is navigable only in the summer months and marine and land transportation are seasonal. Winter access to Barrow is available via air only (ADCCED 2010).
The economy in Barrow is based on public employment (borough, state, and federal) and private employment for support services to oil field operations. The community is more than half Native or part-Native (most residents are Inupiat Eskimos) and a heavy reliance on traditional subsistence food sources continues (ADCCED 2010).
One facility in Barrow submitted a survey response. The Barrow Boat Dock described itself as a publicly owned summer boat/dock facility. The respondent confirmed that there is no local rail or outside road access, and estimated the nearest marine facility to be 1,000 miles away.
The Capital Project Database shows only three projects related to marine infrastructure to have taken place in Barrow since 1999. In 2000, $1 million was spent on the design and purchase of a retractable boat ramp, and in 2002, $128,000 was spent on boat harbor upgrades. This year (2010), $2 million was allotted for a new boat ramp. DCRA was the lead on all three projects (DCRA 2010).
3.9 Interior
Alaska’s Interior region stretches from the Canadian border to just past Lake Minchumina, on the Western edge of the Denali Borough. Like both the Northwest and Yukon-Kuskokwim regions, cargo distribution via river systems takes place in this region during the summer months when waters are navigable. Alaska’s interior may be accessed via road, rail, air, or boat, depending on the location. In many cases delivery of cargo requires intermodal travel. Goods destined for Ruby, for example, may first be railed or trucked to Nenana, then transported by barge for final delivery.
3.9.1 Fairbanks
Fairbanks is located on the bank of the Chena River, 360 road miles north of Anchorage (DCCED 2010). The community is a service and transportation hub for the interior; shipments of cargo arrive in Fairbanks via truck, air, or rail and are then distributed for delivery to smaller interior communities (DCCED 2010).
Unlike most regional hubs previously discussed, waterways in Fairbanks are not used for cargo transportation. Facilities in Fairbanks are primarily used for recreation. The community has only one marine facility listed with the USACE, the Fairbanks Landing on the right bank of the Chena River, owned and operated by Alaska Riverways. The facility is private and is exclusively used for mooring excursion vessels (USACE 2005).
Three survey responses were received from Fairbanks. Two were from boat launch facilities at local parks that were not listed by the USACE. The third was from an unnamed respondent who reported having ‘No Marine Facilities.’
3.9.2 Nenana
Nenana is a village of 480, located on the Tanana River, 55 road miles southwest of Fairbanks. Nenana has air, road, rail, and water access and acts as a water transportation hub for the Interior region. The railroad provides daily freight service, and cargo is barged from Nenana to Interior

Baseline Assessment of Alaska’s Ports and Harbors
30 Final
communities accessible via the river systems. Crowley Marine is the major private employer in town and brings supplies and fuel to more than 40 villages along the Tanana and Yukon Rivers each summer (ADCCED 2010; ADOLWD 2010).
Nenana has two marine facilities, one privately owned and one publicly owned. The private dock was recently constructed by Ruby Marine Inc., a newly established Yukon River barge service. The publicly owned facility is the Port of Nenana.
The port responded to the survey and confirmed that it is publicly owned and operated by the Nenana Port Authority. The Port Authority operates both the airport and the city’s marine facilities, and is run as an enterprise fund (City of Nenana 2009; ADCCED 2010). Table 26 shows the enterprise fund’s operating revenues and expenses for 2009.
Table 26. Nenana Port Authority (Airport and Marine Facilities), Revenues and Expenses, Dollars,
2008
Functions/Programs Operating RevenuesOperating Expenses
and Depreciation Net Operating Income Port Authority 203,650 747,210 (543,560)
Source: City of Nenana (2008).
The Nenana Port Authority shows a $413,773 annual depreciation cost for both airport and marine facilities. Unfortunately, combining the port and airport together prevent distinguishing between the revenues and expenses attributable to just river facilities. The state’s capital funding database shows only one marine facility project taking place in Nenana in the past year. In 2008, a $1 million dollar project was listed for port upgrades. The lead agency on the project was the Denali Commission (DCRA 2010).
3.9.3 Tanana
West of Nenana is Tanana, a village of 250 residents on the Yukon River. The village is accessible by air and river only; the community’s 30 miles of local road do not extend to a highway or outside road system (DCCED 2010). Cargo destined for Tanana is often transported via railroad to Nenana, then barged to Tanana for final delivery. Tanana has one cargo dock and three petroleum delivery facilities. Local barge operators recommend a consolidation of fuel headings to improve operational efficiency (URS 2009).
Tanana’s cargo facility is known as the City Dock and is publicly owned. City of Tanana audited financial statements for FY 2009 do not show line item revenues or expenses for the port facilities.
The City Dock submitted one response to the USACE survey and reported having a travel lift; a boat haul out and launch ramp; fuel available for purchase; parking; and boat storage. The dock also reported several amenities including restrooms, showers/laundromat, and wireless internet. According to the survey respondent, freight operators using the City Dock include Crowley Maritime Corporation, Inland Barge Service, and Ruby Marine, Inc.
The survey respondent noted that tie offs were needed at the City Dock and that funding was needed for this project. The need was confirmed by data gathered from local barge operators who reported that mooring points are needed at this facility (URS 2009).

Baseline Assessment of Alaska’s Ports and Harbors
Final 31
4 Regional Needs and Improvements
The USACE survey addressed regional needs by asking respondents to list capital improvement projects that are planned or currently underway and not yet planned but needed. To assess future needs and identify projects for which funding has not yet been determined, this analysis focuses on the projects not yet planned but needed. A comprehensive list of projects indentified by survey respondents as planned or currently underway is included as Appendix A.
The not-yet-planned projects were grouped by region and divided into two categories based on facility type. Facilities were grouped into ports or harbors. Survey respondents who listed their facilities as docks were grouped with either ports or harbors when a determination could be made using the information provided. If no determination could be made, the facility was not included. Responses from privately owned docks were omitted completely since such facilities would not likely qualify for USACE or ADOT&PF funding. A complete list of projects identified by survey respondents as not yet planned but needed is included as Appendix B.
Neither the Yukon-Kuskokwim nor Arctic region submitted anticipated capital improvement projects. Needs in these regions will need to be assessed through secondary sources. The Alaska Barge Landing Study prepared by URS Corporation in 2009 will be a useful resource for identifying marine facility needs in the Yukon-Kuskokwim region.
4.1 Southeast
Juneau, Ketchikan, and Skagway were the Southeast ports to report future needs at their facilities. Responses varied by facility and location. Their responses are outlined in Table 27.
Table 27. Southeast Port Needs
Facility Name Facility Location Name & DescriptionEstimatedCost ($)
Est. Year of Completion
Alaska Steamship Wharf
Juneau New cruise terminal $20,000,000 FY 2015
Auke Bay Commercial Loading Facility (ABCLF)
Juneau Boat haul out $10,000,000 FY 2012
Berths 1 & 2 Ketchikan Replacement of wooden portions of Berth 1 & 2 with steel piles & concrete deck
$26,000,000 –
Port of Skagway Skagway* Ore dock improvements – –Port expansion – –
* Respondent referred to the Port Development Plan adopted in 2008, available at www.skagway.org; projects listed were taken from this source.Source: Northern Economics, Inc. using USACE, 2010
The Skagway Port Development Plan, as referenced above, was adopted in 2008, and an updated 2010 executive summary is available on the Municipality of Skagway’s website. The summary outlines a four-phase conceptual plan to upgrade and expand Skagway’s facilities. Improvements include completion of an ore storage facility, addition of a new ship ore loader, and expansion of the port site. The municipality has asked for a grant of up to $117 million from the US Department of Transportation’s Transportation Investment Generating Economic Recovery (TIGER) program and

Baseline Assessment of Alaska’s Ports and Harbors
32 Final
expects to hear back in 2010 (Municipality of Skagway 2010). It should be noted that a large portion of Skagway’s marine infrastructure is privately owned by the White Pass and Yukon Route Railroad Company (ADCCED 2010).
Responses from harbors greatly outnumbered those from ports in the Southeast. Projects identified by Southeast harbor respondents and the USACE are outlined in Table 28.
Table 28. Southeast Harbor Needs
Facility Name Facility Location Name & DescriptionEstimatedCost ($)
Est. Year of Completion
N/A Auke Bay Navigational Improvements* Undetermined UndeterminedN/A Craig Navigational Improvements* Undetermined UndeterminedDouglas Boat Harbor Douglas Breakwater Access /
Gangway5,000,000 FY 2015
N/A Gustavus Navigational Improvements* Undetermined UndeterminedN/A Haines Navigational Improvements* Undetermined UndeterminedPortage Cove Harbor Haines Dredging, uplands
improvements.– –
Breakwater extension for better protection
– –
New boat launch – –Aurora Harbor Float Juneau Approach dock 10,000,000 FY 2015Don Statter Harbor Juneau Replacement of ways and
Boat Lift**10,000,000 FY 2020
Charter boat landing 6,000,000 FY 2015Harris Harbor Juneau Replacement** 20,000,000 2024N/A Ketchikan Navigational Improvements* Undetermined UndeterminedBar Harbor North Floats 10-17
Ketchikan Replace Access ramps & electrical services
2,200,000 –
Hole in the Wall Ketchikan Replace access ramp, floats & breakwater
2,500,000 –
Bar Harbor South Floats 1-9
Ketchikan Replace Floats 1, 8 & 9 4,300,000 –
Replace & repair launch ramp & replace grid
2,700,000 –
Thomas Basin Ketchikan Replace Float 1, access ramps & grids
3,700,000 –
Pelican Harbor Pelican Water distribution system – –Dredging of inner harbor – –Reconstruction of 2 oldest floats & attached finger floats
– –
Facilities allowing container van transport to & from Pelican
– –
Pelican Boat Harbor Pelican Boat launch ramp 1,500,000 –Fishermen's work float 500,000 –Replace E float 750,000 –
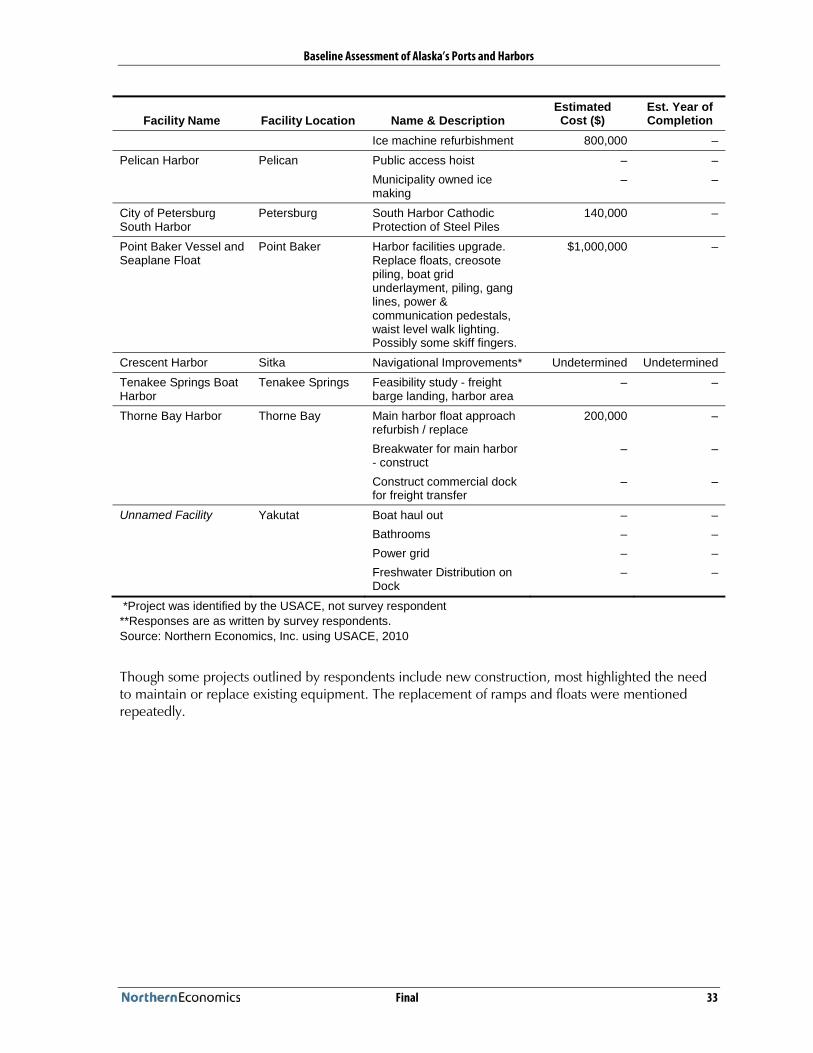
Baseline Assessment of Alaska’s Ports and Harbors
Final 33
Facility Name Facility Location Name & DescriptionEstimatedCost ($)
Est. Year of Completion
Ice machine refurbishment 800,000 –Pelican Harbor Pelican Public access hoist – –
Municipality owned ice making
– –
City of Petersburg South Harbor
Petersburg South Harbor Cathodic Protection of Steel Piles
140,000 –
Point Baker Vessel and Seaplane Float
Point Baker Harbor facilities upgrade. Replace floats, creosote piling, boat grid underlayment, piling, gang lines, power & communication pedestals, waist level walk lighting. Possibly some skiff fingers.
$1,000,000 –
Crescent Harbor Sitka Navigational Improvements* Undetermined UndeterminedTenakee Springs Boat Harbor
Tenakee Springs Feasibility study - freight barge landing, harbor area
– –
Thorne Bay Harbor Thorne Bay Main harbor float approach refurbish / replace
200,000 –
Breakwater for main harbor - construct
– –
Construct commercial dock for freight transfer
– –
Unnamed Facility Yakutat Boat haul out – –Bathrooms – –Power grid – –Freshwater Distribution on Dock
– –
*Project was identified by the USACE, not survey respondent**Responses are as written by survey respondents.Source: Northern Economics, Inc. using USACE, 2010
Though some projects outlined by respondents include new construction, most highlighted the need to maintain or replace existing equipment. The replacement of ramps and floats were mentioned repeatedly.

Baseline Assessment of Alaska’s Ports and Harbors
34 Final
4.2 Prince William Sound
Cordova and Seward were the only communities in Prince William Sound to list needed capital improvements at their ports and harbors. The Municipal Dock in Cordova foresees maintenance needs while the Alaska Railroad East Dock foresees a need for expansion. Both sets of responses are outlined in Table 29.
Table 29. Prince William Sound Port Needs
Facility Name Facility Location Name & DescriptionEstimated Cost ($)
Est. Year of Completion
Municipal Dock (AKA - Oceandock)
Cordova Bullrail replacement 750,000 2020
Overhead light replacement 500,000 2020Alaska Railroad East Dock
Seward Expand dock to 315' wide from current 200'.
$500,000 2015
Extend dock 400' south $15,000,000 Extend dock 400' south
Source: Northern Economics, Inc. using USACE, 2010
Table 30 outlines the harbor needs reported by communities in Prince William Sound. Prime Select Seafoods reported its facility as a publicly owned harbor facility; however, this may have been a misinterpretation of the survey question. Secondary information confirms that Prime Select Seafoods is a privately owned company, but sometimes uses the City Dock facilities, which are publicly owned.
Table 30. Prince William Sound Harbor Needs
Facility Name Facility Location Name & DescriptionEstimated Cost ($)
Est. Year of Completion
N/A Cordova Navigational Improvements* Undetermined UndeterminedPrime Select Seafoods
Cordova Fuel Buying Station for Direct Marketers & small processors
– –
Seward Small Boat Harbor
Seward NE fish cleaning dock 700,000 2014
Replacement of A,B,C & S Floats 5,000,000 2015Replacement of Launch Ramps 1,400,000 2018
N/A Valdez Navigational Improvements* Undetermined UndeterminedN/A Whittier Navigational Improvements* Undetermined Undetermined
*Project was identified by the USACE, not survey respondentSource: Northern Economics, Inc. using USACE, 2010

Baseline Assessment of Alaska’s Ports and Harbors
Final 35
4.3 Southcentral
Port MacKenzie submitted the longest list of foreseeable needs of any Southcentral port facility. The projects outlined in Table 31 fall in line with the facility’s long-term plan for expansion. Port MacKenzie is working to develop its intermodal capabilities and expects growth in the transportation of raw and industrial materials (Matanuska-Susitna Borough 2010).
It is worth noting that the Port of Anchorage is currently undergoing a major renovation; the facility plans to have its foreseeable needs met by the ongoing work.
Table 31. Southcentral Port Needs
Facility NameFacility
Location Name & DescriptionEstimated Cost ($)
Est. Year of Completion
Port of Anchorage Anchorage Harbor Deepening* Undetermined UndeterminedSystem 4 CC > JJ floats
Homer Graduated float replacement – –
Port MacKenzie Point MacKenzie Fuel tank farm 10,000,000 2015Second rail loop (3 miles) 12,000,000 2018Road Connection & Traffic Loop for Knik Arm Bridge Crossing
10,000,000 2018
Anchorage ferry landing 22,000,000 2011*Project was identified by the USACE, not survey respondentSource: Northern Economics, Inc. using USACE, 2010
Homer was the only Southcentral community to submit a list of needed capital investment projects for its harbor. The responses came from three separate facilities and are listed in Table 32.
Table 32. Southcentral Harbor Needs
Facility NameFacility
Location Name & DescriptionEstimated Cost ($)
Est. Year of Completion
City of Homer Fish Dock
Homer Crane replacement 800,000 2020
Homer Small boat harbor Systems 1 and 2
Homer Ramp three / ramp three approach. A, J, R, S float replacement
3,600,000 2015
System 5 Homer Small boat Harbor
Homer Shore power pedestal upgrade 300,000 2013
Heat traced Potable Water Station
60,000 2012
Derelict Vessel removal – –Source: Northern Economics, Inc. using USACE, 2010

Baseline Assessment of Alaska’s Ports and Harbors
36 Final
4.4 Southwest
Three communities from the Southwest responded with a list of port needs. Their responses are summarized in Table 33.
Table 33. Southwest Port Needs
Facility NameFacility Location Name & Description
Estimated Cost ($)
Est. Year of Completion
Old Harbor Port Facilities
Old Harbor Power (electrical meters) to commercial slips
250,000
Harbor and Channel Dredging 2,000,000 Funding Development
Pier 2 Fisherman's Terminal
Kodiak Passenger access sidewalks – –
Pier 1 - Ferry Dock Kodiak Replace within 3 years $10,000,000 2013Pier III Cargo Terminal
Kodiak New crane – –
Structural upgrades – –Port of Bristol Bay Naknek Fishery support center /
community fish processing plant
$1,000,000 –
Cold storage facility $1,500,000 –Slurry ice delivery $500,000 –
St. Paul Harbor St. Paul Island Travel lift $2,000,000 2015Ocean outfall $2,500,000 2014
*Project was identified by the USACE, not survey respondentSource: Northern Economics, Inc. using USACE, 2010
The projects for Kodiak and St. Paul are varied and address cargo, passenger, and community needs. In contrast, all projects listed by the Port of Bristol Bay are seafood industry related and focus on the preservation of harvested product.
Harbor projects in the Southwest region are focused on the preservation and improvement of existing infrastructure. The harbor needs of the Southwest region are listed in Table 34.
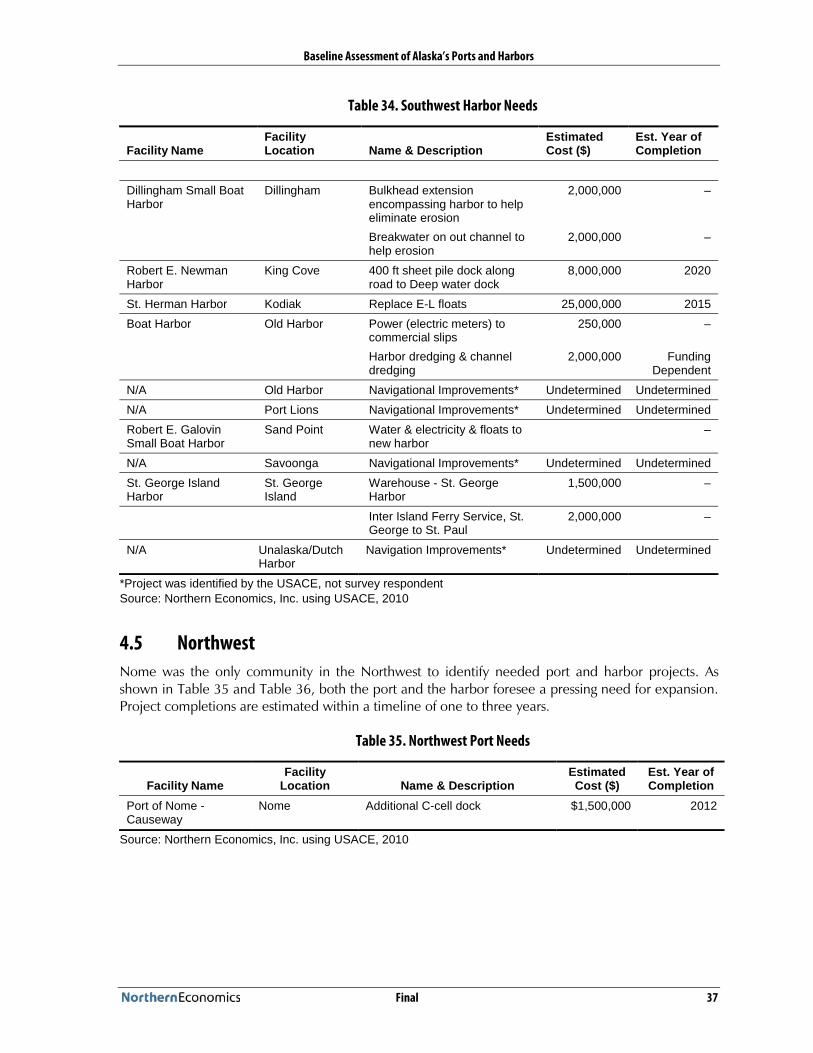
Baseline Assessment of Alaska’s Ports and Harbors
Final 37
Table 34. Southwest Harbor Needs
Facility NameFacility Location Name & Description
Estimated Cost ($)
Est. Year of Completion
Dillingham Small Boat Harbor
Dillingham Bulkhead extension encompassing harbor to help eliminate erosion
2,000,000 –
Breakwater on out channel to help erosion
2,000,000 –
Robert E. Newman Harbor
King Cove 400 ft sheet pile dock along road to Deep water dock
8,000,000 2020
St. Herman Harbor Kodiak Replace E-L floats 25,000,000 2015Boat Harbor Old Harbor Power (electric meters) to
commercial slips250,000 –
Harbor dredging & channel dredging
2,000,000 Funding Dependent
N/A Old Harbor Navigational Improvements* Undetermined UndeterminedN/A Port Lions Navigational Improvements* Undetermined UndeterminedRobert E. Galovin Small Boat Harbor
Sand Point Water & electricity & floats to new harbor
–
N/A Savoonga Navigational Improvements* Undetermined UndeterminedSt. George Island Harbor
St. George Island
Warehouse - St. George Harbor
1,500,000 –
Inter Island Ferry Service, St. George to St. Paul
2,000,000 –
N/A Unalaska/Dutch Harbor
Navigation Improvements* Undetermined Undetermined
*Project was identified by the USACE, not survey respondentSource: Northern Economics, Inc. using USACE, 2010
4.5 Northwest
Nome was the only community in the Northwest to identify needed port and harbor projects. As shown in Table 35 and Table 36, both the port and the harbor foresee a pressing need for expansion. Project completions are estimated within a timeline of one to three years.
Table 35. Northwest Port Needs
Facility NameFacility
Location Name & DescriptionEstimated Cost ($)
Est. Year of Completion
Port of Nome -Causeway
Nome Additional C-cell dock $1,500,000 2012
Source: Northern Economics, Inc. using USACE, 2010

Baseline Assessment of Alaska’s Ports and Harbors
38 Final
Table 36. Northwest Harbor Needs
Facility NameFacility
Location Name & DescriptionEstimated Cost ($)
Est. Year of Completion
N/A Elim Navigational Improvements* Undetermined UndeterminedN/A Little Diomede Navigational Improvements* Undetermined UndeterminedNome Small Boat Harbor
Nome Harbor lighting project 300,000 2011
Additional docking space 2,000,000 2012-13N/A Unalakleet Navigational Improvements* Undetermined Undetermined
*Project was identified by the USACE, not survey respondentSource: Northern Economics, Inc. using USACE, 2010
4.6 Interior
As with the Northwest, only one community listed capital improvement needs in the Interior. Respondents at the Port of Nenana submitted two survey responses, both listing a need for dock sheet piling. No estimated year of completion was provided for any listed project.
Table 37. Interior Port Needs
Facility NameFacility
Location Name & DescriptionEstimated Cost ($)
Est. Year of Completion
Port of Nenana Nenana Sheet pile dock extension – –Repair yard dock face $3,200,000 –Water/sewer extensions $1,200,000 –
Port of Nenana Nenana Dock infrastructure sheet pile installation
$2,000,000 –
Replace marine ways $1,500,000 –Source: Northern Economics, Inc. using USACE, 2010

Baseline Assessment of Alaska’s Ports and Harbors
Final 39
5 References
Alaska Department of Commerce, Community and Economic Development (ADCCED). Community Information and Summaries. Available at http://www.commerce.state.ak.us/dca/commdb/ CF_CIS.htm. Accessed July 26, 2010.
Alaska Department of Fish and Game (ADFG), Division of Commercial Fisheries. 2009 Bristol Bay Salmon Season Summary, News Release. September, 2009. Available at http://www.cf.adfg.state.ak.us/region2//finfish/salmon/bbay/brbpos09.pdf.
Alaska Department of Labor and Workforce Development (ADOLWD). Alaska Local and Regional Information (ALARI). Available at http://labor.alaska.gov/research/alari/. Accessed August 4, 2010.
Alaska Department of Revenue. Cruise vessel passenger counts supplied at the request of Northern Economics, Inc. January 8, 2010.
Division of Community and Regional Affairs (DCRA). Capital Projects Database. Available at http://www.commerce.state.ak.us/dca/commdb/CF_RAPIDS.cfm. Accessed July 28, 2010.
Alyeska Pipeline Service Company. Facts: TransAlaska Pipeline System. Available at http://www.alyeska-pipe.com/Pipelinefacts/FACT-BOOK.pdf. September 10, 2009.
Bristol Bay Borough. Basic Financial Statements, Supplementary Information, and Single Audit Reports, FY 2009. February 8, 2010.
Bristol Bay Borough. Port of Bristol Bay. Available at http://www.theborough/port.html. Accessed August 3, 2010a.
Bureau of Economic Analysis, US Department of Commerce. Gross Domestic Product by State. Available at www.bea.gov/regional/gsp/. Accessed February 2010.
City and Borough of Juneau (CBJ). Comprehensive Annual Financial Report, Fiscal Year 2009. December 15, 2009
City and Borough of Juneau. Juneau Docks and Harbors website. Available at http://www.juneau.org/ harbors/index.php. Accessed July 22, 2010.
City and Borough of Juneau. Statter Harbor Improvements. Available at http://www.statterharbor.com/ background.html. Accessed July 28, 2010a.
City and Borough of Sitka Website. Harbor Department. Available at http://www.cityofsitka.com/ government/departments/harbor/index.html. Accessed July 27, 2010.
City and Borough of Sitka. Comprehensive Annual Financial Report, Fiscal Year 2009. December 18, 2009
City of Bethel. Basic Financial Statements, Required Supplementary Information, Additional Supplementary Information and Compliance Reports, Fiscal Year 2009. March 5, 2010
City of Bethel webpage. Port of Bethel. Available at http://www.cityofbethel.org/index.asp?Type=B_BASIC&SEC={23F7A694-E8AF-42B0-B5CC-3BB6FD264610}. Accessed July 30, 2010.
City of Cordova, Alaska. Basic Financial Statements, Supplementary Information, and Single Audit Reports. Fiscal Year 2009. May 4, 2010.

Baseline Assessment of Alaska’s Ports and Harbors
40 Final
City of Cordova. Harbor Master. Available at www.cityofcordova.net/city-administration/harbor-master/. August 2, 2010a.
City of Homer. Comprehensive Annual Financial Report , FY 2009. June 25, 2010.
City of Homer. Draft Comprehensive Economic Development Strategy. Available at http://www.ci.homer.ak.us/economicdevelopment/#. Accessed August 3, 2010a.
City of Homer. Annual Report, 2009. Available at http://www.ci.homer.ak.us/report.pdf. July 13, 2010b.
City of Kodiak. Comprehensive Annual Financial Report , FY 2009. December 22, 2009
City of Nenana. Comprehensive Annual Financial Report . Fiscal Year 2009.
City of Pelican. Audited Financial Statements. Fiscal Year 2009.
City of St. Mary’s. Financial Statements. Fiscal Year 2008. March 12, 2010.
City of Unalaska Webpage. Department of Ports and Harbors. Available at http://www.unalaska-ak.us/index.asp?Type=B_BASIC&SEC={16875BA3-C037-4BA5-B275-E05AB87F9FBF}. July 29, 2010.
City of Unalaska. Comprehensive Annual Financial Report, FY 2009. Available at http://www.commerce.state.ak.us/dcra/commfin/Unalaska/UnalaskaFY09Audit.pdf. July 29, 2010a.
City of Valdez. Management Discussion and Analysis, Basic Financial Statements, Required Supplementary Information, Additional Supplementary Information and Compliance Reports, FY 2008. September 28, 2009.
City of Whittier. Basic Financial Statements, Supplementary, Financial Information, and Single Audit Reports, FY 2008. September 25, 2009.
City of Whittier webpage. Welcome to Whittier. Available at www.wittieralaska.gov. August 3, 2010.
Colt, Steve et al. The Regional Economy of Southeast Alaska. March 2007. Available at http://www.iser.uaa.alaska.edu/Publications/SoutheastEconomyOverviewfinal4.pdf. July 27, 2010.
Denali Commission. Project Database System. Available at https://www.denali.gov/dcpdb/index.cfm?fuseAction=ProjectSearch.CheckSearchCriteria. July 29, 2010.
FedBizOpps.gov (FBO). Federal Business Opportunities. Available at https://www.fbo.gov/index?s=main&mode=list&tab=list. July 29, 2010.
Forgey, Pat. “Parnell Strikes 300 million from state budget.” Juneau Empire Online. 4 June 2010. Available at http://www.juneauempire.com/stories/060410/sta_648857542.shtml. July 28, 2010.
Lirn, TC, HA Thanopoulou, MJ Beynon, and AKC Beresford. “An Application of AHP on Transhipment Port Selection: A Global Perspective.” Maritime Economics & Logistics, 6 (70-91). 2004.
Martin, Mary Catharine. “Statter Harbor Boat Launch Moves Forward” Juneau Empire Online. 11 April 2010. Available at http://www.juneauempire.com/stories/041110/loc_604642196.shtml. July 28, 2010.

Baseline Assessment of Alaska’s Ports and Harbors
Final 41
Matanuska-Susitna Borough. Port MacKenzie: Gateway to the Matanuska-Susitna Borough. Available at http://www.portmackenzie.com/. August 19, 2010.
Municipality of Anchorage. Comprehensive Annual Financial Report , FY 2009. June 4, 2010.
Municipality of Skagway. Skagway Port Development Plan: Skagway’s Yukon Port Project. January 2010. Available at http://www.skagway.org/vertical/Sites/%7B7820C4E3-63B9-4E67-95BA-7C70FBA51E8F%7D/uploads/%7B206D44BE-85B9-44E9-8A55-110869F9DA9C%7D.PDF. August 5, 2010.
Municipality of Skagway website. Port of Skagway. Available at http://www.skagway.org/index.asp?Type=B_BASIC&SEC=%7B21FD65B5-E64D-488B-9F51-51B650B9D6DE%7D. Accessed on August 19, 2010a.
NANA Regional Corporation. Red Dog FAQ. Available at http://www.nana.com/index.php?option=com_content&task=category§ionid=22&id=196&Itemid=690. August 4, 2010.
Northern Economics, Inc. The Seafood Industry in Alaska’s Economy. Prepared for Marine Conservation Alliance, At-Sea Processors Association and Pacific Seafood Processors Association. January 2009.
Petro Star, Inc. Petro Star Valdez Refinery website. Available at http://www.petrostar.com/vdz/ vdz.asppage=refining. July 20, 2010.
The Port of Anchorage. Intermodal Expansion Project. Available at http://www.portofanchorage.org/ov_project.html. August 3, 2010.
Southwest Alaska Municipal Conference (SWAMC). Southwest Alaska. Available at http://www.swamc.org/html/economic-profile.php. July 29, 2010.
State of Alaska. FY 2011 Capital Budget Request for funding: Bristol Bay Borough – Port of Bristol Bay – Improvements Phase II. Available at http://gov.state.ak.us/omb/11_omb/budget/CapBackup/proj54050.pdf. August 3, 2010a.
State of Alaska, Legislative Finance Division. Historical Capital Enacted Budgets. 1999-2008. Available at http://www.legfin.state.ak.us/DynamicReports/SelectReport.php. February 2010.
United States Army Corps of Engineers (USACE). Ports of South Central and Western Alaska: Port Series No. 39. NDC-05-P-5. Revised Edition 2005.
United States Army Corps of Engineers. Ports of Southeast Alaska: Port Series No. 38. NDC-03-P-5. Revised Edition 2003.
United States Army Corps of Engineers. Map of transportation regions. 2011.URS Corporation. Alaska Barge Landing system Design; Data Gathering Study and Preliminary Design Planning. Prepared for U.S. Army Engineer District, Alaska. January 2009.

Baseline Assessment of Alaska’s Ports and Harbors
42 Final
Appendix A: Planned and/or Underway Projects
Table 38. Planned and/or Underway Projects Listed by Survey Respondents
Location Facility Planned Project Cost ($)
Year Completion
(est.)Arctic
Barrow Barrow Boat Dock City of Barrow Boat Harbor 109,208 –Interior
Fairbanks Pioneer Park Boat Launch
Improve Parking Area - expand public parking adjacent to boat launch
100,000 2015
Dredge and harden boat launch 100,000 2015Manley Hot Springs
Hot Springs Landing (Tanana River)
Hot Springs Landing Improvement Project by ACOE
– –
Nenana Port of Nenana Bank Stabilization / Sheet pile Installation
3,500,000 2011
Tanana City Dock Deadman / Tie offs 15,000 –
Prince William SoundCordova Loading Dock Redecking 25,000 2010
New Harbor Floats G-M Replace “G” Float 2,000,000 2020Replace transient float access 150,000 2020Electrical Upgrade 1,500,000 2020
Seward Coal ship loading dock Fugitive dust control improvements – –Seward Marine Center ARRV Pier. Put in a wave barrier
and dock for the ARRV25,000,000 –
Seward Marine Industrial Center
Vessel Washdown Station for travellift / storm water
750,000 –
Breakwater completion 17,000,000 Dependent on funding availability
Alaska Railroad East Dock
Basin dredging to increase mooring basin depth to -42' MLLW
500,000 2011
Approach basin maintenance dredging to -30' MLLW
210,000 2011
Alaska Railroad West Dock
Dredging of mooring basins to -42' MLLW
1,100,000 2011
Maint. dredging of approach basin 200,000 2011Seward Small Boat Harbor
2/Security Float - 870 linear feet of flats (new) in East Harbor
4,000,000 2012
Replacement of D Float - Replace Floats from 1965
1,700,000 2013
East Breakwater Extension - add 215 feet to Breakwater of Harbor
– 2011
Harbor Dredging - Local and Federal Areas
1,500,000 2012

Baseline Assessment of Alaska’s Ports and Harbors
Final 43
Location Facility Planned Project Cost ($)
Year Completion
(est.)Whittier Barge Slip Convert stern road ramp from rail
only to rail & container forklift traffic4,000,000 2010
SouthcentralAnchorage North Star Terminal /
Anderson DockDock extension – –
Port of Anchorage Port of Anchorage Intermodal Expansion Project
750,000,000 2015
Port of Anchorage Terminal No. 2 Wharf
Port Expansion Project; Contact POA for details
– See POA
Homer City of Homer Fish Dock Fish dock grating replacement 40,000 2013Ice delivery system rebuild 10,000 2011Sea Com Card reader replacement 50,000 2011
Kenai Pacific Star Seafoods Pacific Star dock repair of sheetpile dock
150,000 2010
Point MacKenzie
Port MacKenzie Barge Dock expansion (286 Acres) 3,700,000 2010Rail line extension (to Parks Hwy) and rail off-load facility at port
300,000,000 2013
Hill Reduction and Paving (2 Miles) 7,200,000 2010Ferry landing 18,000,000 2011
Port Graham
Port Graham Dock New dock study; Denali commission feasibility study
– –
Harbor Feasibility Study – –Tyonek North Forelands Dock Barge Landing 2,000,000 Not yet
fundedFendering 250,000 Not yet
fundedExtension to Cape Class Depth 40,000,000 Not yet
fundedSoutheast
Akutan City Dock Funding request put in by DOT forimprovement (Tustamena)
500,000 2010
Angoon Angoon Ferry Terminal Angoon Ferry Terminal 7,000,000 2010
Angoon Oil and Gas New Pilings 20,000 2010New Deck on Walkway 5,000 2010
Coffman Cove
Harbor Harbor Expansion 1,800,000 2010
Charter dock 250,000 2011Barge ramp and bulkhead 2,500,000 –Northland Ferry 750,000 –
Douglas Douglas Boat Harbor Dredging and float replacement 10,000,000 2011Floating Breakwater 1,750,000 2010
Gustavus Gustavus Dray New Dock 20,000,000 2010New tank farm & pipeline 2,000,000 2010
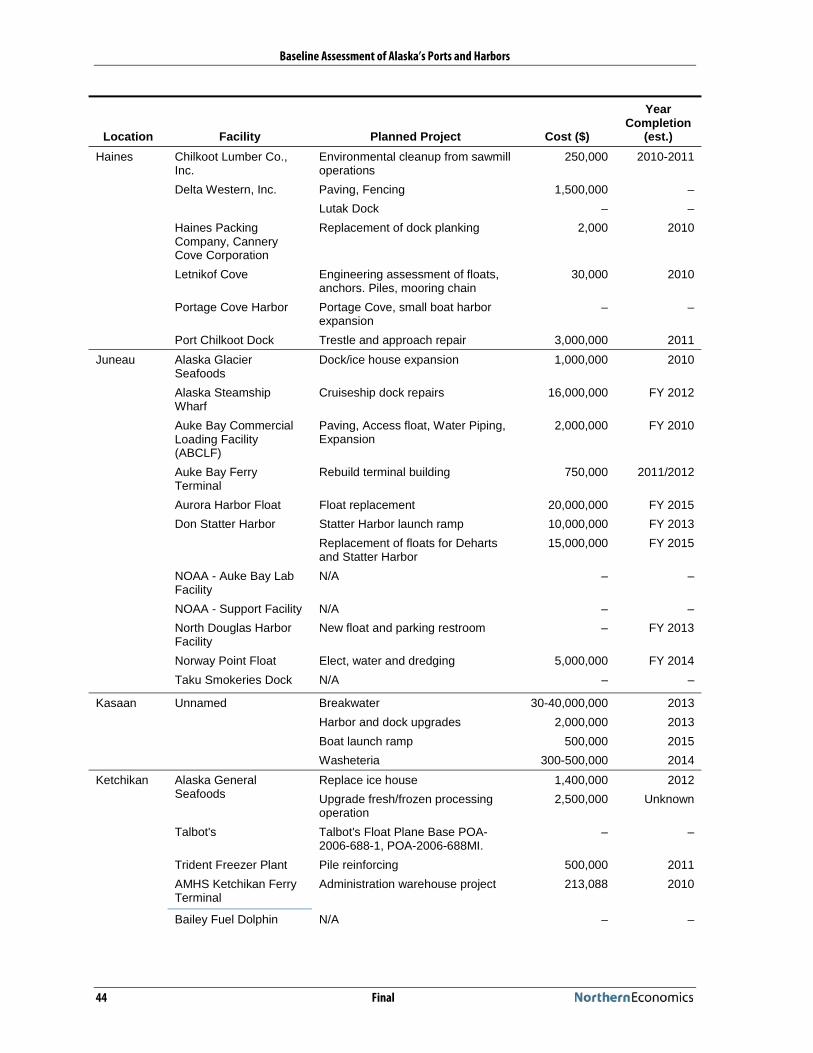
Baseline Assessment of Alaska’s Ports and Harbors
44 Final
Location Facility Planned Project Cost ($)
Year Completion
(est.)Haines Chilkoot Lumber Co.,
Inc.Environmental cleanup from sawmill operations
250,000 2010-2011
Delta Western, Inc. Paving, Fencing 1,500,000 –Lutak Dock – –
Haines Packing Company, Cannery Cove Corporation
Replacement of dock planking 2,000 2010
Letnikof Cove Engineering assessment of floats, anchors. Piles, mooring chain
30,000 2010
Portage Cove Harbor Portage Cove, small boat harbor expansion
– –
Port Chilkoot Dock Trestle and approach repair 3,000,000 2011Juneau Alaska Glacier
SeafoodsDock/ice house expansion 1,000,000 2010
Alaska Steamship Wharf
Cruiseship dock repairs 16,000,000 FY 2012
Auke Bay Commercial Loading Facility (ABCLF)
Paving, Access float, Water Piping, Expansion
2,000,000 FY 2010
Auke Bay Ferry Terminal
Rebuild terminal building 750,000 2011/2012
Aurora Harbor Float Float replacement 20,000,000 FY 2015Don Statter Harbor Statter Harbor launch ramp 10,000,000 FY 2013
Replacement of floats for Deharts and Statter Harbor
15,000,000 FY 2015
NOAA - Auke Bay Lab Facility
N/A – –
NOAA - Support Facility N/A – –North Douglas Harbor Facility
New float and parking restroom – FY 2013
Norway Point Float Elect, water and dredging 5,000,000 FY 2014Taku Smokeries Dock N/A – –
Kasaan Unnamed Breakwater 30-40,000,000 2013Harbor and dock upgrades 2,000,000 2013Boat launch ramp 500,000 2015Washeteria 300-500,000 2014
Ketchikan Alaska General Seafoods
Replace ice house 1,400,000 2012Upgrade fresh/frozen processing operation
2,500,000 Unknown
Talbot's Talbot's Float Plane Base POA-2006-688-1, POA-2006-688MI.
– –
Trident Freezer Plant Pile reinforcing 500,000 2011AMHS Ketchikan Ferry Terminal
Administration warehouse project 213,088 2010
Bailey Fuel Dolphin N/A – –

Baseline Assessment of Alaska’s Ports and Harbors
Final 45
Location Facility Planned Project Cost ($)
Year Completion
(est.)Ketchikan (cont’d)
Bar Harbor South Floats 1-9
Deck & bullrail repairs to floats 7, 8, & 9
58,000 2010
Berths 1 & 2 Repairs to piles & dredging 250,000 2010Berths 3 & 4 Corrosion repairs to pile caps 600,000 2010Ketchikan Ship Yard Ship fabrication & assembly
facilities at Ketchikan Shipyard73,000,000 2015
Knudson Cove Replace launch ramp 1,600,000 2011Thomas Basin Replace finger floats on floats 2, 3,
& 41,000,000 1,000,000
Replace finger floats on float 5 800,000 2011Little Port Walter
NOAA facility Dock plank replacement 30,000 2010
Boat haul and float replacement 150,000 2010Personnel & Float plane dock replacement
75,000 2010
Pelican Pelican Boat Harbor Multi-use cargo dock/barge landing 5,500,000 –Salmon Hatchery 3,000,000 –Seaplane Mooring Dock 250,000 –Alaska Marine Highway Terminal 2,000,000 –
Harbor Breakwater expansion – –Petersburg Petersburg Fisheries Floor Replacement 198,000 2010Port Alexander
Back Dock State of Alaska to repair approach to back dock
– –
Sitka ANB Harbor ANB replacement 6-7,000,000 2013Sitka Float Plane Dock Complete replacement 6,000,000 2014
Sitka sea plane base – –
Skagway Skagway Ore Terminal See Skagway Port Development Plan
– –
Port of Skagway Seawall – Railroad Dock (2 cruiseships) completed summer 2009 - 5 phases
5,000,000 2009
Small Boat Harbor Wave Barrier 4,000,000 2009Port Gateway Project TIGGR Grant Pending - US D.O.T. - MARAD
117,000,000 2013
Small Boat Harbor Phase 1B dredging and dock improvements
11,500,000 2012
Skagway Small Boat Harbor
Skagway Small Boat Harbor Master Plan - Phase 1B
$10,600,000 –
Tenakee Springs
City Dock City Dock deck rehabilitation 1,100,000 2010
Marine Highway Tenakee 450,000 2010Tenakee Springs Boat Harbor
Replacement of 2 floats - (A&B) by DOT/PF-AK-Harbor
– –

Baseline Assessment of Alaska’s Ports and Harbors
46 Final
Location Facility Planned Project Cost ($)
Year Completion
(est.)Thorne Bay Thorne Bay Harbor Davidson landing harbor
improvement7,000,000 2010
Main harbor seaplane dock conversion
100,000 2011
Whale Pass Whale Pass Dock Expansion – add additional slips
1,000,000 2011
Build breakwater around dock 40,000 2011
Seawall improvements. Replace old logs w/cement & rock.
150,000 2011
Wrangell Wrangell Oil Inc. Replace and re-secure outside whaler on concrete float
125,000 2020
Replace and repair cross braces under length of dock
45,000 2020
Yakutat Unnamed Bathrooms, boat haul out, fish cleaning
– –
Remove power pole from launch ramp
– –
SouthwestDillingham Small Boat Harbor
Wharf/BulkheadBulkhead Extension / Crane Installation
1,000,000 2010
King Cove Robert Newman Boat Harbor
Completely redo King Cove Harbor new float with power
6,000,000 2010
King Cove Small Boat Harbor Transient Dock
New decking & fender piles 500,000 2010
Robert E. NewmanHarbor
Narrow Entrance to cut down on swell into harbor
– –
Small boat harbor floats A-C
Total float Replacement 5,000,000 2010
Small Harbor Tee Dock Some new fender pile & Bull rail replacement - some decking
500,000 2010
King Salmon
Katmai N.P. - Naknek River Dock
Replacement of AV-Gas Fuel Tank 5,000 2011
US Fish & Wildlife Service
Replace Old Dock Structures 75,000 2012
Kodiak North Pacific Seafoods / Alaska Pacific Seafoods
N/A – –
St. Herman Harbor None planned but many floats are 25+ years old & will need replacement w/I 5 years
– –
St. Paul Harbor Dredge entrance channel USACE project
2,000,000 2012
Larsen Bay Boat Harbor We are in the process of putting new lights in harbor, still finding out details
– –

Baseline Assessment of Alaska’s Ports and Harbors
Final 47
Location Facility Planned Project Cost ($)
Year Completion
(est.)Naknek Delta Western Dock Replacement – 2010
Alaska General Seafoods
Freezer Plant East Extension 125,000 2011
Freezer Plant West Extension 115,000 –Port of Bristol Bay Fisherman’s Dock – –Ocean Beauty Seafoods Dock Deck replacement 150,000 2008
Old Harbor City Dock Old Harbor City Dock 8,000,000 Funding Dependant
Boat Harbor Harbor Floats & Slips 2,000,000 2010Harbor Dredging and Channel 2,000,000 Funding
DependantOld Harbor Port Facilities
New Dock 8,000,000 Depends on Funding
Harbor & Channel Dredging 2,000,000 Depends on Funding
Port Lions City Dock and Ferry Terminal
Port Lions City Dock and Ferry Terminal Replacement
11,000,000 2015-2016
Port Lions Small Boat Harbor
Port Lions Small Boat Harbor Improvement Project Phase 1
3,500,000 2011
Sand Point Robert E. Galovin Small Boat Harbor
Replace Infrastructure in Robert E. Galovin Harbor
– –
Peter Pan Seafoods, Inc New Decking 350,000 2011
St. George St. George Island Harbor
Build two additional breakwaters and dredging of inner harbor to -20
25,000,000 2015
Fish Handling Facility St. George Harbor
4,000,000 2010
St. Paul St. Paul Harbor or St. Paul Municipal Harbor
Small Boat Harbor 21,000,000 2011
Berth dredge 3,000,000 2011
SBH Infrastructure 6,000,000 2014
North Dock Repairs 100,000 –
Togiak Togiak Corps of Engr. Boat Harbor, Dock, dredged channel to Togiak Bay 1980's
– –
BBEDC study for Dock & Boat Ramp
4,000,000 –
Sea wall and Dock 2,000,000 –

Baseline Assessment of Alaska’s Ports and Harbors
48 Final
Location Facility Planned Project Cost ($)
Year Completion
(est.)Unalaska/Dutch Harbor
Westward Seafoods Resurfacing concrete 500,000 2012
Ballyhoo Wharf (Position 3 UMC)
UMC Position 3 resurfacing/repaving
350,000 Included in paving of Ballyhoo
Road.Marine Center Wharf (UMC Position 4-7)
Position 4-7 fender system repair 450,000 2011UMC back reach grading and drainage / paving. This project includes all positions (1-7) of the UMC.
1,930,000 2011
UMC Position 4-7 Surface Repair / slab leveling
600,000 2010
Anode Replacement Light Cargo Dock, UMC position 1-7, Bob Storrs Small Boat Harbor
1,920,000 2010
Port of Dutch Harbor New small boat harbor 30,000,000 2013Robert Storrs International Small Boat Harbor (Unalaska Small Boat Harbor Floats A and B)
Replacement of floats and gangways at Robert Storrs International Small Boat Harbor
3,796,772 2012
Robert Storrs International Small Boat Harbor (Small Boat Harbor Float C)
Replacement of all floats and gangways at Robert Storrs International Small Boat Harbor
3,796,772 2012
UMC USCG Wharf (Position 1&2 UMC)
UMC back reach grading and drainage/paving (this includes all of UMC position 1-7)
1,930,000 Not Scheduled
Yukon-KuskokwimBethel Beach #2 Petro port expansion – –
Napaimute Napaimute Barge Landing
Napaimute Freight Storage/Barge Landing - 4 acres have been reserved
– –
Tununuak Unnamed Sanitation improvement under planning
– –
ATV Geo-Block trails 2,300,000 2010-2011
Relocation of Airport 25,000,000 2011-2012Source: USACE, 2010

Baseline Assessment of Alaska’s Ports and Harbors
Final 49
Appendix B: Projects Needed but Not Yet Planned
Table 39. Projects Needed but Not Yet Planned, as Listed by Survey Respondents
Location Facility Planned Project Cost ($)
Year Completion
(est.)Arctic
Barrow Barrow Boat Dock Search & rescue equipment 109,208 –Interior
Manley Hot Springs
Hot Springs Landing (Tanana River)
Boat launch & sanitary facilities 200,000 2011
Tanana City Dock Recycling Center 350,000 2013-2015Nenana Port of Nenana Dock infrastructure sheetpile installation 2,000,000 –
Replace marine ways 1,500,000 –Dock Yard Dock Fence 3,200,000Water/Sewer Extensions 1,200,000
NorthwestCrooked Creek
Barge Landing Barge landing & dock 800,000 2011
Kotzebue Drake Construction Boatways
Sheetpile portion of landing 1,000,000 Next 5 yrs.
Nome Nome Small Boat Harbor
Harbor lighting project 300,000 2011Electrical hookups 100,000 2012Additional docking space 2,000,000 2012-13
Port of Nome –Causeway
Additional c-cell dock 1,500,000 2012
Prince William SoundCordova 3 Stage Dock Redecking/bullrail replacement 75,000 2020
Municipal Dock (AKA - Oceandock)
Bullrail replacement 750,000 2020Overhead light replacement 500,000 2020
Old Grid Approach Redecking / bullrail replacement 60,000 2020Prime Select Seafoods
Fuel Buying Station for Direct Marketers & small processors
– –
Trident Seafoods Inc. Cordova South
Unknown – –
Seward Alaska Railroad East Dock
Expand dock to 315' wide from current 200'.
500,000 2015
Extend dock 400' south 15,000,000 unknownSeward Marine Industrial Center
Repair of North Dock 5,000,000 –
Dredging of SMIC Basin 1,000,000 –
Seward Small Boat Harbor
NE fish cleaning dock 700,000 2014
Replacement of A,B,C & S floats 5,000,000 2015Replacement of launch ramps 1,400,000 2018

Baseline Assessment of Alaska’s Ports and Harbors
50 Final
Location Facility Planned Project Cost ($)
Year Completion
(est.)Seward (cont’d)
Coal ship loading dock
Basin maintenance dredging 250,000 –
Seward Marine Center
Replace the warehouse 5,000,000 –
Valdez Valdez Ocean Dock Complete sheet pile on front of dock 500,000 –Southcentral
Anchorage North Star Terminal / Anderson Dock
Lighting 50,000 –Fencing 30,000 –Security cameras 10,000 –
Homer City of Homer Fish Dock
crane replacement 800,000 2020
Homer Small boat harbor Systems 1 and 2
Ramp Three / Ramp Three Approach. A, J, R, S float replacement
3,600,000 2015
System 5 Homer Small boat Harbor
Shore power pedestal upgrade 300,000 2013Heat traced Potable Water Station 60,000 2012Derelict Vessel removal – –
Kenai Kenai City Dock Paving road access/parking lot 500,000 N/APacific Star Seafoods Dock repair; aging dock needs lots of
work250,000 open
Lime Village
Lime Village Boat Dock
Public boat dock w/ small shelter / storage building.
60,000 –
Boat tie ups 5,000 –Ninilchick Deep Creek Custom
Packing, Inc.Dredging has stopped 300,000 YearlySheet pile 1,000,000 –Water/power/sewer – –
Point MacKenzie
Port MacKenzie Fuel tank farm 10,000,000 2015Second rail loop (3 miles) 12,000,000 2018Road Connection & traffic loop for Knik Arm Bridge crossing
10,000,000 2018
Anchorage ferry landing 22,000,000 2011Port Graham
Port Graham Dock new dock – –
SoutheastAngoon Barge Landing Barge Landing – Currently in
planning stage
Douglas Douglas Boat Harbor Breakwater access / gangway 5,000,000 Fiscal Year 2015
Gustavus Gustavus Dray Floating Breakwater – –Haines Portage Cove Harbor Dredging, uplands improvements – –
Breakwater extension for better protection
– –
New boat launch – –

Baseline Assessment of Alaska’s Ports and Harbors
Final 51
Location Facility Planned Project Cost ($)
Year Completion
(est.)Haines (cont’d)
Letnikof Cove Bathrooms 50,000 2011Replace chains holding docks to bottom 100,000 2011Replace floating breakwater and attached tank floats
500,000 2012
construct new seasonal timber floats 100,000 2011Lutak Dock Major upgrades to accommodate gas
pipeline business20,000,000 2015
Chilkoot Lumber Co., Inc.
Dock repairs - fender piles redecking surface
500,000 –
Haines Packing Co. -Cannery Cove Corp.
Piling repair 2,000 –New dock decking 20,000 –
Hollis IFA Ferry Terminal Hollis Terminal dredging. Maintenance Dredging from underneath transfer bridge float.
3,500,000 2011
Hoonah Hoonah Harbor and visitor Dock
Redecking of transient float – –
Hoonah Ferry Terminal
State of Alaska - Channel Construction -expanding parking - New Terminal Bldg
– 2010
Juneau Alaska Steamship Wharf
New cruise terminal 20,000,000 FY 2015
Auke Bay Commercial Loading Facility (ABCLF)
Boat haul out 10,000,000 FY 2012
Aurora Harbor Float Approach dock 10,000,000 FY 2015Don Statter Harbor Replacement of ways and boat lift 10,000,000 FY 2020
Charter boat landing 6,000,000 FY 2015Harris Harbor Replacement 20,000,000 2024Indian Point Dock -National Park Service
Ramp replacement unknown unknownFloat replacement unknown unknownCrane repair unknown unknownPier repair unknown unknown
Intermediate Vessel Float (IVF)
Upgrade & replacement 10,000,000 FY 2018
Lightering Float Dock replacement 24,000,000 FY 2013National Guard Pier Float replacement 10,000,000 FY 2015NOAA - Auke Bay Lab Facility
Float cleaning 50,000 2011Electrical service 100,000 2011Dock plank replacement 100,000 2011
NOAA - Support Facility
Dock piling repair and decking 2,000,000 N/ADock & float electrical upgrades 500,000 N/A
Norway Point Float Condos, shops, and developments 50,000,000 FY 2030

Baseline Assessment of Alaska’s Ports and Harbors
52 Final
Location Facility Planned Project Cost ($)
Year Completion
(est.)Ketchikan Air Marine Harbor Dock Replacement 100,000 2015
Bar Harbor North Floats 10-17
Replace access ramps & electrical services
2,200,000 unknown
Bar Harbor South Floats 1-9
Replace floats 1, 8 & 9 4,300,000 unknownReplace & repair launch ramp & replace grid
2,700,000 unknown
Berths 1 & 2 Replacement of wooden portions of Berth 1 & 2 with steel piles & concrete deck
26,000,000 unknown
Hole in the Wall Replace access ramp, floats & breakwater
2,500,000 unknown
Ketchikan Ship Yard (KSY)
A planning complete environmental assessment complete
73,000,000 2015
Thomas Basin Replace Float1, access ramps & grids 3,700,000 unknownAlaska General Seafoods
– –
Kupreanof Kupreanof State Float Repair rotten pilings & water soaked floats
N/A N/A
Little Port Walter
NOAA - Little Port Walter
Float cleaning 50,000 2011Electrical service 100,000 2011
Pelican Pelican Boat Harbor Boat launch ramp 1,500,000 –Fishermen's work float 500,000 -Replace E float 750,000 –Ice machine refurbishment 800,000 –Water distribution system – –Dredging of inner harbor – –Reconstruction of two oldest floats and attached finger floats
– –
Public Access Hoist – –Petersburg Petersburg Ferry
TerminalDock bumper "donuts" – –
City of Petersburg South Harbor
South Harbor cathodic protection of steel piles
140,000 –
Petersburg Fisheries Hoist/dock replacement 400 N/ACooling Tower 100,000 2010New float – dock system 400,000 2011
Petersburg Shipwrights, Inc.
300 ton travel lift 80,000,000 2012
Tamico Inc Float replacement 100-150,000 2012Land expansion 150-200,000 2020Dredging 100-150,000 2020
Point Baker Point Baker Vessel and Seaplane Float
Harbor facilities upgrade. Replace floats, creosote piling, boat grid underlayment, piling, gag lines, power & communication pedestals, waist level walk lighting. Possibly some skiff fingers.
1,000,000 –

Baseline Assessment of Alaska’s Ports and Harbors
Final 53
Location Facility Planned Project Cost ($)
Year Completion
(est.)Port Alexander
Front Dock Front dock repairs, new floatation, pilings, some decking
1,000,000 Whenever state gets
funding for repairs
Saxman Saxman Seaport Roof replacement, large warehouse 600,000 –
Skagway Port of Skagway* Ore dock improvements – –
Port expansion – –
Tenakee Springs
Tenakee Springs Boat Harbor
Feasibility study - freight barge landing, harbor area
unknown unknown
Thorne Bay Thorne Bay Harbor Main harbor float approach refurbish / replace
200,000 –
Breakwater for main harbor - construct – –Construct commercial dock for freight transfer
– –
Whale Pass
Whale Pass Dock expansion - add additional slips 100,000 2011Sea Wall - build sea wall to replace logs 150,000 2011Break Water - around dock 40,000 2011
Yakutat Unnamed Boat Haul out – –Bathrooms – –Power Grid – –
SouthwestDillingham Dillingham Small Boat
HarborBulkhead extension encompassing harbor to help eliminate erosion
2,000,000 –
Breakwater on out channel to help erosion
2,000,000 –
King Cove Robert E. Newman Harbor
400 ft sheet pile dock along road to deep water dock
8,000,000 2020
King Salmon
US Fish & Wildlife Service
Grade and surface boat ramp 50,000 –
Kodiak Pier 1 - Ferry Dock Replace w/I 3 years 10,000,000 2013Pier 2 Fisherman’s Terminal
Passenger Access Sidewalks – –
Pier III Cargo Terminal
New Crane – –
Transient Float – N.I. Channel
Kodiak Channel Transient Float Replace Float 780' & Ramp
– –
St. Herman Harbor Replace E-L floats 25,000,000 2015Larsen Bay Anton Larsen Bay
DockReplace float 1,500,000 –
Boat Harbor – –

Baseline Assessment of Alaska’s Ports and Harbors
54 Final
Location Facility Planned Project Cost ($)
Year Completion
(est.)Naknek Port of Bristol Bay Fishery support center / community fish
processing plant1,000,000 –
Cold storage facility 1,500,000 –Slurry ice delivery 500,000 –
Ocean Beauty Seafoods
Piling replacement / cap replacement 250,000 2015
Alaska General Seafoods
Upriver dock extension – –
Old Harbor Old Harbor Port Facilities
Power (electrical meters) to commercial slips
250,000 –
Harbor and channel dredging 2,000,000 Funding Development
Sand Point Robert E. Galovin Small Boat Harbor
Water & electricity & floats to new harbor – –
St. George Island
St. George Island Harbor
Warehouse - St. George Harbor 1,500,000 –Inter Island Ferry Service St. George to St. Paul
2,000,000 –
St. Paul Island
Saint Paul Harbor/ Municipal Harbor
Replace harbormaster's offices 600,000 –Construct water and sewer and electric to new SBH
– –
Travel Lift 2,000,000 2015
Ocean Outfall 2,500,000 2014
Togiak Unnamed Replace 25 year old timber seawall with seawall/dock structure
– –
Yukon-KuskokwimBethel Beach #1 Resurface 1,000,000 –
City of Bethel Seawall Dock
East side of dock 6,000,000 –Resurface the dock 3,000,000 –
Port of Bethel Bethel City Dock study cond. survey 6,500,000 –Napaimute Napaimute Barge
LandingNapaimute freight storage & barge landing
– –
St. Mary's Boreal Fisheries Inc. Finish pier to its approved length 100,000 2015* Respondent referred to the Port Development Plan adopted in 2008, available at www.skagway.org; projects listed were taken from this source.Source: USACE, 2010

Wisdom • Trust • Relevance • Innovation
Alaska Regional Ports
Appendix C:
Regional Hubs AnalysisFinal Report
Prepared for the
U.S. Army Corps of Engineers
and
Alaska Department of Transportation
and Public Facilities
January 2011
Under Contract to
URS Corporation


Regional Hubs Analysis
Final Prepared for
U.S. Army Corps of Engineers Alaska District and the
Alaska Department of Transportation & Public Facilities
January 2011
Prepared by
Under contract to URS Corporation

Preparers
Team Member Project RolePatrick Burden Project DirectorMichael Fisher Project Manager, Analyst, AuthorAlexus Bond AnalystTerri McCoy Editor
Please cite as: Northern Economics, Inc. Regional Hubs Analysis. Prepared for U.S. Army Corps of Engineers Alaska District and the Alaska Department of Transportation & Public Facilities. January 2011.

Final i
Contents
Section Page
1 Introduction ............................................................................................................................. 1
2 Criteria for Regional Hubs .......................................................................................................... 3
3 Networks of Major Transportation Companies ............................................................................ 5 3.1 Arctic ................................................................................................................................. 5 3.2 Interior ............................................................................................................................... 5 3.3 Northwest .......................................................................................................................... 6 3.4 Prince William Sound ......................................................................................................... 6 3.5 Southcentral ....................................................................................................................... 7 3.6 Southeast ........................................................................................................................... 7 3.7 Southwest ........................................................................................................................... 8 3.8 Yukon-Kuskokwim Delta..................................................................................................... 9
4 Preliminary Identification of Regional and Subregional Hubs ................................................... 10
5 References .............................................................................................................................. 13 Table Page
Table 1. Preliminary Regional and Subregional Hubs, with Criteria Ratings ....................................... 11 Figure Page
Figure 1. Transportation Regions ........................................................................................................ 2 Figure 2. Map of Preliminary Regional and Subregional Hubs .......................................................... 12

Regional Hubs Analysis
ii Final

Regional Hubs Analysis
Final 1
1 Introduction
This white paper provides criteria for regional and subregional hubs and presents a preliminary list of hubs in each of the eight regions used in the Alaska Regional Ports project. Criteria for what constitutes a regional hub were developed from a transportation literature review, interviews with several transportation companies operating in Alaska, and additional research. The preliminary list of hubs was developed from the interviews and by applying the criteria to port facilities in each region of the state. The preliminary hubs are intended for discussion purposes only, with the final list of regional and subregional hubs to be determined by an advisory group (consisting of members from the U.S. Army Corps of Engineers, Alaska Department of Transportation and Public Facilities, Denali Commission, and Alaska Department of Commerce, Community and Economic Development) and participants at the Alaska Regional Ports Conference on November 18, 2010.
The purpose of identifying hubs is to identify the critical links in the maritime and riverine transportation networks present in each region of Alaska. By focusing on the hubs, funding agencies can maximize the effectiveness of their investments in port and harbor infrastructure because the improvements affect not only shipments into and out of the region, but also intra-regional shipments. The emphasis on hubs should not be to the detriment of the other cities and villages in the region, however, since these non-hub communities still have infrastructure needs. The identification of hubs should simply be the first step in analyzing each region’s transportation system and identifying where improvements will be most effective.

Regional Hubs Analysis
2 Final
Figure 1 shows a map of the regions used in this paper.
Figure 1. Transportation Regions
Source: USACE (2011)

Regional Hubs Analysis
Final 3
2 Criteria for Regional Hubs
Lirn et al. provides a detailed breakdown of each criterion, resulting in directly measureable factors used in the analysis. For purposes of this study, we have used three of the four criteria developed by Lirn and modified them for Alaska using relevant sub-criteria:
1. Geographical Location a. Cargo volumes b. Proximity to regional population or cargo generating industries c. Proximity to major shipping routes or competing/complementary ports
2. Physical and Technical Infrastructure a. Water depth, approach, protection from weather, and seasonal accessibility b. Congestion and available work space and uplands c. Appropriate facilities and equipment d. Intermodal links (road, rail, air)
3. Port Management and Administration a. Port regulations b. Administrative structure/port and harbor department c. Port safety and security
This analysis has further divided the hub selection into eight regions (in alphabetical order): Arctic, Interior, Northwest, Prince William Sound, Southcentral, Southeast, Southwest, and Yukon-Kuskokwim Delta. We also use a modified approach in which we allow for subregional hubs in some regions to reflect their unique geographical and logistical challenges.
We have defined two tiers of hubs: regional and subregional. Regional hubs represent the primary ports of entry for goods moving into or out of the state and region. Shipments to regional hubs tend to include a significant quantity of goods that are to be distributed elsewhere within the region or state, while shipments from regional hubs tend to be consolidated from multiple locations. Each region has at least one regional hub and some regions have more than one, based on the networks used for transportation of different types of goods.
Subregional hubs represent smaller ports of entry that tend to receive shipments from the regional hubs and distribute goods elsewhere in the region. Generally, subregional hubs do not directly send or receive goods from outside the state, though they can be used as staging areas for consolidation of intra-regional shipments.
A checklist can be helpful for organizing the hub identification process. While the primary criterion for hub status is the maritime industry’s use of the port as a hub, and the distinction between regional and subregional hubs is relative to the region under consideration, these checklist items can be helpful in evaluating new hubs or changes in hub status based on planned changes. Hub evaluation criteria could include:
� Is the port currently used as a hub by the marine transportation industry?
� Does the port handle cargo volumes above and beyond local needs (i.e., does the port handle cargo that is transshipped elsewhere within or outside of the region)?
� Does the port include fuel storage facilities used outside of the community?
� Is the port close to major regional population clusters?

Regional Hubs Analysis
4 Final
� Is the port close to major regional cargo generating industries (either import or export)?
� Is the port located close to a major shipping route?
� Is the port dominant to nearby competing or complementary ports?
� Is water depth and approach adequate for larger vessels or barges?
� Does the port offer protection from adverse weather events?
� Is the port accessible year-round?
� Does the port have available work space and uplands for cargo and fuel storage and handling?
� Does the port have appropriate facilities and equipment for handling vessel calls?
� Does the port have intermodal links, including road, rail, or a jet-capable airport?
� Does the port have an established tariff and set of port regulations?
� Does the community have a dedicated port/harbor department?
� Does the port have safety and security measures to prevent unauthorized access and tampering with stored cargo?

Regional Hubs Analysis
Final 5
3 Networks of Major Transportation Companies
We have interviewed staff from several transportation companies operating in Alaska.1
The networks used by the companies interviewed depend on the types of materials they transport and, to some extent, each company’s history. Cargo barges are able to handle almost any level of onshore facilities, from docks to landing pads or beaches. When in protected areas, fuel barges can make transfers on the water. Container ships, on the other hand, require more extensive onshore facilities for handling and storing containers. Because of these basic differences, the definition of a hub differs from shipper to shipper and from commodity to commodity.
In this section, we discuss those companies’ hubs and the basis for selecting those hubs.
The following subsections discuss the hubs, investment needs, and other transportation-related issues by region.
3.1 Arctic
The Arctic is a unique region characterized by very long approaches with shallow water, as well as a very limited operating season. The deepest water along the coast is about 12 feet. Barrow could be considered a regional hub because of its size, central location, jet service, and services available in the community. Likewise, Prudhoe Bay could also be considered a regional hub due to its location, the presence of several private docks, road and jet access, and the fact that it is the center of oil and gas activity. The lack of connective infrastructure between other Arctic ports makes it impractical for Barrow or Prudhoe Bay to be the centers of a hub and spoke network, however, for Point Hope, Point Lay, Wainwright, and Kaktovik. Outside of Deadhorse and Prudhoe Bay, which are connected to the highway system via the Dalton Highway, the only other year-round mode of transportation between communities is by air. The short operating season on the North Slope also makes it impractical to justify significant infrastructure investment unless it can be tied to an economically beneficial activity.
3.2 Interior
Interior Alaska’s communities are located along the road system or major rivers. The major rivers in the region are the Yukon, Tanana, and Koyukuk. Nenana serves as a regional hub for the Tanana and Yukon Rivers. Its location is conducive to serving the entire river system all the way downriver to where ocean barges access the mouth of the river. Ocean barges typically use Emmonak or Alakanuk for freight transfers. Nenana’s intermodal connections with the Parks Highway and Alaska Railroad also make it a convenient hub. Tanana occasionally serves as a subregional hub for river barges though it does not have port infrastructure or a ports department. Tanana could see additional port development if a road were extended to the community. Koyukuk might also serve as a subregional hub for cargo moving up the Koyukuk River from the Yukon, though it also lacks infrastructure and a ports department.
River barge operators have installed their own buoys and dead man anchors where needed. Traditionally there has not been investment by the Corps in this infrastructure, although the Denali
1 Interviewed companies include Crowley, Delta Western, Lynden/Alaska Marine Lines, Ruby Marine, Samson Tug and Barge, and Totem Ocean Trailer Express (TOTE). Brice Marine Services and Horizon Lines were contacted but did not respond to the interview request in time to be represented. Northland Services was contacted but declined to be interviewed.

Regional Hubs Analysis
6 Final
Commission has undertaken such projects in recent years. In the future, investment in buoys, dead man anchors, and gravel landing pads in non-hub communities may be the best investment. Barge companies have developed their operations to be effective with minimal infrastructure, so investment in docks and other facilities likely may not provide sufficient benefit to justify the cost. Larger investments would also require more maintenance, which could lead to higher user fees and a higher cost to consumers.
On the Lower Yukon, Alakanuk and Emmonak are de facto hubs with service directly from the Puget Sound/Cook Inlet regions. River barges move cargo upriver from these locations. These ports are discussed in the section on the Yukon-Kuskokwim Delta.
The Interior is well connected to other intermodal facilities, though outside of the railbelt and the highway system, the intermodal options disappear rapidly. Nenana’s location on the rail line and Parks Highway provide it with multiple access options, including jet service via the Fairbanks International Airport located approximately 60 miles to the north. Alakanuk and Emmonak, however, are limited to only water and air access.
3.3 Northwest
Kotzebue is the logical regional hub for the Northwest, though the water is shallow and barges must lighter in to the community for ten miles or more. It is one of the two large communities in the region and has both ocean access and jet service from Alaska Airlines. Port facilities are privately owned and managed, so the city does not have a port department. Development of Cape Blossom or Cape Espenberg has been suggested to provide an alternate port site with deeper water than Kotzebue. The ADOT&PF is investigating the feasibility of developing a port at Cape Blossom.
Nome is also a regional hub for parts of the Northwest region and features ocean access and jet service from Alaska Airlines. The city has the largest population in the region and has developed port facilities to accommodate cargo handling for regional needs. Nome serves as a hub for communities on the regional road system, along Norton Sound, and inland. It has also been used as a transfer point for shipments heading farther north.
Fuel and cargo are transferred to lighter vessels at sea for many regional deliveries. A number of protected areas with deep water are used for fuel transfers, including Port Clarence. To the extent possible, many vessels make these transfers outside of ports in order to avoid port fees. This study has classified Port Clarence as a subregional hub based on its use for transfers, though the port does not have any infrastructure used by the barge fleet.
With the exception of the roads from Nome to the nearby communities of Teller and Solomon, transportation in the region is limited to air, water, and cross-country land travel by ATV or snowmachine. Both Nome and Kotzebue have scheduled jet service, with smaller planes used to transport people, mail, and cargo from these hub communities to regional villages.
3.4 Prince William Sound
Valdez is a hub for serving Fairbanks and other eastern and central Interior Alaska communities that are connected by road. Seward and Whittier are used as hubs for deliveries to Anchorage, the Matanuska-Susitna Borough, and the rest of the Kenai Peninsula Borough.
The three regional hubs have port and harbor departments, published tariffs, and a combination of public and private infrastructure. All three have highway access and air facilities ranging from a small airstrip in Whittier to a charter-only airport in Seward to an airport with regular scheduled service with

Regional Hubs Analysis
Final 7
a regional carrier in Valdez. Seward and Whittier also have rail access. With highway access, these communities have access to all other communities on the road system, giving them some value as potential alternatives to the Port of Anchorage if the port were not able to accommodate shipments. Valdez and Whittier, along with Cordova, are scheduled stops for ferry service provided by the Alaska Marine Highway System (AMHS).
3.5 Southcentral
Anchorage is the dominant port for cargo and fuel in Southcentral Alaska, handling upwards of 85 percent of the cargo that moves into the state. While concerns have been raised about the suitability of the port due to its extreme tides and other physical factors, Anchorage and the Matanuska-Susitna Borough do constitute a majority of the state’s population and the Port of Anchorage provides superior access to intermodal connections (highway, rail, and jet access) and services. The Port of Anchorage operates as an enterprise fund within the Municipality of Anchorage and has all of the characteristics of a major port in terms of administration, regulations, a published tariff, and safety and security measures.
The greatest challenge in accessing the Port of Anchorage is the water depth. Dredging is required on a regular basis and the Fire Island Shoal has become a hindrance to access, often causing ships to delay until the tide reaches +9 feet. Unknown factors have also led to the creation of a MacKenzie Shoal that is approaching the Port of Anchorage. Once the port expansion is complete, it is thought that the long flat face will allow natural scouring. Until then, however, the shoal and other accumulation have required weekly dredging to maintain the -35 foot contract depth.
Homer serves as a subregional hub for the Kenai Peninsula. The City has a port and harbor department with published tariffs and regulations. It has port and harbor facilities, highway access, and a small airport with scheduled air service on a regional carrier. Its location on the south end of the Kenai Peninsula makes it an attractive location for deliveries within that area, though it is at a disadvantage to Seward, Whittier, and other ports that offer closer access to the majority of the state’s population. Homer is a terminal for AMHS’ service to Kodiak and communities further out the Alaska Peninsula and the Aleutian Chain.
Port MacKenzie, located across Knik Arm from the Port of Anchorage, is developing as a bulk cargo port. The port has a substantial amount of developable land and is pursuing a rail link to the port. Until the rail link is developed, the port only has highway access, though the roads between the port and the Parks Highway may not be sufficient for many types of heavy or high-volume cargo traffic. Port MacKenzie’s operations qualify it as a subregional hub, though this could change if additional road and rail-based infrastructure were developed to serve the port. At present, the port operates under the borough manager’s office with limited staff, rather than through a dedicated department or fund.
3.6 Southeast
The major ports and regional hubs within Southeast Alaska are Juneau, Ketchikan, and Petersburg. Each of these hubs have dedicated port and harbor departments, published tariffs, and both port and harbor facilities. Due to logistics and the network used by transportation companies, Puget Sound is also a de facto regional hub for Southeast Alaska. Deliveries to Southeast Alaska ports tend to be made in a linear fashion as the tugs and barges travel north from Puget Sound, through Southeast Alaska, into Prince William Sound, and then back to Puget Sound.
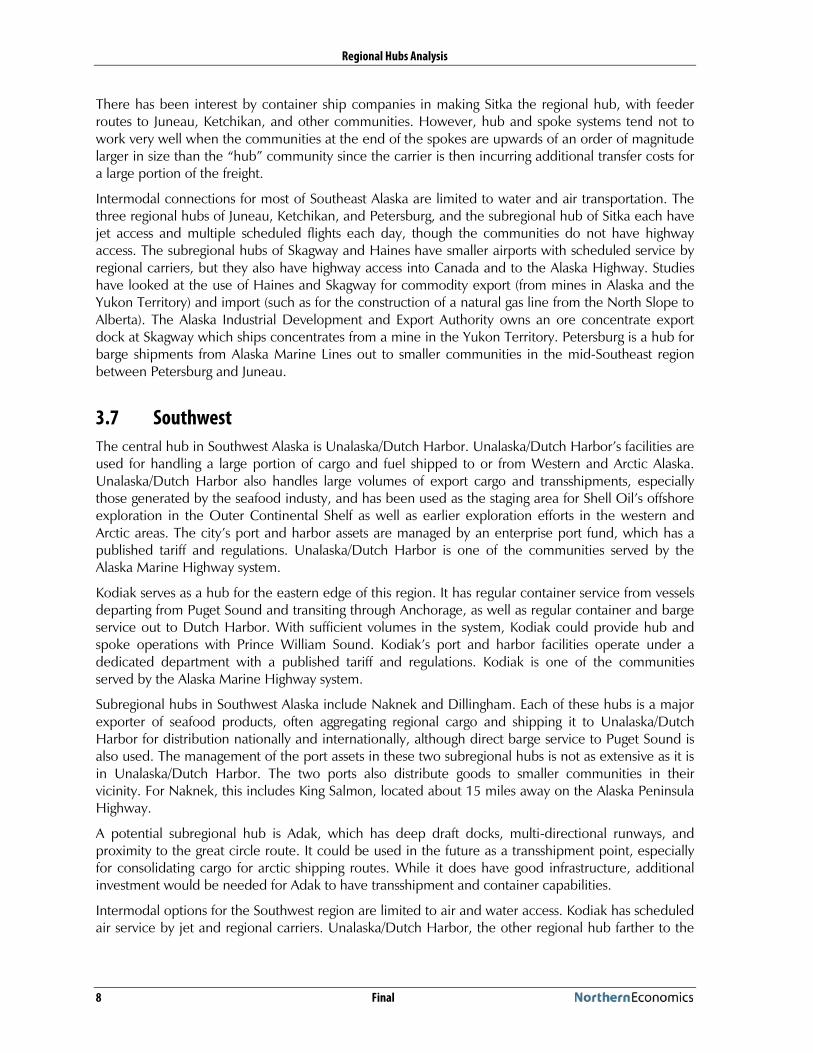
Regional Hubs Analysis
8 Final
There has been interest by container ship companies in making Sitka the regional hub, with feeder routes to Juneau, Ketchikan, and other communities. However, hub and spoke systems tend not to work very well when the communities at the end of the spokes are upwards of an order of magnitude larger in size than the “hub” community since the carrier is then incurring additional transfer costs for a large portion of the freight.
Intermodal connections for most of Southeast Alaska are limited to water and air transportation. The three regional hubs of Juneau, Ketchikan, and Petersburg, and the subregional hub of Sitka each have jet access and multiple scheduled flights each day, though the communities do not have highway access. The subregional hubs of Skagway and Haines have smaller airports with scheduled service by regional carriers, but they also have highway access into Canada and to the Alaska Highway. Studies have looked at the use of Haines and Skagway for commodity export (from mines in Alaska and the Yukon Territory) and import (such as for the construction of a natural gas line from the North Slope to Alberta). The Alaska Industrial Development and Export Authority owns an ore concentrate export dock at Skagway which ships concentrates from a mine in the Yukon Territory. Petersburg is a hub for barge shipments from Alaska Marine Lines out to smaller communities in the mid-Southeast region between Petersburg and Juneau.
3.7 Southwest
The central hub in Southwest Alaska is Unalaska/Dutch Harbor. Unalaska/Dutch Harbor’s facilities are used for handling a large portion of cargo and fuel shipped to or from Western and Arctic Alaska. Unalaska/Dutch Harbor also handles large volumes of export cargo and transshipments, especially those generated by the seafood industy, and has been used as the staging area for Shell Oil’s offshore exploration in the Outer Continental Shelf as well as earlier exploration efforts in the western and Arctic areas. The city’s port and harbor assets are managed by an enterprise port fund, which has a published tariff and regulations. Unalaska/Dutch Harbor is one of the communities served by the Alaska Marine Highway system.
Kodiak serves as a hub for the eastern edge of this region. It has regular container service from vessels departing from Puget Sound and transiting through Anchorage, as well as regular container and barge service out to Dutch Harbor. With sufficient volumes in the system, Kodiak could provide hub and spoke operations with Prince William Sound. Kodiak’s port and harbor facilities operate under a dedicated department with a published tariff and regulations. Kodiak is one of the communities served by the Alaska Marine Highway system.
Subregional hubs in Southwest Alaska include Naknek and Dillingham. Each of these hubs is a major exporter of seafood products, often aggregating regional cargo and shipping it to Unalaska/Dutch Harbor for distribution nationally and internationally, although direct barge service to Puget Sound is also used. The management of the port assets in these two subregional hubs is not as extensive as it is in Unalaska/Dutch Harbor. The two ports also distribute goods to smaller communities in their vicinity. For Naknek, this includes King Salmon, located about 15 miles away on the Alaska Peninsula Highway.
A potential subregional hub is Adak, which has deep draft docks, multi-directional runways, and proximity to the great circle route. It could be used in the future as a transshipment point, especially for consolidating cargo for arctic shipping routes. While it does have good infrastructure, additional investment would be needed for Adak to have transshipment and container capabilities.
Intermodal options for the Southwest region are limited to air and water access. Kodiak has scheduled air service by jet and regional carriers. Unalaska/Dutch Harbor, the other regional hub farther to the

Regional Hubs Analysis
Final 9
west, only has air service by regional carrier due to issues of reliability for jet landings. Dillingham and Naknek each have jet service, with Naknek’s service via the airport in King Salmon.
3.8 Yukon-Kuskokwim Delta
Freight shipments to communities on the Yukon and Kuskokwim Rivers are generally serviced from the Puget Sound region or Anchorage, although they can be routed through a transshipment port such as Dutch Harbor. Cargo is brought into the delta to hubs. Fuel is often transferred to lighter vessels at sea in protected areas, such as Security Cove. This is done both for efficiency as well as to avoid port fees for ship-to-ship transfers.
On the Yukon River, Alakanuk and Emmonak serve as connective ports for ocean and river barges. Emmonak is more commonly used as a hub for this purpose. However, the center of the community is not barge-friendly due to congestion with smaller boats. Upriver or downriver from the community is well-suited for barge access. Investing in a barge dock (flat-faced to allow good contact and a better working area than a sheet pile cell) in Emmonak is likely the best investment that could be made in the Yukon Delta. Additional fuel tank capacity would also be valuable. The section on the Interior discusses investments further up the Yukon.
On the Kuskokwim River, Bethel is the main hub for cargo and fuel. It has sufficient fuel storage capacity for the communities it serves and adequate uplands to allow expansion for cargo handling and storage. The port and harbor facilities are operated as part of a dedicated department. If the proposed Donlin Creek mine is developed and the developers use Bethel for fuel and cargo handling, major investments in port facilities would be needed to handle the increased volume of fuel and cargo moving through Bethel.
In addition to infrastructure investment, dredging and navigational aids would be beneficial for both rivers, as would extending the seasons for which these services are provided. The mouth of the Yukon has channels that change each year and must be navigated carefully. Along the Kuskokwim, a number of shoals reduce the water depth.
Intermodal access is limited to air and water in the Yukon-Kuskokwim Delta. Land transportation is limited to roads within communities and ATV and snowmachine trails for inter-community travel. Emmonak has scheduled air service by a regional carrier, while Bethel has scheduled jet and regional carrier service.

Regional Hubs Analysis
10 Final
4 Preliminary Identification of Regional and Subregional Hubs
Table 1, on the next page, provides a preliminary list of regional and subregional hubs by region of the state. This list is based on the feedback from transportation companies and the criteria developed for evaluating hubs. The assignment of scores for each criterion is based on a high-level assessment of each hub’s geography, infrastructure, and management. Hubs that do not fully meet criteria provide some indication of where investment should take place. However, just as the lack of meeting these criteria is not necessarily an indication that the port fails to operate as a hub, a port that fully meets criteria may still need investment.
The evaluation of geographic location was heavily weighted on access either to areas with a large population (for imported cargo) or to areas with substantial exports, such as seafood. The criterion ratings are relative to all other locations shown in the table, rather than just locations within the same region.
The infrastructure evaluation generally focused on the ease of access to each hub’s facilities and the scale and scope of the facilities. For this evaluation, both public and private facilities are included since, for example, fuel hubs often have privately-owned docks and/or tank farms. The extent of intermodal options was also considered in this evaluation, which increased the scores of hubs with highway, rail, and jet service access.
The third criterion, port management and administration, was evaluated on a subjective basis. Hubs scored highest if they had established municipal port and harbor departments; owned both port and harbor facilities; employed multiple year-round employees in those departments; had easily accessible, published tariffs and rate sheets; and demonstrated planning for future port and harbor needs, either through published information on their websites or through projects that were reported as part of the survey for this project. In communities with only privately-owned facilities, the scores for this criterion were low.
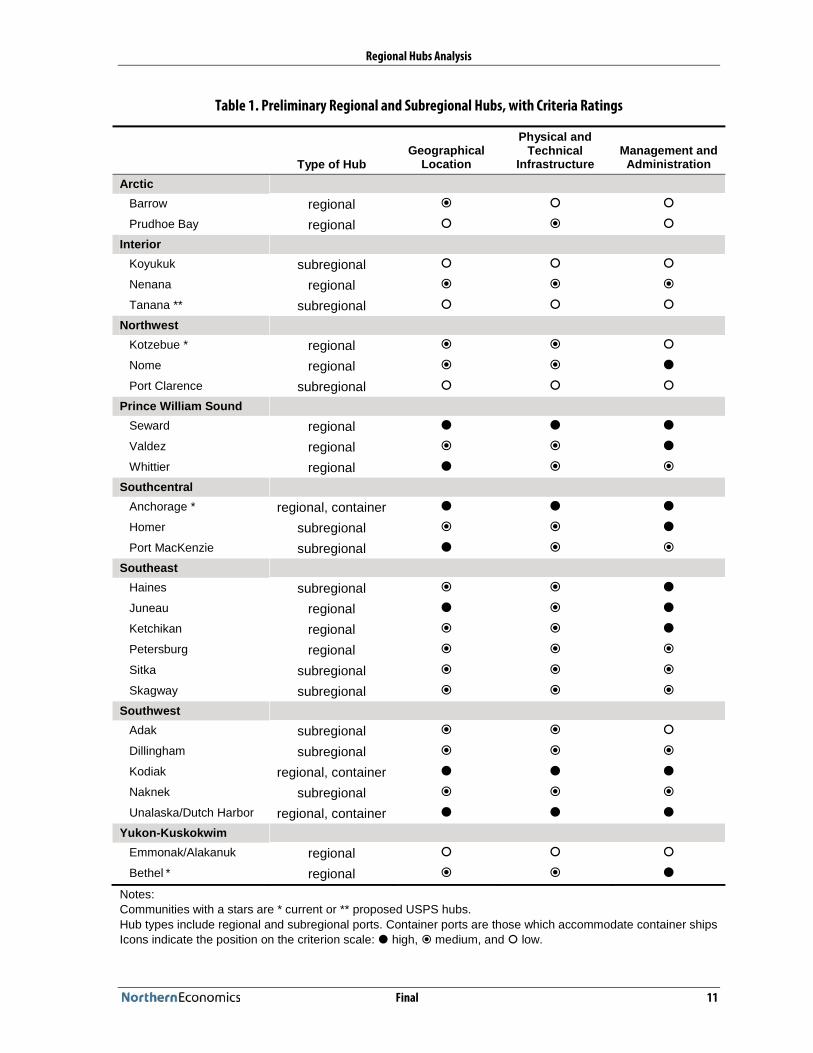
Regional Hubs Analysis
Final 11
Table 1. Preliminary Regional and Subregional Hubs, with Criteria Ratings
Type of HubGeographical
Location
Physical and Technical
InfrastructureManagement and
AdministrationArctic
Barrow regional � � �
Prudhoe Bay regional � � �
InteriorKoyukuk subregional � � �
Nenana regional � � �
Tanana ** subregional � � �
NorthwestKotzebue * regional � � �
Nome regional � � �
Port Clarence subregional � � �
Prince William SoundSeward regional � � �
Valdez regional � � �
Whittier regional � � �
SouthcentralAnchorage * regional, container � � �
Homer subregional � � �
Port MacKenzie subregional � � �
SoutheastHaines subregional � � �
Juneau regional � � �
Ketchikan regional � � �
Petersburg regional � � �
Sitka subregional � � �
Skagway subregional � � �
SouthwestAdak subregional � � �
Dillingham subregional � � �
Kodiak regional, container � � �
Naknek subregional � � �
Unalaska/Dutch Harbor regional, container � � �
Yukon-KuskokwimEmmonak/Alakanuk regional � � �
Bethel * regional � � �
Notes:Communities with a stars are * current or ** proposed USPS hubs.Hub types include regional and subregional ports. Container ports are those which accommodate container shipsIcons indicate the position on the criterion scale: � high, � medium, and � low.
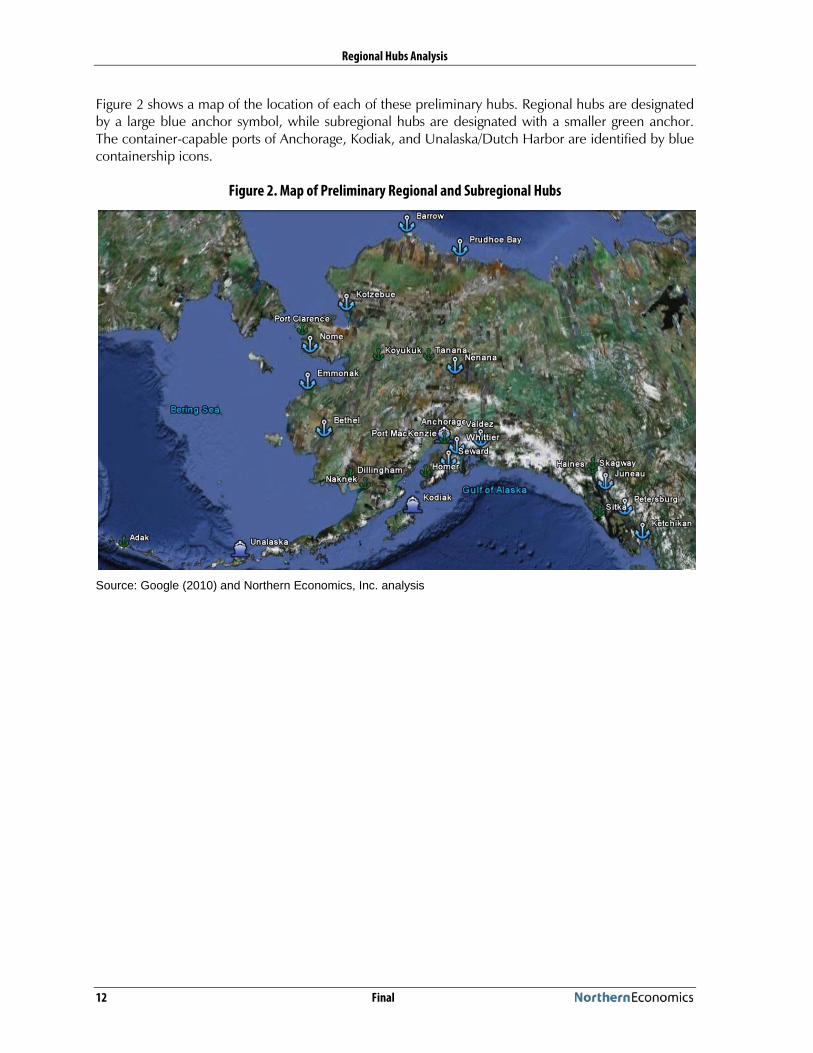
Regional Hubs Analysis
12 Final
Figure 2 shows a map of the location of each of these preliminary hubs. Regional hubs are designated by a large blue anchor symbol, while subregional hubs are designated with a smaller green anchor. The container-capable ports of Anchorage, Kodiak, and Unalaska/Dutch Harbor are identified by blue containership icons.
Figure 2. Map of Preliminary Regional and Subregional Hubs
Source: Google (2010) and Northern Economics, Inc. analysis
Regional Hubs Analysis
Final 13
5 References
Google. Google Earth. Data from SIO, NOAA, Navy, NGA, and GEBCO. © 2010 Google. © 2010 Geocentre Consulting. Image © 2010 TerraMetrics. 2010.
Harland, Bruce. Vice President Contract Services, Crowley Marine Services, Inc. Personal communication with Northern Economics, Inc. July 14, 2010.
Harris, Royal. Crowley. Personal communication with Northern Economics, Inc. July 14, 2010.
Hendren, Rich. Crowley. Personal communication with Northern Economics, Inc. July 14, 2010.
Jansen, Jim. President and Chief Executive Officer, Lynden, Inc. Personal communication with Northern Economics, Inc. August 3, 2010.
Lirn, TC, HA Thanopoulou, MJ Beynon, and AKC Beresford. “An Application of AHP on Transhipment Port Selection: A Global Perspective.” Maritime Economics & Logistics, 6 (70-91). 2004.
Lowery, George. Alaska Director, Totem Ocean Trailer Express, Inc. Personal communication with Northern Economics, Inc. September 14, 2010.
Mayo, Desi. Director of Accounting Services, Petroleum Distribution, Crowley. Personal communication with Northern Economics, Inc. July 14, 2010.
O’Shea, Michael. Delta Western. Personal communication with Northern Economics, Inc. July 12, 2010.
Pavellas, Gregory. Manager, Marine Operations, Petroleum Distribution, Crowley. Personal communication with Northern Economics, Inc. July 14, 2010.
Payne, Kirk. Delta Western. Personal communication with Northern Economics, Inc. July 12, 2010.
Scholz, Jim. Samson Tug and Barge. Personal communication with Northern Economics, Inc. July 15, 2010.
St. John, Jeanine. Vice President, Lynden Logistics. Personal communication with Northern Economics, Inc. August 3, 2010.
Sweetsir, Matt. Ruby Marine Services. Personal communication with Northern Economics, Inc. July 2, 2010.
Tague, Walt. Director, Marine Operations, Petroleum Distribution, Crowley. Personal communication with Northern Economics, Inc. July 14, 2010.
Tornga, Craig. Vice President Alaska, Crowley. Personal communication with Northern Economics, Inc. July 14, 2010.
United States Army Corps of Engineers (USACE). Map of transportation regions. 2011.

Wisdom • Trust • Relevance • Innovation
Alaska Regional Ports
Appendix D:
Policy and Plan DevelopmentFinal Report
Prepared for the
U.S. Army Corps of Engineers
and
Alaska Department of Transportation
and Public Facilities
January 2011
Under Contract to
URS Corporation

Policy and Plan Development
Final Prepared for
U.S. Army Corps of Engineers Alaska District and the
Alaska Department of Transportation & Public Facilities
January 2011
Prepared by
Under contract to URS Corporation

Preparers
Team Member Project RolePat Burden Project DirectorMichael Fisher Project ManagerAlexus Bond AnalystTerri McCoy Editor
Please cite as: Northern Economics, Inc. Policy and Plan Development. Prepared for U.S. Army Corps of Engineers Alaska District and the Alaska Department of Transportation & Public Facilities. January 2011.

Final i
Contents
Section Page
Abbreviations .......................................................................................................................................... iii
1 Introduction ............................................................................................................................. 1
2 Recommended Policies, Strategies, and Actions ......................................................................... 2 2.1 Interagency Coordination ................................................................................................... 2 2.1.1 Interagency Task Force ....................................................................................................... 2 2.1.2 Interagency Working Group................................................................................................ 2 2.2 Planning ............................................................................................................................. 3 2.2.1 Creation of a Transportation Infrastructure Development Program ...................................... 3 2.2.2 Interagency Project List and Project Integration ................................................................... 3 2.2.3 Coordinated Planning and Creative Solutions for Communities ........................................... 4 2.3 Project Ranking and Prioritization ....................................................................................... 4 2.3.1 Suggested Priorities ............................................................................................................. 4 2.4 Funding or Financing .......................................................................................................... 5 2.4.1 Public Private Partnerships .................................................................................................. 5 2.4.2 Project Evaluation ............................................................................................................... 6 2.4.3 Local Government Participation .......................................................................................... 6 2.4.4 Tiered Grant Application Requirements .............................................................................. 6 2.4.5 Marine and Riverine Industrial Development and the Alaska Industrial Development and
Export Authority ................................................................................................................. 7 2.5 Stakeholder Policies ............................................................................................................ 7 2.5.1 USACE Benefit-Cost Ratio ................................................................................................... 7 2.5.2 Funding for ADOT&PF Planning and Coordination of State Transportation System .............. 7 2.6 Stakeholder Coordination ................................................................................................... 8 2.6.1 Suggestions for Improved Communication .......................................................................... 8 2.6.2 Regional Prioritization ......................................................................................................... 8 2.7 New Legislation .................................................................................................................. 9 2.7.1 ADOT&PF Ports and Harbors Section Mission Statement .................................................... 9 2.7.2 Port Authorities................................................................................................................... 9 2.7.3 Public-Private Partnerships .................................................................................................. 9
3 Impediments to Port and Harbor Development ........................................................................ 10 3.1 Planning ........................................................................................................................... 10 3.1.1 USACE ............................................................................................................................. 10 3.1.2 ADOT&PF ........................................................................................................................ 10 3.1.3 Local Communities ........................................................................................................... 11 3.2 Project Ranking and Prioritization ..................................................................................... 11 3.2.1 USACE ............................................................................................................................. 11 3.2.2 ADOT&PF ........................................................................................................................ 12 3.2.3 The Denali Commission .................................................................................................... 13

Policy and Plan Development
ii Final
3.3 Funding or Financing ........................................................................................................ 14 3.3.1 USACE .............................................................................................................................. 14 3.3.2 ADOT&PF ........................................................................................................................ 14 3.3.3 Community Funding Limitations ....................................................................................... 15 3.4 Stakeholder Policies .......................................................................................................... 15 3.4.1 USACE .............................................................................................................................. 15 3.4.2 ADOT&PF ........................................................................................................................ 15 3.4.3 Denali Commission ........................................................................................................... 16 3.5 Stakeholder Coordination ................................................................................................. 16 3.6 Current Legislation ............................................................................................................ 17
4 References .............................................................................................................................. 18
Policy and Plan Development
Final iii
Abbreviations
ADCCED Alaska Department of Commerce, Community and Economic Development
ADOT&PF Alaska Department of Transportation and Public Facilities
AIDEA Alaska Industrial Development and Export Authority
AMHS Alaska Marine Highway System
ARDOR Alaska Regional Development Organization
CDQ Community Development Quota
DMTS DeLong Mountain Transportation System
EDA U. S. Economic Development Administration
KABATA Knik Arm Bridge and Toll Authority
LRTP Long-Range Transportation Plan
MARAD U. S. Department of Transportation, Maritime Administration
NED National Economic Development
PPP Public-Private Partnership
SAFETEA-LU Safe, Accountable Flexible Efficient Transportation Equity Act: A Legacy for All Users
STIP Statewide Transportation Improvement Plan
USACE U. S. Army Corps of Engineers
USCG U. S. Coast Guard
USDA U. S. Department of Agriculture
WRDA Water Resources Development Act

Policy and Plan Development
iv Final

Final 1
1 Introduction
Alaska depended on oil production from the North Slope to help sustain and grow its economy over the past three decades. With continued and projected decreases in oil production, Alaska needs to diversify its economy. Transportation infrastructure investments, such as ports and surface transportation links, are necessary to support resource development in other areas of the state and to deliver the resources to market.
State residents are aware of the importance of marine infrastructure, and support maintaining the existing infrastructure. A recent survey of state residents conducted for the Alaska Department of Transportation & Public Facilities (ADOT&PF) found that 81 percent of residents thought that maintenance of ports and harbors was important or very important. This percentage was up substantially from the 59 percent reported for a 2008 survey. Maintenance of the Alaska Marine Highway System (AMHS) was important or very important for 88 percent of respondents in 2010 compared to 43 percent in 2008 (Ottesen, 2010). These significant increases in the percent of respondents who felt that maintenance of marine infrastructure and vessels was important or very important suggests that the public is becoming more aware of the critical role that marine infrastructure and vessels play in the state’s economy.
This report discusses trends and issues surrounding port and harbor development in the State of Alaska, and discusses policies, programs, and processes of the U. S. Army Corps of Engineers (USACE), ADOT&PF, the Denali Commission, and several other agencies that participate in port and harbor development. This work element synthesizes information provided in three previous reports and a set of interviews with key stakeholders, and develops a set of recommendations, strategies, and actions to reduce the time and cost for making port and harbor improvements and improve the coordination among the parties involved.
The impetus for this project was the first Alaska Regional Ports Conference sponsored by the USACE and ADOT&PF in January 2008 in Anchorage. The conference brought together local, state, and federal government officials with port and harbor users throughout the state to determine future needs for the coastal and riverine waters in Alaska. The overwhelming mandate from this group was the need for a collaborative effort to develop comprehensive planning to meet the future needs of Alaska. This report, in combination with the previous reports for the project, is intended to lay the groundwork for this interagency coordination. The remainder of this white paper is divided into the following sections:
� Section 2 presents the recommendations, strategies, and actions for improving the port and harbor development process and reducing the time and cost for building such infrastructure.
� Section 3 summarizes information from interviews and document research that identify impediments to port and harbor development in Alaska.

Policy and Plan Development
2 Final
2 Recommended Policies, Strategies, and Actions
A major objective of this report is to improve the way in which federal, state, and local governments work together on marine infrastructure improvements. Each federal, state, or local agency involved in port and harbor development has its own set of policies, processes, and procedures created over time to meet the organization’s requirements. In a perfect world, these would be aligned between agencies—perhaps even identical. The real world is much different with oftentimes conflicting policies, processes, and procedures, which impede coordination and communication, and result in implementation difficulties, high costs, and significant delays. Changes to align such policies, processes, and procedures will be difficult, if not impossible for some entities, and will take an inordinate amount of time and resources to achieve.
Given this situation, several of the recommendations that follow focus on activities that might be employed—no matter how small—to improve communications and understanding between the various parties that are engaged in development of marine infrastructure. Some of the recommendations are taken from stakeholder interviews, some from the literature reviewed for this project, and others are based on our experience in the development process of marine infrastructure.
2.1 Interagency Coordination
This section discusses the formation of an interagency task force that would focus on changes at the policy level and an interagency working group that would coordinate efforts at the project level.
2.1.1 Interagency Task Force
One suggestion from persons interviewed for this project was to establish an interagency task force to focus on larger issues surrounding marine and riverine infrastructure development, such as how best to quantify social or subsistence effects, ensuring that all stakeholders are aware of marine and riverine projects that are being pursued by others, and providing suggestions on changes in funding programs for marine and riverine infrastructure at all levels. Another topic suggested for consideration by the task force was developing suitable frameworks for public sector participants in public-private partnerships in order to increase private sector involvement. The members of the task force would need to be at very high levels within their organizations in order for the recommendations to be effectively heard. Member groups could include USACE, ADOT&PF, Denali Commission, USCG, AIDEA, U.S. Economic Development Administration (EDA), U.S. Department of Agriculture (USDA), and other parties that participate in marine and riverine infrastructure development. The task force might also include representatives of Alaska Native organizations, Community Development Quota (CDQ) groups, environmental organizations, and others. Again, to ensure that policies can or will be changed requires that the participants in the task force be high level decision makers.
2.1.2 Interagency Working Group
While the task force is addressing some of the larger issues that impede development of marine and riverine infrastructure, ongoing projects will need attention and it may be possible to improve the current working relationships. There is currently an ad-hoc group working together on the Alaska Regional Ports Phase 1 project. We recommend that this group, potentially with other parties and representatives from the member agencies, be formalized as a ports and harbors working group to facilitate communication and coordination at the level where specific project work is undertaken. We

Policy and Plan Development
Final 3
suggest that this working group meet or teleconference on a quarterly basis to share information on ongoing and planned projects and to coordinate their activities to the extent possible.
2.2 Planning
The following sections describe our recommendations for stakeholder agencies to improve marine infrastructure planning efforts.
2.2.1 Creation of a Transportation Infrastructure Development Program
ADOT&PF is charged with planning for Alaska’s future transportation system. Few of the other parties engaged in marine and riverine infrastructure development are tasked with long-term planning for such development; they tend to be more reactive to projects that are initiated by others, such as Alaska’s congressional delegation or requests from local governments. The planning efforts by other parties are more attuned to project-level planning rather than long-term planning.
ADOT&PF should pursue the authorization of a regular state-funded, multi-year transportation program—separate from federal highways, transit and aviation programs—that includes marine and riverine infrastructure projects. Even if these projects cannot be funded from a reoccurring source of federal dollars, ports and harbors are a critical element in maritime trade, which provides most of the goods and supplies used in Alaska and moves our resources to market. Inclusion of marine and riverine infrastructure projects in the multi-year program will result in a systematic approach to identifying, selecting, coordinating, and funding coastal and river projects, and potentially improve the likelihood of funding for port and harbor projects. Development of a multi-year state-funded program will require support from the state legislature and administration.
We are proposing that ADOT&PF use the Planning for Alaska’s Regional Ports and Harbors study as a resource from which to identify marine and riverine infrastructure projects in the near term. These projects and the marine and riverine transportation systems would be addressed in the regional planning studies as they are updated, as well as the next Long-Range Transportation Plan (LRTP). The current regional planning studies and the LRTP focus on state-owned facilities and vessels. The next update of these reports should provide a comprehensive description of the marine and riverine transportation system, which will require a baseline assessment of marine and riverine infrastructure owned by the state and other entities that provide such infrastructure.
2.2.2 Interagency Project List and Project Integration
To improve the value of ADOT&PF planning documents, other parties involved with marine and riverine infrastructure development will need to communicate their planned or potential projects to ADOT&PF to ensure that these projects are included in the regional planning studies and the LRTP. The list of marine and riverine infrastructure projects developed for this study should be updated at least annually so that it is useful to the congressional delegation, the state legislature, and others funding such projects. Suggested projects which are studied and deemed unfeasible should be removed from the list. But rather than simply being deleted, those projects should be moved to their own list and kept for future reference so that they are not re-nominated or re-studied unless conditions change.
The Strategic Trends Analysis describes issues that are affecting maritime transportation on a global basis and the implications for Alaska. The regional planning studies and the LRTP should incorporate those trends and others that may be identified in the future. For example, the trend toward larger vessels over time will have implications for possible dredging and infrastructure improvements at
Policy and Plan Development
4 Final
Unalaska/Dutch Harbor, where the Asia-bound vessels are primarily sized for trade between large container ports and are much larger than the container ships in the Alaska – Puget Sound trade. Planning should also consider the potential need for dredging of the Fire Island shoal if it continues to migrate into navigation channels, or have the interested parties identify contingency plans if the shoal begins to impede deep draft navigation. Contingency plans for dealing with increased siltation at the Port of Anchorage could be another topic addressed in the LRTP and other planning documents.
2.2.3 Coordinated Planning and Creative Solutions for Communities
In a number of smaller communities with ports and harbors there is limited capacity for planning for port and harbor development. We recommend that in communities where major port and harbor improvements are being made, ADOT&PF or USACE solicit the assistance of the Denali Commission, the Alaska Department of Commerce, Community, and Economic Development (ADCCED), or other entities to assist the community in a planning process to incorporate the new facility into the community’s infrastructure system and to capture the potential economic benefits associated with the facility.
As discussed in the Strategic Trends Analysis report, often when one or more modes of transportation are not available in a community, the remaining modes are enhanced to provide better service and compensate for the missing modes. Thus, different modes can, to some extent, be substitutes for each other. Similarly, it may be possible to substitute other infrastructure projects where it is difficult to improve marine or riverine transportation in a community or region. For example, there are communities in the upper Kobuk River and upper Kuskokwim River drainages where it is difficult for tugs and barges to reliably deliver fuel late in the shipping season, and where fuel must be flown into the community if a second barge delivery is postponed. In other communities, the cost to deliver fuel is expensive given the small volumes required, but multiple deliveries must be made because fuel storage is not sufficient to permit a single delivery that would last an entire year. For both of these types of communities, cost savings could be realized if additional fuel storage were available.
This report focuses on marine and riverine infrastructure, but good planning should recognize that there may be other, more cost-effective means of achieving a goal rather than development or improvement of marine infrastructure. In some cases, another mode of transportation may provide the most cost-effective solution and best meet local, regional, and state needs. Evaluation of multiple modes or other types of infrastructure investment may not fit with every agency’s mission or programs, so it is important that agencies recognize their solutions may not provide the best result, be flexible in their approach, and be willing to hand off their involvement to other agencies that may offer a better solution to meet the needs of the community.
2.3 Project Ranking and Prioritization
As noted earlier, we recommend an interagency review of policies, processes, and procedures to determine if there are potential changes that could be made to eliminate apparent conflicts. This review should include an evaluation of the criteria used to rank marine infrastructure projects for each organization.
2.3.1 Suggested Priorities
As part of the process of reviewing their project ranking policies with the goal of finding as much alignment as possible, we suggest the agencies consider giving higher priority to the following items.

Policy and Plan Development
Final 5
2.3.1.1 Hubs
We recommend that the criteria used by agencies that develop or fund marine transportation infrastructure consider if a community or location has been identified as a regional or subregional hub, or if a planned improvement would result in a port becoming a hub. If so, additional weight should be assigned to the relevant project. The basis for additional weighting is because such improvements, if needed, would result in the greatest benefit to the overall marine transportation system and a larger number of communities.
2.3.1.2 Health and Safety
Each funding organization has different programs that might be used to fund marine or riverine infrastructure, and there may be restrictions on the type of projects that can be undertaken for these programs. While acknowledging these restrictions, it is our opinion that projects which enhance health and safety should also have higher weighting than other projects. The safety of vessels and their crews and passengers are of the utmost importance. We believe that safety should be heavily weighted in all programs.
The U. S. Coast Guard (USCG) is evaluating the development of a forward operating base in the Arctic and an increase in the nation’s ice-breaker fleet. Such steps would do much to improve safety and emergency response capability in this region, as would a port of refuge in western Alaska north of the Alaska Peninsula. We recommend that USCG, USACE, ADOT&PF, petroleum companies exploring in the Chukchi and Beaufort Seas, cruiseship lines that are cruising the Arctic Ocean or transiting the Northwest Passage, and tug and barge companies supplying Arctic communities and industry operating in the area meet after the USCG report is issued. These parties should coordinate activities and support that might lead to the development of at least one port of refuge in Arctic waters and the northern Bering Sea. We suggest that such a port of refuge/forward operating base have additional weighting for project ranking due to its ability to improve vessel and mariner safety, and emergency response capability.
2.4 Funding or Financing
Part of the stimulus for undertaking the Alaska Regional Ports study was the recognition that there are not enough funds available to meet the needs that have already been identified for marine and riverine infrastructure projects, and that future funding may be lower. As a result of this funding trend, it will become even more important that decision-makers have relevant and up-to-date information available for establishing priorities among projects. Part of the decision-making process must explore the possibility of funding or financing projects through other parties or with several organizations as partners.
2.4.1 Public Private Partnerships
Public-private partnerships (PPPs) for developing marine and riverine infrastructure are on the increase around the globe. While such partnerships can be valuable in certain situations, we anticipate that the vast majority of marine and riverine infrastructure projects around the state are not well suited for formal PPPs. Port development is a logical application for PPPs since ports are commercial facilities typically driven by economic demand and usually associated with sustainable economics and funding. Barge landings, like ports, are also potential candidates for PPPs since they are driven by an economic demand for goods and services. Planning for marine and riverine infrastructure project development should involve CDQ groups, Alaska Native regional and village

Policy and Plan Development
6 Final
corporations, shipping companies, and others. While such entities may not wish to participate in funding all aspects of a port or harbor facility, they could establish or finance upland development to enhance the economic returns from the port or harbor investment, or invest in private facilities within a port or harbor. In smaller rural communities, the private sector could be a source of local matching funds.
Formal PPPs are often able to use innovative financing mechanisms with tax credits and other incentives available to the private sector to develop projects and reduce the cost to public agencies. The Knik Arm Bridge and Toll Authority (KABATA) was established to develop a bridge across the Knik Arm and was given special authority to enter into contracts with a private sector entity that would design, build, and operate the facility. However, many potential PPPs are not of the size that they would warrant special legislation or special authorities to plan and implement the projects, and it would be difficult for ADOT&PF to participate in such partnerships with their present authority. As discussed later in this section, we are recommending legislative changes to facilitate participation in PPPs by ADOT&PF.
2.4.2 Project Evaluation
In cases where a port or harbor project is necessary for community economic development or safety, but does not achieve a positive benefit-cost ratio under federal guidelines, we recommend that an analysis be conducted to identify the most cost-effective approach to meeting the objective. Without congressional directive to the USACE, other federal, state, local, and private sector funding would be required. This approach might also be employed for small (less than $5 million) projects where the cost of meeting USACE requirements can add substantially to the project. We recommend that a cost-effectiveness analysis be conducted where there are alternative means to achieve a goal and the USACE cannot participate. Additionally, if project costs are below $5 million and non-USACE funding is available, a cost-effectiveness analysis may be appropriate.
2.4.3 Local Government Participation
Local governments, including their ports and harbor enterprises, also have a role in marine and riverine infrastructure development. While some communities are too small to have significant financial capacity, those with large fishing or recreational vessel fleets or significant commercial maritime traffic can provide some or all of the revenues necessary to build facilities or provide local matching funds. For example, the City of Wrangell provided $1 million from its Permanent Dividend Fund to match a $1.85 million grant from the U. S. Economic Development Administration for construction of the Wrangell Marine Center. However, it would be better to have matching funds available from the port or harbor enterprise fund rather than the general fund or a permanent dividend fund. The sustainability requirements of ADOT&PF’s Municipal Harbor Grant Program could provide a mechanism to establish replacement funds for facilities. We encourage changes in the program to require dedicated replacement reserves within the port and harbor enterprise funds. These reserves could be funded using the depreciation expense (a non-cash expense) on port and harbor assets. While it may not be necessary to use all of the depreciation allowance for replacement funds, the funds should grow over time to be adequate to meet matching fund requirements in the future.
2.4.4 Tiered Grant Application Requirements
In our opinion, organizations should consider different grant application requirements for projects with different threshold costs. For example, a project with an estimated cost of $50,000 or less might

Policy and Plan Development
Final 7
have a two-page application form and a project of greater cost might require a four- or five-page application form with more supporting documentation. In some cases, the most important need is fairly modest in cost but because the application requirements are so extensive, the project of greatest need is incorporated with a larger project of lesser need to justify the costs in preparing the grant application. The funding organizations should consider and set the appropriate level for the cost thresholds.
2.4.5 Marine and Riverine Industrial Development and the Alaska Industrial
Development and Export Authority
In addition to community economic development, industrial development often requires marine and riverine infrastructure projects. The number of such projects is fewer than community-related infrastructure and more sporadic. Opportunities to build needed resource-related projects are situational-dependent, with some resource projects requiring support from the public sector (e.g., Alaska Industrial Development and Export Authority [AIDEA]) to achieve commercial success while others can be built solely with private funds.
AIDEA’s mission is to promote, develop, and advance economic growth and diversification in Alaska by providing various means of financing and investment. Some persons that were interviewed for this report suggested that as a champion of economic development, AIDEA could play a larger role in port development for regional and possibly subregional hubs where the level of economic activity is high enough that AIDEA’s investments could be repaid over time. AIDEA involvement reduces the risk to smaller communities that may not have the tax base to support large investments. As discussed below, we are recommending that AIDEA be included as one of the organizations that meet regularly to discuss potential and planned marine infrastructure projects in the state.
2.5 Stakeholder Policies
As discussed earlier, agency policies are typically established at very high levels in the decision-making hierarchy. As a result, attempting to change policies will require intervention at similar levels of decision-making.
The following subsections address specific agency policies and project coordination suggestions mentioned by interviewees or identified in research.
2.5.1 USACE Benefit-Cost Ratio
Another potential issue identified for the task force to evaluate is modifying the USACE’s policies so that the benefit-cost ratio, which favors large population areas, is not the primary mechanism used to allocate federal funding. An alternative approach might result in a portion of annual USACE funds being allocated by region or state level rather than by projects, which are based on a ranking of National Economic Development (NED) benefits. These changes will be difficult to implement since they would require changes in USACE policies at the national level. However, we recommend that such issues be brought forward by the Alaska District office, with support from the congressional delegation, for discussion at the national level.
2.5.2 Funding for ADOT&PF Planning and Coordination of State Transportation System
For a number of years the Alaska Legislature has sought to have ADOT&PF transfer its port and harbor assets to local agencies and generally diminish the department’s role in this facet of transportation

Policy and Plan Development
8 Final
infrastructure. While we understand the legislature’s desire to minimize the ongoing maintenance costs for such facilities, we believe it is critical that the department be funded adequately to ensure that its responsibilities for planning and coordinating improvement of the state’s overall transportation system, including marine infrastructure, are met. This would include expanding the scope of regional planning efforts and the LRTP to address the role of marine infrastructure, its importance to intermodal connectivity, and identify marine infrastructure and maritime shipping that is not owned by the state. The objective of this expansion is to ensure that the overall marine transportation system is adequately described so that all participants can make better-informed decisions.
2.6 Stakeholder Coordination
There are multiple organizations involved in marine and riverine infrastructure development in Alaska and a number of people noted the need to improve coordination and communication between these entities. The following subsections detail our recommendations for improving stakeholder coordination and communication.
2.6.1 Suggestions for Improved Communication
Some persons who were interviewed noted that there can be multiple contacts within ADOT&PF for port and harbor projects, which, in their opinion, makes coordination with other agencies and even within the Department more difficult. Their recommendation was that all port and harbor projects, apart from Alaska Marine Highway System projects, be through a single point of contact.
Several interviewees mentioned that they would like to know more about the mission, policies, and processes of other agencies that participated in marine infrastructure development, partly to increase their own understanding and also so that they can respond to questions about other agencies from the public or other stakeholders. We suggest that the working group hold a half-day training session in which each participating agency would provide a summary of their relevant policies and the manner in which they undertake or participate in port and harbor development.
Several persons suggested that a process be established to improve communications with local communities and ensure that local residents and leaders understand the roles of USACE, ADOT&PF, and others in engineering and design, construction, and maintenance of the facility. Improved communications could allay some of the frustration that is often felt with USACE’s “tedious process” as it was described by one individual. For example, quarterly newsletters or web sites for each project could ensure that local residents are kept abreast of progress.
2.6.2 Regional Prioritization
Funding agencies may become overwhelmed with requests for project funding if those requests are made in an uncoordinated manner. As a result, limited time and resources may prevent these agencies from identifying the most important projects and funding them. Given these challenges, it may be beneficial for communities and the funding agencies to have communities prioritize projects on a regional basis. Regional port and harbor development groups could follow the model used by Alaska Regional Development Organizations (ARDORs). Whether created formally by the Alaska Legislature or informally through regional efforts, these groups could provide single points of contact for communicating regionally-supported, prioritized, and coordinated lists of needed port and harbor projects. This approach would benefit both individual communities and the funding agencies through greater efficiencies in project nomination, selection, and funding. Regional Seafood Development Associations, Regional Planning Organizations, and Regional Ocean Partnerships are other regional

Policy and Plan Development
Final 9
entities that could be involved in this process. While we cannot recommend which organizations should be considered for involvement in this regional prioritization process, we recommend that projects subjected to such evaluation be given additional weight in funding organizations’ project ranking.
2.7 New Legislation
The following sections discuss some of the ideas and suggestions made for new legislation to improve the port and harbor infrastructure development process.
2.7.1 ADOT&PF Ports and Harbors Section Mission Statement
Several people suggested that the Ports and Harbors Section of ADOT&PF should have “promoting social and economic development” as part of their mission statement. In our opinion, this change would be difficult for the department to implement and may require legislative action. We are not recommending this change.
2.7.2 Port Authorities
State statutes permit the formation of port authorities, which can be catalysts for social and economic development, but the statute is crippled since it does not permit such authorities to levy taxes.
Local city or borough governments presently control ports and harbors within their boundaries and surely do not want to lose control of such assets. However, these local governments have numerous missions and do not focus exclusively on social or economic development. We propose that the statute be amended to permit port authorities to levy taxes, with the specific type of tax varying based on the fiscal system that is presently levied by the local government. The tax could be restricted to a certain number of mills for property taxes or a fixed percent of sales tax.
The local port authority would purchase port or harbor assets from the local government. The local government could use these sales proceeds to establish a “permanent fund” to offset any losses in revenues from the port or harbor asset. (The Municipality of Anchorage took similar steps when it “privatized” or sold the municipally owned telephone utility to a private company.) A resulting port authority could become the primary entity with a mission of social and economic development in the community or region.
2.7.3 Public-Private Partnerships
The role of PPPs in infrastructure development is increasing on a global scale and in certain situations this mechanism may be suitable for Alaska port and harbor development projects. However, many potential PPPs are not of the size that they would warrant special legislation or special authorities to plan and implement the projects, and at present it would be difficult for ADOT&PF to participate in such projects. To meet this need, we recommend that the legislature pass legislation permitting ADOT&PF to enter into PPPs for transportation-related projects, including marine and riverine infrastructure. Such legislation could be based on the KABATA legislation as well as legislation from other states on the Pacific coast where PPPs are more common.

Policy and Plan Development
10 Final
3 Impediments to Port and Harbor Development
A key objective of the Alaska Regional Ports study is to identify those factors that hinder port and harbor development in Alaska and recommend policies, strategies, and actions to remove or mitigate them. The following subsections describe the impediments that were identified through interviews with agency personnel, marine transportation companies, and harbormasters, as well as our project experience with port and harbor development over the past several decades.
3.1 Planning
There are several issues related to planning of port and harbor improvement projects that were identified. These issues were at the federal (USACE), state (ADOT&PF), and local government levels.
3.1.1 USACE
The process of conducting studies and constructing projects using the USACE can be quite lengthy because of the funding process and competition for limited funds. Alaska’s recent loss of seniority in Congress is of concern to many federal and state agencies, because funding may become even more limited and sporadic. Projects become a challenge to complete when they proceed in a start-and-stop fashion. Further, lengthy project implementation schedules can impact the project’s ability to serve its target market due to the significant market changes that can occur over that time. Local stakeholders and government administrations come and go, key staff turnover, political climates change, and other factors contribute to a lengthy process as well. Even after federal funds are obtained, it may be several years before the local project sponsor or the state can acquire matching funds for the project. All of these factors delay project completion and make it difficult to incorporate a USACE project into a development plan for other community infrastructure.
3.1.2 ADOT&PF
ADOT&PF’s plans are generally focused on highway, transit, and air transportation because of the availability of regular federal funding streams in those categories to support planning, programming, and construction. The movement of goods by water, which accounts for the vast majority of goods moving to or from Alaska, is not similarly supported by a regular stream of federal or state funds, nor is ADOT&PF specifically tasked, staffed, or funded for planning, programming, and construction of the marine transportation system. As a result, the discussion of marine transportation in the LRTP only focuses on state-owned vessels and facilities. There is no discussion of the entire marine transportation system and identification of improvements that would optimize the system, although the LRTP does identify the need for a system plan for ports and harbors, to which this report will contribute. As noted by one person, ADOT&PF does not have a statewide process, similar to the Statewide Transportation Improvement Plan (STIP), for programming non-federal (i.e., State of Alaska) marine transportation investments over multiple years. When the state’s revenue situation permits a large capital budget, a number of projects may be funded, but in years when state revenues are down, it is difficult to get good projects funded, and the political influence of certain legislators often determines funding priorities rather than the merits of a particular project.

Policy and Plan Development
Final 11
3.1.3 Local Communities
In many smaller communities around the state, there is limited capacity to capture or build on the economic opportunities offered by port and harbor development. Capturing these benefits can require planning and implementation over a number of years, and funding or institutional capacity is often lacking to sustain these efforts. Such planning should also be part of a comprehensive development plan to ensure that the port and harbor development is compatible with other elements of the community’s infrastructure. For example, one should not design and build a new float system with shore power if the existing power plant does not have sufficient capacity to handle the anticipated load. Without shore power, the anticipated occupancy of the harbor may not be reached and revenues may be insufficient to meet the debt service.
3.2 Project Ranking and Prioritization
3.2.1 USACE
USACE projects are evaluated on benefit-cost ratios that measure benefits accruing to the national economic development (NED) account. This situation makes it difficult for projects in Alaska to achieve unity (i.e., a benefit-cost ratio equal to or greater than one). Benefits accruing to environmental quality, regional economic development, and social effects are also considered; however, these other benefits are not yet used to determine project funding. Environmental and social benefits are also difficult to quantify. Although all four accounts are considered, the national economic development benefits are attributed the greatest weight when seeking funding through the President’s budgeting process.
The USACE has authorization under Section 2006 of the Water Resources Development Act (WRDA) 2007 to conduct studies for remote and subsistence harbors where the project may be recommended for funding without being justified solely by NED benefits. To invoke the authority of Section 2006 of WRDA 2007, the Secretary must determine that a remote or subsistence harbor or navigation improvement meets certain criteria and must be justified based on cited benefits.
The criteria for application of Section 2006 are as follows:
(1) The location of the harbor must meet either (a) or (b) below. (a) The community to be served by the project is at least 70 miles
from the nearest surface accessible commercial port and has no direct rail or highway link to another community served by a surface accessible port or harbor; or
(b) The project would be located in the State of Hawaii, the Commonwealth of Puerto Rico, Guam, the Commonwealth of the Northern Mariana Islands, the United States Virgin Islands; or American Samoa;
(2) The harbor is economically critical such that over 80 percent of the goods transported through the harbor would be consumed within the community served by the harbor and navigation improvement; and
(3) The long-term viability of the community would be threatened without the harbor and navigation improvement.
Most rural villages in Alaska would meet criteria (a) above. The percent of goods consumed within the community (criteria (2) above) could also be met by many harbors in the state. However, there are

Policy and Plan Development
12 Final
likely a limited number of projects where a finding could be made that the long-term viability of a community would be threatened without the proposed improvement. The justification for recommending a project that meets the criteria above will include consideration of the benefits of the project to the following:
(1) Public health and safety of the local community, including access to facilities designed to protect public health and safety;
(2) Access to natural resources for subsistence purposes; (3) Local and regional economic opportunities; (4) Welfare of the local population; and (5) Social and cultural value to the community.
While Section 2006 provides a mechanism for funding projects in many rural/remote communities, the reality of the situation is that this authorization has yet to be tested. Further, Section 2006 is limited to studies. Project construction, if authorized, would still require Congressional appropriation. Funding for these projects is not certain.
In order for Alaska projects to succeed in the President’s budgeting process, USACE must find a way to improve the benefit/cost ratio. That means either increase the benefits or decrease the project costs. USACE is conducting a study to develop techniques and approaches to quantify subsistence benefits for associated marine infrastructure projects in the state. Concurrently, USACE has an additional study underway to determine if construction costs can be lowered. Lower costs would have the same effect on the benefit/cost ratio as increasing benefits, and if greater benefits and lower costs can both be achieved, a project is more likely to realize a positive benefit/cost ratio.
Lower project cost may become a reality through increased competition among bidders and flexibility in project construction. USACE will evaluate changes to its current contracting procedures. Presently, construction contracts are advertised and awarded without regard to the cost or availability of quarries. Guaranteed pricing or increased competition could significantly reduce project costs. USACE is evaluating if these services can be split into separate contracts for the supply and placement of quarry material. Additionally, providing a contractor a multi-year window to commence construction may encourage additional bidders hoping to plan for the offseason or when workload is low.
3.2.2 ADOT&PF
Although there is a process in place within ADOT&PF to prioritize and rank marine infrastructure improvements, some respondents felt that Alaska port and harbor investment decisions seem to be driven by legislators rather than the ADOT&PF process. In that regard, ADOT&PF is seen as being more reactive than proactive.
The criteria that ADOT&PF employs for evaluating potential harbor investments are as follows:
� safety
� maintenance cost
� operational importance
� service life
� deficiency as a percentage of the replacement cost
� new harbor capacity

Policy and Plan Development
Final 13
� economic impacts
� local interest
� environmental and project development
� general fund contribution
� transportation alternatives (ADOT&PF undated)
However, these criteria are not followed for federal projects where the community has asked for ADOT&PF’s assistance. For many of these projects, the primary criteria for state involvement are 1) ADOT&PF’s confirmation that the federal reconnaissance study gives an appropriate result and 2) the availability of money from the federal and local governments.
ADOT&PF also has scoring criteria for its Municipal Harbor Facility Grant Program, which are different from the criteria used to evaluate harbor investments. The criteria used for the grant program are as follows:
� Does the municipality have sufficient revenues to operate and maintain the harbor facility in the future without state aid?
� Safety or Emergency factors; primary purpose is to improve operational safety, to respond to an emergency situation, or change in safety guidelines.
� Annual average amount spent on maintenance of the harbor facility by the municipality. This criterion is applicable only for a harbor facility that was previously owned by the state and now is locally owned, and which has not previously received a Tier 1 grant.
� Are there other options that would reduce or eliminate the need for the proposed project?
� Project serves the best public interest.
� Project reduces maintenance costs.
� Operational importance of harbor component to be addressed with grant funds.
� Importance of the municipality’s harbor facility.
� Local resolution of support (ADOT&PF 2010).
3.2.3 The Denali Commission
The Denali Commission’s Transportation Program began in late 2005 as part of the Safe, Accountable Flexible Efficient Transportation Equity Act: A Legacy for Users (SAFETEA-LU) legislation and accompanying amendments to the Denali Commission Act of 1998 (amended). The program focus is rural roads and waterfront development. The waterfront development program addresses port, harbor and other waterfront needs for rural communities. The focus areas are improvements to regional ports, and construction of barge landings and docking facilities.

Policy and Plan Development
14 Final
The Commission applies the following criteria and weights to projects nominated for the waterfront development program:
Criteria WeightSafety – improve operational safety 5Maintenance – reduce maintenance costs 3Operations – important to safe and economic operations 3Economic value – improves economic conditions; provides intermodal connections 3Facility capacity – increases capacity to meet demand 4Service life – period of years that the facility component will last 3Connectivity – improves intermodal connections or reduces redundant facilities 4Project stage – highest weights to construction ready projects with low contribution required from Commission
4
Public support – community and/or regional support 3Capital costs – contributions by project sponsor and project partners 3Source: Smith, 2010.
As described above, there are differences in the criteria and approaches used by these three agencies to evaluate marine infrastructure projects. The criteria and approaches used by the Denali Commission and ADOT&PF are more aligned with each other than either is with the criteria and approach employed by the USACE. Still, there are enough differences between ADOT&PF and the Denali Commission that the same project could end up with different rankings and thus be awarded partial funding from one agency but not receive needed funds from the other organization.
3.3 Funding or Financing
3.3.1 USACE
The primary source of funds for the USACE is authorization through the WRDA, which is enacted or reintroduced every few years. The latest reauthorizations were in 1998, 2000, and 2007. As discussed earlier, the long period between reauthorizations makes it difficult to plan and complete projects. The time gap may be due to a perception by Congress that there is a large backlog of authorized projects for the USACE to complete and adding more authorizations for work that cannot be completed near-term may exacerbate the problem.
The USACE and ADOT&PF coordinate on building harbors with the USACE typically providing the breakwater and the state assisting the local sponsor1
3.3.2 ADOT&PF
with inner harbor facilities. While the federal contribution to the project is substantial, the cost to the state and the local sponsor can also be very high. It may take local communities several years to accumulate the required matching funds, which further delays the project.
Funding for ADOT&PF port and harbor projects is allocated by the state legislature each year. In general, the annual legislative budget process is an impediment to development of marine infrastructure, since each of these projects takes a number of years to plan, design, and construct. If
1 A local sponsor, typically a local government, is required for all USACE harbor projects.

Policy and Plan Development
Final 15
funding isn’t available for a development activity in a planned year, the project schedule can slip an entire year. There is not a long-term, methodical approach to allocating port and harbor funding.
While ferries and terminals can be part of the National Highway System or the Alaska Highway System and be eligible for federal funding annually allocated to the ADOT&PF from the Highway Trust Fund, port and harbor improvements are not eligible for this dedicated federal funding and have generally come from the state’s general fund plus congressional appropriations. Port development in Alaska has traditionally been driven by commerce and the private sector, with the legislature contributing some funding for public port improvements. Harbors have relied more on ADOT&PF assistance and funds from the legislature, with participation by the USACE on a number of projects. The Ports and Harbors Section actively solicits legislative assistance for marine infrastructure projects, and particularly for those projects needing a local match for USACE projects.
3.3.3 Community Funding Limitations
In smaller communities, the financial resources may not be available to finance a project, but in larger communities there is often a mix of grant funds and bond funding that is used to develop port and harbor improvements. As noted above, there is no long-term funding for port and harbor projects and projects can take a number of years to be completed. Costs for the projects increase over time and the local sponsors often find the projects costing more than they had anticipated and more than they may be able to bond or finance. Thus, state and federal grants become even more important in funding and financing these projects and lobbying efforts and costs increase to ensure that the grants are obtained.
3.4 Stakeholder Policies
Each federal, state, or local agency stakeholder has its own set of policies, processes, and procedures that have been developed over time to meet certain requirements. The result is that there are oftentimes conflicting policies, processes, and procedures, which impede coordination and communication, and result in difficulties in implementation. As a result, projects take more time and cost more than they might otherwise. In all likelihood, making changes to align such policies, processes, and procedures will be difficult, if not impossible for some entities, and will take an inordinate amount of time and resources to achieve.
3.4.1 USACE
The policies and programs that guide the USACE have been developed over decades, and often reflect prior events or circumstances in other states that are far removed from the present situation in Alaska. Given the length of time that this framework has been in place, the impetus for creating such regulations, and the fact that USACE guidance is to be followed across the nation, it is likely that only minor changes at best can be expected in USACE regulations.
As a result, the USACE will likely continue to require a positive benefit-cost analysis, while other participating agencies may not have such a requirement.
3.4.2 ADOT&PF
It was noted by some interviewees that the State of Alaska also has its policies, procedures, and processes which can interfere with efficient and cost-effective completion of a project, and at times can result in actions that conflict with the interests of a community. However, local interests and other

Policy and Plan Development
16 Final
stakeholders can influence the state legislature and the administration to effect changes within ADOT&PF more easily than the same parties can influence change at the USACE. As a result, it may be more beneficial for Alaska port and harbor stakeholders to focus change efforts at the state level.
Several persons that were interviewed felt it was imperative that port and harbor projects be identified in the STIP to increase awareness of the importance of such projects and ensure that they do not “fall through the cracks.” While the STIP is not the appropriate medium, the idea of a statewide process, similar to the STIP, for programming non-federal state transportation investments over multiple years would promote better planning and coordination between stakeholders and others engaged in port and harbor development, and also ensure state interest and involvement in USACE projects, which take a long time to complete.
3.4.3 Denali Commission
The policies, procedures, and processes of the Denali Commission were also noted by a number of interviewees as contributing to difficulties in coordinating efforts and moving projects forward. The Denali Commission is a relatively young organization, so it has had less time to develop legacy policies, processes, and procedures. However, the Commission’s programs focus on providing basic infrastructure to rural communities with a priority on distressed communities. Thus, the ranking of projects for funding by the Denali Commission may not align with project ranking by the USACE or ADOT&PF. However, Alaska stakeholders can influence the Commission and changes in criteria and program requirements could be implemented.
Several respondents noted that providing construction management or design skills for a Denali Commission project is very effective and easy to achieve, but coordinating with the Denali Commission to fund or finance a project can have some of the same difficulties as noted for the USACE and ADOT&PF: namely, that different policies, procedures, and processes can make it difficult for all parties to coordinate activities effectively and achieve their goal.
3.5 Stakeholder Coordination
There are limited resources available to build the marine infrastructure that is needed in the state. Those organizations that are involved in building marine infrastructure need to reduce costs in order to maximize the amount or quality of infrastructure that can be put in place. Limited coordination among these organizations, and others, was identified as an impediment to developing marine infrastructure in the state.
Several people noted that ADOT&PF can have several different contact points for port and harbor projects, which can make it difficult for persons not familiar with the agency to identify the individual that is responsible for a specific project. Conversely, it also makes it difficult to identify projects that have been proposed or approved by the state.
One example noted by a person interviewed for this document, was that three different agencies had different construction projects slated for the same community in the same summer building season. Each agency could have saved a substantial amount of money if they had been able to coordinate the mobilization and demobilization efforts for their projects, but they were unable to do so.
It can be difficult for organizations developing marine infrastructure to know of all infrastructure projects (e.g., school expansion or new health clinic) that may be planned in a community, particularly if they are not in close communication with key individuals and representatives in the local community. The lack of formal policies to maintain communication with local communities was

Policy and Plan Development
Final 17
noted by one interviewee as an impediment to keeping momentum and interest in port and harbor development projects, which can take a very long time to execute.
Some smaller communities have undertaken port and harbor projects that are funded by state and federal agency grants, and the communities have not had the capacity to effectively manage construction projects, or the required skills for a force account project were not available in the community. As a result, the projects were not completed or not built to the design specifications. This lack of capacity was noted as an impediment, and grant providers need to ensure that the project management and construction skills are available in a community before providing funds.
3.6 Current Legislation
This subsection focuses on State of Alaska legislation since the study focuses on port and harbor development in the state and it is more difficult to change legislation at the federal level.
Several persons that were interviewed for this document indicated that there were certain State of Alaska statutes that impeded port and harbor development. For example, port authorities or regional resource development authorities can be agents for economic development in the state, but they do not have powers of taxation, even in areas where borough governments do not exist. Without such powers, it is more difficult to build marine infrastructure.
At least one person interviewed for this study indicated that the state legislature should examine the ability of ADOT&PF to enter into public-private partnerships (PPPs). It was felt that current legislation does not enable ADOT&PF to enter into PPPs such as are being transacted in other states. Given the difficulty in obtaining public funds for port and harbor development, it is believed that providing the capability for ADOT&PF to access private capital through a PPP could improve the likelihood of development in certain ports and harbors.

Policy and Plan Development
18 Final
4 References
Alaska Department of Transportation and Public Facilities. Harbors Project Evaluation Criteria. Undated. Available at http://www.dot.state.ak.us/stwdplng/cip_stip/assets/eval_criteria/04criteria_ harbors.pdf. November 15, 2010.
Alaska Department of Transportation and Public Facilities. Municipal Harbor Facility Grant Program—Scoring Criteria. April 2010. Available at http://www.dot.state.ak.us/stwddes/desports/ harbor_grant.shtml#. December 1, 2010.
Anderson, Christine. Deputy Director, Alaska Industrial Development and Export Authority. Personal communication with Northern Economics, Inc. November 22, 2010.
Carter, Ruth. Coastal Engineer, Alaska Department of Transportation & Public Facilities. Personal communication with Northern Economics, Inc. September 1, 2010.
Commonwealth North. 2009 Infrastructure Study Group (Draft Report). November 12, 2009.
Cordova, Lorraine. Economics Section Chief, U. S. Army Corps of Engineers Alaska District. Personal communication with Northern Economics, Inc. August 31, 2010.
Dye Management Group, Inc. Sierra Yoyo Desan Road, British Columbia: A Case Study of Resource Road Public-Private Partnership (Discussion Draft). Prepared for the Alaska Department of Transportation & Public Facilities. March 17, 2009.
Lukshin, Mike. State Ports and Harbors Engineers, Alaska Department of Transportation & Public Facilities. Personal communication with Northern Economics, Inc. September 20, 2010.
McKinnon, Mike. Contractor to the Denali Commission, McKinnon & Associates. Personal communication with Northern Economics, Inc. August 25, 2010.
Ottesen, Jeff. Chief of Planning. Alaska Department of Transportation & Public Facilities. Personal communication with Northern Economics, Inc. September 9, 2010.
Sexauer, Bruce. Senior Plan Formulator, U. S. Army Corps of Engineers Alaska District. Personal communication with Northern Economics, Inc. August 31, 2010.
Smith, Harvey. State Coastal Engineer, Alaska Department of Transportation & Public Facilities. Personal communication with Northern Economics, Inc. September 1, 2010.
Smith, Adison. Denali Access System FFY 2006 – 2011 Roads and Waterfront Development Program Waterfront Development Project Evaluation Criteria. Personal communication with Northern Economics, Inc. November 23, 2010.
Taylor, Eric. Manager, Statewide Long Range Transportation Plan and Transit Program, Alaska Department of Transportation & Public Facilities. Personal communication with Northern Economics, Inc. September 20, 2010.
Ted Stevens Anchorage International Airport, 2008.”Ted Stevens Anchorage International Airport Yesterday –– Today –– Tomorrow.” January 28, 2008. Available at http://dot.state.ak.us/anc/ business/communityRelations/presentations/08jan28ChamberOfCommerce.pdf. November 16, 2010.
U. S. Department of Commerce, National Oceanic and Atmospheric Administration. U. S. Coast Pilot 9 Pacific and Arctic Coasts Alaska: Cape Spencer to Beaufort Sea. Available at http://www.nauticalcharts.noaa.gov/nsd/coastpilot/files/cp9/CP9-28ed-Ch08_9.pdf. September 27, 2010.