albania revised ndc
TRANSCRIPT
1
ALBANIA REVISED NDC
ALBANIA REVISED NDC ............................................................................................................... 1
1. NATIONAL CIRCUMSTANCES .............................................................................................. 1
2. MITIGATION ............................................................................................................................. 4
2.1. Situation of the country ........................................................................................................ 4 2.2. Projections ........................................................................................................................... 7
3. ADAPTATION ........................................................................................................................ 27
3.1. The Albanian coast and AFOLU sector - background ...................................................... 28 3.2. Climate variability and change .......................................................................................... 33 3.3. Climate change risks, impacts and vulnerability ............................................................... 36 3.4. Adaptation measures ......................................................................................................... 62
4. FAIRNESS, AMBITION AND CONTRIBUTION TOWARDS ACHIEVING THE OBJECTIVE
OF THE CONVENTION ................................................................................................................. 75
5. MEANS OF IMPLEMENTATION ........................................................................................... 77
5.1. Institutional and legal aspects ........................................................................................... 77 5.2. Knowledge and capacity ................................................................................................... 77 5.3. Technology transfer ........................................................................................................... 78 5.4. Finance .............................................................................................................................. 78
6. CLARITY, TRANSPARENCY AND UNDERSTANING ......................................................... 79
7. ANNEXES ............................................................................................................................... 85
Annex 1. Mitigation calculations (details for sectors) .................................................................... 85 7.1. Energy ............................................................................................................................... 85 7.2. IPPU................................................................................................................................... 94 7.3. Waste ................................................................................................................................. 94 7.4. AFOLU ............................................................................................................................. 101 Annex 2. Adaptation ..................................................................................................................... 114 7.5. Map related to the presentation of the Albanian coast ................................................... 114 7.6. Graphs, figures and maps related to climate variability and change .............................. 115 7.7. Figure related to sectoral vulnerability ............................................................................ 121 7.8. Detailed prioritization table .............................................................................................. 122

Albania Revised NDC
2
Albania Revised NDC
i
ABBREVATIONS
4NC Fourth National Communication of Albania to the UNFCCC
AFOLU Agriculture, Forestry and Other Land Uses
ALKOGAP Albania - Kosovo Pipeline (Project)
AR5 Fifth Assessment Report of the IPCC
ARDA Agriculture and Rural Development Agency
BAU Business-as-usual
BOD Biochemical oxygen demand
C Carbon
CAP Common Agricultural Policy of the European Union
CCGT Combined cycle gas turbine
CCKP Climate Change Knowledge Portal
CH4 Methane
CMPI5 Coupled Model Intercomparison Project Phase 5
CO2 Carbon dioxide
CO2e Carbon dioxide equivalent
COD Chemical oxygen demand
ECCS Draft Environmental Cross-cutting Strategy
EE Energy Efficiency
EFFIS European Forest Fire Information System
EU European Union
EU European Union
FAO Food and Agriculture Organization of the United Nations
FNC First National Communication
FOLU Forest and Other Land Use
GACMO Greenhouse Gas Abatement Cost Model
GDI Gender development index
GDP Gross Domestic Product
GHG Greenhouse gas
GWP Global Warming Potential
Ha Hectares
HDI Human Development Index
IAP Ionian Adriatic Pipeline Project)
ICSP Integrated cross-sectoral plan for the coastal belt
IMWGCC Inter-Ministerial Working Group on Climate Change
INSTAT Albanian Institute of Statistics
IPARD Rural Development Programme 2014-2020 under the Instrument for Pre-accession Assistance
IPCC Intergovernmental Panel on Climate Change
Albania Revised NDC
ii
IPPU Industrial Processes and Product Use
ISARD Inter-sectoral Strategy for Agriculture and Rural Development
kt Kilotons
LANFPF Draft law on the administration of the national forest and pasture fund in the republic of Albania
LEAP Low Emissions Analysis Platform
LPG Liquefied petroleum gas
MARD Ministry of Agriculture and Rural Development
MOTE Ministry of Tourism and Environment
MSW Municipal solid waste
N Nitrogen
N2O Nitrous oxide
NDC Nationally Determined Contribution
NEEAP National Energy Efficiencies Actions Plans
NREAP National Renewable Energy Action Plan
NSCC National Strategy on Climate Change
NSDI-II National Strategy for Development and Integration 2015-2020
NSE National Energy Strategy 2018-2030
NTP National Territorial Plan
PDFS On Policy Document of the Forest Sector in Albania – 2030
PPM Parts per million
RCP Representative Concentration Pathways
RES Renewable Energy Sources
SDG Sustainable Development Goals
SLR Sea-level rise
SPDBP Strategic Policy Document for the Protection of Biodiversity
SPEI Standardized Precipitation Evapotranspiration Index
TAP The Trans Adriatic Pipeline Project
TCI Tourism Climate Index
TJ Terajoules
TNC Third National Communication of Albania to the UNFCCC
TPP Thermal power plant
UNFCCC United Nations Framework Convention on Climate Change
1
1. NATIONAL CIRCUMSTANCES
The Republic of Albania is a Balkan country in Southeast Europe. It is located to the North of
Greece and to the South of Montenegro and Kosovo. To the West, it borders the Ionian (South)
and the Adriatic (North) seas, in the Mediterranean Sea, for 450 km. Albania’s land area totals
28,748 km2. The country’s average altitude is 700 meters above sea level, as 70% of the territory
is mountainous.
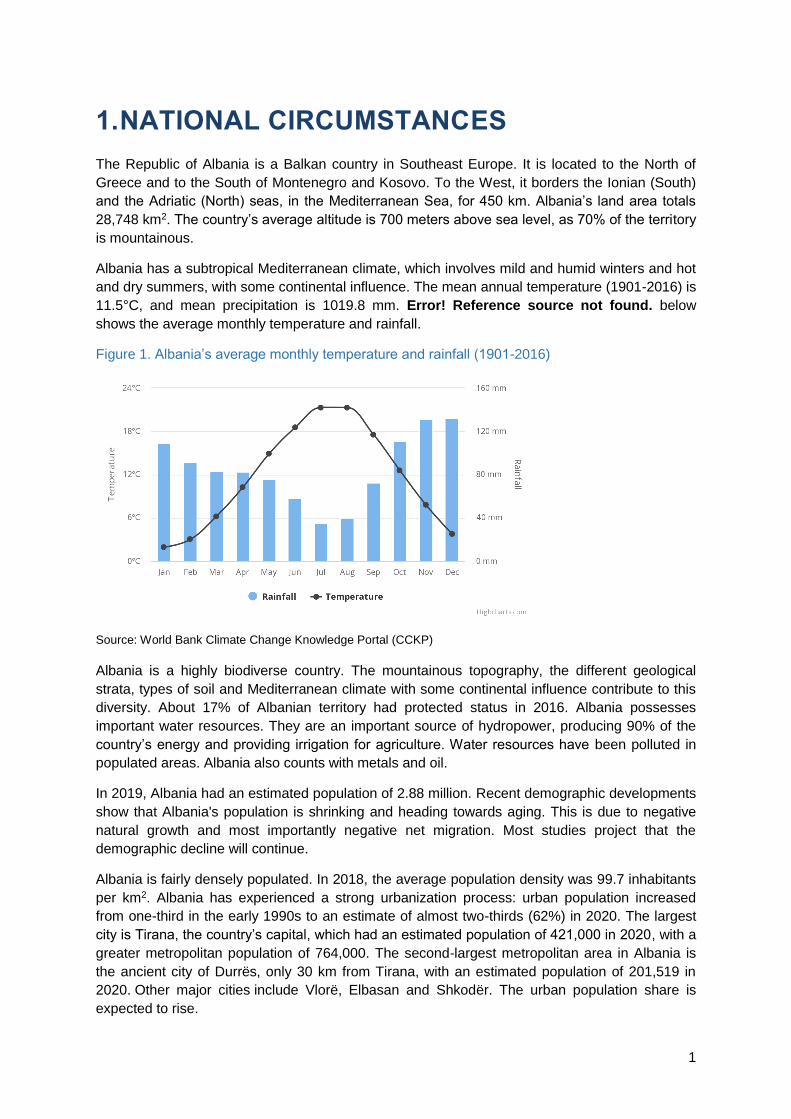
Albania has a subtropical Mediterranean climate, which involves mild and humid winters and hot
and dry summers, with some continental influence. The mean annual temperature (1901-2016) is
11.5°C, and mean precipitation is 1019.8 mm. Error! Reference source not found. below
shows the average monthly temperature and rainfall.
Figure 1. Albania’s average monthly temperature and rainfall (1901-2016)
Source: World Bank Climate Change Knowledge Portal (CCKP)
Albania is a highly biodiverse country. The mountainous topography, the different geological
strata, types of soil and Mediterranean climate with some continental influence contribute to this
diversity. About 17% of Albanian territory had protected status in 2016. Albania possesses
important water resources. They are an important source of hydropower, producing 90% of the
country’s energy and providing irrigation for agriculture. Water resources have been polluted in
populated areas. Albania also counts with metals and oil.
In 2019, Albania had an estimated population of 2.88 million. Recent demographic developments
show that Albania's population is shrinking and heading towards aging. This is due to negative
natural growth and most importantly negative net migration. Most studies project that the
demographic decline will continue.
Albania is fairly densely populated. In 2018, the average population density was 99.7 inhabitants
per km2. Albania has experienced a strong urbanization process: urban population increased
from one-third in the early 1990s to an estimate of almost two-thirds (62%) in 2020. The largest
city is Tirana, the country’s capital, which had an estimated population of 421,000 in 2020, with a
greater metropolitan population of 764,000. The second-largest metropolitan area in Albania is
the ancient city of Durrës, only 30 km from Tirana, with an estimated population of 201,519 in
2020. Other major cities include Vlorë, Elbasan and Shkodër. The urban population share is
expected to rise.
Albania Revised NDC
2
After 50 years of communist rule, Albania has transformed from one of the poorest countries in
Europe in the early 1990s to an upper-middle-income country in 2020. As a result of three
decades of remarkable economic growth, in 2019, its GDP amounted to USD 15.3 billion, and its
GDP per capita to USD 5,450.
This economic growth has been associated with structural economic changes, with a transition
from an economy based on raw materials and agriculture and industry, into a more diverse
economy, where the service sector plays a leading role. In 2019, the service sector (represented
by the subsectors of trade, transport, commercial activities and telecommunication services)
constituted about 50% of the GDP of the country. Industry and construction made up about 20%
of the GDP and the agriculture sector contributed about 19% of the GDP. Public debt was over
65% in 2019.
Over the last three decades social indicators have improved in Albania. In 2019 Albania’s Human
Development Index (HDI) value, which considers life expectancy at birth, education and gross
national income per capita, was 0.795— which put the country in the high human development
category— positioning it at 69 out of 189 countries and territories1. In 2012, the most recent year
with official poverty figures, 14.3% of Albanians lived below the national poverty line2, while 1.1%
lived below the international extreme poverty line and 39.1% lived below the upper middle
income poverty line. Unemployment reached a historically low 11.4 percent in Q3 of 2019. The
latest Gini index was estimated at 33.2 in 2017 (0 representing equality and 100 inequality).
The socio-economic progress of Albania has been recently hampered by two shocks. The
country was hit by a devastating earthquake in November 2019. The earthquake, measuring 6.3
on the Richter scale, the strongest in 30 years, caused 51 fatalities, injured at least 913 people
and affected over 200,000 people (17,000 people were displaced). It caused extensive damage
to physical assets in 11 municipalities, including the two most populous and developed
municipalities (Tirana and Durres). Tourism assets and housing were hit the hardest. The
earthquake led to losses equivalent to an estimated 7.5% of GDP.
In the midst of the reconstruction efforts, the COVID-19 crisis is putting more pressure on the
Government’s budget and response, and the country’s socio-economic progress, as it forced
Albania, as other countries, to put key economic sectors in lockdown. The tourism sector, a key
driver of growth, was hit especially hard because of containment measures and travel
restrictions. In the second quarter of 2020, employment declined by 3.6% year-on-year. The
earthquake and the pandemic are expected to significantly increase poverty, resulting in poverty
rates comparable to those in 2005.
Since the early 1990s, Albania has implemented important structural reforms to promote
equitable economic growth and improve governance and public service delivery. In a transition
from a centrally planned to a market-oriented economy, this has included macroeconomic and
fiscal sustainability, financial sector stabilization, energy reform, social assistance and disability
reform, and territorial decentralization.
1 Between 1990 and 2019, Albania’s life expectancy at birth increased by 6.7 years, mean years of schooling
increased by 2.3 years and expected years of schooling increased by 3.1 years. Albania’s GNI per capita
increased by about 183.5 percent between 1990 and 2019. 2 The national poverty line is set at 60% of national median equalised disposable income (after social transfers). The percentage of Albanians living below the poverty line decreased from 25.4% in 2002 to 12.5 in 2008 and then increased to 14.3% in 2012. The international extreme poverty line is set up at US$1.90 per person per day (2011 PPP). The upper middle income country poverty line is set at 5.5 per person per day, 2011 PPP.
Albania Revised NDC
3
The key national planning document currently in place is the National Strategy for Development
and Integration 2015-2020 (NSDI-II), which was adopted by the Government of Albania in May
2016. This strategic document reflects the vision, priorities, objectives and means for social and
economic development of the country up to 2020. About 37 sectoral strategies3 adopted by the
Albanian Government (and in three cases, by the Parliament) complement the NSDI-II. The
NSDI-II is organized around 13 cross-cutting foundations on good governance, democracy and
rule of law, and four main sectoral pillars: i) growth through macroeconomic and fiscal stability; ii)
economic growth through enhanced competitiveness and innovation; ii) investing in social capital
and social cohesion and iv) growth through sustainable use of natural resources and territorial
development. National elections took place in April 2021.
The overarching goal of NSDI-II is the accession to the European Union (EU). After the EU’s
decision in March 2014 to open accession talks with the country, Albania is advancing the EU
integration agenda. As part of the process, the country is transposing and implementing parts of
the EU legislation - most national plans or actions, including in the environmental domain, are
now designed to take into account policies and directives of the EU. Albania is also considering
the EU’s strategies and plans for the Western Balkans of which Albania is part4, such as the EU
Economic and Investment Plan for the Western Balkans5, adopted in October 2020, the EU
Green Deal for the Western Balkans6, adopted in November 2020, and the the Decision Nr. 90,
date 17.2.2021 « On approval of National Plan for European Integration, 2021–2023 »among
others.
Besides the EU, Albania is an active participant in multilateral organizations and agreements.
The Republic of Albania is a signatory Party of the United Nations Framework Convention on
Climate Change (UNFCCC), which was ratified by the Albanian Parliament in 1994. In April
2016, Albania signed the Paris Agreement. In December 2017 the Albanian Parliament
unanimously approved a resolution confirming the country’s commitment to Agenda 2030 and
achievement of the Sustainable Development Goals (SGDs).
In line with global and regional commitments and national priorities, Albania has made progress
on climate change mitigation and adaptation. In 2014, the Albanian government established the
Inter-Ministerial Working Group on Climate Change (IMWGCC), which coordinates all institutions
involved in climate change processes and facilitates the integration of climate change into
relevant new and existing policies, programs and activities. In July 2019 Albania approved a
National Climate Change Strategy and corresponding national mitigation and adaptation plans.
The country has implemented several mitigation and adaptation projects and studies.
The Republic of Albania submitted its first NDC in November 2015, with the commitment “to
reduce CO2 emissions compared to the baseline scenario in the period of 2016 and 2030 by
11.5%, or 708 kT CO2 emission reduction in 2030”. Regarding mitigation, the scope was limited
3 Including for instance the energy strategy of 2018, the sustainable transport sector plan of 2015 or the national
strategy for sustainable tourism development 2019-2023. 4 In addition to Albania, for the EU the Western Balkans region includes Kosovo, Serbia, Montenegro, North-
Macedonia and Bosnia and Herzegovina 5 This investment plan, which will mobilise up to €9 billion of funding for the region, aims to spur the long-term
economic recovery of the region, support a green and digital transition, foster regional integration and convergence with the European Union. 6 This foresees actions around five pillars: (i) climate action, including decarbonization, energy and mobility, (ii)
circular economy, addressing in particular waste, recycling, sustainable production and efficient use of resources,
(iii) biodiversity, aiming to protect and restore the natural wealth of the region, (iv) fighting air, water and soil
pollution and (v) sustainable food systems and rural areas.
Albania Revised NDC
4
in terms of both gases and sectors. The NDC only covered CO2 gases - it did not include other
relevant gases such as CH4, N2O, F-gases; and it only covered energy and industrial processes
sectors - it did not include agriculture, Forest and Other Land Use (FOLU) and waste sectors.
No references to specific mitigation actions or adaptation were included.
2. MITIGATION
2.1. Situation of the country
2.1.1. Historical GHG emissions trends
Albania’s greenhouse gas (GHG) mean annual emissions, according to the national inventory
prepared for the 4th National Communication and the final draft of 1st BUR, amounted to 10.8 Mt
CO2e/y in the period 2009-2016. Compared to the rest of Europe, this level of emission is low.
While the level of emissions per capita is 8.7 t CO2e/hab in the EU-27 in 2018, the level of
emission per capita in Albania is 3.5 t CO2e/hab in 2016.
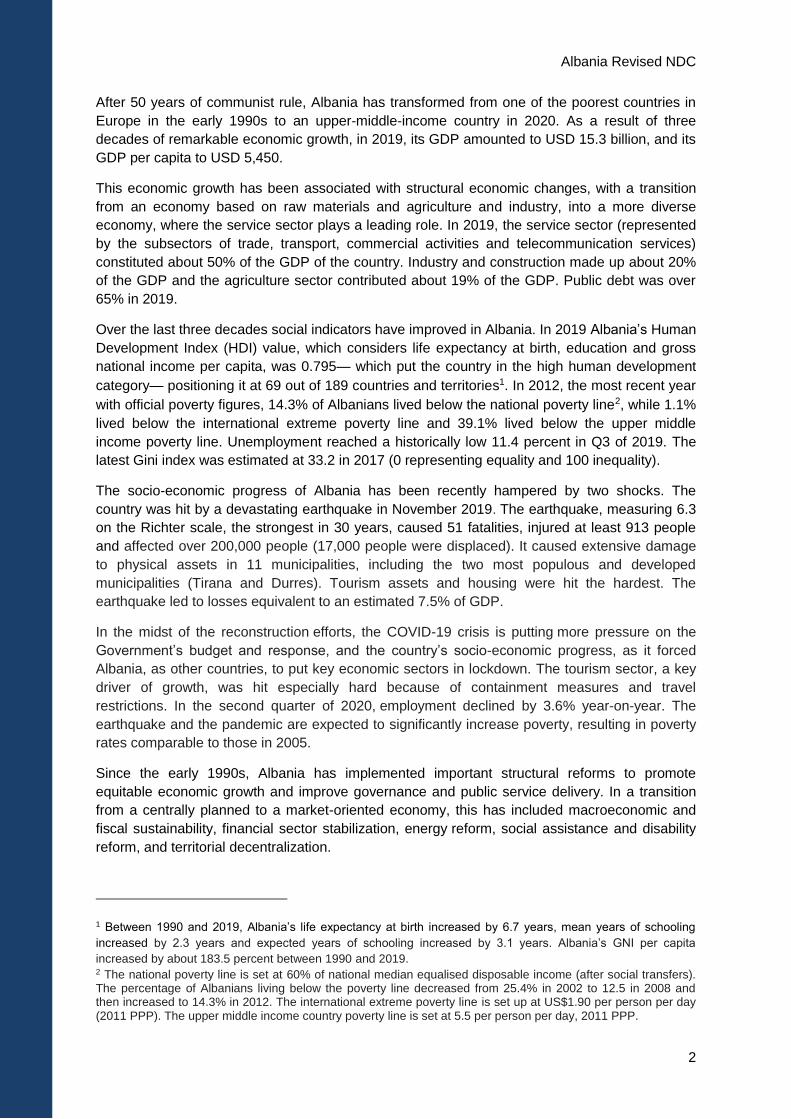
During this period, emissions have increased only slightly: they amounted to 9,925 kt CO2e in
2009 and to 10,139 kt CO2e in 2016 (+2.2%). During this period, only important variation in terms
of emissions is due to exceptional episodes of forest fires in 2011-2012 that are accounted in the
FOLU sector.
Figure 2. Albania’s mean annual GHG emissions (kt CO2e) per sector (2009-2016)
This overall national evolution hides discrepancies between individual sectors:
Emissions of the Energy sector amounted to 4,243 kt CO2e in 2009 and to 4,664 kt CO2e
in 2016 (+9.9%).
Emissions of the Industrial processes and Product Use (IPPU) sector amounted to 1,356
kt CO2e in 2009 and to 1,020 kt CO2e in 2016 (-24.8%). This decrease is mainly due to a
technology switch in the Iron & Steel sector between 2009 (Direct Reduced Iron
Production) and 2010 (Electric Arc Furnace).
Albania Revised NDC
5
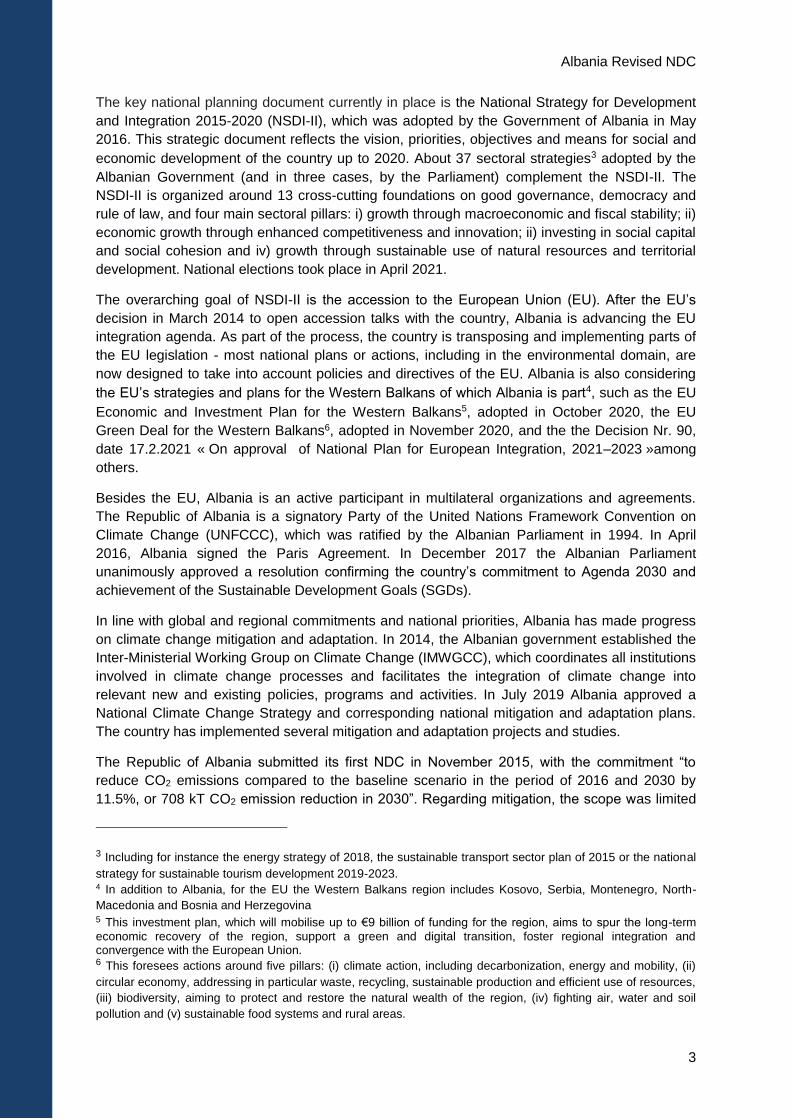
Emissions of the Waste sector amounted to 621 kt CO2e in 2009 and to 838 kt CO2e in
2016 (+35.1%).
Emissions of the Agriculture sector amounted to 2,239 kt CO2e in 2009 and to 2,344 kt
CO2e in 2016 (+4.7%).
Emissions of the Forest and Other Land Use (FOLU) sector amounted to 1,467 kt CO2e
in 2009 and to 1,274 kt CO2e in 2016 (-12.4%). Emissions peaks are caused by the
effect of exceptional episodes of forest fires in 2011-2012. However, the fuelwood
demand is the important driver of FOLU trends in general and is the main reason why the
FOLU is not a net carbon sink during the period as CO2 emissions from the combustion
of wood are reported under the FOLU sector and not under the energy sector.
Specific trends per sector are presented on the figure below:
Figure 3. Emission trends (kt CO2e) per sector (2009-2016)
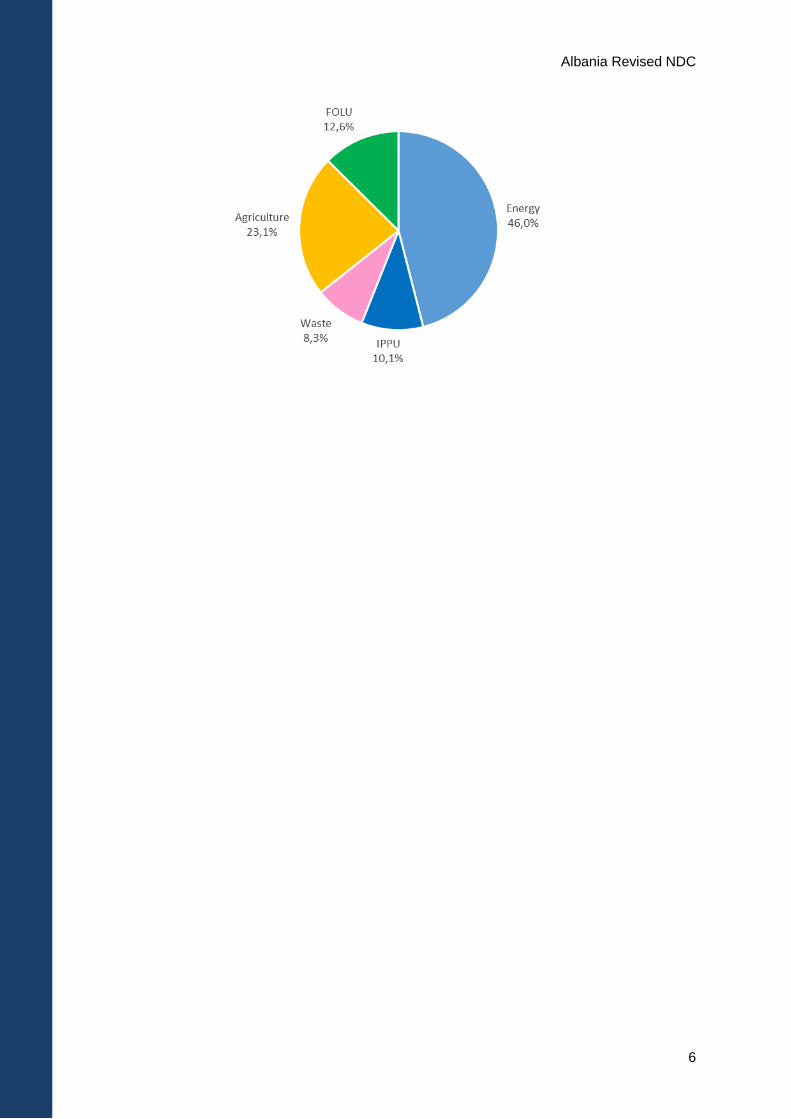
2.1.2. 2016 GHG inventory
In 2016, according to the national inventory figures from the draft of the first BUR and the 4th
National Communication, used as a base for the NDC projections, Albania emitted 10,184 kt
CO2e, 46.0% from the Energy sector; 23.1% from the Agriculture sector; 12.6% from the FOLU
sector; 10.1% from the IPPU sector and 8.3% from the Waste sector.
Figure 4. 2016 emissions
Albania Revised NDC
6
Albania Revised NDC
7
2.2. Projections
2.2.1. BAU scenario
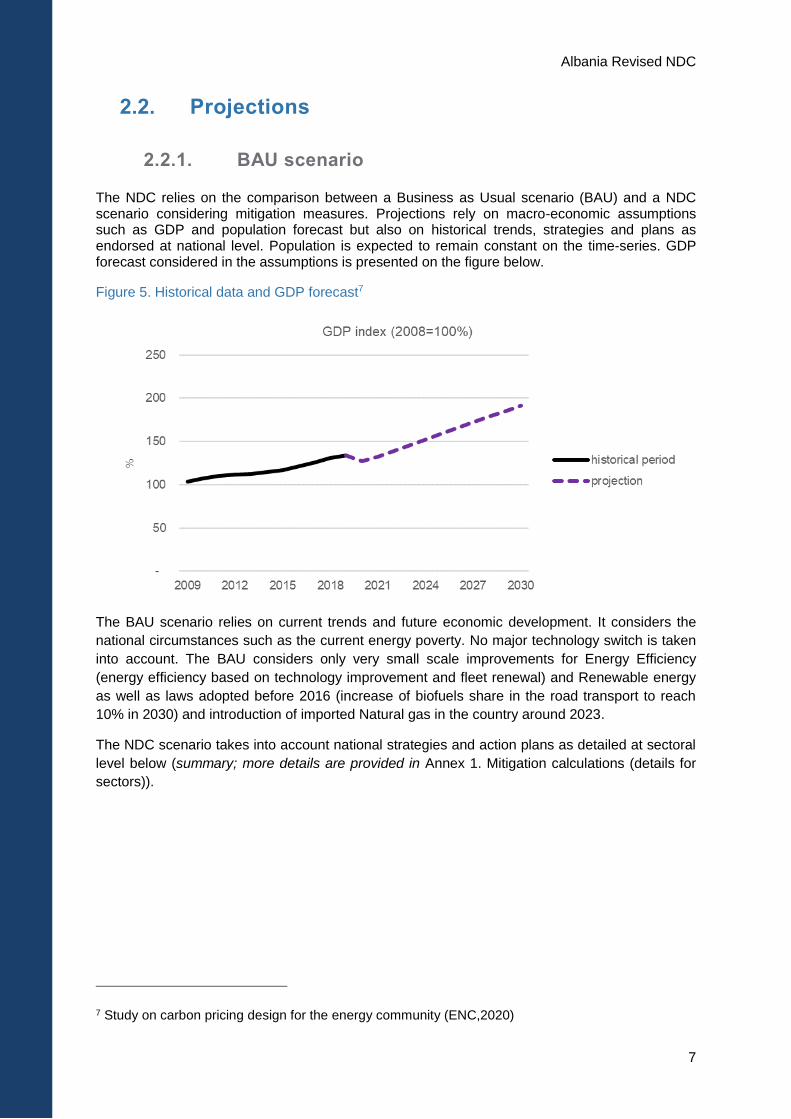
The NDC relies on the comparison between a Business as Usual scenario (BAU) and a NDC scenario considering mitigation measures. Projections rely on macro-economic assumptions such as GDP and population forecast but also on historical trends, strategies and plans as endorsed at national level. Population is expected to remain constant on the time-series. GDP forecast considered in the assumptions is presented on the figure below.
Figure 5. Historical data and GDP forecast7
The BAU scenario relies on current trends and future economic development. It considers the
national circumstances such as the current energy poverty. No major technology switch is taken
into account. The BAU considers only very small scale improvements for Energy Efficiency
(energy efficiency based on technology improvement and fleet renewal) and Renewable energy
as well as laws adopted before 2016 (increase of biofuels share in the road transport to reach
10% in 2030) and introduction of imported Natural gas in the country around 2023.
The NDC scenario takes into account national strategies and action plans as detailed at sectoral
level below (summary; more details are provided in Annex 1. Mitigation calculations (details for
sectors)).
7 Study on carbon pricing design for the energy community (ENC,2020)
Albania Revised NDC
8
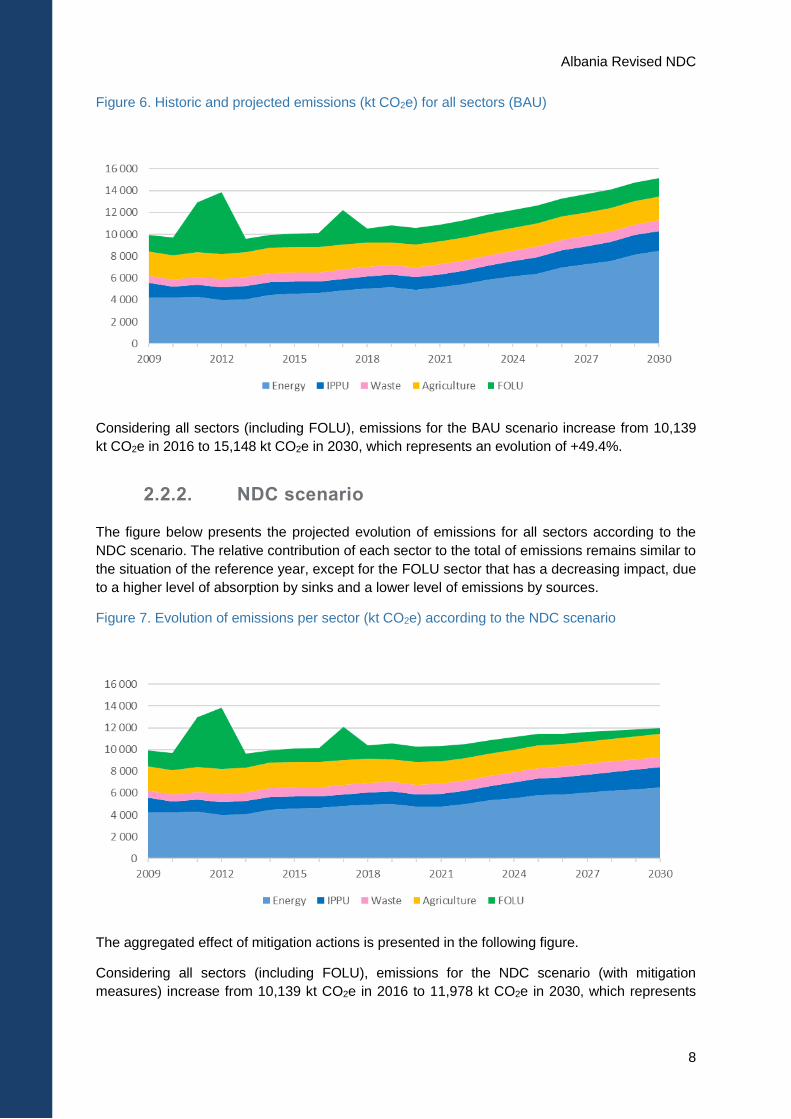
Figure 6. Historic and projected emissions (kt CO2e) for all sectors (BAU)
Considering all sectors (including FOLU), emissions for the BAU scenario increase from 10,139
kt CO2e in 2016 to 15,148 kt CO2e in 2030, which represents an evolution of +49.4%.
2.2.2. NDC scenario
The figure below presents the projected evolution of emissions for all sectors according to the
NDC scenario. The relative contribution of each sector to the total of emissions remains similar to
the situation of the reference year, except for the FOLU sector that has a decreasing impact, due
to a higher level of absorption by sinks and a lower level of emissions by sources.
Figure 7. Evolution of emissions per sector (kt CO2e) according to the NDC scenario
The aggregated effect of mitigation actions is presented in the following figure.
Considering all sectors (including FOLU), emissions for the NDC scenario (with mitigation
measures) increase from 10,139 kt CO2e in 2016 to 11,978 kt CO2e in 2030, which represents
Albania Revised NDC
9
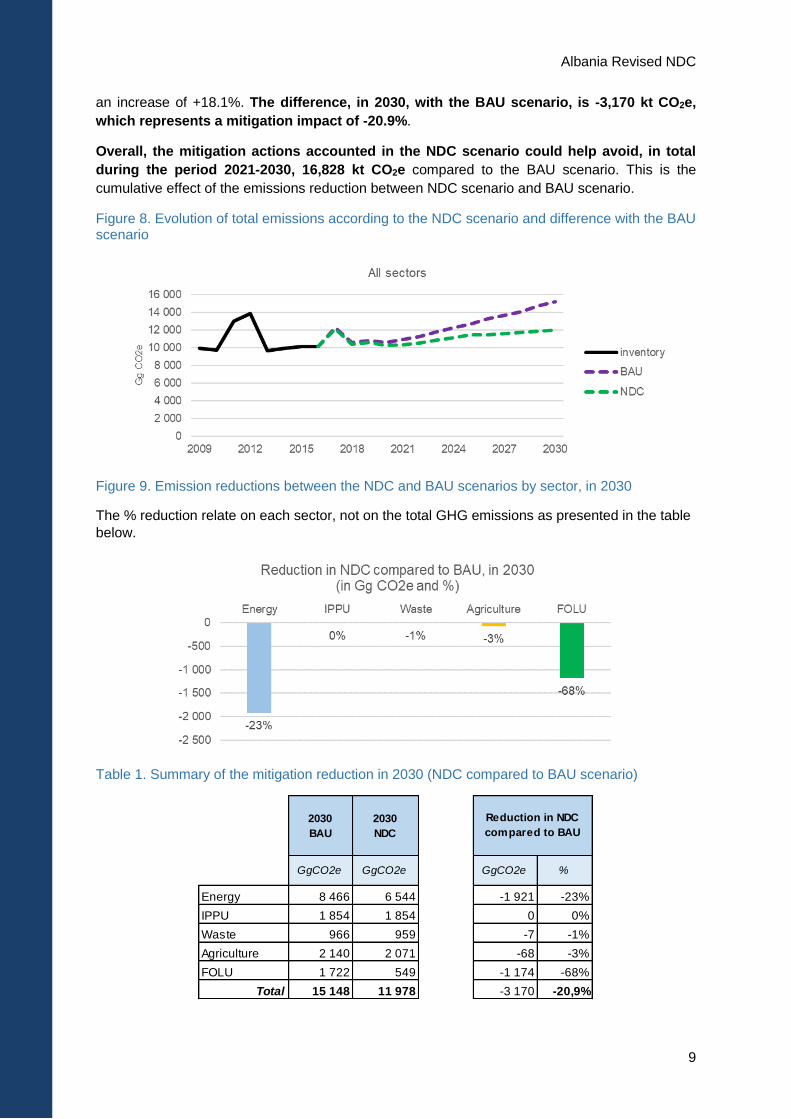
an increase of +18.1%. The difference, in 2030, with the BAU scenario, is -3,170 kt CO2e,
which represents a mitigation impact of -20.9%.
Overall, the mitigation actions accounted in the NDC scenario could help avoid, in total
during the period 2021-2030, 16,828 kt CO2e compared to the BAU scenario. This is the
cumulative effect of the emissions reduction between NDC scenario and BAU scenario.
Figure 8. Evolution of total emissions according to the NDC scenario and difference with the BAU scenario
Figure 9. Emission reductions between the NDC and BAU scenarios by sector, in 2030
The % reduction relate on each sector, not on the total GHG emissions as presented in the table
below.
Table 1. Summary of the mitigation reduction in 2030 (NDC compared to BAU scenario)
2030
BAU
2030
NDC
GgCO2e GgCO2e GgCO2e %
Energy 8 466 6 544 -1 921 -23%
IPPU 1 854 1 854 0 0%
Waste 966 959 -7 -1%
Agriculture 2 140 2 071 -68 -3%
FOLU 1 722 549 -1 174 -68%
Total 15 148 11 978 -3 170 -20,9%
Reduction in NDC
compared to BAU
Albania Revised NDC
10
2.2.3. Energy
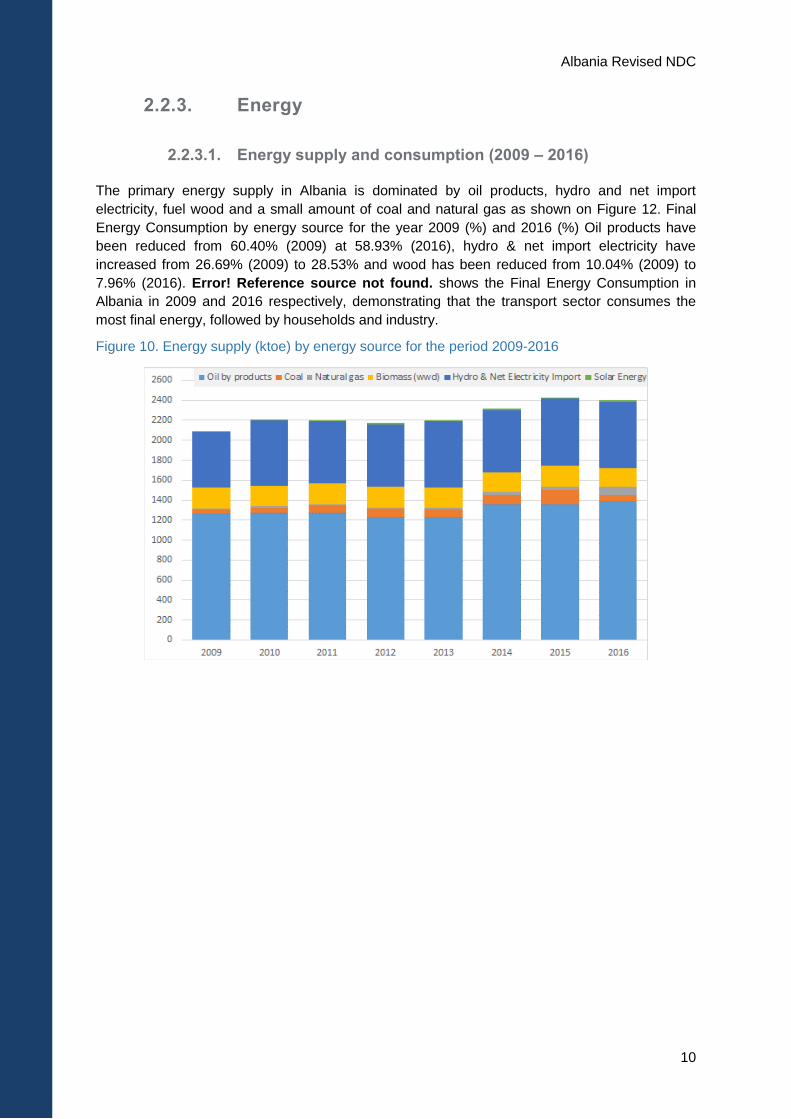
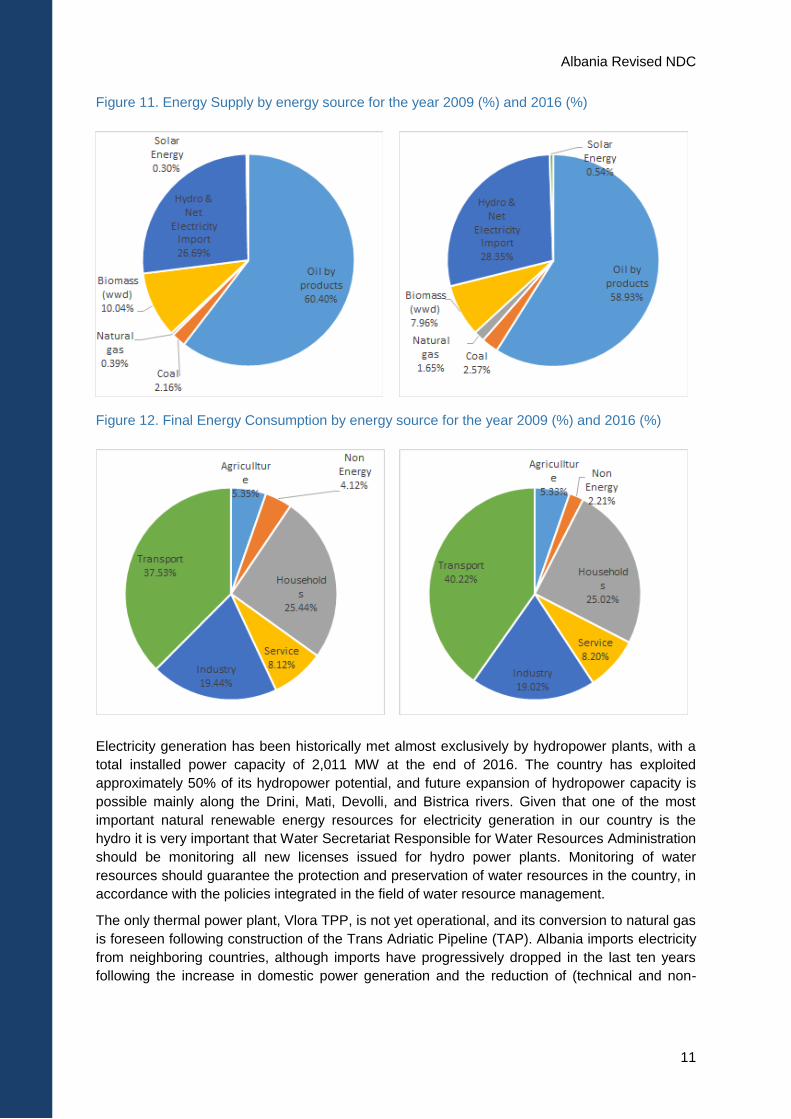
2.2.3.1. Energy supply and consumption (2009 – 2016)
The primary energy supply in Albania is dominated by oil products, hydro and net import
electricity, fuel wood and a small amount of coal and natural gas as shown on Figure 12. Final
Energy Consumption by energy source for the year 2009 (%) and 2016 (%) Oil products have
been reduced from 60.40% (2009) at 58.93% (2016), hydro & net import electricity have
increased from 26.69% (2009) to 28.53% and wood has been reduced from 10.04% (2009) to
7.96% (2016). Error! Reference source not found. shows the Final Energy Consumption in
Albania in 2009 and 2016 respectively, demonstrating that the transport sector consumes the
most final energy, followed by households and industry.
Figure 10. Energy supply (ktoe) by energy source for the period 2009-2016
Albania Revised NDC
11
Figure 11. Energy Supply by energy source for the year 2009 (%) and 2016 (%)
Figure 12. Final Energy Consumption by energy source for the year 2009 (%) and 2016 (%)
Electricity generation has been historically met almost exclusively by hydropower plants, with a
total installed power capacity of 2,011 MW at the end of 2016. The country has exploited
approximately 50% of its hydropower potential, and future expansion of hydropower capacity is
possible mainly along the Drini, Mati, Devolli, and Bistrica rivers. Given that one of the most
important natural renewable energy resources for electricity generation in our country is the
hydro it is very important that Water Secretariat Responsible for Water Resources Administration
should be monitoring all new licenses issued for hydro power plants. Monitoring of water
resources should guarantee the protection and preservation of water resources in the country, in
accordance with the policies integrated in the field of water resource management.
The only thermal power plant, Vlora TPP, is not yet operational, and its conversion to natural gas
is foreseen following construction of the Trans Adriatic Pipeline (TAP). Albania imports electricity
from neighboring countries, although imports have progressively dropped in the last ten years
following the increase in domestic power generation and the reduction of (technical and non-
Albania Revised NDC
12
technical) electricity losses in the distribution system, which have been reduced from 45% in
2013 to 28% by the end of 20168 with a clear investment and management plan to reduce them
further to 17% by the end of 2022. Albania’s electricity market is under transition from a centrally
planned to a market-based system. The wholesale power market is dominated by the state-
owned, regulated generation company KESh, which supplies to OSHEE the electricity needed for
captive customers under regulated “full supply” condition. The competitive wholesale
environment consists of independent producers and a small number of large customers supplied
through bilateral contracts.
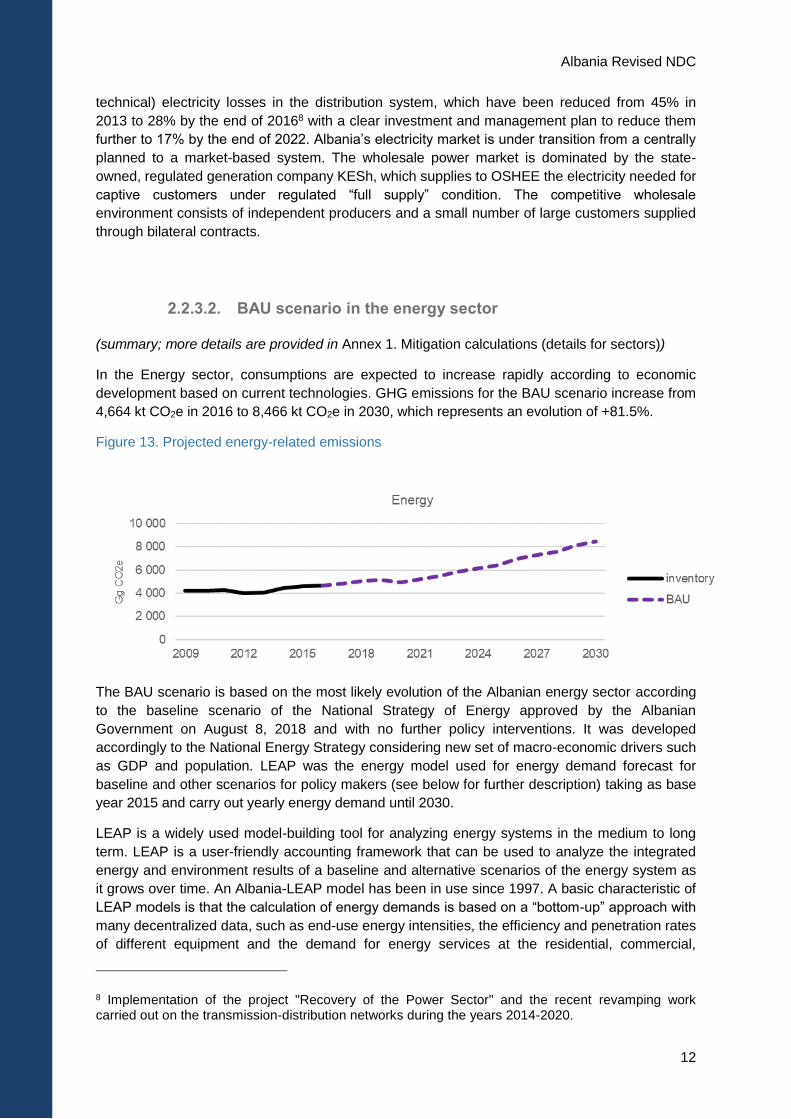
2.2.3.2. BAU scenario in the energy sector
(summary; more details are provided in Annex 1. Mitigation calculations (details for sectors))
In the Energy sector, consumptions are expected to increase rapidly according to economic
development based on current technologies. GHG emissions for the BAU scenario increase from
4,664 kt CO2e in 2016 to 8,466 kt CO2e in 2030, which represents an evolution of +81.5%.
Figure 13. Projected energy-related emissions
The BAU scenario is based on the most likely evolution of the Albanian energy sector according
to the baseline scenario of the National Strategy of Energy approved by the Albanian
Government on August 8, 2018 and with no further policy interventions. It was developed
accordingly to the National Energy Strategy considering new set of macro-economic drivers such
as GDP and population. LEAP was the energy model used for energy demand forecast for
baseline and other scenarios for policy makers (see below for further description) taking as base
year 2015 and carry out yearly energy demand until 2030.
LEAP is a widely used model-building tool for analyzing energy systems in the medium to long
term. LEAP is a user-friendly accounting framework that can be used to analyze the integrated
energy and environment results of a baseline and alternative scenarios of the energy system as
it grows over time. An Albania-LEAP model has been in use since 1997. A basic characteristic of
LEAP models is that the calculation of energy demands is based on a “bottom-up” approach with
many decentralized data, such as end-use energy intensities, the efficiency and penetration rates
of different equipment and the demand for energy services at the residential, commercial,
8 Implementation of the project "Recovery of the Power Sector" and the recent revamping work carried out on the transmission-distribution networks during the years 2014-2020.
Albania Revised NDC
13
agriculture, industry and transport sectors levels. Given these sectoral demands, LEAP software
calculates the demand for primary energy sources, electricity and all other energy commodities.
LEAP also calculates a variety of emissions that are generated from the fuels used.
Nowadays, the Albanian economy is predominantly based on the service sector. Agriculture has
also been one of the most important economic sectors in Albania. Nonetheless, during the last
decade the Albanian economy has shifted towards industry and service due to increased
urbanization and emigration. Consequently, the service sector is today the largest contributor to
GDP, comprising around 60% of the total, followed by agriculture and manufacturing industry. All
these factors have been incorporated into the Baseline sectoral demand projections.
The main drivers of energy consumption in the residential sector are population and the number
of households. Data on the number of persons per household in developed European countries
and countries in transition show that household size decreases as the standard of living grows.
The decrease occurs due to the aging of the population and the increase in the number of one-
member and two-member households. In Albania, the number of persons per household is
expected to decrease from 2.92 in 2014 to 2.41 in 2030.
To reflect the various climatic zones in Albania, households were categorized into three zones
with respect to their heating and cooling demands. Breakdown between zones is done based on
the concept of Heating Degree Days according to the Albanian Energy Building Code (approved
by the Albanian Council of Ministers in January 2003). Zone 1 is most of the urban centers in
coastal area of Albania with heating degree days lower than 1300 °C, Zone 2 with cities with
heating degree days higher than 1300 °C and lower than 2300 °C, and Zone 3 is mountainous
areas with heating degree days higher than 2300 °C.
The basic measure of heating standard in the model is heated area. The heated area of the
average household was determined based on statistical data and calibrating with the data from
the energy balance. The share of heated area in total living area (load factor) is 31% and is the
result of the purchasing ability of the population, the availability of firewood, the price of
electricity, and life priorities arising from tradition and cultural heritage. Therefore, with standard
growth, the further increase of the share of heated area in a total area of housing units is 70% by
2030.
In order to calculate the energy demand, the Service Sector was divided in two branches: Public
Service and Private, or Commercial Service. The Public Service Sector is based on the
traditional approach to heat demand, mainly using not efficient technologies, installations and
organization, although in some recent cases new schemes have been introduced. Commercial
Service Sector approach is based on rapid introduction of modern technology, but improvements
are needed regarding the efficient utilization. Private Service Sector has inherited some
traditional repair-service and small shops/restaurants that have neither possibility nor demand for
space heating and air conditioning. Meanwhile, in many services, the private sector has
experienced modern and qualitative developments. This service group includes business
categories such as hotels, restaurants, banks, tourist agencies, consulting and insurance offices,
etc. as well as many parallel services with the public service such as education, culture, health,
etc., aiming the maximal comfort. Analysis of the energy demand is based on the general
tendency of the previous period. A number of driving factors were taken into consideration as
determining factors for the future energy demands. The public service buildings have as a
special driving factor the total volume, divided in the heated stock and unheated stock. In order to
increase the service quality, improve the working conditions and the comfort for the public
administration, was forecasted that until the end of the period 2014-2030, the existing ratio would
change in favour of the heated stock in 2030. The GDP growth from the service sector will be
Albania Revised NDC
14
accompanied with energy demand increase due to high comfort requirements, the qualitative
improvement of the services and changes of the ratio between the urban and rural populations in
favour of the former.
The structure of the industry sector in Albania shows that three main industrial sectors are
consuming the highest share of energy: food, metal and building materials industries. Each of
these industries is represented by its final energy consumption of electricity and other fuels. The
growth in GDP is the most influential determinant of energy demand in industry. In addition to
overall GDP growth, the value-added structure of the GDP drives the energy consumption for the
industry and agriculture sectors. In the early development of a society, agriculture contributes a
significant share of GDP. GDP from agriculture has been dominant in the past. As the society
develops, GDP from the Agriculture sector will increase in absolute terms, but the sectoral share
will remain constant in relative terms while the share of industry grows. GDP from the Service
sectors will increase in absolute terms. In developed economies the dominant GDP share
belongs to services, followed by industry and then agriculture. The growth in GDP is the most
influential determinant of energy demand in industry. For this analysis, given that little structural
changes are anticipated in the near-future, the expected contribution from agriculture is expected
to remain constant at 22.7%, while the contribution from the overall industry sector to be
increased from 14.9% (2014) up to 25% at 2030.
The Transport Sector is the largest energy consuming sector in Albania and plays an important
role in the consumption of energy resources. After 1990, there was a significant increase in the
number of the transport modes, especially for road transport, which lead to a significant increase
of transport activity and fuel consumption, mainly diesel and gasoline. In order to calculate the
future transport energy demand, the sector was divided in two sub sectors: transport of freight
and passengers. For the transport sector, two main indicators measure the demand for
passenger and freight transport: passenger-km and ton-km. It is forecasted that ton-km will
increase by 85% in 2030 compared to 2014, while passenger-km will increase by 37%. The vast
majority of transport is undertaken by road vehicles. Albania’s transport sector has been
increasing rapidly since 2000. The number of vehicles in circulation has increased and
infrastructure is being improved, which leads to an ever-increasing total traffic load. The transport
sector consumes significant quantities of energy (mostly in the form of diesel and gasoline).
Albania will continue to remain for many years a country where the agriculture dominates. The
income increase from the agricultural production, livestock, agro-industry, fishing and forestry
remains the main alternative for the economic and social development of the country. The
development of the agriculture sector is conditioned by many factors where the most important
are: Farms are of minimal sizes and fragmented; Problems exist over arable land property rights;
Farm inputs have very high prices and the distribution system for agricultural production is
unorganized and inefficient; There is a lack of available agriculture crediting, and Agricultural
production is insufficiently mechanized. The organisation of farms brings energy savings in the
NDC scenario.
2.2.3.1. Energy NDC scenario
The analysis of the Albanian Energy Sector was performed using the Albania-LEAP model
results adjusted according to the latest development of the period 2014-2020, a proven tool used
previously by the Albanian Government and commonly used by other countries in the region and
globally. The analytical results provided quantitative metrics for assessing the likely outcomes of
possible energy scenarios against the goals of this strategy.
Albania Revised NDC
15
Establishment of the NDC scenario for Energy Sector was based mainly on the Albania’s Energy
Sector Strategy, which is harmonized in terms of goals, energy sector details and timeline with a
number of other strategic and legal documents that are in force, adopted or drafted in the same
time frame as this document. Building on and complementing these documents has led to
synergies in the prioritization of policies and programs and in the development of strategic
recommendations. The National Strategy for the Energy Sector (2017-2030) is aligned with the
following key documents:
Obligations under the Energy Community;
National Strategy for Development and Integration – 2015-2020 (Albanian Council of
Ministers, 2017);
National Programs for Economic Reforms (NPER) 2015-2017 and 2016-2018 Albanian
Council of Ministers, 2017);
Albanian Renewable Energy Source Action Plan (NREAP adopted by the Governmental
Decree no.27, dated 20.01.2016);
1st National Energy Efficiency Action Plan 2011-2018 (Government Decree no. 619, date
7.09.2011)
2nd and 3rd Albanian Energy Efficiency Action Plan 2017-2020 (Government Decree
no.709, date 1.12.2017);
Intended National Determined Contribution (INDC approved by the Albanian Government
on September 2015);
The Decision of the Council of Ministers (DCM) no. 519, dated 13.07.2016 “On the
approval of the Market Model of the Power Sector”;
The DCM no. 125, dated 11.02.2015 “On the approval of the financial recovery plan in
the power electricity sector”;
Albanian National Gas Master Plan (November 2016);
Transport Sector Strategy in Albania – Final Strategy & Action Plan (DCM No. 811, dated
16.11.2016);
Albanian Sustainable Transport Plan (Draft Jane 2016);
Law on Biofuels No 9876 (2008)
Law on Power Sector No. 43/2015, dated 30.04.2015;
Law on Renewable Energy Sources No. 7/February 2017;
Law on Hydrocarbons No. 6/February 2017;
Law on Natural Gas No.102/2015, dated 23.09.2015;
Law on Energy Efficiency No. 124/2015, dated 12.11.2015;
Law on Energy Performance in Buildings No. 116/2016, dated 10.11.2016;
Law on Climate Change
Official Albanian Energy Balance prepared from AKBN for years 2009-2019;
Official ERE Annual reports related to Power Sector Electricity Balance prepared from
ERE for years 2012-2020;
Albania Revised NDC
16
CENSUS 2011 – Albanian Household Registration (INSTAT website);
GDP sectorial development 2012-2019 – (National Bank of Albania and the World Bank
websites)
First National Communication of Albania to the UNFCCC (FNC – 2002);
Albania’s Second National Communication to the Conference of Parties under the United
Nations Framework Convention on Climate Change (SNC – 2009);
Albania’s Third National Communication to the Conference of Parties under the United
Nations Framework Convention on Climate Change (TNC – 2016);
The following long-term strategic objectives were identified to actualize the Guiding Principles
and the current commitments that have been undertaken by the Albanian government.
Improving the reliability and security of energy supply;
Developing the domestic primary energy sources in a sustainable and competitive manner
Improving the cost-effectiveness of energy supply systems;
Achieving the targets for renewable energy sources and energy efficiency established in
the second National Energy Efficiency Action Plans and the National Renewable Energy
Action Plan;
Developing least cost and sustainable policy for residential heating and cooling
Integrating the Albanian power and natural gas markets with regional Energy Community
and European markets; and
Achieving the Nationally Determined Contribution (NDC) targets for greenhouse gas
(GHG) emission reductions.
To understand the costs and benefits of these possible policies, the following four other
scenarios were developed and analyzed using the Albania-LEAP model.
Energy Efficiency (EE): This scenario assumes that Albania meets its Energy
Community Treaty commitments by implementing the second National Energy Efficiency
Action Plan and enforceing the Law on Energy Efficiency (together with improvement of
the Law to transpose EED requirements) and the Law on Energy Performance in
Buildings. EE target for 2030 has been defined to be 15%.
Renewable Energy Sources (RES): Assumes that Albania meets its Energy Community
Treaty commitments of reaching a 38% renewable energy target in 2020 by
implementing the Albanian National Renewable Energy Action Plan. RES target for 2030
has been defined to be 42.5%.
Natural Gas Promotion: Assumes maximum possible penetration of natural gas in line
with the Gas Master Plan. Natural gas penetration rate of penetration target for 2030 has
been defined to be 8-10% (National Natural Gas Master Plan). Natural gas in Albania will
be mostly for guaranteeing the security of electricity supply since Albanian power sector
is 100% based on the hydro resources and in electricity import.
Combined: Combines the EE, RES and Natural Gas Promotion scenarios. Under this
scenario all above mentioned targets have been aggregated and guaranteeing so proper
development scenario for development of energy sector until 2030.
The Energy sector NDC scenario is based on Combined – Strategy scenario calibrated with real
figures for the period 2015-2019. The NDC scenario takes into account the introduction of natural
Albania Revised NDC
17
gas in almost all sectors (including energy industry, manufacturing industry, transport,
commercial, residential and agriculture). It also considers the implementation of the different
National Energy Efficiencies Actions Plans (NEEAP) to increase energy efficiencies in both
supply and demand reaching a 15% gain in 2030. It also takes into account the National
Renewable Energy Action Plan (NREAP) with objectives of a share of 38% of renewables in the
final energy consumption in 2020 (already almost reached in 2019) and 42% in 2030.
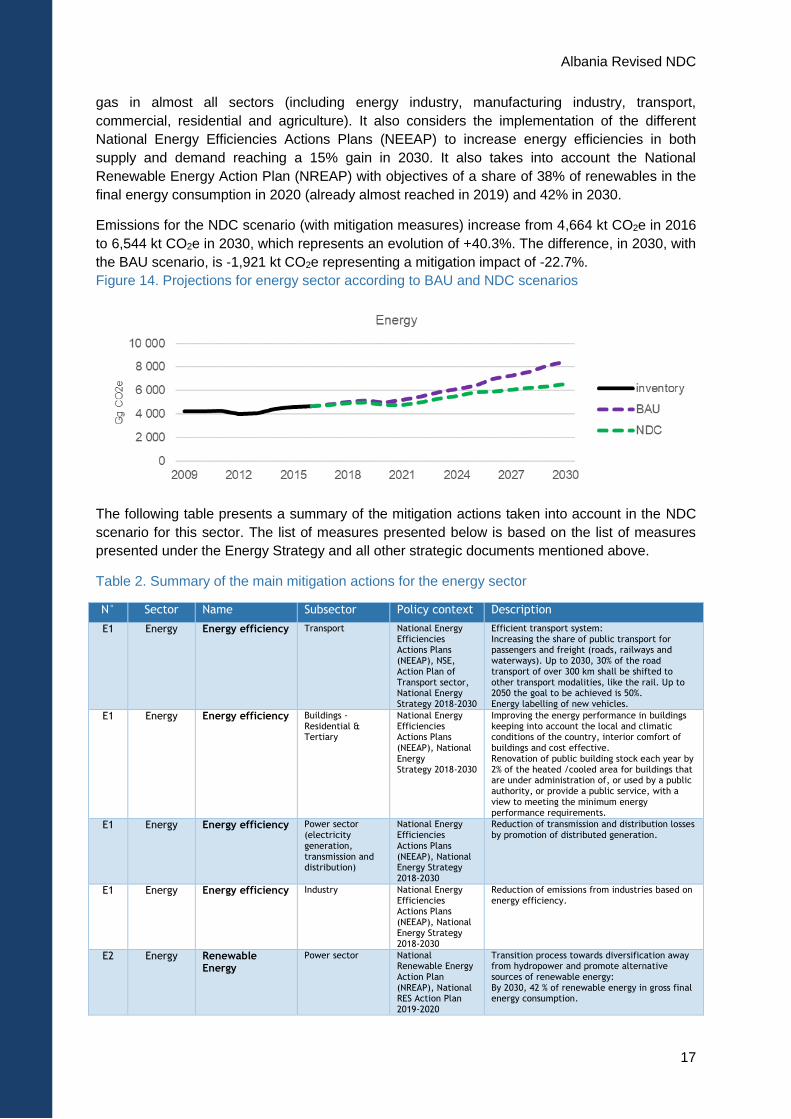
Emissions for the NDC scenario (with mitigation measures) increase from 4,664 kt CO2e in 2016
to 6,544 kt CO2e in 2030, which represents an evolution of +40.3%. The difference, in 2030, with
the BAU scenario, is -1,921 kt CO2e representing a mitigation impact of -22.7%.
Figure 14. Projections for energy sector according to BAU and NDC scenarios
The following table presents a summary of the mitigation actions taken into account in the NDC
scenario for this sector. The list of measures presented below is based on the list of measures
presented under the Energy Strategy and all other strategic documents mentioned above.
Table 2. Summary of the main mitigation actions for the energy sector
N° Sector Name Subsector Policy context Description
E1 Energy Energy efficiency Transport National Energy Efficiencies Actions Plans (NEEAP), NSE, Action Plan of Transport sector, National Energy Strategy 2018-2030
Efficient transport system: Increasing the share of public transport for passengers and freight (roads, railways and waterways). Up to 2030, 30% of the road transport of over 300 km shall be shifted to other transport modalities, like the rail. Up to 2050 the goal to be achieved is 50%. Energy labelling of new vehicles.
E1 Energy Energy efficiency Buildings - Residential & Tertiary
National Energy Efficiencies Actions Plans (NEEAP), National Energy Strategy 2018-2030
Improving the energy performance in buildings keeping into account the local and climatic conditions of the country, interior comfort of buildings and cost effective. Renovation of public building stock each year by 2% of the heated /cooled area for buildings that are under administration of, or used by a public authority, or provide a public service, with a view to meeting the minimum energy performance requirements.
E1 Energy Energy efficiency Power sector (electricity generation, transmission and distribution)
National Energy Efficiencies Actions Plans (NEEAP), National Energy Strategy 2018-2030
Reduction of transmission and distribution losses by promotion of distributed generation.
E1 Energy Energy efficiency Industry National Energy Efficiencies Actions Plans (NEEAP), National Energy Strategy 2018-2030
Reduction of emissions from industries based on energy efficiency.
E2 Energy Renewable Energy
Power sector National Renewable Energy Action Plan (NREAP), National RES Action Plan 2019-2020
Transition process towards diversification away from hydropower and promote alternative sources of renewable energy: By 2030, 42 % of renewable energy in gross final energy consumption.
Albania Revised NDC
18
E2 Energy Renewable Energy
Transport National Energy Strategy 2018-2030
Renewable energy sources in transport: Goal for the share of the biofuels vs. total fuel consumption in transport sector 10% in 2020, 10% in 2025 and 10% in 2030 as compared to 3.55% in 2015. The share of electrical vehicles (EV) is increasing in the passenger cars fleet (up to 10% of passenger.km in 2030). Bicycle as Passenger travel mode is increasing (up to 5% of passenger.km in 2030).
E3 Energy Penetration of natural gas
Power supply Gas master plan 2018
Increasing the penetration of natural gas Development of the gas market and services in Albania based on natural gas supplied through the Trans Adriatic Pipeline (TAP Project), as well as potential gas sources discovered and concretized in the country, or even through natural gas pipelines such as the Ionian Adriatic Pipeline (IAP Project) and the Albania - Kosovo Pipeline (ALKOGAP Project). Albania intends to develop an underground natural gas storage site in Dumre, near Elbasan (UGS Dumrea Project). The construction of the pipeline that will link the TAP project near the Fier Compressor Station area to the Vlora TPP and the entire Vlora region, will make it possible to restore the Vlora TPP by using natural gas as fuel.
2.2.4. IPPU
2.2.4.1. Overview of the IPPU sector
Almost 90% of GHG emissions from industrial processes depends on the cement production.
Emissions from energy consumption in the manufacturing industry are considered under the
Energy sector presented above.
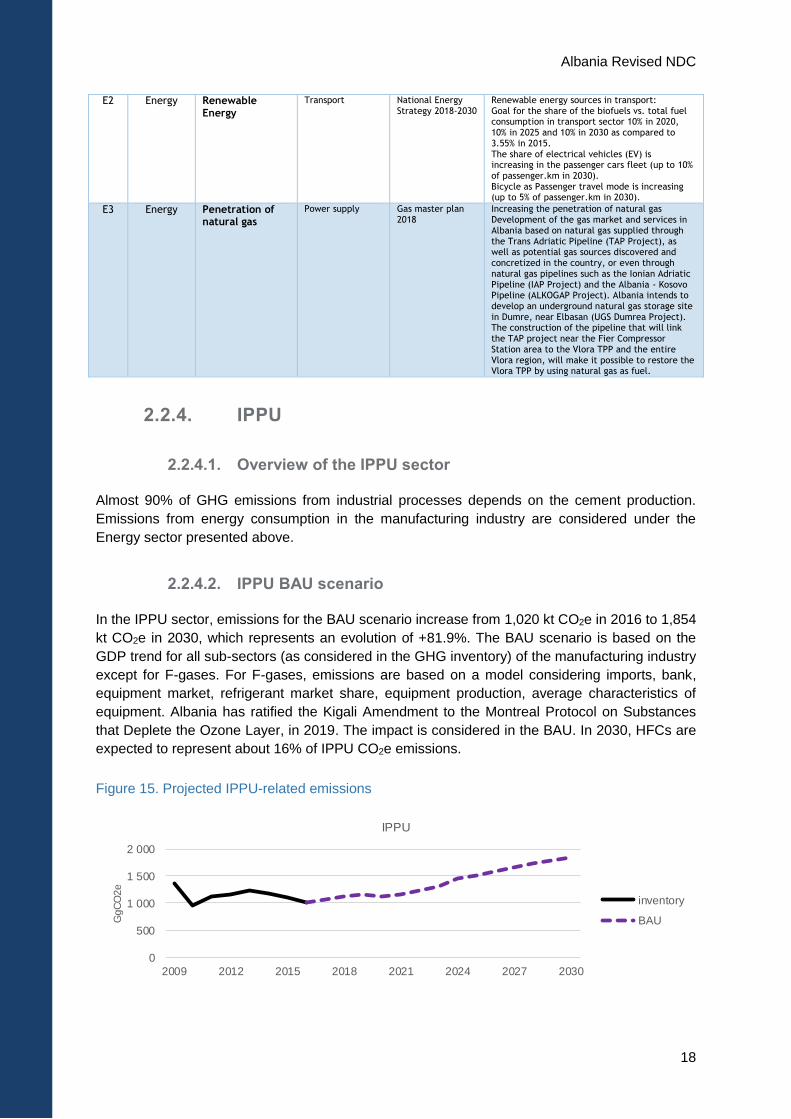
2.2.4.2. IPPU BAU scenario
In the IPPU sector, emissions for the BAU scenario increase from 1,020 kt CO2e in 2016 to 1,854
kt CO2e in 2030, which represents an evolution of +81.9%. The BAU scenario is based on the
GDP trend for all sub-sectors (as considered in the GHG inventory) of the manufacturing industry
except for F-gases. For F-gases, emissions are based on a model considering imports, bank,
equipment market, refrigerant market share, equipment production, average characteristics of
equipment. Albania has ratified the Kigali Amendment to the Montreal Protocol on Substances
that Deplete the Ozone Layer, in 2019. The impact is considered in the BAU. In 2030, HFCs are
expected to represent about 16% of IPPU CO2e emissions.
Figure 15. Projected IPPU-related emissions
0
500
1 000
1 500
2 000
2009 2012 2015 2018 2021 2024 2027 2030
GgC
O2e
IPPU
inventory
BAU
Albania Revised NDC
19
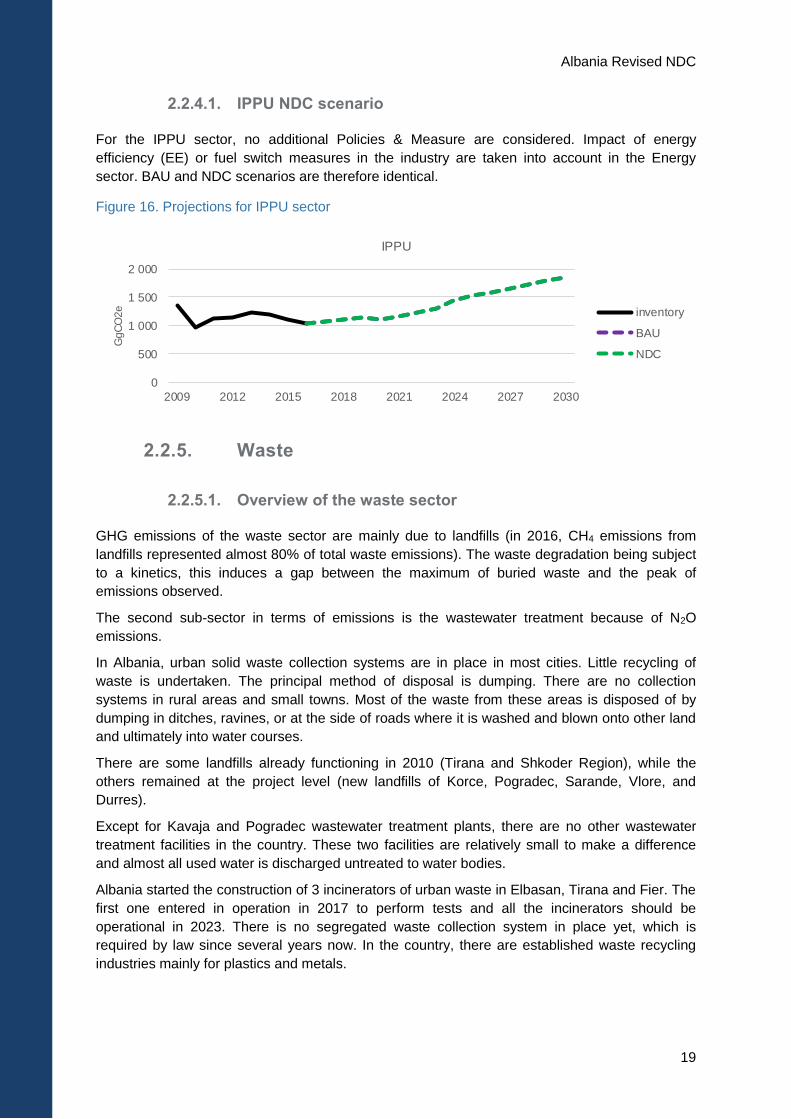
2.2.4.1. IPPU NDC scenario
For the IPPU sector, no additional Policies & Measure are considered. Impact of energy
efficiency (EE) or fuel switch measures in the industry are taken into account in the Energy
sector. BAU and NDC scenarios are therefore identical.
Figure 16. Projections for IPPU sector
2.2.5. Waste
2.2.5.1. Overview of the waste sector
GHG emissions of the waste sector are mainly due to landfills (in 2016, CH4 emissions from
landfills represented almost 80% of total waste emissions). The waste degradation being subject
to a kinetics, this induces a gap between the maximum of buried waste and the peak of
emissions observed.
The second sub-sector in terms of emissions is the wastewater treatment because of N2O
emissions.
In Albania, urban solid waste collection systems are in place in most cities. Little recycling of
waste is undertaken. The principal method of disposal is dumping. There are no collection
systems in rural areas and small towns. Most of the waste from these areas is disposed of by
dumping in ditches, ravines, or at the side of roads where it is washed and blown onto other land
and ultimately into water courses.
There are some landfills already functioning in 2010 (Tirana and Shkoder Region), while the
others remained at the project level (new landfills of Korce, Pogradec, Sarande, Vlore, and
Durres).
Except for Kavaja and Pogradec wastewater treatment plants, there are no other wastewater
treatment facilities in the country. These two facilities are relatively small to make a difference
and almost all used water is discharged untreated to water bodies.
Albania started the construction of 3 incinerators of urban waste in Elbasan, Tirana and Fier. The
first one entered in operation in 2017 to perform tests and all the incinerators should be
operational in 2023. There is no segregated waste collection system in place yet, which is
required by law since several years now. In the country, there are established waste recycling
industries mainly for plastics and metals.
0
500
1 000
1 500
2 000
2009 2012 2015 2018 2021 2024 2027 2030
GgC
O2e
IPPU
inventory
BAU
NDC
Albania Revised NDC
20
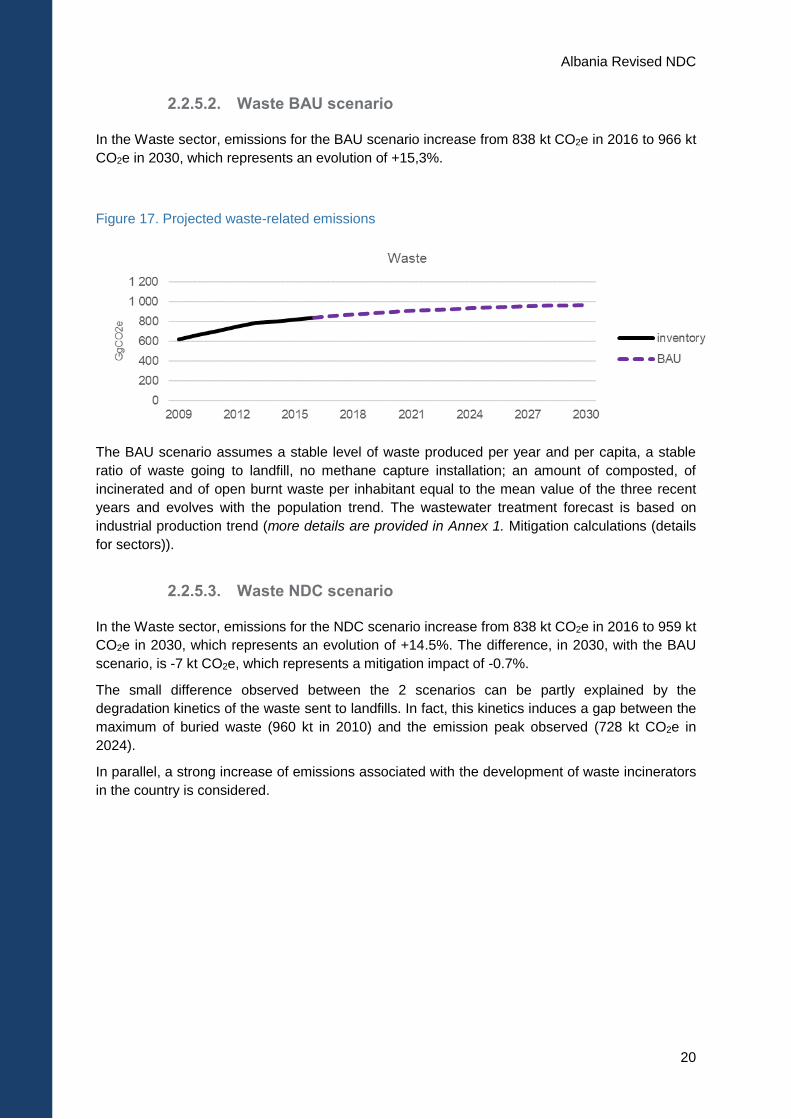
2.2.5.2. Waste BAU scenario
In the Waste sector, emissions for the BAU scenario increase from 838 kt CO2e in 2016 to 966 kt
CO2e in 2030, which represents an evolution of +15,3%.
Figure 17. Projected waste-related emissions
The BAU scenario assumes a stable level of waste produced per year and per capita, a stable
ratio of waste going to landfill, no methane capture installation; an amount of composted, of
incinerated and of open burnt waste per inhabitant equal to the mean value of the three recent
years and evolves with the population trend. The wastewater treatment forecast is based on
industrial production trend (more details are provided in Annex 1. Mitigation calculations (details
for sectors)).
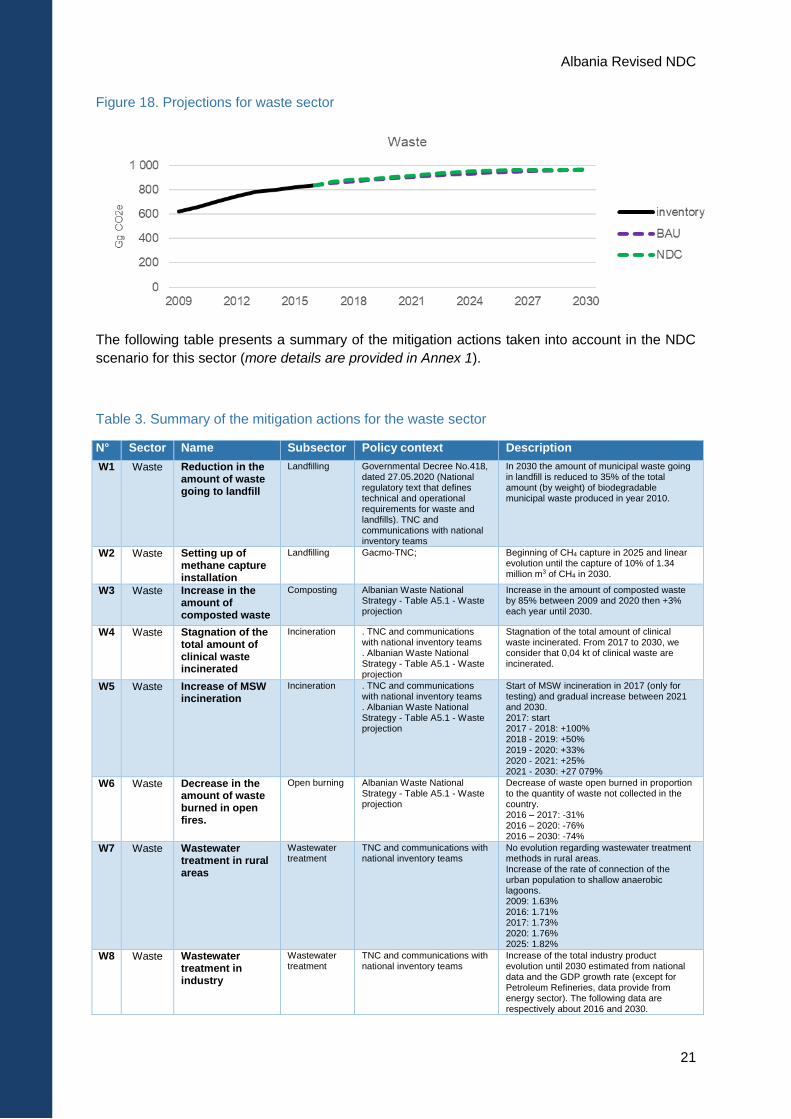
2.2.5.3. Waste NDC scenario
In the Waste sector, emissions for the NDC scenario increase from 838 kt CO2e in 2016 to 959 kt
CO2e in 2030, which represents an evolution of +14.5%. The difference, in 2030, with the BAU
scenario, is -7 kt CO2e, which represents a mitigation impact of -0.7%.
The small difference observed between the 2 scenarios can be partly explained by the
degradation kinetics of the waste sent to landfills. In fact, this kinetics induces a gap between the
maximum of buried waste (960 kt in 2010) and the emission peak observed (728 kt CO2e in
2024).
In parallel, a strong increase of emissions associated with the development of waste incinerators
in the country is considered.
Albania Revised NDC
21
Figure 18. Projections for waste sector
The following table presents a summary of the mitigation actions taken into account in the NDC
scenario for this sector (more details are provided in Annex 1).
Table 3. Summary of the mitigation actions for the waste sector
N° Sector Name Subsector Policy context Description
W1 Waste Reduction in the amount of waste going to landfill
Landfilling Governmental Decree No.418, dated 27.05.2020 (National regulatory text that defines technical and operational requirements for waste and landfills). TNC and communications with national inventory teams
In 2030 the amount of municipal waste going in landfill is reduced to 35% of the total amount (by weight) of biodegradable municipal waste produced in year 2010.
W2 Waste Setting up of methane capture installation
Landfilling Gacmo-TNC; Beginning of CH4 capture in 2025 and linear evolution until the capture of 10% of 1.34 million m3 of CH4 in 2030.
W3 Waste Increase in the amount of composted waste
Composting Albanian Waste National Strategy - Table A5.1 - Waste projection
Increase in the amount of composted waste by 85% between 2009 and 2020 then +3% each year until 2030.
W4 Waste Stagnation of the total amount of clinical waste incinerated
Incineration . TNC and communications with national inventory teams . Albanian Waste National Strategy - Table A5.1 - Waste projection
Stagnation of the total amount of clinical waste incinerated. From 2017 to 2030, we consider that 0,04 kt of clinical waste are incinerated.
W5 Waste Increase of MSW incineration
Incineration . TNC and communications with national inventory teams . Albanian Waste National Strategy - Table A5.1 - Waste projection
Start of MSW incineration in 2017 (only for testing) and gradual increase between 2021 and 2030. 2017: start 2017 - 2018: +100% 2018 - 2019: +50% 2019 - 2020: +33% 2020 - 2021: +25% 2021 - 2030: +27 079%
W6 Waste Decrease in the amount of waste burned in open fires.
Open burning Albanian Waste National Strategy - Table A5.1 - Waste projection
Decrease of waste open burned in proportion to the quantity of waste not collected in the country. 2016 – 2017: -31% 2016 – 2020: -76% 2016 – 2030: -74%
W7 Waste Wastewater treatment in rural areas
Wastewater treatment
TNC and communications with national inventory teams
No evolution regarding wastewater treatment methods in rural areas. Increase of the rate of connection of the urban population to shallow anaerobic lagoons. 2009: 1.63% 2016: 1.71% 2017: 1.73% 2020: 1.76% 2025: 1.82%
W8 Waste Wastewater treatment in industry
Wastewater treatment
TNC and communications with national inventory teams
Increase of the total industry product evolution until 2030 estimated from national data and the GDP growth rate (except for Petroleum Refineries, data provide from energy sector). The following data are respectively about 2016 and 2030.
Albania Revised NDC
22
Beer & Malt (t/yrs): 862 026 - 1 366 209 Dairy Products (t/yrs): 108 988 - 172 734 Meat & Poultry (t/yrs): 159 819 - 253 295 Pulp & Paper (t/yrs): 2 327 - 3 688 Wine & Vinegar (t/yrs): 22 420 - 35 533
W9 Waste Increase of protein consumption
Wastewater treatment
Food and Agriculture Organization of the United Nations (FAO) - Statistics Division (ESS)
Increase of the annual per capita protein consumption estimated from FAOSTAT data. 2016: 35,04 kg/person/yr 2017: 43,11 kg/person/yr 2018: 42,22 kg/person/yr 2019-2030: 40,12 kg/person/yr
2.2.6. Agriculture
2.2.6.1. Overview of the Agriculture sector
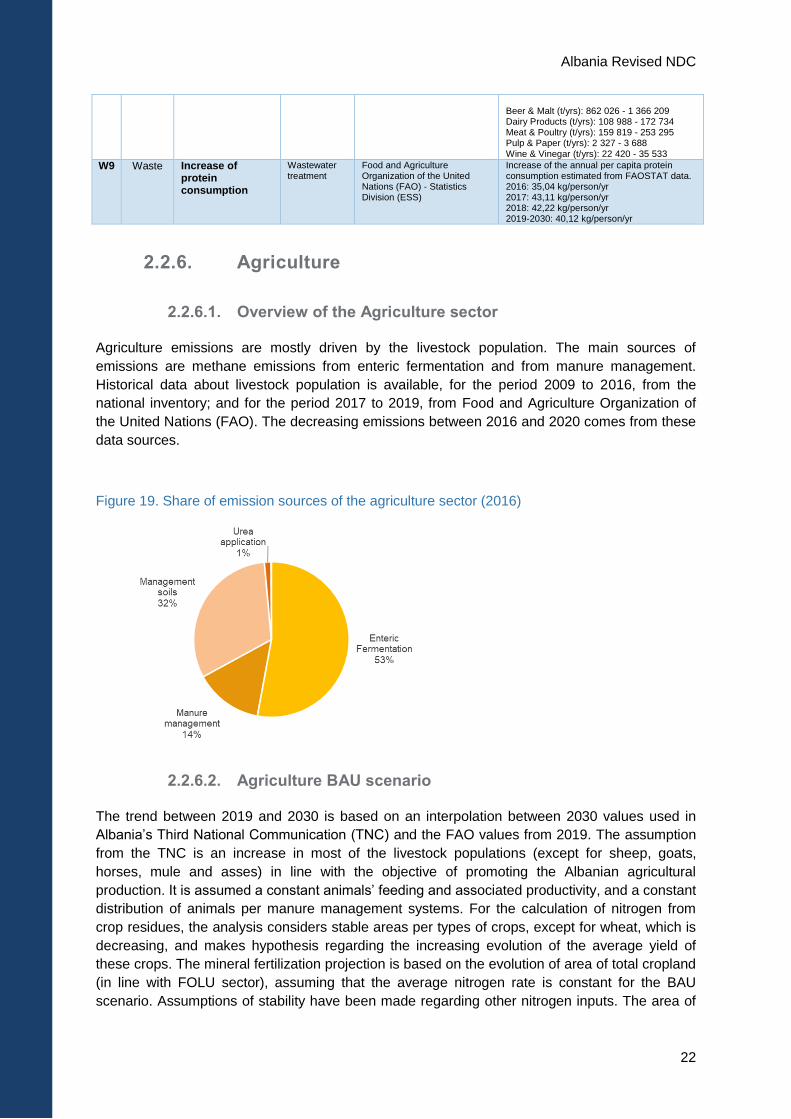
Agriculture emissions are mostly driven by the livestock population. The main sources of
emissions are methane emissions from enteric fermentation and from manure management.
Historical data about livestock population is available, for the period 2009 to 2016, from the
national inventory; and for the period 2017 to 2019, from Food and Agriculture Organization of
the United Nations (FAO). The decreasing emissions between 2016 and 2020 comes from these
data sources.
Figure 19. Share of emission sources of the agriculture sector (2016)
2.2.6.2. Agriculture BAU scenario
The trend between 2019 and 2030 is based on an interpolation between 2030 values used in
Albania’s Third National Communication (TNC) and the FAO values from 2019. The assumption
from the TNC is an increase in most of the livestock populations (except for sheep, goats,
horses, mule and asses) in line with the objective of promoting the Albanian agricultural
production. It is assumed a constant animals’ feeding and associated productivity, and a constant
distribution of animals per manure management systems. For the calculation of nitrogen from
crop residues, the analysis considers stable areas per types of crops, except for wheat, which is
decreasing, and makes hypothesis regarding the increasing evolution of the average yield of
these crops. The mineral fertilization projection is based on the evolution of area of total cropland
(in line with FOLU sector), assuming that the average nitrogen rate is constant for the BAU
scenario. Assumptions of stability have been made regarding other nitrogen inputs. The area of
Albania Revised NDC
23
histosols is assumed stable. For crop residues burning, data from the European Forest Fire
Information System (EFFIS) are taken into account for the period 2009-2018. Average rate of
burning for wheat during this know period (2009-2018) equals 1.3% and is maintained for the
whole period (2019-2030). For pasture burning, the average area burnt for 2009-2018 (5,154 ha)
has been used for projected years (more details are provided in Annex 1. Mitigation calculations
(details for sectors)).
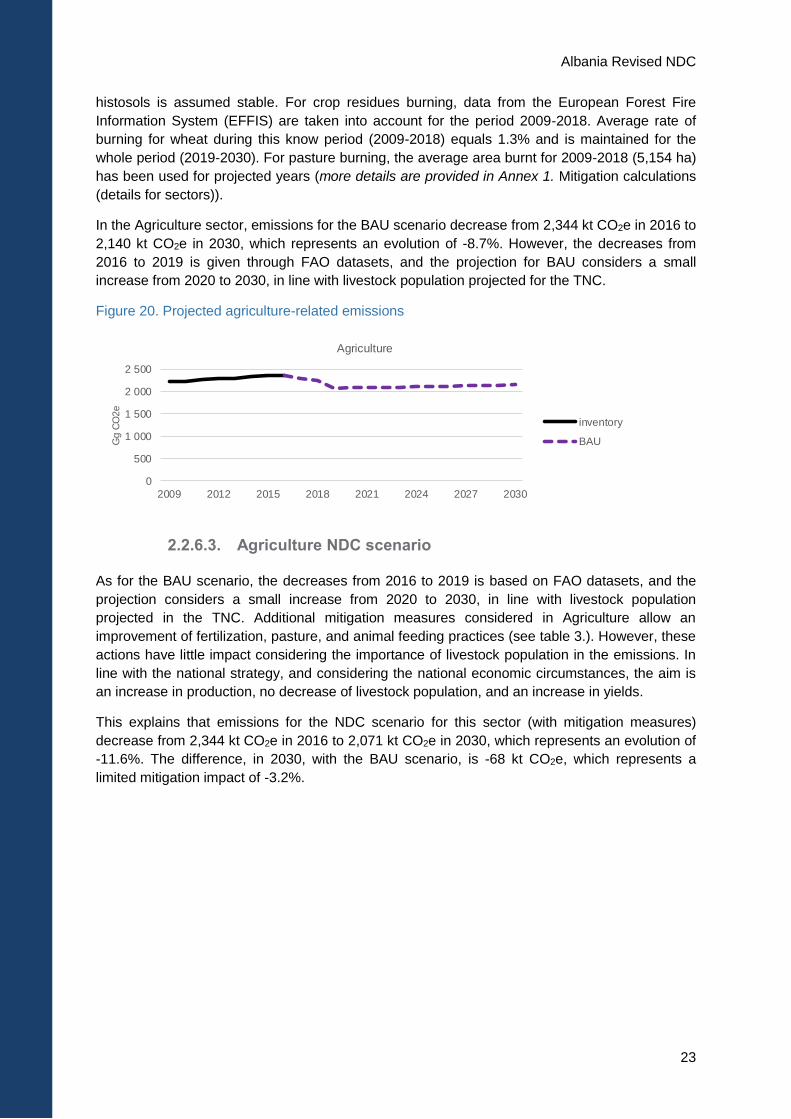
In the Agriculture sector, emissions for the BAU scenario decrease from 2,344 kt CO2e in 2016 to
2,140 kt CO2e in 2030, which represents an evolution of -8.7%. However, the decreases from
2016 to 2019 is given through FAO datasets, and the projection for BAU considers a small
increase from 2020 to 2030, in line with livestock population projected for the TNC.
Figure 20. Projected agriculture-related emissions
2.2.6.3. Agriculture NDC scenario
As for the BAU scenario, the decreases from 2016 to 2019 is based on FAO datasets, and the
projection considers a small increase from 2020 to 2030, in line with livestock population
projected in the TNC. Additional mitigation measures considered in Agriculture allow an
improvement of fertilization, pasture, and animal feeding practices (see table 3.). However, these
actions have little impact considering the importance of livestock population in the emissions. In
line with the national strategy, and considering the national economic circumstances, the aim is
an increase in production, no decrease of livestock population, and an increase in yields.
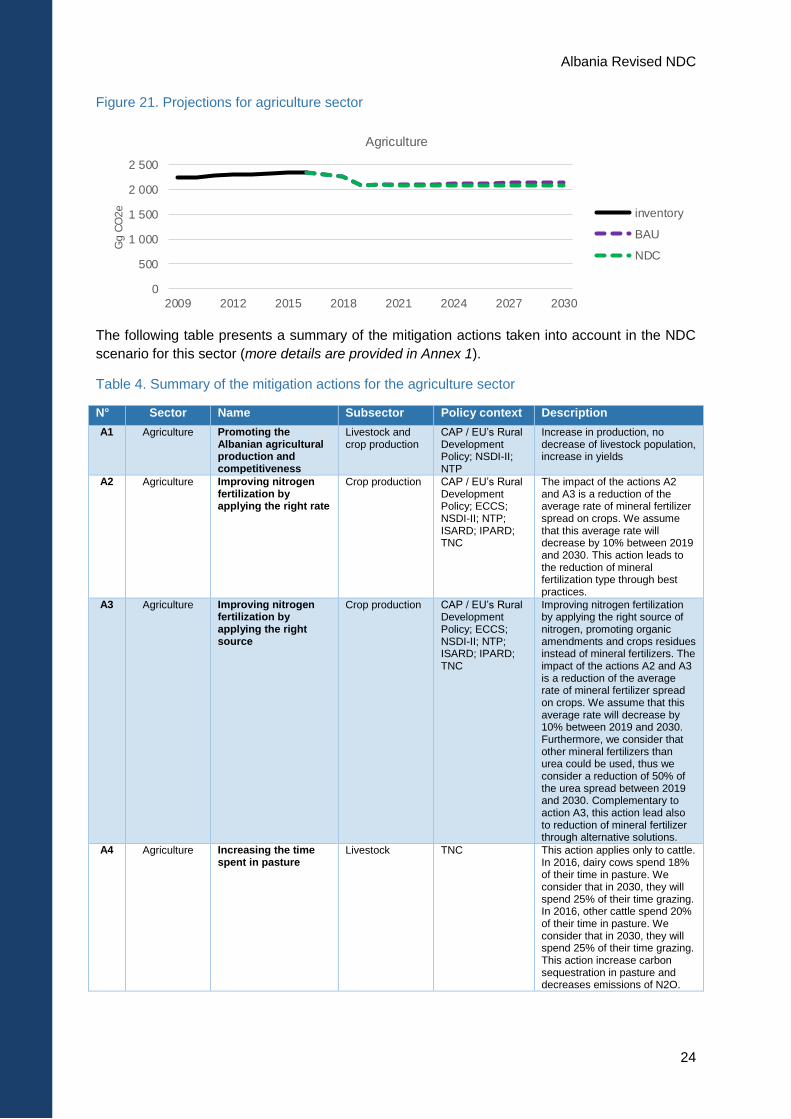
This explains that emissions for the NDC scenario for this sector (with mitigation measures)
decrease from 2,344 kt CO2e in 2016 to 2,071 kt CO2e in 2030, which represents an evolution of
-11.6%. The difference, in 2030, with the BAU scenario, is -68 kt CO2e, which represents a
limited mitigation impact of -3.2%.
0
500
1 000
1 500
2 000
2 500
2009 2012 2015 2018 2021 2024 2027 2030
Gg C
O2e
Agriculture
inventory
BAU
Albania Revised NDC
24
Figure 21. Projections for agriculture sector
The following table presents a summary of the mitigation actions taken into account in the NDC
scenario for this sector (more details are provided in Annex 1).
Table 4. Summary of the mitigation actions for the agriculture sector
N° Sector Name Subsector Policy context Description
A1 Agriculture Promoting the Albanian agricultural production and competitiveness
Livestock and crop production
CAP / EU’s Rural Development Policy; NSDI-II; NTP
Increase in production, no decrease of livestock population, increase in yields
A2 Agriculture Improving nitrogen fertilization by applying the right rate
Crop production CAP / EU’s Rural Development Policy; ECCS; NSDI-II; NTP; ISARD; IPARD; TNC
The impact of the actions A2 and A3 is a reduction of the average rate of mineral fertilizer spread on crops. We assume that this average rate will decrease by 10% between 2019 and 2030. This action leads to the reduction of mineral fertilization type through best practices.
A3 Agriculture Improving nitrogen fertilization by applying the right source
Crop production CAP / EU’s Rural Development Policy; ECCS; NSDI-II; NTP; ISARD; IPARD; TNC
Improving nitrogen fertilization by applying the right source of nitrogen, promoting organic amendments and crops residues instead of mineral fertilizers. The impact of the actions A2 and A3 is a reduction of the average rate of mineral fertilizer spread on crops. We assume that this average rate will decrease by 10% between 2019 and 2030. Furthermore, we consider that other mineral fertilizers than urea could be used, thus we consider a reduction of 50% of the urea spread between 2019 and 2030. Complementary to action A3, this action lead also to reduction of mineral fertilizer through alternative solutions.
A4 Agriculture Increasing the time spent in pasture
Livestock TNC This action applies only to cattle. In 2016, dairy cows spend 18% of their time in pasture. We consider that in 2030, they will spend 25% of their time grazing. In 2016, other cattle spend 20% of their time in pasture. We consider that in 2030, they will spend 25% of their time grazing. This action increase carbon sequestration in pasture and decreases emissions of N2O.
0
500
1 000
1 500
2 000
2 500
2009 2012 2015 2018 2021 2024 2027 2030
Gg C
O2e
Agriculture
inventory
BAU
NDC
Albania Revised NDC
25
A5 Agriculture Optimizing animal feeding in order to reduce N2O and CH4 emissions
Livestock NSDI-II; ISARD; IPARD
Improved feeding techniques for animal in housing (where feeding can be controlled). This action applies only to cattle livestock in housing in 2030, at different application rates. The improved feeding techniques lead to: - A decrease in nitrogen excretion rate (N inputs from feeding fitting better to animal needs). We assume a 10% reduction for improved feeding. - A decrease in enteric CH4 (add of fat in feeding): according to the GACMO tool, this can lead to a reduction of 4% of CH4 emissions for 1% of fat added.
2.2.7. FOLU
2.2.7.1. Overview of the FOLU sector
In the FOLU sector, emissions (mainly carbon losses from the harvest of fuelwood, wood, and
forest fires) are bigger than absorptions (the growth of forest biomass). Therefore, this sector
does not represent a net sink. During the historical period, fuelwood harvested quantities did not
vary much (around 1 million m3/y), and forest growth remained stable. On the other hand, there
is a large magnitude of variation for forest fires, with one peak in 2011-2012 and another in
20179. While the main driver of the sector and for the projections remains the forest, agricultural
land also presents mitigation potential that has been taken into account.
2.2.7.2. FOLU BAU scenario
The BAU scenario for FOLU sector considers the continuation of the situation and trends of the
recent decade covered by the inventory, in particular in terms of trends for land-use change
areas, wood and fuelwood harvests (stable, as in the 2009-2016 period). For wildfires, EFFIS
data is used for 2017-2018, and it explains the second peak in 2017. Forest fires episodes, which
happen at irregular times, cannot be projected: only a background level was projected, based on
the whole period without considering exceptional episodes. it is assumed an increasing
probability of fires for this background level, with a linear increase (more details are provided in
Annex 1. Mitigation calculations (details for sectors)).
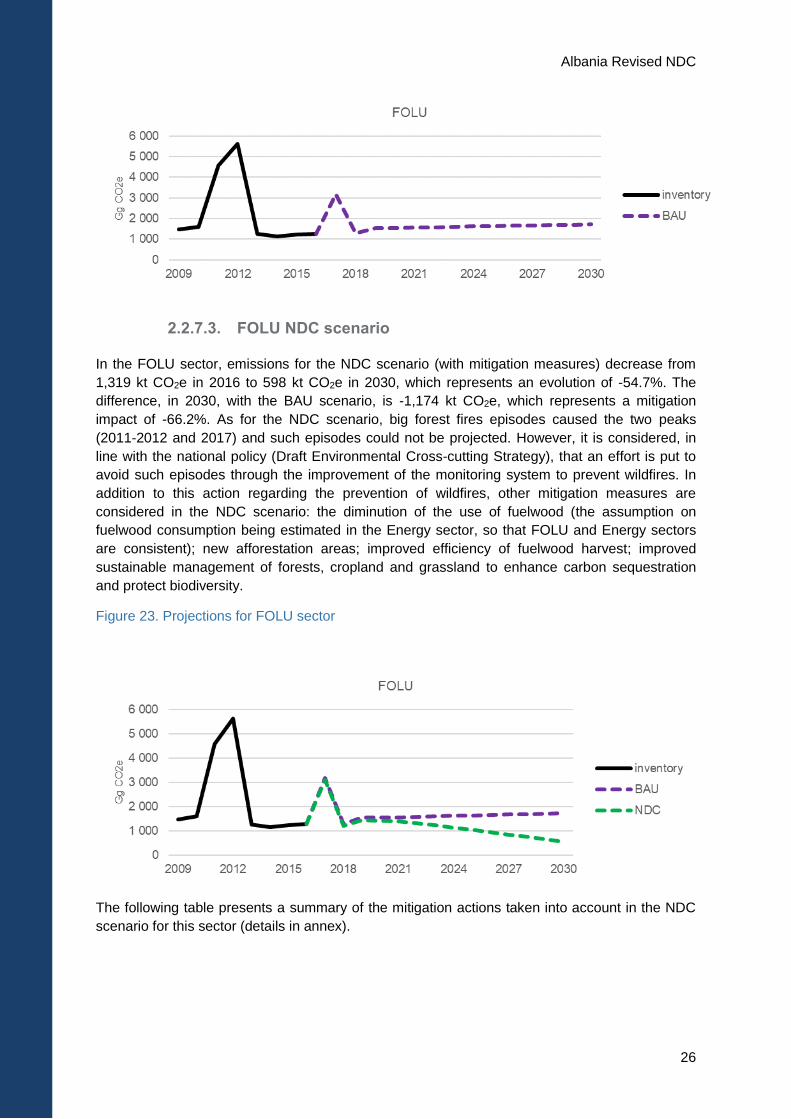
In the FOLU sector, emissions for the BAU scenario increase from 1,319 kt CO2e in 2016 to
1,772 kt CO2e in 2030, which represents an evolution of +34.3%.
Figure 22. Projected FOLU-related emissions
9 datasets were available outside of the historical period for some subsectors, such as the wildfires for the years 2017-2019. Therefore, in this case, inventory calculations continue after 2016, to 2019, and then projections assumptions start. That is why there are peaks in the period 2017-2019.
Albania Revised NDC
26
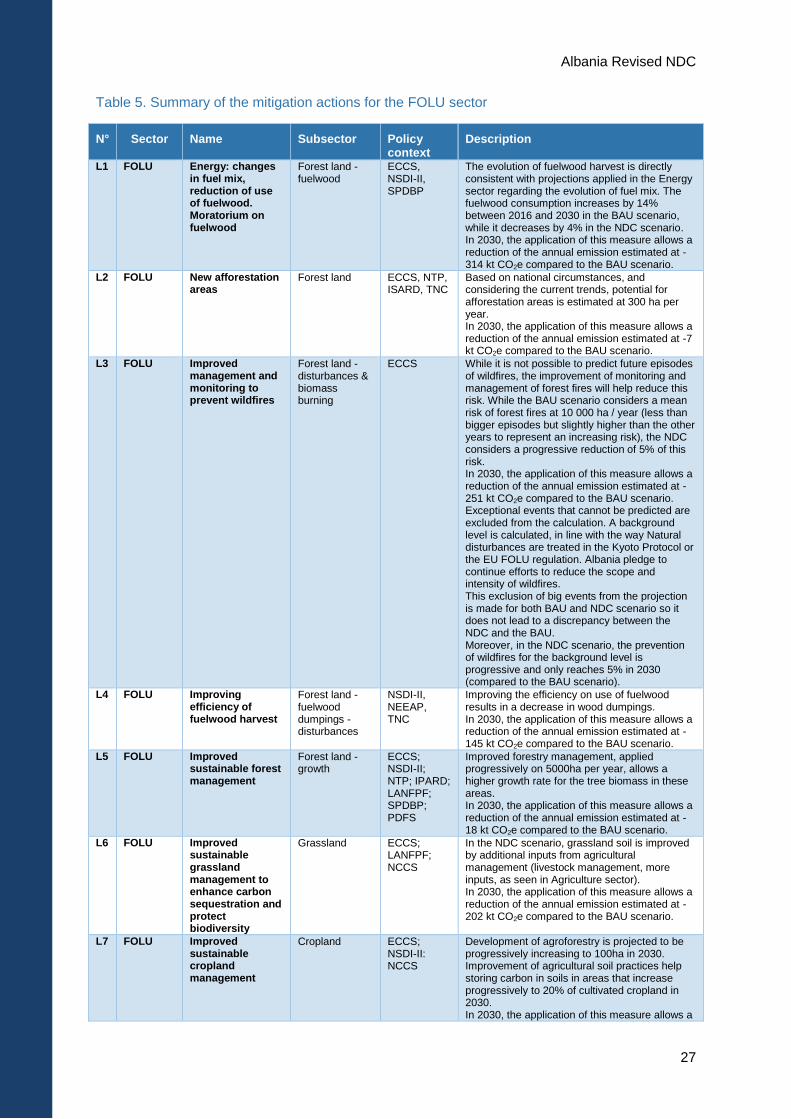
2.2.7.3. FOLU NDC scenario
In the FOLU sector, emissions for the NDC scenario (with mitigation measures) decrease from
1,319 kt CO2e in 2016 to 598 kt CO2e in 2030, which represents an evolution of -54.7%. The
difference, in 2030, with the BAU scenario, is -1,174 kt CO2e, which represents a mitigation
impact of -66.2%. As for the NDC scenario, big forest fires episodes caused the two peaks
(2011-2012 and 2017) and such episodes could not be projected. However, it is considered, in
line with the national policy (Draft Environmental Cross-cutting Strategy), that an effort is put to
avoid such episodes through the improvement of the monitoring system to prevent wildfires. In
addition to this action regarding the prevention of wildfires, other mitigation measures are
considered in the NDC scenario: the diminution of the use of fuelwood (the assumption on
fuelwood consumption being estimated in the Energy sector, so that FOLU and Energy sectors
are consistent); new afforestation areas; improved efficiency of fuelwood harvest; improved
sustainable management of forests, cropland and grassland to enhance carbon sequestration
and protect biodiversity.
Figure 23. Projections for FOLU sector
The following table presents a summary of the mitigation actions taken into account in the NDC
scenario for this sector (details in annex).
Albania Revised NDC
27
Table 5. Summary of the mitigation actions for the FOLU sector
N° Sector Name Subsector Policy context
Description
L1 FOLU Energy: changes in fuel mix, reduction of use of fuelwood. Moratorium on fuelwood
Forest land - fuelwood
ECCS, NSDI-II, SPDBP
The evolution of fuelwood harvest is directly consistent with projections applied in the Energy sector regarding the evolution of fuel mix. The fuelwood consumption increases by 14% between 2016 and 2030 in the BAU scenario, while it decreases by 4% in the NDC scenario. In 2030, the application of this measure allows a reduction of the annual emission estimated at -314 kt CO2e compared to the BAU scenario.
L2 FOLU New afforestation areas
Forest land ECCS, NTP, ISARD, TNC
Based on national circumstances, and considering the current trends, potential for afforestation areas is estimated at 300 ha per year. In 2030, the application of this measure allows a reduction of the annual emission estimated at -7 kt CO2e compared to the BAU scenario.
L3 FOLU Improved management and monitoring to prevent wildfires
Forest land - disturbances & biomass burning
ECCS While it is not possible to predict future episodes of wildfires, the improvement of monitoring and management of forest fires will help reduce this risk. While the BAU scenario considers a mean risk of forest fires at 10 000 ha / year (less than bigger episodes but slightly higher than the other years to represent an increasing risk), the NDC considers a progressive reduction of 5% of this risk. In 2030, the application of this measure allows a reduction of the annual emission estimated at -251 kt CO2e compared to the BAU scenario. Exceptional events that cannot be predicted are excluded from the calculation. A background level is calculated, in line with the way Natural disturbances are treated in the Kyoto Protocol or the EU FOLU regulation. Albania pledge to continue efforts to reduce the scope and intensity of wildfires. This exclusion of big events from the projection is made for both BAU and NDC scenario so it does not lead to a discrepancy between the NDC and the BAU. Moreover, in the NDC scenario, the prevention of wildfires for the background level is progressive and only reaches 5% in 2030 (compared to the BAU scenario).
L4 FOLU Improving efficiency of fuelwood harvest
Forest land - fuelwood dumpings - disturbances
NSDI-II, NEEAP, TNC
Improving the efficiency on use of fuelwood results in a decrease in wood dumpings. In 2030, the application of this measure allows a reduction of the annual emission estimated at -145 kt CO2e compared to the BAU scenario.
L5 FOLU Improved sustainable forest management
Forest land - growth
ECCS; NSDI-II; NTP; IPARD; LANFPF; SPDBP; PDFS
Improved forestry management, applied progressively on 5000ha per year, allows a higher growth rate for the tree biomass in these areas. In 2030, the application of this measure allows a reduction of the annual emission estimated at -18 kt CO2e compared to the BAU scenario.
L6 FOLU Improved sustainable grassland management to enhance carbon sequestration and protect biodiversity
Grassland ECCS; LANFPF; NCCS
In the NDC scenario, grassland soil is improved by additional inputs from agricultural management (livestock management, more inputs, as seen in Agriculture sector). In 2030, the application of this measure allows a reduction of the annual emission estimated at -202 kt CO2e compared to the BAU scenario.
L7 FOLU Improved sustainable cropland management
Cropland ECCS; NSDI-II: NCCS
Development of agroforestry is projected to be progressively increasing to 100ha in 2030. Improvement of agricultural soil practices help storing carbon in soils in areas that increase progressively to 20% of cultivated cropland in 2030. In 2030, the application of this measure allows a
Albania Revised NDC
28
reduction of the annual emission estimated at -167 kt CO2e compared to the BAU scenario.
3. ADAPTATION
The projected changes in temperature, rainfall and sea-level (see section 4.2 below) will affect
every Albanian region and every socio-economic sector in a specific way, depending on its own
characteristics. On adaptation, this document focuses on the Albanian coastal area and the
capital Tirana, which comprises a significant proportion of the population, as well as key
infrastructure and is the main touristic destination in the country. Indeed, while within the
Albanian coast climate change will affect every socio-economic sector, on adaptation this
document focuses on settlements, populations and tourism. More specifically, on settlements the
document considers the infrastructure and the built environment, water and energy; on
populations, it considers lives and livelihoods and health; and on tourism, it considers changes in
the touristic season and the touristic conditions. In addition, the Albanian agriculture, forestry and
other land use (AFOLU) sector is analysed in great detail.
Building on section 1 on national circumstances, this section on adaptation is structured in the
following way. Section 4.1 introduces the Albanian coast and agriculture. Section 4.2 presents
climate variability and change in Albania regarding temperature, precipitation and sea level rise.
Section 4.3 analyses climate risks, impacts and vulnerability for the four priority sectors, namely
settlements, populations, tourism and AFOLU. Finally, section 4.4 categorizes and prioritizes
climate change adaptation measures.
3.1. The Albanian coast and AFOLU sector -
background
3.1.1. The Albanian Coast
3.1.1.1. Overview
The main part of the coastal area (the Adriatic coast and the most southern part of the Ionian
coast –that belong to the Zone A in Map 1) is located in the Mediterranean field climatic Zone.
The other part of the Ionian coast, in Zone B in Map 2, belongs to the Mediterranean Southern
Mountainous climatic Subzone. Overall, the coast is warmer than the interior of the country. In
the coastal area, maximum temperatures average 21.8°C in the summer and 14.6°C in the
winter.10 The centre of the coast gets less rain than the North and the Southwest (with the
Southeast being the least rainy).
Albanian coasts are rich with sandy and rocky shores and include important ecosystems.
Although the number of protected areas in the coast has increased over the years (there are
10 World Bank Climate Change Knowledge Portal, accessed January 2020 and 4NC
Albania Revised NDC
29
currently eleven protected areas including a marine protected area), the coastal ecosystems are
still facing significant risks and pressures, including:
Deficiencies in waste management (waste from tourism facilities is reaching the coastal
waters, and plastic litter accounts for more than 90% of the total solid waste found on
beaches);
Unplanned tourism development and urbanization, and unmanaged urban population
increase;
Not integrated coastal zone management by local authorities; and
Climate change impacts, which are further described in section 4.3 below.
According to the Integrated cross-sectoral plan for the coastal belt, coastal rivers are significantly
polluted: water quality was poor or bad in 45% of the 22 water quality monitoring stations in the
coast.
3.1.1.2. Coastal settlements & demography
The coastal region occupies 36.7% of the surface area of the country and has 39.3% of the
population. The Integrated cross-sectoral plan for the coastal belt (ICSP) identifies the four
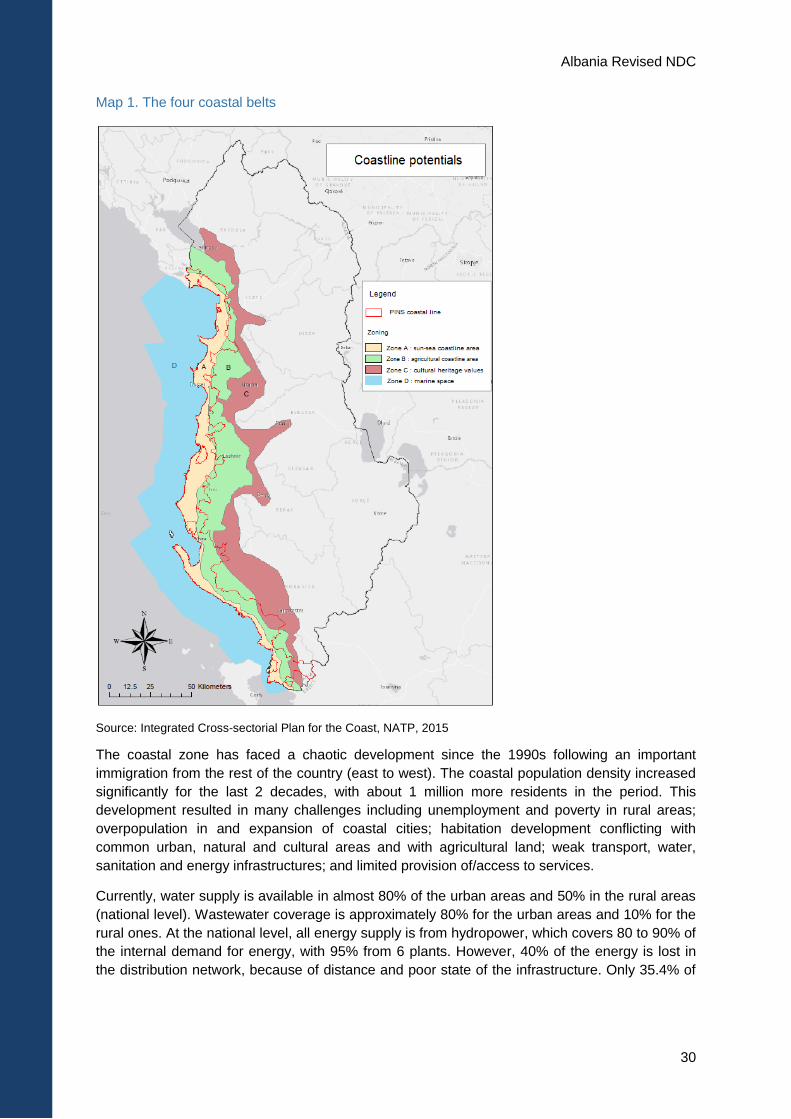
following coastal spatial belts, as shown in Error! Reference source not found. below:
The first belt, Zone A, is characterised by its urban development and tourism
infrastructure and is known as “sun-sea belt”. The cities composing this zone are Durres,
Vlora, Lezha, Saranda, Velipoja, Himara, Ksamili and Divjaka. Although technically not a
coastal city, Tirana is sometimes considered as such, given its proximity to the coastline
and the functional links with coastal city of Durres, which constitutes the main port of the
country. The Tirana – Durres region comprises 8.4% of the territory and accommodates
37% of the country’s population. In 2015, this region generated 48% of the national GDP
and represented the region with the highest income per capita, which is 1.32 times more
than the national average.
The second belt, Zone B, can be defined as the agricultural belt, includes vast field areas
and low hills, and is composed of cities of secondary importance regarding the coastline
(such as Shkodra, Fushe-Kruja, Tirana, Kavaja, Lushnja, Fieri and other smaller areas).
Agricultural land represents 24% of the coastal territory. Farmers traditionally produce
vegetables, potatoes, and fruits (olives, citrus, grape vines, etc). In some areas,
production is possible all year long.
The third belt, Zone C, includes cities and residences that are more in depth of the
territory, that have important cultural, heritage, folkloric, polyphonic, music, arts values.
Cities of this zone are Kruja, Elbasan, Berat, Tepelena, Permet and Gjirokastra; and
The fourth belt, Zone D, which is the maritime space. rich in flora and fauna, underwater
resources of the bottom of the sea, including beaches, ports and their terrestrial
territories, lagoons, estuaries, lakes, water, which communicate with the sea.
Albania Revised NDC
30
Map 1. The four coastal belts
Source: Integrated Cross-sectorial Plan for the Coast, NATP, 2015
The coastal zone has faced a chaotic development since the 1990s following an important
immigration from the rest of the country (east to west). The coastal population density increased
significantly for the last 2 decades, with about 1 million more residents in the period. This
development resulted in many challenges including unemployment and poverty in rural areas;
overpopulation in and expansion of coastal cities; habitation development conflicting with
common urban, natural and cultural areas and with agricultural land; weak transport, water,
sanitation and energy infrastructures; and limited provision of/access to services.
Currently, water supply is available in almost 80% of the urban areas and 50% in the rural areas
(national level). Wastewater coverage is approximately 80% for the urban areas and 10% for the
rural ones. At the national level, all energy supply is from hydropower, which covers 80 to 90% of
the internal demand for energy, with 95% from 6 plants. However, 40% of the energy is lost in
the distribution network, because of distance and poor state of the infrastructure. Only 35.4% of
Albania Revised NDC
31
the hydro potential is being used, and the potential for solar energy and others is not yet
exploited.11
3.1.1.3. Tourism
According to the National Tourism Strategy (2019), in 2017 tourism directly contributed to 8.5%
of the GDP (2017), and indirectly (multiplier effects) to 26.2%. It is growing and is projected to
reach 9.3% of GDP by 2028. It employed 7.7% of total labour force in 2017, and possibly 8.8%
by 202812. The different tourism locations along the coast are illustrated in Map 3 in Annex 2.
Adaptation
Tourism is however an underdeveloped sector in Albania in view of its potential, hindered by its
limited infrastructure and accommodation capacities, standards and quality of services, tourism
offer and products, and cooperation and coordination among the players who are or could be an
integral part of the industry.
Being dependent from summer tourism (starting from June-July, with a maximum number of
visitors achieved in August and with an immediate decline in September), the majority of hotels
and accommodations in the coastal areas are faced with seasonal functioning difficulties and as
such, the phenomena of seasonal migration of habitants of coastal areas, especially in the South
regions, is still evident.
Even though archaeology and cultural heritage is not the main drive to attract foreign or domestic
visitors, these are identified as priorities in developing the tourism sector in the country and the
coastal zone13.
3.1.2. AFOLU
Crops
Agriculture accounts for about one-fifth of the gross domestic product. 50% of rural population is
engaged in agriculture. The agriculture sector is dominated by small and family farms, with an
average farm size of about 1.2 ha. A high level of agricultural land fragmentation remains one of
the major challenges in the sector.
The climatic conditions of the country allow the cultivation of cereals, fruits, vegetables, and
fodder crops. About 35% of the arable land is cultivated for cereals, 8 % for vegetables, 50% for
fodder crops and 7 % for other types of plants. In the last ten years the area under wheat has
decreased by about 22% and the average yield stayed at the same level. The yields of maize,
vegetables, fodder, fruits and grapes have increased by 8-12%.
Despite the favourable climatic conditions and abundant water resources, the crops sector in
Albania remains relatively underdeveloped and faces a number of challenges, including low
productivity; limited area of cultivation; highly fragmented land ownership; low level of
11 Albania’s Integrated cross-sectorial plan for the coastal belt, 2015 12 Albania’s National Tourism Strategy 2019-2030 (p. 5). The date for the contribution to employment is uncertain – the document says “currently”, so it can be assumed it was in 2019. 13 Albania’s National Tourism Strategy 2019-2023.
Albania Revised NDC
32
mechanization; negative climate impacts, especially flood and drought conditions; and low level
of phytosanitary controls that limits agricultural export.
Livestock
Livestock production contributes more than 50% of the agriculture production value. Within the
livestock sector, the primary output is cow milk followed by bovine meat. With regard to milk and
dairy products in Albania is almost self-sufficient (at the level of 95%), while the eggs production
has a surplus and eggs are exported to Italy, Croatia and Kosovo. At the same time, about 40%
of meat consumed is imported. Livestock population is differently distributed across the country:
in the lowland areas, cattle are the dominant livestock type, while in hilly and mountainous areas,
small ruminants (sheep and goats) dominate. From 1997 to 2019 the number of ruminant
species has declined, and the population of swine and poultry remained almost stable.
The barriers towards more efficient livestock sector include small farm size; land fragmentation;
broken rolling relief; poor infrastructure; limited availability of rural credit to farmers, processors
and other small rural businesses; and inadequate rural institutions, especially extension services.
Forests
Forests cover around 36% of the land area in Albania with “high” forests covering 32.4%, coppice
46.2% and shrubs 21.4% of the forest area. The total forest area has declined since 1938, from
1.385 million hectares to 1.051 million hectares in 2018. During the last decades, forests have
experienced significant changes in their area and standing volume. During 2007-2019, the forest
volume was reduced from 73.641 million cubic meters in 2009 to 57.7 million in 2018 or by 22%.
The main negative factors are a lack of forest management capacity, illegal logging, and forest
fires. During 2007-2019 about 337,800 ha of forests were burned, which constitutes around 33%
of the national forest area. Almost all the forest fires have anthropogenic origin. Also, such
species as black pine, chestnut, plane, oaks and box-tree are suffering from the damages
caused by diseases and pests.
Firewood is an important commodity for Albania because it is used for heating many households.
In rural areas it is also used for cooking and water heating. Albanian forests have uneven age
structure with predominantly young stands, which leaves limited timber volume to harvest. There
are some limited areas of old-growth forests (mainly beech), but they are part of protected areas,
where harvesting is prohibited. The Albanian forest age is relatively young and there is a strong
need for improved forest management.
Currently, 96% of the forest is owned by municipalities and the National Agency of Protected
Areas and the rest is privately owned. In 2016, the Government of Albania transferred forest
management (except protected areas) to 61 municipalities. Also, since 2016 there is a
moratorium on forest harvesting with exception of harvesting by local governments to meet the
needs of households and large public building users.
Pastures and Meadows
Pastures are defined as areas larger than 0.5 ha with herbaceous and dwarf species. The total
pasture area in Albania is about 480,800 ha. The pasture area per capita varies widely among
the districts from 0.009 ha/capita for Durres to 0.83 for Kolonje. About 50% of the pastures are
owned by private individuals, about 44% by the state and only 6 % by local communities. There
are about 60% summer pastures and 40% are winter pastures. The vast majority of the pastures
are natural pastures; only a single pasture is defined as cultivated. A high percentage of the
pastures are located on steep or very steep slopes (almost 80%) and only about 20% are on
Albania Revised NDC
33
undulating terrain, posing some limitation on the management of the pasture resources. Most of
the pasture areas show erosion signs with about 60% overutilized. About 50% of the pastures
are at an altitude of less than 1000m, 50% are above 1000m. The grazing intensity has a definite
influence on the sustainability of grazing, depending on carrying capacity and pasture conditions.
More than 73% of the pastures are grazed moderately and 23% -- are being grazed heavily.
Water supply is important for providing drinking water for the animals. Only 25% of pastures have
a water source closer than 1 km, for almost 30% the closest water supply is more than 3 km
away.
Lagoons and Wetlands
Wetlands and lagoons are an important element of Albania’s ecosystem diversity. Most of them
are located along the coastal area of Adriatic and Ionian seas (Viluni, Kune Vain, Patok,
Karavasta, Narta Orikum and Butriknti lagoons), as well as along the big lakes (Prespa, Ohrid
and Shkodra Lakes). Many lagoons and wetlands a part of the Protected Areas Network, which
covers 524,322.70 ha, or 18.24% of the total territory.
Albania has four Ramsar sites: “Lagoon of Karavastasë-Pisha e Divjakës”, “Kanali i Çukës-
Butrint-Kepi i Stillos”, “Lake Shkodra-Buna river”, “Lake of Prespa” with a total of 98180 ha. In
Adriatic coast Divjaka and Karavasta lagoons are located, comprising the most important
protected area along the Albania’s coastal space. The Karavasta Lagoon ranks among the
lagoons of great importance providing habitat of over 20,000 wintering birds. The lagoon is
known for the large colony of the curly pelican (Pelecanus crispus), the only coastal nesting point
of Albania. Uncontrolled hunting remains the major risk factor for rare birds. Periodic hunting ban
has led to a noticeable increase of the colony of pelicans, even flamingos (Phoenicopterus
roseus) in Narta and Kune Vain. Coastal waters and lagoons as well as freshwater ecosystems
have additional economic value as recreational fishing and hunting spots.
Aquaculture and Fisheries
Albania is rich in water resources, with a coastline of 476 km, where fishing activities take place
in the 12 miles zone. Fishing activities are mainly concentrated on the continental shelf (on the
Adriatic side in the north extends to 25 miles and 2–4 miles in the Ionian Sea). There is a gradual
increasing trend of the average annual per capita consumption of fisheries and aquaculture
products from 4.9 kg/year in 2010 to 5.3 kg/year in 2016. Today fisheries (including capture
fisheries and aquatic organisms farming) take an important place in the Albanian economy, even
though the contribution of the sector to the Gross Domestic Product (GDP) is relatively low
(0.3%).
The sector has a good growth potential to be exploited through formulation and adoption of
appropriate policies sustained by efficient investments. Marine fisheries (represented by Large
Scale Fisheries - LSF) provide more than 52% of the catch and 61% of the value with coastal
areas, lagoons and inland waters (Small Scale Fisheries – SSF) yielding respectively 21% of the
production, but only 13% of the value. The aquaculture sectors have been increasing in
importance with 27% of the production and 26% of the value. The total full-time employment in
the fisheries and aquaculture sector is estimated at more than 4200 persons with a significant
number of women employed by the processing industry and ancillary services. The fish
processing industry is represented by almost 20 companies involved in processing seafood
mainly for the EU markets. The export of fish and seafood is quadrupling in comparison to 2013,
while for instance in 2019 the value of Albanian fish exports reached 100 million euros and
during the first six months of 2020, it was recorded a further increase of 24.5%. The development
of the aquaculture sector has followed the domestic consumer demand, especially for marine
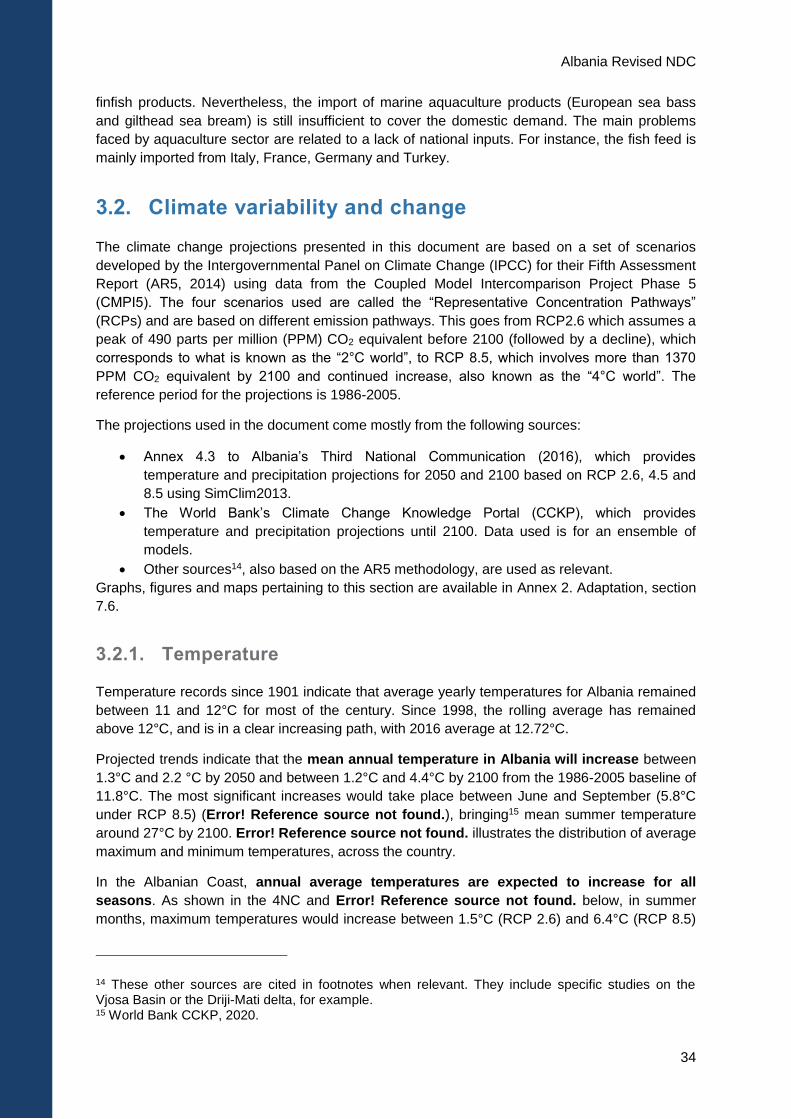
Albania Revised NDC
34
finfish products. Nevertheless, the import of marine aquaculture products (European sea bass
and gilthead sea bream) is still insufficient to cover the domestic demand. The main problems
faced by aquaculture sector are related to a lack of national inputs. For instance, the fish feed is
mainly imported from Italy, France, Germany and Turkey.
3.2. Climate variability and change
The climate change projections presented in this document are based on a set of scenarios
developed by the Intergovernmental Panel on Climate Change (IPCC) for their Fifth Assessment
Report (AR5, 2014) using data from the Coupled Model Intercomparison Project Phase 5
(CMPI5). The four scenarios used are called the “Representative Concentration Pathways”
(RCPs) and are based on different emission pathways. This goes from RCP2.6 which assumes a
peak of 490 parts per million (PPM) CO2 equivalent before 2100 (followed by a decline), which
corresponds to what is known as the “2°C world”, to RCP 8.5, which involves more than 1370
PPM CO2 equivalent by 2100 and continued increase, also known as the “4°C world”. The
reference period for the projections is 1986-2005.
The projections used in the document come mostly from the following sources:
Annex 4.3 to Albania’s Third National Communication (2016), which provides
temperature and precipitation projections for 2050 and 2100 based on RCP 2.6, 4.5 and
8.5 using SimClim2013.
The World Bank’s Climate Change Knowledge Portal (CCKP), which provides
temperature and precipitation projections until 2100. Data used is for an ensemble of
models.
Other sources14, also based on the AR5 methodology, are used as relevant.
Graphs, figures and maps pertaining to this section are available in Annex 2. Adaptation, section
7.6.
3.2.1. Temperature
Temperature records since 1901 indicate that average yearly temperatures for Albania remained
between 11 and 12°C for most of the century. Since 1998, the rolling average has remained
above 12°C, and is in a clear increasing path, with 2016 average at 12.72°C.
Projected trends indicate that the mean annual temperature in Albania will increase between
1.3°C and 2.2 °C by 2050 and between 1.2°C and 4.4°C by 2100 from the 1986-2005 baseline of
11.8°C. The most significant increases would take place between June and September (5.8°C
under RCP 8.5) (Error! Reference source not found.), bringing15 mean summer temperature
around 27°C by 2100. Error! Reference source not found. illustrates the distribution of average
maximum and minimum temperatures, across the country.
In the Albanian Coast, annual average temperatures are expected to increase for all
seasons. As shown in the 4NC and Error! Reference source not found. below, in summer
months, maximum temperatures would increase between 1.5°C (RCP 2.6) and 6.4°C (RCP 8.5)
14 These other sources are cited in footnotes when relevant. They include specific studies on the Vjosa Basin or the Driji-Mati delta, for example. 15 World Bank CCKP, 2020.
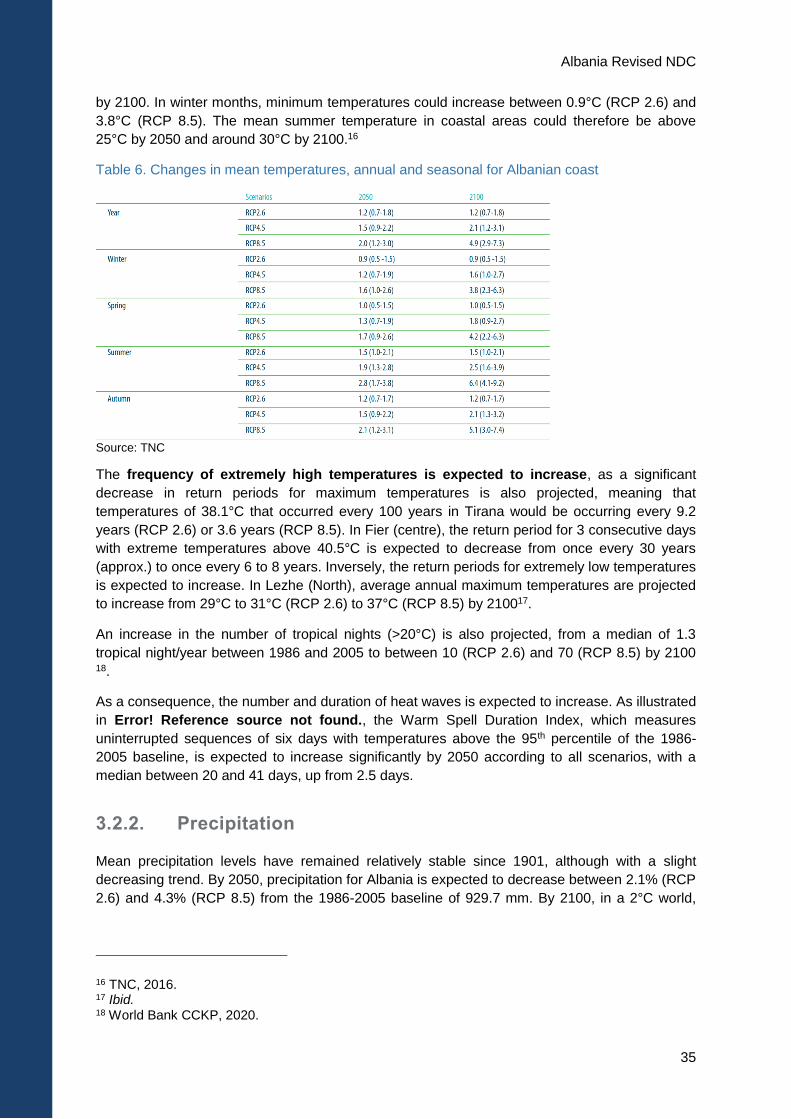
Albania Revised NDC
35
by 2100. In winter months, minimum temperatures could increase between 0.9°C (RCP 2.6) and
3.8°C (RCP 8.5). The mean summer temperature in coastal areas could therefore be above
25°C by 2050 and around 30°C by 2100.16
Table 6. Changes in mean temperatures, annual and seasonal for Albanian coast
Source: TNC
The frequency of extremely high temperatures is expected to increase, as a significant
decrease in return periods for maximum temperatures is also projected, meaning that
temperatures of 38.1°C that occurred every 100 years in Tirana would be occurring every 9.2
years (RCP 2.6) or 3.6 years (RCP 8.5). In Fier (centre), the return period for 3 consecutive days
with extreme temperatures above 40.5°C is expected to decrease from once every 30 years
(approx.) to once every 6 to 8 years. Inversely, the return periods for extremely low temperatures
is expected to increase. In Lezhe (North), average annual maximum temperatures are projected
to increase from 29°C to 31°C (RCP 2.6) to 37°C (RCP 8.5) by 210017.
An increase in the number of tropical nights (>20°C) is also projected, from a median of 1.3
tropical night/year between 1986 and 2005 to between 10 (RCP 2.6) and 70 (RCP 8.5) by 2100 18.
As a consequence, the number and duration of heat waves is expected to increase. As illustrated
in Error! Reference source not found., the Warm Spell Duration Index, which measures
uninterrupted sequences of six days with temperatures above the 95th percentile of the 1986-
2005 baseline, is expected to increase significantly by 2050 according to all scenarios, with a
median between 20 and 41 days, up from 2.5 days.
3.2.2. Precipitation
Mean precipitation levels have remained relatively stable since 1901, although with a slight
decreasing trend. By 2050, precipitation for Albania is expected to decrease between 2.1% (RCP
2.6) and 4.3% (RCP 8.5) from the 1986-2005 baseline of 929.7 mm. By 2100, in a 2°C world,
16 TNC, 2016. 17 Ibid. 18 World Bank CCKP, 2020.
Albania Revised NDC
36
precipitation would have decreased by 1.8% (less than by 2050), while under a 4°C world, it
would have decreased by 12.2%.19
Annual precipitation in coastal Albania is expected to decrease between 1.6 to 2.9% by 2050,
and by 1.6 to 7.1% by 2100. Precipitation is expected to decrease the most during summer
months (8.7 to 38.1% by 2100). However, precipitation would increase during winter months,
between 1.8 to 3.2% by 2050 and between 1.8 to 7.8% by 2100. Combined with warmer
temperatures, this increase means that more precipitation will be in the form of rain rather than
snow, causing river flows to increase in the winter and decrease in the spring, summer and
fall.20
Variability of precipitation is expected to increase in the Albanian coastal area, with an increased
frequency and intensity of heavy rainfall events. Return periods for such events are expected to
decrease (all scenarios), with events involving rainfall of 161 mm that occur every 100 years
expected to occur every 60 to 75 years in Tirana. These could cause floods, especially during
fall, winter and spring months.
During summer months, the combined increase in heavy rainfall events and the decrease in
rainfall averages indicate that the frequency of droughts is projected to increase. For
Albania, the Standardized Precipitation Evapotranspiration Index (SPEI), which considers
changes in the mean of 12-month cumulative water balance, taking into account
evapotranspiration, is expected to decrease by a median of 0.34 to 2.08 by 2100, indicating
negative and worsening water balance conditions, especially in the South of the country (Error!
Reference source not found.).21
19 World Bank CCKP, 2020. 20 TNC 21 World Bank CCKP, 2020.
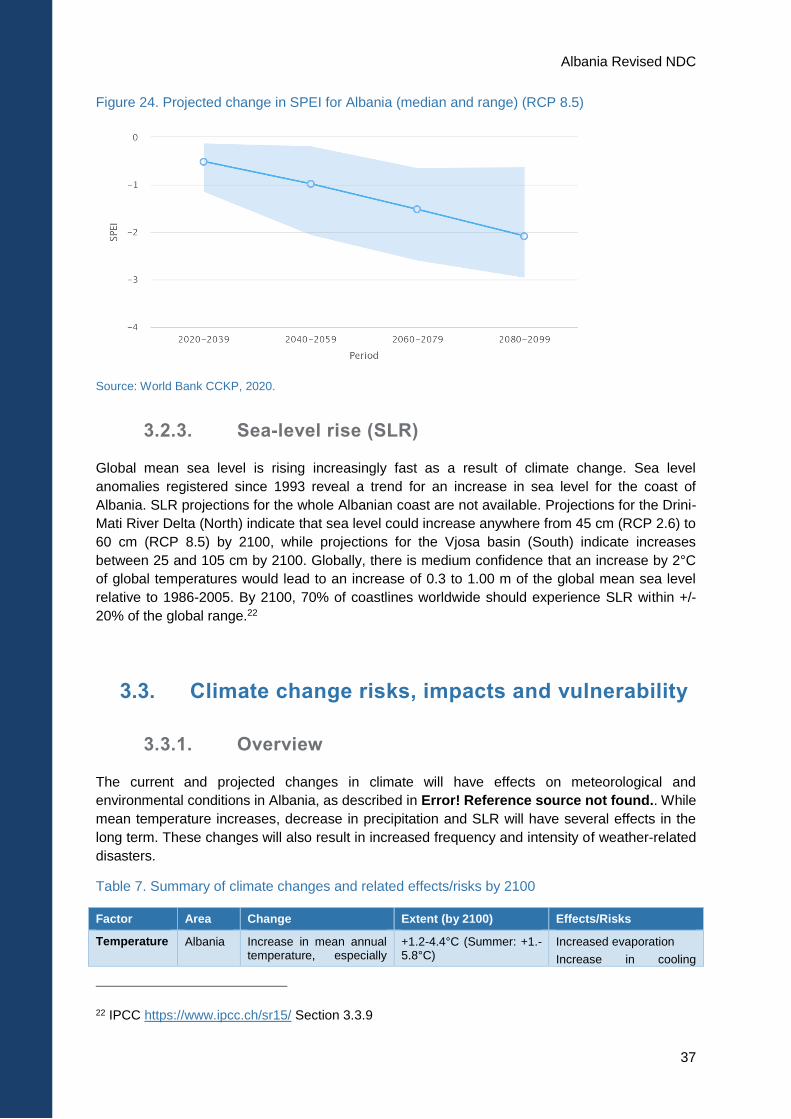
Albania Revised NDC
37
Figure 24. Projected change in SPEI for Albania (median and range) (RCP 8.5)
Source: World Bank CCKP, 2020.
3.2.3. Sea-level rise (SLR)
Global mean sea level is rising increasingly fast as a result of climate change. Sea level
anomalies registered since 1993 reveal a trend for an increase in sea level for the coast of
Albania. SLR projections for the whole Albanian coast are not available. Projections for the Drini-
Mati River Delta (North) indicate that sea level could increase anywhere from 45 cm (RCP 2.6) to
60 cm (RCP 8.5) by 2100, while projections for the Vjosa basin (South) indicate increases
between 25 and 105 cm by 2100. Globally, there is medium confidence that an increase by 2°C
of global temperatures would lead to an increase of 0.3 to 1.00 m of the global mean sea level
relative to 1986-2005. By 2100, 70% of coastlines worldwide should experience SLR within +/-
20% of the global range.22
3.3. Climate change risks, impacts and vulnerability
3.3.1. Overview
The current and projected changes in climate will have effects on meteorological and
environmental conditions in Albania, as described in Error! Reference source not found.. While
mean temperature increases, decrease in precipitation and SLR will have several effects in the
long term. These changes will also result in increased frequency and intensity of weather-related
disasters.
Table 7. Summary of climate changes and related effects/risks by 2100
Factor Area Change Extent (by 2100) Effects/Risks
Temperature Albania Increase in mean annual temperature, especially
+1.2-4.4°C (Summer: +1.-5.8°C)
Increased evaporation
Increase in cooling
22 IPCC https://www.ipcc.ch/sr15/ Section 3.3.9
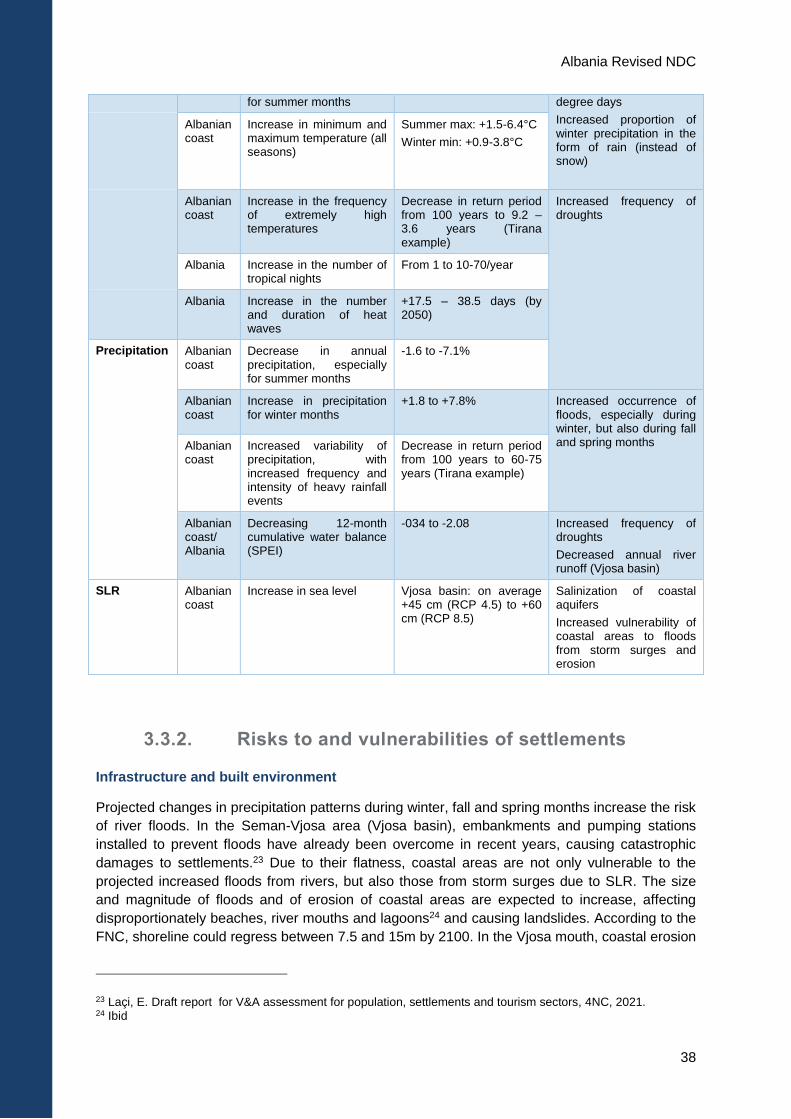
Albania Revised NDC
38
for summer months degree days
Increased proportion of winter precipitation in the form of rain (instead of snow)
Albanian coast
Increase in minimum and maximum temperature (all seasons)
Summer max: +1.5-6.4°C
Winter min: +0.9-3.8°C
Albanian coast
Increase in the frequency of extremely high temperatures
Decrease in return period from 100 years to 9.2 – 3.6 years (Tirana example)
Increased frequency of droughts
Albania Increase in the number of tropical nights
From 1 to 10-70/year
Albania Increase in the number and duration of heat waves
+17.5 – 38.5 days (by 2050)
Precipitation Albanian coast
Decrease in annual precipitation, especially for summer months
-1.6 to -7.1%
Albanian coast
Increase in precipitation for winter months
+1.8 to +7.8% Increased occurrence of floods, especially during winter, but also during fall and spring months Albanian
coast Increased variability of precipitation, with increased frequency and intensity of heavy rainfall events
Decrease in return period from 100 years to 60-75 years (Tirana example)
Albanian coast/ Albania
Decreasing 12-month cumulative water balance (SPEI)
-034 to -2.08 Increased frequency of droughts
Decreased annual river runoff (Vjosa basin)
SLR Albanian coast
Increase in sea level Vjosa basin: on average +45 cm (RCP 4.5) to +60 cm (RCP 8.5)
Salinization of coastal aquifers
Increased vulnerability of coastal areas to floods from storm surges and erosion
3.3.2. Risks to and vulnerabilities of settlements
Infrastructure and built environment
Projected changes in precipitation patterns during winter, fall and spring months increase the risk
of river floods. In the Seman-Vjosa area (Vjosa basin), embankments and pumping stations
installed to prevent floods have already been overcome in recent years, causing catastrophic
damages to settlements.23 Due to their flatness, coastal areas are not only vulnerable to the
projected increased floods from rivers, but also those from storm surges due to SLR. The size
and magnitude of floods and of erosion of coastal areas are expected to increase, affecting
disproportionately beaches, river mouths and lagoons24 and causing landslides. According to the
FNC, shoreline could regress between 7.5 and 15m by 2100. In the Vjosa mouth, coastal erosion
23 Laçi, E. Draft report for V&A assessment for population, settlements and tourism sectors, 4NC, 2021. 24 Ibid
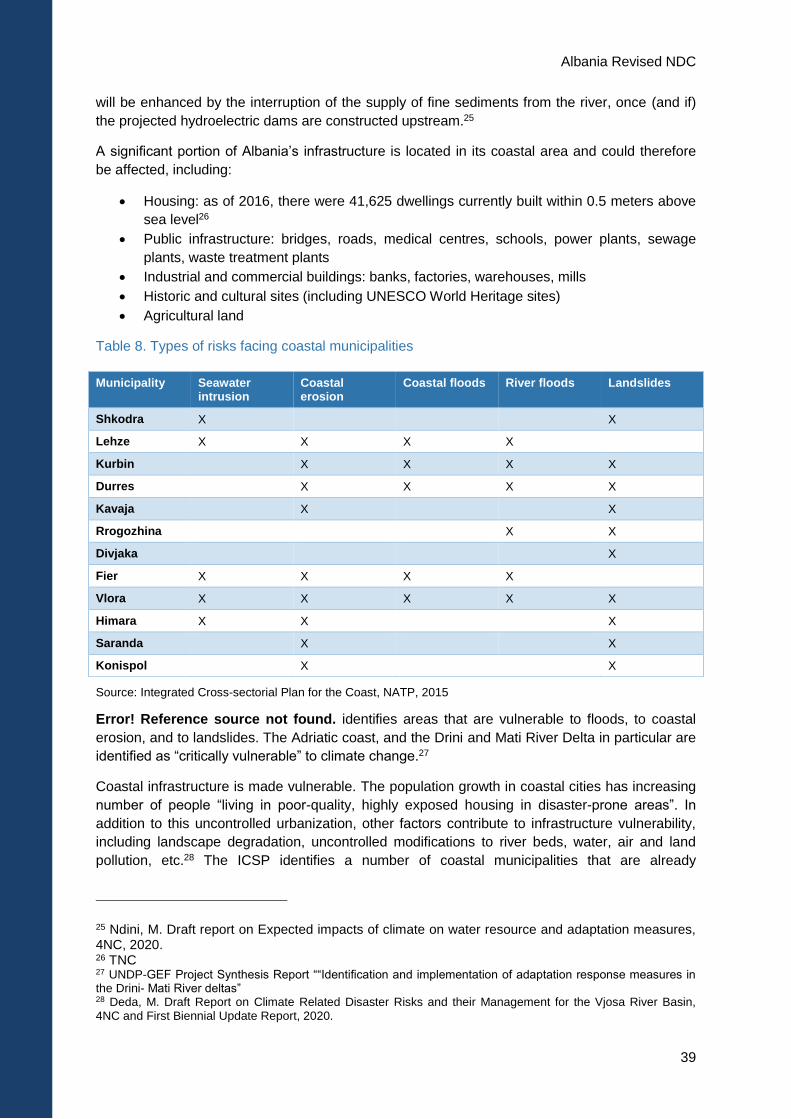
Albania Revised NDC
39
will be enhanced by the interruption of the supply of fine sediments from the river, once (and if)
the projected hydroelectric dams are constructed upstream.25
A significant portion of Albania’s infrastructure is located in its coastal area and could therefore
be affected, including:
Housing: as of 2016, there were 41,625 dwellings currently built within 0.5 meters above
sea level26
Public infrastructure: bridges, roads, medical centres, schools, power plants, sewage
plants, waste treatment plants
Industrial and commercial buildings: banks, factories, warehouses, mills
Historic and cultural sites (including UNESCO World Heritage sites)
Agricultural land
Table 8. Types of risks facing coastal municipalities
Source: Integrated Cross-sectorial Plan for the Coast, NATP, 2015
Error! Reference source not found. identifies areas that are vulnerable to floods, to coastal
erosion, and to landslides. The Adriatic coast, and the Drini and Mati River Delta in particular are
identified as “critically vulnerable” to climate change.27
Coastal infrastructure is made vulnerable. The population growth in coastal cities has increasing
number of people “living in poor-quality, highly exposed housing in disaster-prone areas”. In
addition to this uncontrolled urbanization, other factors contribute to infrastructure vulnerability,
including landscape degradation, uncontrolled modifications to river beds, water, air and land
pollution, etc.28 The ICSP identifies a number of coastal municipalities that are already
25 Ndini, M. Draft report on Expected impacts of climate on water resource and adaptation measures, 4NC, 2020. 26 TNC 27 UNDP-GEF Project Synthesis Report ““Identification and implementation of adaptation response measures in the Drini- Mati River deltas” 28 Deda, M. Draft Report on Climate Related Disaster Risks and their Management for the Vjosa River Basin, 4NC and First Biennial Update Report, 2020.
Municipality Seawater intrusion
Coastal erosion
Coastal floods River floods Landslides
Shkodra X X
Lehze X X X X
Kurbin X X X X
Durres X X X X
Kavaja X X
Rrogozhina X X
Divjaka X
Fier X X X X
Vlora X X X X X
Himara X X X
Saranda X X
Konispol X X
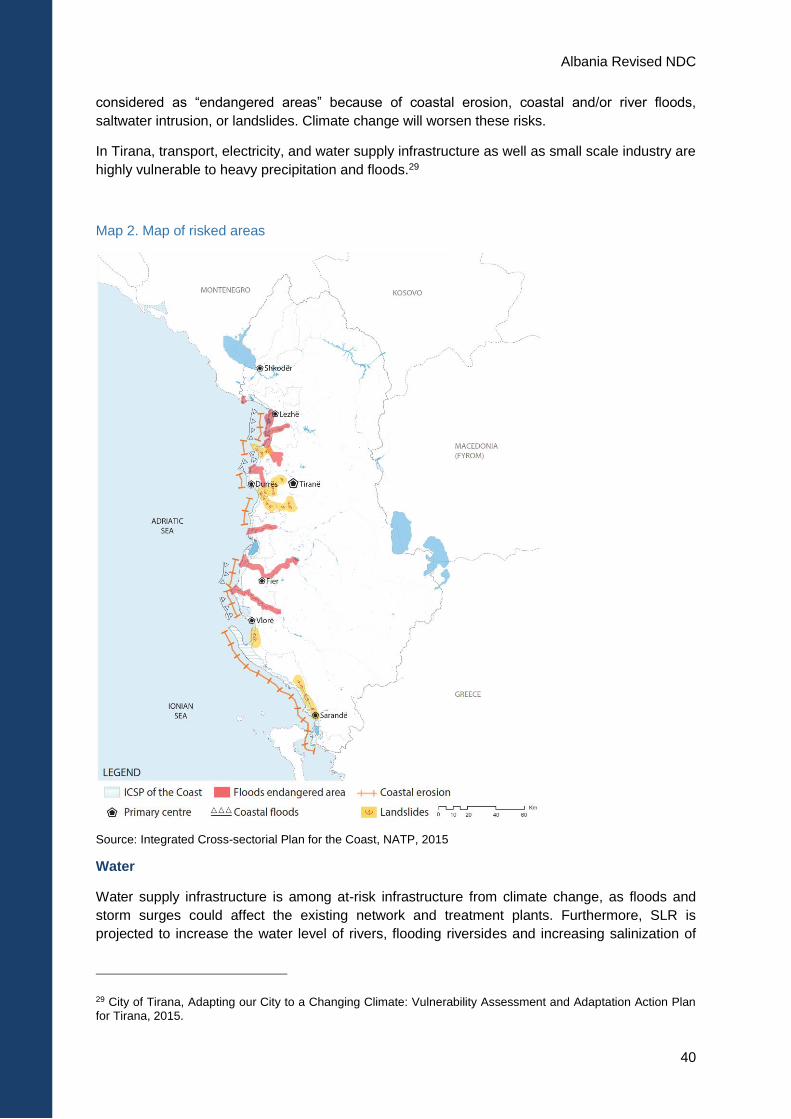
Albania Revised NDC
40
considered as “endangered areas” because of coastal erosion, coastal and/or river floods,
saltwater intrusion, or landslides. Climate change will worsen these risks.
In Tirana, transport, electricity, and water supply infrastructure as well as small scale industry are
highly vulnerable to heavy precipitation and floods.29
Map 2. Map of risked areas
Source: Integrated Cross-sectorial Plan for the Coast, NATP, 2015
Water
Water supply infrastructure is among at-risk infrastructure from climate change, as floods and
storm surges could affect the existing network and treatment plants. Furthermore, SLR is
projected to increase the water level of rivers, flooding riversides and increasing salinization of
29 City of Tirana, Adapting our City to a Changing Climate: Vulnerability Assessment and Adaptation Action Plan for Tirana, 2015.
Albania Revised NDC
41
coastal aquifers. While water availability has not been an issue in Albania due to its ample
freshwater reserves, salinization of coastal aquifers adds on to water losses in the water supply
system (due to its maintenance state).
Projected increases in temperature will lead to increased evaporation, especially in the summer
which is when temperature increases the most. Water availability will be further affected by the
projected decrease in precipitation projected to be strongest during summer months, resulting in
decreased river runoff. As an example, in the Vjosa basin, annual runoff is expected to decrease
between 3.4% (RCP 2.6) and 10.9% (RCP 8.5) by 2050 and between 3.15% (RCP 2.6) and
13.5% (RCP 8.5) by 2100. Runoff decrease is expected to be more important for other river
basins.30
On the other hand, water demand is expected to increase. This is largely related to increased
access to water supply and increase in personal use of water for well-being, as well as
challenges to water governance.31 Although the marginal effect of climate change is difficult to
project, heat waves and droughts are likely to lead to high peaks in demand.
Projections for the Vjosa River Basin indicate that during drought periods in the months of July,
August, and September, under RCP 8.5, there could be an unmet demand between 3 and 4.5
million m3 per year by 2050.32
Energy
Given the high reliance of the country on hydropower and the poor state of related infrastructure,
the energy supply is vulnerable to climate change. The ICSP states that “seasonal fluctuations
can have a negative effect in securing energy supply from these hydro power stations”,
mentioning that “in the recent years, the water levels in reservoirs have sometimes been very low
levelled, forcing the domestic operators to purchase energy from neighbour countries to cope
with the need for energy supply.”
The projected decrease in annual river runoff will worsen this situation. Indeed, the National
Climate Change Policy (2019) estimates that “by 2050, annual average electricity output from
Albania’s large hydropower plants could be reduced by about 15% and from small hydropower
plants by around 20%”. Even the projected new dams in Poçem on the Vjosa river will have to
address significant streamflow reductions in the summer months, and moderate yearly
streamflow reductions.33
Hydroelectricity infrastructure could also be damaged during heavy rainfall events, which tend to
cause unusually high amounts of sediments to flow into the rivers and dams.
On the demand side, increased temperatures will cause an overall increase in cooling degree
days between May and September, which will reflect on higher demand for electricity. Error!
Reference source not found. illustrates this for Albania, but the coast usually has more cooling
30 Ndini, M. Draft Report on Expected impact of climate on water resource and adaptation measures, 4NC, 2020. 31 Ndini, M. Draft Report on Expected impact of climate on water resource and adaptation measures, 4NC, 2020. 3232 Ndini, M. Draft Report on Expected impact of climate on water resource and adaptation measures, 4NC,
2020. 33 Ndini, M. Draft Report on Expected impact of climate on water resource and adaptation measures, 4NC, 2020.
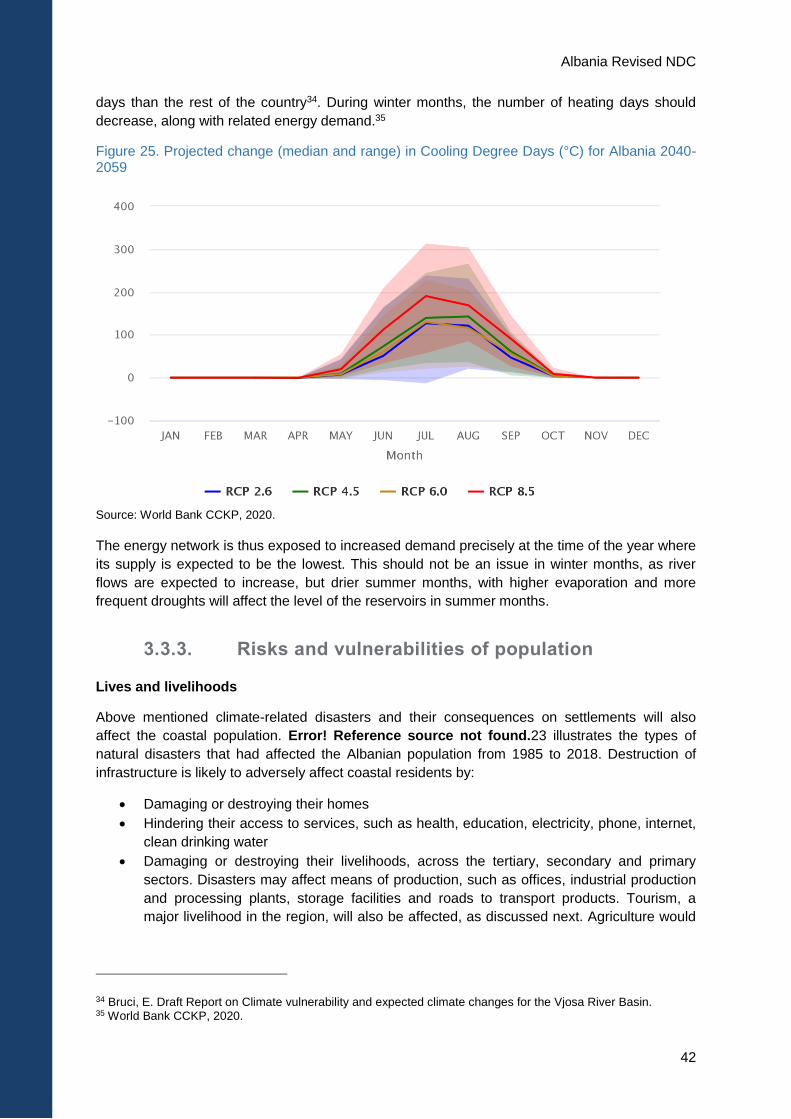
Albania Revised NDC
42
days than the rest of the country34. During winter months, the number of heating days should
decrease, along with related energy demand.35
Figure 25. Projected change (median and range) in Cooling Degree Days (°C) for Albania 2040-2059
Source: World Bank CCKP, 2020.
The energy network is thus exposed to increased demand precisely at the time of the year where
its supply is expected to be the lowest. This should not be an issue in winter months, as river
flows are expected to increase, but drier summer months, with higher evaporation and more
frequent droughts will affect the level of the reservoirs in summer months.
3.3.3. Risks and vulnerabilities of population
Lives and livelihoods
Above mentioned climate-related disasters and their consequences on settlements will also
affect the coastal population. Error! Reference source not found.23 illustrates the types of
natural disasters that had affected the Albanian population from 1985 to 2018. Destruction of
infrastructure is likely to adversely affect coastal residents by:
Damaging or destroying their homes
Hindering their access to services, such as health, education, electricity, phone, internet,
clean drinking water
Damaging or destroying their livelihoods, across the tertiary, secondary and primary
sectors. Disasters may affect means of production, such as offices, industrial production
and processing plants, storage facilities and roads to transport products. Tourism, a
major livelihood in the region, will also be affected, as discussed next. Agriculture would
34 Bruci, E. Draft Report on Climate vulnerability and expected climate changes for the Vjosa River Basin. 35 World Bank CCKP, 2020.
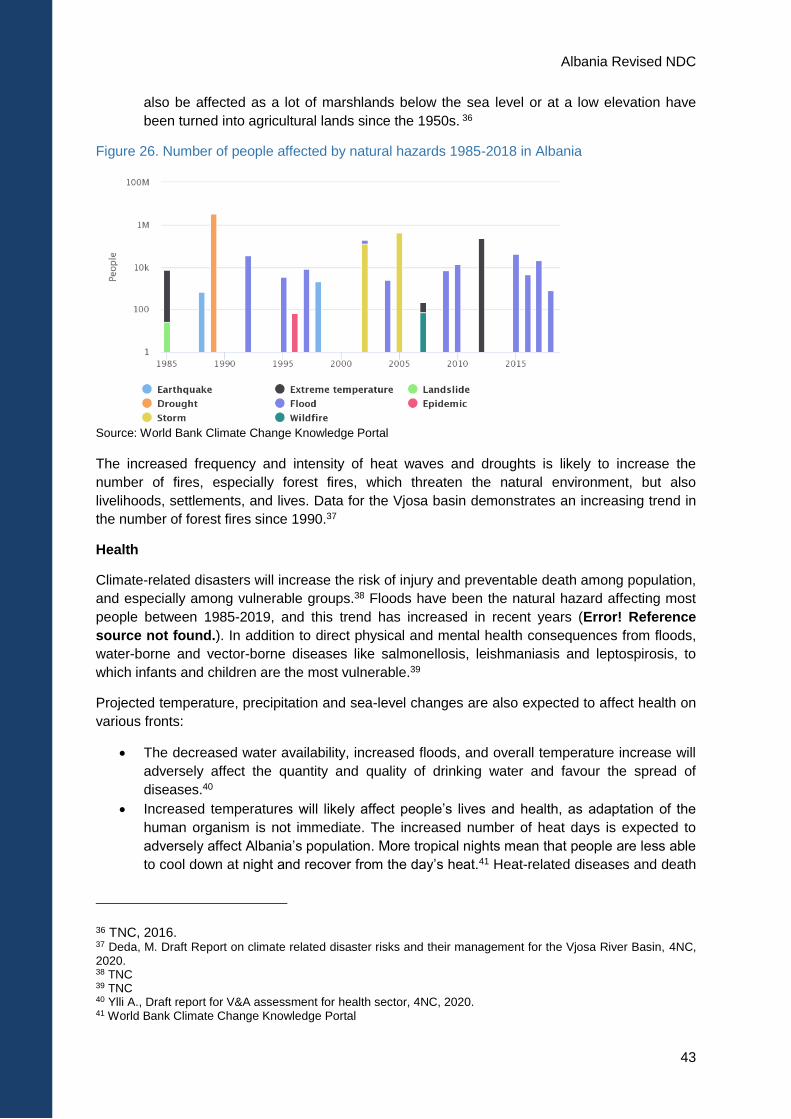
Albania Revised NDC
43
also be affected as a lot of marshlands below the sea level or at a low elevation have
been turned into agricultural lands since the 1950s. 36
Figure 26. Number of people affected by natural hazards 1985-2018 in Albania
Source: World Bank Climate Change Knowledge Portal
The increased frequency and intensity of heat waves and droughts is likely to increase the
number of fires, especially forest fires, which threaten the natural environment, but also
livelihoods, settlements, and lives. Data for the Vjosa basin demonstrates an increasing trend in
the number of forest fires since 1990.37
Health
Climate-related disasters will increase the risk of injury and preventable death among population,
and especially among vulnerable groups.38 Floods have been the natural hazard affecting most
people between 1985-2019, and this trend has increased in recent years (Error! Reference
source not found.). In addition to direct physical and mental health consequences from floods,
water-borne and vector-borne diseases like salmonellosis, leishmaniasis and leptospirosis, to
which infants and children are the most vulnerable.39
Projected temperature, precipitation and sea-level changes are also expected to affect health on
various fronts:
The decreased water availability, increased floods, and overall temperature increase will
adversely affect the quantity and quality of drinking water and favour the spread of
diseases.40
Increased temperatures will likely affect people’s lives and health, as adaptation of the
human organism is not immediate. The increased number of heat days is expected to
adversely affect Albania’s population. More tropical nights mean that people are less able
to cool down at night and recover from the day’s heat.41 Heat-related diseases and death
36 TNC, 2016. 37 Deda, M. Draft Report on climate related disaster risks and their management for the Vjosa River Basin, 4NC, 2020. 38 TNC 39 TNC 40 Ylli A., Draft report for V&A assessment for health sector, 4NC, 2020. 41 World Bank Climate Change Knowledge Portal
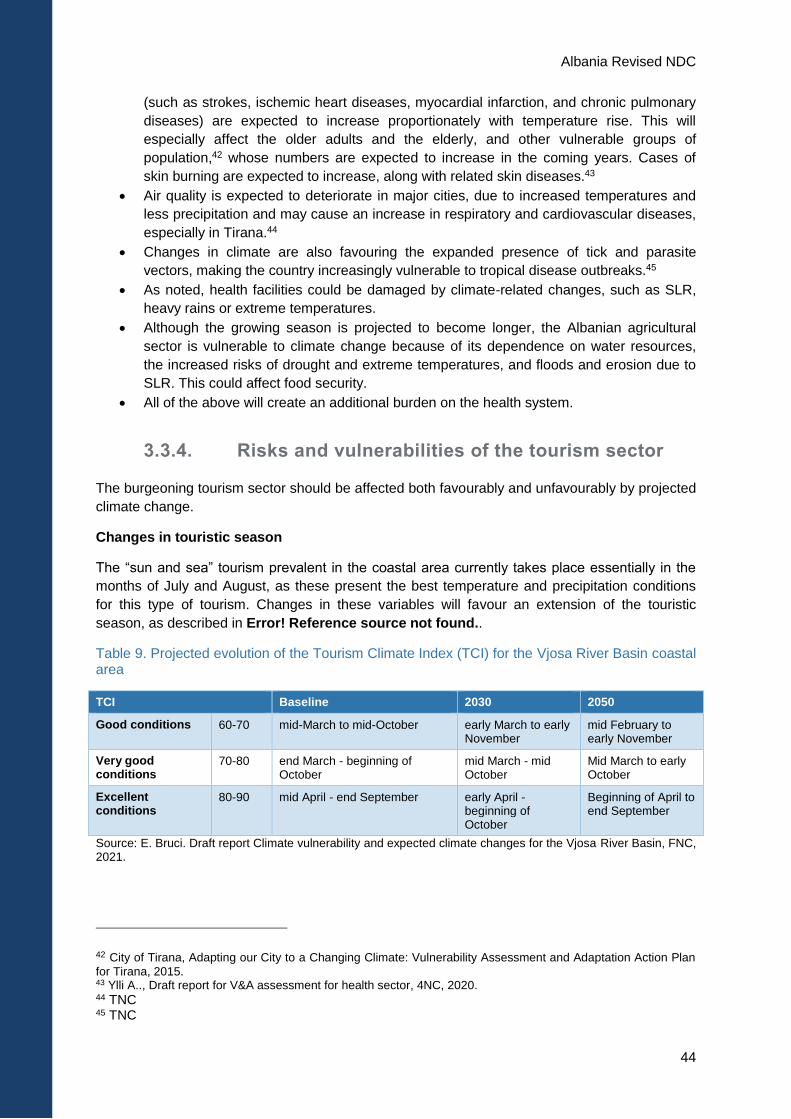
Albania Revised NDC
44
(such as strokes, ischemic heart diseases, myocardial infarction, and chronic pulmonary
diseases) are expected to increase proportionately with temperature rise. This will
especially affect the older adults and the elderly, and other vulnerable groups of
population,42 whose numbers are expected to increase in the coming years. Cases of
skin burning are expected to increase, along with related skin diseases.43
Air quality is expected to deteriorate in major cities, due to increased temperatures and
less precipitation and may cause an increase in respiratory and cardiovascular diseases,
especially in Tirana.44
Changes in climate are also favouring the expanded presence of tick and parasite
vectors, making the country increasingly vulnerable to tropical disease outbreaks.45
As noted, health facilities could be damaged by climate-related changes, such as SLR,
heavy rains or extreme temperatures.
Although the growing season is projected to become longer, the Albanian agricultural
sector is vulnerable to climate change because of its dependence on water resources,
the increased risks of drought and extreme temperatures, and floods and erosion due to
SLR. This could affect food security.
All of the above will create an additional burden on the health system.
3.3.4. Risks and vulnerabilities of the tourism sector
The burgeoning tourism sector should be affected both favourably and unfavourably by projected
climate change.
Changes in touristic season
The “sun and sea” tourism prevalent in the coastal area currently takes place essentially in the
months of July and August, as these present the best temperature and precipitation conditions
for this type of tourism. Changes in these variables will favour an extension of the touristic
season, as described in Error! Reference source not found..
Table 9. Projected evolution of the Tourism Climate Index (TCI) for the Vjosa River Basin coastal area
TCI Baseline 2030 2050
Good conditions 60-70 mid-March to mid-October early March to early November
mid February to early November
Very good conditions
70-80 end March - beginning of October
mid March - mid October
Mid March to early October
Excellent conditions
80-90 mid April - end September early April - beginning of October
Beginning of April to end September
Source: E. Bruci. Draft report Climate vulnerability and expected climate changes for the Vjosa River Basin, FNC, 2021.
42 City of Tirana, Adapting our City to a Changing Climate: Vulnerability Assessment and Adaptation Action Plan
for Tirana, 2015. 43 Ylli A.., Draft report for V&A assessment for health sector, 4NC, 2020. 44 TNC 45 TNC
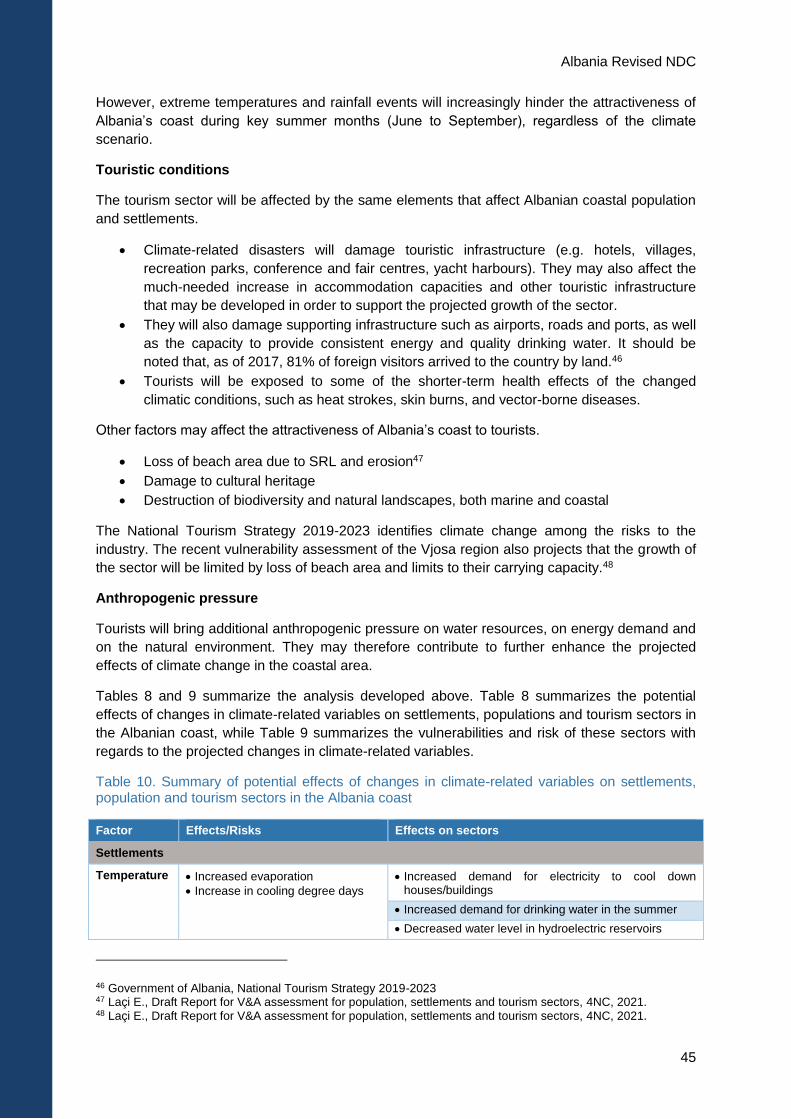
Albania Revised NDC
45
However, extreme temperatures and rainfall events will increasingly hinder the attractiveness of
Albania’s coast during key summer months (June to September), regardless of the climate
scenario.
Touristic conditions
The tourism sector will be affected by the same elements that affect Albanian coastal population
and settlements.
Climate-related disasters will damage touristic infrastructure (e.g. hotels, villages,
recreation parks, conference and fair centres, yacht harbours). They may also affect the
much-needed increase in accommodation capacities and other touristic infrastructure
that may be developed in order to support the projected growth of the sector.
They will also damage supporting infrastructure such as airports, roads and ports, as well
as the capacity to provide consistent energy and quality drinking water. It should be
noted that, as of 2017, 81% of foreign visitors arrived to the country by land.46
Tourists will be exposed to some of the shorter-term health effects of the changed
climatic conditions, such as heat strokes, skin burns, and vector-borne diseases.
Other factors may affect the attractiveness of Albania’s coast to tourists.
Loss of beach area due to SRL and erosion47
Damage to cultural heritage
Destruction of biodiversity and natural landscapes, both marine and coastal
The National Tourism Strategy 2019-2023 identifies climate change among the risks to the
industry. The recent vulnerability assessment of the Vjosa region also projects that the growth of
the sector will be limited by loss of beach area and limits to their carrying capacity.48
Anthropogenic pressure
Tourists will bring additional anthropogenic pressure on water resources, on energy demand and
on the natural environment. They may therefore contribute to further enhance the projected
effects of climate change in the coastal area.
Tables 8 and 9 summarize the analysis developed above. Table 8 summarizes the potential
effects of changes in climate-related variables on settlements, populations and tourism sectors in
the Albanian coast, while Table 9 summarizes the vulnerabilities and risk of these sectors with
regards to the projected changes in climate-related variables.
Table 10. Summary of potential effects of changes in climate-related variables on settlements, population and tourism sectors in the Albania coast
Factor Effects/Risks Effects on sectors
Settlements
Temperature Increased evaporation
Increase in cooling degree days
Increased demand for electricity to cool down houses/buildings
Increased demand for drinking water in the summer
Decreased water level in hydroelectric reservoirs
46 Government of Albania, National Tourism Strategy 2019-2023 47 Laçi E., Draft Report for V&A assessment for population, settlements and tourism sectors, 4NC, 2021. 48 Laçi E., Draft Report for V&A assessment for population, settlements and tourism sectors, 4NC, 2021.
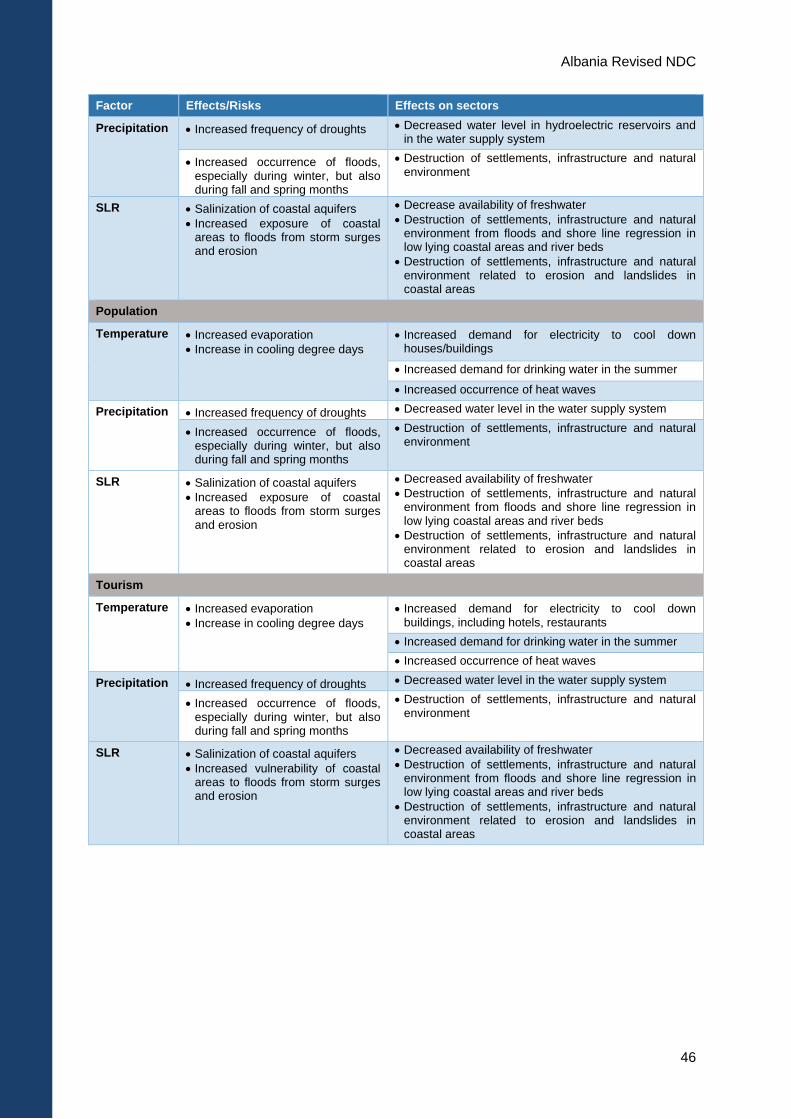
Albania Revised NDC
46
Factor Effects/Risks Effects on sectors
Precipitation Increased frequency of droughts Decreased water level in hydroelectric reservoirs and in the water supply system
Increased occurrence of floods, especially during winter, but also during fall and spring months
Destruction of settlements, infrastructure and natural environment
SLR Salinization of coastal aquifers
Increased exposure of coastal areas to floods from storm surges and erosion
Decrease availability of freshwater
Destruction of settlements, infrastructure and natural environment from floods and shore line regression in low lying coastal areas and river beds
Destruction of settlements, infrastructure and natural environment related to erosion and landslides in coastal areas
Population
Temperature Increased evaporation
Increase in cooling degree days
Increased demand for electricity to cool down houses/buildings
Increased demand for drinking water in the summer
Increased occurrence of heat waves
Precipitation Increased frequency of droughts Decreased water level in the water supply system
Increased occurrence of floods, especially during winter, but also during fall and spring months
Destruction of settlements, infrastructure and natural environment
SLR Salinization of coastal aquifers
Increased exposure of coastal areas to floods from storm surges and erosion
Decreased availability of freshwater
Destruction of settlements, infrastructure and natural environment from floods and shore line regression in low lying coastal areas and river beds
Destruction of settlements, infrastructure and natural environment related to erosion and landslides in coastal areas
Tourism
Temperature Increased evaporation
Increase in cooling degree days
Increased demand for electricity to cool down buildings, including hotels, restaurants
Increased demand for drinking water in the summer
Increased occurrence of heat waves
Precipitation Increased frequency of droughts Decreased water level in the water supply system
Increased occurrence of floods, especially during winter, but also during fall and spring months
Destruction of settlements, infrastructure and natural environment
SLR Salinization of coastal aquifers
Increased vulnerability of coastal areas to floods from storm surges and erosion
Decreased availability of freshwater
Destruction of settlements, infrastructure and natural environment from floods and shore line regression in low lying coastal areas and river beds
Destruction of settlements, infrastructure and natural environment related to erosion and landslides in coastal areas
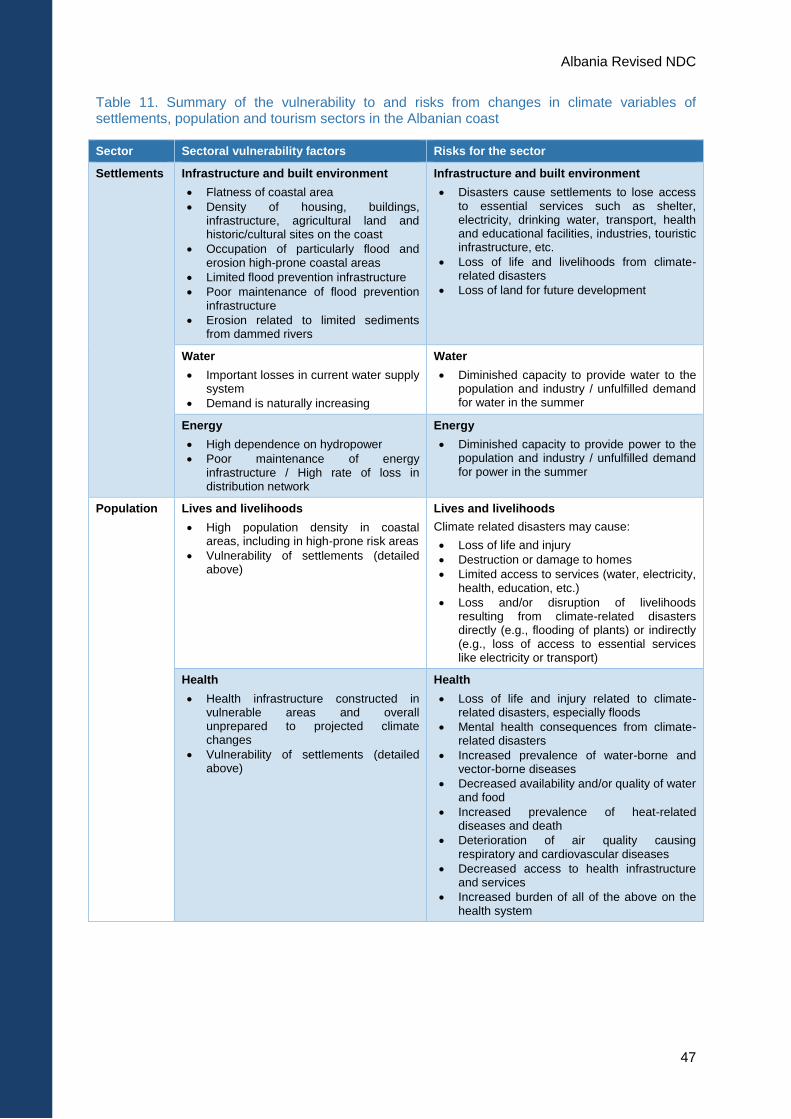
Albania Revised NDC
47
Table 11. Summary of the vulnerability to and risks from changes in climate variables of settlements, population and tourism sectors in the Albanian coast
Sector Sectoral vulnerability factors Risks for the sector
Settlements Infrastructure and built environment
Flatness of coastal area
Density of housing, buildings, infrastructure, agricultural land and historic/cultural sites on the coast
Occupation of particularly flood and erosion high-prone coastal areas
Limited flood prevention infrastructure
Poor maintenance of flood prevention infrastructure
Erosion related to limited sediments from dammed rivers
Infrastructure and built environment
Disasters cause settlements to lose access to essential services such as shelter, electricity, drinking water, transport, health and educational facilities, industries, touristic infrastructure, etc.
Loss of life and livelihoods from climate-related disasters
Loss of land for future development
Water
Important losses in current water supply system
Demand is naturally increasing
Water
Diminished capacity to provide water to the population and industry / unfulfilled demand for water in the summer
Energy
High dependence on hydropower
Poor maintenance of energy infrastructure / High rate of loss in distribution network
Energy
Diminished capacity to provide power to the population and industry / unfulfilled demand for power in the summer
Population Lives and livelihoods
High population density in coastal areas, including in high-prone risk areas
Vulnerability of settlements (detailed above)
Lives and livelihoods
Climate related disasters may cause:
Loss of life and injury
Destruction or damage to homes
Limited access to services (water, electricity, health, education, etc.)
Loss and/or disruption of livelihoods resulting from climate-related disasters directly (e.g., flooding of plants) or indirectly (e.g., loss of access to essential services like electricity or transport)
Health
Health infrastructure constructed in vulnerable areas and overall unprepared to projected climate changes
Vulnerability of settlements (detailed above)
Health
Loss of life and injury related to climate-related disasters, especially floods
Mental health consequences from climate-related disasters
Increased prevalence of water-borne and vector-borne diseases
Decreased availability and/or quality of water and food
Increased prevalence of heat-related diseases and death
Deterioration of air quality causing respiratory and cardiovascular diseases
Decreased access to health infrastructure and services
Increased burden of all of the above on the health system
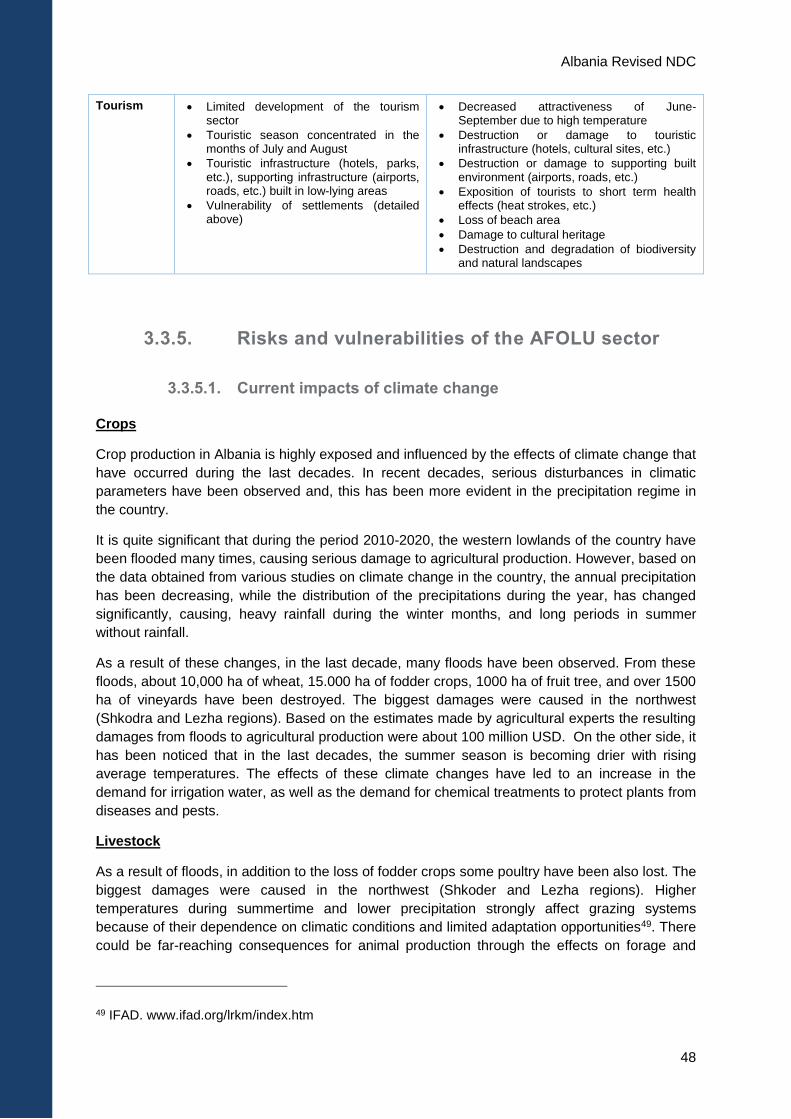
Albania Revised NDC
48
Tourism Limited development of the tourism sector
Touristic season concentrated in the months of July and August
Touristic infrastructure (hotels, parks, etc.), supporting infrastructure (airports, roads, etc.) built in low-lying areas
Vulnerability of settlements (detailed above)
Decreased attractiveness of June-September due to high temperature
Destruction or damage to touristic infrastructure (hotels, cultural sites, etc.)
Destruction or damage to supporting built environment (airports, roads, etc.)
Exposition of tourists to short term health effects (heat strokes, etc.)
Loss of beach area
Damage to cultural heritage
Destruction and degradation of biodiversity and natural landscapes
3.3.5. Risks and vulnerabilities of the AFOLU sector
3.3.5.1. Current impacts of climate change
Crops
Crop production in Albania is highly exposed and influenced by the effects of climate change that
have occurred during the last decades. In recent decades, serious disturbances in climatic
parameters have been observed and, this has been more evident in the precipitation regime in
the country.
It is quite significant that during the period 2010-2020, the western lowlands of the country have
been flooded many times, causing serious damage to agricultural production. However, based on
the data obtained from various studies on climate change in the country, the annual precipitation
has been decreasing, while the distribution of the precipitations during the year, has changed
significantly, causing, heavy rainfall during the winter months, and long periods in summer
without rainfall.
As a result of these changes, in the last decade, many floods have been observed. From these
floods, about 10,000 ha of wheat, 15.000 ha of fodder crops, 1000 ha of fruit tree, and over 1500
ha of vineyards have been destroyed. The biggest damages were caused in the northwest
(Shkodra and Lezha regions). Based on the estimates made by agricultural experts the resulting
damages from floods to agricultural production were about 100 million USD. On the other side, it
has been noticed that in the last decades, the summer season is becoming drier with rising
average temperatures. The effects of these climate changes have led to an increase in the
demand for irrigation water, as well as the demand for chemical treatments to protect plants from
diseases and pests.
Livestock
As a result of floods, in addition to the loss of fodder crops some poultry have been also lost. The
biggest damages were caused in the northwest (Shkoder and Lezha regions). Higher
temperatures during summertime and lower precipitation strongly affect grazing systems
because of their dependence on climatic conditions and limited adaptation opportunities49. There
could be far-reaching consequences for animal production through the effects on forage and
49 IFAD. www.ifad.org/lrkm/index.htm
Albania Revised NDC
49
range productivity. The small ruminant animals, sheep and goats in Albania are mainly kept in
extensive pasture system and they are more vulnerable to climate change, including higher
temperatures and shortage of forage.
The direct impacts of climate change are likely to be more limited in non-grazing systems mostly
because the housing of animals in buildings allows for greater control of production conditions50.
The most productive animals, dairy cattle, laying hens, broilers and pigs are managed and
housed in good conditions in Albania and the impact of climate change on them will be less than
farm animals in the semi-intensive or extensive system. The surface planted with alfalfa, which
makes the main forage used in ruminant animals feeding, is still stable with a slight increase. The
high temperatures during the last few summer seasons may have affected the laying hens and
dairy cattle production, but no data are available to quantify this impact.
The worst effect has been noticed in the area of diseases spread out in farm animals, because of
high temperatures. Seven years ago, Albania had experienced the case of bluetongue diseases
in cattle and then in sheep as climate change allowed its spread. Bluetongue disease is a non-
contagious illness of ruminant animals that is transmitted through insects (Culicoides. Sp). In
general, 900 head of cattle were infected, from which 175 died. Then the illness was spread out
in small ruminant animals that infected 28,176 heads of sheep and 663 heads of goat from which
were dead respectively 6379 and 142 Head of animals51. These are the main financial losses
without taking into account the losses from the low productivity of animals. Another disease that
is affected by climate change is Krime-Kongo hemorrhagic fever (CCHF) that is present in
Albania and causes death in human being but affect animals. The warmer winter season helps
the survival of larvae and rays spread out of CCHF. The same situation has happened with
horses infected with the West Nile virus spread out by Culex pipiens mosquito that is adapted to
high temperatures. In the year 2011, 22% of horses were infected.
Forests
Climate change directly affects the frequency and intensity of forest disturbances such as insect
outbreaks, the increased presence of invasive species, fires, storms, etc. Also, rising
temperatures, heat waves and reduced rainfall cause stress to trees, directly affecting the
productivity of forests.
To date, there is no specific studies regarding the impact of climate change on Albanian forests.
However, some impacts of those changes are already evident and consist of:
1. Damage to the coastal belt of Mediterranean pine forests (mainly Pinus halepensis). This
damage occurred in two main areas:
a. In Kune-Vain (Lezha municipality), where a forest belt of Mediterranean pines of
about 80 ha has disappeared during 1985-2020 as a result of coastal erosion.
The belt has a length of about 4 km and a maximum width of up to 400 meters.
Coastal erosion in combination with a rising sea level has caused the loss of a
significant amount of forest land in this area with an average extinction rate of
about 2.3 ha/year.
b. In Velipoje (Shkodra municipality), due to coastal erosion, a forest area of 34 ha
with riparian forests was lost in the period 1985-2020. The rate of forest area of
loss there has been about 1 ha/year.
50 FAO. "The State of Food and Agriculture: Livestock in the Balance, ." 2009 51 Blue tongue Bulletin, ISUV 2014
Albania Revised NDC
50
2. Changes have been observed in the vertical migration of forest areas. This has been
observed to occur in the upper forest belt of Bosnian pine (Pinus heldreichii) and
Macedonian pine (Pinus peuce) where those forests are moving to the areas of alpine
pastures. In some areas, a vertical shift of forest vegetation between 50-100 meters has
been observed.
3. The high temperatures and heat waves that have invaded the country have led to
substantial damage of forests by massive forest fires. The frequency of fires and the
damage caused by them has increased in recent years. During the period 2011-2019,
about 760 forest fires were identified, burning an area of 337,800 ha of the Albanian
forests. The deforestation rate due to fires caused the 22% of forest area reduction over
12 years.
4. New pests and diseases are becoming more frequent and causing massive damages to
forest fund. Especially the forests of black pine, chestnut, plane, oaks, and box-tree are
suffering from the damages caused by diseases and pests. Thus, some of the diseases
and pests have appeared that were not previously in our forests are Box tree moth,
Chestnut gall wasp and plane trees canker stain. On the other hand, diseases and pests
have increased the rate of their spread and intensity of infection of forest trees (The Pine
processionary moth, Oak processionary moth, Box tree moth, Chestnut gall wasp,
Chestnut blight etc.). In total, it is estimated that the rate of forest impact by pests and
diseases is spread over an area of about 200,000 ha or 20% of the total forest area of
Albania.
Pastures and Meadows
After 1990, pastures in Albania are not actively maintained due to lacking human and financial
resources, resulting in changes in the vegetation and pasture degradation. Pastures at altitudes
1500-1800 m are turning to shrublands domination by Juniperus. Pastures at higher elevations,
above 1800 m do not show significant change.
The analyses of digital photographs show a decrease of cover vegetation at 5 % of the alpine
grasslands in Nemërçka Mt from 2004 to 201052. On the other hand, overgrazing of the alpine
pastures led to increased presence of thorny and pioneer species like Centaurea sp. Cirsium
sps. or so-called “resistant” species like Sesleria tenerrima etc. The same study refers that higher
presence of invasive and pioneer species that has changed the structure of alpine grasslands
mostly observed in Wide and Nemërçka Mts.
Climate change effects on pastures were evident since the late 1990s, more precisely since the
snowless winter of 1997. Since 1997, winters in Albania have become shorter and milder,
whereas summers have become longer and hotter. Droughts in summer and sometimes even in
autumn, and then sudden floods, have become more frequent. The climate change effects have
increased the number and the intensity of fires in Albania negatively affecting grassland and
pasture ecosystems.
Lagoons and Wetlands
Coastal lagoons are formed and maintained through sediment transport processes, which are
affected by climaticchanges. Sediments carried by rivers, waves, currents, wind, and tides
52Shuka L., Malo S., Vardhami I. (2011) : The impact of global warming in southern Albanian grassland ecosystems, Conference: International Conference of Ecosystems (ICE), 4-6 June 2011, Tirana, Albania https://www.researchgate.net/publication/283211420
Albania Revised NDC
51
accumulate in the river and tidal deltas, on marshes and flats where submerged aquatic
vegetation slows currents, and on wash over fans. The process of sedimentation which can
eventually fill in lagoons is interrupted in rivers such as Drini heavily affecting the sediments on
the Adriatic coast53. Therefore, lagoon barriers in Shengjin and Patok area are constantly eroded
by climate change related waves and wind, requiring continuous sediment deposition to maintain
them.
Water quantity and quality in the lagoons is influenced by the rate at which the lagoon loses or
gains water from evaporation, precipitation, groundwater input, surface runoff, and exchange with
the sea54. Lagoon–sea exchange is driven by tides and wave action and is often the largest
component of lagoon water balance55. Some of the lagoons such as Kune – Vain, Orikum have
almost lost communication with the sea as the most of communication channels are closed.
Rising temperatures lead to increased eutrophication and change in water quality and salinity.
There is observed and monitored change in the phytoplankton and zooplankton composition, as
well as an increase of alien species population such as the blue crab Callinectes sapidus,
competing will the local crab populations.
Strong human pressures and inappropriate management practices have significantly reduced the
natural system’s adaptability and resilience. Climate change is an added stress for wetlands and
will highly influence the nature and function of specific wetlands, in particular the hydrological
regime and the biodiversity. Climate change in combination with human-induced pressures is
likely to become increasingly important factor leading to wetlands degradation and loss.
Aquaculture and Fisheries
Albanian coast is part of the Mediterranean basin, which is warming 20% faster than the rest of
the globe as a whole56. Anticipated changes (increased sea surface temperature (SST) and
salinity, greater frequency of heat waves, sea-level rise, decrease in precipitation and changes in
oceanographic circulation57, are expected to have a strong impact on habitats and ecosystems in
general, and on fisheries and fisheries resources in particular. For instance, in the Adriatic Sea,
the sardine, mackerel and anchovy respond to salinity changes, which are modulated by the
climate oscillations, as described by the pressure differences between the mid-north Atlantic and
the southeast Mediterranean. This behaviour change can be attributed to ongoing climatic
changes, which change the migration patterns of pelagic fish in the Adriatic. Due to
meridionalization and tropicalization several non-native species started to appear along the
coasts of Albania during the last 2 decades. Those include blue fish, blue crab and silver-
cheeked toadfish.
53 Nichols, M.M.; Boon, J.D. (1994). Sediment transport processes in coastal lagoons, in: Kjerfve, B.
(Ed.) Coastal lagoon processes. Elsevier Oceanography Series, 60: pp. 157-219.
hdl.handle.net/10.1016/s0422-9894(08)70012-6 54 Abigail A. et al. (2009) : Coastal Lagoons and Climate Change: Ecological and Social Ramifications in U.S. Atlantic and Gulf Coast Ecosystems. www.researchgate.net/publication/263008875 55 Smith, N. P. 1994. Chapter 4. Water, salt, and heat balances of coastal lagoons. Pages 69-101 in B. Kjerfve, editor. Coastal lagoon processes. Elsevier, Amsterdam, The Netherlands 56 MedECC. 2020. 57 Hidalgo, M., Mihneva, V., Vasconcellos, M. and Bernal, M. 2018.
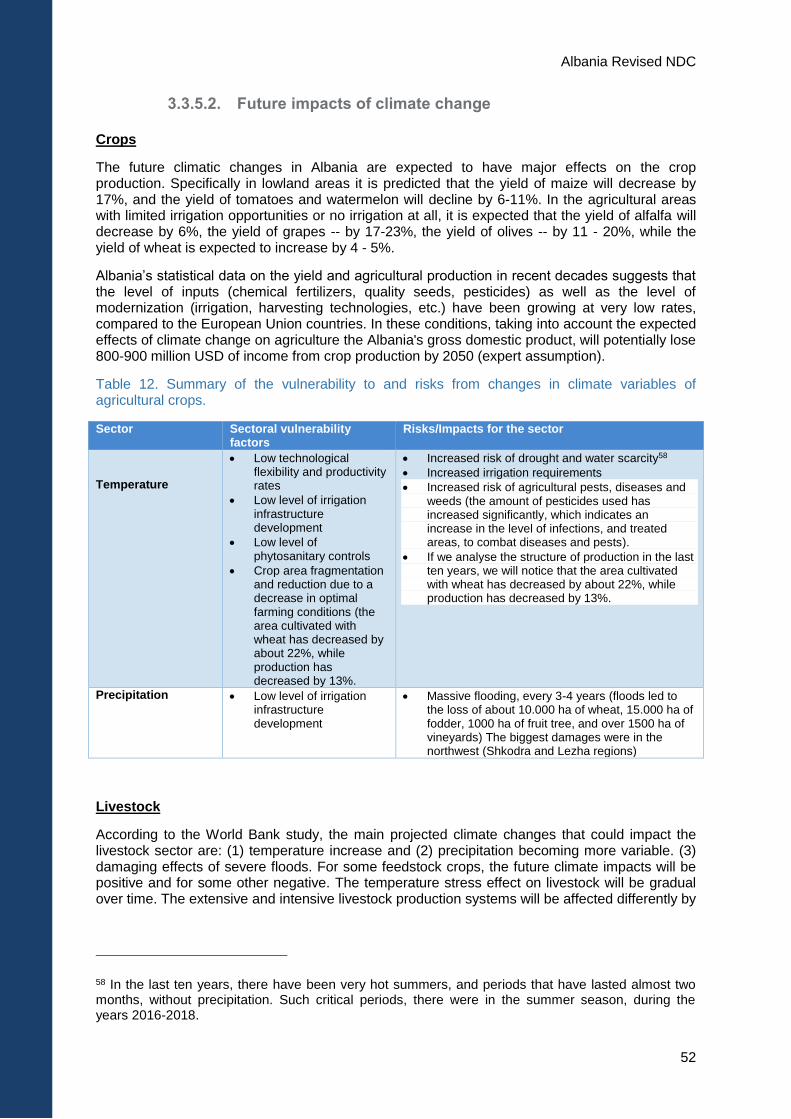
Albania Revised NDC
52
3.3.5.2. Future impacts of climate change
Crops
The future climatic changes in Albania are expected to have major effects on the crop production. Specifically in lowland areas it is predicted that the yield of maize will decrease by 17%, and the yield of tomatoes and watermelon will decline by 6-11%. In the agricultural areas with limited irrigation opportunities or no irrigation at all, it is expected that the yield of alfalfa will decrease by 6%, the yield of grapes -- by 17-23%, the yield of olives -- by 11 - 20%, while the yield of wheat is expected to increase by 4 - 5%.
Albania’s statistical data on the yield and agricultural production in recent decades suggests that the level of inputs (chemical fertilizers, quality seeds, pesticides) as well as the level of modernization (irrigation, harvesting technologies, etc.) have been growing at very low rates, compared to the European Union countries. In these conditions, taking into account the expected effects of climate change on agriculture the Albania's gross domestic product, will potentially lose 800-900 million USD of income from crop production by 2050 (expert assumption).
Table 12. Summary of the vulnerability to and risks from changes in climate variables of agricultural crops.
Sector Sectoral vulnerability factors
Risks/Impacts for the sector
Temperature
Low technological flexibility and productivity rates
Low level of irrigation infrastructure development
Low level of phytosanitary controls
Crop area fragmentation and reduction due to a decrease in optimal farming conditions (the area cultivated with wheat has decreased by about 22%, while production has decreased by 13%.
Increased risk of drought and water scarcity58
Increased irrigation requirements
Increased risk of agricultural pests, diseases and weeds (the amount of pesticides used has increased significantly, which indicates an increase in the level of infections, and treated areas, to combat diseases and pests).
If we analyse the structure of production in the last ten years, we will notice that the area cultivated with wheat has decreased by about 22%, while production has decreased by 13%.
Precipitation Low level of irrigation infrastructure development
Massive flooding, every 3-4 years (floods led to the loss of about 10.000 ha of wheat, 15.000 ha of fodder, 1000 ha of fruit tree, and over 1500 ha of vineyards) The biggest damages were in the northwest (Shkodra and Lezha regions)
Livestock
According to the World Bank study, the main projected climate changes that could impact the livestock sector are: (1) temperature increase and (2) precipitation becoming more variable. (3) damaging effects of severe floods. For some feedstock crops, the future climate impacts will be positive and for some other negative. The temperature stress effect on livestock will be gradual over time. The extensive and intensive livestock production systems will be affected differently by
58 In the last ten years, there have been very hot summers, and periods that have lasted almost two months, without precipitation. Such critical periods, there were in the summer season, during the years 2016-2018.
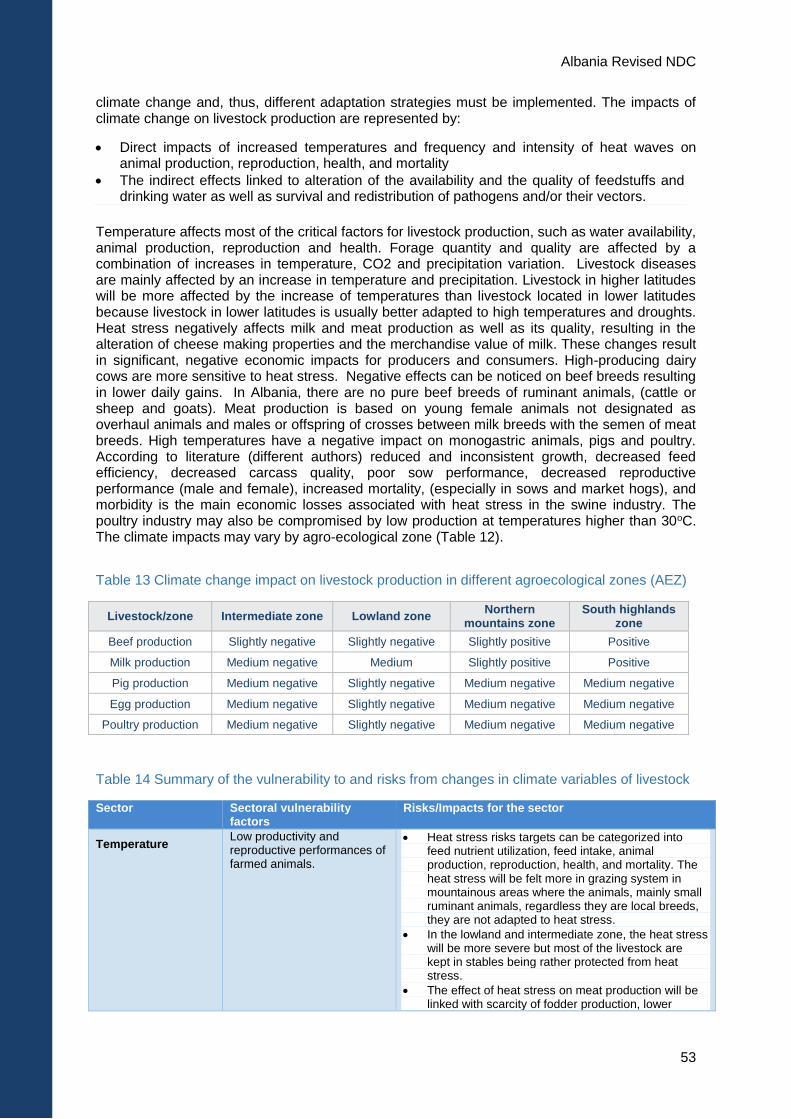
Albania Revised NDC
53
climate change and, thus, different adaptation strategies must be implemented. The impacts of climate change on livestock production are represented by:
Direct impacts of increased temperatures and frequency and intensity of heat waves on animal production, reproduction, health, and mortality
The indirect effects linked to alteration of the availability and the quality of feedstuffs and drinking water as well as survival and redistribution of pathogens and/or their vectors.
Temperature affects most of the critical factors for livestock production, such as water availability, animal production, reproduction and health. Forage quantity and quality are affected by a combination of increases in temperature, CO2 and precipitation variation. Livestock diseases are mainly affected by an increase in temperature and precipitation. Livestock in higher latitudes will be more affected by the increase of temperatures than livestock located in lower latitudes because livestock in lower latitudes is usually better adapted to high temperatures and droughts. Heat stress negatively affects milk and meat production as well as its quality, resulting in the alteration of cheese making properties and the merchandise value of milk. These changes result in significant, negative economic impacts for producers and consumers. High-producing dairy cows are more sensitive to heat stress. Negative effects can be noticed on beef breeds resulting in lower daily gains. In Albania, there are no pure beef breeds of ruminant animals, (cattle or sheep and goats). Meat production is based on young female animals not designated as overhaul animals and males or offspring of crosses between milk breeds with the semen of meat breeds. High temperatures have a negative impact on monogastric animals, pigs and poultry. According to literature (different authors) reduced and inconsistent growth, decreased feed efficiency, decreased carcass quality, poor sow performance, decreased reproductive performance (male and female), increased mortality, (especially in sows and market hogs), and morbidity is the main economic losses associated with heat stress in the swine industry. The poultry industry may also be compromised by low production at temperatures higher than 30oC. The climate impacts may vary by agro-ecological zone (Table 12).
Table 13 Climate change impact on livestock production in different agroecological zones (AEZ)
Livestock/zone Intermediate zone Lowland zone Northern
mountains zone South highlands
zone
Beef production Slightly negative Slightly negative Slightly positive Positive
Milk production Medium negative Medium Slightly positive Positive
Pig production Medium negative Slightly negative Medium negative Medium negative
Egg production Medium negative Slightly negative Medium negative Medium negative
Poultry production Medium negative Slightly negative Medium negative Medium negative
Table 14 Summary of the vulnerability to and risks from changes in climate variables of livestock
Sector Sectoral vulnerability factors
Risks/Impacts for the sector
Temperature Low productivity and reproductive performances of farmed animals.
Heat stress risks targets can be categorized into feed nutrient utilization, feed intake, animal production, reproduction, health, and mortality. The heat stress will be felt more in grazing system in mountainous areas where the animals, mainly small ruminant animals, regardless they are local breeds, they are not adapted to heat stress.
In the lowland and intermediate zone, the heat stress will be more severe but most of the livestock are kept in stables being rather protected from heat stress.
The effect of heat stress on meat production will be linked with scarcity of fodder production, lower
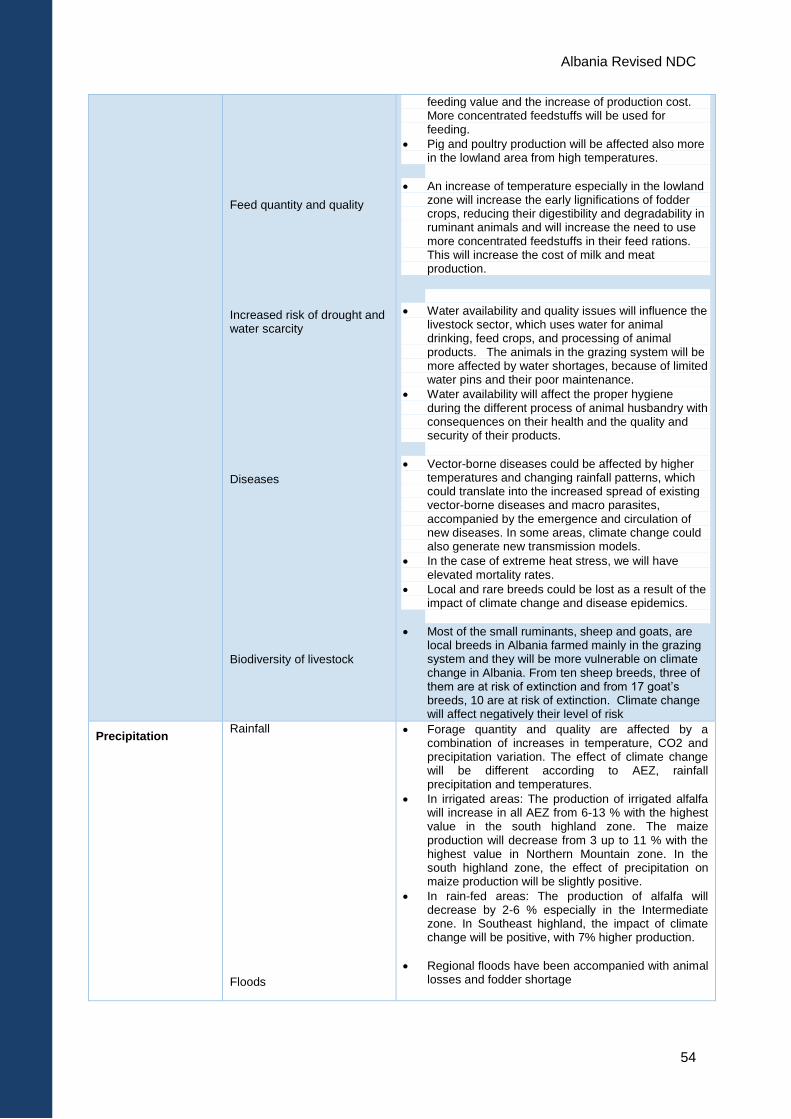
Albania Revised NDC
54
Feed quantity and quality
Increased risk of drought and water scarcity
Diseases
Biodiversity of livestock
feeding value and the increase of production cost. More concentrated feedstuffs will be used for feeding.
Pig and poultry production will be affected also more in the lowland area from high temperatures.
An increase of temperature especially in the lowland zone will increase the early lignifications of fodder crops, reducing their digestibility and degradability in ruminant animals and will increase the need to use more concentrated feedstuffs in their feed rations. This will increase the cost of milk and meat production.
Water availability and quality issues will influence the livestock sector, which uses water for animal drinking, feed crops, and processing of animal products. The animals in the grazing system will be more affected by water shortages, because of limited water pins and their poor maintenance.
Water availability will affect the proper hygiene during the different process of animal husbandry with consequences on their health and the quality and security of their products.
Vector-borne diseases could be affected by higher temperatures and changing rainfall patterns, which could translate into the increased spread of existing vector-borne diseases and macro parasites, accompanied by the emergence and circulation of new diseases. In some areas, climate change could also generate new transmission models.
In the case of extreme heat stress, we will have elevated mortality rates.
Local and rare breeds could be lost as a result of the impact of climate change and disease epidemics.
Most of the small ruminants, sheep and goats, are local breeds in Albania farmed mainly in the grazing system and they will be more vulnerable on climate change in Albania. From ten sheep breeds, three of them are at risk of extinction and from 17 goat’s breeds, 10 are at risk of extinction. Climate change will affect negatively their level of risk
Precipitation Rainfall
Floods
Forage quantity and quality are affected by a combination of increases in temperature, CO2 and precipitation variation. The effect of climate change will be different according to AEZ, rainfall precipitation and temperatures.
In irrigated areas: The production of irrigated alfalfa will increase in all AEZ from 6-13 % with the highest value in the south highland zone. The maize production will decrease from 3 up to 11 % with the highest value in Northern Mountain zone. In the south highland zone, the effect of precipitation on maize production will be slightly positive.
In rain-fed areas: The production of alfalfa will decrease by 2-6 % especially in the Intermediate zone. In Southeast highland, the impact of climate change will be positive, with 7% higher production.
Regional floods have been accompanied with animal losses and fodder shortage
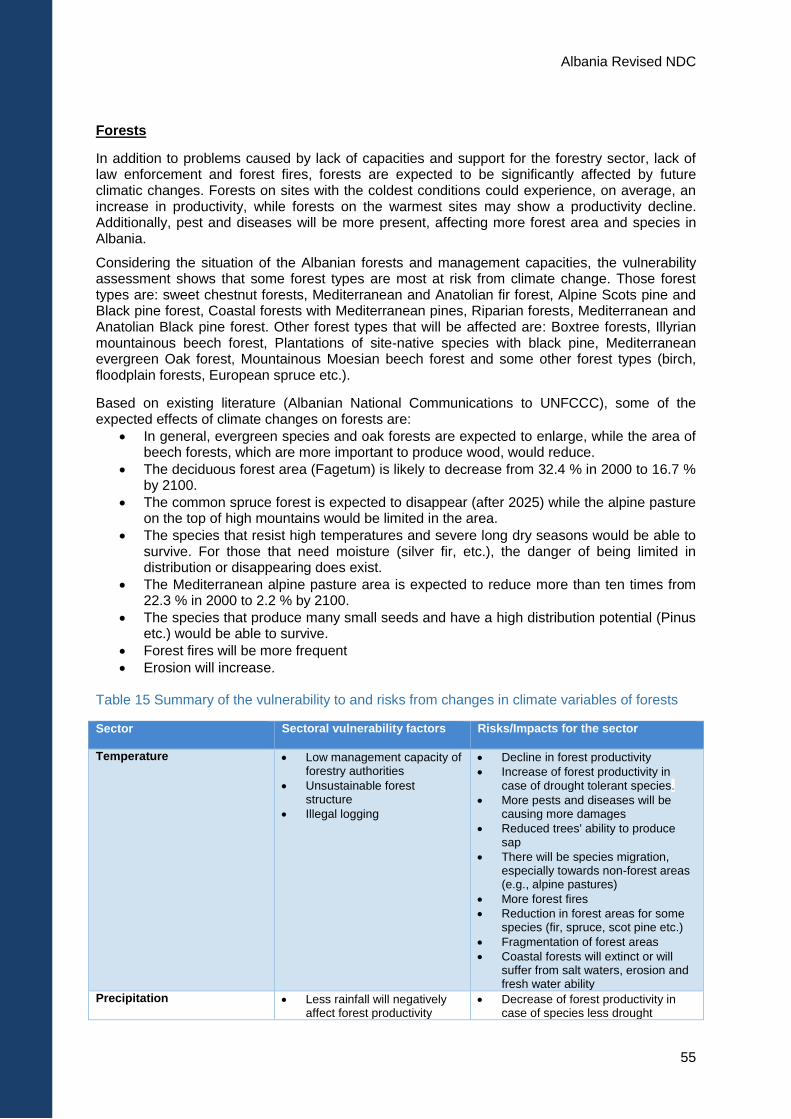
Albania Revised NDC
55
Forests
In addition to problems caused by lack of capacities and support for the forestry sector, lack of law enforcement and forest fires, forests are expected to be significantly affected by future climatic changes. Forests on sites with the coldest conditions could experience, on average, an increase in productivity, while forests on the warmest sites may show a productivity decline. Additionally, pest and diseases will be more present, affecting more forest area and species in Albania.
Considering the situation of the Albanian forests and management capacities, the vulnerability assessment shows that some forest types are most at risk from climate change. Those forest types are: sweet chestnut forests, Mediterranean and Anatolian fir forest, Alpine Scots pine and Black pine forest, Coastal forests with Mediterranean pines, Riparian forests, Mediterranean and Anatolian Black pine forest. Other forest types that will be affected are: Boxtree forests, Illyrian mountainous beech forest, Plantations of site-native species with black pine, Mediterranean evergreen Oak forest, Mountainous Moesian beech forest and some other forest types (birch, floodplain forests, European spruce etc.).
Based on existing literature (Albanian National Communications to UNFCCC), some of the expected effects of climate changes on forests are:
In general, evergreen species and oak forests are expected to enlarge, while the area of beech forests, which are more important to produce wood, would reduce.
The deciduous forest area (Fagetum) is likely to decrease from 32.4 % in 2000 to 16.7 % by 2100.
The common spruce forest is expected to disappear (after 2025) while the alpine pasture on the top of high mountains would be limited in the area.
The species that resist high temperatures and severe long dry seasons would be able to survive. For those that need moisture (silver fir, etc.), the danger of being limited in distribution or disappearing does exist.
The Mediterranean alpine pasture area is expected to reduce more than ten times from 22.3 % in 2000 to 2.2 % by 2100.
The species that produce many small seeds and have a high distribution potential (Pinus etc.) would be able to survive.
Forest fires will be more frequent
Erosion will increase. Table 15 Summary of the vulnerability to and risks from changes in climate variables of forests
Sector Sectoral vulnerability factors Risks/Impacts for the sector
Temperature Low management capacity of forestry authorities
Unsustainable forest structure
Illegal logging
Decline in forest productivity
Increase of forest productivity in case of drought tolerant species.
More pests and diseases will be causing more damages
Reduced trees' ability to produce sap
There will be species migration, especially towards non-forest areas (e.g., alpine pastures)
More forest fires
Reduction in forest areas for some species (fir, spruce, scot pine etc.)
Fragmentation of forest areas
Coastal forests will extinct or will suffer from salt waters, erosion and fresh water ability
Precipitation Less rainfall will negatively affect forest productivity
Decrease of forest productivity in case of species less drought
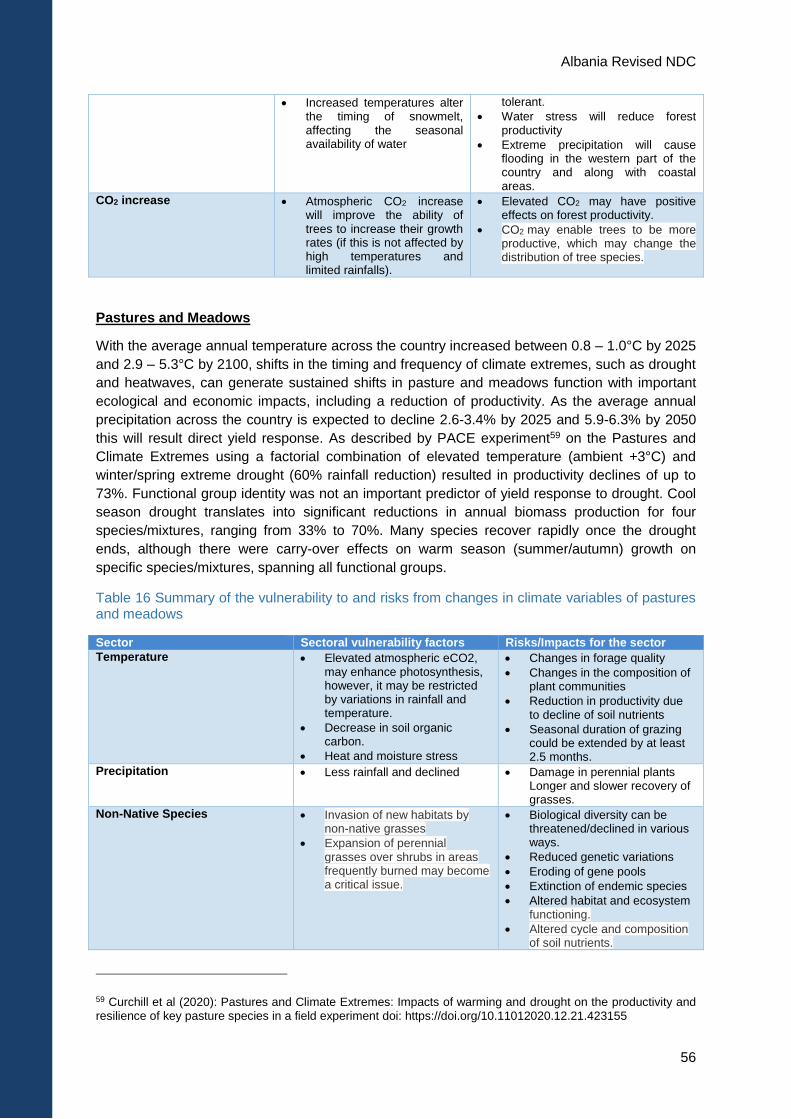
Albania Revised NDC
56
Increased temperatures alter the timing of snowmelt, affecting the seasonal availability of water
tolerant.
Water stress will reduce forest productivity
Extreme precipitation will cause flooding in the western part of the country and along with coastal areas.
CO2 increase Atmospheric CO2 increase will improve the ability of trees to increase their growth rates (if this is not affected by high temperatures and limited rainfalls).
Elevated CO2 may have positive effects on forest productivity.
CO2 may enable trees to be more productive, which may change the distribution of tree species.
Pastures and Meadows
With the average annual temperature across the country increased between 0.8 – 1.0°C by 2025
and 2.9 – 5.3°C by 2100, shifts in the timing and frequency of climate extremes, such as drought
and heatwaves, can generate sustained shifts in pasture and meadows function with important
ecological and economic impacts, including a reduction of productivity. As the average annual
precipitation across the country is expected to decline 2.6-3.4% by 2025 and 5.9-6.3% by 2050
this will result direct yield response. As described by PACE experiment59 on the Pastures and
Climate Extremes using a factorial combination of elevated temperature (ambient +3°C) and
winter/spring extreme drought (60% rainfall reduction) resulted in productivity declines of up to
73%. Functional group identity was not an important predictor of yield response to drought. Cool
season drought translates into significant reductions in annual biomass production for four
species/mixtures, ranging from 33% to 70%. Many species recover rapidly once the drought
ends, although there were carry-over effects on warm season (summer/autumn) growth on
specific species/mixtures, spanning all functional groups.
Table 16 Summary of the vulnerability to and risks from changes in climate variables of pastures and meadows
Sector Sectoral vulnerability factors Risks/Impacts for the sector
Temperature Elevated atmospheric eCO2, may enhance photosynthesis, however, it may be restricted by variations in rainfall and temperature.
Decrease in soil organic carbon.
Heat and moisture stress
Changes in forage quality
Changes in the composition of plant communities
Reduction in productivity due to decline of soil nutrients
Seasonal duration of grazing could be extended by at least 2.5 months.
Precipitation Less rainfall and declined Damage in perennial plants Longer and slower recovery of grasses.
Non-Native Species Invasion of new habitats by non-native grasses
Expansion of perennial grasses over shrubs in areas frequently burned may become a critical issue.
Biological diversity can be threatened/declined in various ways.
Reduced genetic variations
Eroding of gene pools
Extinction of endemic species
Altered habitat and ecosystem functioning.
Altered cycle and composition of soil nutrients.
59 Curchill et al (2020): Pastures and Climate Extremes: Impacts of warming and drought on the productivity and resilience of key pasture species in a field experiment doi: https://doi.org/10.11012020.12.21.423155
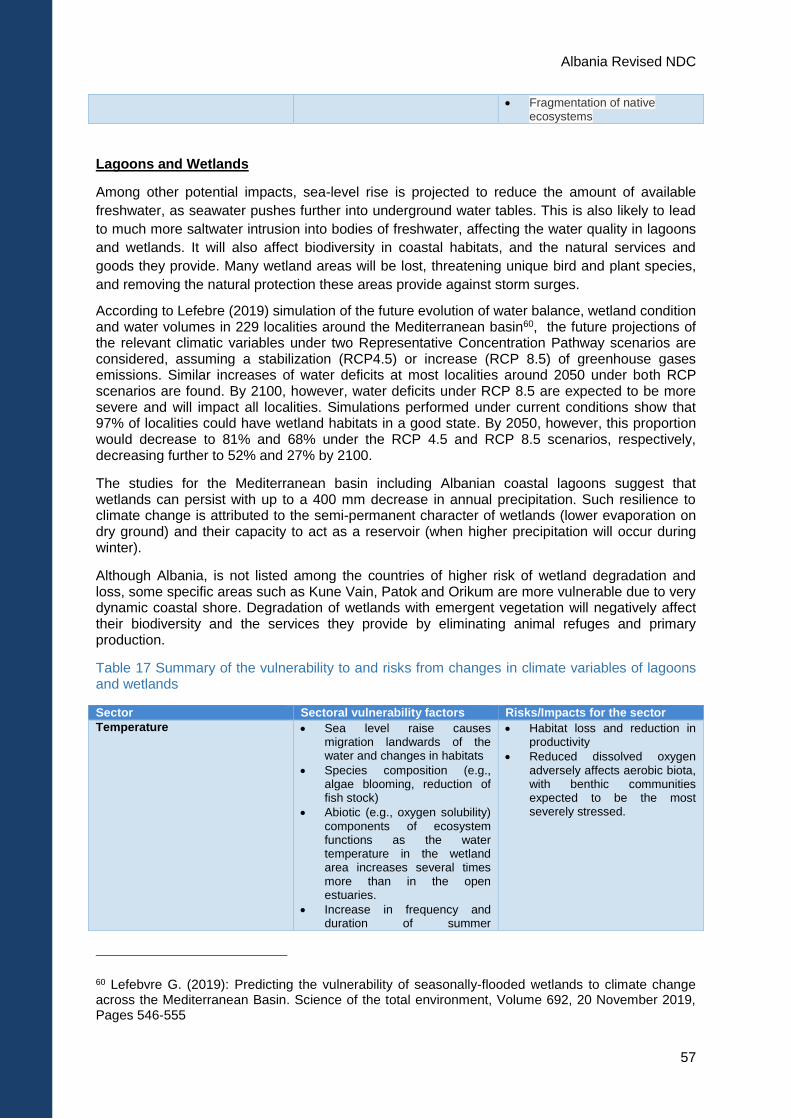
Albania Revised NDC
57
Fragmentation of native ecosystems
Lagoons and Wetlands
Among other potential impacts, sea-level rise is projected to reduce the amount of available
freshwater, as seawater pushes further into underground water tables. This is also likely to lead
to much more saltwater intrusion into bodies of freshwater, affecting the water quality in lagoons
and wetlands. It will also affect biodiversity in coastal habitats, and the natural services and
goods they provide. Many wetland areas will be lost, threatening unique bird and plant species,
and removing the natural protection these areas provide against storm surges.
According to Lefebre (2019) simulation of the future evolution of water balance, wetland condition and water volumes in 229 localities around the Mediterranean basin60, the future projections of the relevant climatic variables under two Representative Concentration Pathway scenarios are considered, assuming a stabilization (RCP4.5) or increase (RCP 8.5) of greenhouse gases emissions. Similar increases of water deficits at most localities around 2050 under both RCP scenarios are found. By 2100, however, water deficits under RCP 8.5 are expected to be more severe and will impact all localities. Simulations performed under current conditions show that 97% of localities could have wetland habitats in a good state. By 2050, however, this proportion would decrease to 81% and 68% under the RCP 4.5 and RCP 8.5 scenarios, respectively, decreasing further to 52% and 27% by 2100.
The studies for the Mediterranean basin including Albanian coastal lagoons suggest that wetlands can persist with up to a 400 mm decrease in annual precipitation. Such resilience to climate change is attributed to the semi-permanent character of wetlands (lower evaporation on dry ground) and their capacity to act as a reservoir (when higher precipitation will occur during winter).
Although Albania, is not listed among the countries of higher risk of wetland degradation and loss, some specific areas such as Kune Vain, Patok and Orikum are more vulnerable due to very dynamic coastal shore. Degradation of wetlands with emergent vegetation will negatively affect their biodiversity and the services they provide by eliminating animal refuges and primary production.
Table 17 Summary of the vulnerability to and risks from changes in climate variables of lagoons and wetlands
Sector Sectoral vulnerability factors Risks/Impacts for the sector
Temperature Sea level raise causes migration landwards of the water and changes in habitats
Species composition (e.g., algae blooming, reduction of fish stock)
Abiotic (e.g., oxygen solubility) components of ecosystem functions as the water temperature in the wetland area increases several times more than in the open estuaries.
Increase in frequency and duration of summer
Habitat loss and reduction in productivity
Reduced dissolved oxygen adversely affects aerobic biota, with benthic communities expected to be the most severely stressed.
60 Lefebvre G. (2019): Predicting the vulnerability of seasonally-flooded wetlands to climate change across the Mediterranean Basin. Science of the total environment, Volume 692, 20 November 2019, Pages 546-555
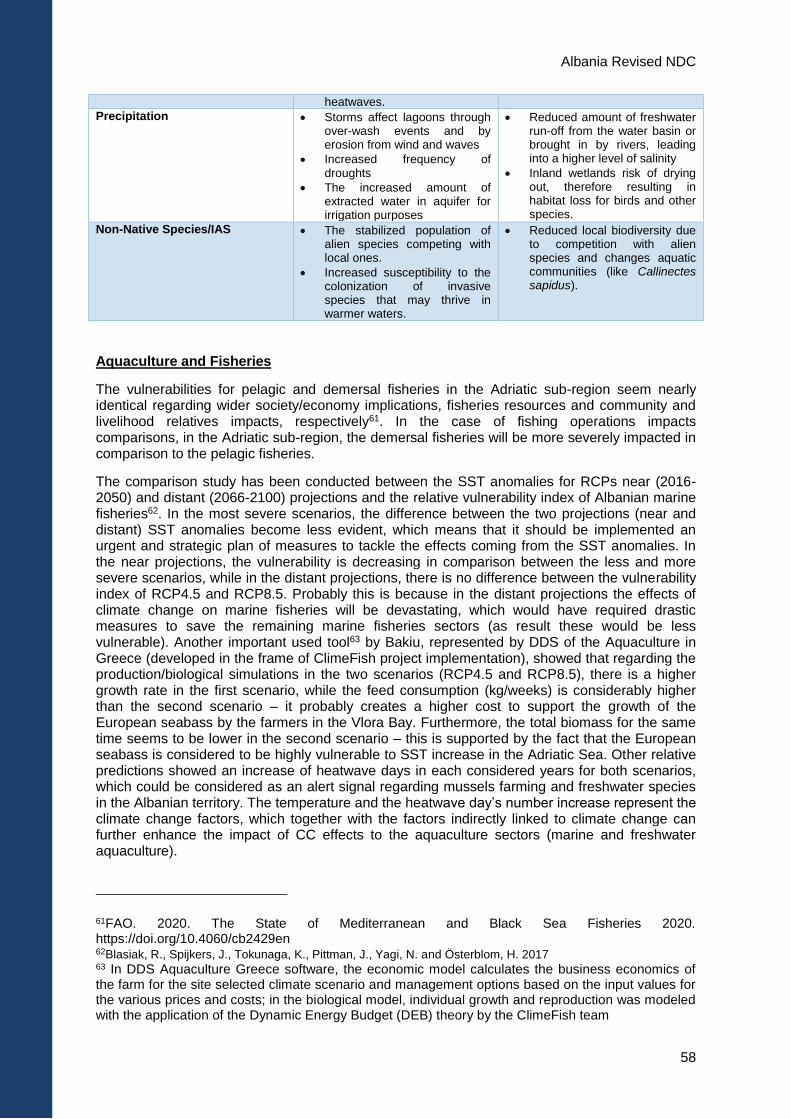
Albania Revised NDC
58
heatwaves.
Precipitation Storms affect lagoons through over-wash events and by erosion from wind and waves
Increased frequency of droughts
The increased amount of extracted water in aquifer for irrigation purposes
Reduced amount of freshwater run-off from the water basin or brought in by rivers, leading into a higher level of salinity
Inland wetlands risk of drying out, therefore resulting in habitat loss for birds and other species.
Non-Native Species/IAS The stabilized population of alien species competing with local ones.
Increased susceptibility to the colonization of invasive species that may thrive in warmer waters.
Reduced local biodiversity due to competition with alien species and changes aquatic communities (like Callinectes sapidus).
Aquaculture and Fisheries
The vulnerabilities for pelagic and demersal fisheries in the Adriatic sub-region seem nearly identical regarding wider society/economy implications, fisheries resources and community and livelihood relatives impacts, respectively61. In the case of fishing operations impacts comparisons, in the Adriatic sub-region, the demersal fisheries will be more severely impacted in comparison to the pelagic fisheries.
The comparison study has been conducted between the SST anomalies for RCPs near (2016-2050) and distant (2066-2100) projections and the relative vulnerability index of Albanian marine fisheries62. In the most severe scenarios, the difference between the two projections (near and distant) SST anomalies become less evident, which means that it should be implemented an urgent and strategic plan of measures to tackle the effects coming from the SST anomalies. In the near projections, the vulnerability is decreasing in comparison between the less and more severe scenarios, while in the distant projections, there is no difference between the vulnerability index of RCP4.5 and RCP8.5. Probably this is because in the distant projections the effects of climate change on marine fisheries will be devastating, which would have required drastic measures to save the remaining marine fisheries sectors (as result these would be less vulnerable). Another important used tool63 by Bakiu, represented by DDS of the Aquaculture in Greece (developed in the frame of ClimeFish project implementation), showed that regarding the production/biological simulations in the two scenarios (RCP4.5 and RCP8.5), there is a higher growth rate in the first scenario, while the feed consumption (kg/weeks) is considerably higher than the second scenario – it probably creates a higher cost to support the growth of the European seabass by the farmers in the Vlora Bay. Furthermore, the total biomass for the same time seems to be lower in the second scenario – this is supported by the fact that the European seabass is considered to be highly vulnerable to SST increase in the Adriatic Sea. Other relative predictions showed an increase of heatwave days in each considered years for both scenarios, which could be considered as an alert signal regarding mussels farming and freshwater species in the Albanian territory. The temperature and the heatwave day’s number increase represent the climate change factors, which together with the factors indirectly linked to climate change can further enhance the impact of CC effects to the aquaculture sectors (marine and freshwater aquaculture).
61FAO. 2020. The State of Mediterranean and Black Sea Fisheries 2020. https://doi.org/10.4060/cb2429en 62Blasiak, R., Spijkers, J., Tokunaga, K., Pittman, J., Yagi, N. and Österblom, H. 2017 63 In DDS Aquaculture Greece software, the economic model calculates the business economics of the farm for the site selected climate scenario and management options based on the input values for the various prices and costs; in the biological model, individual growth and reproduction was modeled with the application of the Dynamic Energy Budget (DEB) theory by the ClimeFish team
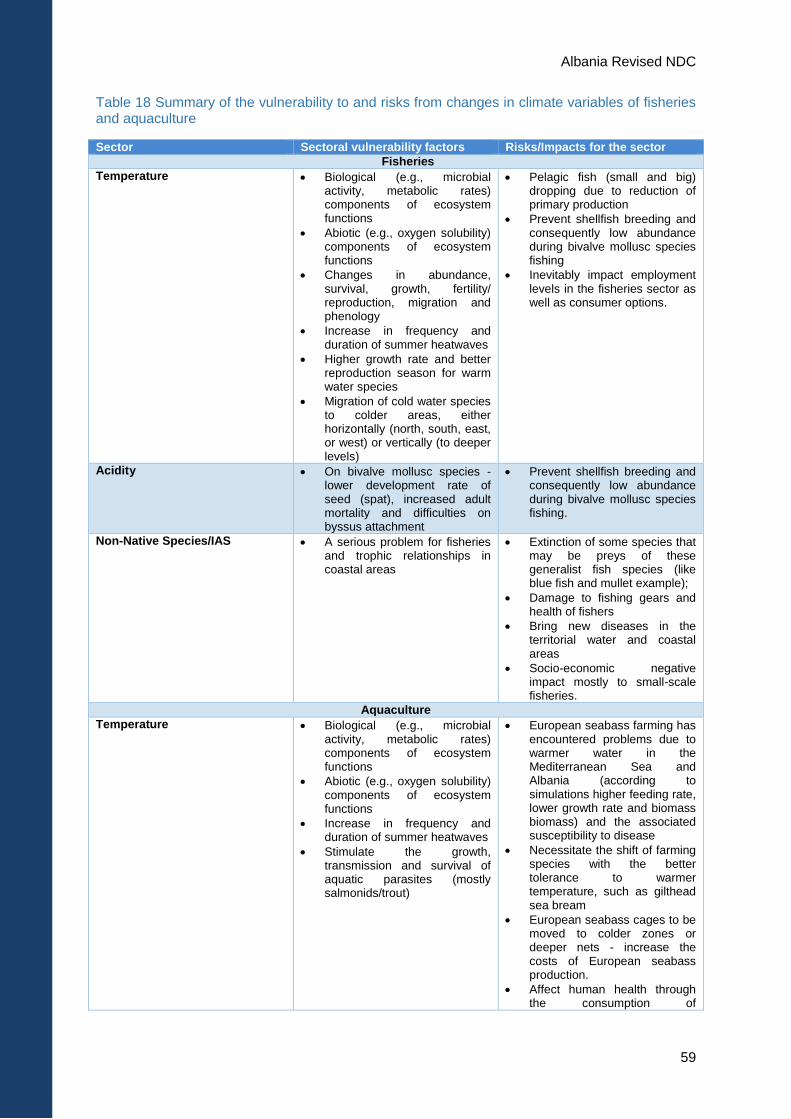
Albania Revised NDC
59
Table 18 Summary of the vulnerability to and risks from changes in climate variables of fisheries and aquaculture
Sector Sectoral vulnerability factors Risks/Impacts for the sector
Fisheries
Temperature Biological (e.g., microbial activity, metabolic rates) components of ecosystem functions
Abiotic (e.g., oxygen solubility) components of ecosystem functions
Changes in abundance, survival, growth, fertility/ reproduction, migration and phenology
Increase in frequency and duration of summer heatwaves
Higher growth rate and better reproduction season for warm water species
Migration of cold water species to colder areas, either horizontally (north, south, east, or west) or vertically (to deeper levels)
Pelagic fish (small and big) dropping due to reduction of primary production
Prevent shellfish breeding and consequently low abundance during bivalve mollusc species fishing
Inevitably impact employment levels in the fisheries sector as well as consumer options.
Acidity On bivalve mollusc species - lower development rate of seed (spat), increased adult mortality and difficulties on byssus attachment
Prevent shellfish breeding and consequently low abundance during bivalve mollusc species fishing.
Non-Native Species/IAS A serious problem for fisheries and trophic relationships in coastal areas
Extinction of some species that may be preys of these generalist fish species (like blue fish and mullet example);
Damage to fishing gears and health of fishers
Bring new diseases in the territorial water and coastal areas
Socio-economic negative impact mostly to small-scale fisheries.
Aquaculture
Temperature Biological (e.g., microbial activity, metabolic rates) components of ecosystem functions
Abiotic (e.g., oxygen solubility) components of ecosystem functions
Increase in frequency and duration of summer heatwaves
Stimulate the growth, transmission and survival of aquatic parasites (mostly salmonids/trout)
European seabass farming has encountered problems due to warmer water in the Mediterranean Sea and Albania (according to simulations higher feeding rate, lower growth rate and biomass biomass) and the associated susceptibility to disease
Necessitate the shift of farming species with the better tolerance to warmer temperature, such as gilthead sea bream
European seabass cages to be moved to colder zones or deeper nets - increase the costs of European seabass production.
Affect human health through the consumption of
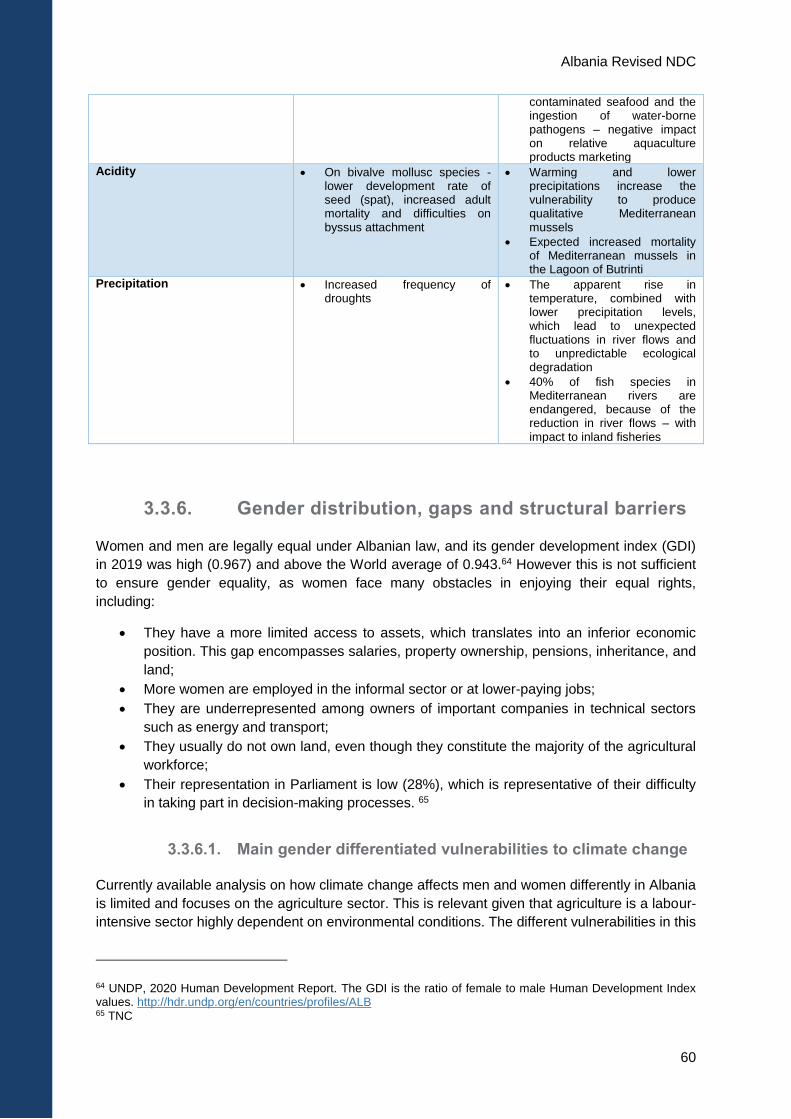
Albania Revised NDC
60
contaminated seafood and the ingestion of water-borne pathogens – negative impact on relative aquaculture products marketing
Acidity On bivalve mollusc species - lower development rate of seed (spat), increased adult mortality and difficulties on byssus attachment
Warming and lower precipitations increase the vulnerability to produce qualitative Mediterranean mussels
Expected increased mortality of Mediterranean mussels in the Lagoon of Butrinti
Precipitation Increased frequency of droughts
The apparent rise in temperature, combined with lower precipitation levels, which lead to unexpected fluctuations in river flows and to unpredictable ecological degradation
40% of fish species in Mediterranean rivers are endangered, because of the reduction in river flows – with impact to inland fisheries
3.3.6. Gender distribution, gaps and structural barriers
Women and men are legally equal under Albanian law, and its gender development index (GDI)
in 2019 was high (0.967) and above the World average of 0.943.64 However this is not sufficient
to ensure gender equality, as women face many obstacles in enjoying their equal rights,
including:
They have a more limited access to assets, which translates into an inferior economic
position. This gap encompasses salaries, property ownership, pensions, inheritance, and
land;
More women are employed in the informal sector or at lower-paying jobs;
They are underrepresented among owners of important companies in technical sectors
such as energy and transport;
They usually do not own land, even though they constitute the majority of the agricultural
workforce;
Their representation in Parliament is low (28%), which is representative of their difficulty
in taking part in decision-making processes. 65
3.3.6.1. Main gender differentiated vulnerabilities to climate change
Currently available analysis on how climate change affects men and women differently in Albania
is limited and focuses on the agriculture sector. This is relevant given that agriculture is a labour-
intensive sector highly dependent on environmental conditions. The different vulnerabilities in this
64 UNDP, 2020 Human Development Report. The GDI is the ratio of female to male Human Development Index values. http://hdr.undp.org/en/countries/profiles/ALB 65 TNC
Albania Revised NDC
61
sector depend to a large extent on the differentiated roles of women and men in the agricultural
value chain.
According to a survey conducted for the Fourth National Communication (4NC), 39% of
respondents believe there are differences in men’s and women’s ability to react to climate
change, and among them, 53% believe men are more able to address climate change
challenges.66
Lives
Following the 2015 floods in the Southeast of the country, UN Women documented the following
consequences of floods on women:
Increase of the workload by four hours on average, to clean up and due to lack of energy
supply
Increase in violence against women, both domestic and outside the home, with women
heads of households facing a greater risk
Decreased income
Loss of access to services that helped alleviate women’s workload (e.g., kindergarten,
schools, etc.)67
The increase in violence against women and that of time use for main household chores were
also identified as the main impacts of climate change on women’s living conditions in the FNC
survey. The survey does not identify significant gender differences regarding the effects of
increased conflicts in settlements or in reactions of hopelessness and sense of loss.68 They
survey also identified significant differences in access to information about adaptation to climate
change.69
Health
According to the 4NC survey, women reported a more significant increase in health, physical and
emotional problems than men following climate-related disasters. This is reported to intersect
with ethnicity and location (especially in areas with more vulnerable populations), poverty or
migration status.
Exposure to high temperatures has adverse effects on pregnant women (teratogenic effect).
Following floods, they can develop bronchitis or infections as they cleanup damp houses.
Pregnant women are disproportionately more affected by healthcare access disruption following
a disaster.
Energy
No studies are available on the effects of climate change on gender in the energy sector in
Albania. According to UN Women, it is very likely that energy supply, use and consumption affect
men and women differently, and intersects with factors such as location, age and financial status.
Energy is considered to be a male topic, but household management is a women responsibility.70
66 Zhllima.E, Draft report on Climate change and gender equality, 4NC, 2020. 67 UN Women, The Gender Impact of the 2015 February Floods in Southeast Albania, 2016 68 Zhllima.E, Draft report on Climate change and gender equality, 4NC, 2020. NC 70 UN Women & UNDP (2016). Gender Brief Albania 2016. Prepared by Monika Kocaqi, Ani Plaku and Dolly Wittberger. UN Women, Albania.

Albania Revised NDC
62
Energy poverty may thus be worsened by climate change, as it affects energy consumption,
means of heating, health and overall quality of life, including during winter, all topics typically
falling under women’s purview.
3.3.6.2. Overview of measures and barriers
Albania has signed a number of international binding and non-binding commitments with regards
to addressing gender equality:
Table 19. Albania’s international obligations with regards to gender equality
Binding obligations Non-binding obligations
Council of Europe’s 2011 Convention on Preventing and Combating Violence against Women and Domestic Violence (“The Istanbul Convention”)
Convention on the Elimination of all Forms of Discrimination against Women (CeDaW)
UNFCCC
Beijing Platform for action
Kyoto Protocol
Copenhagen Accord
Paris Agreement,
2030 Agenda for Sustainable Development (SDGs)
The country has taken initial steps to mainstream gender in its climate change policies and
programs. This included guidelines on mainstreaming gender in climate change mitigation and
adaptation programs and plans in the 4NC. However, this has not been reflected in any of the
recent climate-related policies and laws, none of which systematically address gender issues.
This includes:
The Cross-Sector Strategy on Environment 2013-2020
The Intended National Determined Contribution to the global efforts for GHG emission
reduction (DCM No. 762 of 16.09.2015)
National Strategy on Climate Change (NSCC) and its two annexes, the National Action
Plan on Mitigation (NAPM) and the National Adaptation Plan (NAP) (DCM 466, date
3.07.2019)
National Integrated Energy and Climate strategy, as an engagement of the Republic of
Albania at the Ministerial Meeting of the Energy Community (Dec 2017).
Law "On climate change" on (DCM No.499, date 17.07. 2019).
Law no. 45/2019 "On civil protection" approved on 18/07/2019.
Neither do gender-related strategies, such as the Third National Strategy on Gender Equality
(NSGE) and its Action Plan 2016-2020, consider climate change issues. In contrast, climate
change is identified in five Municipal Council’s Gender Equity Local Action Plans 2018-2020.71
Progress is hindered by the limited availability of data. Only a few studies on the effects of
climate change on gender in Albania are available, and most focus on the agriculture sector.
Disaster Risk Management and Environment, Energy Poverty and Climate Change were
identified by UN Women as largely undocumented gender issues.72 The Albanian Institute of
Statistics (INSTAT) has increased the use of gender indicators and added gender equality
sections to some of its reports. Only a few ministries collect gender disaggregated data on issues
related to climate change. This includes the Ministry of Agriculture and Rural Development
71 Zhllima.E, Draft report on Climate change and gender equality, 4NC, 2020., 2020. 72 UN Women & UNDP (2016). Gender Brief Albania 2016. Prepared by Monika Kocaqi, Ani Plaku and Dolly Wittberger. UN Women, Albania.
Albania Revised NDC
63
(MARD) and its Agriculture and Rural Development Agency (ARDA) but not the Civil Protection
Units. Uptake is greater at local level, where municipalities are establishing gender indicators in
their budget monitoring systems.
The limited presence of women in key decision-making spheres is also a barrier to progress on
this issue.
On the other hand, the 4NC identifies four driving forces for change:
The various conventions ratified
The existence of national binding rules for updating the majority of strategies related to
gender equality
The pressure of the Albanian Government to align to requirements brought by the
European Integration process
The education system
Section 4.4 includes the four objectives identified in the Gender Action Plan included in the 4NC.
3.4. Adaptation measures
3.4.1. Overview of adaptation measures
Albania has developed and implemented a large number of adaptation related policies,
strategies, plans, programmes, project and actions. Among others, the country has identified
priority adaptation actions in the National Strategy on Development and Integration 2015-2020,
the Third National Communication, the National Climate Change Policy and the NSCC and its
National Adaptation Plan, the Adaptation Plan for Tirana, the national tourism strategy 2019-
2023, the national forest policy 2019-2030, the integrated cross-sectoral plan of Tirana-Durres
area and the Green Climate Fund Country Programme that was developed in a participatory
manner based on the previous documents. These documents identify a very large number of
adaptation actions. These are categorized and summarized in tables below73. In tune with the
Paris Agreement’s adaptation objectives, these actions will enhance adaptive capacity,
strengthen resilience and reduce vulnerability to climate change, with a view to contributing to
sustainable development and ensuring an adequate adaptation response in the context of the
temperature goal referred to in Article 2 of the Paris agreement.
73 To develop this table, three steps were followed. In the first step, for each sector (settlements, population and tourism) a list of actions was produced including all the actions indicated in the above-mentioned documents, presenting these actions exactly as they were presented in those documents. This resulted in very long lists (121 actions for settlements, 90 for tourism and 85 for populations) with a lot of duplication and some actions that were too general. In the second step, i) broad adaptation categories were defined taking into account a taxonomy that has been widely used internationally, and ii) actions were arranged per sector according to these broad categories. These involved merging and reformulating some of the actions that were included in the lists produced in step 3. The second step produced shorter list of actions for each sector. In the third step, the sector lists were triangulated to produce the table presented in this document. It is worth noting that given the cross-sectoral nature of coastal settlements and populations and the strong links between these sectors and between them and the coastal tourism the sector lists were very similar to each other, with significant coincidences (sometimes only the order changed).
Albania Revised NDC
64
3.4.2. Prioritization of adaptation measures
Considering that all the actions identified have significant potential to contribute to adaptation in
Albania's coastal area, the prioritization exercise focused on two main aspects, namely:
Co-benefit potential of the actions, which refers to the probability and the extent to which
said actions can also generate (i) socio-economic development and (ii) mitigation
benefits.
Ease of implementation, which seeks to identify actions whose implementation is easier
to achieve. This aspect considers the complexity of (i) the institutional and (ii) technical
requirements and (iii) the magnitude of costs (financial aspects) as inversely proportional
to the ease of implementation, i.e., a very expensive measure is less “easy to implement”
considering that a large budget needs to be mobilized. Feasibility was not analysed as all
of the actions are considered both feasible and necessary.
Each sub-category was rated as “low”, “medium” or “high”, and ratings were weighted and
cumulated, leading to an overall priority rating.74 Detailed ratings are available in Annex 2.
Adaptation
Several measures related to policy and governance are rated as very high, largely due to their
potential important development co-benefits and limited technical complexity and costs. These
include developing sectoral adaptation plans and disaster risk management plans as well as
mainstreaming adaptation into spatial/territorial and sectoral planning and legislation. Measures
pertaining to enhancing technical capacity and awareness raising also have a very high priority
as they have important co-benefits and are simple to implement.
All measures pertaining to adapting the supporting natural environment are considered as having
very high priority, given the extent of both mitigation and development co-benefits they could
generate, and their limited institutional complexity and relatively low costs. Water and energy
efficiency, and rainwater harvesting are the measures to prioritize in terms of adaptation of the
supporting built environment. All measures related to promoting gender equality in relation to
adaptation should also be considered as having very high priority. Gender-related measures are
meant to be structuring in the sense that they are meant to ensure gender is mainstreamed
across all the other measures, including for example sectoral adaptation plans.
Several measures that are very important for adaptation, such as those related to generating
scientific evidence in support of decision-making, to climate-proofing infrastructure, or to disaster
risk management are not highlighted as having a “very high priority” mainly due to their high
technical complexity and costs.
It is important to highlight that while this prioritization exercise highlights the “low hanging fruits”
in terms of adaptation, that can be enacted rapidly and can generate multiple benefits, Albania
acknowledges the importance of planning, budgeting for and implementing more complex, costly
and specific adaptation measures as well.
74 The weights for co-benefits are 0.8 for development and 0.2 for mitigation. For ease of implementation, weights are 0.3 for institutional, 0.3 for technical, and 0.4 for financial. For each category, ratings of low, medium or high were associated respectively with 1, 2 or 3 points. The total weights equally consider the co-benefits and the ease of implementation criteria. The final priority level identifies as “Very high” the actions with a rating of >4.5 points, as High those with 4.5>x>4.0, and with Medium priorities those with a rating <4.0 (the maximum number of points an action could get is 6).

Albania Revised NDC
65
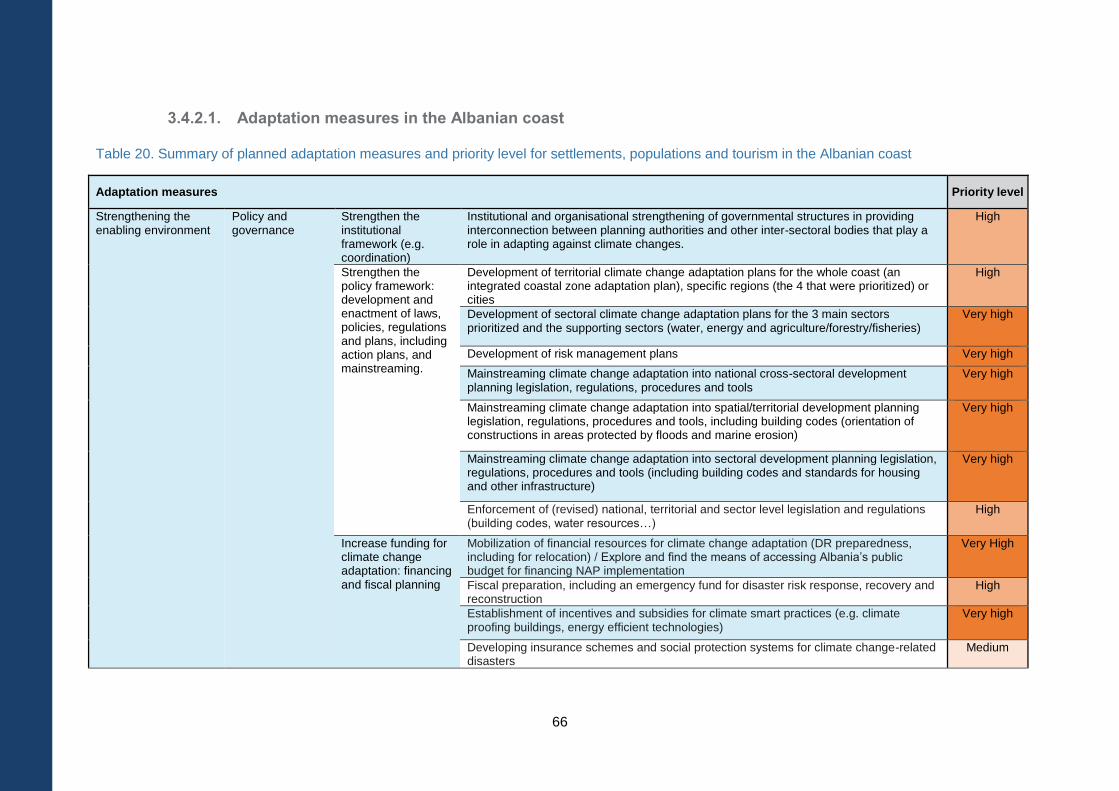
66
3.4.2.1. Adaptation measures in the Albanian coast
Table 20. Summary of planned adaptation measures and priority level for settlements, populations and tourism in the Albanian coast
Adaptation measures Priority level
Strengthening the enabling environment
Policy and governance
Strengthen the institutional framework (e.g. coordination)
Institutional and organisational strengthening of governmental structures in providing interconnection between planning authorities and other inter-sectoral bodies that play a role in adapting against climate changes.
High
Strengthen the policy framework: development and enactment of laws, policies, regulations and plans, including action plans, and mainstreaming.
Development of territorial climate change adaptation plans for the whole coast (an integrated coastal zone adaptation plan), specific regions (the 4 that were prioritized) or cities
High
Development of sectoral climate change adaptation plans for the 3 main sectors prioritized and the supporting sectors (water, energy and agriculture/forestry/fisheries)
Very high
Development of risk management plans Very high
Mainstreaming climate change adaptation into national cross-sectoral development planning legislation, regulations, procedures and tools
Very high
Mainstreaming climate change adaptation into spatial/territorial development planning legislation, regulations, procedures and tools, including building codes (orientation of constructions in areas protected by floods and marine erosion)
Very high
Mainstreaming climate change adaptation into sectoral development planning legislation, regulations, procedures and tools (including building codes and standards for housing and other infrastructure)
Very high
Enforcement of (revised) national, territorial and sector level legislation and regulations (building codes, water resources…)
High
Increase funding for climate change adaptation: financing and fiscal planning
Mobilization of financial resources for climate change adaptation (DR preparedness, including for relocation) / Explore and find the means of accessing Albania’s public budget for financing NAP implementation
Very High
Fiscal preparation, including an emergency fund for disaster risk response, recovery and reconstruction
High
Establishment of incentives and subsidies for climate smart practices (e.g. climate proofing buildings, energy efficient technologies)
Very high
Developing insurance schemes and social protection systems for climate change-related disasters
Medium
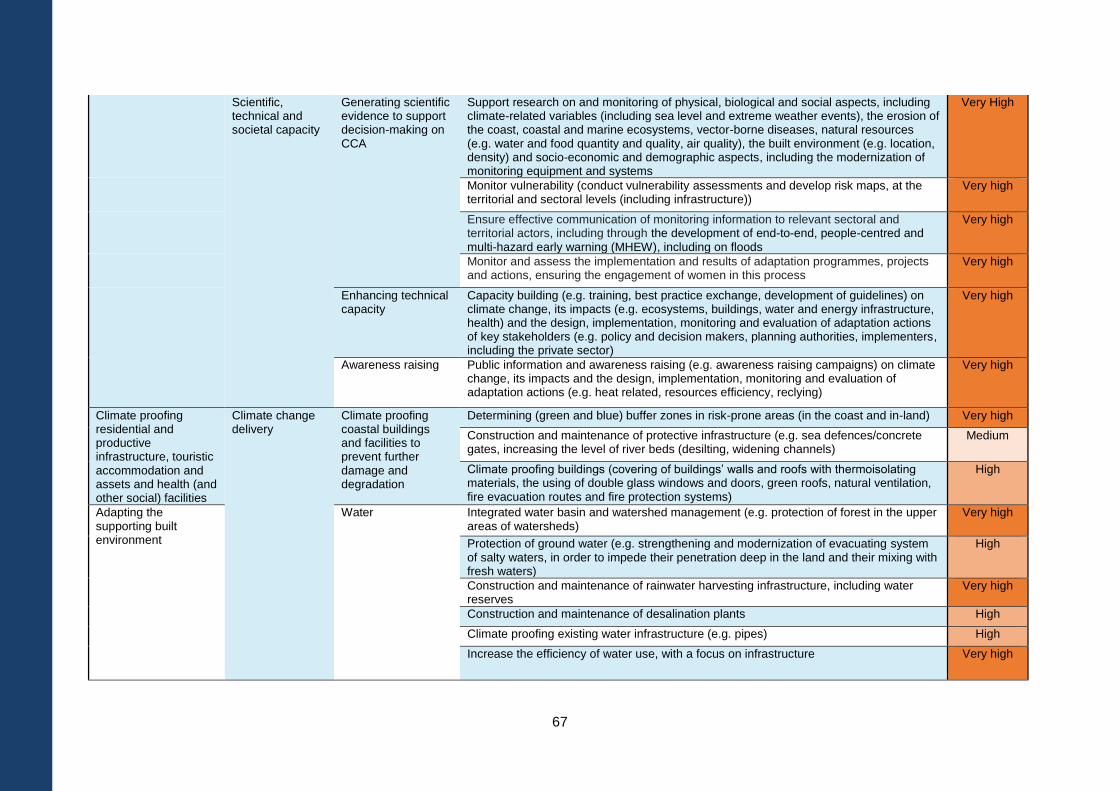
67
Scientific, technical and societal capacity
Generating scientific evidence to support decision-making on CCA
Support research on and monitoring of physical, biological and social aspects, including climate-related variables (including sea level and extreme weather events), the erosion of the coast, coastal and marine ecosystems, vector-borne diseases, natural resources (e.g. water and food quantity and quality, air quality), the built environment (e.g. location, density) and socio-economic and demographic aspects, including the modernization of monitoring equipment and systems
Very High
Monitor vulnerability (conduct vulnerability assessments and develop risk maps, at the territorial and sectoral levels (including infrastructure))
Very high
Ensure effective communication of monitoring information to relevant sectoral and territorial actors, including through the development of end-to-end, people-centred and multi-hazard early warning (MHEW), including on floods
Very high
Monitor and assess the implementation and results of adaptation programmes, projects and actions, ensuring the engagement of women in this process
Very high
Enhancing technical capacity
Capacity building (e.g. training, best practice exchange, development of guidelines) on climate change, its impacts (e.g. ecosystems, buildings, water and energy infrastructure, health) and the design, implementation, monitoring and evaluation of adaptation actions of key stakeholders (e.g. policy and decision makers, planning authorities, implementers, including the private sector)
Very high
Awareness raising Public information and awareness raising (e.g. awareness raising campaigns) on climate change, its impacts and the design, implementation, monitoring and evaluation of adaptation actions (e.g. heat related, resources efficiency, reclying)
Very high
Climate proofing residential and productive infrastructure, touristic accommodation and assets and health (and other social) facilities
Climate change delivery
Climate proofing coastal buildings and facilities to prevent further damage and degradation
Determining (green and blue) buffer zones in risk-prone areas (in the coast and in-land) Very high
Construction and maintenance of protective infrastructure (e.g. sea defences/concrete gates, increasing the level of river beds (desilting, widening channels)
Medium
Climate proofing buildings (covering of buildings’ walls and roofs with thermoisolating materials, the using of double glass windows and doors, green roofs, natural ventilation, fire evacuation routes and fire protection systems)
High
Adapting the supporting built environment
Water Integrated water basin and watershed management (e.g. protection of forest in the upper areas of watersheds)
Very high
Protection of ground water (e.g. strengthening and modernization of evacuating system of salty waters, in order to impede their penetration deep in the land and their mixing with fresh waters)
High
Construction and maintenance of rainwater harvesting infrastructure, including water reserves
Very high
Construction and maintenance of desalination plants High
Climate proofing existing water infrastructure (e.g. pipes) High
Increase the efficiency of water use, with a focus on infrastructure Very high
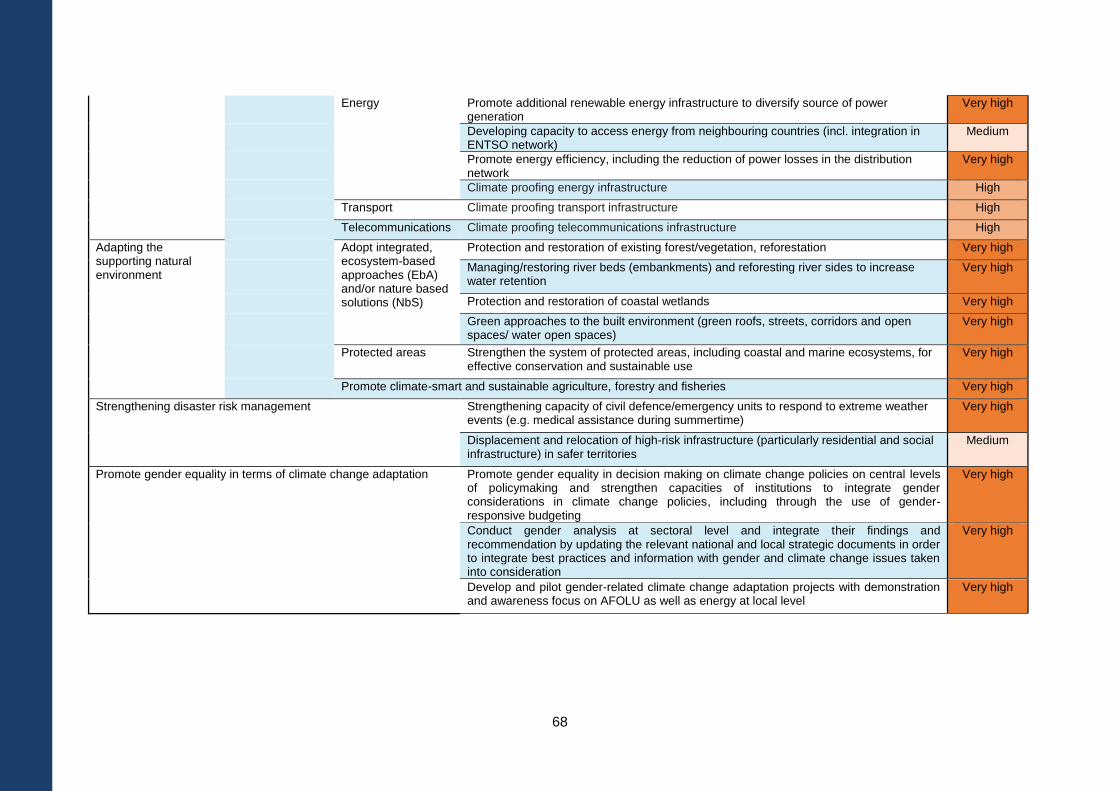
68
Energy Promote additional renewable energy infrastructure to diversify source of power generation
Very high
Developing capacity to access energy from neighbouring countries (incl. integration in ENTSO network)
Medium
Promote energy efficiency, including the reduction of power losses in the distribution network
Very high
Climate proofing energy infrastructure High
Transport Climate proofing transport infrastructure High
Telecommunications Climate proofing telecommunications infrastructure High
Adapting the supporting natural environment
Adopt integrated, ecosystem-based approaches (EbA) and/or nature based solutions (NbS)
Protection and restoration of existing forest/vegetation, reforestation Very high
Managing/restoring river beds (embankments) and reforesting river sides to increase water retention
Very high
Protection and restoration of coastal wetlands Very high
Green approaches to the built environment (green roofs, streets, corridors and open spaces/ water open spaces)
Very high
Protected areas Strengthen the system of protected areas, including coastal and marine ecosystems, for effective conservation and sustainable use
Very high
Promote climate-smart and sustainable agriculture, forestry and fisheries Very high
Strengthening disaster risk management Strengthening capacity of civil defence/emergency units to respond to extreme weather events (e.g. medical assistance during summertime)
Very high
Displacement and relocation of high-risk infrastructure (particularly residential and social infrastructure) in safer territories
Medium
Promote gender equality in terms of climate change adaptation Promote gender equality in decision making on climate change policies on central levels of policymaking and strengthen capacities of institutions to integrate gender considerations in climate change policies, including through the use of gender-responsive budgeting
Very high
Conduct gender analysis at sectoral level and integrate their findings and recommendation by updating the relevant national and local strategic documents in order to integrate best practices and information with gender and climate change issues taken into consideration
Very high
Develop and pilot gender-related climate change adaptation projects with demonstration and awareness focus on AFOLU as well as energy at local level
Very high
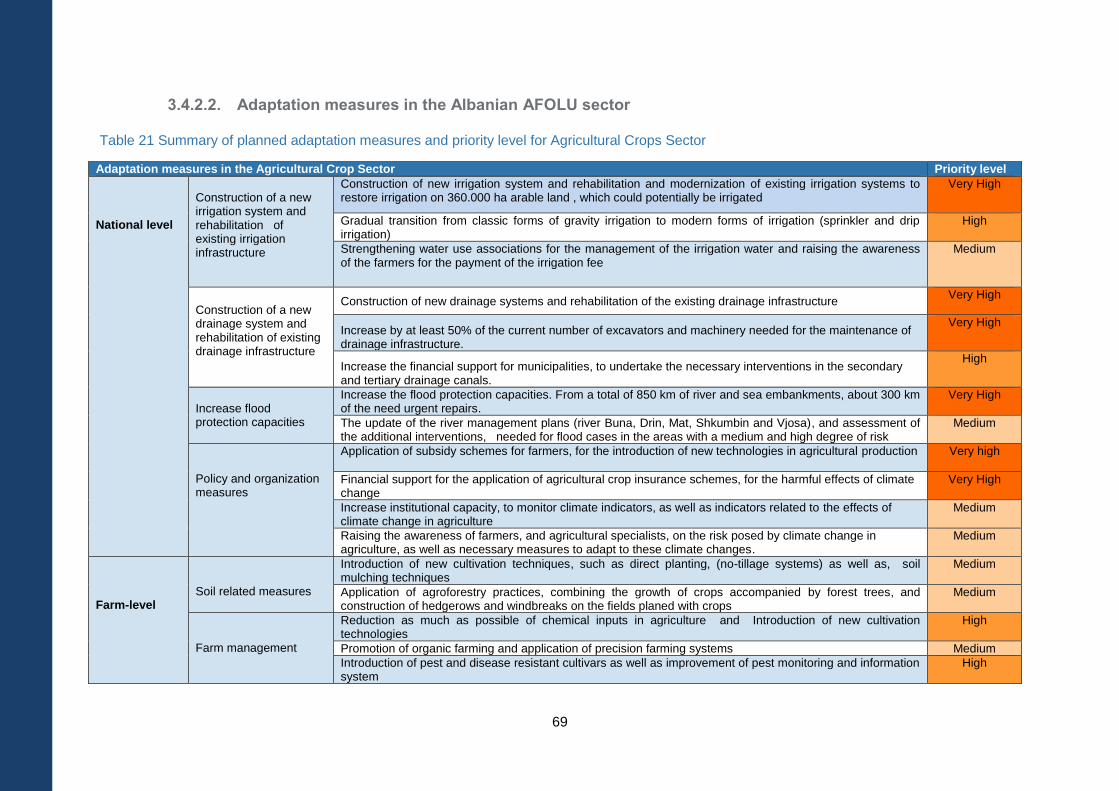
69
3.4.2.2. Adaptation measures in the Albanian AFOLU sector
Table 21 Summary of planned adaptation measures and priority level for Agricultural Crops Sector
Adaptation measures in the Agricultural Crop Sector Priority level
National level
Construction of a new irrigation system and rehabilitation of existing irrigation infrastructure
Construction of new irrigation system and rehabilitation and modernization of existing irrigation systems to restore irrigation on 360.000 ha arable land , which could potentially be irrigated
Very High
Gradual transition from classic forms of gravity irrigation to modern forms of irrigation (sprinkler and drip irrigation)
High
Strengthening water use associations for the management of the irrigation water and raising the awareness of the farmers for the payment of the irrigation fee
Medium
Construction of a new drainage system and rehabilitation of existing drainage infrastructure
Construction of new drainage systems and rehabilitation of the existing drainage infrastructure Very High
Increase by at least 50% of the current number of excavators and machinery needed for the maintenance of drainage infrastructure.
Very High
Increase the financial support for municipalities, to undertake the necessary interventions in the secondary and tertiary drainage canals.
High
Increase flood protection capacities
Increase the flood protection capacities. From a total of 850 km of river and sea embankments, about 300 km of the need urgent repairs.
Very High
The update of the river management plans (river Buna, Drin, Mat, Shkumbin and Vjosa), and assessment of the additional interventions, needed for flood cases in the areas with a medium and high degree of risk
Medium
Policy and organization measures
Application of subsidy schemes for farmers, for the introduction of new technologies in agricultural production Very high
Financial support for the application of agricultural crop insurance schemes, for the harmful effects of climate change
Very High
Increase institutional capacity, to monitor climate indicators, as well as indicators related to the effects of climate change in agriculture
Medium
Raising the awareness of farmers, and agricultural specialists, on the risk posed by climate change in agriculture, as well as necessary measures to adapt to these climate changes.
Medium
Farm-level
Soil related measures
Introduction of new cultivation techniques, such as direct planting, (no-tillage systems) as well as, soil mulching techniques
Medium
Application of agroforestry practices, combining the growth of crops accompanied by forest trees, and construction of hedgerows and windbreaks on the fields planed with crops
Medium
Farm management
Reduction as much as possible of chemical inputs in agriculture and Introduction of new cultivation technologies
High
Promotion of organic farming and application of precision farming systems Medium
Introduction of pest and disease resistant cultivars as well as improvement of pest monitoring and information system
High
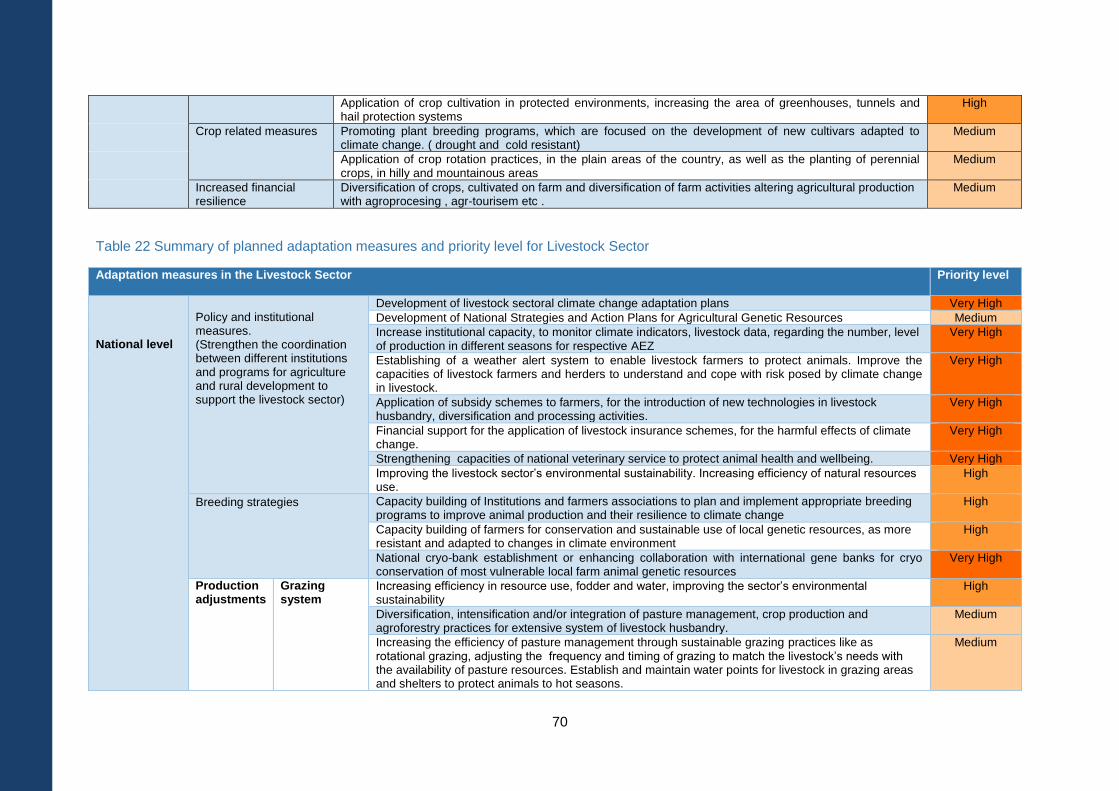
70
Application of crop cultivation in protected environments, increasing the area of greenhouses, tunnels and hail protection systems
High
Crop related measures Promoting plant breeding programs, which are focused on the development of new cultivars adapted to climate change. ( drought and cold resistant)
Medium
Application of crop rotation practices, in the plain areas of the country, as well as the planting of perennial crops, in hilly and mountainous areas
Medium
Increased financial resilience
Diversification of crops, cultivated on farm and diversification of farm activities altering agricultural production with agroprocesing , agr-tourisem etc .
Medium
Table 22 Summary of planned adaptation measures and priority level for Livestock Sector
Adaptation measures in the Livestock Sector Priority level
National level
Policy and institutional measures. (Strengthen the coordination between different institutions and programs for agriculture and rural development to support the livestock sector)
Development of livestock sectoral climate change adaptation plans Very High
Development of National Strategies and Action Plans for Agricultural Genetic Resources Medium
Increase institutional capacity, to monitor climate indicators, livestock data, regarding the number, level of production in different seasons for respective AEZ
Very High
Establishing of a weather alert system to enable livestock farmers to protect animals. Improve the capacities of livestock farmers and herders to understand and cope with risk posed by climate change in livestock.
Very High
Application of subsidy schemes to farmers, for the introduction of new technologies in livestock husbandry, diversification and processing activities.
Very High
Financial support for the application of livestock insurance schemes, for the harmful effects of climate change.
Very High
Strengthening capacities of national veterinary service to protect animal health and wellbeing. Very High
Improving the livestock sector’s environmental sustainability. Increasing efficiency of natural resources use.
High
Breeding strategies Capacity building of Institutions and farmers associations to plan and implement appropriate breeding programs to improve animal production and their resilience to climate change
High
Capacity building of farmers for conservation and sustainable use of local genetic resources, as more resistant and adapted to changes in climate environment
High
National cryo-bank establishment or enhancing collaboration with international gene banks for cryo conservation of most vulnerable local farm animal genetic resources
Very High
Production adjustments
Grazing system
Increasing efficiency in resource use, fodder and water, improving the sector’s environmental sustainability
High
Diversification, intensification and/or integration of pasture management, crop production and agroforestry practices for extensive system of livestock husbandry.
Medium
Increasing the efficiency of pasture management through sustainable grazing practices like as rotational grazing, adjusting the frequency and timing of grazing to match the livestock’s needs with the availability of pasture resources. Establish and maintain water points for livestock in grazing areas and shelters to protect animals to hot seasons.
Medium
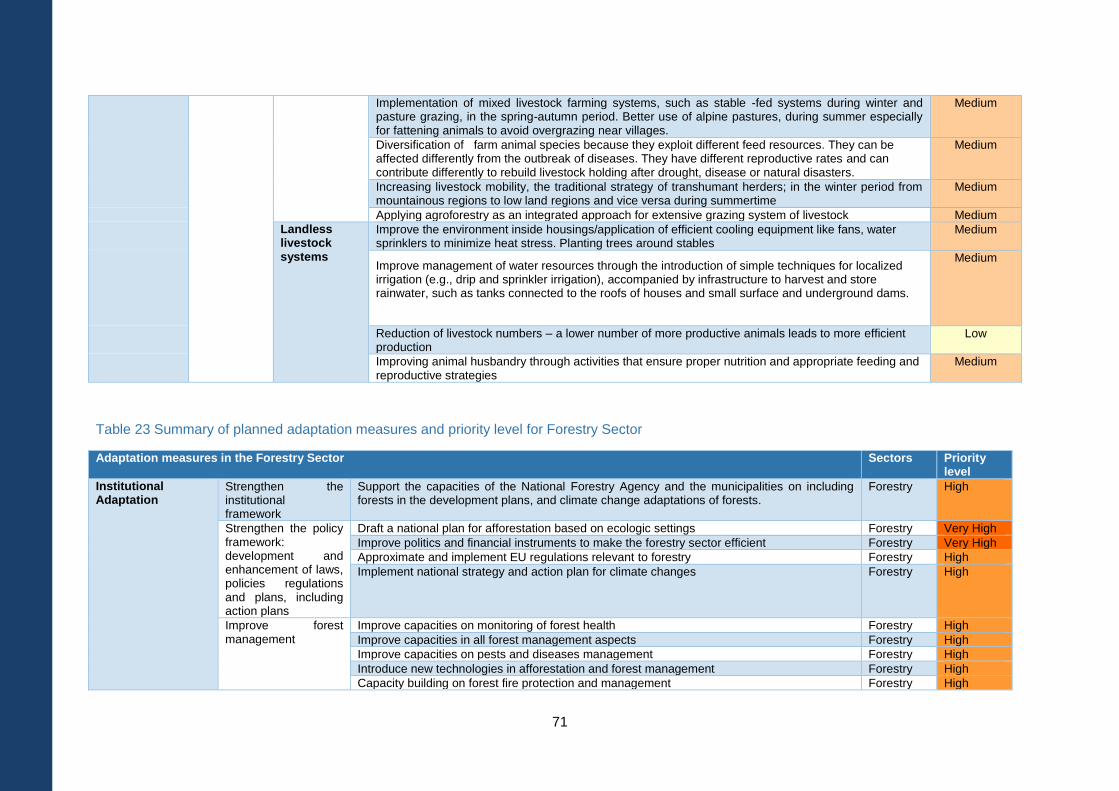
71
Implementation of mixed livestock farming systems, such as stable -fed systems during winter and pasture grazing, in the spring-autumn period. Better use of alpine pastures, during summer especially for fattening animals to avoid overgrazing near villages.
Medium
Diversification of farm animal species because they exploit different feed resources. They can be affected differently from the outbreak of diseases. They have different reproductive rates and can contribute differently to rebuild livestock holding after drought, disease or natural disasters.
Medium
Increasing livestock mobility, the traditional strategy of transhumant herders; in the winter period from mountainous regions to low land regions and vice versa during summertime
Medium
Applying agroforestry as an integrated approach for extensive grazing system of livestock Medium
Landless livestock systems
Improve the environment inside housings/application of efficient cooling equipment like fans, water sprinklers to minimize heat stress. Planting trees around stables
Medium
Improve management of water resources through the introduction of simple techniques for localized irrigation (e.g., drip and sprinkler irrigation), accompanied by infrastructure to harvest and store rainwater, such as tanks connected to the roofs of houses and small surface and underground dams.
Medium
Reduction of livestock numbers – a lower number of more productive animals leads to more efficient production
Low
Improving animal husbandry through activities that ensure proper nutrition and appropriate feeding and reproductive strategies
Medium
Table 23 Summary of planned adaptation measures and priority level for Forestry Sector
Adaptation measures in the Forestry Sector Sectors Priority level
Institutional Adaptation
Strengthen the institutional framework
Support the capacities of the National Forestry Agency and the municipalities on including forests in the development plans, and climate change adaptations of forests.
Forestry High
Strengthen the policy framework: development and enhancement of laws, policies regulations and plans, including action plans
Draft a national plan for afforestation based on ecologic settings Forestry Very High
Improve politics and financial instruments to make the forestry sector efficient Forestry Very High
Approximate and implement EU regulations relevant to forestry Forestry High
Implement national strategy and action plan for climate changes Forestry High
Improve forest management
Improve capacities on monitoring of forest health Forestry High
Improve capacities in all forest management aspects Forestry High
Improve capacities on pests and diseases management Forestry High
Introduce new technologies in afforestation and forest management Forestry High
Capacity building on forest fire protection and management Forestry High
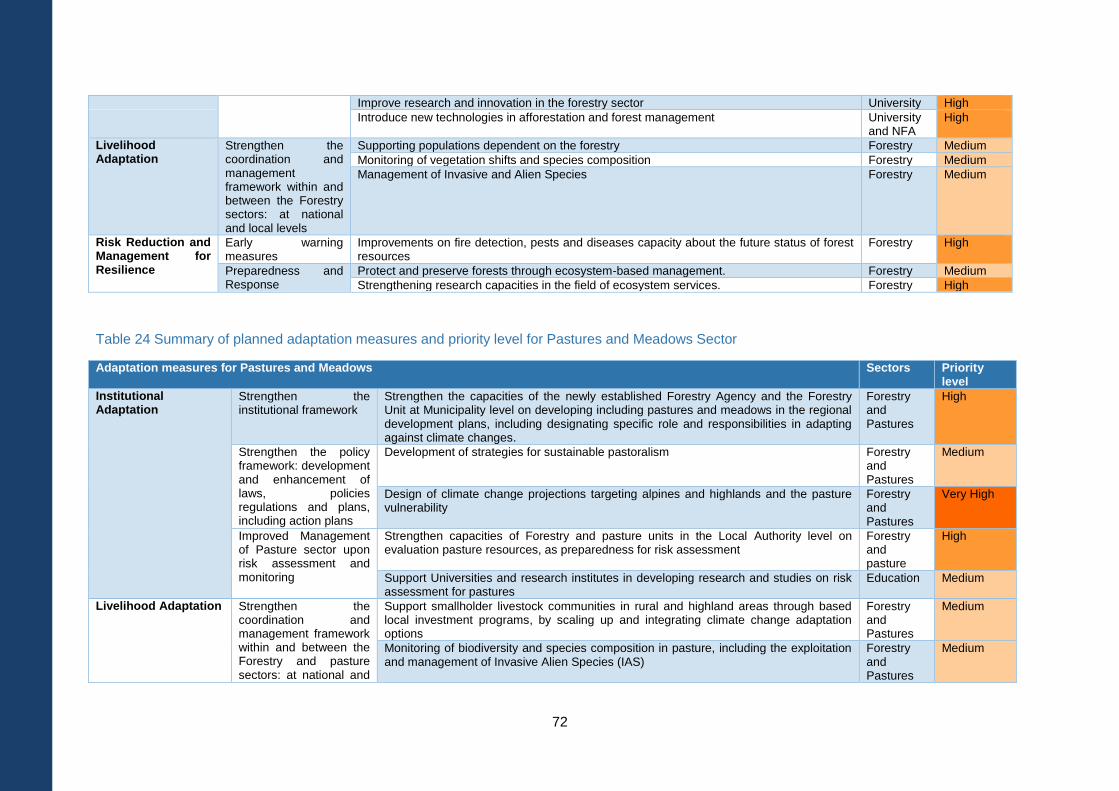
72
Improve research and innovation in the forestry sector University High
Introduce new technologies in afforestation and forest management University and NFA
High
Livelihood Adaptation
Strengthen the coordination and management framework within and between the Forestry sectors: at national and local levels
Supporting populations dependent on the forestry Forestry Medium
Monitoring of vegetation shifts and species composition Forestry Medium
Management of Invasive and Alien Species Forestry Medium
Risk Reduction and Management for Resilience
Early warning measures
Improvements on fire detection, pests and diseases capacity about the future status of forest resources
Forestry High
Preparedness and Response
Protect and preserve forests through ecosystem-based management. Forestry Medium
Strengthening research capacities in the field of ecosystem services. Forestry High
Table 24 Summary of planned adaptation measures and priority level for Pastures and Meadows Sector
Adaptation measures for Pastures and Meadows Sectors Priority level
Institutional Adaptation
Strengthen the institutional framework
Strengthen the capacities of the newly established Forestry Agency and the Forestry Unit at Municipality level on developing including pastures and meadows in the regional development plans, including designating specific role and responsibilities in adapting against climate changes.
Forestry and Pastures
High
Strengthen the policy framework: development and enhancement of laws, policies regulations and plans, including action plans
Development of strategies for sustainable pastoralism Forestry and Pastures
Medium
Design of climate change projections targeting alpines and highlands and the pasture vulnerability
Forestry and Pastures
Very High
Improved Management of Pasture sector upon risk assessment and monitoring
Strengthen capacities of Forestry and pasture units in the Local Authority level on evaluation pasture resources, as preparedness for risk assessment
Forestry and pasture
High
Support Universities and research institutes in developing research and studies on risk assessment for pastures
Education Medium
Livelihood Adaptation Strengthen the coordination and management framework within and between the Forestry and pasture sectors: at national and
Support smallholder livestock communities in rural and highland areas through based local investment programs, by scaling up and integrating climate change adaptation options
Forestry and Pastures
Medium
Monitoring of biodiversity and species composition in pasture, including the exploitation and management of Invasive Alien Species (IAS)
Forestry and Pastures
Medium
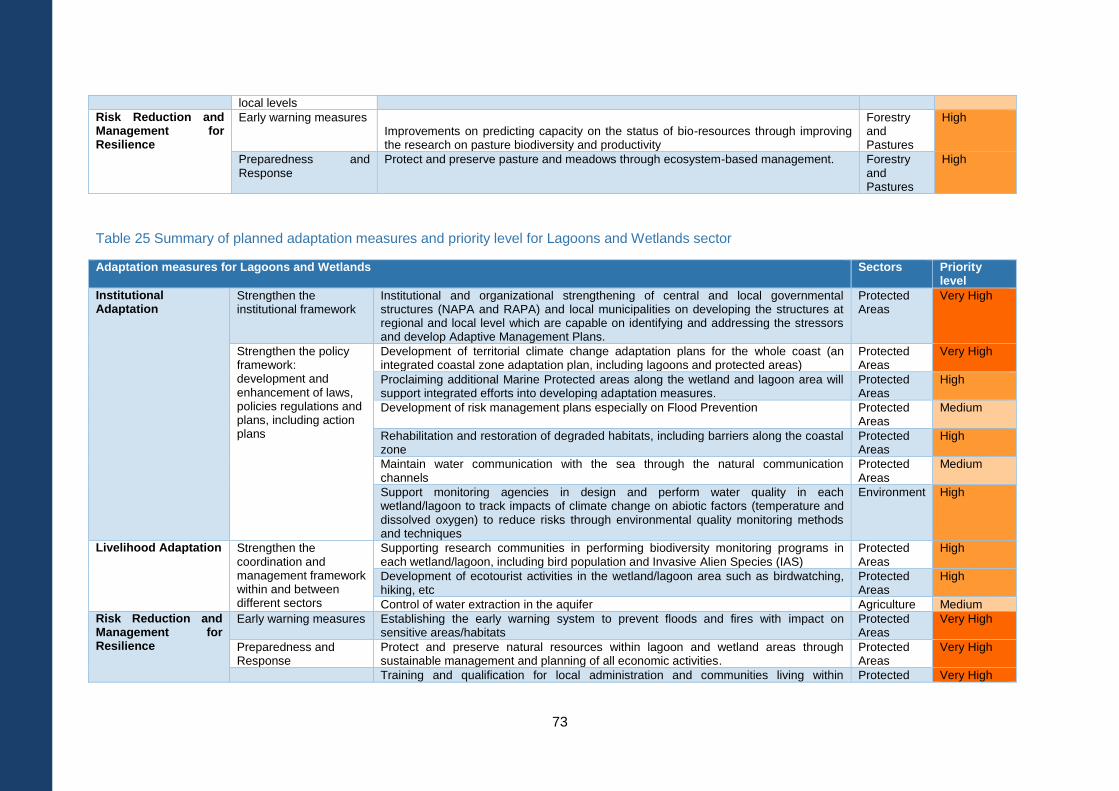
73
local levels
Risk Reduction and Management for Resilience
Early warning measures Improvements on predicting capacity on the status of bio-resources through improving the research on pasture biodiversity and productivity
Forestry and Pastures
High
Preparedness and Response
Protect and preserve pasture and meadows through ecosystem-based management. Forestry and Pastures
High
Table 25 Summary of planned adaptation measures and priority level for Lagoons and Wetlands sector
Adaptation measures for Lagoons and Wetlands Sectors Priority level
Institutional Adaptation
Strengthen the institutional framework
Institutional and organizational strengthening of central and local governmental structures (NAPA and RAPA) and local municipalities on developing the structures at regional and local level which are capable on identifying and addressing the stressors and develop Adaptive Management Plans.
Protected Areas
Very High
Strengthen the policy framework: development and enhancement of laws, policies regulations and plans, including action plans
Development of territorial climate change adaptation plans for the whole coast (an integrated coastal zone adaptation plan, including lagoons and protected areas)
Protected Areas
Very High
Proclaiming additional Marine Protected areas along the wetland and lagoon area will support integrated efforts into developing adaptation measures.
Protected Areas
High
Development of risk management plans especially on Flood Prevention Protected Areas
Medium
Rehabilitation and restoration of degraded habitats, including barriers along the coastal zone
Protected Areas
High
Maintain water communication with the sea through the natural communication channels
Protected Areas
Medium
Support monitoring agencies in design and perform water quality in each wetland/lagoon to track impacts of climate change on abiotic factors (temperature and dissolved oxygen) to reduce risks through environmental quality monitoring methods and techniques
Environment High
Livelihood Adaptation Strengthen the coordination and management framework within and between different sectors
Supporting research communities in performing biodiversity monitoring programs in each wetland/lagoon, including bird population and Invasive Alien Species (IAS)
Protected Areas
High
Development of ecotourist activities in the wetland/lagoon area such as birdwatching, hiking, etc
Protected Areas
High
Control of water extraction in the aquifer Agriculture Medium
Risk Reduction and Management for Resilience
Early warning measures Establishing the early warning system to prevent floods and fires with impact on sensitive areas/habitats
Protected Areas
Very High
Preparedness and Response
Protect and preserve natural resources within lagoon and wetland areas through sustainable management and planning of all economic activities.
Protected Areas
Very High
Training and qualification for local administration and communities living within Protected Very High
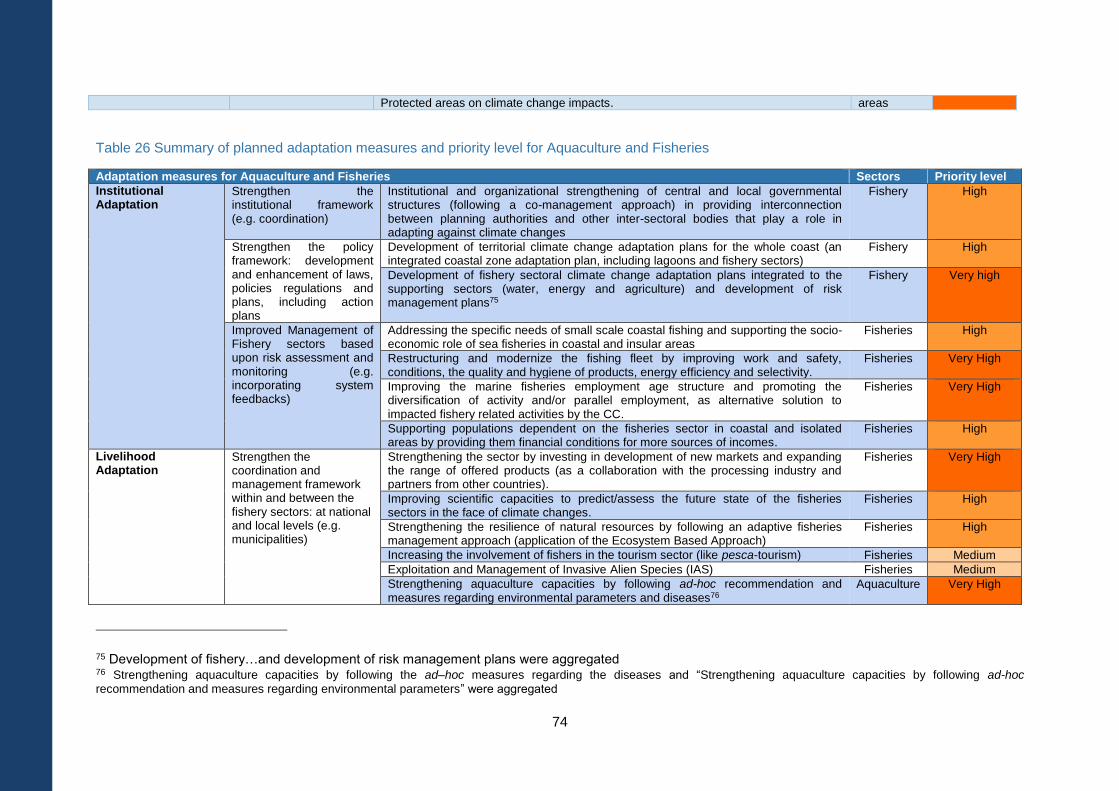
74
Protected areas on climate change impacts. areas
Table 26 Summary of planned adaptation measures and priority level for Aquaculture and Fisheries
Adaptation measures for Aquaculture and Fisheries Sectors Priority level
Institutional Adaptation
Strengthen the institutional framework (e.g. coordination)
Institutional and organizational strengthening of central and local governmental structures (following a co-management approach) in providing interconnection between planning authorities and other inter-sectoral bodies that play a role in adapting against climate changes
Fishery High
Strengthen the policy framework: development and enhancement of laws, policies regulations and plans, including action plans
Development of territorial climate change adaptation plans for the whole coast (an integrated coastal zone adaptation plan, including lagoons and fishery sectors)
Fishery High
Development of fishery sectoral climate change adaptation plans integrated to the supporting sectors (water, energy and agriculture) and development of risk management plans75
Fishery Very high
Improved Management of Fishery sectors based upon risk assessment and monitoring (e.g. incorporating system feedbacks)
Addressing the specific needs of small scale coastal fishing and supporting the socio-economic role of sea fisheries in coastal and insular areas
Fisheries High
Restructuring and modernize the fishing fleet by improving work and safety, conditions, the quality and hygiene of products, energy efficiency and selectivity.
Fisheries Very High
Improving the marine fisheries employment age structure and promoting the diversification of activity and/or parallel employment, as alternative solution to impacted fishery related activities by the CC.
Fisheries Very High
Supporting populations dependent on the fisheries sector in coastal and isolated areas by providing them financial conditions for more sources of incomes.
Fisheries High
Livelihood Adaptation
Strengthen the coordination and management framework within and between the fishery sectors: at national and local levels (e.g. municipalities)
Strengthening the sector by investing in development of new markets and expanding the range of offered products (as a collaboration with the processing industry and partners from other countries).
Fisheries Very High
Improving scientific capacities to predict/assess the future state of the fisheries sectors in the face of climate changes.
Fisheries High
Strengthening the resilience of natural resources by following an adaptive fisheries management approach (application of the Ecosystem Based Approach)
Fisheries High
Increasing the involvement of fishers in the tourism sector (like pesca-tourism) Fisheries Medium
Exploitation and Management of Invasive Alien Species (IAS) Fisheries Medium
Strengthening aquaculture capacities by following ad-hoc recommendation and measures regarding environmental parameters and diseases76
Aquaculture Very High
75 Development of fishery…and development of risk management plans were aggregated 76 Strengthening aquaculture capacities by following the ad–hoc measures regarding the diseases and “Strengthening aquaculture capacities by following ad-hoc
recommendation and measures regarding environmental parameters” were aggregated
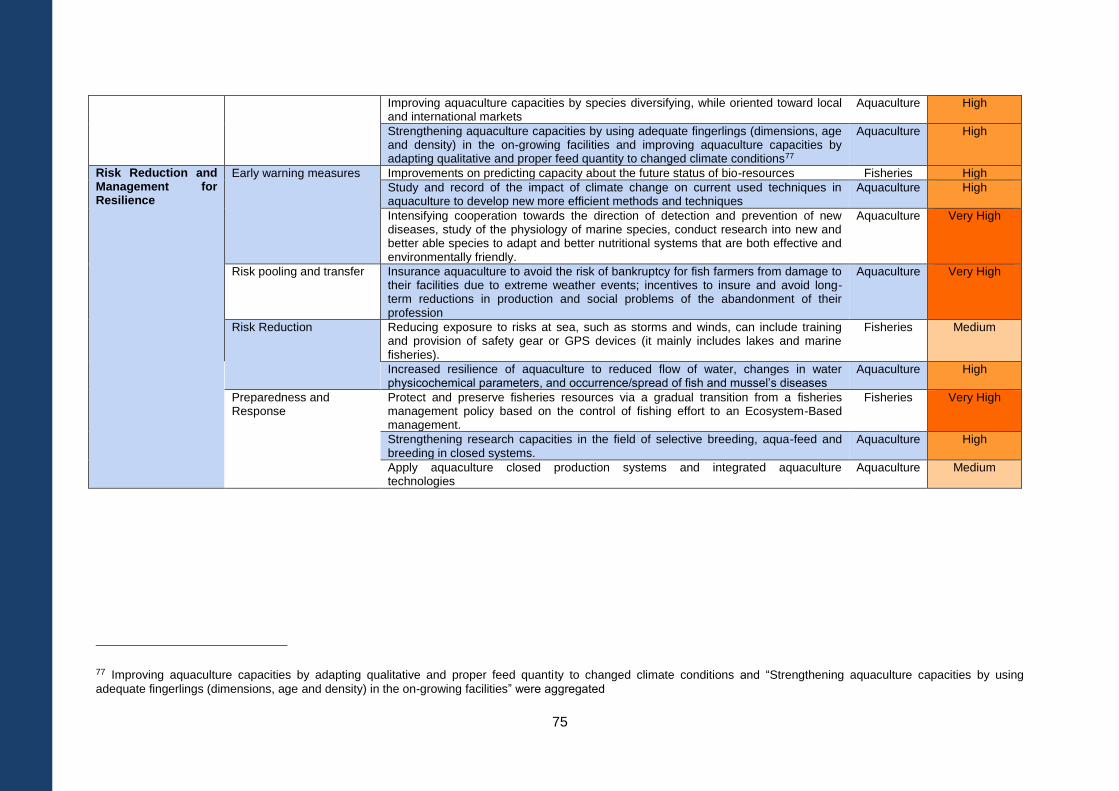
75
Improving aquaculture capacities by species diversifying, while oriented toward local and international markets
Aquaculture High
Strengthening aquaculture capacities by using adequate fingerlings (dimensions, age and density) in the on-growing facilities and improving aquaculture capacities by adapting qualitative and proper feed quantity to changed climate conditions77
Aquaculture High
Risk Reduction and Management for Resilience
Early warning measures Improvements on predicting capacity about the future status of bio-resources Fisheries High
Study and record of the impact of climate change on current used techniques in aquaculture to develop new more efficient methods and techniques
Aquaculture High
Intensifying cooperation towards the direction of detection and prevention of new diseases, study of the physiology of marine species, conduct research into new and better able species to adapt and better nutritional systems that are both effective and environmentally friendly.
Aquaculture Very High
Risk pooling and transfer Insurance aquaculture to avoid the risk of bankruptcy for fish farmers from damage to their facilities due to extreme weather events; incentives to insure and avoid long-term reductions in production and social problems of the abandonment of their profession
Aquaculture Very High
Risk Reduction Reducing exposure to risks at sea, such as storms and winds, can include training and provision of safety gear or GPS devices (it mainly includes lakes and marine fisheries).
Fisheries Medium
Increased resilience of aquaculture to reduced flow of water, changes in water physicochemical parameters, and occurrence/spread of fish and mussel’s diseases
Aquaculture High
Preparedness and Response
Protect and preserve fisheries resources via a gradual transition from a fisheries management policy based on the control of fishing effort to an Ecosystem-Based management.
Fisheries Very High
Strengthening research capacities in the field of selective breeding, aqua-feed and breeding in closed systems.
Aquaculture High
Apply aquaculture closed production systems and integrated aquaculture technologies
Aquaculture Medium
77 Improving aquaculture capacities by adapting qualitative and proper feed quantity to changed climate conditions and “Strengthening aquaculture capacities by using
adequate fingerlings (dimensions, age and density) in the on-growing facilities” were aggregated
76
4. FAIRNESS, AMBITION AND CONTRIBUTION
TOWARDS ACHIEVING THE OBJECTIVE OF
THE CONVENTION
The revised NDC of Albania presents an ambition that contributes to achieving the objectives of the UNFCCC and the Paris Agreement, and to achieve regional and national strategies and plans.
At the national level, the NDC is aligned with Albania’s long term national and sectoral
development strategies, plans and goals. On mitigation, sectoral projections used for the NDC
scenario are based on national strategies, including the National Strategy on Development
Integration 2015-2020, the National Strategy on Climate Change, the National Action Plan on
Mitigation, the National Energy Strategy, and other sectoral plans. On adaptation, the planned
adaptation measures for settlements, populations and tourism are aligned with the National
Strategy for Development and Integration 2015-2020, especially the pillar 4th on Growth through
the sustainable use of resources and territorial development. They are also in tune with the
objectives of the National Adaptation Plan, as well as the ones of the Integrated Cross-Sectoral
Plan for the Coast and the National Strategy for Sustainable Tourism Development 2019-2023,
among others.
The revised NDC is also in harmony with Albania’s post-earthquake/disaster and COVID-19
green recovery strategies and plans. The proposed adaptation measures, and especially the
ones on the built environment and on disaster risk management, are aligned with and contribute
to the guiding principles of the Albania post-disaster needs assessments, which specifically aims
to achieve reconstruction and recovery in a manner that increases the resilience of
infrastructures, ecosystems, the environment, and vulnerable communities to future disasters,
including anthropogenic and climate shocks, and to promote adaptation to climate change by
introducing specific measures into sectoral recovery and reconstruction programs. The revised
NDC is also aligned and contributes to the UN Albania COVID-19 Socio-Economic Recovery and
Response Plan, which complements the Government of Albania’s National Response Plan and
the National Strategic Preparedness and Response Plan (SPRP). The revised NDC supports the
need to invest in a low-carbon and resilient economy, by promoting clean, green, sustainable and
resilient investments, ensuring post COVID-19 green recovery.
The revised NDC is closely aligned with the Fourth National Communication being developed in
parallel, as well as the Third National Communication of Albania to the UNFCCC.
At the regional level, the NDC is also aligned with EU’s Green Deal, which aims to enhance the
EU climate 2030 objective, taking into account all sectors (including FOLU), to decarbonise the
energy sector, supporting innovation in transport and industry; through an action plan in order to
boost the efficient use of resources by moving to a clean, circular economy. According to the EU
Green Deal, a Just Transition Mechanism and Fund has been set up to help regions and sectors
the most affected by the cost of transition, due to their reliance on fossil fuels such as coal.
The Green Agenda for the Western Balkans, included in the Communication on an Economic
and Investment Plan for the Western Balkans adopted by the European Commission in 2020,
has five pillars: (1) climate action, including decarbonisation, energy and mobility, (2) circular
economy, addressing in particular waste, recycling, sustainable production and efficient use of
resources, (3) biodiversity, aiming to protect and restore the natural wealth of the region, (4)
77
fighting pollution of air, water and soil and (5) sustainable food systems and rural areas. The
implementation of this Green Agenda requires substantial public and private funding, at national,
regional and international level, and the EU considers supporting innovative financial instruments
such as the Instrument for Pre-Accession (IPA). This revised NDC is aligned and directly
contributes to the first pilar on climate action (both on mitigation and adaptation), as well as the
3rd one biodiversity (adaptation measures on adapting the supporting natural environment).
At the global level, as presented in point 6 of section 3, implementation of this revised NDC
contributes to achievement of the Paris Agreement, reflecting Albania’s own national
circumstances. In this sense, Albania’s contribution is both fair and ambitious. Albania’s historical
and current levels of GHG emissions are low, at the global level and in comparison to other
European countries. Albania’s national GHG emissions represented only 0.02% of global
emissions in 2016. While the average level of emissions per inhabitant was 8.7 t CO2e/hab in the
EU-27 in 2018, the level of emission per capita in Albania was 3.5 t CO2e/hab in 2016. Albania is
a country with an economy in transition and expects human and economic developments in the
next decades, which would increase the level of emissions, which, as noted, are historically low.
The NDC considers a lower level of emissions increase in comparison to the expected business-
as-usual scenario (-16.3% in 2030), considering more sectors and gases than in its first NDC.
This constitutes a high ambition given the capacities of the country. The emissions reduction
objective is not defined as a general target but is based on a bottom-up approach taking into
account possible mitigation actions sector by sector, ensuring that the final target remains a
realistic and reachable figure, considering the current of implementation of existing mitigation
actions, which is sometimes limited. Albania will take into account the ultimate objective of the
UNFCCC in its future development and commits to decouple GHG emissions from its economic
growth and embark on a low emission development pathway beyond 2030.This NDC also
includes adaptation measures, which is an enhancement of the first NDC, and will absorb
significant resources.
In addition, the implementation of this NDC will directly contribute to achievement of the
Sustainable Development Goal (SDG) 13: Climate action, and indirectly to SDG7: Affordable and
Clean Energy (mitigation target), SDG3: Good health and well-being (adaptation health
measures), and SDG 5: Gender equality (cross-cutting focus on the revised NDC, which is
addressing gender differentiated vulnerabilities to climate change and gender gaps and structural
barriers).
The implementation of the mitigation and adaptation measures included in this revised NDC will
contribute to human rights in a broader sense, in line with Albania’s national policies and regional
and global commitments, including the 2030 Agenda and the Aarhus Convention on access to
information, public participation in decision-making and access to justice in environmental
matters, through participatory processes, including a strong engagement of youth.
By promoting the climate proofing of residential and productive infrastructure, touristic
accommodation and assets and health (and other social) facilities, and the strengthening of
disaster risk management, the revised NDC is aligned and directly contributes to the Sendai
Framework for Disaster Risk Reduction 2015-2030 which outlines four priorities for action to
prevent new and reduce existing disaster risks: (i) Understanding disaster risk; (ii) Strengthening
disaster risk governance to manage disaster risk; (iii) Investing in disaster reduction for resilience
and; (iv) Enhancing disaster preparedness for effective response, and to "Build Back Better" in
recovery, rehabilitation and reconstruction.
78
5. MEANS OF IMPLEMENTATION
5.1. Institutional and legal aspects
Strengths: The Inter-Ministerial Working Group on Climate Change (IMWGCC), which
coordinates all institutions involved in climate change processes, will facilitate the implementation
of this NDC, and will promote some of the proposed adaptation measures, especially on
strengthening the enabling environment. Furthermore, Albania’s institutional arrangements
already enable the preparation of national inventory and projections and comply with
international reporting requirements. The existing coordination between the Ministry of Tourism
and Environment, other ministries, UNDP, FAO-Albania, and other institutional actors, is a
strength to improve the MRV framework in the country as well as the implementation of
mitigation and adaptation actions. General and sectoral mitigation and adaptation strategies are
well documented in specific legal and policy documents, such as the National Energy and
Climate Plan. The National Climate Change Strategy included national mitigation and adaptation
plans (NAP). The Government of Albania is currently developing an action plan for this NDC to
provide direction and a timeline for implementing adaptation and mitigation actions.
Gaps: Precise objectives or means of implementation are sometimes lacking, and some of the
policy and legal documents have not been fully approved. There is a lack of consistency among
different areas of policy, which relies on a high number of external consultancy projects. There is
a need to move from a project-based approach to a more mainstreamed process. There is a lack
of public awareness to acknowledge relevance of climate change. Adopted policies and
measures are not always applied.
The adaptation section of this NDC incorporates adaptation actions for the Albanian Coast
encompassing all current policies and strategies targeting settlements, population and tourism.
This structure provides an opportunity to adopt a systematic approach to implementing
adaptation actions. The NAP focuses on mainstreaming adaptation into sectoral approaches.
Doing this will contribute to strengthen the enabling environment when implemented.
5.2. Knowledge and capacity
Strengths: Some knowledge and capacities are available within the administration, universities
and other Albanian institutions both on mitigation and adaptation. For example, technical
capacities are available to develop the MRV for mitigation in all sectors.
Gaps: However, scientific, technical and societal capacities could be further developed, to
generate scientific evidence to support decision making on the most strategic measures and their
implementation. For instance, on mitigation, the country is lacking harmonized, complete and
consistent datasets for various sectors, such as for Waste and FOLU. Existing datasets could be
improved for a more precise monitoring. Furthermore, there is no mitigation action tracking
system that would enable the monitoring of implementation of policies and measures and of their
impact in terms of GHG emissions reduction. In terms of adaptation, technical capacity to plan for
adaptation, both on policy and on technical aspects, needs to be further strengthened at all
levels.
79
5.3. Technology transfer
Strengths: Albania already benefits from the creation of the Units of Information, Technology
and Communication and the Agency of Research, Technology and Innovation (AKTI). In some
sectors, there is no need for important technology transfer (Agriculture, FOLU). In the Waste
sector, a technology transfer is already undergoing with the building of new incinerators.
Gaps: Albania would benefit from updating its Technology needs Assessment (TNA), assessing
the technology needs for both mitigation and adaptation in the different economic sectors. Its
latest version was published in 2005 and is a bit outdated. For the energy sector, there is a need
to enhance technology transfer, for example for the oil and gas sector and on renewable energy.
According to the EU Low Carbon Economy Roadmap, significant investments and technological
transfers will be needed, in particular in new low-carbon technologies, renewable energy, energy
efficiency, and grid infrastructure. Adapting the supporting built environment and climate proofing
residential and productive infrastructure, touristic accommodation and assets and health (and
other social) facilities will also require accessing new technologies.
5.4. Finance
Strengths: Albania has a robust financial strategy on mitigation and adaptation, including
financial needs and potential sources of funding. Adaptation measures were prioritized in this
revised NDC according to the relative magnitude of their costs, among others. Several measures
that are very important for adaptation also have a low cost including several measures related to
generating scientific evidence in support of decision-making and to capacity-building. These
could be more easily incorporated in budgets and short-term plans. In the agriculture sector,
most mitigation actions have a low cost and even can deliver additional revenues.
Gaps: Albania does not currently integrate climate change considerations and criteria, as well as
relevant policies, in the guidance, procedures and methodologies used for selection and
appraisal of public investment programs and projects. Such criteria need to include: (i) impacts of
the project on climate change mitigation efforts, to determine if the project will lead to an increase
or decrease of GHG emissions. Projects that have significant impact on GHG emissions should
conduct GHG accounting and use the shadow price of carbon in their economic analysis and (ii)
assessment of climate change risks and vulnerabilities relevant for the project, as well as if the
project outcomes contribute to adaptation efforts and strengthening climate resilience. Public and
private investments shall be secured and tracked so that they ensure effective implementation of
the NDC in all sectors. In addition, Albania has limited experience in carbon pricing instruments
to promote decarbonisation, including the EU Emissions Trading Scheme. With regards to
adaptation, some essential measures involving among other climate-proofing infrastructure, or
disaster risk management are not highlighted as having a “very high priority” mainly due to their
high technical complexity and costs.
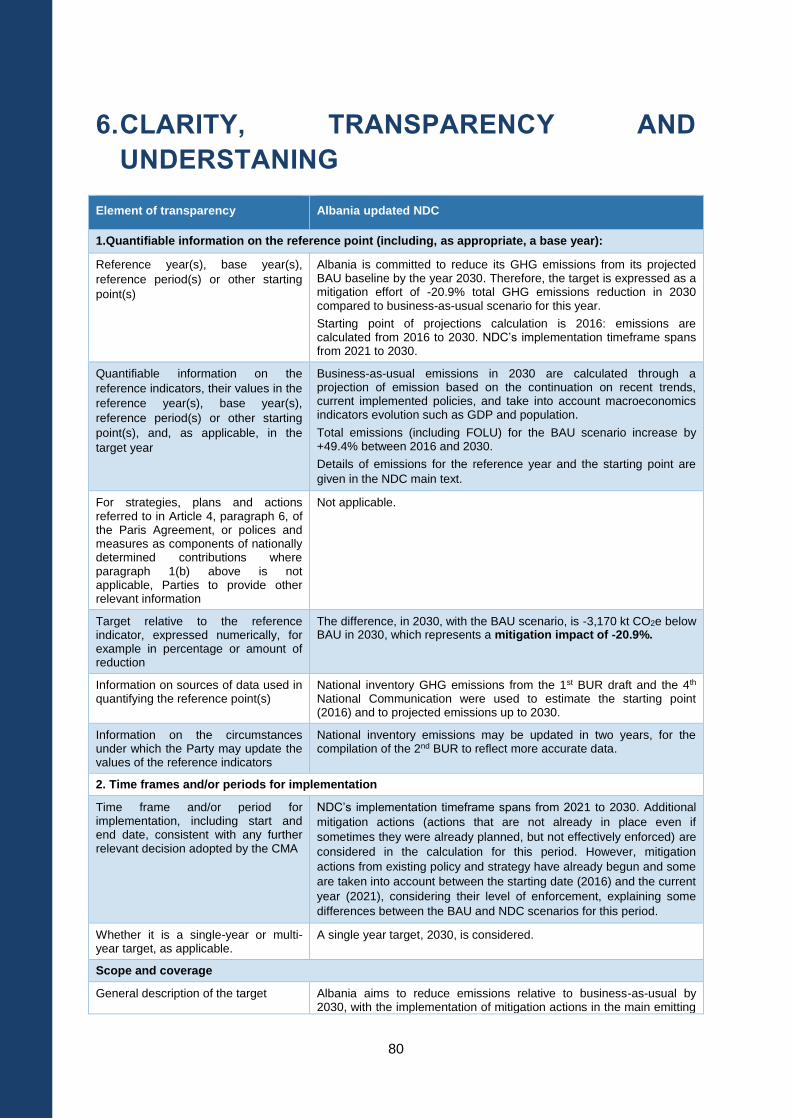
80
6. CLARITY, TRANSPARENCY AND
UNDERSTANING
Element of transparency Albania updated NDC
1.Quantifiable information on the reference point (including, as appropriate, a base year):
Reference year(s), base year(s),
reference period(s) or other starting
point(s)
Albania is committed to reduce its GHG emissions from its projected BAU baseline by the year 2030. Therefore, the target is expressed as a mitigation effort of -20.9% total GHG emissions reduction in 2030 compared to business-as-usual scenario for this year.
Starting point of projections calculation is 2016: emissions are calculated from 2016 to 2030. NDC’s implementation timeframe spans from 2021 to 2030.
Quantifiable information on the
reference indicators, their values in the
reference year(s), base year(s),
reference period(s) or other starting
point(s), and, as applicable, in the
target year
Business-as-usual emissions in 2030 are calculated through a projection of emission based on the continuation on recent trends, current implemented policies, and take into account macroeconomics indicators evolution such as GDP and population.
Total emissions (including FOLU) for the BAU scenario increase by +49.4% between 2016 and 2030.
Details of emissions for the reference year and the starting point are
given in the NDC main text.
For strategies, plans and actions referred to in Article 4, paragraph 6, of the Paris Agreement, or polices and measures as components of nationally determined contributions where paragraph 1(b) above is not applicable, Parties to provide other relevant information
Not applicable.
Target relative to the reference indicator, expressed numerically, for example in percentage or amount of reduction
The difference, in 2030, with the BAU scenario, is -3,170 kt CO2e below BAU in 2030, which represents a mitigation impact of -20.9%.
Information on sources of data used in quantifying the reference point(s)
National inventory GHG emissions from the 1st BUR draft and the 4th National Communication were used to estimate the starting point (2016) and to projected emissions up to 2030.
Information on the circumstances under which the Party may update the values of the reference indicators
National inventory emissions may be updated in two years, for the compilation of the 2nd BUR to reflect more accurate data.
2. Time frames and/or periods for implementation
Time frame and/or period for implementation, including start and end date, consistent with any further relevant decision adopted by the CMA
NDC’s implementation timeframe spans from 2021 to 2030. Additional
mitigation actions (actions that are not already in place even if
sometimes they were already planned, but not effectively enforced) are
considered in the calculation for this period. However, mitigation
actions from existing policy and strategy have already begun and some
are taken into account between the starting date (2016) and the current
year (2021), considering their level of enforcement, explaining some
differences between the BAU and NDC scenarios for this period.
Whether it is a single-year or multi-year target, as applicable.
A single year target, 2030, is considered.
Scope and coverage
General description of the target Albania aims to reduce emissions relative to business-as-usual by 2030, with the implementation of mitigation actions in the main emitting
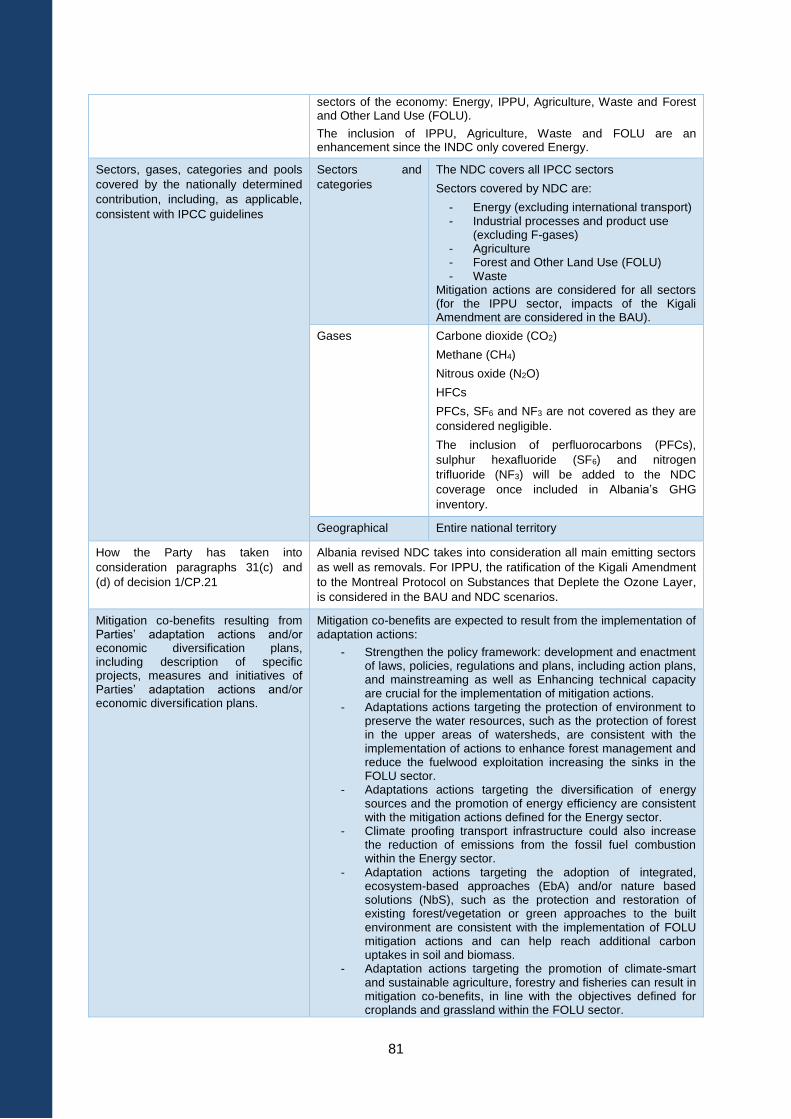
81
sectors of the economy: Energy, IPPU, Agriculture, Waste and Forest and Other Land Use (FOLU).
The inclusion of IPPU, Agriculture, Waste and FOLU are an enhancement since the INDC only covered Energy.
Sectors, gases, categories and pools
covered by the nationally determined
contribution, including, as applicable,
consistent with IPCC guidelines
Sectors and
categories
The NDC covers all IPCC sectors
Sectors covered by NDC are:
- Energy (excluding international transport) - Industrial processes and product use
(excluding F-gases) - Agriculture - Forest and Other Land Use (FOLU) - Waste
Mitigation actions are considered for all sectors (for the IPPU sector, impacts of the Kigali Amendment are considered in the BAU).
Gases Carbone dioxide (CO2)
Methane (CH4)
Nitrous oxide (N2O)
HFCs
PFCs, SF6 and NF3 are not covered as they are
considered negligible.
The inclusion of perfluorocarbons (PFCs),
sulphur hexafluoride (SF6) and nitrogen
trifluoride (NF3) will be added to the NDC
coverage once included in Albania’s GHG
inventory.
Geographical Entire national territory
How the Party has taken into
consideration paragraphs 31(c) and
(d) of decision 1/CP.21
Albania revised NDC takes into consideration all main emitting sectors
as well as removals. For IPPU, the ratification of the Kigali Amendment
to the Montreal Protocol on Substances that Deplete the Ozone Layer,
is considered in the BAU and NDC scenarios.
Mitigation co-benefits resulting from Parties’ adaptation actions and/or economic diversification plans, including description of specific projects, measures and initiatives of Parties’ adaptation actions and/or economic diversification plans.
Mitigation co-benefits are expected to result from the implementation of adaptation actions:
- Strengthen the policy framework: development and enactment of laws, policies, regulations and plans, including action plans, and mainstreaming as well as Enhancing technical capacity are crucial for the implementation of mitigation actions.
- Adaptations actions targeting the protection of environment to preserve the water resources, such as the protection of forest in the upper areas of watersheds, are consistent with the implementation of actions to enhance forest management and reduce the fuelwood exploitation increasing the sinks in the FOLU sector.
- Adaptations actions targeting the diversification of energy sources and the promotion of energy efficiency are consistent with the mitigation actions defined for the Energy sector.
- Climate proofing transport infrastructure could also increase the reduction of emissions from the fossil fuel combustion within the Energy sector.
- Adaptation actions targeting the adoption of integrated, ecosystem-based approaches (EbA) and/or nature based solutions (NbS), such as the protection and restoration of existing forest/vegetation or green approaches to the built environment are consistent with the implementation of FOLU mitigation actions and can help reach additional carbon uptakes in soil and biomass.
- Adaptation actions targeting the promotion of climate-smart and sustainable agriculture, forestry and fisheries can result in mitigation co-benefits, in line with the objectives defined for croplands and grassland within the FOLU sector.
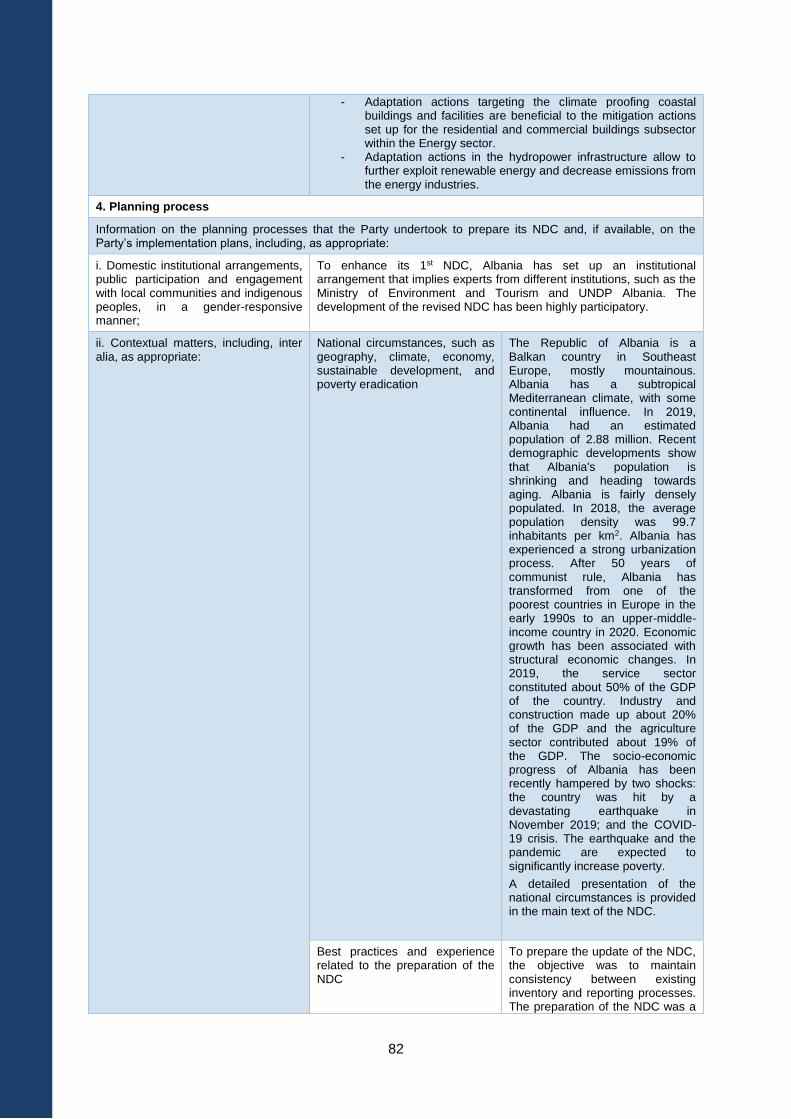
82
- Adaptation actions targeting the climate proofing coastal buildings and facilities are beneficial to the mitigation actions set up for the residential and commercial buildings subsector within the Energy sector.
- Adaptation actions in the hydropower infrastructure allow to further exploit renewable energy and decrease emissions from the energy industries.
4. Planning process
Information on the planning processes that the Party undertook to prepare its NDC and, if available, on the Party’s implementation plans, including, as appropriate:
i. Domestic institutional arrangements, public participation and engagement with local communities and indigenous peoples, in a gender-responsive manner;
To enhance its 1st NDC, Albania has set up an institutional arrangement that implies experts from different institutions, such as the Ministry of Environment and Tourism and UNDP Albania. The development of the revised NDC has been highly participatory.
ii. Contextual matters, including, inter alia, as appropriate:
National circumstances, such as geography, climate, economy, sustainable development, and poverty eradication
The Republic of Albania is a Balkan country in Southeast Europe, mostly mountainous. Albania has a subtropical Mediterranean climate, with some continental influence. In 2019, Albania had an estimated population of 2.88 million. Recent demographic developments show that Albania's population is shrinking and heading towards aging. Albania is fairly densely populated. In 2018, the average population density was 99.7 inhabitants per km2. Albania has experienced a strong urbanization process. After 50 years of communist rule, Albania has transformed from one of the poorest countries in Europe in the early 1990s to an upper-middle-income country in 2020. Economic growth has been associated with structural economic changes. In 2019, the service sector constituted about 50% of the GDP of the country. Industry and construction made up about 20% of the GDP and the agriculture sector contributed about 19% of the GDP. The socio-economic progress of Albania has been recently hampered by two shocks: the country was hit by a devastating earthquake in November 2019; and the COVID-19 crisis. The earthquake and the pandemic are expected to significantly increase poverty.
A detailed presentation of the national circumstances is provided in the main text of the NDC.
Best practices and experience related to the preparation of the NDC
To prepare the update of the NDC, the objective was to maintain consistency between existing inventory and reporting processes. The preparation of the NDC was a
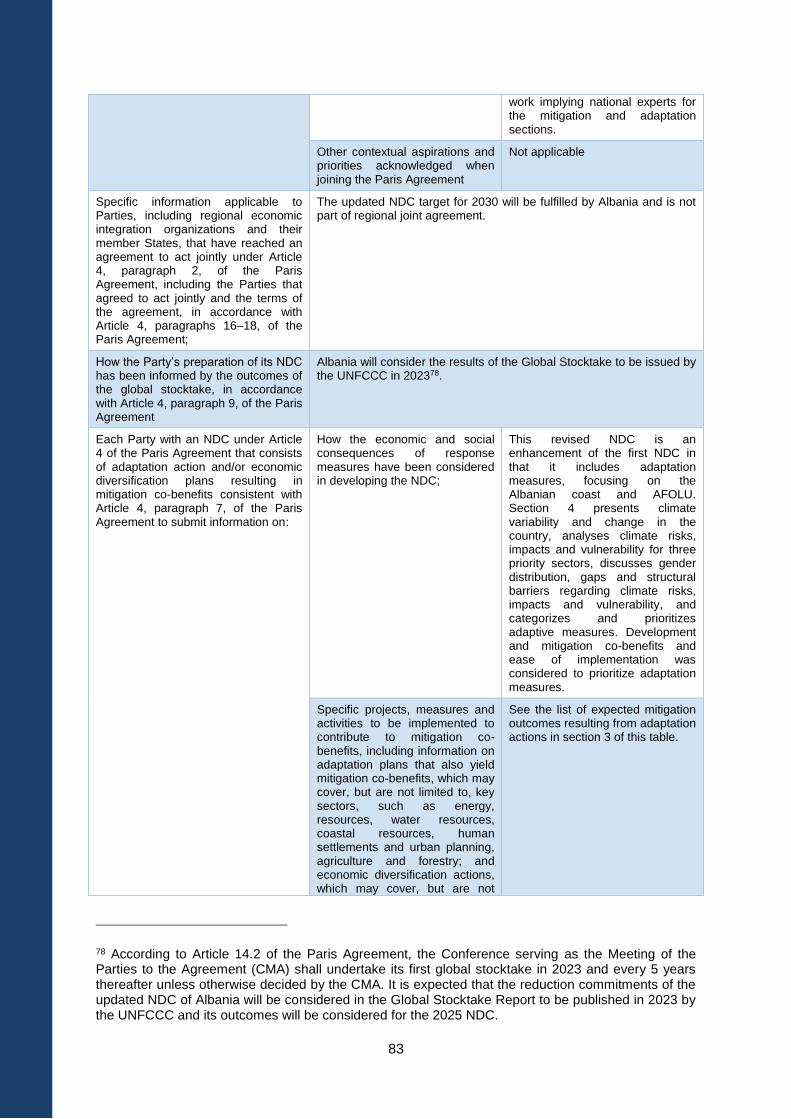
83
work implying national experts for the mitigation and adaptation sections.
Other contextual aspirations and priorities acknowledged when joining the Paris Agreement
Not applicable
Specific information applicable to Parties, including regional economic integration organizations and their member States, that have reached an agreement to act jointly under Article 4, paragraph 2, of the Paris Agreement, including the Parties that agreed to act jointly and the terms of the agreement, in accordance with Article 4, paragraphs 16–18, of the Paris Agreement;
The updated NDC target for 2030 will be fulfilled by Albania and is not part of regional joint agreement.
How the Party’s preparation of its NDC has been informed by the outcomes of the global stocktake, in accordance with Article 4, paragraph 9, of the Paris Agreement
Albania will consider the results of the Global Stocktake to be issued by the UNFCCC in 202378.
Each Party with an NDC under Article 4 of the Paris Agreement that consists of adaptation action and/or economic diversification plans resulting in mitigation co-benefits consistent with Article 4, paragraph 7, of the Paris Agreement to submit information on:
How the economic and social consequences of response measures have been considered in developing the NDC;
This revised NDC is an enhancement of the first NDC in that it includes adaptation measures, focusing on the Albanian coast and AFOLU. Section 4 presents climate variability and change in the country, analyses climate risks, impacts and vulnerability for three priority sectors, discusses gender distribution, gaps and structural barriers regarding climate risks, impacts and vulnerability, and categorizes and prioritizes adaptive measures. Development and mitigation co-benefits and ease of implementation was considered to prioritize adaptation measures.
Specific projects, measures and activities to be implemented to contribute to mitigation co-benefits, including information on adaptation plans that also yield mitigation co-benefits, which may cover, but are not limited to, key sectors, such as energy, resources, water resources, coastal resources, human settlements and urban planning, agriculture and forestry; and economic diversification actions, which may cover, but are not
See the list of expected mitigation outcomes resulting from adaptation actions in section 3 of this table.
78 According to Article 14.2 of the Paris Agreement, the Conference serving as the Meeting of the Parties to the Agreement (CMA) shall undertake its first global stocktake in 2023 and every 5 years thereafter unless otherwise decided by the CMA. It is expected that the reduction commitments of the updated NDC of Albania will be considered in the Global Stocktake Report to be published in 2023 by the UNFCCC and its outcomes will be considered for the 2025 NDC.
84
limited to, sectors such as manufacturing and industry, energy and mining, transport and communication, construction, tourism, real estate, agriculture and fisheries
5. Assumptions and methodological approaches, including those for estimating and accounting for anthropogenic greenhouse gas emissions and, as appropriate, removals
Assumptions and methodological approaches used for accounting for anthropogenic greenhouse gas emissions and removals corresponding to the Party’s nationally determined contribution, consistent with decision 1/CP.21, paragraph 31, and accounting guidance adopted by the CMA
Methods applied are presented in the main text of the NDC.
Assumptions and methodological approaches used for accounting for the implementation of policies and measures or strategies in the nationally determined contribution
The NDC takes into account current and draft policies and measures that have been used to define the list of mitigation actions for each sector. Assumptions about the level of implementation of these policies and measures were prepared in discussion with national experts, considering the national circumstances and the current level of implementation of existing objectives.
If applicable, information on how the Party will take into account existing methods and guidance under the Convention to account for anthropogenic emissions and removals, in accordance with Article 4, paragraph 14, of the Paris Agreement, as appropriate;
The NDC takes into account the existing methods and guidance under the Convention, and considers its key principles of transparency, accuracy, completeness, comparability and consistency, and ensure the avoidance of double counting.
IPCC methodologies and metrics used for estimating anthropogenic greenhouse gas emissions and removal.
Methodologies from IPCC 2006 Guidelines are applied to estimate historical and projected emissions. The NDC is consistent with the latest national GHG inventory compiled. Global Warming Potential Values from IPCC Second Assessment Report are applied.
Sector-, category- or activity-specific assumptions, methodologies and approaches consistent with IPCC guidance, as appropriate, including, as applicable
i. Approach to addressing emissions and subsequent removals from natural disturbances on managed lands;
Natural disturbances are accounted for in the inventory and in the calculation of projections for the NDC. Forest wildfires are the only disturbances considered and are not excluded from the total of emissions in the FOLU. A background level (excluding exceptional episodes) of emissions is used for the projections, as exceptional episodes cannot be predicted.
ii. Approach used to account for emissions and removals from harvested wood products;
HWP are not yet accounted in the national inventory, immediate oxidation assumption is applied. The same is done in the NDC to be consistent. Next inventories will consider whether HWP calculation could be improved.
iii. Approach used to address the effects of age-class structure in forests;
No specific modelling of forest biomass has been applied. Projection is based on the parameters (increment rate, losses) used in the inventory.
Other assumptions and methodological approaches used for
i. How the reference indicators, baseline(s) and/or reference
The BAU scenario is based on the most likely evolution of the
85
understanding the nationally determined contribution and, if applicable, estimating corresponding emissions and removals, including
level(s), including, where applicable, sector-, category- or activity specific reference levels, are constructed, including, for example, key parameters, assumptions, definitions, methodologies, data sources and models used;
Albanian energy sector according to the baseline scenario of the National Energy Strategy approved by the Albanian Government on August 8, 2021 and with no further policy interventions. It was developed accordingly to the National Energy Strategy considering new set of macro-economic drivers such as GDP and population. LEAP was the energy model used for energy demand forecast until 2030.
ii. For Parties with nationally determined contributions that contain non-greenhouse-gas components, information on assumptions and methodological approaches used in relation to those components, as applicable;
Not applicable
iii. For climate forcers included in nationally determined contributions not covered by IPCC guidelines, information on how the climate forcers are estimated;
Not applicable
iv. Further technical information, as necessary;
Not applicable
The intention to use voluntary
cooperation under Article 6 of the
Paris Agreement, if applicable
The accounting rules for international carbon markets under Article 6 of
the Paris Agreement have not been set up yet. Albania intends to sell
carbon credits during the period until 2030 to contribute to
cost‐effective implementation of the low emission development
pathway and its sustainable development. Albania foresees that the
utilization of international market mechanism is conditional on having
effective accounting rules developed under the UNFCCC to ensure the
environmental integrity of the mechanisms.
6. How the Party considers that its NDC is fair and ambitious in light of its national circumstances
How the Party considers that its NDC
is fair and ambitious, in the light of its
national circumstances,
Albania will take into account the ultimate objective of the UNFCCC in
its future development and commits to decouple GHG emissions from
its economic growth and embark on a low emission development
pathway beyond 2030.
Albania considers its update of the INDC ambitious because it covers
more sectors and gases, and it increases the reduction target
compared to BAU to be achieved in 2030. To ensure the
implementation of this higher mitigation ambition, substantial
investments will be required. The updated NDC target thus represent
progression beyond the current NDC. Adaptation has also been
considered in the updated NDC.
The country’s emissions per capita will remain substantially lower than
the European average (3.5 Mg CO2 eq. per capita in Albania,
compared to 8.4 Mg CO2 eq. per capita in the EU-27).
Fairness considerations, including
reflecting on equity;
How the Party has addressed Article 4, paragraph 3, of the Paris Agreement;
Albania’s updated NDC represents an enhancement of the first NDC, as the scope includes more sectors and gases, and the mitigation target in 2030 is more ambitious (from 11.5% to 20.9%).
How the Party has addressed Article 4, paragraph 4, of the Paris Agreement;
The updated NDC includes all sectors except PFCs, SF6 and NF3 from IPPU, while the first NDC included only Energy sector, showing the intent to have a mitigation target covering all sectors.
How the Party has addressed Article 4, paragraph 6, of the Paris
Not applicable
86
Agreement.
7. How the NDC contributes towards achieving the objectives of the Convention as set out in its Article 2
How the NDC contributes towards achieving the objective stated in UNFCCC Article 2, which has been later clarified as the objective of limiting global warming at +2°C and if possible +1.5°C through the climate neutrality during the 21st century
The revised NDC of Albania contributes to the global mitigation effort considering its national circumstances. The mitigation actions are defined for all sectors and therefore tackle all sectors of the economy. The inclusion of the FOLU sector allows an increase in the absorptions by the sinks of this sector, which could contribute to the global climate neutrality during the second half of the 21st century.
How the NDC contributes towards Article 2, paragraph 1(a), and Article 4, paragraph 1, of the Paris Agreement
Albania is a developing country, highly vulnerable to the effects of the climate change. National GHG emissions represent only 0.02% of global emissions in 2016.
Considering the national circumstances for the economic development of the country, the NDC mitigation actions reduce the increase of emission from 2016 to 2030. A peak of emissions is not projected during the timeframe of the current NDC.
7. ANNEXES
Annex 1. Mitigation calculations (details for sectors)
7.1. Energy
The BAU scenario is based on the most likely evolution of the Albanian energy sector with no
further policy interventions. It was developed according to the National Energy Strategy
considering new set of macro-economic drivers such as GDP and population. The base year was
calibrated to the official 2016 national GHG inventory. The current structure of energy supply and
demand in all economic sectors remains similar to the base year. A continued prevalent use of
electrical energy for heating and warm water in residential and the service sector. A significant
portion of future demand for electricity is met through new power hydropower plants but also new
thermal general based on imported natural gas. It is expected that Albania will become a net
exporter of electricity from 2025 onwards. National energy intensity decreases only slightly in the
BAU scenario from 2016 to 2030.
The NDC scenario is based on the National Energy Strategy and also takes into account the Gas
Master Plan of Albania, considering the introduction of natural gas in almost all sectors (including
energy industry, manufacturing industry, transport, commercial, residential and agriculture). This
scenario considers the implementation of the different National Energy Efficiencies Actions Plans
(NEEAP) to increase energy efficiencies in both supply and demand reaching a 15% gain in
2030. The 15% in final demand is split among sectors as presented in the table below.
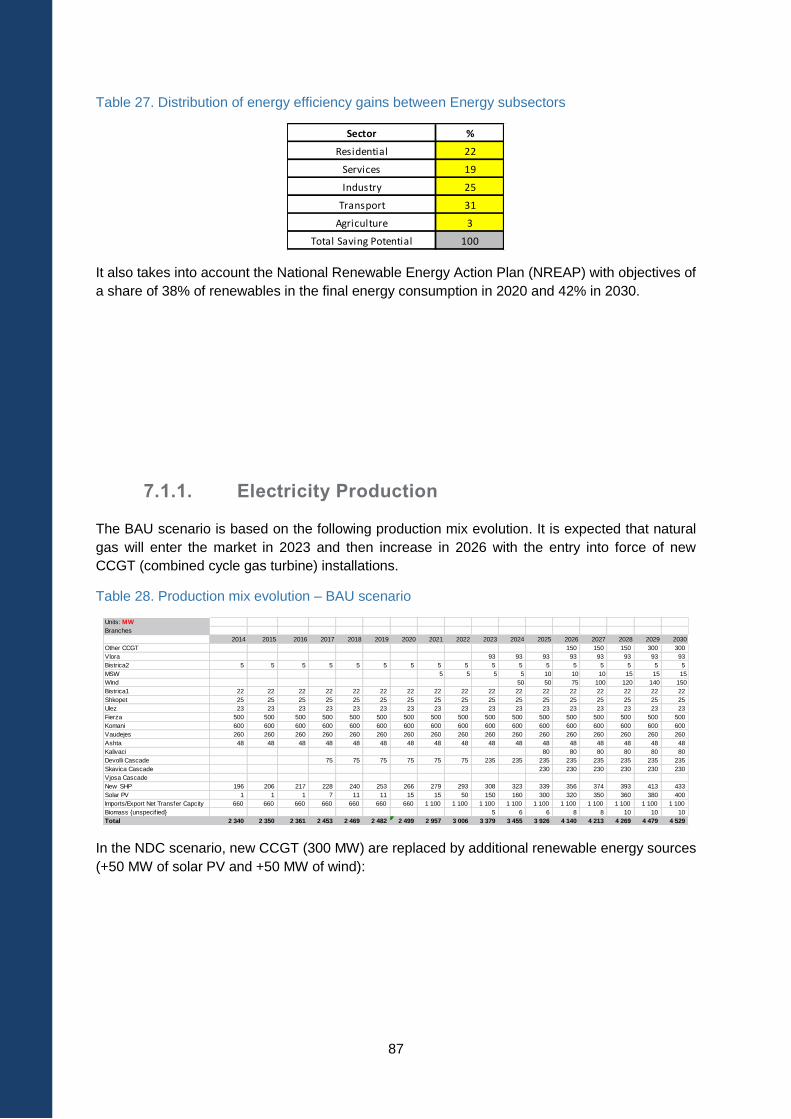
87
Table 27. Distribution of energy efficiency gains between Energy subsectors
It also takes into account the National Renewable Energy Action Plan (NREAP) with objectives of
a share of 38% of renewables in the final energy consumption in 2020 and 42% in 2030.
7.1.1. Electricity Production
The BAU scenario is based on the following production mix evolution. It is expected that natural
gas will enter the market in 2023 and then increase in 2026 with the entry into force of new
CCGT (combined cycle gas turbine) installations.
Table 28. Production mix evolution – BAU scenario
In the NDC scenario, new CCGT (300 MW) are replaced by additional renewable energy sources
(+50 MW of solar PV and +50 MW of wind):
Sector %
Residential 22
Services 19
Industry 25
Transport 31
Agriculture 3
Total Saving Potential 100
Units: MW
Branches
2014 2015 2016 2017 2018 2019 2020 2021 2022 2023 2024 2025 2026 2027 2028 2029 2030
Other CCGT 150 150 150 300 300
Vlora 93 93 93 93 93 93 93 93
Bistrica2 5 5 5 5 5 5 5 5 5 5 5 5 5 5 5 5 5
MSW 5 5 5 5 10 10 10 15 15 15
Wind 50 50 75 100 120 140 150
Bistrica1 22 22 22 22 22 22 22 22 22 22 22 22 22 22 22 22 22
Shkopet 25 25 25 25 25 25 25 25 25 25 25 25 25 25 25 25 25
Ulez 23 23 23 23 23 23 23 23 23 23 23 23 23 23 23 23 23
Fierza 500 500 500 500 500 500 500 500 500 500 500 500 500 500 500 500 500
Komani 600 600 600 600 600 600 600 600 600 600 600 600 600 600 600 600 600
Vaudejes 260 260 260 260 260 260 260 260 260 260 260 260 260 260 260 260 260
Ashta 48 48 48 48 48 48 48 48 48 48 48 48 48 48 48 48 48
Kalivaci 80 80 80 80 80 80
Devolli Cascade 75 75 75 75 75 75 235 235 235 235 235 235 235 235
Skavica Cascade 230 230 230 230 230 230
Vjosa Cascade
New SHP 196 206 217 228 240 253 266 279 293 308 323 339 356 374 393 413 433
Solar PV 1 1 1 7 11 11 15 15 50 150 160 300 320 350 360 380 400
Imports/Export Net Transfer Capcity 660 660 660 660 660 660 660 1 100 1 100 1 100 1 100 1 100 1 100 1 100 1 100 1 100 1 100
Biomass {unspecif ied} 5 6 6 8 8 10 10 10
Total 2 340 2 350 2 361 2 453 2 469 2 482 2 499 2 957 3 006 3 379 3 455 3 926 4 140 4 213 4 269 4 479 4 529
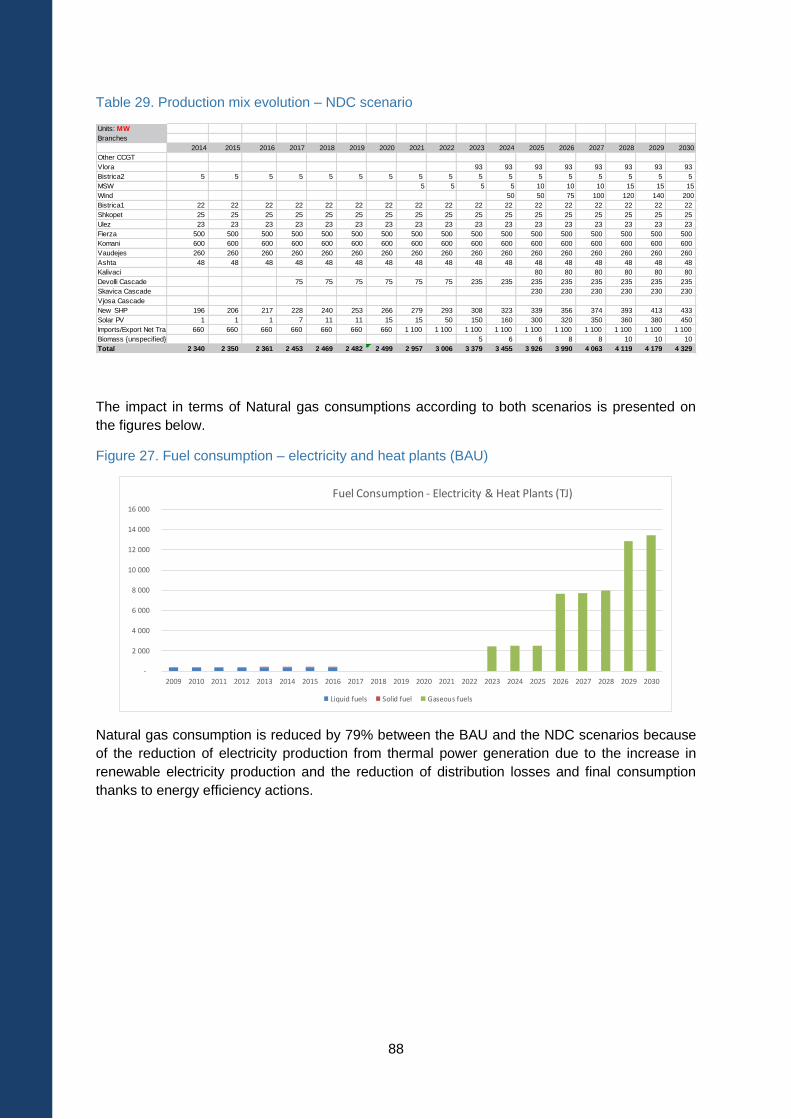
88
Table 29. Production mix evolution – NDC scenario
The impact in terms of Natural gas consumptions according to both scenarios is presented on
the figures below.
Figure 27. Fuel consumption – electricity and heat plants (BAU)
Natural gas consumption is reduced by 79% between the BAU and the NDC scenarios because
of the reduction of electricity production from thermal power generation due to the increase in
renewable electricity production and the reduction of distribution losses and final consumption
thanks to energy efficiency actions.
Units: MW
Branches
2014 2015 2016 2017 2018 2019 2020 2021 2022 2023 2024 2025 2026 2027 2028 2029 2030
Other CCGT
Vlora 93 93 93 93 93 93 93 93
Bistrica2 5 5 5 5 5 5 5 5 5 5 5 5 5 5 5 5 5
MSW 5 5 5 5 10 10 10 15 15 15
Wind 50 50 75 100 120 140 200
Bistrica1 22 22 22 22 22 22 22 22 22 22 22 22 22 22 22 22 22
Shkopet 25 25 25 25 25 25 25 25 25 25 25 25 25 25 25 25 25
Ulez 23 23 23 23 23 23 23 23 23 23 23 23 23 23 23 23 23
Fierza 500 500 500 500 500 500 500 500 500 500 500 500 500 500 500 500 500
Komani 600 600 600 600 600 600 600 600 600 600 600 600 600 600 600 600 600
Vaudejes 260 260 260 260 260 260 260 260 260 260 260 260 260 260 260 260 260
Ashta 48 48 48 48 48 48 48 48 48 48 48 48 48 48 48 48 48
Kalivaci 80 80 80 80 80 80
Devolli Cascade 75 75 75 75 75 75 235 235 235 235 235 235 235 235
Skavica Cascade 230 230 230 230 230 230
Vjosa Cascade
New SHP 196 206 217 228 240 253 266 279 293 308 323 339 356 374 393 413 433
Solar PV 1 1 1 7 11 11 15 15 50 150 160 300 320 350 360 380 450
Imports/Export Net Transfer Capcity660 660 660 660 660 660 660 1 100 1 100 1 100 1 100 1 100 1 100 1 100 1 100 1 100 1 100
Biomass {unspecif ied} 5 6 6 8 8 10 10 10
Total 2 340 2 350 2 361 2 453 2 469 2 482 2 499 2 957 3 006 3 379 3 455 3 926 3 990 4 063 4 119 4 179 4 329
-
2 000
4 000
6 000
8 000
10 000
12 000
14 000
16 000
2009 2010 2011 2012 2013 2014 2015 2016 2017 2018 2019 2020 2021 2022 2023 2024 2025 2026 2027 2028 2029 2030
Fuel Consumption - Electricity & Heat Plants (TJ)
Liquid fuels Solid fuel Gaseous fuels
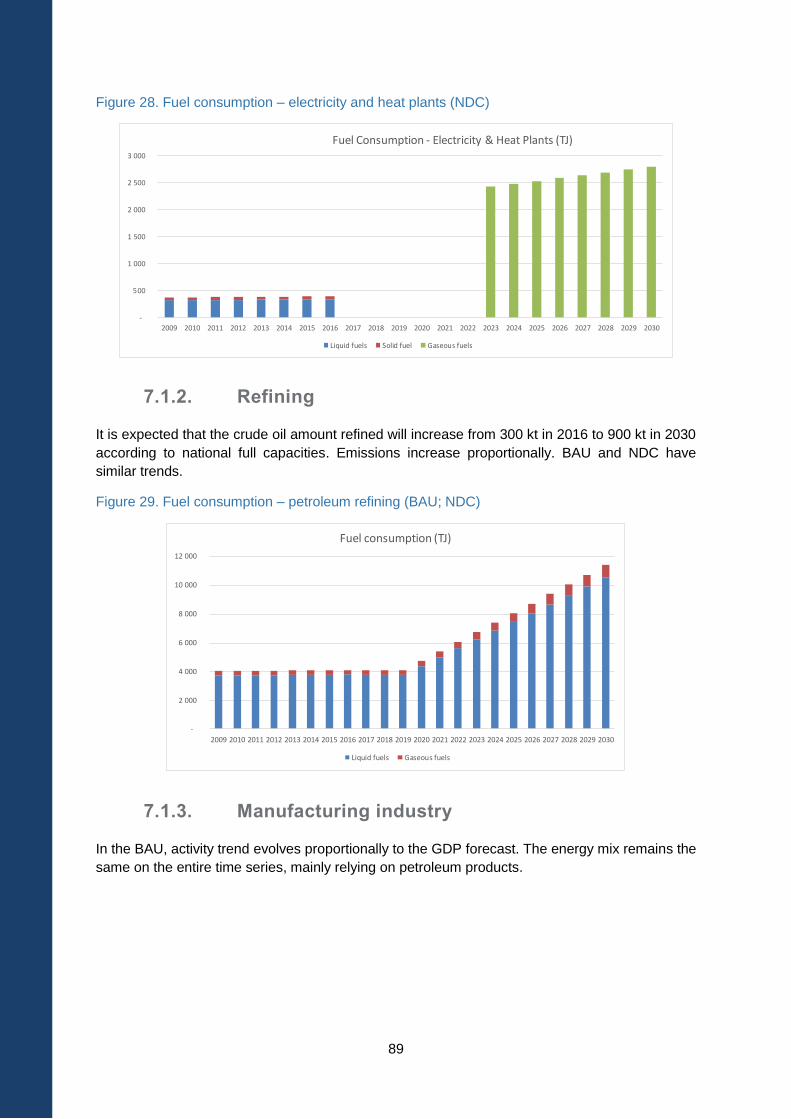
89
Figure 28. Fuel consumption – electricity and heat plants (NDC)
7.1.2. Refining
It is expected that the crude oil amount refined will increase from 300 kt in 2016 to 900 kt in 2030
according to national full capacities. Emissions increase proportionally. BAU and NDC have
similar trends.
Figure 29. Fuel consumption – petroleum refining (BAU; NDC)
7.1.3. Manufacturing industry
In the BAU, activity trend evolves proportionally to the GDP forecast. The energy mix remains the
same on the entire time series, mainly relying on petroleum products.
-
500
1 000
1 500
2 000
2 500
3 000
2009 2010 2011 2012 2013 2014 2015 2016 2017 2018 2019 2020 2021 2022 2023 2024 2025 2026 2027 2028 2029 2030
Fuel Consumption - Electricity & Heat Plants (TJ)
Liquid fuels Solid fuel Gaseous fuels
-
2 000
4 000
6 000
8 000
10 000
12 000
2009 2010 2011 2012 2013 2014 2015 2016 2017 2018 2019 2020 2021 2022 2023 2024 2025 2026 2027 2028 2029 2030
Fuel consumption (TJ)
Liquid fuels Gaseous fuels
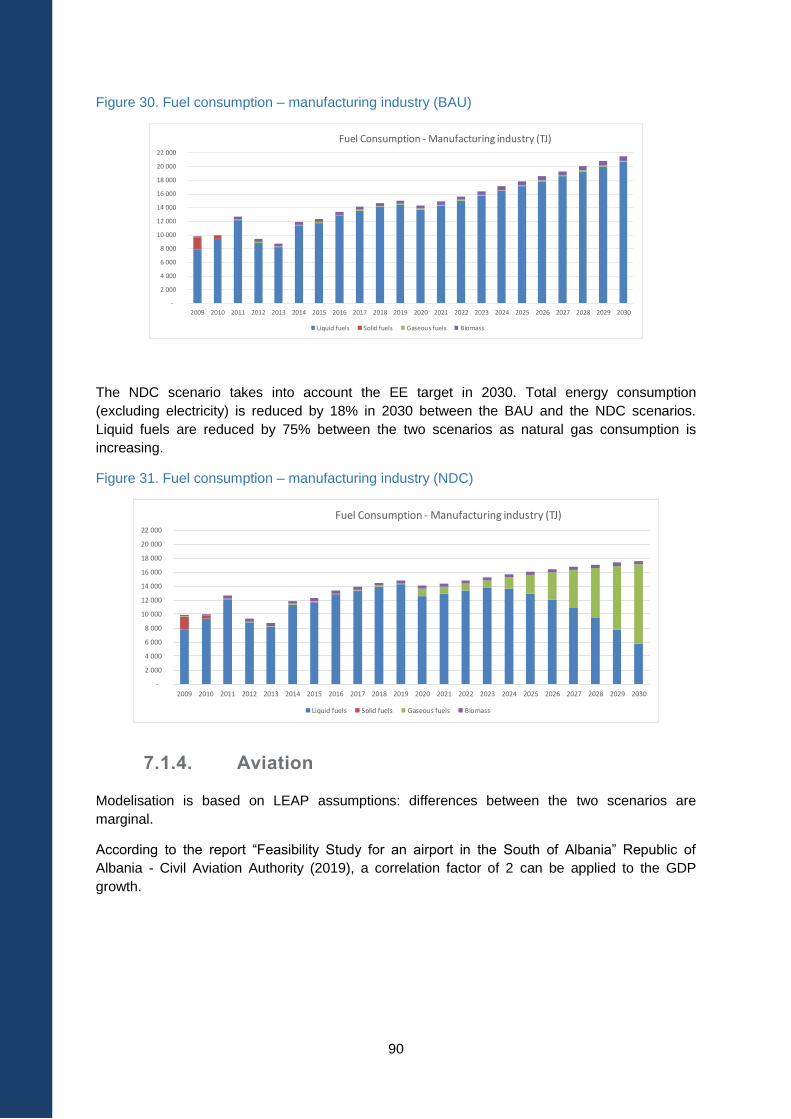
90
Figure 30. Fuel consumption – manufacturing industry (BAU)
The NDC scenario takes into account the EE target in 2030. Total energy consumption
(excluding electricity) is reduced by 18% in 2030 between the BAU and the NDC scenarios.
Liquid fuels are reduced by 75% between the two scenarios as natural gas consumption is
increasing.
Figure 31. Fuel consumption – manufacturing industry (NDC)
7.1.4. Aviation
Modelisation is based on LEAP assumptions: differences between the two scenarios are
marginal.
According to the report “Feasibility Study for an airport in the South of Albania” Republic of
Albania - Civil Aviation Authority (2019), a correlation factor of 2 can be applied to the GDP
growth.
-
2 000
4 000
6 000
8 000
10 000
12 000
14 000
16 000
18 000
20 000
22 000
2009 2010 2011 2012 2013 2014 2015 2016 2017 2018 2019 2020 2021 2022 2023 2024 2025 2026 2027 2028 2029 2030
Fuel Consumption - Manufacturing industry (TJ)
Liquid fuels Solid fuels Gaseous fuels Biomass
-
2 000
4 000
6 000
8 000
10 000
12 000
14 000
16 000
18 000
20 000
22 000
2009 2010 2011 2012 2013 2014 2015 2016 2017 2018 2019 2020 2021 2022 2023 2024 2025 2026 2027 2028 2029 2030
Fuel Consumption - Manufacturing industry (TJ)
Liquid fuels Solid fuels Gaseous fuels Biomass
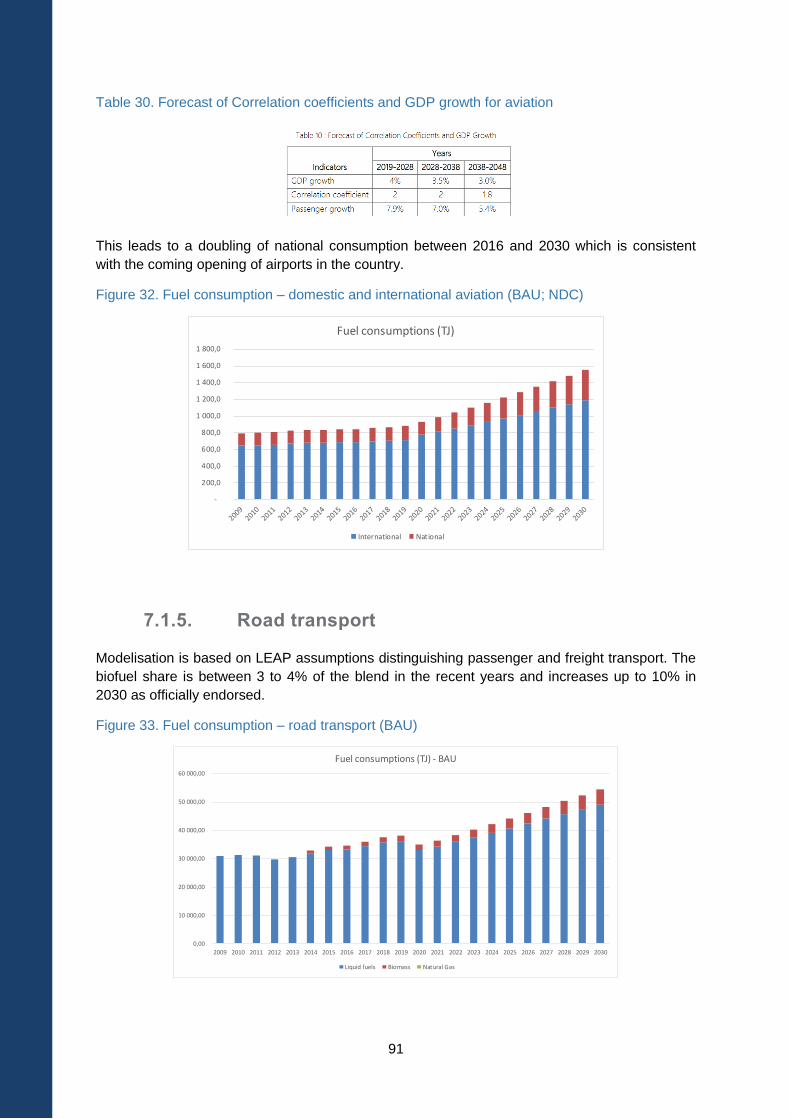
91
Table 30. Forecast of Correlation coefficients and GDP growth for aviation
This leads to a doubling of national consumption between 2016 and 2030 which is consistent
with the coming opening of airports in the country.
Figure 32. Fuel consumption – domestic and international aviation (BAU; NDC)
7.1.5. Road transport
Modelisation is based on LEAP assumptions distinguishing passenger and freight transport. The
biofuel share is between 3 to 4% of the blend in the recent years and increases up to 10% in
2030 as officially endorsed.
Figure 33. Fuel consumption – road transport (BAU)
-
200,0
400,0
600,0
800,0
1 000,0
1 200,0
1 400,0
1 600,0
1 800,0
Fuel consumptions (TJ)
International National
0,00
10 000,00
20 000,00
30 000,00
40 000,00
50 000,00
60 000,00
2009 2010 2011 2012 2013 2014 2015 2016 2017 2018 2019 2020 2021 2022 2023 2024 2025 2026 2027 2028 2029 2030
Fuel consumptions (TJ) - BAU
Liquid fuels Biomass Natural Gas
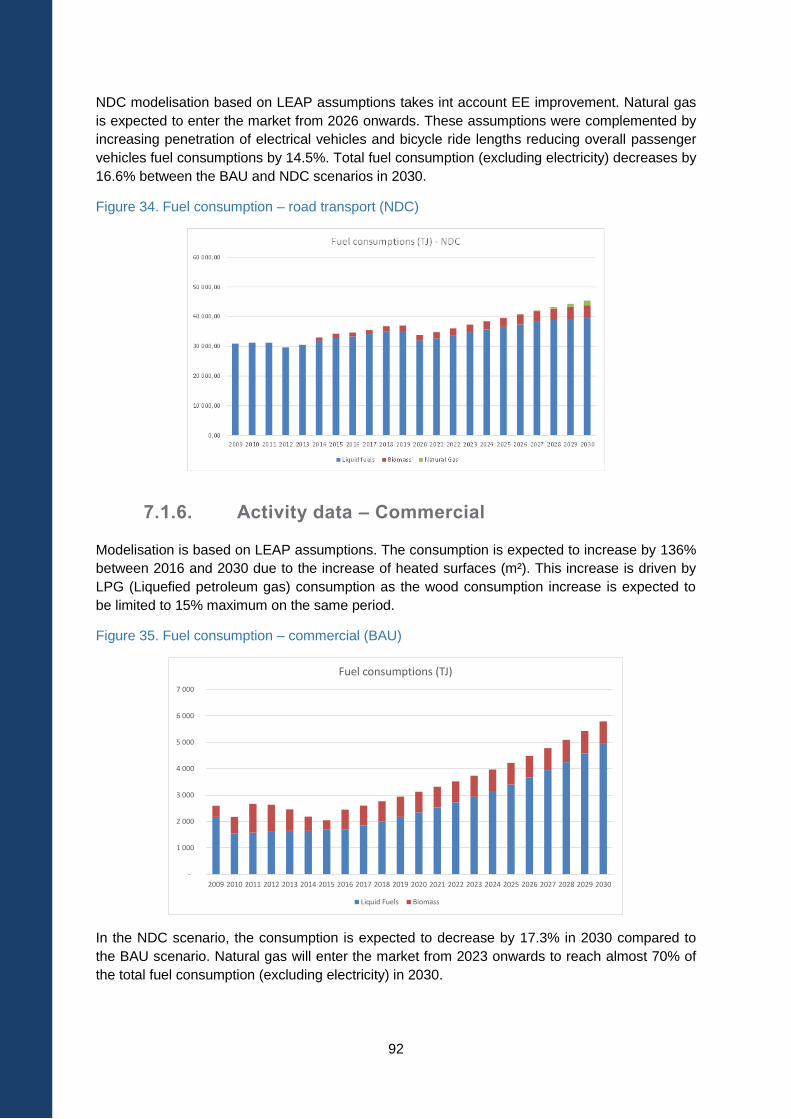
92
NDC modelisation based on LEAP assumptions takes int account EE improvement. Natural gas
is expected to enter the market from 2026 onwards. These assumptions were complemented by
increasing penetration of electrical vehicles and bicycle ride lengths reducing overall passenger
vehicles fuel consumptions by 14.5%. Total fuel consumption (excluding electricity) decreases by
16.6% between the BAU and NDC scenarios in 2030.
Figure 34. Fuel consumption – road transport (NDC)
7.1.6. Activity data – Commercial
Modelisation is based on LEAP assumptions. The consumption is expected to increase by 136%
between 2016 and 2030 due to the increase of heated surfaces (m²). This increase is driven by
LPG (Liquefied petroleum gas) consumption as the wood consumption increase is expected to
be limited to 15% maximum on the same period.
Figure 35. Fuel consumption – commercial (BAU)
In the NDC scenario, the consumption is expected to decrease by 17.3% in 2030 compared to
the BAU scenario. Natural gas will enter the market from 2023 onwards to reach almost 70% of
the total fuel consumption (excluding electricity) in 2030.
-
1 000
2 000
3 000
4 000
5 000
6 000
7 000
2009 2010 2011 2012 2013 2014 2015 2016 2017 2018 2019 2020 2021 2022 2023 2024 2025 2026 2027 2028 2029 2030
Fuel consumptions (TJ)
Liquid Fuels Biomass
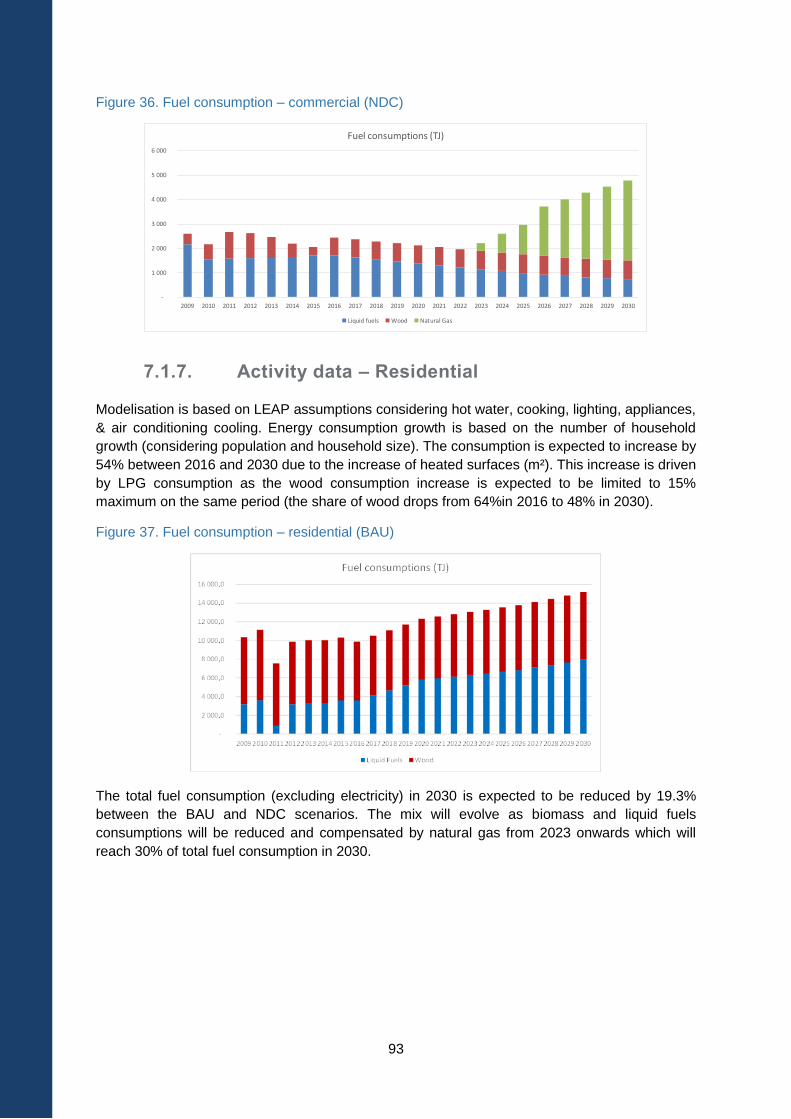
93
Figure 36. Fuel consumption – commercial (NDC)
7.1.7. Activity data – Residential
Modelisation is based on LEAP assumptions considering hot water, cooking, lighting, appliances,
& air conditioning cooling. Energy consumption growth is based on the number of household
growth (considering population and household size). The consumption is expected to increase by
54% between 2016 and 2030 due to the increase of heated surfaces (m²). This increase is driven
by LPG consumption as the wood consumption increase is expected to be limited to 15%
maximum on the same period (the share of wood drops from 64%in 2016 to 48% in 2030).
Figure 37. Fuel consumption – residential (BAU)
The total fuel consumption (excluding electricity) in 2030 is expected to be reduced by 19.3%
between the BAU and NDC scenarios. The mix will evolve as biomass and liquid fuels
consumptions will be reduced and compensated by natural gas from 2023 onwards which will
reach 30% of total fuel consumption in 2030.
-
1 000
2 000
3 000
4 000
5 000
6 000
2009 2010 2011 2012 2013 2014 2015 2016 2017 2018 2019 2020 2021 2022 2023 2024 2025 2026 2027 2028 2029 2030
Fuel consumptions (TJ)
Liquid fuels Wood Natural Gas
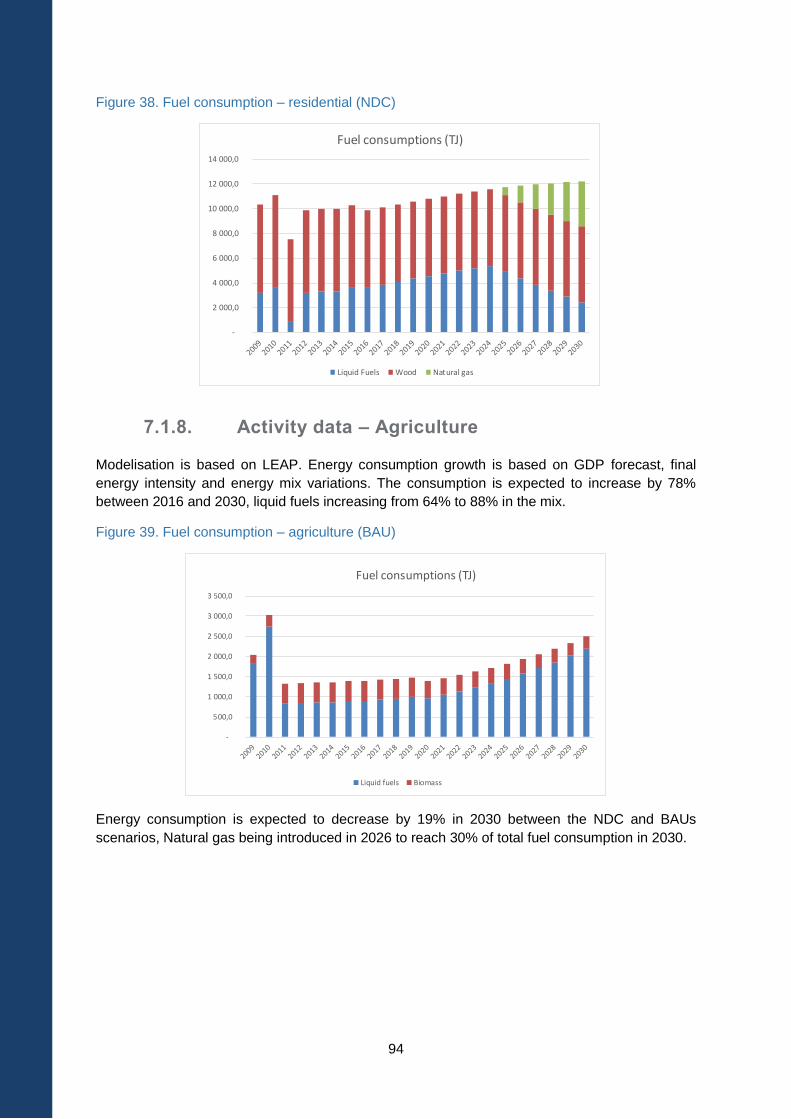
94
Figure 38. Fuel consumption – residential (NDC)
7.1.8. Activity data – Agriculture
Modelisation is based on LEAP. Energy consumption growth is based on GDP forecast, final
energy intensity and energy mix variations. The consumption is expected to increase by 78%
between 2016 and 2030, liquid fuels increasing from 64% to 88% in the mix.
Figure 39. Fuel consumption – agriculture (BAU)
Energy consumption is expected to decrease by 19% in 2030 between the NDC and BAUs
scenarios, Natural gas being introduced in 2026 to reach 30% of total fuel consumption in 2030.
-
2 000,0
4 000,0
6 000,0
8 000,0
10 000,0
12 000,0
14 000,0
Fuel consumptions (TJ)
Liquid Fuels Wood Natural gas
-
500,0
1 000,0
1 500,0
2 000,0
2 500,0
3 000,0
3 500,0
Fuel consumptions (TJ)
Liquid fuels Biomass
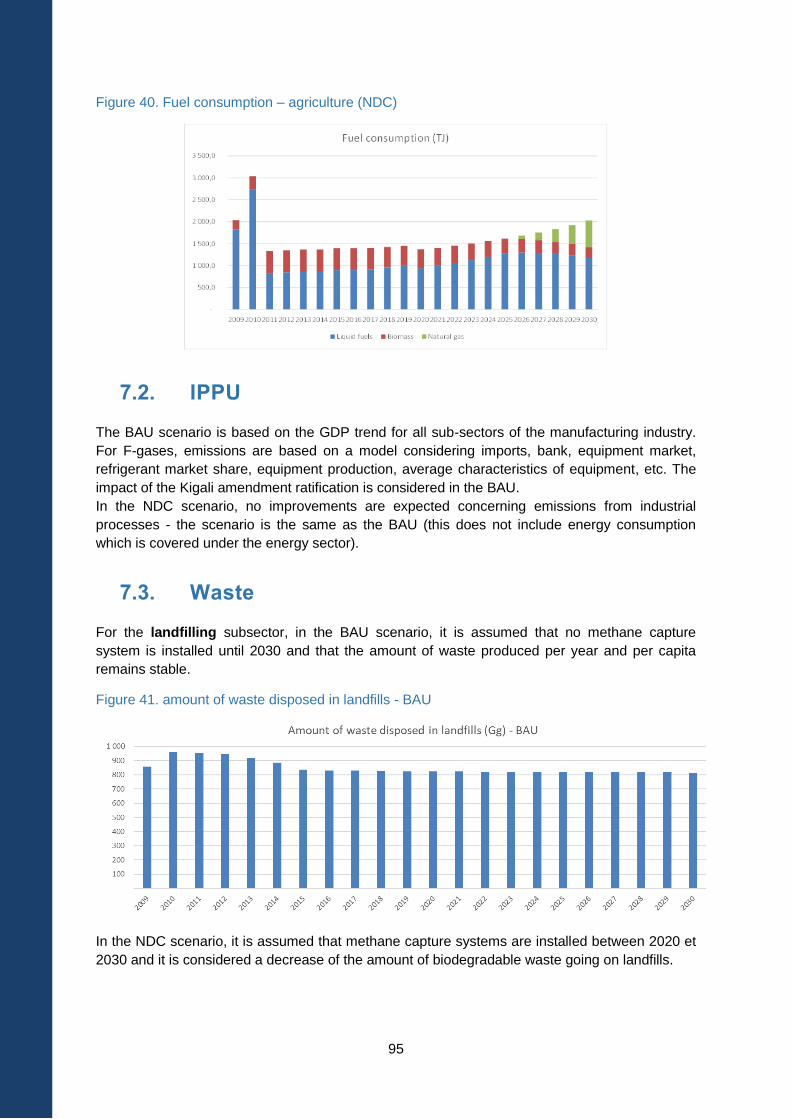
95
Figure 40. Fuel consumption – agriculture (NDC)
7.2. IPPU
The BAU scenario is based on the GDP trend for all sub-sectors of the manufacturing industry.
For F-gases, emissions are based on a model considering imports, bank, equipment market,
refrigerant market share, equipment production, average characteristics of equipment, etc. The
impact of the Kigali amendment ratification is considered in the BAU.
In the NDC scenario, no improvements are expected concerning emissions from industrial
processes - the scenario is the same as the BAU (this does not include energy consumption
which is covered under the energy sector).
7.3. Waste
For the landfilling subsector, in the BAU scenario, it is assumed that no methane capture
system is installed until 2030 and that the amount of waste produced per year and per capita
remains stable.
Figure 41. amount of waste disposed in landfills - BAU
In the NDC scenario, it is assumed that methane capture systems are installed between 2020 et
2030 and it is considered a decrease of the amount of biodegradable waste going on landfills.
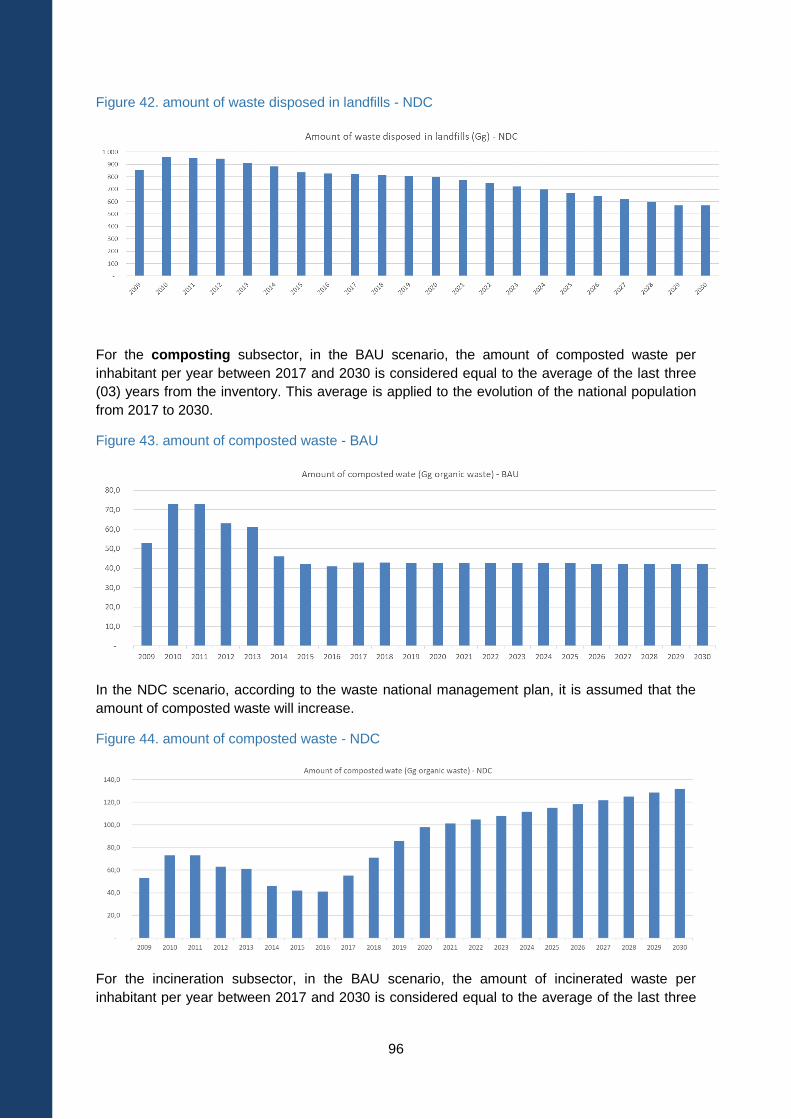
96
Figure 42. amount of waste disposed in landfills - NDC
For the composting subsector, in the BAU scenario, the amount of composted waste per
inhabitant per year between 2017 and 2030 is considered equal to the average of the last three
(03) years from the inventory. This average is applied to the evolution of the national population
from 2017 to 2030.
Figure 43. amount of composted waste - BAU
In the NDC scenario, according to the waste national management plan, it is assumed that the
amount of composted waste will increase.
Figure 44. amount of composted waste - NDC
For the incineration subsector, in the BAU scenario, the amount of incinerated waste per
inhabitant per year between 2017 and 2030 is considered equal to the average of the last three
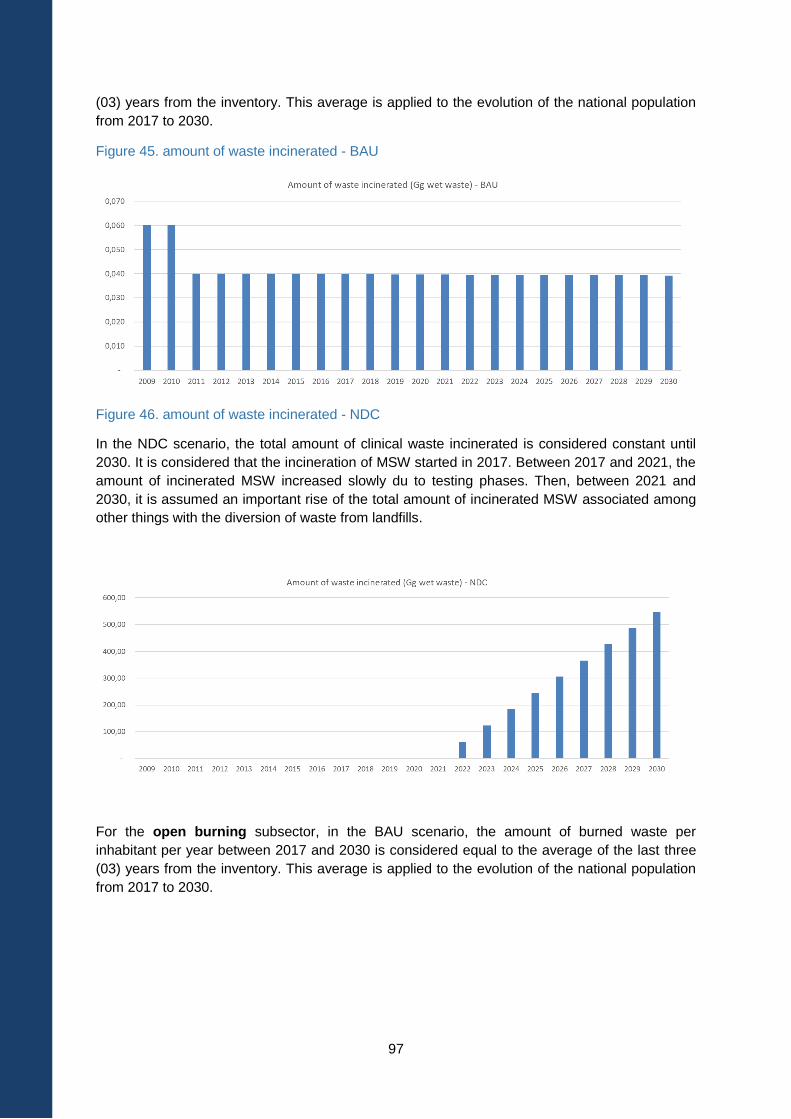
97
(03) years from the inventory. This average is applied to the evolution of the national population
from 2017 to 2030.
Figure 45. amount of waste incinerated - BAU
Figure 46. amount of waste incinerated - NDC
In the NDC scenario, the total amount of clinical waste incinerated is considered constant until
2030. It is considered that the incineration of MSW started in 2017. Between 2017 and 2021, the
amount of incinerated MSW increased slowly du to testing phases. Then, between 2021 and
2030, it is assumed an important rise of the total amount of incinerated MSW associated among
other things with the diversion of waste from landfills.
For the open burning subsector, in the BAU scenario, the amount of burned waste per
inhabitant per year between 2017 and 2030 is considered equal to the average of the last three
(03) years from the inventory. This average is applied to the evolution of the national population
from 2017 to 2030.
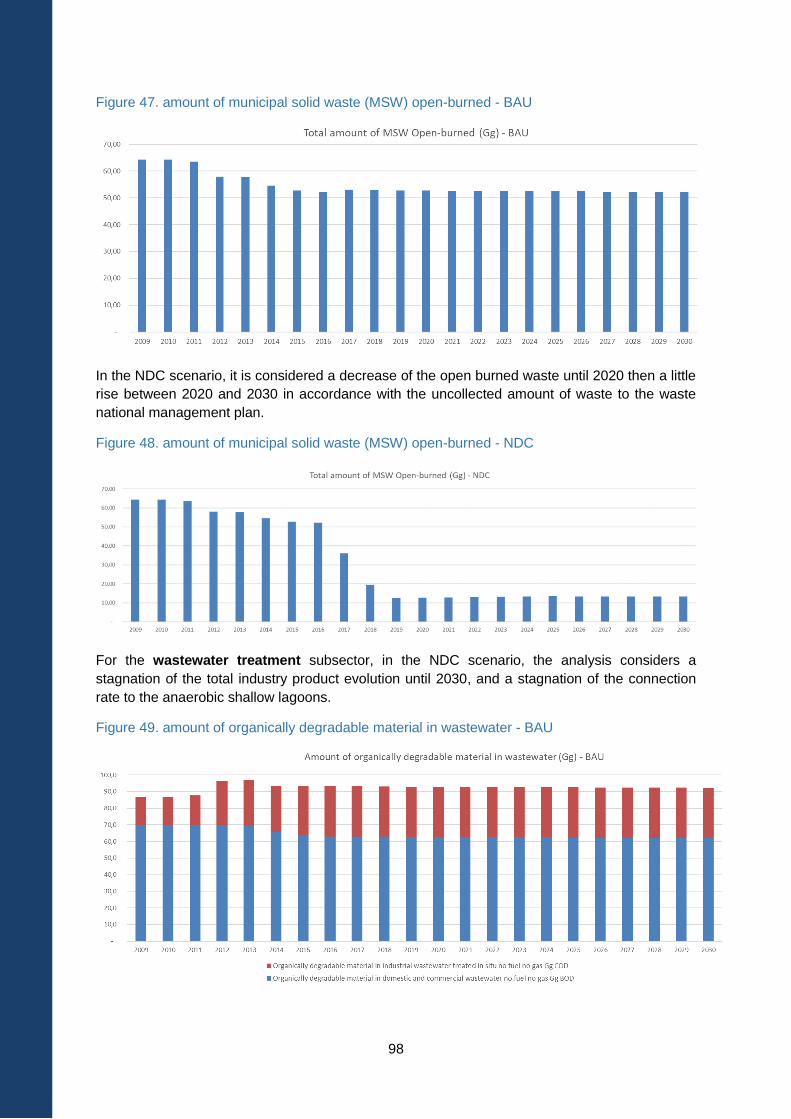
98
Figure 47. amount of municipal solid waste (MSW) open-burned - BAU
In the NDC scenario, it is considered a decrease of the open burned waste until 2020 then a little
rise between 2020 and 2030 in accordance with the uncollected amount of waste to the waste
national management plan.
Figure 48. amount of municipal solid waste (MSW) open-burned - NDC
For the wastewater treatment subsector, in the NDC scenario, the analysis considers a
stagnation of the total industry product evolution until 2030, and a stagnation of the connection
rate to the anaerobic shallow lagoons.
Figure 49. amount of organically degradable material in wastewater - BAU
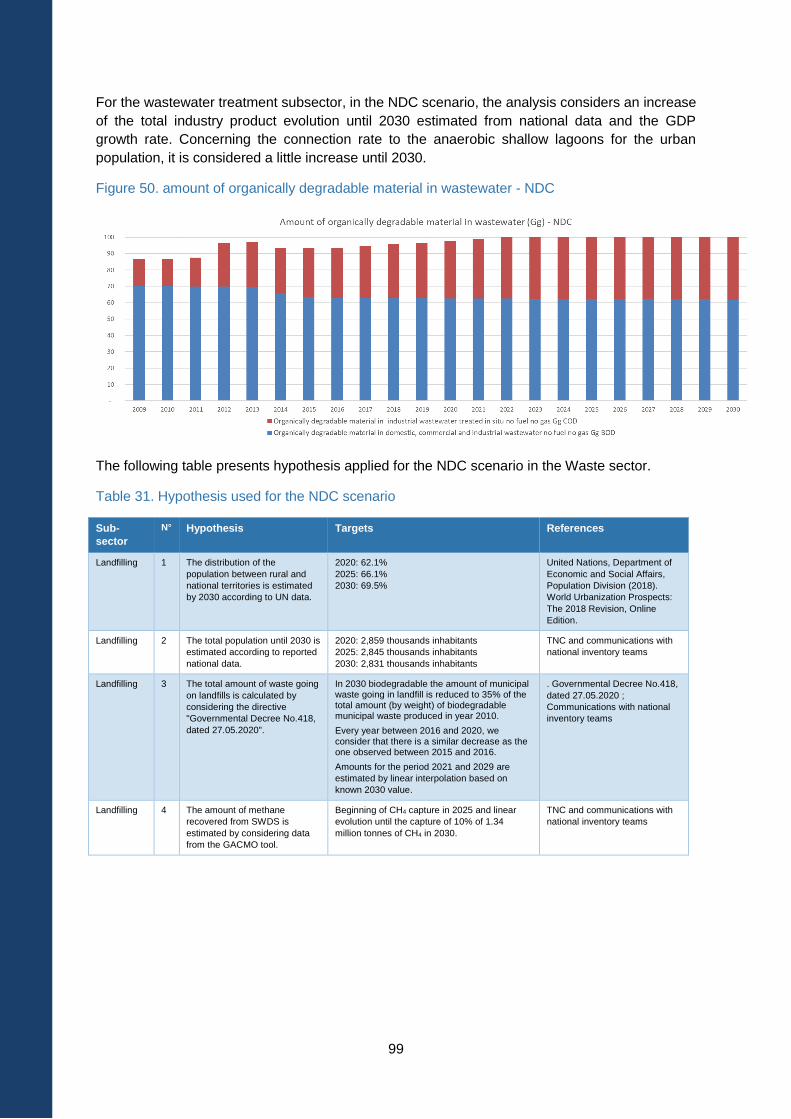
99
For the wastewater treatment subsector, in the NDC scenario, the analysis considers an increase
of the total industry product evolution until 2030 estimated from national data and the GDP
growth rate. Concerning the connection rate to the anaerobic shallow lagoons for the urban
population, it is considered a little increase until 2030.
Figure 50. amount of organically degradable material in wastewater - NDC
The following table presents hypothesis applied for the NDC scenario in the Waste sector.
Table 31. Hypothesis used for the NDC scenario
Sub-
sector
N° Hypothesis Targets References
Landfilling 1 The distribution of the
population between rural and
national territories is estimated
by 2030 according to UN data.
2020: 62.1%
2025: 66.1%
2030: 69.5%
United Nations, Department of
Economic and Social Affairs,
Population Division (2018).
World Urbanization Prospects:
The 2018 Revision, Online
Edition.
Landfilling 2 The total population until 2030 is
estimated according to reported
national data.
2020: 2,859 thousands inhabitants
2025: 2,845 thousands inhabitants
2030: 2,831 thousands inhabitants
TNC and communications with
national inventory teams
Landfilling 3 The total amount of waste going
on landfills is calculated by
considering the directive
"Governmental Decree No.418,
dated 27.05.2020".
In 2030 biodegradable the amount of municipal waste going in landfill is reduced to 35% of the total amount (by weight) of biodegradable municipal waste produced in year 2010.
Every year between 2016 and 2020, we consider that there is a similar decrease as the one observed between 2015 and 2016.
Amounts for the period 2021 and 2029 are
estimated by linear interpolation based on
known 2030 value.
. Governmental Decree No.418,
dated 27.05.2020 ;
Communications with national
inventory teams
Landfilling 4 The amount of methane
recovered from SWDS is
estimated by considering data
from the GACMO tool.
Beginning of CH4 capture in 2025 and linear
evolution until the capture of 10% of 1.34
million tonnes of CH4 in 2030.
TNC and communications with
national inventory teams
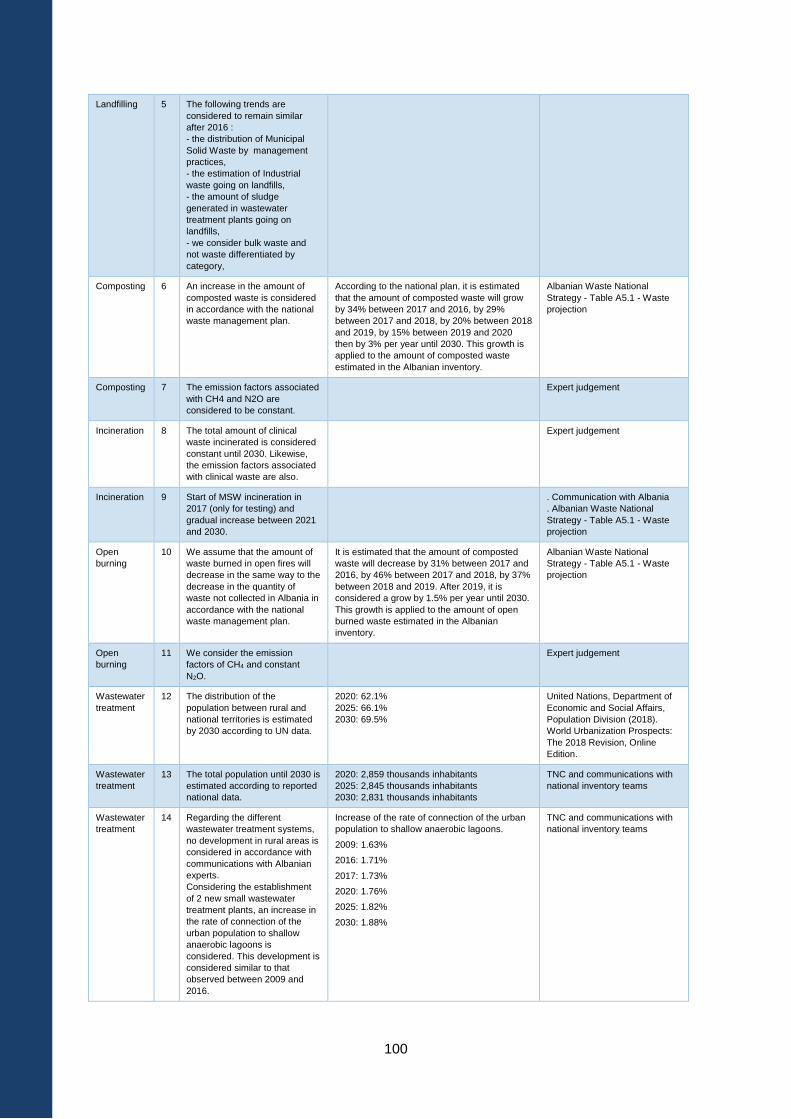
100
Landfilling 5 The following trends are
considered to remain similar
after 2016 :
- the distribution of Municipal
Solid Waste by management
practices,
- the estimation of Industrial
waste going on landfills,
- the amount of sludge
generated in wastewater
treatment plants going on
landfills,
- we consider bulk waste and
not waste differentiated by
category,
Composting 6 An increase in the amount of
composted waste is considered
in accordance with the national
waste management plan.
According to the national plan, it is estimated
that the amount of composted waste will grow
by 34% between 2017 and 2016, by 29%
between 2017 and 2018, by 20% between 2018
and 2019, by 15% between 2019 and 2020
then by 3% per year until 2030. This growth is
applied to the amount of composted waste
estimated in the Albanian inventory.
Albanian Waste National
Strategy - Table A5.1 - Waste
projection
Composting 7 The emission factors associated
with CH4 and N2O are
considered to be constant.
Expert judgement
Incineration 8 The total amount of clinical
waste incinerated is considered
constant until 2030. Likewise,
the emission factors associated
with clinical waste are also.
Expert judgement
Incineration 9 Start of MSW incineration in
2017 (only for testing) and
gradual increase between 2021
and 2030.
. Communication with Albania
. Albanian Waste National
Strategy - Table A5.1 - Waste
projection
Open
burning
10 We assume that the amount of
waste burned in open fires will
decrease in the same way to the
decrease in the quantity of
waste not collected in Albania in
accordance with the national
waste management plan.
It is estimated that the amount of composted
waste will decrease by 31% between 2017 and
2016, by 46% between 2017 and 2018, by 37%
between 2018 and 2019. After 2019, it is
considered a grow by 1.5% per year until 2030.
This growth is applied to the amount of open
burned waste estimated in the Albanian
inventory.
Albanian Waste National
Strategy - Table A5.1 - Waste
projection
Open
burning
11 We consider the emission
factors of CH4 and constant
N2O.
Expert judgement
Wastewater
treatment
12 The distribution of the
population between rural and
national territories is estimated
by 2030 according to UN data.
2020: 62.1%
2025: 66.1%
2030: 69.5%
United Nations, Department of
Economic and Social Affairs,
Population Division (2018).
World Urbanization Prospects:
The 2018 Revision, Online
Edition.
Wastewater
treatment
13 The total population until 2030 is
estimated according to reported
national data.
2020: 2,859 thousands inhabitants
2025: 2,845 thousands inhabitants
2030: 2,831 thousands inhabitants
TNC and communications with
national inventory teams
Wastewater
treatment
14 Regarding the different
wastewater treatment systems,
no development in rural areas is
considered in accordance with
communications with Albanian
experts.
Considering the establishment
of 2 new small wastewater
treatment plants, an increase in
the rate of connection of the
urban population to shallow
anaerobic lagoons is
considered. This development is
considered similar to that
observed between 2009 and
2016.
Increase of the rate of connection of the urban
population to shallow anaerobic lagoons.
2009: 1.63%
2016: 1.71%
2017: 1.73%
2020: 1.76%
2025: 1.82%
2030: 1.88%
TNC and communications with
national inventory teams
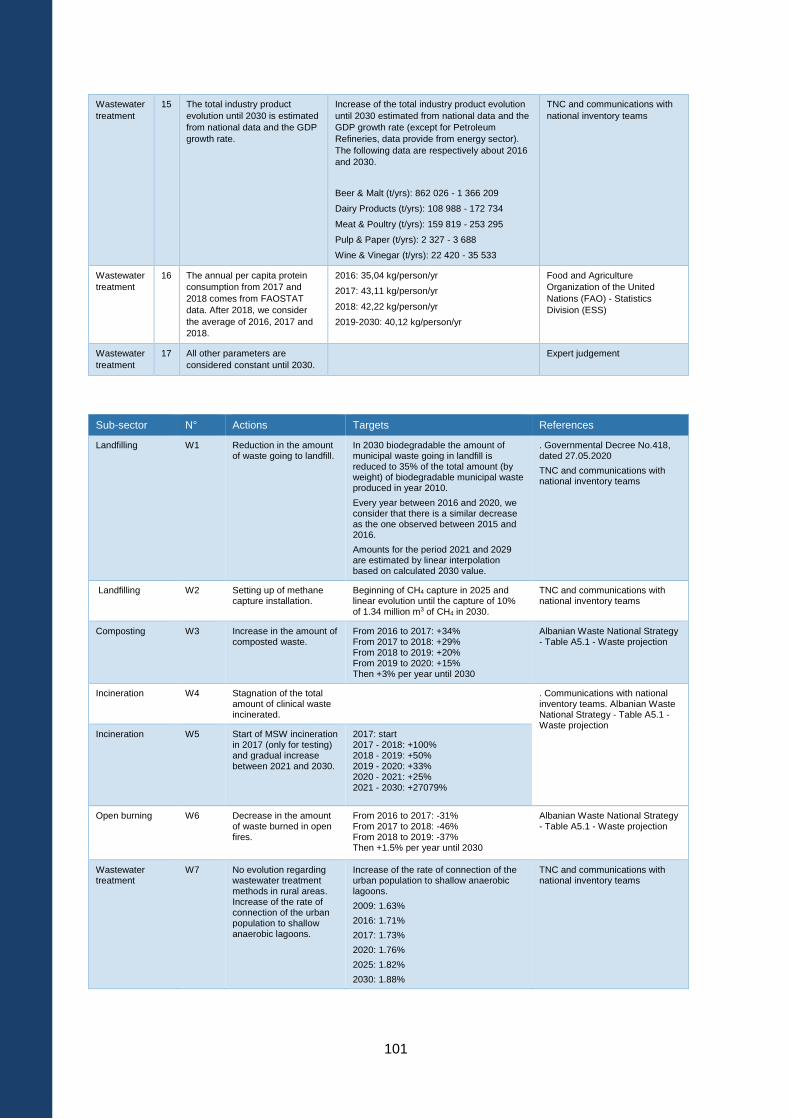
101
Wastewater
treatment
15 The total industry product
evolution until 2030 is estimated
from national data and the GDP
growth rate.
Increase of the total industry product evolution
until 2030 estimated from national data and the
GDP growth rate (except for Petroleum
Refineries, data provide from energy sector).
The following data are respectively about 2016
and 2030.
Beer & Malt (t/yrs): 862 026 - 1 366 209
Dairy Products (t/yrs): 108 988 - 172 734
Meat & Poultry (t/yrs): 159 819 - 253 295
Pulp & Paper (t/yrs): 2 327 - 3 688
Wine & Vinegar (t/yrs): 22 420 - 35 533
TNC and communications with
national inventory teams
Wastewater
treatment
16 The annual per capita protein
consumption from 2017 and
2018 comes from FAOSTAT
data. After 2018, we consider
the average of 2016, 2017 and
2018.
2016: 35,04 kg/person/yr
2017: 43,11 kg/person/yr
2018: 42,22 kg/person/yr
2019-2030: 40,12 kg/person/yr
Food and Agriculture
Organization of the United
Nations (FAO) - Statistics
Division (ESS)
Wastewater
treatment
17 All other parameters are
considered constant until 2030.
Expert judgement
Sub-sector N° Actions Targets References
Landfilling W1 Reduction in the amount of waste going to landfill.
In 2030 biodegradable the amount of municipal waste going in landfill is reduced to 35% of the total amount (by weight) of biodegradable municipal waste produced in year 2010.
Every year between 2016 and 2020, we consider that there is a similar decrease as the one observed between 2015 and 2016.
Amounts for the period 2021 and 2029 are estimated by linear interpolation based on calculated 2030 value.
. Governmental Decree No.418, dated 27.05.2020
TNC and communications with national inventory teams
Landfilling W2 Setting up of methane capture installation.
Beginning of CH4 capture in 2025 and linear evolution until the capture of 10% of 1.34 million m3 of CH4 in 2030.
TNC and communications with national inventory teams
Composting W3 Increase in the amount of composted waste.
From 2016 to 2017: +34% From 2017 to 2018: +29% From 2018 to 2019: +20% From 2019 to 2020: +15% Then +3% per year until 2030
Albanian Waste National Strategy - Table A5.1 - Waste projection
Incineration W4 Stagnation of the total amount of clinical waste incinerated.
. Communications with national inventory teams. Albanian Waste National Strategy - Table A5.1 - Waste projection
Incineration W5 Start of MSW incineration in 2017 (only for testing) and gradual increase between 2021 and 2030.
2017: start 2017 - 2018: +100% 2018 - 2019: +50% 2019 - 2020: +33% 2020 - 2021: +25% 2021 - 2030: +27079%
Open burning W6 Decrease in the amount of waste burned in open fires.
From 2016 to 2017: -31% From 2017 to 2018: -46% From 2018 to 2019: -37% Then +1.5% per year until 2030
Albanian Waste National Strategy - Table A5.1 - Waste projection
Wastewater treatment
W7 No evolution regarding wastewater treatment methods in rural areas. Increase of the rate of connection of the urban population to shallow anaerobic lagoons.
Increase of the rate of connection of the urban population to shallow anaerobic lagoons.
2009: 1.63%
2016: 1.71%
2017: 1.73%
2020: 1.76%
2025: 1.82%
2030: 1.88%
TNC and communications with national inventory teams
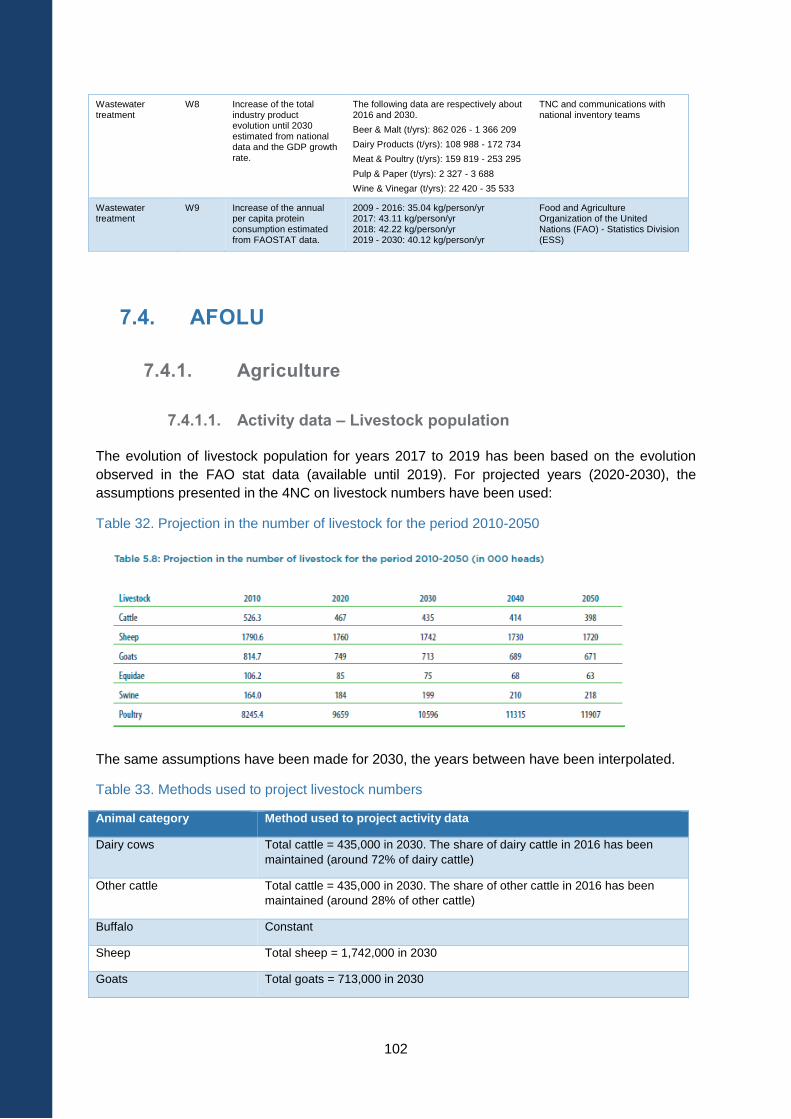
102
Wastewater treatment
W8 Increase of the total industry product evolution until 2030 estimated from national data and the GDP growth rate.
The following data are respectively about 2016 and 2030.
Beer & Malt (t/yrs): 862 026 - 1 366 209
Dairy Products (t/yrs): 108 988 - 172 734
Meat & Poultry (t/yrs): 159 819 - 253 295
Pulp & Paper (t/yrs): 2 327 - 3 688
Wine & Vinegar (t/yrs): 22 420 - 35 533
TNC and communications with national inventory teams
Wastewater treatment
W9 Increase of the annual per capita protein consumption estimated from FAOSTAT data.
2009 - 2016: 35.04 kg/person/yr 2017: 43.11 kg/person/yr 2018: 42.22 kg/person/yr 2019 - 2030: 40.12 kg/person/yr
Food and Agriculture Organization of the United Nations (FAO) - Statistics Division (ESS)
7.4. AFOLU
7.4.1. Agriculture
7.4.1.1. Activity data – Livestock population
The evolution of livestock population for years 2017 to 2019 has been based on the evolution
observed in the FAO stat data (available until 2019). For projected years (2020-2030), the
assumptions presented in the 4NC on livestock numbers have been used:
Table 32. Projection in the number of livestock for the period 2010-2050
The same assumptions have been made for 2030, the years between have been interpolated.
Table 33. Methods used to project livestock numbers
Animal category Method used to project activity data
Dairy cows Total cattle = 435,000 in 2030. The share of dairy cattle in 2016 has been
maintained (around 72% of dairy cattle)
Other cattle Total cattle = 435,000 in 2030. The share of other cattle in 2016 has been
maintained (around 28% of other cattle)
Buffalo Constant
Sheep Total sheep = 1,742,000 in 2030
Goats Total goats = 713,000 in 2030
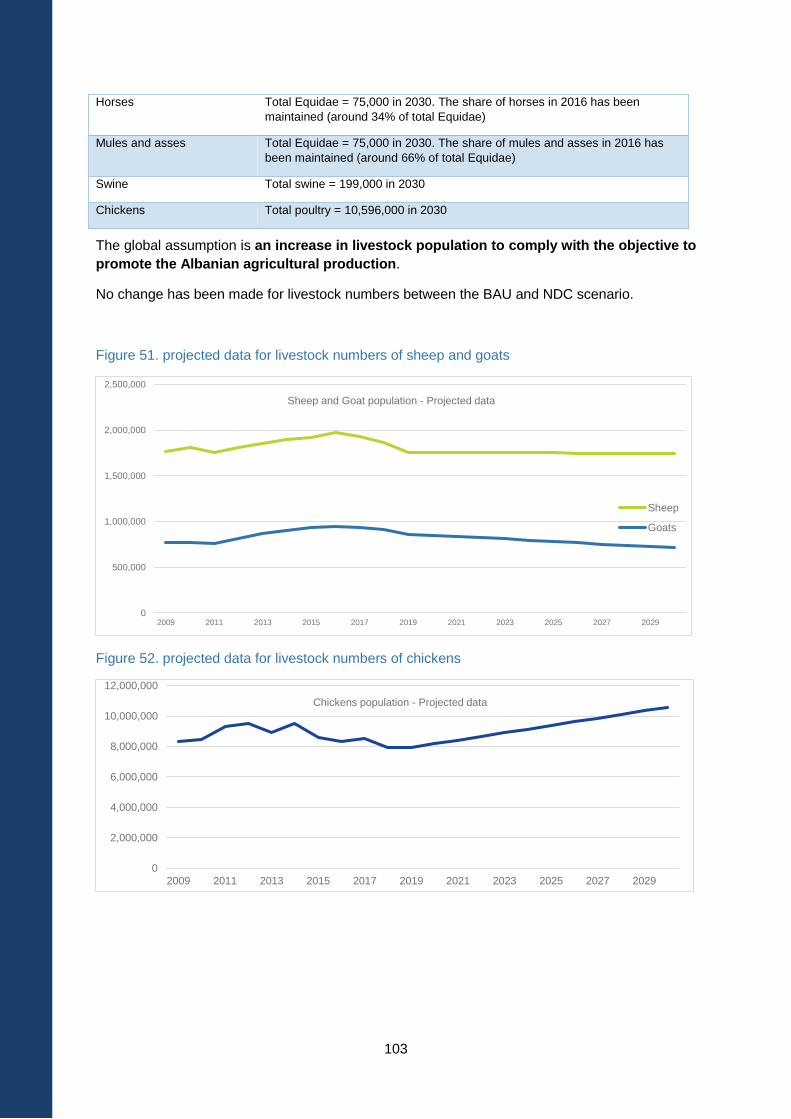
103
Horses Total Equidae = 75,000 in 2030. The share of horses in 2016 has been
maintained (around 34% of total Equidae)
Mules and asses Total Equidae = 75,000 in 2030. The share of mules and asses in 2016 has
been maintained (around 66% of total Equidae)
Swine Total swine = 199,000 in 2030
Chickens Total poultry = 10,596,000 in 2030
The global assumption is an increase in livestock population to comply with the objective to
promote the Albanian agricultural production.
No change has been made for livestock numbers between the BAU and NDC scenario.
Figure 51. projected data for livestock numbers of sheep and goats
Figure 52. projected data for livestock numbers of chickens
0
500,000
1,000,000
1,500,000
2,000,000
2,500,000
2009 2011 2013 2015 2017 2019 2021 2023 2025 2027 2029
Sheep and Goat population - Projected data
Sheep
Goats
0
2,000,000
4,000,000
6,000,000
8,000,000
10,000,000
12,000,000
2009 2011 2013 2015 2017 2019 2021 2023 2025 2027 2029
Chickens population - Projected data
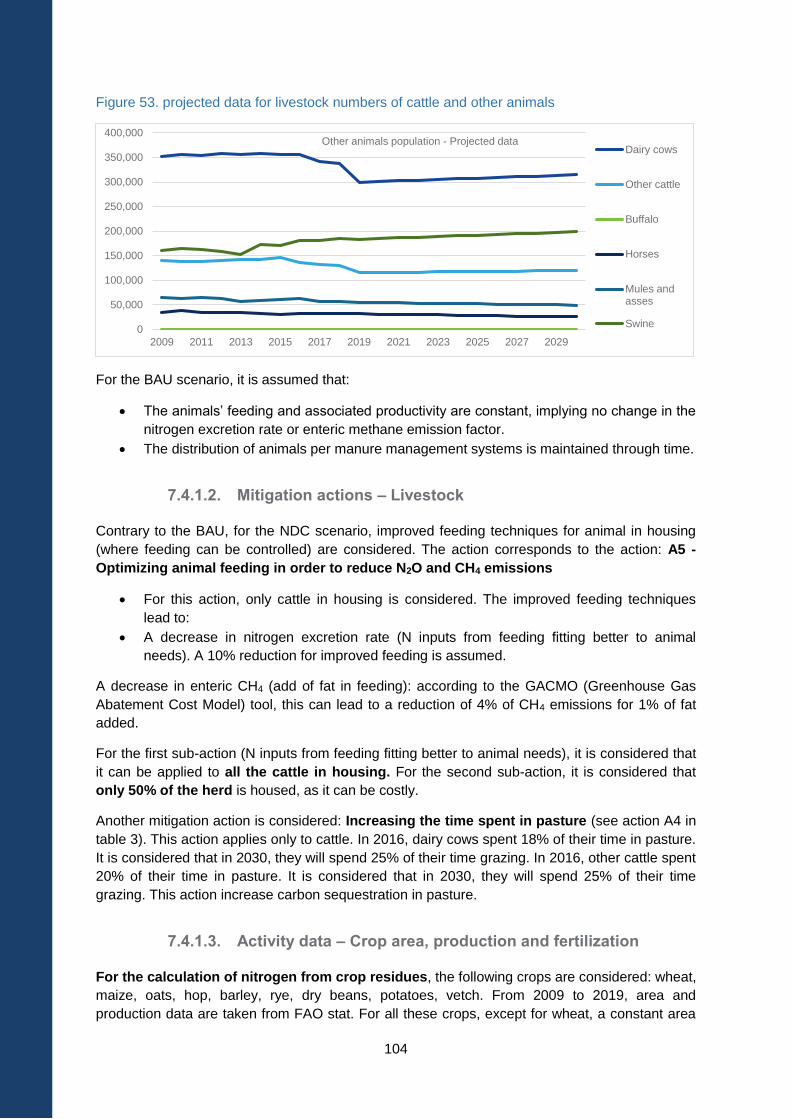
104
Figure 53. projected data for livestock numbers of cattle and other animals
For the BAU scenario, it is assumed that:
The animals’ feeding and associated productivity are constant, implying no change in the
nitrogen excretion rate or enteric methane emission factor.
The distribution of animals per manure management systems is maintained through time.
7.4.1.2. Mitigation actions – Livestock
Contrary to the BAU, for the NDC scenario, improved feeding techniques for animal in housing
(where feeding can be controlled) are considered. The action corresponds to the action: A5 -
Optimizing animal feeding in order to reduce N2O and CH4 emissions
For this action, only cattle in housing is considered. The improved feeding techniques
lead to:
A decrease in nitrogen excretion rate (N inputs from feeding fitting better to animal
needs). A 10% reduction for improved feeding is assumed.
A decrease in enteric CH4 (add of fat in feeding): according to the GACMO (Greenhouse Gas
Abatement Cost Model) tool, this can lead to a reduction of 4% of CH4 emissions for 1% of fat
added.
For the first sub-action (N inputs from feeding fitting better to animal needs), it is considered that
it can be applied to all the cattle in housing. For the second sub-action, it is considered that
only 50% of the herd is housed, as it can be costly.
Another mitigation action is considered: Increasing the time spent in pasture (see action A4 in
table 3). This action applies only to cattle. In 2016, dairy cows spent 18% of their time in pasture.
It is considered that in 2030, they will spend 25% of their time grazing. In 2016, other cattle spent
20% of their time in pasture. It is considered that in 2030, they will spend 25% of their time
grazing. This action increase carbon sequestration in pasture.
7.4.1.3. Activity data – Crop area, production and fertilization
For the calculation of nitrogen from crop residues, the following crops are considered: wheat,
maize, oats, hop, barley, rye, dry beans, potatoes, vetch. From 2009 to 2019, area and
production data are taken from FAO stat. For all these crops, except for wheat, a constant area
0
50,000
100,000
150,000
200,000
250,000
300,000
350,000
400,000
2009 2011 2013 2015 2017 2019 2021 2023 2025 2027 2029
Other animals population - Projected dataDairy cows
Other cattle
Buffalo
Horses
Mules andasses
Swine
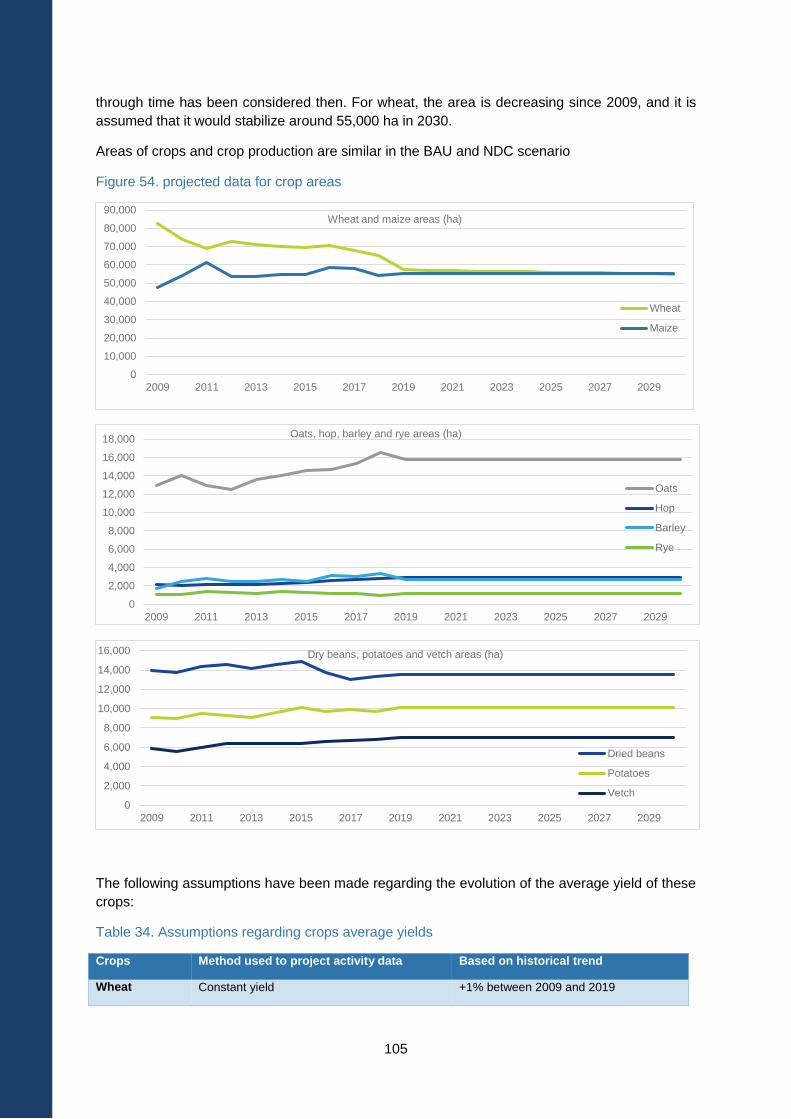
105
through time has been considered then. For wheat, the area is decreasing since 2009, and it is
assumed that it would stabilize around 55,000 ha in 2030.
Areas of crops and crop production are similar in the BAU and NDC scenario
Figure 54. projected data for crop areas
The following assumptions have been made regarding the evolution of the average yield of these
crops:
Table 34. Assumptions regarding crops average yields
Crops Method used to project activity data Based on historical trend
Wheat Constant yield +1% between 2009 and 2019
0
10,000
20,000
30,000
40,000
50,000
60,000
70,000
80,000
90,000
2009 2011 2013 2015 2017 2019 2021 2023 2025 2027 2029
Wheat and maize areas (ha)
Wheat
Maize
0
2,000
4,000
6,000
8,000
10,000
12,000
14,000
16,000
18,000
2009 2011 2013 2015 2017 2019 2021 2023 2025 2027 2029
Oats, hop, barley and rye areas (ha)
Oats
Hop
Barley
Rye
0
2,000
4,000
6,000
8,000
10,000
12,000
14,000
16,000
2009 2011 2013 2015 2017 2019 2021 2023 2025 2027 2029
Dry beans, potatoes and vetch areas (ha)
Dried beans
Potatoes
Vetch
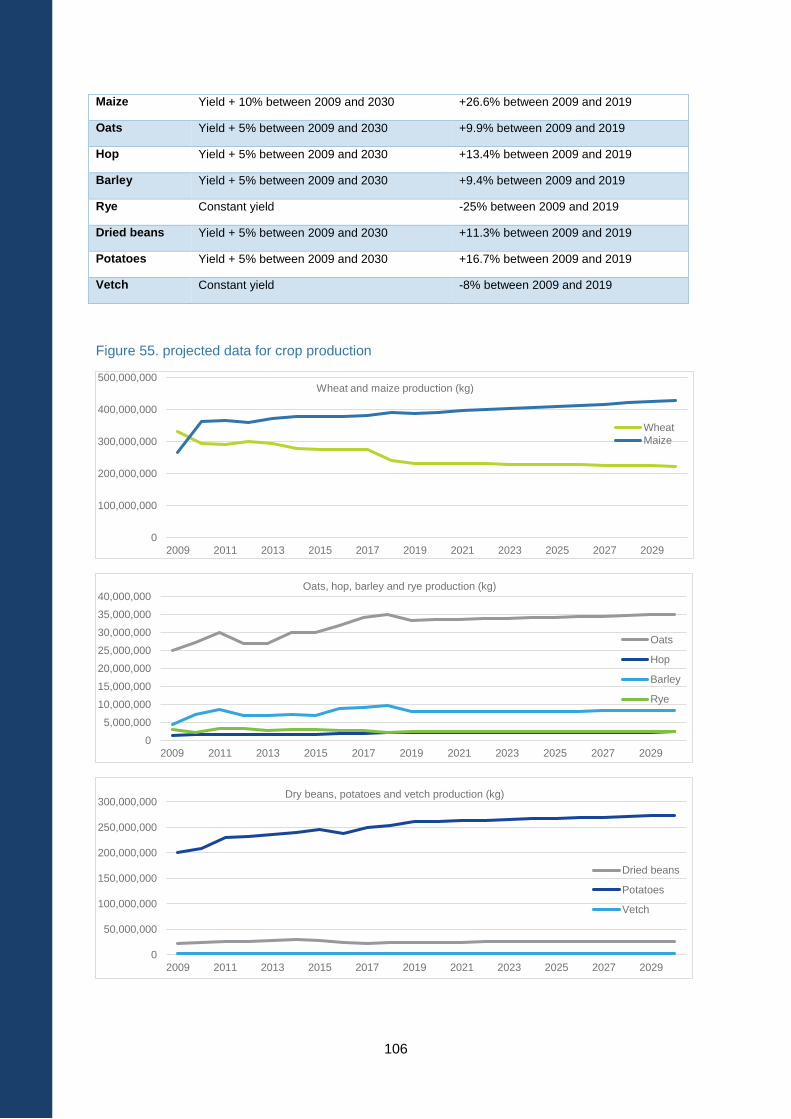
106
Maize Yield + 10% between 2009 and 2030 +26.6% between 2009 and 2019
Oats Yield + 5% between 2009 and 2030 +9.9% between 2009 and 2019
Hop Yield + 5% between 2009 and 2030 +13.4% between 2009 and 2019
Barley Yield + 5% between 2009 and 2030 +9.4% between 2009 and 2019
Rye Constant yield -25% between 2009 and 2019
Dried beans Yield + 5% between 2009 and 2030 +11.3% between 2009 and 2019
Potatoes Yield + 5% between 2009 and 2030 +16.7% between 2009 and 2019
Vetch Constant yield -8% between 2009 and 2019
Figure 55. projected data for crop production
0
100,000,000
200,000,000
300,000,000
400,000,000
500,000,000
2009 2011 2013 2015 2017 2019 2021 2023 2025 2027 2029
Wheat and maize production (kg)
Wheat
Maize
0
5,000,000
10,000,000
15,000,000
20,000,000
25,000,000
30,000,000
35,000,000
40,000,000
2009 2011 2013 2015 2017 2019 2021 2023 2025 2027 2029
Oats, hop, barley and rye production (kg)
Oats
Hop
Barley
Rye
0
50,000,000
100,000,000
150,000,000
200,000,000
250,000,000
300,000,000
2009 2011 2013 2015 2017 2019 2021 2023 2025 2027 2029
Dry beans, potatoes and vetch production (kg)
Dried beans
Potatoes
Vetch
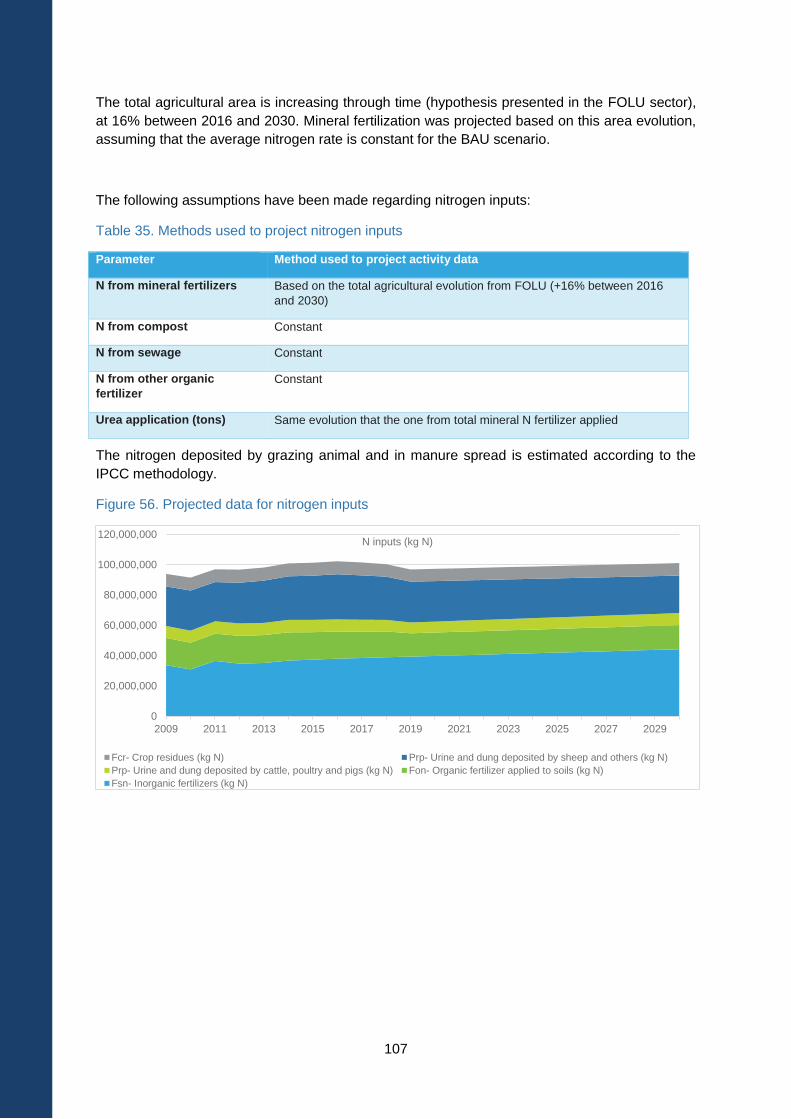
107
The total agricultural area is increasing through time (hypothesis presented in the FOLU sector),
at 16% between 2016 and 2030. Mineral fertilization was projected based on this area evolution,
assuming that the average nitrogen rate is constant for the BAU scenario.
The following assumptions have been made regarding nitrogen inputs:
Table 35. Methods used to project nitrogen inputs
Parameter Method used to project activity data
N from mineral fertilizers Based on the total agricultural evolution from FOLU (+16% between 2016
and 2030)
N from compost Constant
N from sewage Constant
N from other organic
fertilizer
Constant
Urea application (tons) Same evolution that the one from total mineral N fertilizer applied
The nitrogen deposited by grazing animal and in manure spread is estimated according to the
IPCC methodology.
Figure 56. Projected data for nitrogen inputs
0
20,000,000
40,000,000
60,000,000
80,000,000
100,000,000
120,000,000
2009 2011 2013 2015 2017 2019 2021 2023 2025 2027 2029
N inputs (kg N)
Fcr- Crop residues (kg N) Prp- Urine and dung deposited by sheep and others (kg N)
Prp- Urine and dung deposited by cattle, poultry and pigs (kg N) Fon- Organic fertilizer applied to soils (kg N)
Fsn- Inorganic fertilizers (kg N)
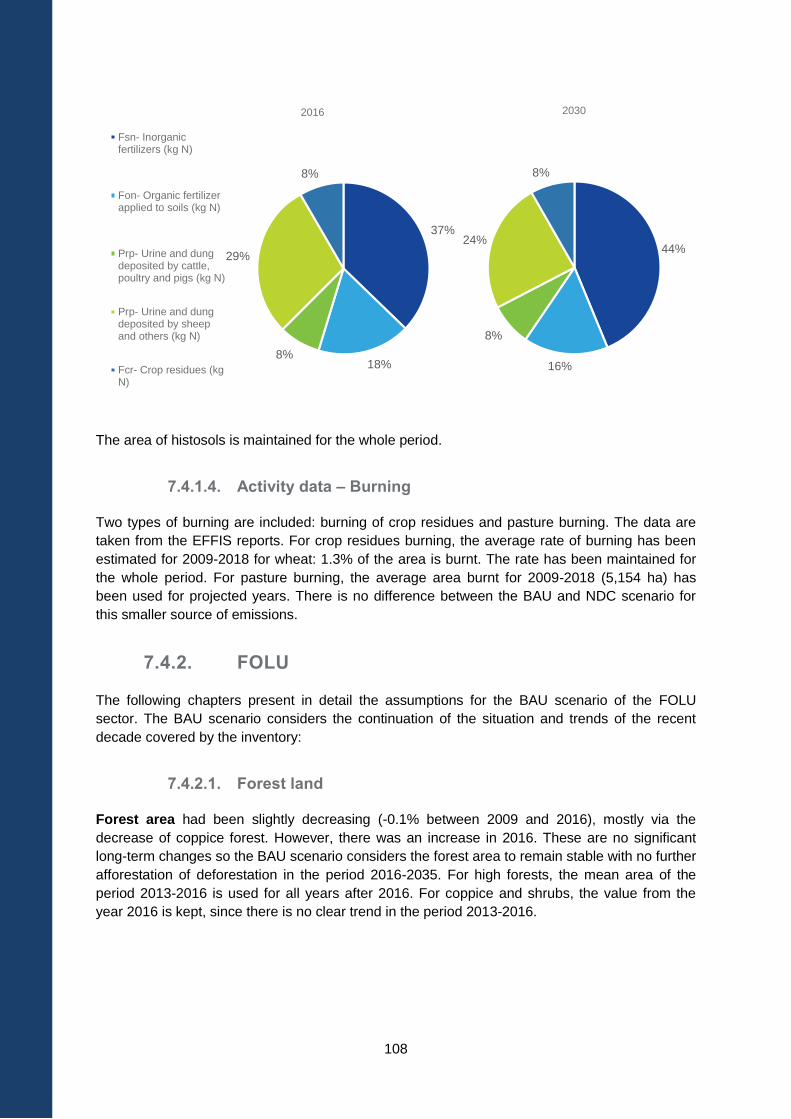
108
The area of histosols is maintained for the whole period.
7.4.1.4. Activity data – Burning
Two types of burning are included: burning of crop residues and pasture burning. The data are
taken from the EFFIS reports. For crop residues burning, the average rate of burning has been
estimated for 2009-2018 for wheat: 1.3% of the area is burnt. The rate has been maintained for
the whole period. For pasture burning, the average area burnt for 2009-2018 (5,154 ha) has
been used for projected years. There is no difference between the BAU and NDC scenario for
this smaller source of emissions.
7.4.2. FOLU
The following chapters present in detail the assumptions for the BAU scenario of the FOLU
sector. The BAU scenario considers the continuation of the situation and trends of the recent
decade covered by the inventory:
7.4.2.1. Forest land
Forest area had been slightly decreasing (-0.1% between 2009 and 2016), mostly via the
decrease of coppice forest. However, there was an increase in 2016. These are no significant
long-term changes so the BAU scenario considers the forest area to remain stable with no further
afforestation of deforestation in the period 2016-2035. For high forests, the mean area of the
period 2013-2016 is used for all years after 2016. For coppice and shrubs, the value from the
year 2016 is kept, since there is no clear trend in the period 2013-2016.
37%
18%8%
29%
8%
2016
Fsn- Inorganicfertilizers (kg N)
Fon- Organic fertilizerapplied to soils (kg N)
Prp- Urine and dungdeposited by cattle,poultry and pigs (kg N)
Prp- Urine and dungdeposited by sheepand others (kg N)
Fcr- Crop residues (kgN)
44%
16%
8%
24%
8%
2030
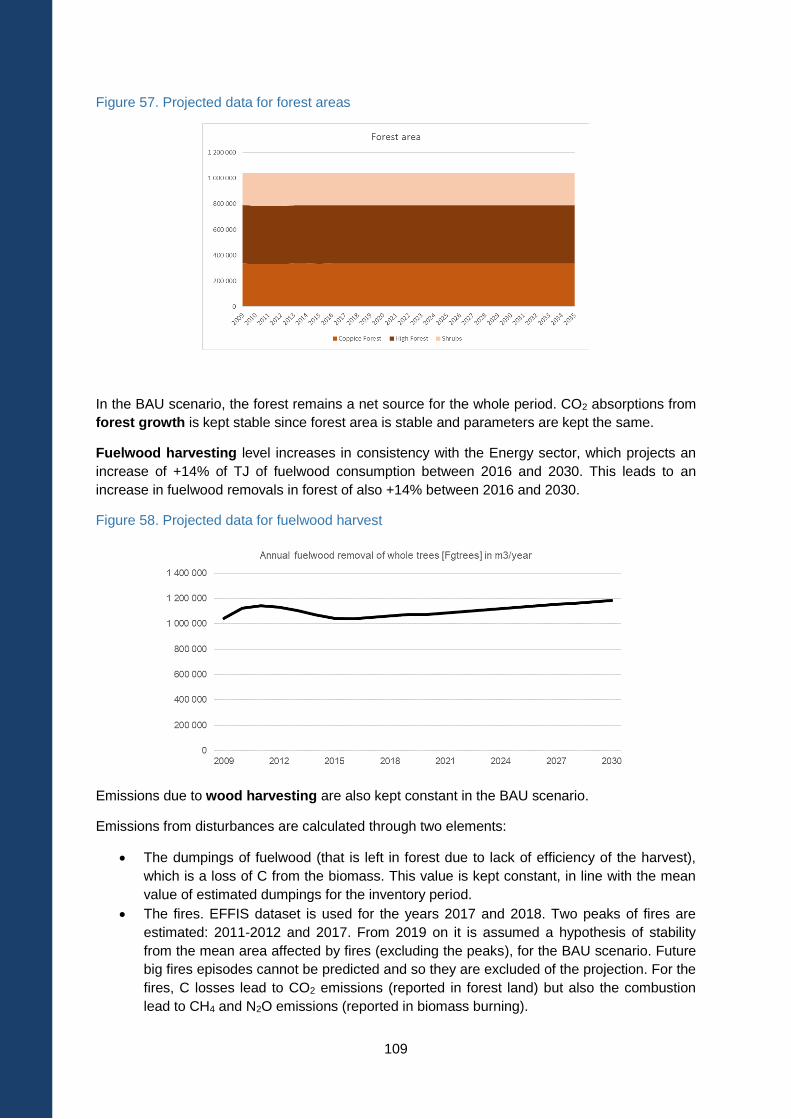
109
Figure 57. Projected data for forest areas
In the BAU scenario, the forest remains a net source for the whole period. CO2 absorptions from
forest growth is kept stable since forest area is stable and parameters are kept the same.
Fuelwood harvesting level increases in consistency with the Energy sector, which projects an
increase of +14% of TJ of fuelwood consumption between 2016 and 2030. This leads to an
increase in fuelwood removals in forest of also +14% between 2016 and 2030.
Figure 58. Projected data for fuelwood harvest
Emissions due to wood harvesting are also kept constant in the BAU scenario.
Emissions from disturbances are calculated through two elements:
The dumpings of fuelwood (that is left in forest due to lack of efficiency of the harvest),
which is a loss of C from the biomass. This value is kept constant, in line with the mean
value of estimated dumpings for the inventory period.
The fires. EFFIS dataset is used for the years 2017 and 2018. Two peaks of fires are
estimated: 2011-2012 and 2017. From 2019 on it is assumed a hypothesis of stability
from the mean area affected by fires (excluding the peaks), for the BAU scenario. Future
big fires episodes cannot be predicted and so they are excluded of the projection. For the
fires, C losses lead to CO2 emissions (reported in forest land) but also the combustion
lead to CH4 and N2O emissions (reported in biomass burning).
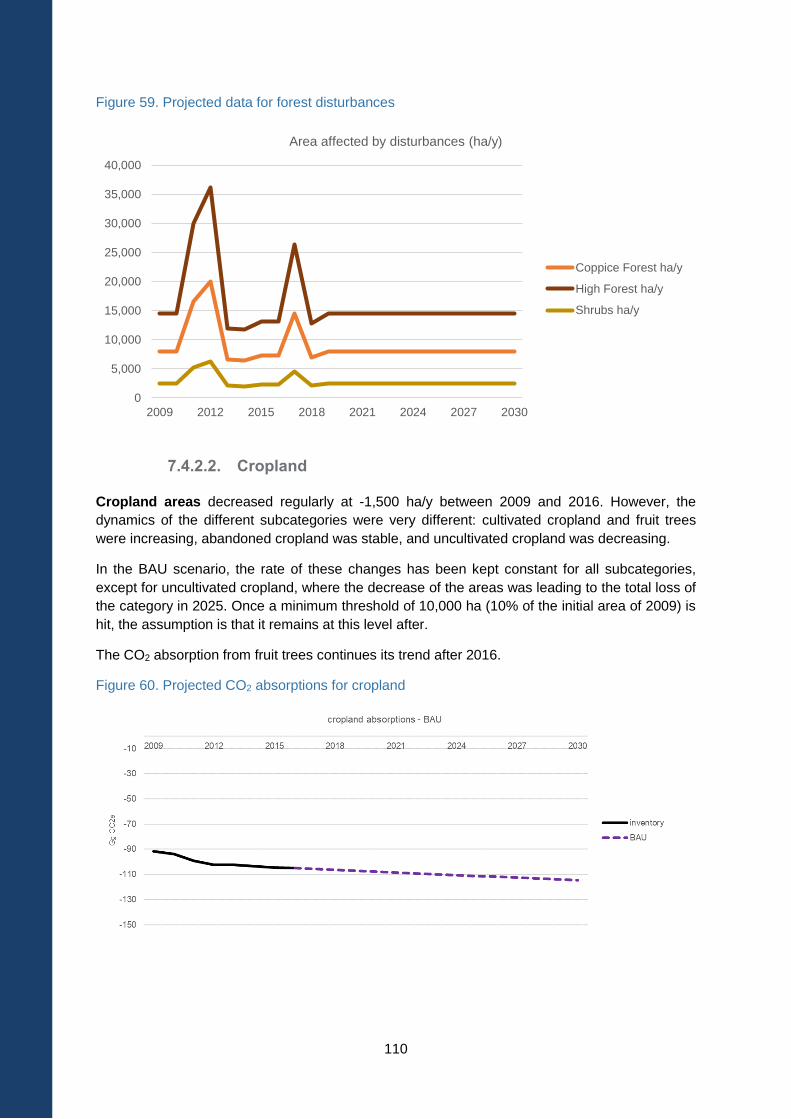
110
Figure 59. Projected data for forest disturbances
7.4.2.2. Cropland
Cropland areas decreased regularly at -1,500 ha/y between 2009 and 2016. However, the
dynamics of the different subcategories were very different: cultivated cropland and fruit trees
were increasing, abandoned cropland was stable, and uncultivated cropland was decreasing.
In the BAU scenario, the rate of these changes has been kept constant for all subcategories,
except for uncultivated cropland, where the decrease of the areas was leading to the total loss of
the category in 2025. Once a minimum threshold of 10,000 ha (10% of the initial area of 2009) is
hit, the assumption is that it remains at this level after.
The CO2 absorption from fruit trees continues its trend after 2016.
Figure 60. Projected CO2 absorptions for cropland
0
5,000
10,000
15,000
20,000
25,000
30,000
35,000
40,000
2009 2012 2015 2018 2021 2024 2027 2030
Area affected by disturbances (ha/y)
Coppice Forest ha/y
High Forest ha/y
Shrubs ha/y
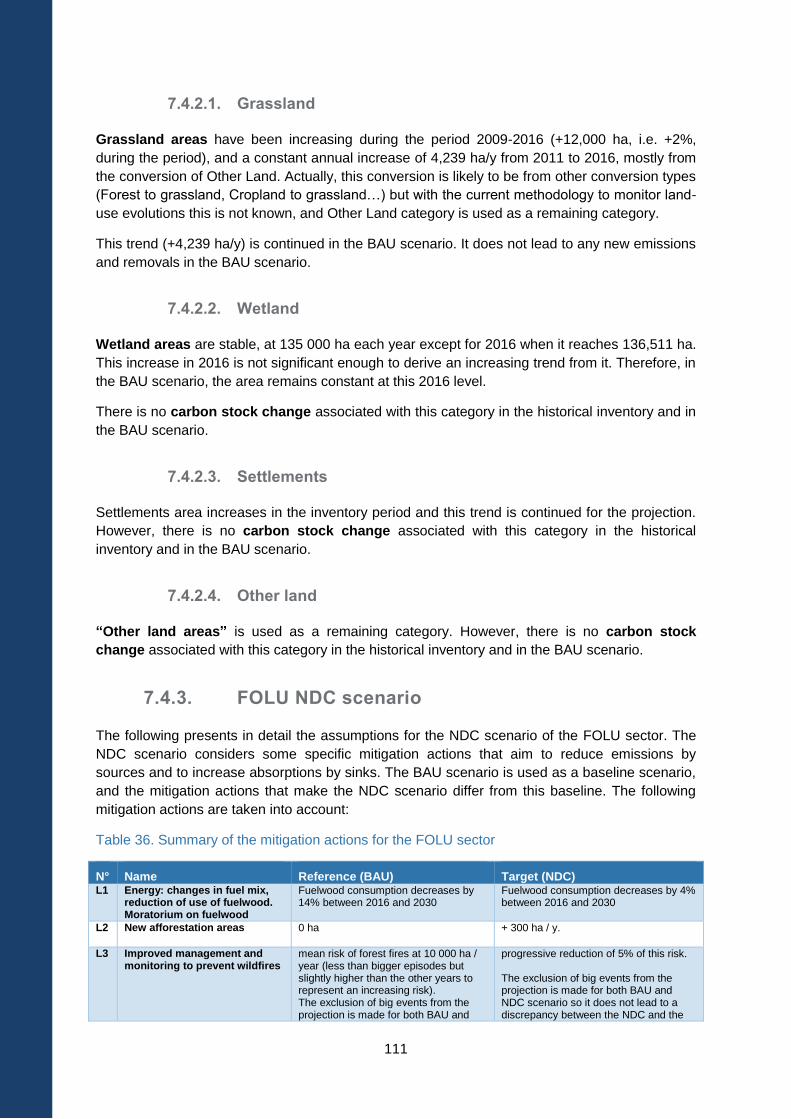
111
7.4.2.1. Grassland
Grassland areas have been increasing during the period 2009-2016 (+12,000 ha, i.e. +2%,
during the period), and a constant annual increase of 4,239 ha/y from 2011 to 2016, mostly from
the conversion of Other Land. Actually, this conversion is likely to be from other conversion types
(Forest to grassland, Cropland to grassland…) but with the current methodology to monitor land-
use evolutions this is not known, and Other Land category is used as a remaining category.
This trend (+4,239 ha/y) is continued in the BAU scenario. It does not lead to any new emissions
and removals in the BAU scenario.
7.4.2.2. Wetland
Wetland areas are stable, at 135 000 ha each year except for 2016 when it reaches 136,511 ha.
This increase in 2016 is not significant enough to derive an increasing trend from it. Therefore, in
the BAU scenario, the area remains constant at this 2016 level.
There is no carbon stock change associated with this category in the historical inventory and in
the BAU scenario.
7.4.2.3. Settlements
Settlements area increases in the inventory period and this trend is continued for the projection.
However, there is no carbon stock change associated with this category in the historical
inventory and in the BAU scenario.
7.4.2.4. Other land
“Other land areas” is used as a remaining category. However, there is no carbon stock
change associated with this category in the historical inventory and in the BAU scenario.
7.4.3. FOLU NDC scenario
The following presents in detail the assumptions for the NDC scenario of the FOLU sector. The
NDC scenario considers some specific mitigation actions that aim to reduce emissions by
sources and to increase absorptions by sinks. The BAU scenario is used as a baseline scenario,
and the mitigation actions that make the NDC scenario differ from this baseline. The following
mitigation actions are taken into account:
Table 36. Summary of the mitigation actions for the FOLU sector
N° Name Reference (BAU) Target (NDC) L1 Energy: changes in fuel mix,
reduction of use of fuelwood. Moratorium on fuelwood
Fuelwood consumption decreases by 14% between 2016 and 2030
Fuelwood consumption decreases by 4% between 2016 and 2030
L2 New afforestation areas 0 ha + 300 ha / y.
L3 Improved management and monitoring to prevent wildfires
mean risk of forest fires at 10 000 ha / year (less than bigger episodes but slightly higher than the other years to represent an increasing risk). The exclusion of big events from the projection is made for both BAU and
progressive reduction of 5% of this risk. The exclusion of big events from the projection is made for both BAU and NDC scenario so it does not lead to a discrepancy between the NDC and the
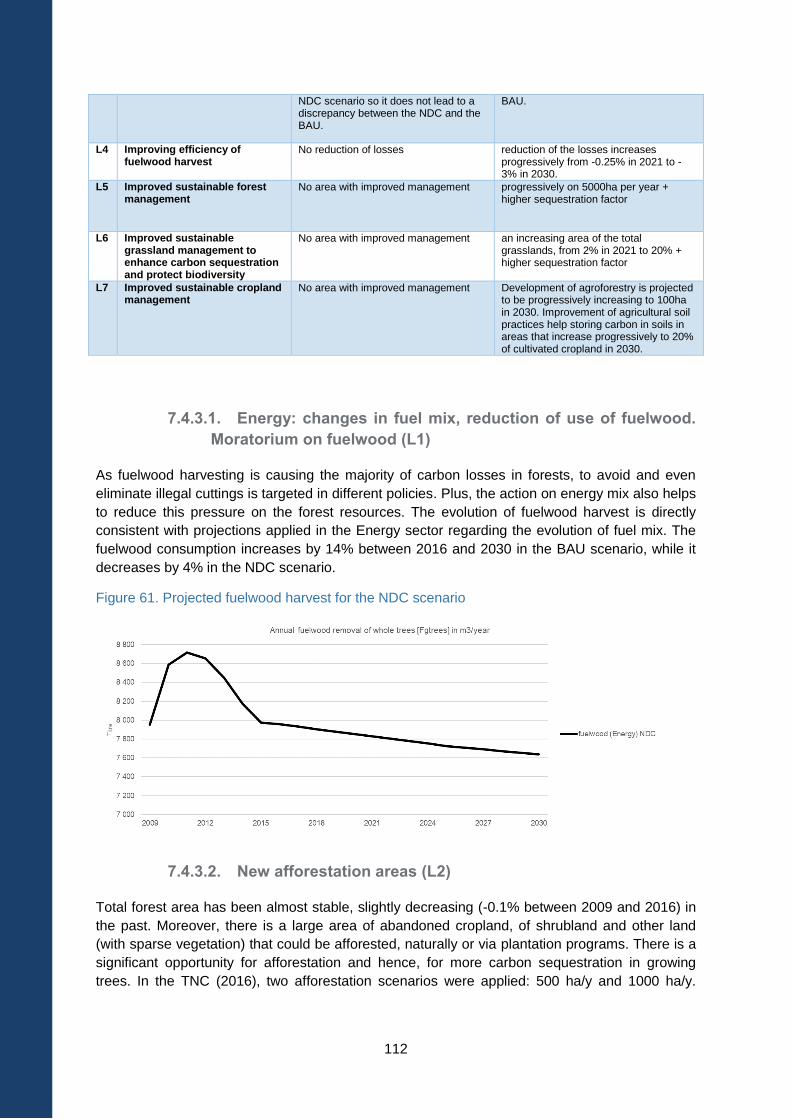
112
NDC scenario so it does not lead to a discrepancy between the NDC and the BAU.
BAU.
L4 Improving efficiency of fuelwood harvest
No reduction of losses reduction of the losses increases progressively from -0.25% in 2021 to -3% in 2030.
L5 Improved sustainable forest management
No area with improved management progressively on 5000ha per year + higher sequestration factor
L6 Improved sustainable grassland management to enhance carbon sequestration and protect biodiversity
No area with improved management an increasing area of the total grasslands, from 2% in 2021 to 20% + higher sequestration factor
L7 Improved sustainable cropland management
No area with improved management Development of agroforestry is projected to be progressively increasing to 100ha in 2030. Improvement of agricultural soil practices help storing carbon in soils in areas that increase progressively to 20% of cultivated cropland in 2030.
7.4.3.1. Energy: changes in fuel mix, reduction of use of fuelwood.
Moratorium on fuelwood (L1)
As fuelwood harvesting is causing the majority of carbon losses in forests, to avoid and even
eliminate illegal cuttings is targeted in different policies. Plus, the action on energy mix also helps
to reduce this pressure on the forest resources. The evolution of fuelwood harvest is directly
consistent with projections applied in the Energy sector regarding the evolution of fuel mix. The
fuelwood consumption increases by 14% between 2016 and 2030 in the BAU scenario, while it
decreases by 4% in the NDC scenario.
Figure 61. Projected fuelwood harvest for the NDC scenario
7.4.3.2. New afforestation areas (L2)
Total forest area has been almost stable, slightly decreasing (-0.1% between 2009 and 2016) in
the past. Moreover, there is a large area of abandoned cropland, of shrubland and other land
(with sparse vegetation) that could be afforested, naturally or via plantation programs. There is a
significant opportunity for afforestation and hence, for more carbon sequestration in growing
trees. In the TNC (2016), two afforestation scenarios were applied: 500 ha/y and 1000 ha/y.
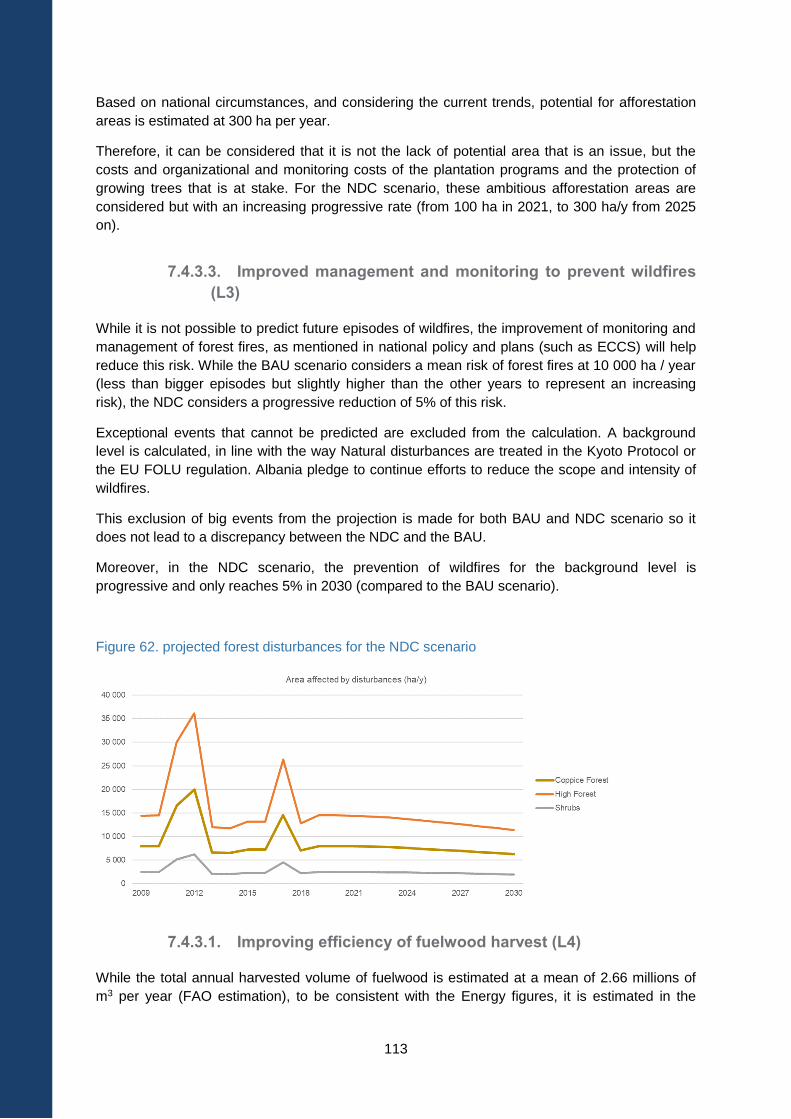
113
Based on national circumstances, and considering the current trends, potential for afforestation
areas is estimated at 300 ha per year.
Therefore, it can be considered that it is not the lack of potential area that is an issue, but the
costs and organizational and monitoring costs of the plantation programs and the protection of
growing trees that is at stake. For the NDC scenario, these ambitious afforestation areas are
considered but with an increasing progressive rate (from 100 ha in 2021, to 300 ha/y from 2025
on).
7.4.3.3. Improved management and monitoring to prevent wildfires
(L3)
While it is not possible to predict future episodes of wildfires, the improvement of monitoring and
management of forest fires, as mentioned in national policy and plans (such as ECCS) will help
reduce this risk. While the BAU scenario considers a mean risk of forest fires at 10 000 ha / year
(less than bigger episodes but slightly higher than the other years to represent an increasing
risk), the NDC considers a progressive reduction of 5% of this risk.
Exceptional events that cannot be predicted are excluded from the calculation. A background
level is calculated, in line with the way Natural disturbances are treated in the Kyoto Protocol or
the EU FOLU regulation. Albania pledge to continue efforts to reduce the scope and intensity of
wildfires.
This exclusion of big events from the projection is made for both BAU and NDC scenario so it
does not lead to a discrepancy between the NDC and the BAU.
Moreover, in the NDC scenario, the prevention of wildfires for the background level is
progressive and only reaches 5% in 2030 (compared to the BAU scenario).
Figure 62. projected forest disturbances for the NDC scenario
7.4.3.1. Improving efficiency of fuelwood harvest (L4)
While the total annual harvested volume of fuelwood is estimated at a mean of 2.66 millions of
m3 per year (FAO estimation), to be consistent with the Energy figures, it is estimated in the
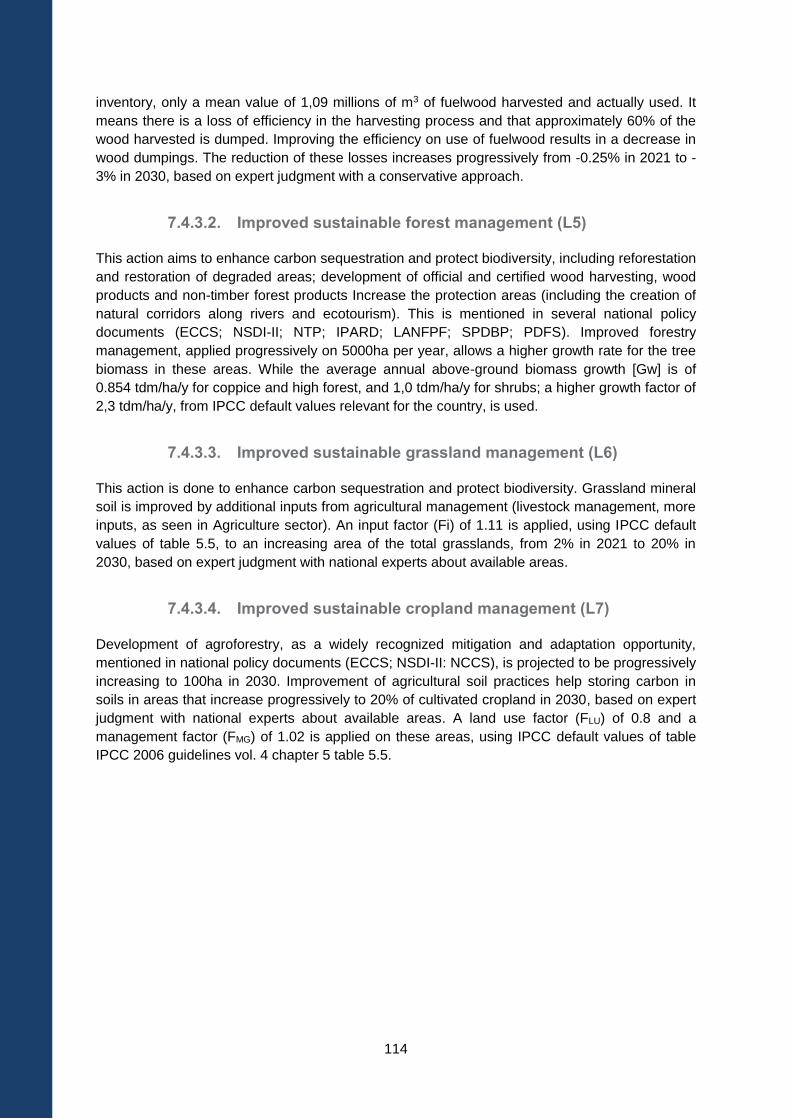
114
inventory, only a mean value of 1,09 millions of m3 of fuelwood harvested and actually used. It
means there is a loss of efficiency in the harvesting process and that approximately 60% of the
wood harvested is dumped. Improving the efficiency on use of fuelwood results in a decrease in
wood dumpings. The reduction of these losses increases progressively from -0.25% in 2021 to -
3% in 2030, based on expert judgment with a conservative approach.
7.4.3.2. Improved sustainable forest management (L5)
This action aims to enhance carbon sequestration and protect biodiversity, including reforestation
and restoration of degraded areas; development of official and certified wood harvesting, wood
products and non-timber forest products Increase the protection areas (including the creation of
natural corridors along rivers and ecotourism). This is mentioned in several national policy
documents (ECCS; NSDI-II; NTP; IPARD; LANFPF; SPDBP; PDFS). Improved forestry
management, applied progressively on 5000ha per year, allows a higher growth rate for the tree
biomass in these areas. While the average annual above-ground biomass growth [Gw] is of
0.854 tdm/ha/y for coppice and high forest, and 1,0 tdm/ha/y for shrubs; a higher growth factor of
2,3 tdm/ha/y, from IPCC default values relevant for the country, is used.
7.4.3.3. Improved sustainable grassland management (L6)
This action is done to enhance carbon sequestration and protect biodiversity. Grassland mineral
soil is improved by additional inputs from agricultural management (livestock management, more
inputs, as seen in Agriculture sector). An input factor (Fi) of 1.11 is applied, using IPCC default
values of table 5.5, to an increasing area of the total grasslands, from 2% in 2021 to 20% in
2030, based on expert judgment with national experts about available areas.
7.4.3.4. Improved sustainable cropland management (L7)
Development of agroforestry, as a widely recognized mitigation and adaptation opportunity,
mentioned in national policy documents (ECCS; NSDI-II: NCCS), is projected to be progressively
increasing to 100ha in 2030. Improvement of agricultural soil practices help storing carbon in
soils in areas that increase progressively to 20% of cultivated cropland in 2030, based on expert
judgment with national experts about available areas. A land use factor (FLU) of 0.8 and a
management factor (FMG) of 1.02 is applied on these areas, using IPCC default values of table
IPCC 2006 guidelines vol. 4 chapter 5 table 5.5.
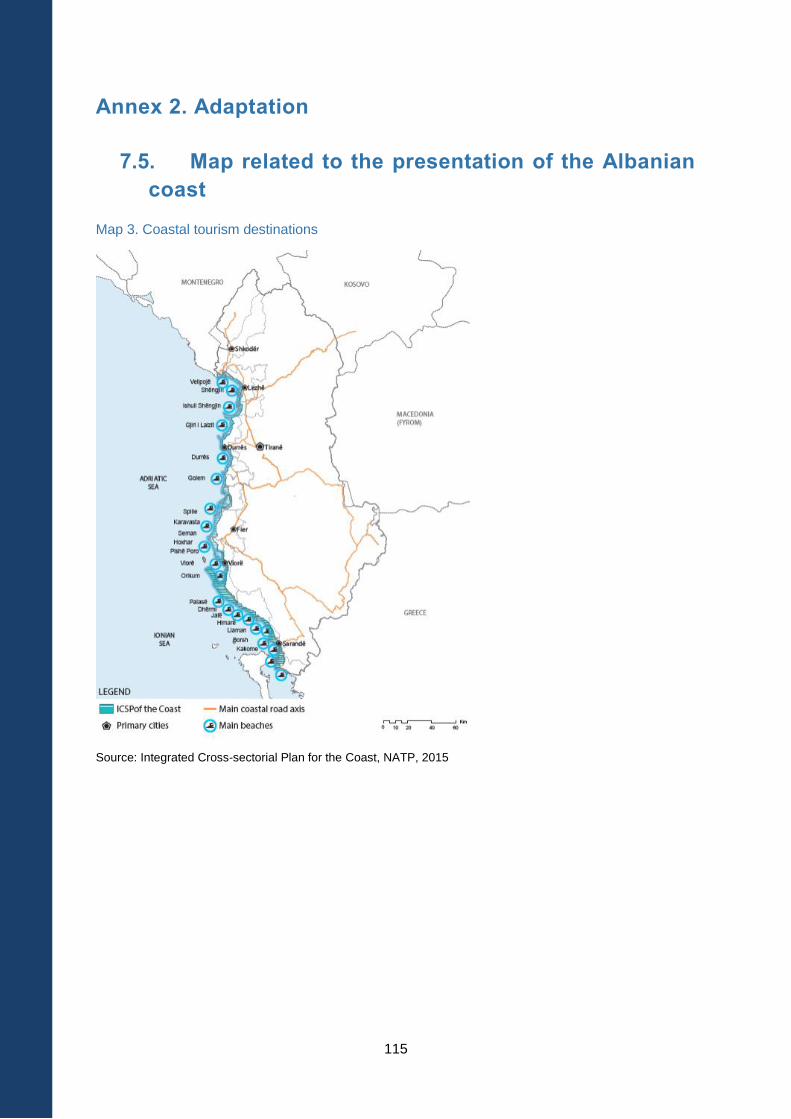
115
Annex 2. Adaptation
7.5. Map related to the presentation of the Albanian
coast
Map 3. Coastal tourism destinations
Source: Integrated Cross-sectorial Plan for the Coast, NATP, 2015
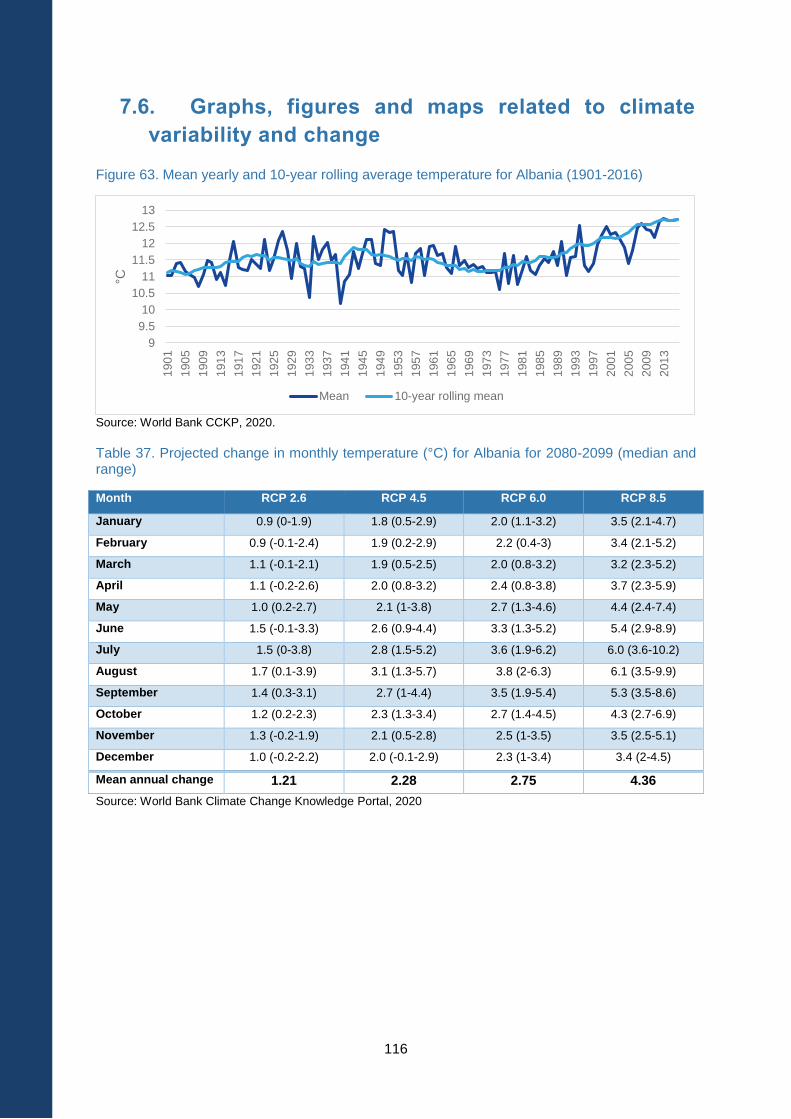
116
7.6. Graphs, figures and maps related to climate
variability and change
Figure 63. Mean yearly and 10-year rolling average temperature for Albania (1901-2016)
Source: World Bank CCKP, 2020.
Table 37. Projected change in monthly temperature (°C) for Albania for 2080-2099 (median and range)
Month RCP 2.6 RCP 4.5 RCP 6.0 RCP 8.5
January 0.9 (0-1.9) 1.8 (0.5-2.9) 2.0 (1.1-3.2) 3.5 (2.1-4.7)
February 0.9 (-0.1-2.4) 1.9 (0.2-2.9) 2.2 (0.4-3) 3.4 (2.1-5.2)
March 1.1 (-0.1-2.1) 1.9 (0.5-2.5) 2.0 (0.8-3.2) 3.2 (2.3-5.2)
April 1.1 (-0.2-2.6) 2.0 (0.8-3.2) 2.4 (0.8-3.8) 3.7 (2.3-5.9)
May 1.0 (0.2-2.7) 2.1 (1-3.8) 2.7 (1.3-4.6) 4.4 (2.4-7.4)
June 1.5 (-0.1-3.3) 2.6 (0.9-4.4) 3.3 (1.3-5.2) 5.4 (2.9-8.9)
July 1.5 (0-3.8) 2.8 (1.5-5.2) 3.6 (1.9-6.2) 6.0 (3.6-10.2)
August 1.7 (0.1-3.9) 3.1 (1.3-5.7) 3.8 (2-6.3) 6.1 (3.5-9.9)
September 1.4 (0.3-3.1) 2.7 (1-4.4) 3.5 (1.9-5.4) 5.3 (3.5-8.6)
October 1.2 (0.2-2.3) 2.3 (1.3-3.4) 2.7 (1.4-4.5) 4.3 (2.7-6.9)
November 1.3 (-0.2-1.9) 2.1 (0.5-2.8) 2.5 (1-3.5) 3.5 (2.5-5.1)
December 1.0 (-0.2-2.2) 2.0 (-0.1-2.9) 2.3 (1-3.4) 3.4 (2-4.5)
Mean annual change 1.21 2.28 2.75 4.36
Source: World Bank Climate Change Knowledge Portal, 2020
9
9.5
10
10.5
11
11.5
12
12.5
13
190
1
190
5
190
9
191
3
191
7
192
1
192
5
192
9
193
3
193
7
194
1
194
5
194
9
195
3
195
7
196
1
196
5
196
9
197
3
197
7
198
1
198
5
198
9
199
3
199
7
200
1
200
5
200
9
201
3
°C
Mean 10-year rolling mean
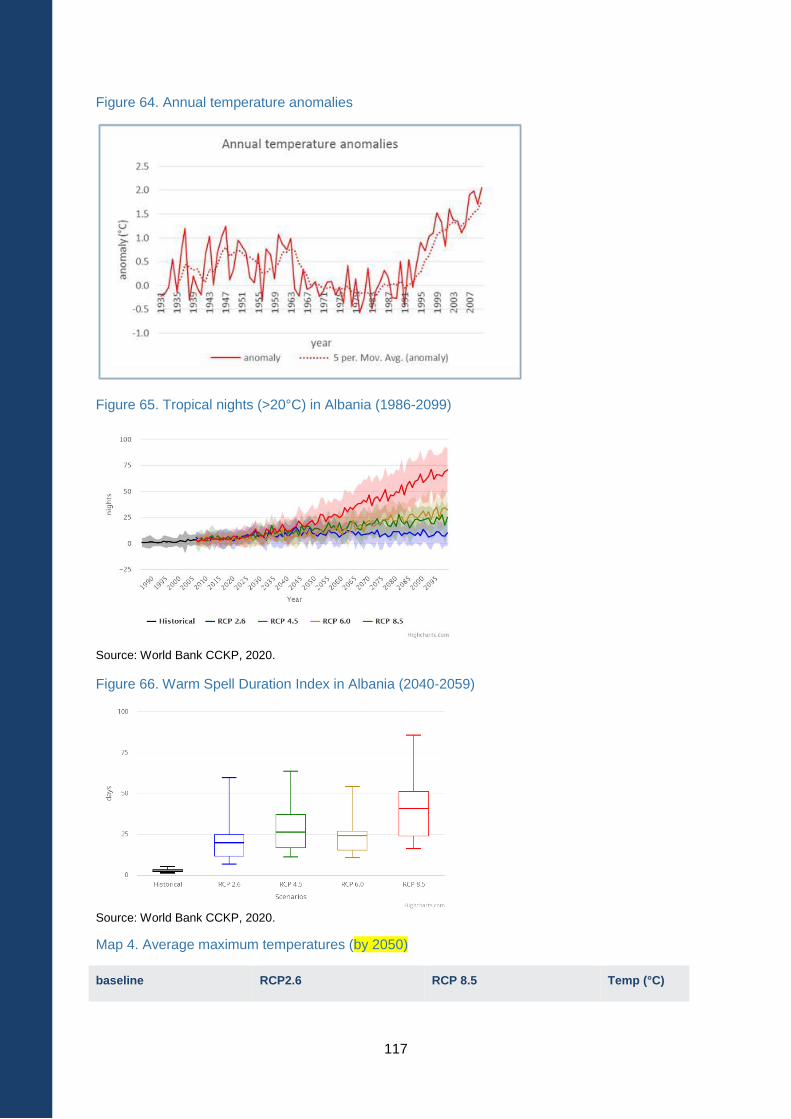
117
Figure 64. Annual temperature anomalies
Figure 65. Tropical nights (>20°C) in Albania (1986-2099)
Source: World Bank CCKP, 2020.
Figure 66. Warm Spell Duration Index in Albania (2040-2059)
Source: World Bank CCKP, 2020.
Map 4. Average maximum temperatures (by 2050)
baseline RCP2.6 RCP 8.5 Temp (°C)
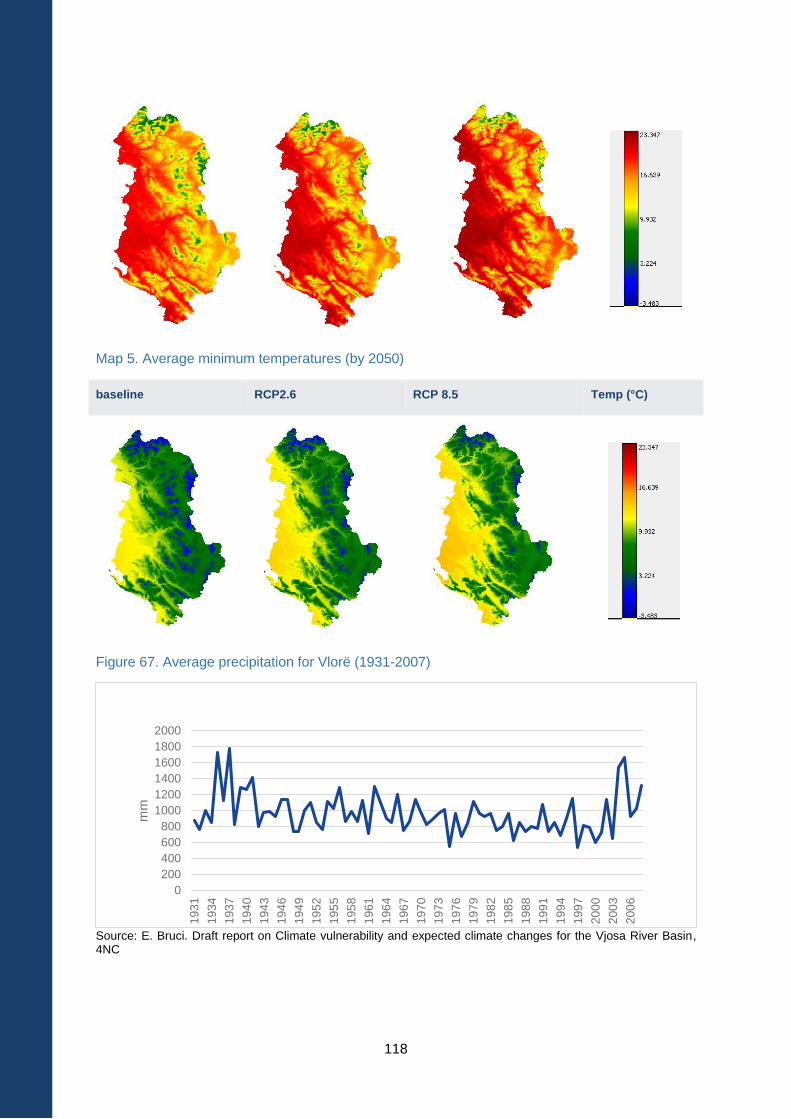
118
Map 5. Average minimum temperatures (by 2050)
baseline RCP2.6 RCP 8.5 Temp (°C)
Figure 67. Average precipitation for Vlorë (1931-2007)
Source: E. Bruci. Draft report on Climate vulnerability and expected climate changes for the Vjosa River Basin, 4NC
0
200
400
600
800
1000
1200
1400
1600
1800
2000
193
1
193
4
193
7
194
0
194
3
194
6
194
9
195
2
195
5
195
8
196
1
196
4
196
7
197
0
197
3
197
6
197
9
198
2
198
5
198
8
199
1
199
4
199
7
200
0
200
3
200
6
mm
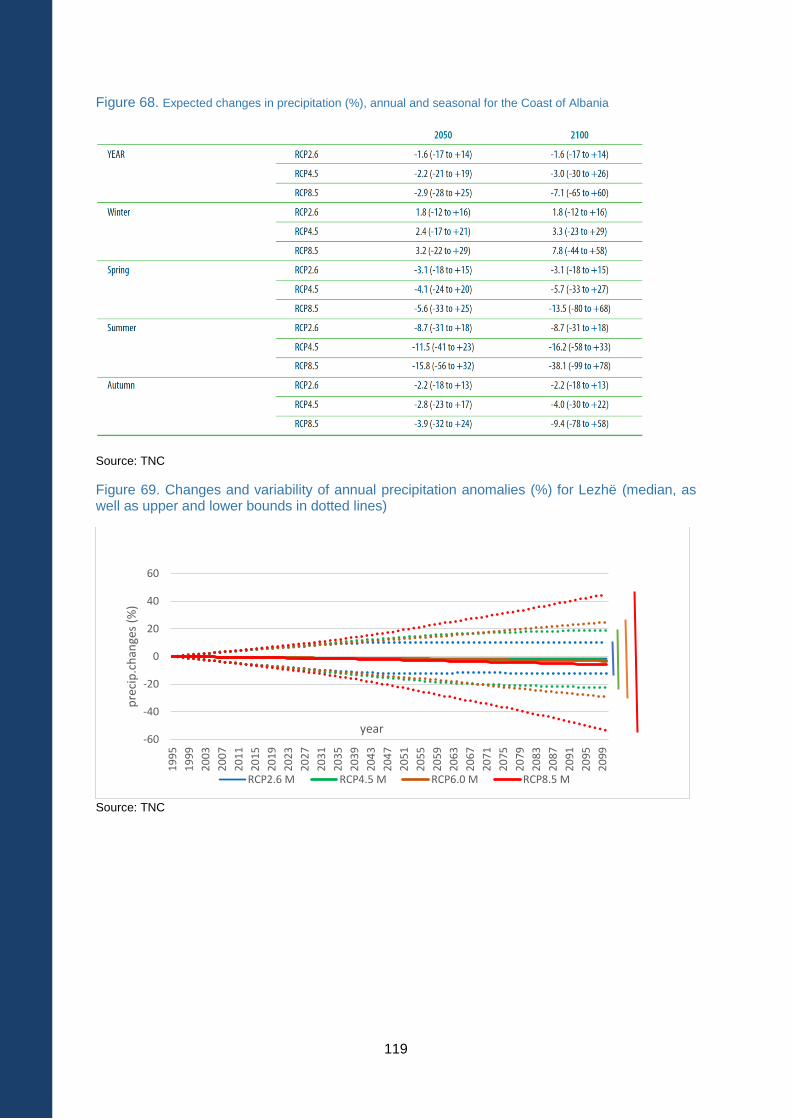
119
Figure 68. Expected changes in precipitation (%), annual and seasonal for the Coast of Albania
Source: TNC
Figure 69. Changes and variability of annual precipitation anomalies (%) for Lezhë (median, as well as upper and lower bounds in dotted lines)
Source: TNC
-60
-40
-20
0
20
40
60
19
95
19
99
20
03
20
07
20
11
20
15
20
19
20
23
20
27
20
31
20
35
20
39
20
43
20
47
20
51
20
55
20
59
20
63
20
67
20
71
20
75
20
79
20
83
20
87
20
91
20
95
20
99
pre
cip
.ch
ange
s (%
)
year
RCP2.6 M RCP4.5 M RCP6.0 M RCP8.5 M
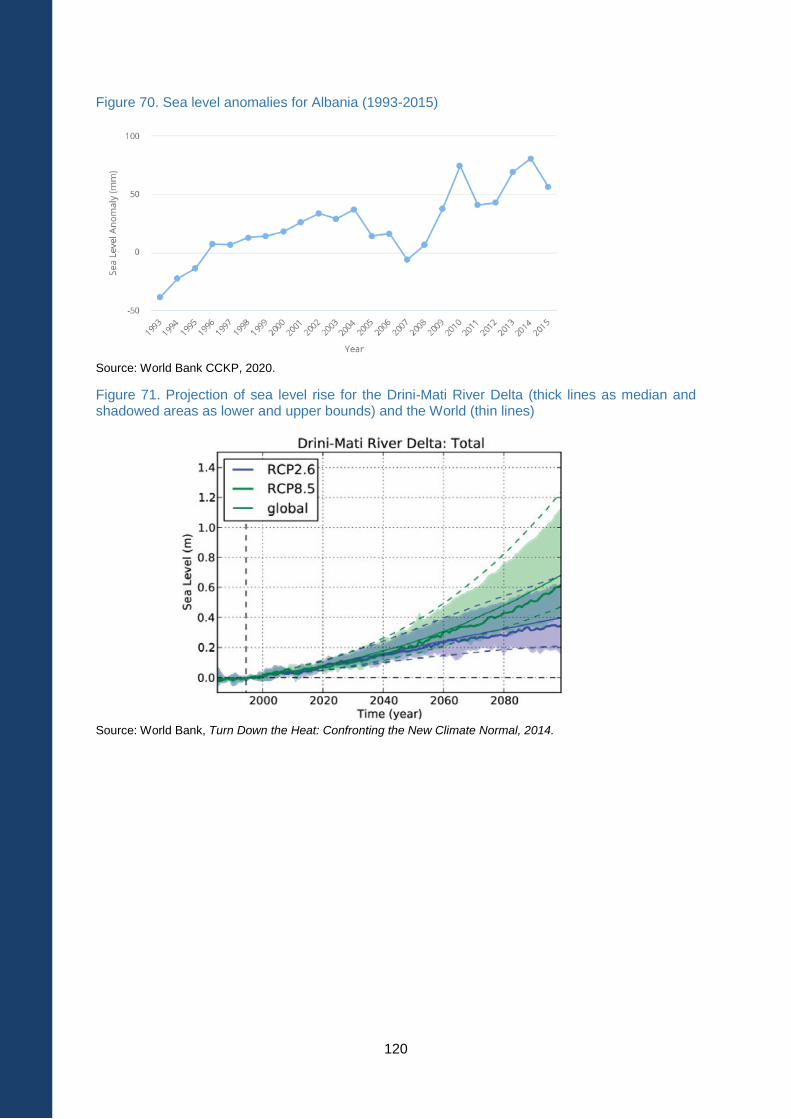
120
Figure 70. Sea level anomalies for Albania (1993-2015)
Source: World Bank CCKP, 2020.
Figure 71. Projection of sea level rise for the Drini-Mati River Delta (thick lines as median and shadowed areas as lower and upper bounds) and the World (thin lines)
Source: World Bank, Turn Down the Heat: Confronting the New Climate Normal, 2014.
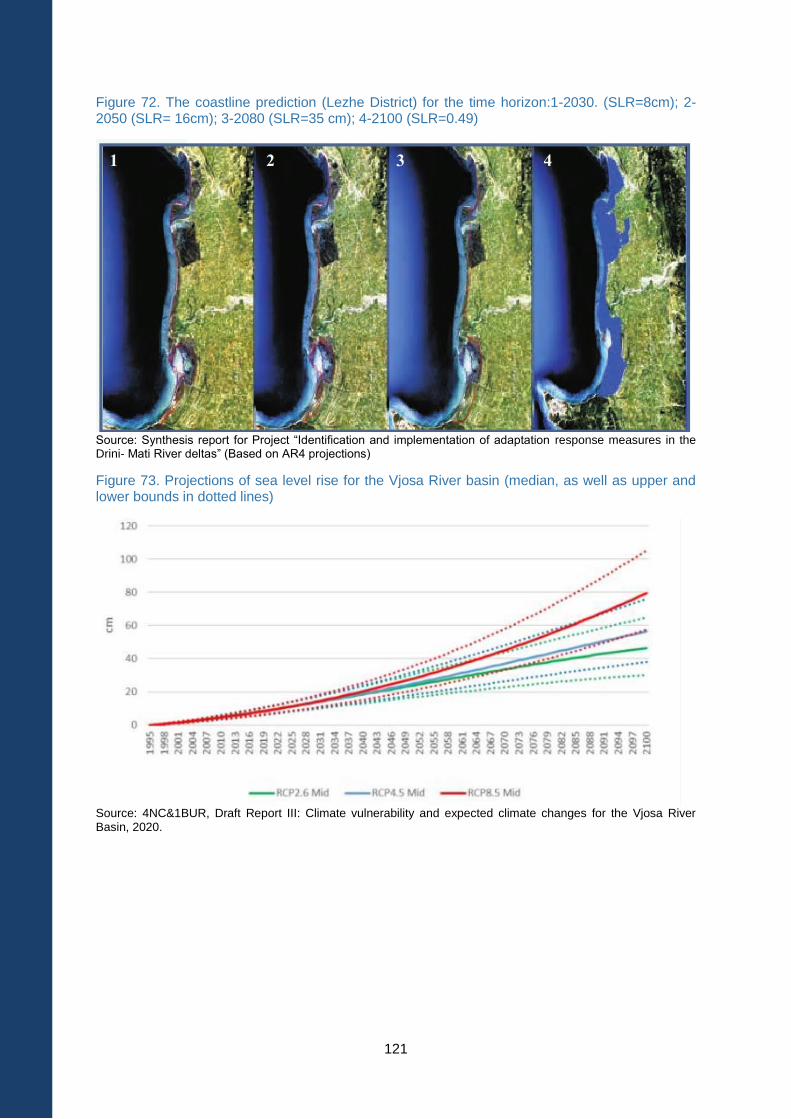
121
Figure 72. The coastline prediction (Lezhe District) for the time horizon:1-2030. (SLR=8cm); 2-2050 (SLR= 16cm); 3-2080 (SLR=35 cm); 4-2100 (SLR=0.49)
Source: Synthesis report for Project “Identification and implementation of adaptation response measures in the Drini- Mati River deltas” (Based on AR4 projections)
Figure 73. Projections of sea level rise for the Vjosa River basin (median, as well as upper and lower bounds in dotted lines)
Source: 4NC&1BUR, Draft Report III: Climate vulnerability and expected climate changes for the Vjosa River Basin, 2020.
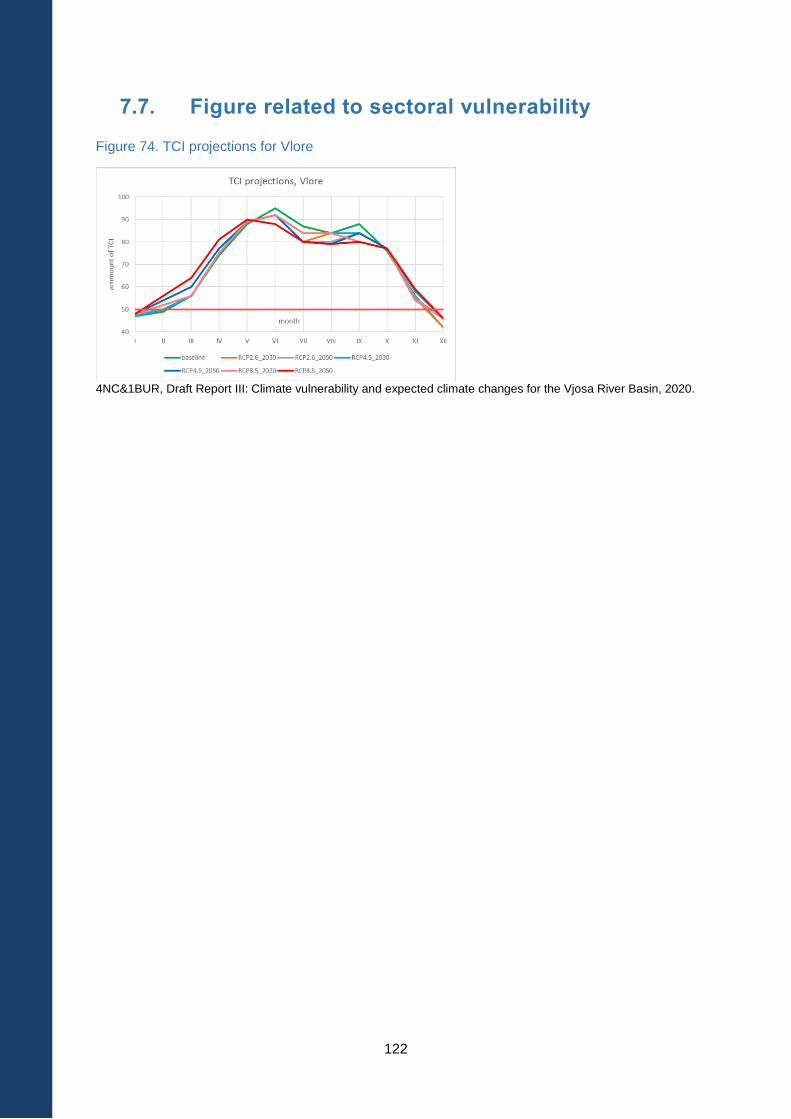
122
7.7. Figure related to sectoral vulnerability
Figure 74. TCI projections for Vlore
4NC&1BUR, Draft Report III: Climate vulnerability and expected climate changes for the Vjosa River Basin, 2020.
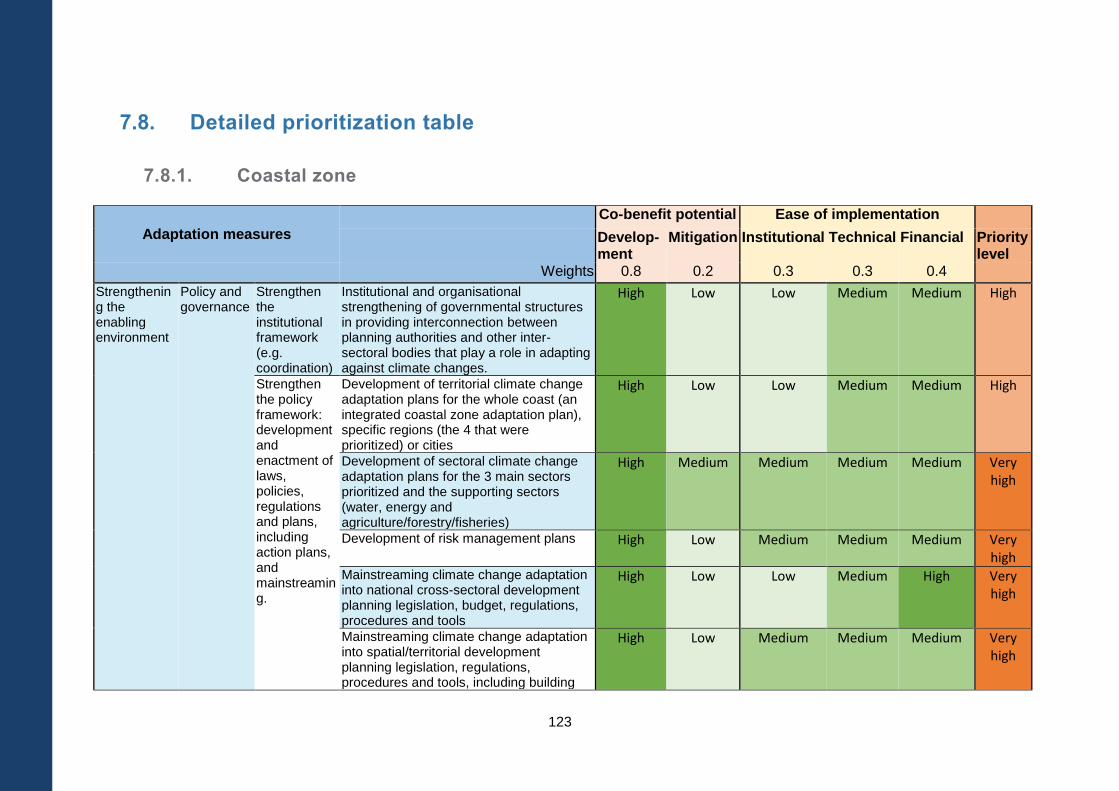
123
7.8. Detailed prioritization table
7.8.1. Coastal zone
Adaptation measures
Co-benefit potential Ease of implementation
Develop-ment
Mitigation Institutional Technical Financial Priority level
Weights 0.8 0.2 0.3 0.3 0.4
Strengthening the enabling environment
Policy and governance
Strengthen the institutional framework (e.g. coordination)
Institutional and organisational strengthening of governmental structures in providing interconnection between planning authorities and other inter-sectoral bodies that play a role in adapting against climate changes.
High Low Low Medium Medium High
Strengthen the policy framework: development and enactment of laws, policies, regulations and plans, including action plans, and mainstreaming.
Development of territorial climate change adaptation plans for the whole coast (an integrated coastal zone adaptation plan), specific regions (the 4 that were prioritized) or cities
High Low Low Medium Medium High
Development of sectoral climate change adaptation plans for the 3 main sectors prioritized and the supporting sectors (water, energy and agriculture/forestry/fisheries)
High Medium Medium Medium Medium Very high
Development of risk management plans High Low Medium Medium Medium Very high
Mainstreaming climate change adaptation into national cross-sectoral development planning legislation, budget, regulations, procedures and tools
High Low Low Medium High Very high
Mainstreaming climate change adaptation into spatial/territorial development planning legislation, regulations, procedures and tools, including building
High Low Medium Medium Medium Very high
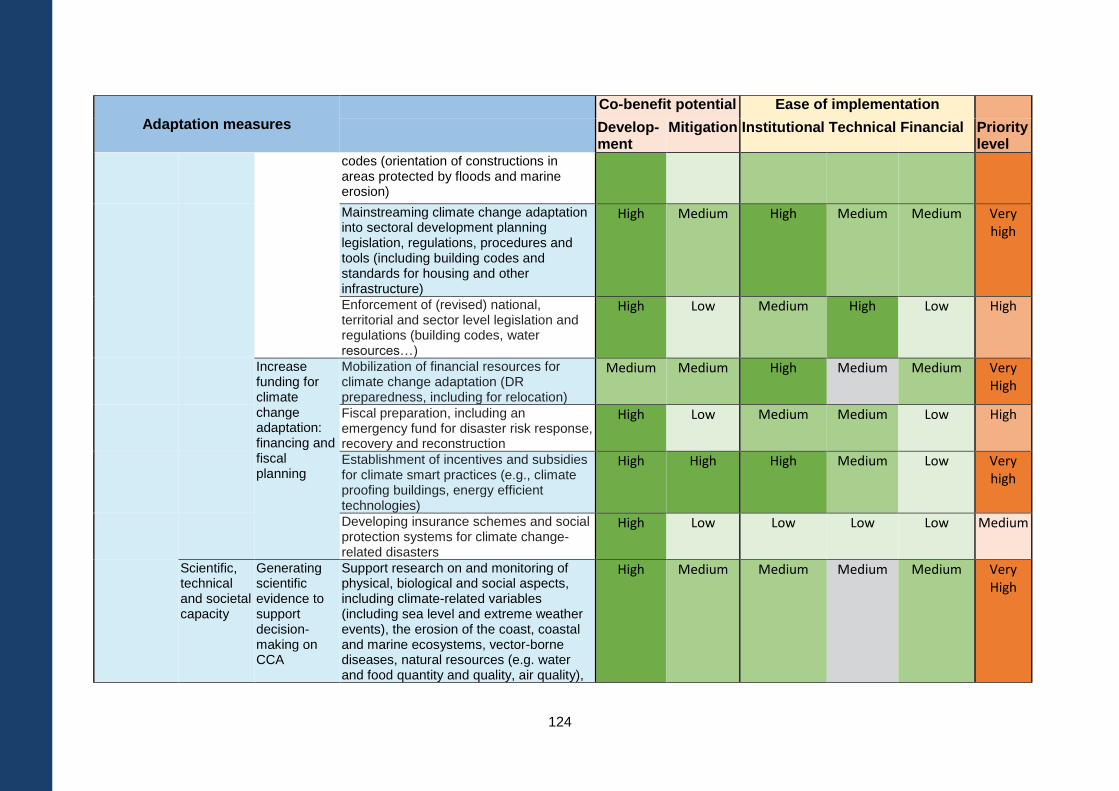
124
Adaptation measures
Co-benefit potential Ease of implementation
Develop-ment
Mitigation Institutional Technical Financial Priority level
codes (orientation of constructions in areas protected by floods and marine erosion)
Mainstreaming climate change adaptation into sectoral development planning legislation, regulations, procedures and tools (including building codes and standards for housing and other infrastructure)
High Medium High Medium Medium Very high
Enforcement of (revised) national, territorial and sector level legislation and regulations (building codes, water resources…)
High Low Medium High Low High
Increase funding for climate change adaptation: financing and fiscal planning
Mobilization of financial resources for climate change adaptation (DR preparedness, including for relocation)
Medium Medium High Medium Medium Very High
Fiscal preparation, including an emergency fund for disaster risk response, recovery and reconstruction
High Low Medium Medium Low High
Establishment of incentives and subsidies for climate smart practices (e.g., climate proofing buildings, energy efficient technologies)
High High High Medium Low Very high
Developing insurance schemes and social protection systems for climate change-related disasters
High Low Low Low Low Medium
Scientific, technical and societal capacity
Generating scientific evidence to support decision-making on CCA
Support research on and monitoring of physical, biological and social aspects, including climate-related variables (including sea level and extreme weather events), the erosion of the coast, coastal and marine ecosystems, vector-borne diseases, natural resources (e.g. water and food quantity and quality, air quality),
High Medium Medium Medium Medium Very High
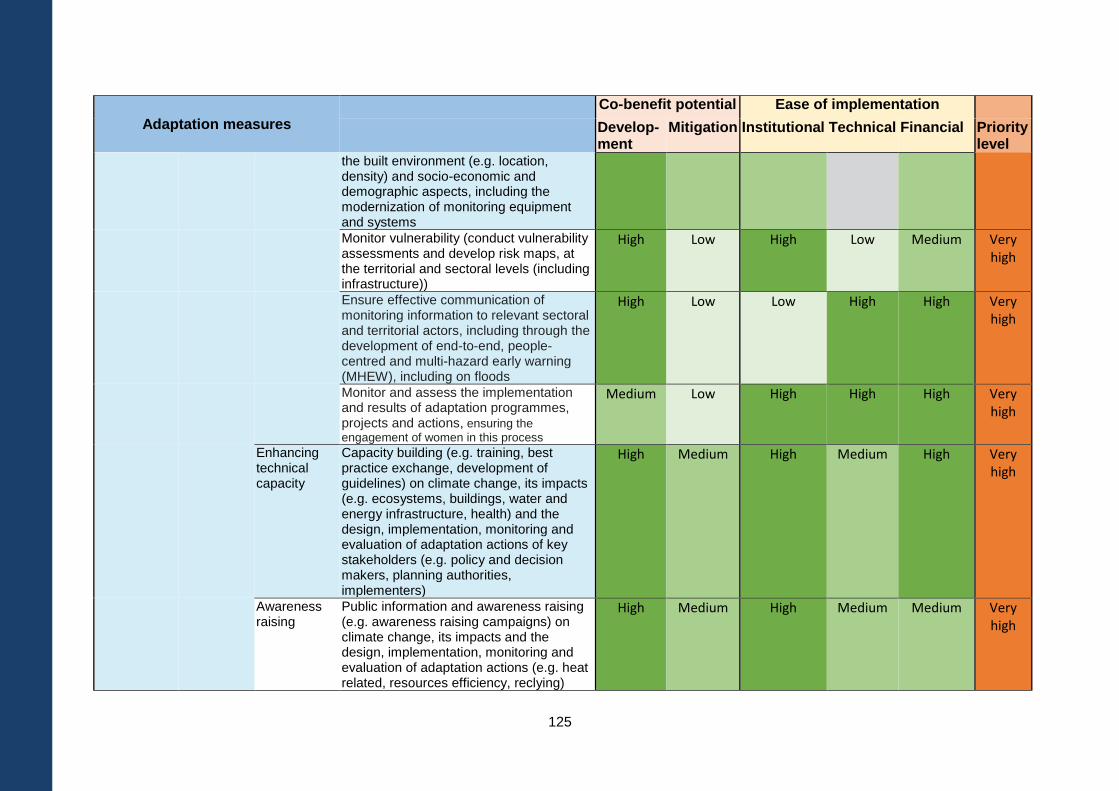
125
Adaptation measures
Co-benefit potential Ease of implementation
Develop-ment
Mitigation Institutional Technical Financial Priority level
the built environment (e.g. location, density) and socio-economic and demographic aspects, including the modernization of monitoring equipment and systems
Monitor vulnerability (conduct vulnerability assessments and develop risk maps, at the territorial and sectoral levels (including infrastructure))
High Low High Low Medium Very high
Ensure effective communication of monitoring information to relevant sectoral and territorial actors, including through the development of end-to-end, people-centred and multi-hazard early warning (MHEW), including on floods
High Low Low High High Very high
Monitor and assess the implementation and results of adaptation programmes, projects and actions, ensuring the
engagement of women in this process
Medium Low High High High Very high
Enhancing technical capacity
Capacity building (e.g. training, best practice exchange, development of guidelines) on climate change, its impacts (e.g. ecosystems, buildings, water and energy infrastructure, health) and the design, implementation, monitoring and evaluation of adaptation actions of key stakeholders (e.g. policy and decision makers, planning authorities, implementers)
High Medium High Medium High Very high
Awareness raising
Public information and awareness raising (e.g. awareness raising campaigns) on climate change, its impacts and the design, implementation, monitoring and evaluation of adaptation actions (e.g. heat related, resources efficiency, reclying)
High Medium High Medium Medium Very high
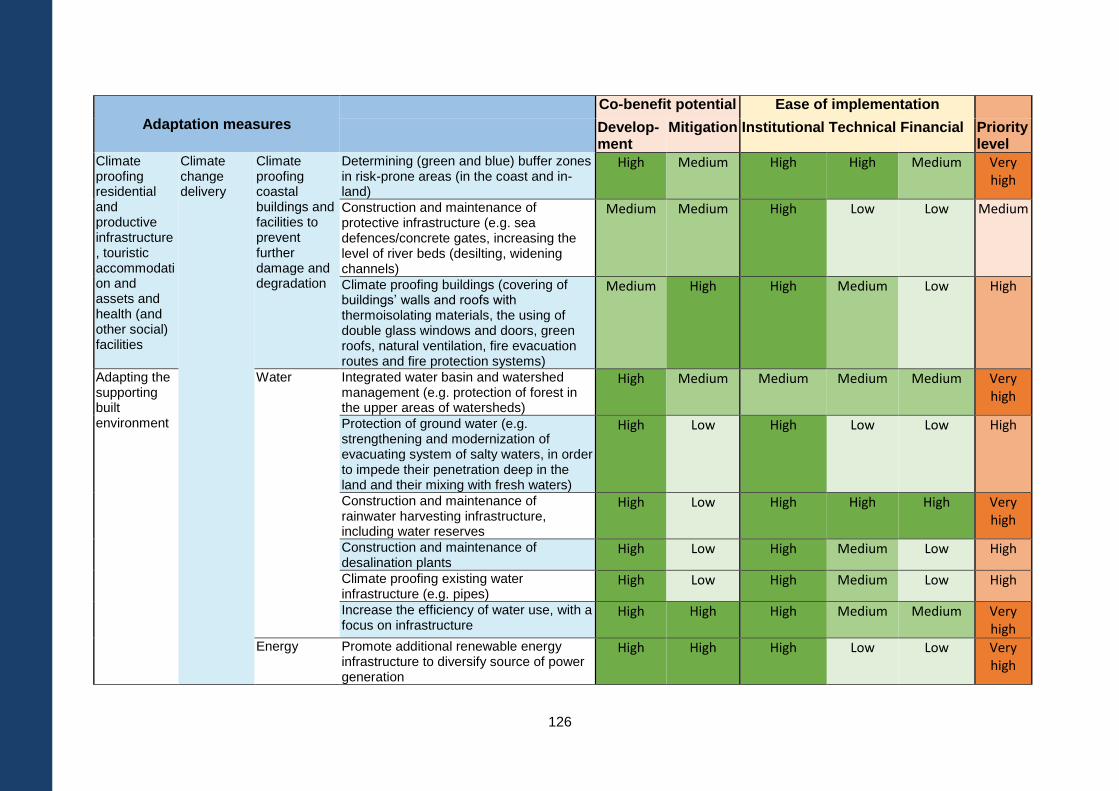
126
Adaptation measures
Co-benefit potential Ease of implementation
Develop-ment
Mitigation Institutional Technical Financial Priority level
Climate proofing residential and productive infrastructure, touristic accommodation and assets and health (and other social) facilities
Climate change delivery
Climate proofing coastal buildings and facilities to prevent further damage and degradation
Determining (green and blue) buffer zones in risk-prone areas (in the coast and in-land)
High Medium High High Medium Very high
Construction and maintenance of protective infrastructure (e.g. sea defences/concrete gates, increasing the level of river beds (desilting, widening channels)
Medium Medium High Low Low Medium
Climate proofing buildings (covering of buildings’ walls and roofs with thermoisolating materials, the using of double glass windows and doors, green roofs, natural ventilation, fire evacuation routes and fire protection systems)
Medium High High Medium Low High
Adapting the supporting built environment
Water Integrated water basin and watershed management (e.g. protection of forest in the upper areas of watersheds)
High Medium Medium Medium Medium Very high
Protection of ground water (e.g. strengthening and modernization of evacuating system of salty waters, in order to impede their penetration deep in the land and their mixing with fresh waters)
High Low High Low Low High
Construction and maintenance of rainwater harvesting infrastructure, including water reserves
High Low High High High Very high
Construction and maintenance of desalination plants
High Low High Medium Low High
Climate proofing existing water infrastructure (e.g. pipes)
High Low High Medium Low High
Increase the efficiency of water use, with a focus on infrastructure
High High High Medium Medium Very high
Energy Promote additional renewable energy infrastructure to diversify source of power generation
High High High Low Low Very high
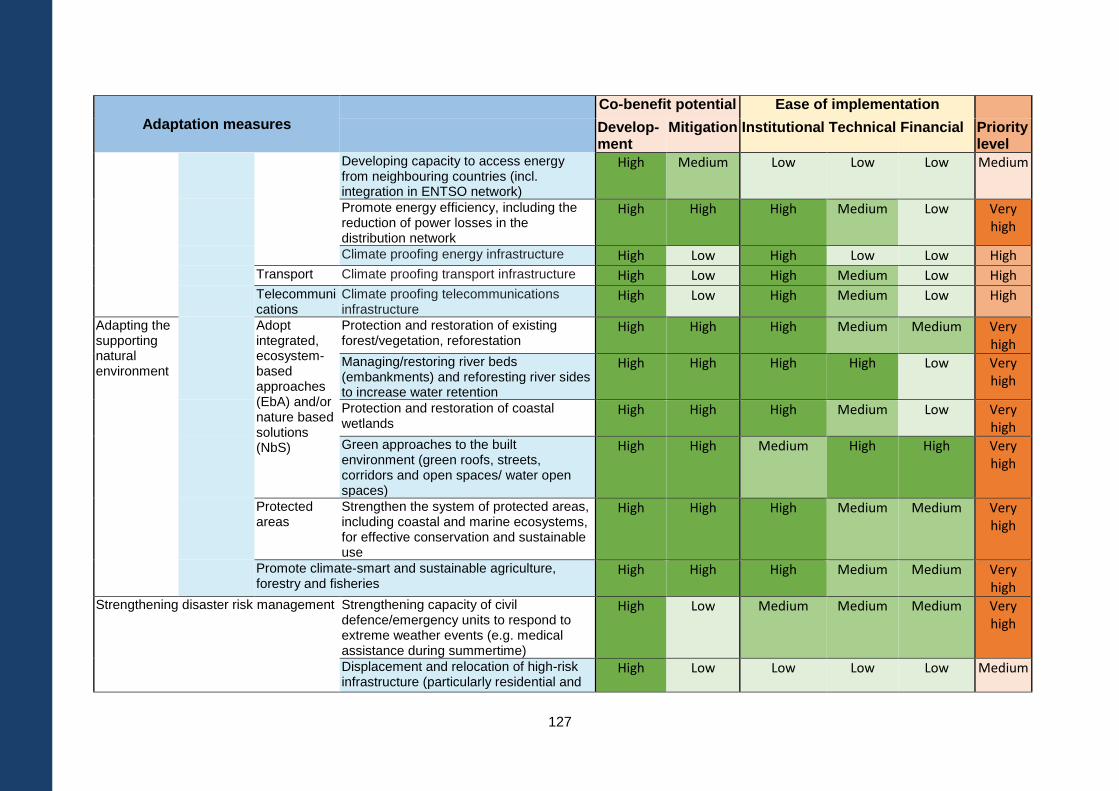
127
Adaptation measures
Co-benefit potential Ease of implementation
Develop-ment
Mitigation Institutional Technical Financial Priority level
Developing capacity to access energy from neighbouring countries (incl. integration in ENTSO network)
High Medium Low Low Low Medium
Promote energy efficiency, including the reduction of power losses in the distribution network
High High High Medium Low Very high
Climate proofing energy infrastructure High Low High Low Low High
Transport Climate proofing transport infrastructure High Low High Medium Low High
Telecommunications
Climate proofing telecommunications infrastructure
High Low High Medium Low High
Adapting the supporting natural environment
Adopt integrated, ecosystem-based approaches (EbA) and/or nature based solutions (NbS)
Protection and restoration of existing forest/vegetation, reforestation
High High High Medium Medium Very high
Managing/restoring river beds (embankments) and reforesting river sides to increase water retention
High High High High Low Very high
Protection and restoration of coastal wetlands
High High High Medium Low Very high
Green approaches to the built environment (green roofs, streets, corridors and open spaces/ water open spaces)
High High Medium High High Very high
Protected areas
Strengthen the system of protected areas, including coastal and marine ecosystems, for effective conservation and sustainable use
High High High Medium Medium Very high
Promote climate-smart and sustainable agriculture, forestry and fisheries
High High High Medium Medium Very high
Strengthening disaster risk management Strengthening capacity of civil defence/emergency units to respond to extreme weather events (e.g. medical assistance during summertime)
High Low Medium Medium Medium Very high
Displacement and relocation of high-risk infrastructure (particularly residential and
High Low Low Low Low Medium
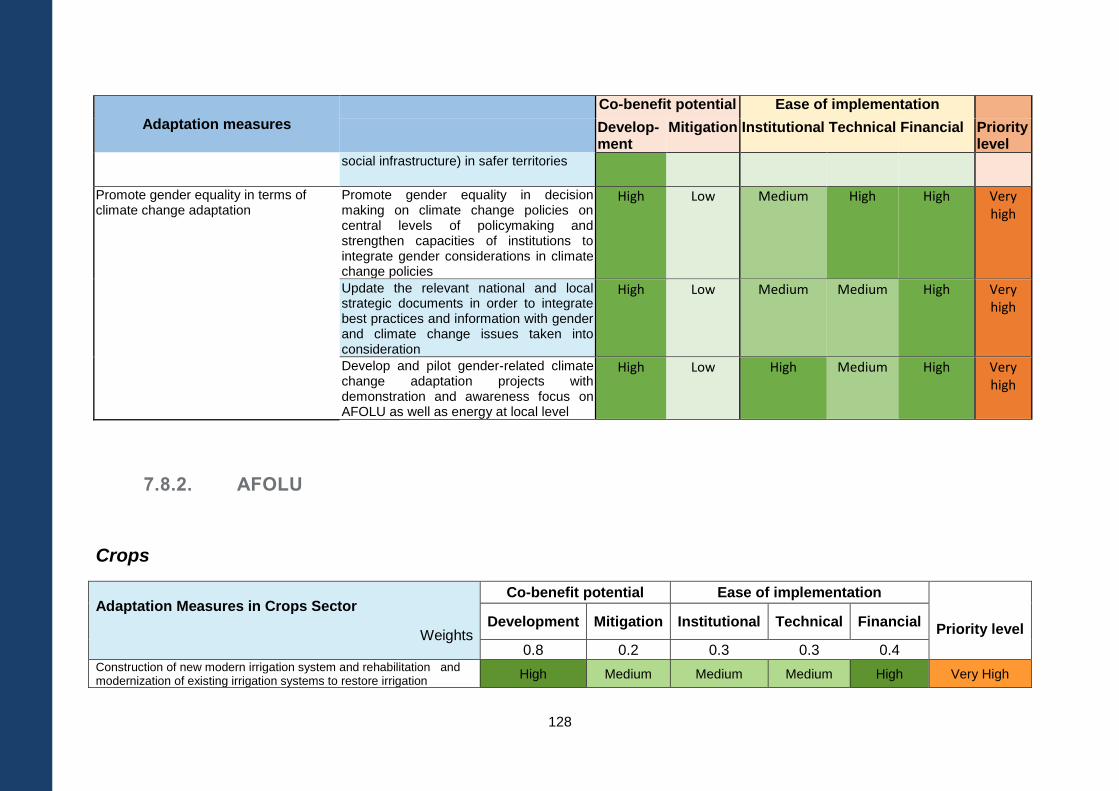
128
Adaptation measures
Co-benefit potential Ease of implementation
Develop-ment
Mitigation Institutional Technical Financial Priority level
social infrastructure) in safer territories
Promote gender equality in terms of climate change adaptation
Promote gender equality in decision making on climate change policies on central levels of policymaking and strengthen capacities of institutions to integrate gender considerations in climate change policies
High Low Medium High High Very high
Update the relevant national and local strategic documents in order to integrate best practices and information with gender and climate change issues taken into consideration
High Low Medium Medium High Very high
Develop and pilot gender-related climate change adaptation projects with demonstration and awareness focus on AFOLU as well as energy at local level
High Low High Medium High Very high
7.8.2. AFOLU
Crops
Adaptation Measures in Crops Sector
Weights
Co-benefit potential Ease of implementation
Priority level
Development Mitigation Institutional Technical Financial
0.8 0.2 0.3 0.3 0.4 Construction of new modern irrigation system and rehabilitation and modernization of existing irrigation systems to restore irrigation
High Medium Medium Medium High Very High
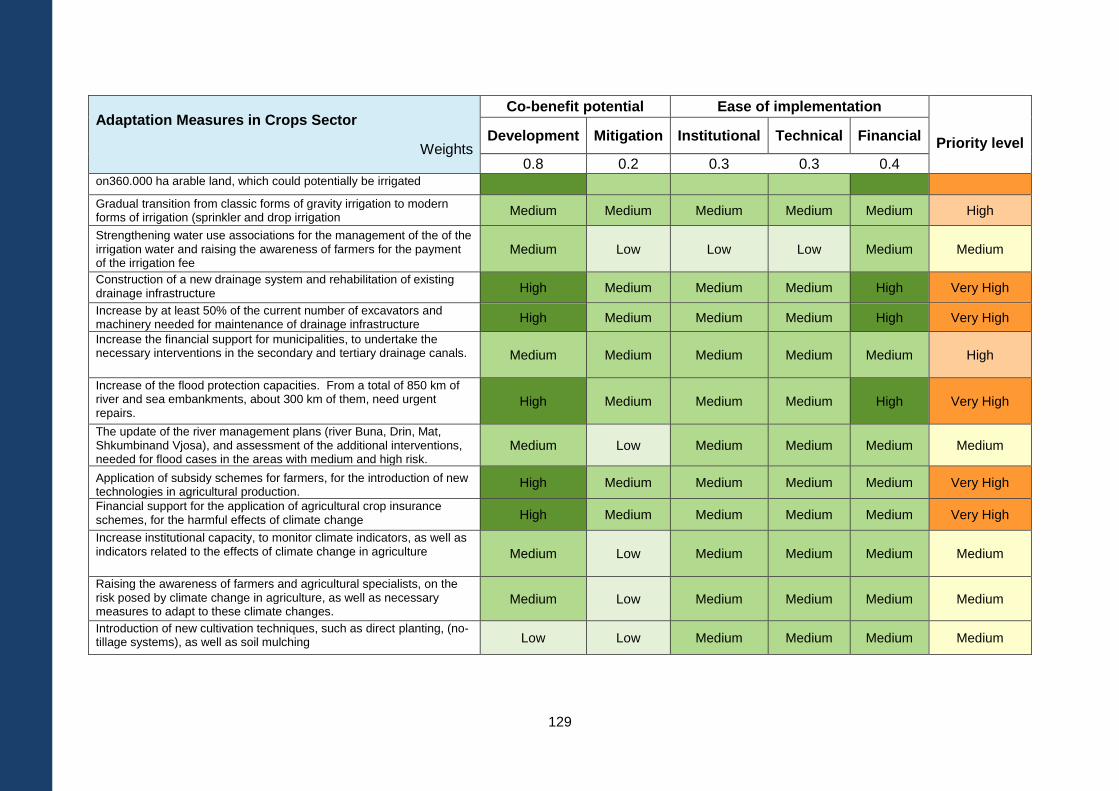
129
Adaptation Measures in Crops Sector
Weights
Co-benefit potential Ease of implementation
Priority level
Development Mitigation Institutional Technical Financial
0.8 0.2 0.3 0.3 0.4 on360.000 ha arable land, which could potentially be irrigated
Gradual transition from classic forms of gravity irrigation to modern forms of irrigation (sprinkler and drop irrigation
Medium Medium Medium Medium Medium High
Strengthening water use associations for the management of the of the irrigation water and raising the awareness of farmers for the payment of the irrigation fee
Medium Low Low Low Medium Medium
Construction of a new drainage system and rehabilitation of existing drainage infrastructure High Medium Medium Medium High Very High
Increase by at least 50% of the current number of excavators and machinery needed for maintenance of drainage infrastructure
High Medium Medium Medium High Very High
Increase the financial support for municipalities, to undertake the necessary interventions in the secondary and tertiary drainage canals. Medium Medium Medium Medium Medium High
Increase of the flood protection capacities. From a total of 850 km of river and sea embankments, about 300 km of them, need urgent repairs.
High Medium Medium Medium High Very High
The update of the river management plans (river Buna, Drin, Mat, Shkumbinand Vjosa), and assessment of the additional interventions, needed for flood cases in the areas with medium and high risk.
Medium Low Medium Medium Medium Medium
Application of subsidy schemes for farmers, for the introduction of new technologies in agricultural production.
High Medium Medium Medium Medium Very High
Financial support for the application of agricultural crop insurance schemes, for the harmful effects of climate change High Medium Medium Medium Medium Very High
Increase institutional capacity, to monitor climate indicators, as well as indicators related to the effects of climate change in agriculture Medium Low Medium Medium Medium Medium
Raising the awareness of farmers and agricultural specialists, on the risk posed by climate change in agriculture, as well as necessary measures to adapt to these climate changes.
Medium Low Medium Medium Medium Medium
Introduction of new cultivation techniques, such as direct planting, (no-tillage systems), as well as soil mulching Low Low Medium Medium Medium Medium
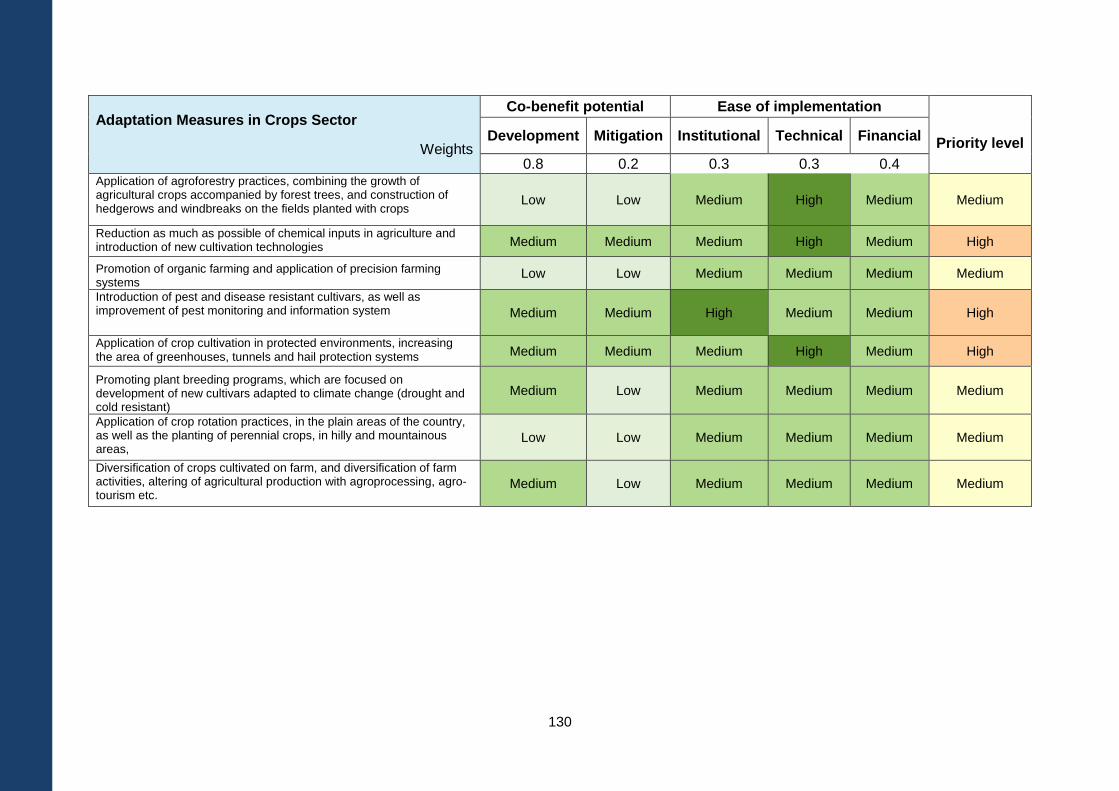
130
Adaptation Measures in Crops Sector
Weights
Co-benefit potential Ease of implementation
Priority level
Development Mitigation Institutional Technical Financial
0.8 0.2 0.3 0.3 0.4 Application of agroforestry practices, combining the growth of agricultural crops accompanied by forest trees, and construction of hedgerows and windbreaks on the fields planted with crops
Low Low Medium High Medium Medium
Reduction as much as possible of chemical inputs in agriculture and introduction of new cultivation technologies Medium Medium Medium High Medium High
Promotion of organic farming and application of precision farming systems
Low Low Medium Medium Medium Medium
Introduction of pest and disease resistant cultivars, as well as improvement of pest monitoring and information system Medium Medium High Medium Medium High
Application of crop cultivation in protected environments, increasing the area of greenhouses, tunnels and hail protection systems Medium Medium Medium High Medium High
Promoting plant breeding programs, which are focused on development of new cultivars adapted to climate change (drought and cold resistant)
Medium Low Medium Medium Medium Medium
Application of crop rotation practices, in the plain areas of the country, as well as the planting of perennial crops, in hilly and mountainous areas,
Low Low Medium Medium Medium Medium
Diversification of crops cultivated on farm, and diversification of farm activities, altering of agricultural production with agroprocessing, agro-tourism etc.
Medium Low Medium Medium Medium Medium
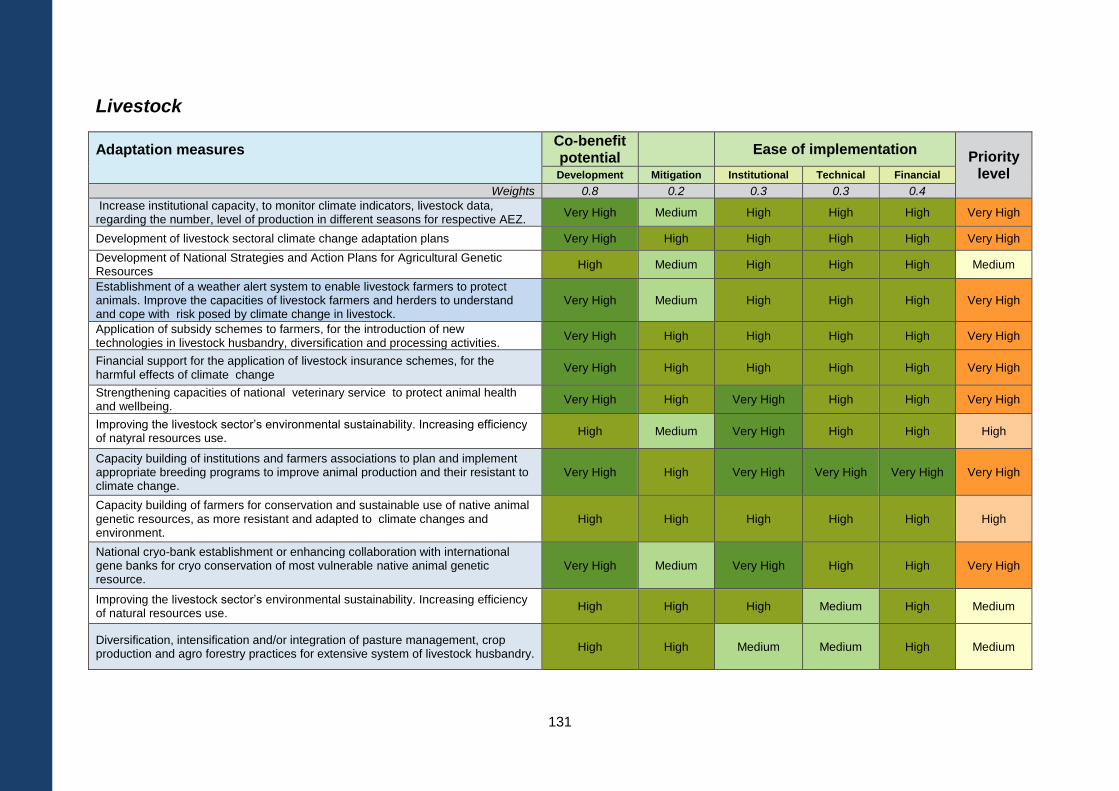
131
Livestock
Adaptation measures
Co-benefit potential
Ease of implementation Priority
level Development Mitigation Institutional Technical Financial
Weights 0.8 0.2 0.3 0.3 0.4
Increase institutional capacity, to monitor climate indicators, livestock data, regarding the number, level of production in different seasons for respective AEZ.
Very High Medium High High High Very High
Development of livestock sectoral climate change adaptation plans Very High High High High High Very High
Development of National Strategies and Action Plans for Agricultural Genetic Resources
High Medium High High High Medium
Establishment of a weather alert system to enable livestock farmers to protect animals. Improve the capacities of livestock farmers and herders to understand and cope with risk posed by climate change in livestock.
Very High Medium High High High Very High
Application of subsidy schemes to farmers, for the introduction of new technologies in livestock husbandry, diversification and processing activities.
Very High High High High High Very High
Financial support for the application of livestock insurance schemes, for the harmful effects of climate change
Very High High High High High Very High
Strengthening capacities of national veterinary service to protect animal health and wellbeing.
Very High High Very High High High Very High
Improving the livestock sector’s environmental sustainability. Increasing efficiency of natyral resources use.
High Medium Very High High High High
Capacity building of institutions and farmers associations to plan and implement appropriate breeding programs to improve animal production and their resistant to climate change.
Very High High Very High Very High Very High Very High
Capacity building of farmers for conservation and sustainable use of native animal genetic resources, as more resistant and adapted to climate changes and environment.
High High High High High High
National cryo-bank establishment or enhancing collaboration with international gene banks for cryo conservation of most vulnerable native animal genetic resource.
Very High Medium Very High High High Very High
Improving the livestock sector’s environmental sustainability. Increasing efficiency of natural resources use.
High High High Medium High Medium
Diversification, intensification and/or integration of pasture management, crop production and agro forestry practices for extensive system of livestock husbandry.
High High Medium Medium High Medium
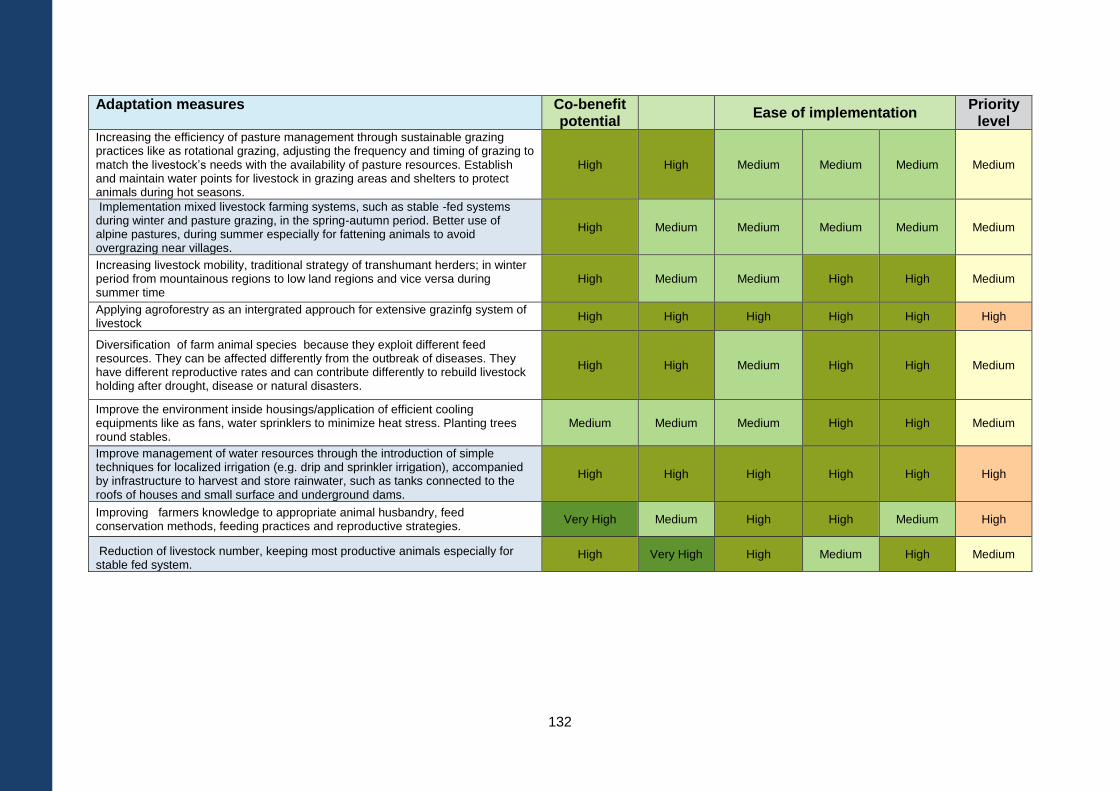
132
Adaptation measures
Co-benefit potential
Ease of implementation Priority
level Increasing the efficiency of pasture management through sustainable grazing practices like as rotational grazing, adjusting the frequency and timing of grazing to match the livestock’s needs with the availability of pasture resources. Establish and maintain water points for livestock in grazing areas and shelters to protect animals during hot seasons.
High High Medium Medium Medium Medium
Implementation mixed livestock farming systems, such as stable -fed systems during winter and pasture grazing, in the spring-autumn period. Better use of alpine pastures, during summer especially for fattening animals to avoid overgrazing near villages.
High Medium Medium Medium Medium Medium
Increasing livestock mobility, traditional strategy of transhumant herders; in winter period from mountainous regions to low land regions and vice versa during summer time
High Medium Medium High High Medium
Applying agroforestry as an intergrated approuch for extensive grazinfg system of livestock
High High High High High High
Diversification of farm animal species because they exploit different feed resources. They can be affected differently from the outbreak of diseases. They have different reproductive rates and can contribute differently to rebuild livestock holding after drought, disease or natural disasters.
High High Medium High High Medium
Improve the environment inside housings/application of efficient cooling equipments like as fans, water sprinklers to minimize heat stress. Planting trees round stables.
Medium Medium Medium High High Medium
Improve management of water resources through the introduction of simple techniques for localized irrigation (e.g. drip and sprinkler irrigation), accompanied by infrastructure to harvest and store rainwater, such as tanks connected to the roofs of houses and small surface and underground dams.
High High High High High High
Improving farmers knowledge to appropriate animal husbandry, feed conservation methods, feeding practices and reproductive strategies.
Very High Medium High High Medium High
Reduction of livestock number, keeping most productive animals especially for stable fed system.
High Very High High Medium High Medium
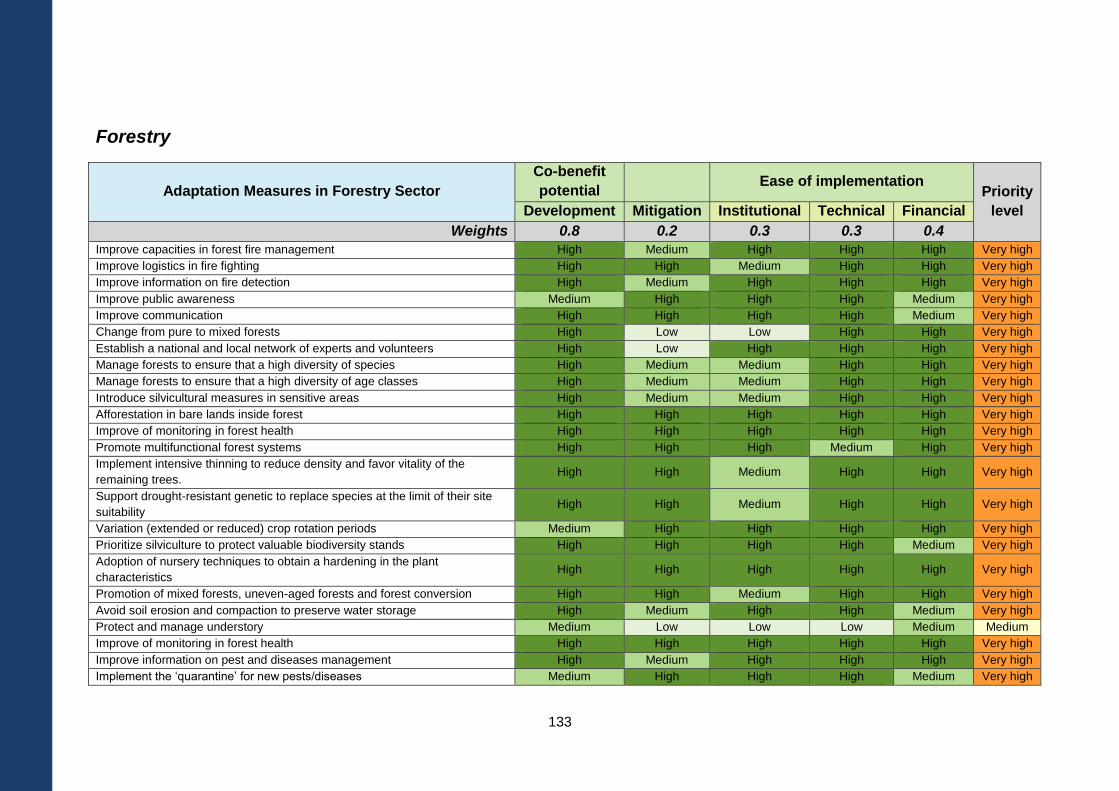
133
Forestry
Adaptation Measures in Forestry Sector
Co-benefit
potential Ease of implementation
Priority
level Development Mitigation Institutional Technical Financial
Weights 0.8 0.2 0.3 0.3 0.4
Improve capacities in forest fire management High Medium High High High Very high
Improve logistics in fire fighting High High Medium High High Very high
Improve information on fire detection High Medium High High High Very high
Improve public awareness Medium High High High Medium Very high
Improve communication High High High High Medium Very high
Change from pure to mixed forests High Low Low High High Very high
Establish a national and local network of experts and volunteers High Low High High High Very high
Manage forests to ensure that a high diversity of species High Medium Medium High High Very high
Manage forests to ensure that a high diversity of age classes High Medium Medium High High Very high
Introduce silvicultural measures in sensitive areas High Medium Medium High High Very high
Afforestation in bare lands inside forest High High High High High Very high
Improve of monitoring in forest health High High High High High Very high
Promote multifunctional forest systems High High High Medium High Very high
Implement intensive thinning to reduce density and favor vitality of the
remaining trees. High High Medium High High Very high
Support drought-resistant genetic to replace species at the limit of their site
suitability High High Medium High High Very high
Variation (extended or reduced) crop rotation periods Medium High High High High Very high
Prioritize silviculture to protect valuable biodiversity stands High High High High Medium Very high
Adoption of nursery techniques to obtain a hardening in the plant
characteristics High High High High High Very high
Promotion of mixed forests, uneven-aged forests and forest conversion High High Medium High High Very high
Avoid soil erosion and compaction to preserve water storage High Medium High High Medium Very high
Protect and manage understory Medium Low Low Low Medium Medium
Improve of monitoring in forest health High High High High High Very high
Improve information on pest and diseases management High Medium High High High Very high
Implement the ‘quarantine’ for new pests/diseases Medium High High High Medium Very high
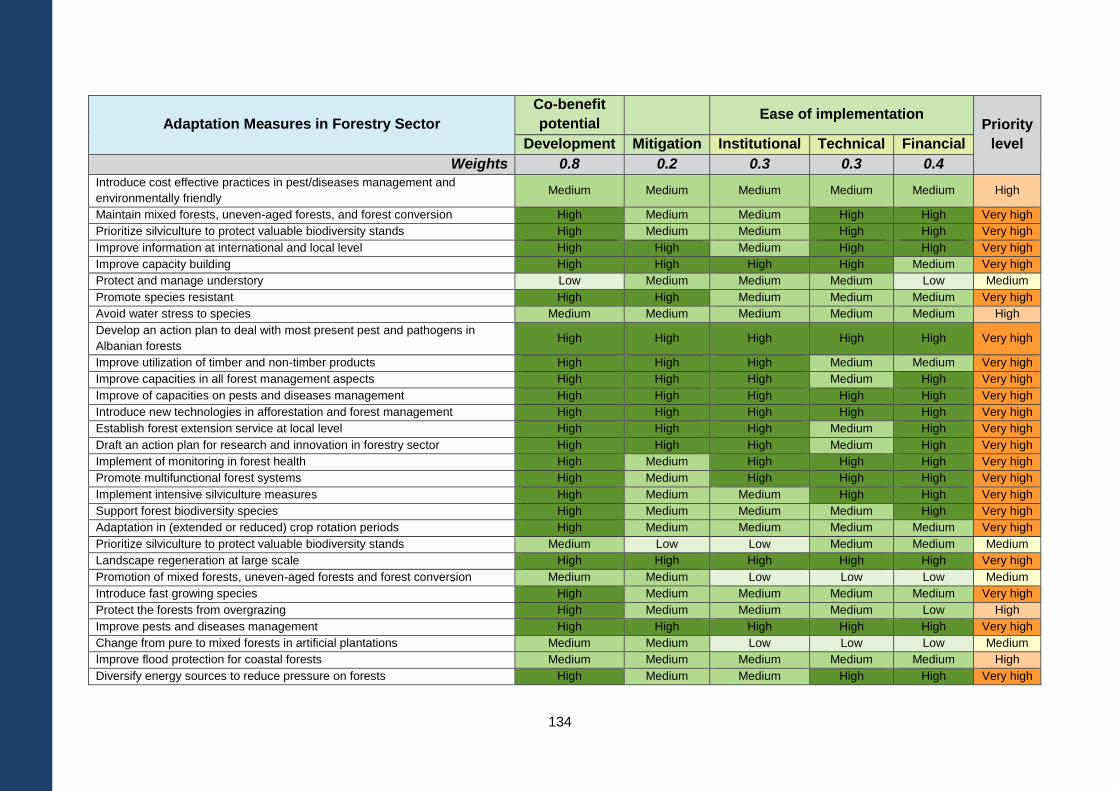
134
Adaptation Measures in Forestry Sector
Co-benefit
potential Ease of implementation
Priority
level Development Mitigation Institutional Technical Financial
Weights 0.8 0.2 0.3 0.3 0.4
Introduce cost effective practices in pest/diseases management and
environmentally friendly Medium Medium Medium Medium Medium High
Maintain mixed forests, uneven-aged forests, and forest conversion High Medium Medium High High Very high
Prioritize silviculture to protect valuable biodiversity stands High Medium Medium High High Very high
Improve information at international and local level High High Medium High High Very high
Improve capacity building High High High High Medium Very high
Protect and manage understory Low Medium Medium Medium Low Medium
Promote species resistant High High Medium Medium Medium Very high
Avoid water stress to species Medium Medium Medium Medium Medium High
Develop an action plan to deal with most present pest and pathogens in
Albanian forests High High High High High Very high
Improve utilization of timber and non-timber products High High High Medium Medium Very high
Improve capacities in all forest management aspects High High High Medium High Very high
Improve of capacities on pests and diseases management High High High High High Very high
Introduce new technologies in afforestation and forest management High High High High High Very high
Establish forest extension service at local level High High High Medium High Very high
Draft an action plan for research and innovation in forestry sector High High High Medium High Very high
Implement of monitoring in forest health High Medium High High High Very high
Promote multifunctional forest systems High Medium High High High Very high
Implement intensive silviculture measures High Medium Medium High High Very high
Support forest biodiversity species High Medium Medium Medium High Very high
Adaptation in (extended or reduced) crop rotation periods High Medium Medium Medium Medium Very high
Prioritize silviculture to protect valuable biodiversity stands Medium Low Low Medium Medium Medium
Landscape regeneration at large scale High High High High High Very high
Promotion of mixed forests, uneven-aged forests and forest conversion Medium Medium Low Low Low Medium
Introduce fast growing species High Medium Medium Medium Medium Very high
Protect the forests from overgrazing High Medium Medium Medium Low High
Improve pests and diseases management High High High High High Very high
Change from pure to mixed forests in artificial plantations Medium Medium Low Low Low Medium
Improve flood protection for coastal forests Medium Medium Medium Medium Medium High
Diversify energy sources to reduce pressure on forests High Medium Medium High High Very high
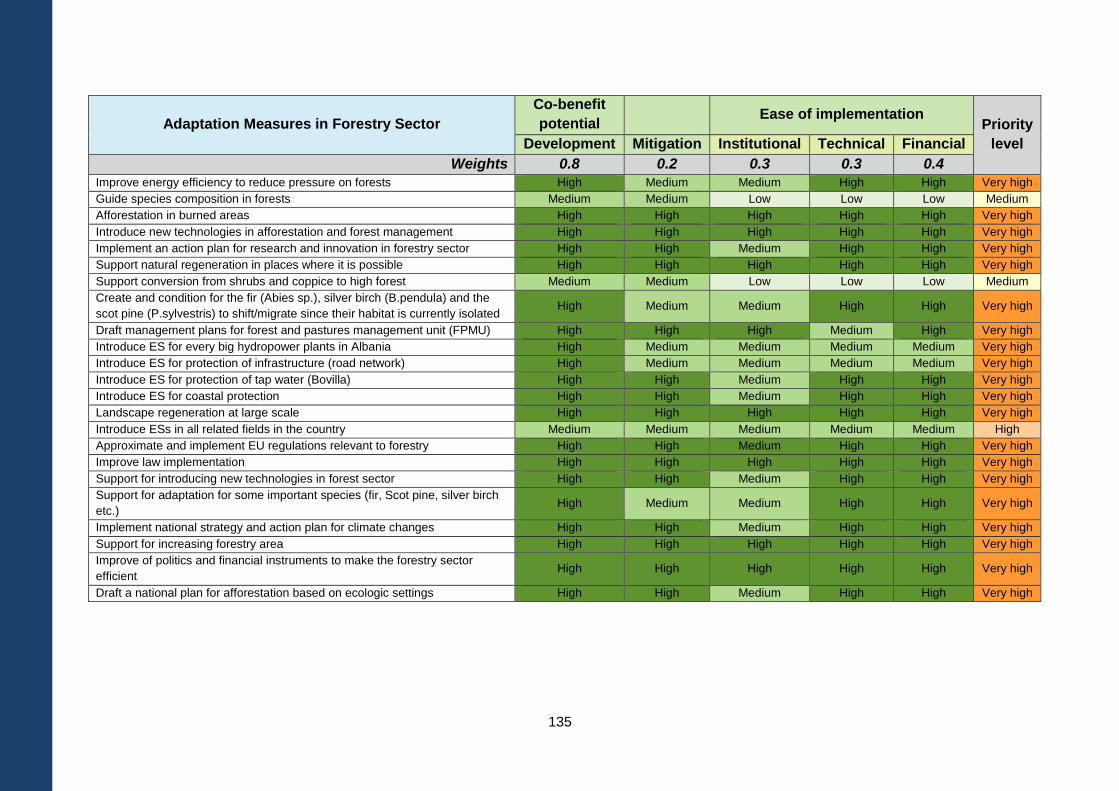
135
Adaptation Measures in Forestry Sector
Co-benefit
potential Ease of implementation
Priority
level Development Mitigation Institutional Technical Financial
Weights 0.8 0.2 0.3 0.3 0.4
Improve energy efficiency to reduce pressure on forests High Medium Medium High High Very high
Guide species composition in forests Medium Medium Low Low Low Medium
Afforestation in burned areas High High High High High Very high
Introduce new technologies in afforestation and forest management High High High High High Very high
Implement an action plan for research and innovation in forestry sector High High Medium High High Very high
Support natural regeneration in places where it is possible High High High High High Very high
Support conversion from shrubs and coppice to high forest Medium Medium Low Low Low Medium
Create and condition for the fir (Abies sp.), silver birch (B.pendula) and the
scot pine (P.sylvestris) to shift/migrate since their habitat is currently isolated High Medium Medium High High Very high
Draft management plans for forest and pastures management unit (FPMU) High High High Medium High Very high
Introduce ES for every big hydropower plants in Albania High Medium Medium Medium Medium Very high
Introduce ES for protection of infrastructure (road network) High Medium Medium Medium Medium Very high
Introduce ES for protection of tap water (Bovilla) High High Medium High High Very high
Introduce ES for coastal protection High High Medium High High Very high
Landscape regeneration at large scale High High High High High Very high
Introduce ESs in all related fields in the country Medium Medium Medium Medium Medium High
Approximate and implement EU regulations relevant to forestry High High Medium High High Very high
Improve law implementation High High High High High Very high
Support for introducing new technologies in forest sector High High Medium High High Very high
Support for adaptation for some important species (fir, Scot pine, silver birch
etc.) High Medium Medium High High Very high
Implement national strategy and action plan for climate changes High High Medium High High Very high
Support for increasing forestry area High High High High High Very high
Improve of politics and financial instruments to make the forestry sector
efficient High High High High High Very high
Draft a national plan for afforestation based on ecologic settings High High Medium High High Very high
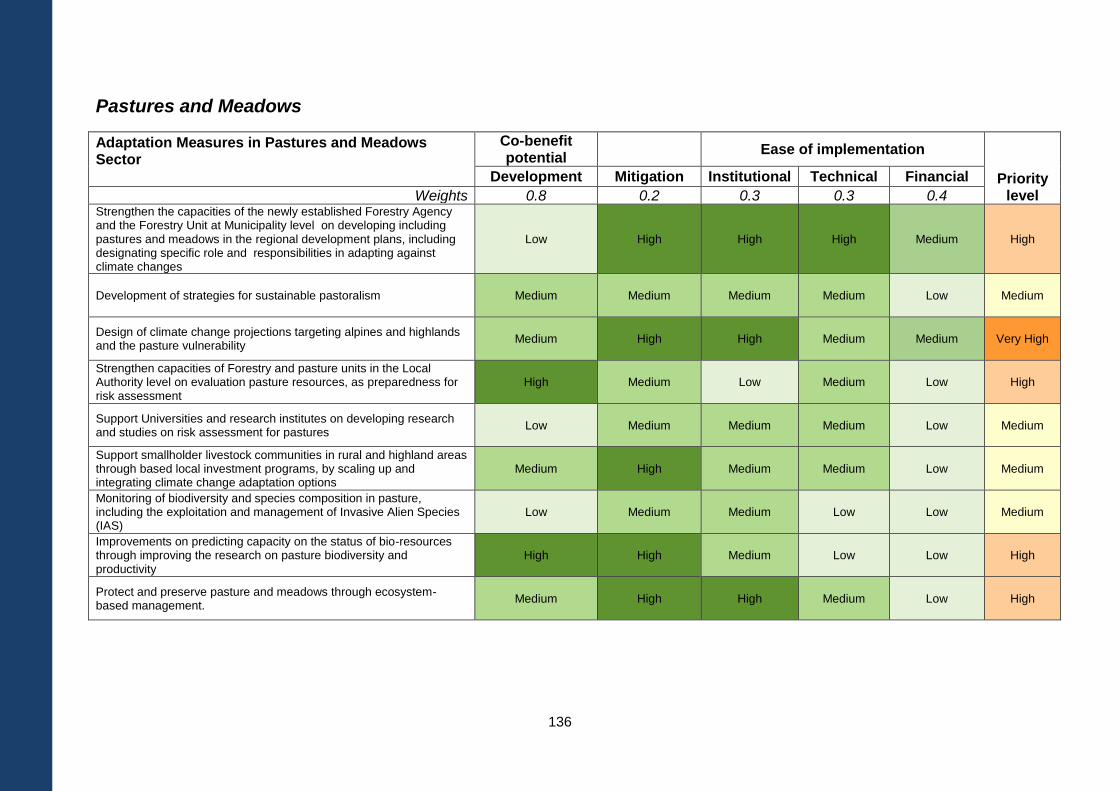
136
Pastures and Meadows
Adaptation Measures in Pastures and Meadows Sector
Co-benefit potential
Ease of implementation
Priority level
Development Mitigation Institutional Technical Financial
Weights 0.8 0.2 0.3 0.3 0.4 Strengthen the capacities of the newly established Forestry Agency and the Forestry Unit at Municipality level on developing including pastures and meadows in the regional development plans, including designating specific role and responsibilities in adapting against climate changes
Low High High High Medium High
Development of strategies for sustainable pastoralism Medium Medium Medium Medium Low Medium
Design of climate change projections targeting alpines and highlands and the pasture vulnerability
Medium High High Medium Medium Very High
Strengthen capacities of Forestry and pasture units in the Local Authority level on evaluation pasture resources, as preparedness for risk assessment
High Medium Low Medium Low High
Support Universities and research institutes on developing research and studies on risk assessment for pastures
Low Medium Medium Medium Low Medium
Support smallholder livestock communities in rural and highland areas through based local investment programs, by scaling up and integrating climate change adaptation options
Medium High Medium Medium Low Medium
Monitoring of biodiversity and species composition in pasture, including the exploitation and management of Invasive Alien Species (IAS)
Low Medium Medium Low Low Medium
Improvements on predicting capacity on the status of bio-resources through improving the research on pasture biodiversity and productivity
High High Medium Low Low High
Protect and preserve pasture and meadows through ecosystem-based management.
Medium High High Medium Low High
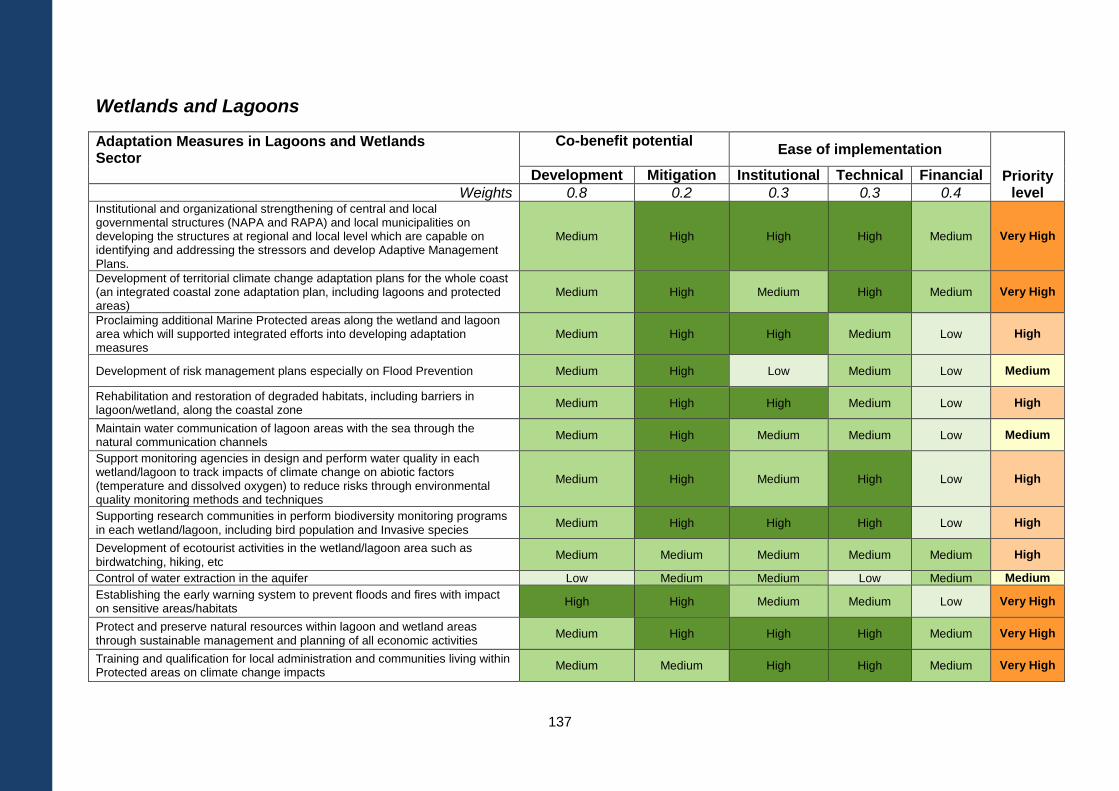
137
Wetlands and Lagoons
Adaptation Measures in Lagoons and Wetlands Sector
Co-benefit potential
Ease of implementation
Priority level
Development Mitigation Institutional Technical Financial
Weights 0.8 0.2 0.3 0.3 0.4 Institutional and organizational strengthening of central and local governmental structures (NAPA and RAPA) and local municipalities on developing the structures at regional and local level which are capable on identifying and addressing the stressors and develop Adaptive Management Plans.
Medium High High High Medium Very High
Development of territorial climate change adaptation plans for the whole coast (an integrated coastal zone adaptation plan, including lagoons and protected areas)
Medium High Medium High Medium Very High
Proclaiming additional Marine Protected areas along the wetland and lagoon area which will supported integrated efforts into developing adaptation measures
Medium High High Medium Low High
Development of risk management plans especially on Flood Prevention Medium High Low Medium Low Medium
Rehabilitation and restoration of degraded habitats, including barriers in lagoon/wetland, along the coastal zone
Medium High High Medium Low High
Maintain water communication of lagoon areas with the sea through the natural communication channels
Medium High Medium Medium Low Medium
Support monitoring agencies in design and perform water quality in each wetland/lagoon to track impacts of climate change on abiotic factors (temperature and dissolved oxygen) to reduce risks through environmental quality monitoring methods and techniques
Medium High Medium High Low High
Supporting research communities in perform biodiversity monitoring programs in each wetland/lagoon, including bird population and Invasive species
Medium High High High Low High
Development of ecotourist activities in the wetland/lagoon area such as birdwatching, hiking, etc
Medium Medium Medium Medium Medium High
Control of water extraction in the aquifer Low Medium Medium Low Medium Medium
Establishing the early warning system to prevent floods and fires with impact on sensitive areas/habitats
High High Medium Medium Low Very High
Protect and preserve natural resources within lagoon and wetland areas through sustainable management and planning of all economic activities
Medium High High High Medium Very High
Training and qualification for local administration and communities living within Protected areas on climate change impacts
Medium Medium High High Medium Very High
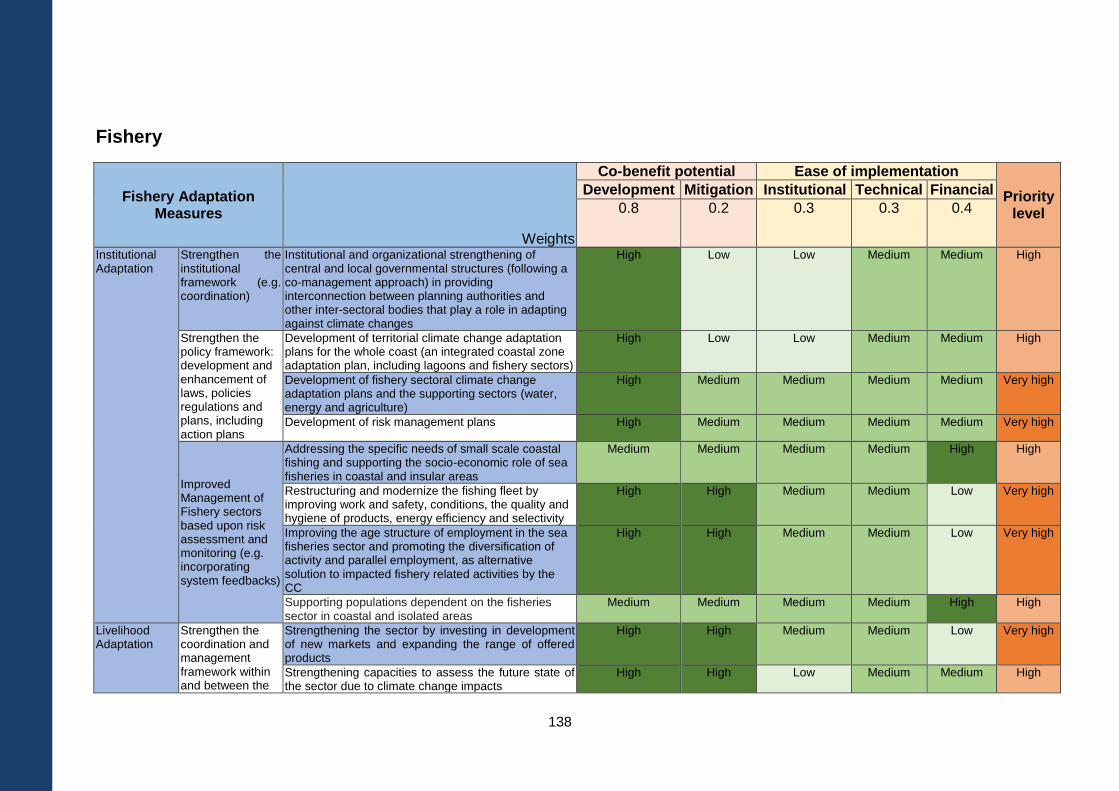
138
Fishery
Fishery Adaptation Measures
Weights
Co-benefit potential Ease of implementation
Priority level
Development Mitigation Institutional Technical Financial
0.8 0.2 0.3 0.3 0.4
Institutional Adaptation
Strengthen the institutional framework (e.g. coordination)
Institutional and organizational strengthening of central and local governmental structures (following a co-management approach) in providing interconnection between planning authorities and other inter-sectoral bodies that play a role in adapting against climate changes
High Low Low Medium Medium High
Strengthen the policy framework: development and enhancement of laws, policies regulations and plans, including action plans
Development of territorial climate change adaptation plans for the whole coast (an integrated coastal zone adaptation plan, including lagoons and fishery sectors)
High Low Low Medium Medium High
Development of fishery sectoral climate change adaptation plans and the supporting sectors (water, energy and agriculture)
High Medium Medium Medium Medium Very high
Development of risk management plans High Medium Medium Medium Medium Very high
Improved Management of Fishery sectors based upon risk assessment and monitoring (e.g. incorporating system feedbacks)
Addressing the specific needs of small scale coastal fishing and supporting the socio-economic role of sea fisheries in coastal and insular areas
Medium Medium Medium Medium High High
Restructuring and modernize the fishing fleet by improving work and safety, conditions, the quality and hygiene of products, energy efficiency and selectivity
High High Medium Medium Low Very high
Improving the age structure of employment in the sea fisheries sector and promoting the diversification of activity and parallel employment, as alternative solution to impacted fishery related activities by the CC
High High Medium Medium Low Very high
Supporting populations dependent on the fisheries sector in coastal and isolated areas
Medium Medium Medium Medium High High
Livelihood Adaptation
Strengthen the coordination and management framework within and between the
Strengthening the sector by investing in development of new markets and expanding the range of offered products
High High Medium Medium Low Very high
Strengthening capacities to assess the future state of the sector due to climate change impacts
High High Low Medium Medium High
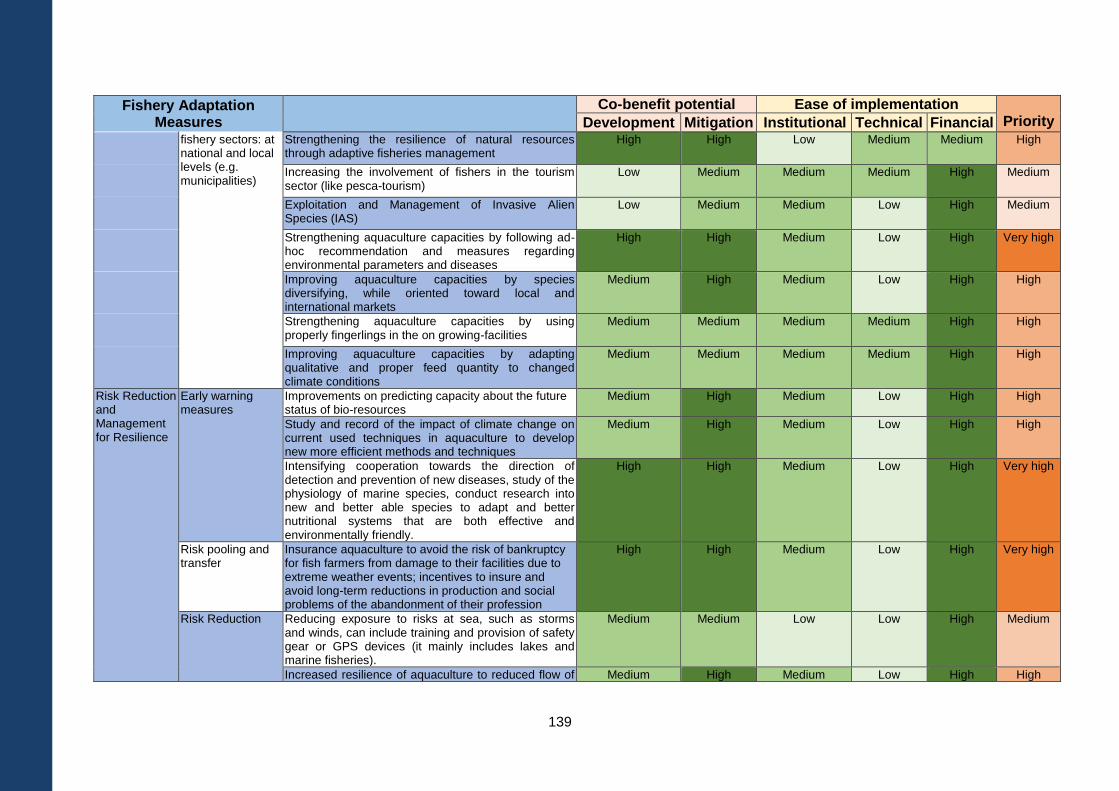
139
Fishery Adaptation Measures
Weights
Co-benefit potential Ease of implementation Priority
level
Development Mitigation Institutional Technical Financial fishery sectors: at national and local levels (e.g. municipalities)
Strengthening the resilience of natural resources through adaptive fisheries management
High High Low Medium Medium High
Increasing the involvement of fishers in the tourism sector (like pesca-tourism)
Low Medium Medium Medium High Medium
Exploitation and Management of Invasive Alien Species (IAS)
Low Medium Medium Low High Medium
Strengthening aquaculture capacities by following ad-hoc recommendation and measures regarding environmental parameters and diseases
High High Medium Low High Very high
Improving aquaculture capacities by species diversifying, while oriented toward local and international markets
Medium High Medium Low High High
Strengthening aquaculture capacities by using properly fingerlings in the on growing-facilities
Medium Medium Medium Medium High High
Improving aquaculture capacities by adapting qualitative and proper feed quantity to changed climate conditions
Medium Medium Medium Medium High High
Risk Reduction and Management for Resilience
Early warning measures
Improvements on predicting capacity about the future status of bio-resources
Medium High Medium Low High High
Study and record of the impact of climate change on current used techniques in aquaculture to develop new more efficient methods and techniques
Medium High Medium Low High High
Intensifying cooperation towards the direction of detection and prevention of new diseases, study of the physiology of marine species, conduct research into new and better able species to adapt and better nutritional systems that are both effective and environmentally friendly.
High High Medium Low High Very high
Risk pooling and transfer
Insurance aquaculture to avoid the risk of bankruptcy for fish farmers from damage to their facilities due to extreme weather events; incentives to insure and avoid long-term reductions in production and social problems of the abandonment of their profession
High High Medium Low High Very high
Risk Reduction Reducing exposure to risks at sea, such as storms and winds, can include training and provision of safety gear or GPS devices (it mainly includes lakes and marine fisheries).
Medium Medium Low Low High Medium
Increased resilience of aquaculture to reduced flow of Medium High Medium Low High High
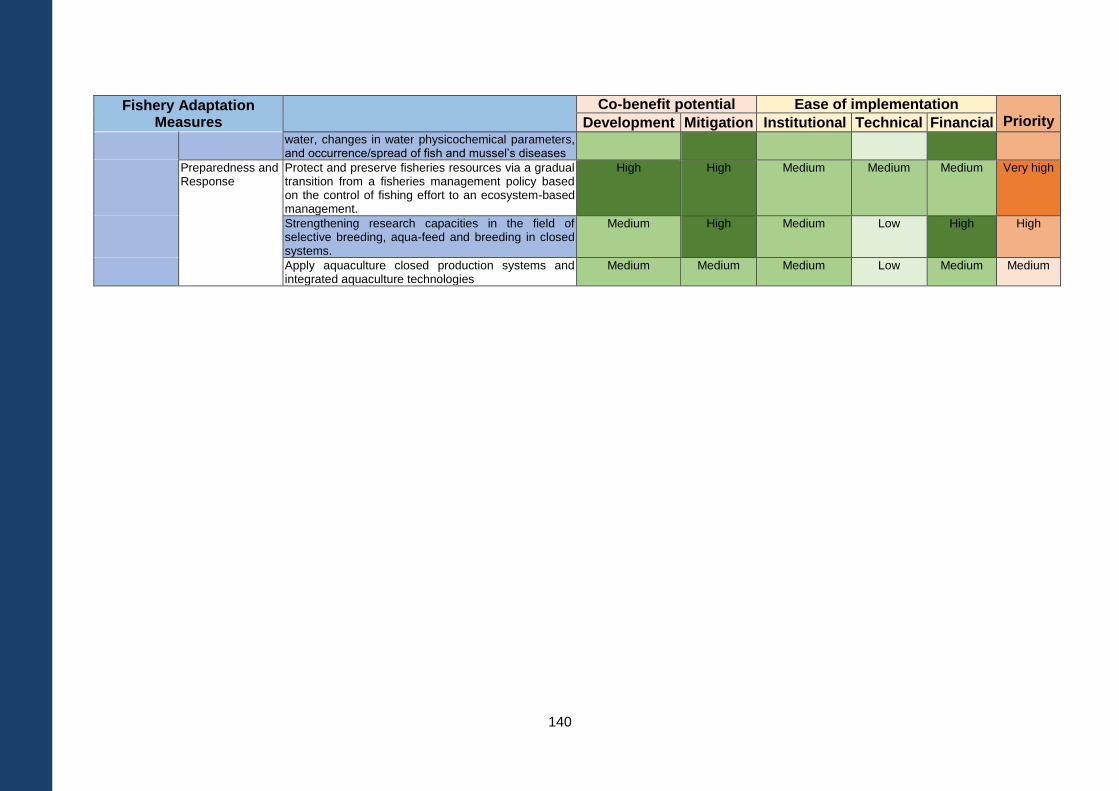
140
Fishery Adaptation Measures
Weights
Co-benefit potential Ease of implementation Priority
level
Development Mitigation Institutional Technical Financial water, changes in water physicochemical parameters, and occurrence/spread of fish and mussel’s diseases
Preparedness and Response
Protect and preserve fisheries resources via a gradual transition from a fisheries management policy based on the control of fishing effort to an ecosystem-based management.
High High Medium Medium Medium Very high
Strengthening research capacities in the field of selective breeding, aqua-feed and breeding in closed systems.
Medium High Medium Low High High
Apply aquaculture closed production systems and integrated aquaculture technologies
Medium Medium Medium Low Medium Medium

141