albany unified school istrict -...
TRANSCRIPT

ALBANY UNIFIED SCHOOL DISTRICT
AUDIT REPORT JUNE 30, 2015
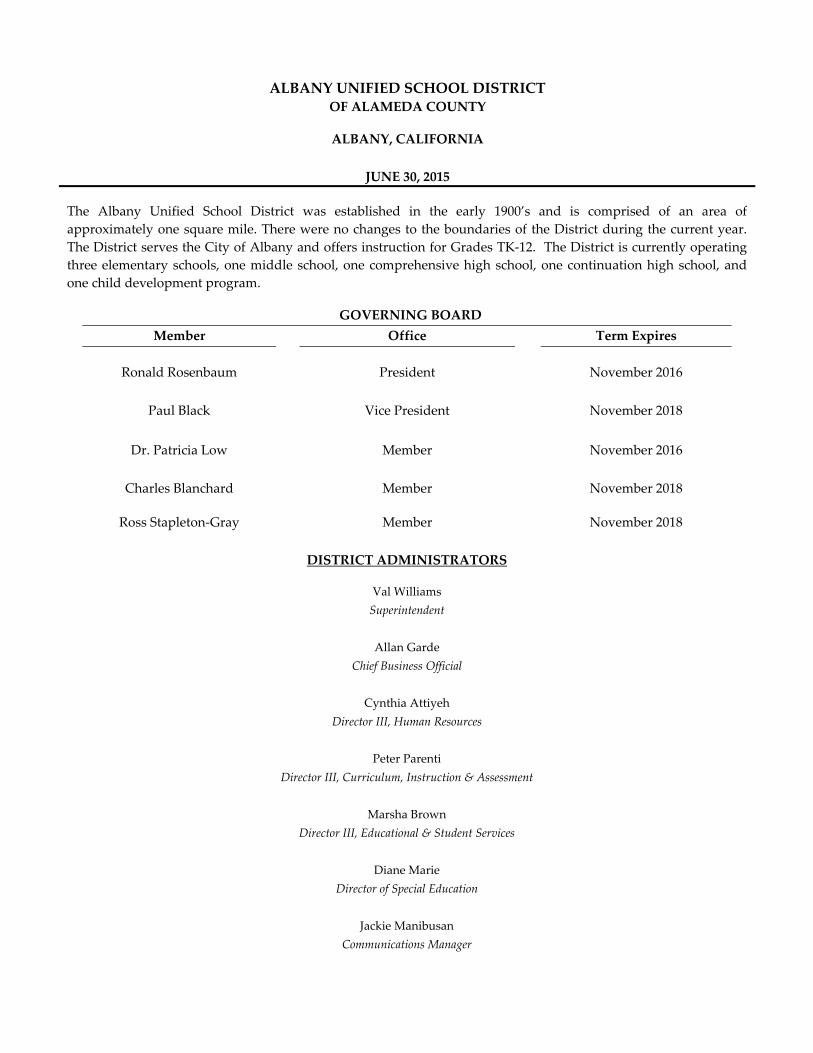
ALBANY UNIFIED SCHOOL DISTRICT OF ALAMEDA COUNTY
ALBANY, CALIFORNIA
JUNE 30, 2015
The Albany Unified School District was established in the early 1900’s and is comprised of an area of
approximately one square mile. There were no changes to the boundaries of the District during the current year.
The District serves the City of Albany and offers instruction for Grades TK‐12. The District is currently operating
three elementary schools, one middle school, one comprehensive high school, one continuation high school, and
one child development program.
GOVERNING BOARD
Member Office Term Expires
Ronald Rosenbaum President November 2016
Paul Black Vice President November 2018
Dr. Patricia Low Member November 2016
Charles Blanchard Member November 2018
Ross Stapleton‐Gray Member November 2018
DISTRICT ADMINISTRATORS
Val Williams
Superintendent
Allan Garde
Chief Business Official
Cynthia Attiyeh
Director III, Human Resources
Peter Parenti
Director III, Curriculum, Instruction & Assessment
Marsha Brown
Director III, Educational & Student Services
Diane Marie
Director of Special Education
Jackie Manibusan
Communications Manager

ALBANY UNIFIED SCHOOL DISTRICT
TABLE OF CONTENTS
FOR THE YEAR ENDED JUNE 30, 2015
FINANCIAL SECTION
Independent Auditors’ Report ............................................................................................................................................. 1 Management’s Discussion and Analysis ............................................................................................................................. 4 Basic Financial Statements
Government‐wide Financial Statements
Statement of Net Position .......................................................................................................................................... 12 Statement of Activities ............................................................................................................................................... 13
Fund Financial Statements
Governmental Funds – Balance Sheet ...................................................................................................................... 14 Reconciliation of the Governmental Funds Balance Sheet to the Statement of Net Position ........................... 15 Governmental Funds – Statement of Revenues, Expenditures, and Changes in Fund Balances ..................... 16 Reconciliation of the Governmental Funds Statement of Revenues, Expenditures, and Changes in Fund
Balances to the Statement of Activities ................................................................................................................. 17 Fiduciary Funds – Statement of Net Position .......................................................................................................... 18 Fiduciary Funds – Statement of Changes in Net Position ..................................................................................... 19
Notes to Financial Statements ............................................................................................................................................ 20
REQUIRED SUPPLEMENTARY INFORMATION
General Fund – Budgetary Comparison Schedule .......................................................................................................... 55 Special Education Pass‐Through Fund – Budgetary Comparison Schedule ................................................................ 56 Deferred Maintenance Fund – Budgetary Comparison Schedule ................................................................................. 57 Schedule of Funding Progress ............................................................................................................................................ 58 Schedule of the District’s Proportionate Share of the Net Pension Liability ‐ CalSTRS ............................................. 59 Schedule of the District’s Proportionate Share of the Net Pension Liability ‐ CalPERS ............................................. 60 Schedule of District Contributions ‐ CalSTRS .................................................................................................................. 61 Schedule of District Contributions ‐ CalPERS .................................................................................................................. 62 Notes to Required Supplementary Information............................................................................................................... 63
SUPPLEMENTARY INFORMATION
Schedule of Expenditures of Federal Awards .................................................................................................................. 65 Schedule of Average Daily Attendance (ADA) ................................................................................................................ 66 Schedule of Instructional Time ........................................................................................................................................... 67 Schedule of Financial Trends and Analysis ...................................................................................................................... 68 Reconciliation of Annual Financial and Budget Report with Audited Financial Statements .................................... 69 Schedule of Charter Schools ............................................................................................................................................... 70 Combining Statements – Non‐Major Governmental Funds
Combining Balance Sheet ............................................................................................................................................... 71 Combining Statement of Revenues, Expenditures, and Changes in Fund Balances .............................................. 72 Notes to Supplementary Information ................................................................................................................................ 73
ALBANY UNIFIED SCHOOL DISTRICT
TABLE OF CONTENTS
FOR THE YEAR ENDED JUNE 30, 2015
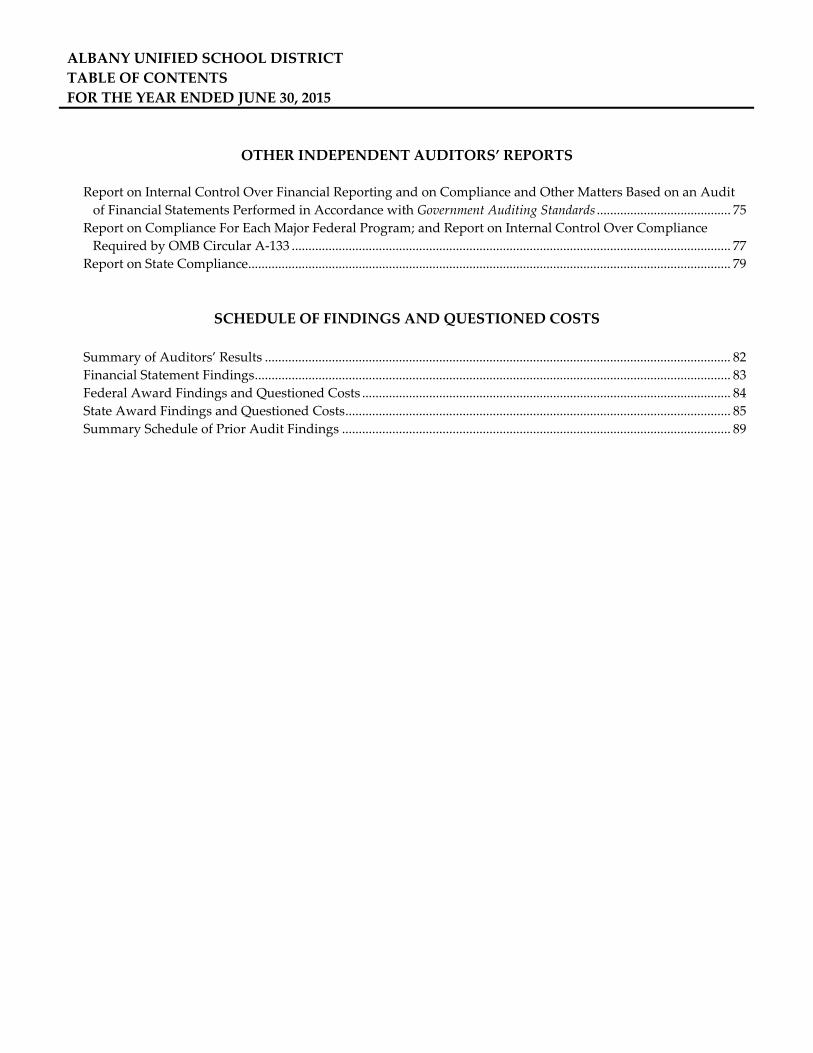
OTHER INDEPENDENT AUDITORS’ REPORTS
Report on Internal Control Over Financial Reporting and on Compliance and Other Matters Based on an Audit
of Financial Statements Performed in Accordance with Government Auditing Standards ........................................ 75 Report on Compliance For Each Major Federal Program; and Report on Internal Control Over Compliance
Required by OMB Circular A‐133 ................................................................................................................................... 77 Report on State Compliance ................................................................................................................................................ 79
SCHEDULE OF FINDINGS AND QUESTIONED COSTS
Summary of Auditors’ Results ........................................................................................................................................... 82 Financial Statement Findings .............................................................................................................................................. 83 Federal Award Findings and Questioned Costs .............................................................................................................. 84 State Award Findings and Questioned Costs ................................................................................................................... 85 Summary Schedule of Prior Audit Findings .................................................................................................................... 89

FINANCIAL SECTION

Corporate O�ce:348 Olive Street
San Diego, CA 92103
toll-free: 877.220.7229tel: 619.270.8222fax: 619.260.9085
www.christywhite.com
Christy White, CPA
Michael Ash, CPA
Heather Rubio
SAN DIEGO
LOS ANGELES
SAN FRANCISCO/BAY AREA
1
INDEPENDENT AUDITORS’ REPORT
Governing Board
Albany Unified School District
Albany, California
Report on the Financial Statements
We have audited the accompanying financial statements of the governmental activities, each
major fund, and the aggregate remaining fund information of the Albany Unified School
District, as of and for the year ended June 30, 2015, and the related notes to the financial
statements, which collectively comprise the Albany Unified School District’s basic financial
statements as listed in the table of contents.
Management’s Responsibility for the Financial Statements
Management is responsible for the preparation and fair presentation of these financial
statements in accordance with accounting principles generally accepted in the United States
of America; this includes the design, implementation, and maintenance of internal control
relevant to the preparation and fair presentation of financial statements that are free from
material misstatement, whether due to fraud or error.
Auditor’s Responsibility
Our responsibility is to express opinions on these financial statements based on our audit.
We conducted our audit in accordance with auditing standards generally accepted in the
United States of America and the standards applicable to financial audits contained in
Government Auditing Standards, issued by the Comptroller General of the United States.
Those standards require that we plan and perform the audit to obtain reasonable assurance
about whether the financial statements are free from material misstatement.
An audit involves performing procedures to obtain audit evidence about the amounts and
disclosures in the financial statements. The procedures selected depend on the auditorʹs
judgment, including the assessment of the risks of material misstatement of the financial
statements, whether due to fraud or error. In making those risk assessments, the auditor
considers internal control relevant to the entityʹs preparation and fair presentation of the
financial statements in order to design audit procedures that are appropriate in the
circumstances, but not for the purpose of expressing an opinion on the effectiveness of the
entityʹs internal control. Accordingly, we express no such opinion. An audit also includes
evaluating the appropriateness of accounting policies used and the reasonableness of
significant accounting estimates made by management, as well as evaluating the overall
presentation of the financial statements.

2
We believe that the audit evidence we have obtained is sufficient and appropriate to provide a basis for our audit
opinions.
Opinions
In our opinion, the financial statements referred to above present fairly, in all material respects, the respective
financial position of the governmental activities, each major fund, and the aggregate remaining fund information of
Albany Unified School District, as of June 30, 2015, and the respective changes in financial position thereof for the
year then ended in accordance with accounting principles generally accepted in the United States of America.
Emphasis of a Matter
As described in Note 1 to the financial statements, in 2015 Albany Unified School District adopted new accounting
guidance, Governmental Accounting Standards Board Statement No. 68, Accounting and Financial Reporting for
Pensions. Our opinion is not modified with respect to this matter.
Other Matters
Required Supplementary Information
Accounting principles generally accepted in the United States of America require that the required supplementary
information, such as management’s discussion and analysis, budgetary comparison information, schedule of
funding progress for OPEB benefits, schedules of proportionate share of net pension liability, and schedules of
District contributions for pensions be presented to supplement the basic financial statements. Such information,
although not part of the basic financial statements, is required by the Governmental Accounting Standards Board
who considers it to be an essential part of financial reporting for placing the basic financial statements in
appropriate operational, economic, or historical context. We have applied certain limited procedures to the
required supplementary information in accordance with auditing standards generally accepted in the United States
of America, which consisted of inquiries of management about the methods of preparing the information and
comparing the information for consistency with management’s responses to our inquiries, the basic financial
statements, and other knowledge we obtained during our audit of the basic financial statements. We do not
express an opinion or provide any assurance on the information because the limited procedures do not provide us
with sufficient evidence to express an opinion or provide any assurance.
Supplementary Information
Our audit was conducted for the purpose of forming opinions on the financial statements that collectively comprise
the Albany Unified School District’s basic financial statements. The supplementary information listed in the table
of contents, including the schedule of expenditures of Federal awards, which is required by the U.S. Office of
Management and Budget Circular A‐133, Audits of State, Local Governments, and Non‐Profit Organizations, is
presented for purposes of additional analysis and is not a required part of the basic financial statements.
The supplementary information listed in the table of contents is the responsibility of management and was derived
from and relates directly to the underlying accounting and other records used to prepare the basic financial
statements. Such information has been subjected to the auditing procedures applied in the audit of the basic
financial statements and certain additional procedures, including comparing and reconciling such information
directly to the underlying accounting and other records used to prepare the basic financial statements or to the
basic financial statements themselves, and other additional procedures in accordance with auditing standards
generally accepted in the United States of America. In our opinion, the supplementary information is fairly stated,
in all material respects, in relation to the basic financial statements as a whole.

3
Other Reporting Required by Government Auditing Standards
In accordance with Government Auditing Standards, we have also issued our report dated December 8, 2015 on our
consideration of Albany Unified School Districtʹs internal control over financial reporting and on our tests of its
compliance with certain provisions of laws, regulations, contracts, and grant agreements and other matters. The
purpose of that report is to describe the scope of our testing of internal control over financial reporting and
compliance and the results of that testing, and not to provide an opinion on internal control over financial
reporting or on compliance. That report is an integral part of an audit performed in accordance with Government
Auditing Standards in considering Albany Unified School District’s internal control over financial reporting and
compliance.
San Diego, California
December 8, 2015

4
MANAGEMENT’S DISCUSSION AND ANALYSIS
INTRODUCTION
Our discussion and analysis of Albany Unified School District’s (District) financial performance provides an
overview of the District’s financial activities for the fiscal year ended June 30, 2015. It should be read in conjunction
with the District’s financial statements, which follow this section.
FINANCIAL HIGHLIGHTS
The District’s net position was $(5,044,229) at June 30, 2015. This was a decrease of $1,956,013 from the
prior year’s restated net position.
Overall revenues were $65,121,924 which were exceeded by expenses of $67,077,937.
OVERVIEW OF FINANCIAL STATEMENTS
Components of the Financials Section
Summary Detail
Management's Discussion &
Analysis
Basic Financial Statements
Required Supplementary
Information
Government-Wide Financial Statements
Fund Financial Statements
Notes to the Financial Statements
ALBANY UNIFIED SCHOOL DISTRICT
MANAGEMENT’S DISCUSSION AND ANALYSIS, continued
FOR THE YEAR ENDED JUNE 30, 2015
5
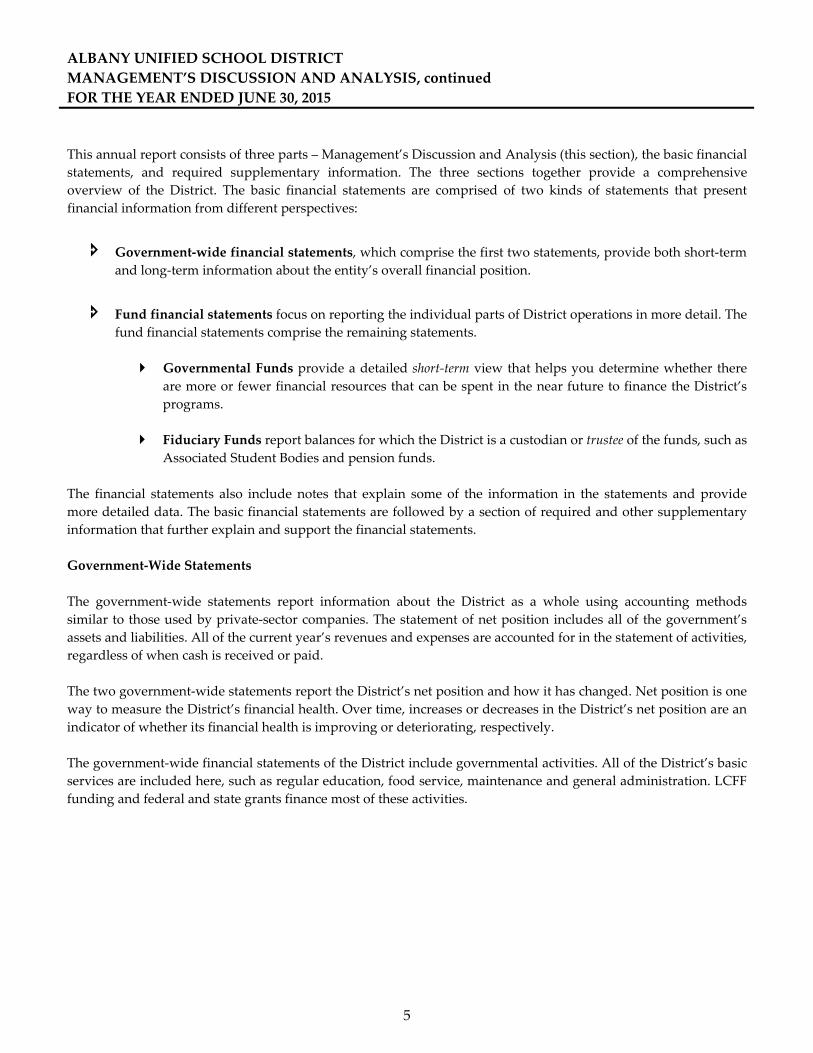
This annual report consists of three parts – Management’s Discussion and Analysis (this section), the basic financial
statements, and required supplementary information. The three sections together provide a comprehensive
overview of the District. The basic financial statements are comprised of two kinds of statements that present
financial information from different perspectives:
Government‐wide financial statements, which comprise the first two statements, provide both short‐term
and long‐term information about the entity’s overall financial position.
Fund financial statements focus on reporting the individual parts of District operations in more detail. The
fund financial statements comprise the remaining statements.
Governmental Funds provide a detailed short‐term view that helps you determine whether there
are more or fewer financial resources that can be spent in the near future to finance the District’s
programs.
Fiduciary Funds report balances for which the District is a custodian or trustee of the funds, such as
Associated Student Bodies and pension funds.
The financial statements also include notes that explain some of the information in the statements and provide
more detailed data. The basic financial statements are followed by a section of required and other supplementary
information that further explain and support the financial statements.
Government‐Wide Statements
The government‐wide statements report information about the District as a whole using accounting methods
similar to those used by private‐sector companies. The statement of net position includes all of the government’s
assets and liabilities. All of the current year’s revenues and expenses are accounted for in the statement of activities,
regardless of when cash is received or paid.
The two government‐wide statements report the District’s net position and how it has changed. Net position is one
way to measure the District’s financial health. Over time, increases or decreases in the District’s net position are an
indicator of whether its financial health is improving or deteriorating, respectively.
The government‐wide financial statements of the District include governmental activities. All of the District’s basic
services are included here, such as regular education, food service, maintenance and general administration. LCFF
funding and federal and state grants finance most of these activities.

ALBANY UNIFIED SCHOOL DISTRICT
MANAGEMENT’S DISCUSSION AND ANALYSIS, continued
FOR THE YEAR ENDED JUNE 30, 2015
6
FINANCIAL ANALYSIS OF THE ENTITY AS A WHOLE
Net Position
The District’s net position was $(5,044,229) at June 30, 2015, as reflected in table below. Of this amount,
$(29,998,243) was unrestricted. Restricted net position is reported separately to show legal constraints from debt
covenants and enabling legislation that limit the Governing Board’s ability to use that net position for day‐to‐day
operations.
2015 2014 Net Change
ASSETS
Current and other assets 20,309,893$ 24,483,627$ (4,173,734)$
Capital assets 56,063,042 54,919,321 1,143,721
Total Assets 76,372,935 79,402,948 (3,030,013)
DEFERRED OUTFLOWS OF RESOURCES 2,439,050 ‐ 2,439,050
LIABILITIES
Current liabilities 9,467,078 9,319,314 147,764
Long‐term liabilities 66,467,090 38,307,897 28,159,193
Total Liabilities 75,934,168 47,627,211 28,306,957
DEFERRED INFLOWS OF RESOURCES 7,922,046 ‐ 7,922,046
NET POSITION
Net investment in capital assets 20,003,485 16,490,770 3,512,715
Restricted 4,950,529 15,284,967 (10,334,438)
Unrestricted (29,998,243) ‐ (29,998,243)
Total Net Position (5,044,229)$ 31,775,737$ (36,819,966)$
Governmental Activities

ALBANY UNIFIED SCHOOL DISTRICT
MANAGEMENT’S DISCUSSION AND ANALYSIS, continued
FOR THE YEAR ENDED JUNE 30, 2015
7
FINANCIAL ANALYSIS OF THE ENTITY AS A WHOLE (continued)
Changes in Net Position
The results of this year’s operations for the District as a whole are reported in the Statement of Activities. The table
below takes the information from the Statement, rounds off the numbers, and rearranges them slightly, so you can
see our total revenues, expenses, and special items for the year.
2015 2014 Net Change
REVENUES
Program revenues
Charges for services 860,363$ 1,002,859$ (142,496)$
Operating grants and contributions 23,122,041 22,797,486 324,555
Capital grants and contributions 5,369 760 4,609
General revenues
Property taxes 16,680,844 16,034,820 646,024
Unrestricted federal and state aid 22,065,786 18,151,735 3,914,051
Other 2,387,521 2,362,022 25,499
Total Revenues 65,121,924 60,349,682 4,772,242
EXPENSES
Instruction 29,555,233 25,934,867 3,620,366
Instruction‐related services 5,135,802 4,310,527 825,275
Pupil services 2,558,283 2,250,636 307,647
General administration 3,475,756 3,566,869 (91,113)
Plant services 3,638,638 3,496,043 142,595
Ancillary and community services 1,256,833 1,304,457 (47,624)
Debt service 1,474,130 1,549,718 (75,588)
Other Outgo 17,558,111 16,531,313 1,026,798
Depreciation 2,425,151 2,767,222 (342,071)
Total Expenses 67,077,937 61,711,652 5,366,285
Change in net position (1,956,013) (1,361,970) (594,043)
Net Position ‐ Beginning, as Restated* (3,088,216) 33,137,707 (36,225,923)
Net Position ‐ Ending (5,044,229)$ 31,775,737$ (36,819,966)$
Governmental Activities
* Restatement to Beginning Net Position relates to both the 2015 year and the 2014 year
The cost of all our governmental activities this year was $67,077,937 (refer to the table above). The amount that our
taxpayers ultimately financed for these activities through taxes was only $16,680,844 because the cost was paid by
other governments and organizations who subsidized certain programs with grants and contributions.

ALBANY UNIFIED SCHOOL DISTRICT
MANAGEMENT’S DISCUSSION AND ANALYSIS, continued
FOR THE YEAR ENDED JUNE 30, 2015
8
FINANCIAL ANALYSIS OF THE ENTITY AS A WHOLE (continued)
Changes in Net Position (continued)
In the table below we have presented the net cost of each of the District’s functions. Net cost shows the financial
burden that was placed on the District’s taxpayers by each of these functions. Providing this information allows
our citizens to consider the cost of each function in comparison to the benefits they believe are provided by that
function.
2015 2014
Instruction 23,577,333$ 20,070,694$
Instruction‐related services 4,266,602 2,755,828
Pupil services 1,306,506 1,126,302
General administration 3,164,664 3,270,238
Plant services 3,632,937 3,489,041
Ancillary and community services 1,094,649 1,129,086
Debt service 1,474,130 1,549,718
Transfers to other agencies 2,148,192 1,782,508
Depreciation 2,425,151 2,767,222
Total Expenses 43,090,164$ 37,940,637$
Net Cost of Services

ALBANY UNIFIED SCHOOL DISTRICT
MANAGEMENT’S DISCUSSION AND ANALYSIS, continued
FOR THE YEAR ENDED JUNE 30, 2015
9
FINANCIAL ANALYSIS OF THE DISTRICT’S MAJOR FUNDS
The financial performance of the District as a whole is reflected in its governmental funds as well. As the District
completed this year, its governmental funds reported a combined fund balance of $13,809,738, which is less than
last year’s ending fund balance of $18,088,790. The District’s General Fund had $1,074,078 less in operating
revenues than expenditures for the year ended June 30, 2015. The District’s Special Education Pass‐Through Fund
had no change in fund balance for the year ended June 30, 2015. The District’s Deferred Maintenance Fund had
$1,054,588 less in operating revenues than expenditures for the year ended June 30, 2015. The District’s Bond
Interest and Redemption Fund had $249,911 more in operating revenues than expenditures for the year ended June
30, 2015.
CURRENT YEAR BUDGET 2014‐15
During the fiscal year, budget revisions and appropriation transfers are presented to the Board for their approval
on a monthly basis to reflect changes to both revenues and expenditures that become known during the year. In
addition, the Board of Education approves financial projections included with the Adopted Budget, First Interim,
and Second Interim financial reports. The Unaudited Actuals reflect the District’s financial projections and current
budget based on State and local financial information.
CAPITAL ASSET AND DEBT ADMINISTRATION
Capital Assets
By the end of 2014‐15 the District had invested $56,063,042 in capital assets, net of accumulated depreciation.
2015 2014 Net Change
CAPITAL ASSETS
Land 4,394,935$ 4,394,935$ ‐$
Construction in progress 3,066,009 ‐ 3,066,009
Land improvements 20,090,403 19,840,079 250,324
Buildings & improvements 53,326,225 53,073,686 252,539
Furniture & equipment 6,176,431 6,320,259 (143,828)
Accumulated depreciation (30,990,961) (28,709,638) (2,281,323)
Total Capital Assets 56,063,042$ 54,919,321$ 1,143,721$
Governmental Activities

ALBANY UNIFIED SCHOOL DISTRICT
MANAGEMENT’S DISCUSSION AND ANALYSIS, continued
FOR THE YEAR ENDED JUNE 30, 2015
10
CAPITAL ASSET AND DEBT ADMINISTRATION (continued)
Long‐Term Debt
At year‐end, the District had $66,467,090 in long‐term debt, an increase of 74% from last year’s balance due
primarily to GASB Statement 68 requiring the District to record net pension liability – as shown in table below.
(More detailed information about the District’s long‐term liabilities is presented in footnotes to the financial
statements.)
2015 2014 Net Change
LONG‐TERM LIABILITIES
Total general obligation bonds 36,315,124$ 38,428,551$ (2,113,427)$
Net OPEB obligation 2,961,694 1,992,776 968,918
Net pension liability 29,498,699 ‐ 29,498,699
Less: current portion of long‐term debt (2,308,427) (2,113,430) (194,997)
Total Long‐term Liabilities 66,467,090$ 38,307,897$ 28,159,193$
Governmental Activities
ALBANY UNIFIED SCHOOL DISTRICT
MANAGEMENT’S DISCUSSION AND ANALYSIS, continued
FOR THE YEAR ENDED JUNE 30, 2015
11
ECONOMIC FACTORS AND NEXT YEAR’S BUDGET AND RATES
At the time these financial statements were prepared and audited, the District was aware of several circumstances
that could affect its future financial health.
Assembly Bill 97 (Chapter 47, Statutes of 2013), as amended by Senate Bills 91 and 97, enacted landmark legislation
reform in California school district finance by creating the new Local Control Funding Formula (LCFF). The
District is analyzing the impact of the LCFF on funding for our program offerings and services. The LCFF is
designed to provide a flexible funding mechanism that links student achievement to state funding levels. The
LCFF provides a per pupil base grant amount, by grade span, that is augmented by supplemental funding for
targeted student groups in low income brackets, those that are English language learners and foster youth. The
State anticipates all school districts to reach the statewide targeted base funding levels by 2020‐21.
Factors related to LCFF that the District is in the process of evaluating include estimates of new funding in the next
budget year and beyond; creation of the Local Control and Accountability Plan (LCAP) for fiscal year 2014‐15 that
aims to link student accountability measurements to funding allocations; ensuring the integrity of reporting
student data through the California Longitudinal Pupil Achievement Data System (CALPADs); and, meeting new
compliance and audit requirements.
The State’s economy “mirrors the slow growth of the nation”, this is according to the UCLA Newsroom reporting
on the September 2013 Anderson Economic Forecast. “While the economy is returning to normal, it is still
operating well below what would have been expected prior to the recession.” The ability of the State to fund the
new LCFF is largely dependent on the strength of the State’s economy and remains uncertain.
Enrollment can fluctuate due to factors such as population growth, competition from private, parochial, inter‐
district transfers in or out, economic conditions and housing values. Losses in enrollment will cause a school
district to lose operating revenues without necessarily permitting the district to make adjustments in fixed
operating costs.
All of these factors were considered in preparing the District’s budget for the 2013‐14 fiscal year.
CONTACTING THE DISTRICT’S FINANCIAL MANAGEMENT
This financial report is designed to provide our citizens, taxpayers, students, and investors and creditors with a
general overview of the District’s finances and to show the District’s accountability for the money it receives. If
you have questions about this report or need any additional financial information, contact Allan Garde, Chief
Business Official at Albany Unified School District, 1051 Monroe Street, Albany, California, 94706.

ALBANY UNIFIED SCHOOL DISTRICT
The accompanying notes are an integral part of these financial statements.
12
STATEMENT OF NET POSITION
JUNE 30, 2015
Governmental
Activities
ASSETS
Cash and cash equivalents 14,710,619$
Accounts receivable 5,564,980
Inventory 4,757
Prepaid expenses 29,537
Capital assets, not depreciated 7,460,944
Capital assets, net of accumulated depreciation 48,602,098
Total Assets 76,372,935
DEFERRED OUTFLOWS OF RESOURCES
Deferred outflows related to pensions 2,439,050
Total Deferred Outflows of Resources 2,439,050
LIABILITIES
Accrued liabilities 6,692,260
Unearned revenue 466,391
Long‐term liabilities, current portion 2,308,427
Long‐term liabilities, non‐current portion 66,467,090
Total Liabilities 75,934,168
DEFERRED INFLOWS OF RESOURCES
Deferred inflows related to pensions 7,922,046
Total Deferred Inflows of Resources 7,922,046
NET POSITION
Net investment in capital assets 20,003,485
Restricted:
Capital projects 1,752,620
Debt service 2,495,455
Educational programs 517,610
All others 184,844
Unrestricted (29,998,243)
Total Net Position (5,044,229)$

ALBANY UNIFIED SCHOOL DISTRICT
The accompanying notes are an integral part of these financial statements.
13
STATEMENT OF ACTIVITIES
FOR THE YEAR ENDED JUNE 30, 2015
Operating Capital
Charges for Grants and Grants and Governmental
Expenses Services Contributions Contributions Activities
GOVERNMENTAL ACTIVITIES
Instruction 29,555,233$ 228,079$ 5,744,452$ 5,369$ (23,577,333)$
Instruction‐related services
Instructional supervision and administration 2,070,177 ‐ 831,355 ‐ (1,238,822)
Instructional library, media, and technology 626,924 ‐ 32,585 ‐ (594,339)
School site administration 2,438,701 ‐ 5,260 ‐ (2,433,441)
Pupil services
Home‐to‐school transportation 159,880 ‐ 8,828 ‐ (151,052)
Food services 991,564 582,721 354,917 ‐ (53,926)
All other pupil services 1,406,839 ‐ 305,311 ‐ (1,101,528)
General administration
Centralized data processing 969,239 ‐ ‐ ‐ (969,239)
All other general administration 2,506,517 49,563 261,529 ‐ (2,195,425)
Plant services 3,638,638 ‐ 5,701 ‐ (3,632,937)
Ancillary services 477,981 ‐ 79,170 ‐ (398,811)
Community services 778,852 ‐ 83,014 ‐ (695,838)
Interest on long‐term debt 1,474,130 ‐ ‐ ‐ (1,474,130)
Other Outgo 17,558,111 ‐ 15,409,919 ‐ (2,148,192)
Depreciation (unallocated) 2,425,151 ‐ ‐ ‐ (2,425,151)
Total Governmental Activities 67,077,937$ 860,363$ 23,122,041$ 5,369$ (43,090,164)
General revenues
Taxes and subventions
Property taxes, levied for general purposes 6,981,499
Property taxes, levied for debt service 3,861,367
Property taxes, levied for other specific purposes 5,837,978
Federal and state aid not restricted for specific purposes 22,065,786
Interest and investment earnings 41,512
Interagency revenues 230,971
Miscellaneous 2,115,038
Subtotal, General Revenue 41,134,151
CHANGE IN NET POSITION (1,956,013)
Net Position ‐ Beginning, as Restated (3,088,216)
Net Position ‐ Ending (5,044,229)$
Function/Programs
Net (Expenses)
Revenues and
Changes in
Program Revenues Net Position

ALBANY UNIFIED SCHOOL DISTRICT
The accompanying notes are an integral part of these financial statements.
14
GOVERNMENTAL FUNDS
BALANCE SHEET
JUNE 30, 2015
General Fund
Special Education
Pass‐Through
Fund
Deferred
Maintenance
Fund
Bond Interest &
Redemption Fund
Non‐Major
Governmental
Funds
Total
Governmental
Funds
ASSETS
Cash and cash equivalents 7,633,916$ 27$ 919,067$ 3,153,451$ 3,004,158$ 14,710,619$
Accounts receivable 1,702,025 3,685,195 300 500 176,960 5,564,980
Due from other funds 1,272,985 ‐ 1,274,407 ‐ 23,405 2,570,797
Stores inventory ‐ ‐ ‐ ‐ 4,757 4,757
Prepaid expenditures 29,537 ‐ ‐ ‐ ‐ 29,537
Total Assets 10,638,463$ 3,685,222$ 2,193,774$ 3,153,951$ 3,209,280$ 22,880,690$
LIABILITIES
Accrued liabilities 1,380,409$ 3,685,221$ 201,632$ ‐$ 766,502$ 6,033,764$
Due to other funds 1,274,407 ‐ 1,295,723 ‐ 667 2,570,797
Unearned revenue 466,391 ‐ ‐ ‐ ‐ 466,391
Total Liabilities 3,121,207 3,685,221 1,497,355 ‐ 767,169 9,070,952
FUND BALANCES
Nonspendable 54,537 ‐ ‐ ‐ 4,757 59,294
Restricted 517,609 1 ‐ 3,153,951 2,193,031 5,864,592
Committed ‐ ‐ 696,419 ‐ ‐ 696,419
Assigned 488,072 ‐ ‐ ‐ 244,323 732,395
Unassigned 6,457,038 ‐ ‐ ‐ ‐ 6,457,038
Total Fund Balances 7,517,256 1 696,419 3,153,951 2,442,111 13,809,738
Total Liabilities and Fund Balances 10,638,463$ 3,685,222$ 2,193,774$ 3,153,951$ 3,209,280$ 22,880,690$

ALBANY UNIFIED SCHOOL DISTRICT
The accompanying notes are an integral part of these financial statements.
15
RECONCILIATION OF THE GOVERNMENTAL FUNDS BALANCE SHEET TO THE STATEMENT
OF NET POSITION
JUNE 30, 2015
Total Fund Balance ‐ Governmental Funds 13,809,738$
Amounts reported for assets and liabilities for governmental activities in the
statement of net position are different from amounts reported in governmental
funds because:
Capital assets:
In governmental funds, only current assets are reported. In the statement
of net position, all assets are reported, including capital assets and
accumulated depreciation:
Capital assets 87,054,003$
Accumulated depreciation (30,990,961) 56,063,042
Unmatured interest on long‐term debt:
In governmental funds, interest on long‐term debt is not recognized until
the period in which it matures and is paid. In the government‐wide
statement of activities, it is recognized in the period that it is incurred. The
additional liability for unmatured interest owing at the end of the period
was: (658,496)
Long‐term liabilities:
In governmental funds, only current liabilities are reported. In the
statement of net position, all liabilities, including long‐term liabilities, are
reported. Long‐term liabilities relating to governmental activities consist
of:
Total general obligation bonds 36,315,124$
Net OPEB obligation 2,961,694
Net pension liability 29,498,699 (68,775,517)
Deferred outflows and inflows of resources relating to pensions:
In governmental funds, deferred outflows and inflows of resources relating
to pensions are not reported because they are applicable to future periods.
In the statement of net position, deferred outflows and inflows of resources
relating to pensions are reported.
Deferred outflows of resources related to pensions 2,439,050$
Deferred inflows of resources related to pensions (7,922,046) (5,482,996)
Total Net Position ‐ Governmental Activities (5,044,229)$

ALBANY UNIFIED SCHOOL DISTRICT
The accompanying notes are an integral part of these financial statements.
16
GOVERNMENTAL FUNDS
STATEMENT OF REVENUES, EXPENDITURES, AND CHANGES IN FUND BALANCES
FOR THE YEAR ENDED JUNE 30, 2015
General Fund
Special Education
Pass‐Through
Fund
Deferred
Maintenance
Fund
Bond Interest &
Redemption Fund
Non‐Major
Governmental
Funds
Total
Governmental
Funds
REVENUES
LCFF sources 26,490,409$ ‐$ 150,000$ ‐$ ‐$ 26,640,409$
Federal sources 1,096,511 4,474,785 ‐ ‐ 741,559 6,312,855
Other state sources 4,428,050 13,206,753 ‐ 36,782 615,842 18,287,427
Other local sources 7,706,818 ‐ 65,023 3,829,810 2,038,256 13,639,907
Total Revenues 39,721,788 17,681,538 215,023 3,866,592 3,395,657 64,880,598
EXPENDITURES
Current
Instruction 26,618,628 ‐ ‐ ‐ 1,619,940 28,238,568
Instruction‐related services
Instructional supervision and administration 2,035,933 ‐ ‐ ‐ ‐ 2,035,933
Instructional library, media, and technology 616,774 ‐ ‐ ‐ ‐ 616,774
School site administration 2,417,147 ‐ ‐ ‐ ‐ 2,417,147
Pupil services
Home‐to‐school transportation 161,663 ‐ ‐ ‐ ‐ 161,663
Food services 4 ‐ ‐ ‐ 1,003,334 1,003,338
All other pupil services 1,392,612 ‐ ‐ ‐ ‐ 1,392,612
General administration
Centralized data processing 979,754 ‐ ‐ ‐ ‐ 979,754
All other general administration 2,318,148 ‐ ‐ ‐ 196,275 2,514,423
Plant services 3,427,779 ‐ 280,341 ‐ 105,574 3,813,694
Facilities acquisition and maintenance ‐ ‐ 989,270 ‐ 2,436,301 3,425,571
Ancillary services 476,475 ‐ ‐ ‐ ‐ 476,475
Community services 350,949 ‐ ‐ ‐ 434,530 785,479
Transfers to other agencies ‐ 17,681,538 ‐ ‐ ‐ 17,681,538
Debt service
Principal ‐ ‐ ‐ 1,990,000 ‐ 1,990,000
Interest and other ‐ ‐ ‐ 1,626,681 ‐ 1,626,681
Total Expenditures 40,795,866 17,681,538 1,269,611 3,616,681 5,795,954 69,159,650
Excess (Deficiency) of Revenues
Over Expenditures (1,074,078) ‐ (1,054,588) 249,911 (2,400,297) (4,279,052)
Other Financing Sources (Uses)
Transfers in ‐ ‐ 1,274,407 ‐ 2,319 1,276,726
Transfers out (1,276,726) ‐ ‐ ‐ ‐ (1,276,726)
Net Financing Sources (Uses) (1,276,726) ‐ 1,274,407 ‐ 2,319 ‐
NET CHANGE IN FUND BALANCE (2,350,804) ‐ 219,819 249,911 (2,397,978) (4,279,052)
Fund Balance ‐ Beginning 9,868,060 1 476,600 2,904,040 4,840,089 18,088,790
Fund Balance ‐ Ending 7,517,256$ 1$ 696,419$ 3,153,951$ 2,442,111$ 13,809,738$
ALBANY UNIFIED SCHOOL DISTRICT
The accompanying notes are an integral part of these financial statements.
17
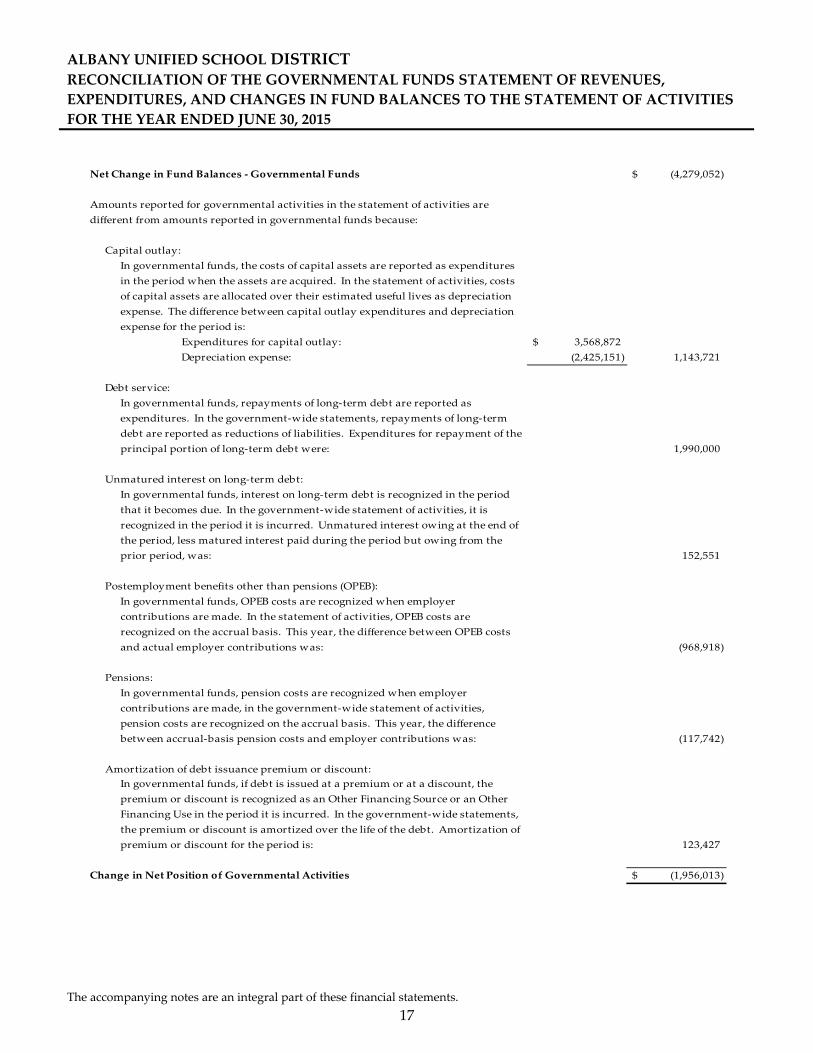
RECONCILIATION OF THE GOVERNMENTAL FUNDS STATEMENT OF REVENUES,
EXPENDITURES, AND CHANGES IN FUND BALANCES TO THE STATEMENT OF ACTIVITIES
FOR THE YEAR ENDED JUNE 30, 2015
Net Change in Fund Balances ‐ Governmental Funds (4,279,052)$
Amounts reported for governmental activities in the statement of activities are
different from amounts reported in governmental funds because:
Capital outlay:
In governmental funds, the costs of capital assets are reported as expenditures
in the period when the assets are acquired. In the statement of activities, costs
of capital assets are allocated over their estimated useful lives as depreciation
expense. The difference between capital outlay expenditures and depreciation
expense for the period is:
Expenditures for capital outlay: 3,568,872$
Depreciation expense: (2,425,151) 1,143,721
Debt service:
In governmental funds, repayments of long‐term debt are reported as
expenditures. In the government‐wide statements, repayments of long‐term
debt are reported as reductions of liabilities. Expenditures for repayment of the
principal portion of long‐term debt were: 1,990,000
Unmatured interest on long‐term debt:
In governmental funds, interest on long‐term debt is recognized in the period
that it becomes due. In the government‐wide statement of activities, it is
recognized in the period it is incurred. Unmatured interest owing at the end of
the period, less matured interest paid during the period but owing from the
prior period, was: 152,551
Postemployment benefits other than pensions (OPEB):
In governmental funds, OPEB costs are recognized when employer
contributions are made. In the statement of activities, OPEB costs are
recognized on the accrual basis. This year, the difference between OPEB costs
and actual employer contributions was: (968,918)
Pensions:
In governmental funds, pension costs are recognized when employer
contributions are made, in the government‐wide statement of activities,
pension costs are recognized on the accrual basis. This year, the difference
between accrual‐basis pension costs and employer contributions was: (117,742)
Amortization of debt issuance premium or discount:
In governmental funds, if debt is issued at a premium or at a discount, the
premium or discount is recognized as an Other Financing Source or an Other
Financing Use in the period it is incurred. In the government‐wide statements,
the premium or discount is amortized over the life of the debt. Amortization of
premium or discount for the period is: 123,427
Change in Net Position of Governmental Activities (1,956,013)$

ALBANY UNIFIED SCHOOL DISTRICT
The accompanying notes are an integral part of these financial statements.
18
FIDUCIARY FUNDS
STATEMENT OF NET POSITION
JUNE 30, 2015
Terry Corpus
Memorial
Scholarship Fund
Student Body
Fund
ASSETS
Cash and cash equivalents 473$ 113,255$
Total Assets 473 113,255$
LIABILITIES
Due to student groups ‐ 113,255$
Total Liabilities ‐ 113,255$
NET POSITION
Restricted 473
Total Net Position 473$
Trust Fund Agency Funds
Private‐Purpose

ALBANY UNIFIED SCHOOL DISTRICT
The accompanying notes are an integral part of these financial statements.
19
FIDUCIARY FUNDS
STATEMENT OF CHANGES IN NET POSITION
FOR THE YEAR ENDED JUNE 30, 2015
Terry Corpus
Memorial
Scholarship Fund
ADDITIONS
Donations 500$
Total Additions 500
DEDUCTIONS
Scholarship awards 580
Total Deductions 580
CHANGE IN NET POSITION (80)
Net Position ‐ Beginning 553
Net Position ‐ Ending 473$
Trust Fund
Private‐Purpose

ALBANY UNIFIED SCHOOL DISTRICT
20
NOTES TO FINANCIAL STATEMENTS
JUNE 30, 2015
NOTE 1 – SUMMARY OF SIGNIFICANT ACCOUNTING POLICIES
A. Financial Reporting Entity
The Albany Unified School District (the “District”) accounts for its financial transactions in accordance with the
policies and procedures of the Department of Educationʹs California School Accounting Manual. The accounting
policies of the District conform to generally accepted accounting principles as prescribed by the Governmental
Accounting Standards Board (GASB) and the American Institute of Certified Public Accountants (AICPA).
The District operates under a locally elected Board form of government and provides educational services to
grades K‐12 as mandated by the state. A reporting entity is comprised of the primary government, component
units, and other organizations that are included to ensure the financial statements are not misleading. The
primary government of the District consists of all funds, departments and agencies that are not legally separate
from the District. For the District, this includes general operations, food service, and student‐related activities.
B. Component Units
Component units are legally separate organizations for which the District is financially accountable.
Component units may also include organizations that are fiscally dependent on the District in that the District
approves their budget, the issuance of their debt or the levying of their taxes. In addition, component units are
other legally separate organizations for which the District is not financially accountable but the nature and
significance of the organization’s relationship with the District is such that exclusion would cause the District’s
financial statements to be misleading or incomplete. The District has no such component units.
C. Basis of Presentation
Government‐Wide Statements. The statement of net position and the statement of activities display
information about the primary government (the District). These statements include the financial activities of
the overall government, except for fiduciary activities. Eliminations have been made to minimize the double‐
counting of internal activities. Governmental activities generally are financed through taxes,
intergovernmental revenue, and other non‐exchange transactions.
The statement of activities presents a comparison between direct expenses and program revenue for each
function of the District’s governmental activities. Direct expenses are those that are specifically associated with
a program or function and, therefore, are clearly identifiable to a particular function. Indirect expense
allocations that have been made in the funds have been reserved for the statement of activities. Program
revenues include charges paid by the recipients of the goods or services offered by the programs and grants
and contributions that are restricted to meeting of operational or capital requirements of a particular program.
Revenues that are not classified as program revenues are presented as general revenues. The comparison of
program revenues and expenses identifies the extent to which each program or business segment is self‐
financing or draws from the general revenues of the District.

ALBANY UNIFIED SCHOOL DISTRICTNOTES TO FINANCIAL STATEMENTS, continued
JUNE 30, 2015
21
NOTE 1 – SUMMARY OF SIGNIFICANT ACCOUNTING POLICIES (continued)
C. Basis of Presentation (continued)
Fund Financial Statements. The fund financial statements provide information about the District’s funds,
including its fiduciary funds. Separate statements for each fund category – governmental and fiduciary – are
presented. The emphasis of fund financial statements is on major governmental funds, each displayed in a
separate column. All remaining governmental funds are aggregated and reported as non‐major funds.
Governmental funds are used to account for activities that are governmental in nature. Governmental activities
are typically tax‐supported and include education of pupils, operation of food service and child development
programs, construction and maintenance of school facilities, and repayment of long‐term debt.
Fiduciary funds are used to account for assets held by the District in a trustee or agency capacity for others that
cannot be used to support the Districtʹs own programs.
Major Governmental Funds
General Fund: The General Fund is the main operating fund of the District. It is used to account for all
activities except those that are required to be accounted for in another fund. In keeping with the minimum
number of funds principle, all of the Districtʹs activities are reported in the General Fund unless there is a
compelling reason to account for an activity in another fund. A District may have only one General Fund.
Special Education Pass‐Through Fund: This fund is used by the Administrative Unit (AU) of a multi‐Local
Education Agency (LEA) Special Education Local Plan Area (SELPA) to account for Special Education revenue
passed through to other member LEA’s.
Deferred Maintenance Fund: This fund is used to account separately for state apportionments and the
Districtʹs contributions for deferred maintenance purposes (Education Code Sections 17582–17587). In addition,
whenever the state funds provided pursuant to Education Code Sections 17584 and 17585 (apportionments from
the State Allocation Board) are insufficient to fully match the local funds deposited in this fund, the governing
board of a school district may transfer the excess local funds deposited in this fund to any other expenditure
classifications in other funds of the District (Education Code Sections 17582 and 17583).
Bond Interest and Redemption Fund: This fund is used for the repayment of bonds issued for the District
(Education Code Sections 15125–15262). The board of supervisors of the county issues the bonds. The proceeds
from the sale of the bonds are deposited in the county treasury to the Building Fund of the District. Any
premiums or accrued interest received from the sale of the bonds must be deposited in the Bond Interest and
Redemption Fund of the District. The county auditor maintains control over the Districtʹs Bond Interest and
Redemption Fund. The principal and interest on the bonds must be paid by the county treasurer from taxes
levied by the county auditor‐controller.
ALBANY UNIFIED SCHOOL DISTRICTNOTES TO FINANCIAL STATEMENTS, continued
JUNE 30, 2015
22
NOTE 1 – SUMMARY OF SIGNIFICANT ACCOUNTING POLICIES (continued)
C. Basis of Presentation (continued)
Non‐Major Governmental Funds
Special Revenue Funds: Special revenue funds are used to account for and report the proceeds of specific
revenue sources that are restricted or committed to expenditures for specified purposes other than debt service
or capital projects. The District maintains the following special revenue funds:
Adult Education Fund: This fund is used to account separately for federal, state, and local revenues for
adult education programs. Money in this fund shall be expended for adult education purposes only.
Moneys received for programs other than adult education shall not be expended for adult education
(Education Code Sections 52616[b] and 52501.5[a]).
Child Development Fund: This fund is used to account separately for federal, state, and local revenues to
operate child development programs. All moneys received by the District for, or from the operation of,
child development services covered under the Child Care and Development Services Act (Education Code
Section 8200 et seq.) shall be deposited into this fund. The moneys may be used only for expenditures for
the operation of child development programs. The costs incurred in the maintenance and operation of child
development services shall be paid from this fund, with accounting to reflect specific funding sources
(Education Code Section 8328).
Cafeteria Special Revenue Fund: This fund is used to account separately for federal, state, and local
resources to operate the food service program (Education Code Sections 38090–38093). The Cafeteria Special
Revenue Fund shall be used only for those expenditures authorized by the governing board as necessary
for the operation of the Districtʹs food service program (Education Code Sections 38091 and 38100).
Capital Project Funds: Capital project funds are established to account for financial resources to be used for the
acquisition or construction of major capital facilities (other than those financed by proprietary funds and trust
funds).
Building Fund: This fund exists primarily to account separately for proceeds from the sale of bonds
(Education Code Section 15146) and may not be used for any purposes other than those for which the bonds
were issued. Other authorized revenues to the Building Fund are proceeds from the sale or lease‐with‐
option‐to‐purchase of real property (Education Code Section 17462) and revenue from rentals and leases of
real property specifically authorized for deposit into the fund by the governing board (Education Code
Section 41003).
Capital Facilities Fund: This fund is used primarily to account separately for moneys received from fees
levied on developers or other agencies as a condition of approving a development (Education Code Sections
17620–17626). The authority for these levies may be county/city ordinances (Government Code Sections
65970–65981) or private agreements between the District and the developer. Interest earned in the Capital
Facilities Fund is restricted to that fund (Government Code Section 66006).

ALBANY UNIFIED SCHOOL DISTRICTNOTES TO FINANCIAL STATEMENTS, continued
JUNE 30, 2015
23
NOTE 1 – SUMMARY OF SIGNIFICANT ACCOUNTING POLICIES (continued)
C. Basis of Presentation (continued)
Non‐Major Governmental Funds
Capital Project Funds (continued)
County School Facilities Fund: This fund is established pursuant to Education Code Section 17070.43 to
receive apportionments from the 1998 State School Facilities Fund (Proposition 1A), the 2002 State School
Facilities Fund (Proposition 47), or the 2004 State School Facilities Fund (Proposition 55) authorized by the
State Allocation Board for new school facility construction, modernization projects, and facility hardship
grants, as provided in the Leroy F. Greene School Facilities Act of 1998 (Education Code Section 17070 et
seq.).
Fiduciary Funds
Trust and Agency Funds: Trust and agency funds are used to account for assets held in a trustee or agent
capacity for others that cannot be used to support the Districtʹs own programs. The key distinction between
trust and agency funds is that trust funds are subject to a trust agreement that affects the degree of
management involvement and the length of time that the resources are held.
Private‐Purpose Trust Fund: This fund is used to account separately for gifts or bequests per Education
Code Section 41031 that benefit individuals, private organizations, or other governments and under which
neither principal nor income may be used for purposes that support the Districtʹs own programs.
Student Body Fund: The Student Body Fund is an agency fund and, therefore, consists only of accounts
such as cash and balancing liability accounts, such as due to student groups. The student body itself
maintains its own general fund, which accounts for the transactions of that entity in raising and expending
money to promote the general welfare, morale, and educational experiences of the student body (Education
Code Sections 48930–48938).
D. Basis of Accounting – Measurement Focus
Government‐Wide and Fiduciary Financial Statements
The government‐wide and fiduciary fund financial statements are reported using the economic resources
measurement focus. The government‐wide and fiduciary fund financial statements are reported using the
accrual basis of accounting. Revenues are recorded when earned and expenses are recorded at the time
liabilities are incurred, regardless of when the related cash flows take place.
Net Position equals assets and deferred outflows of resources minus liabilities and deferred inflows of
resources. Net investment in capital assets consists of capital assets, net of accumulated depreciation, reduced
by the outstanding balances of any borrowings used for the acquisition, construction or improvement of those
assets. The net position should be reported as restricted when constraints placed on its use are either externally
imposed by creditors (such as through debt covenants), grantors, contributors, or laws or regulations of other
governments or imposed by law through constitutional provisions or enabling legislation. The net position
restricted for other activities results from special revenue funds and the restrictions on their use.
ALBANY UNIFIED SCHOOL DISTRICTNOTES TO FINANCIAL STATEMENTS, continued
JUNE 30, 2015
24
NOTE 1 – SUMMARY OF SIGNIFICANT ACCOUNTING POLICIES (continued)
D. Basis of Accounting – Measurement Focus (continued)
Governmental Funds
Basis of accounting refers to when revenues and expenditures are recognized in the accounts and reported in
the financial statements. Governmental funds use the modified accrual basis of accounting.
Revenues – Exchange and Non‐Exchange Transactions
Revenue resulting from exchange transactions, in which each party gives and receives essentially equal value,
is recorded under the accrual basis when the exchange takes place. On a modified accrual basis, revenue is
recorded in the fiscal year in which the resources are measurable and become available. “Available” means the
resources will be collected within the current fiscal year or are expected to be collected soon enough thereafter
to be used to pay liabilities of the current fiscal year. Generally, “available” means collectible within the current
period or within 60 days after year‐end. However, to achieve comparability of reporting among California
school districts and so as not to distort normal revenue patterns, with specific respect to reimbursement grants
and corrections to State‐aid apportionments, the California Department of Education has defined available for
school districts as collectible within one year.
Non‐exchange transactions, in which the District receives value without directly giving equal value in return,
include property taxes, grants, and entitlements. Under the accrual basis, revenue from property taxes is
recognized in the fiscal year for which the taxes are levied. Revenue from the grants and entitlements is
recognized in the fiscal year in which all eligibility requirements have been satisfied.
Eligibility requirements include timing requirements, which specify the year when the resources are to be used
or the fiscal year when use is first permitted; matching requirements, in which the District must provide local
resources to be used for a specific purpose; and expenditure requirements, in which the resources are provided
to the District on a reimbursement basis. Under the modified accrual basis, revenue from non‐exchange
transactions must also be available before it can be recognized.
Unearned Revenue
Unearned revenue arises when potential revenue does not meet both the ʺmeasurableʺ and ʺavailableʺ criteria
for recognition in the current period or when resources are received by the District prior to the incurrence of
qualifying expenditures. In subsequent periods, when both revenue recognition criteria are met, or when the
District has a legal claim to the resources, the liability for unearned revenue is removed from the balance sheet
and revenue is recognized.
Certain grants received that have not met eligibility requirements are recorded as unearned revenue. On the
governmental fund financial statements, receivables that will not be collected within the available period are
also recorded as unearned revenue.

ALBANY UNIFIED SCHOOL DISTRICTNOTES TO FINANCIAL STATEMENTS, continued
JUNE 30, 2015
25
NOTE 1 – SUMMARY OF SIGNIFICANT ACCOUNTING POLICIES (continued)
D. Basis of Accounting – Measurement Focus (continued)
Expenses/Expenditures
On the accrual basis of accounting, expenses are recognized at the time a liability is incurred. On the modified
accrual basis of accounting, expenditures are generally recognized in the accounting period in which the
related fund liability is incurred, as under the accrual basis of accounting. However, under the modified
accrual basis of accounting, debt service expenditures, as well as expenditures related to compensated absences
and claims and judgments, are recorded only when payment is due. Allocations of cost, such as depreciation
and amortization, are not recognized in the governmental funds. When both restricted and unrestricted
resources are available for use, it is the District’s policy to use restricted resources first, then unrestricted
resources as they are needed.
E. Assets, Deferred Outflows of Resources, Liabilities, Deferred Inflows of Resources, Fund Balance and Net Position
Cash and Cash Equivalents
The District’s cash and cash equivalents consist of cash on hand, demand deposits and short‐term investments
with original maturities of three months or less from the date of acquisition. Cash held in the county treasury
is recorded at cost, which approximates fair value.
Investments
Investments with original maturities greater than one year are stated at fair value. Fair value is estimated
based on quoted market prices at year‐end. All investments not required to be reported at fair value are stated
at cost or amortized cost. Fair values of investments in county and State investment pools are determined by
the program sponsor.
Inventories
Inventories are recorded using the purchases method in that the cost is recorded as an expenditure at the time
the individual inventory items are requisitioned. Inventories are valued at historical cost and consist of
expendable supplies held for consumption.
ALBANY UNIFIED SCHOOL DISTRICTNOTES TO FINANCIAL STATEMENTS, continued
JUNE 30, 2015
26
NOTE 1 – SUMMARY OF SIGNIFICANT ACCOUNTING POLICIES (continued)
E. Assets, Deferred Outflows of Resources, Liabilities, Deferred Inflows of Resources, Fund Balance and Net Position (continued)
Capital Assets
The accounting and reporting treatment applied to the capital assets associated with a fund is determined by
its measurement focus. Capital assets are reported in the governmental activities column of the government‐
wide statement of net position, but are not reported in the fund financial statements.
Capital assets are capitalized at cost (or estimated historical cost) and updated for additions and retirements
during the year. Donated fixed assets are recorded at their fair market values as of the date received. The
District maintains a capitalization threshold of $5,000. The District does not own any infrastructure as defined
in GASB Statement No. 34. Improvements are capitalized; the costs of normal maintenance and repairs that do
not add to the value of the asset or materially extend an asset’s life are not capitalized. All reported capital
assets, except for land and construction in progress, are depreciated. Improvements are depreciated over the
remaining useful lives of the related capital assets. Depreciation is computed using the straight‐line method
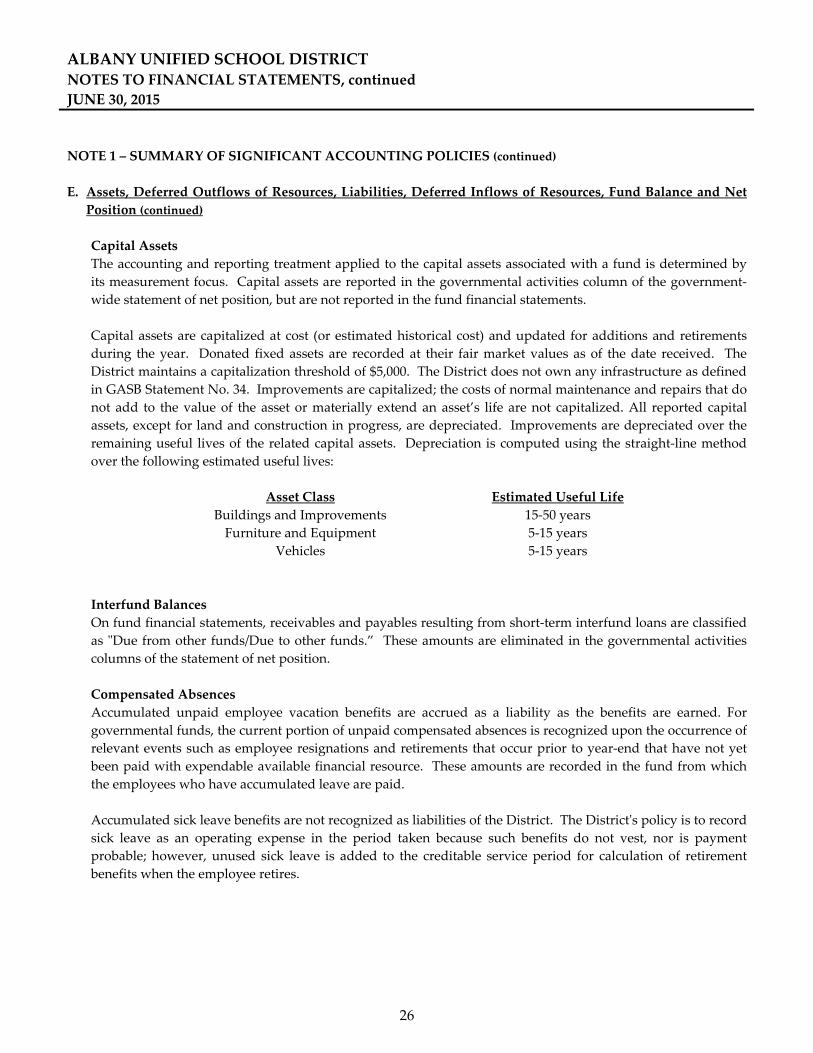
over the following estimated useful lives:
Asset Class Estimated Useful Life
Buildings and Improvements 15‐50 years
Furniture and Equipment 5‐15 years
Vehicles 5‐15 years
Interfund Balances
On fund financial statements, receivables and payables resulting from short‐term interfund loans are classified
as ʺDue from other funds/Due to other funds.” These amounts are eliminated in the governmental activities
columns of the statement of net position.
Compensated Absences
Accumulated unpaid employee vacation benefits are accrued as a liability as the benefits are earned. For
governmental funds, the current portion of unpaid compensated absences is recognized upon the occurrence of
relevant events such as employee resignations and retirements that occur prior to year‐end that have not yet
been paid with expendable available financial resource. These amounts are recorded in the fund from which
the employees who have accumulated leave are paid.
Accumulated sick leave benefits are not recognized as liabilities of the District. The Districtʹs policy is to record
sick leave as an operating expense in the period taken because such benefits do not vest, nor is payment
probable; however, unused sick leave is added to the creditable service period for calculation of retirement
benefits when the employee retires.

ALBANY UNIFIED SCHOOL DISTRICTNOTES TO FINANCIAL STATEMENTS, continued
JUNE 30, 2015
27
NOTE 1 – SUMMARY OF SIGNIFICANT ACCOUNTING POLICIES (continued)
E. Assets, Deferred Outflows of Resources, Liabilities, Deferred Inflows of Resources, Fund Balance and Net
Position (continued)
Accrued Liabilities and Long‐Term Obligations
All payables, accrued liabilities, and long‐term obligations are reported in the government‐wide financial
statements. In general, governmental fund payables and accrued liabilities that, once incurred, are paid in a
timely manner and in full from current financial resources are reported as obligations of the funds.
Premiums and Discounts
In the government‐wide financial statements, long‐term obligations are reported as liabilities in the statement
of net position. Bond premiums and discounts are deferred and amortized over the life of the bonds using the
straight line method.
Deferred Outflows/Deferred Inflows of Resources
In addition to assets, the District will sometimes report a separate section for deferred outflows of resources.
This separate financial statement element, deferred outflows of resources, represents a consumption of net
position that applies to a future period and so will not be recognized as an outflow of resources
(expense/expenditure) until then.
In addition to liabilities, the District will sometimes report a separate section for deferred inflows of resources.
This separate financial statement element, deferred inflows of resources, represents an acquisition of net
position that applies to a future period and so will not be recognized as an inflow of resources (revenue) until
that time.
Pensions
For purposes of measuring the net pension liability, deferred outflows of resources and deferred inflows of
resources related to pensions, and pension expense, information about the fiduciary net position of the defined
benefit pension plans (the Plans) of the California State Teachers’ Retirement System (CalSTRS) and the
California Public Employees’ Retirement System (CalPERS) and additions to/deductions from the Plans’
fiduciary net position have been determined on the same basis as they are reported by the Plans. For this
purpose, benefit payments (including refunds of employee contributions) are recognized when due and
payable in accordance with the benefit terms. Investments are reported at fair value.
Fund Balance
Fund balance is divided into five classifications based primarily on the extent to which the District is bound to
observe constraints imposed upon the use of the resources in the governmental funds. The classifications are
as follows:
Nonspendable ‐ The nonspendable fund balance classification reflects amounts that are not in spendable form.
Examples include inventory, prepaid items, the long‐term portion of loans receivable, and nonfinancial assets
held for resale. This classification also reflects amounts that are in spendable form but that are legally or
contractually required to remain intact, such as the principal of a permanent endowment.

ALBANY UNIFIED SCHOOL DISTRICTNOTES TO FINANCIAL STATEMENTS, continued
JUNE 30, 2015
28
NOTE 1 – SUMMARY OF SIGNIFICANT ACCOUNTING POLICIES (continued)
E. Assets, Deferred Outflows of Resources, Liabilities, Deferred Inflows of Resources, Fund Balance and Net Position (continued)
Fund Balance (continued)
Restricted ‐ The restricted fund balance classification reflects amounts subject to externally imposed and legally
enforceable constraints. Such constraints may be imposed by creditors, grantors, contributors, or laws or
regulations of other governments, or may be imposed by law through constitutional provisions or enabling
legislation.
Committed ‐ The committed fund balance classification reflects amounts subject to internal constraints self‐
imposed by formal action of the Governing Board. The constraints giving rise to committed fund balance must
be imposed no later than the end of the reporting period. The actual amounts may be determined subsequent
to that date but prior to the issuance of the financial statements. In contrast to restricted fund balance,
committed fund balance may be redirected by the government to other purposes as long as the original
constraints are removed or modified in the same manner in which they were imposed, that is, by the same
formal action of the Governing Board.
Assigned ‐ The assigned fund balance classification reflects amounts that the government intends to be used for
specific purposes. Assignments may be established either by the Governing Board or by a designee of the
governing body, and are subject to neither the restricted nor committed levels of constraint. In contrast to the
constraints giving rise to committed fund balance, constraints giving rise to assigned fund balance are not
required to be imposed, modified, or removed by formal action of the Governing Board. The action does not
require the same level of formality and may be delegated to another body or official. Additionally, the
assignment need not be made before the end of the reporting period, but rather may be made any time prior to
the issuance of the financial statements.
Unassigned ‐ In the General Fund only, the unassigned fund balance classification reflects the residual balance
that has not been assigned to other funds and that is not restricted, committed, or assigned to specific purposes.
However, deficits in any fund, including the General Fund that cannot be eliminated by reducing or
eliminating amounts assigned to other purposes are reported as negative unassigned fund balance.
The District applies restricted resources first when expenditures are incurred for purposes for which either
restricted or unrestricted (committed, assigned and unassigned) amounts are available. Similarly, within
unrestricted fund balance, committed amounts are reduced first followed by assigned, and then unassigned
amounts when expenditures are incurred for purposes for which amounts in any of the unrestricted fund
balance classifications could be used.

ALBANY UNIFIED SCHOOL DISTRICTNOTES TO FINANCIAL STATEMENTS, continued
JUNE 30, 2015
29
NOTE 1 – SUMMARY OF SIGNIFICANT ACCOUNTING POLICIES (continued)
F. Interfund Activity
Exchange transactions between funds are reported as revenues in the seller funds and as
expenditures/expenses in the purchaser funds. Flows of cash or goods from one fund to another without a
requirement for repayment are reported as interfund transfers. Interfund transfers are reported as other
financing sources/uses in governmental funds. Repayments from funds responsible for particular
expenditures/expenses to the funds that initially paid for them are not presented in the financial statements.
Interfund transfers are eliminated in the governmental activities columns of the statement of activities.
G. Estimates
The preparation of the financial statements in conformity with accounting principles generally accepted in the
United States of America requires management to make estimates and assumptions that affect the amounts
reported in the financial statements and accompanying notes. Actual results may differ from those estimates.
H. Budgetary Data
The budgetary process is prescribed by provisions of the California Education Code and requires the governing
board to hold a public hearing and adopt an operating budget no later than July 1 of each year. The District
governing board satisfied these requirements. The adopted budget is subject to amendment throughout the
year to give consideration to unanticipated revenue and expenditures primarily resulting from events
unknown at the time of budget adoption with the legal restriction that expenditures cannot exceed
appropriations by major object account.
The amounts reported as the original budgeted amounts in the budgetary statements reflect the amounts when
the original appropriations were adopted. The amounts reported as the final budgeted amounts in the
budgetary statements reflect the amounts after all budget amendments have been accounted for. For purposes
of the budget, on‐behalf payments have not been included as revenue and expenditures as required under
generally accepted accounting principles.
I. Property Tax
Secured property taxes attach as an enforceable lien on property as of January 1. Taxes are payable in two
installments on November 1 and February 1 and become delinquent on December 10 and April 10,
respectively. Unsecured property taxes are payable in one installment on or before August 31. The County
Auditor‐Controller bills and collects the taxes on behalf of the District. Local property tax revenues are
recorded when received.

ALBANY UNIFIED SCHOOL DISTRICTNOTES TO FINANCIAL STATEMENTS, continued
JUNE 30, 2015
30
NOTE 1 – SUMMARY OF SIGNIFICANT ACCOUNTING POLICIES (continued)
J. New Accounting Pronouncements
GASB Statement No. 68 – In June 2012, GASB issued Statement No. 68, Accounting and Financial Reporting for
Pensions—an amendment of GASB Statement No. 27. The primary objective of this Statement is to improve
accounting and financial reporting by state and local governments for pensions. It also improves information
provided by state and local governmental employers about financial support for pensions that is provided by
other entities. This Statement results from a comprehensive review of the effectiveness of existing standards of
accounting and financial reporting for pensions with regard to providing decision‐useful information,
supporting assessments of accountability and interperiod equity, and creating additional transparency. The
Statement is effective for periods beginning after June 15, 2014. The District has implemented GASB Statement
No. 68 for the year ended June 30, 2015.
GASB Statement No. 71 – In November 2013, GASB issued Statement No. 71, Pension Transition for Contributions
Made Subsequent to the Measurement Date – an amendment of GASB Statement No. 68. This standard seeks to clarify
certain implementation issues related to amounts that are deferred and amortized at the time GASB 68 is first
adopted. It applies to situations in which the measurement date of an actuarial valuation differs from the
governmentʹs fiscal year. The Statement is effective for periods beginning after June 15, 2014. The District has
implemented GASB Statement No. 71 for the year ended June 30, 2015.
GASB Statement No. 72 – In February 2015, GASB issued Statement No. 72, Fair Value Measurement and
Application. This standard addresses accounting and financial reporting issues related to fair value
measurements. The Statement is effective for periods beginning after June 15, 2015. The District has not yet
determined the impact on the financial statements.
GASB Statement No. 73 – In June 2015, GASB issued Statement No. 73, Accounting and Financial Reporting for
Pensions and Related Assets That are Not within the Scope of GASB Statement 68, and Amendments to Certain
Provisions of GASB Statements 67 and 68. This standard establishes requirements for defined benefit pensions that
are not within the scope of GASB Statement 68 and amends certain provisions of GASB Statements 67 and 68.
The Statement is effective for periods beginning after June 15, 2016. The District has not yet determined the
impact on the financial statements.
GASB Statement No. 75 – In June 2015, GASB issued Statement No. 75, Accounting and Financial Reporting for
Postemployment Benefits Other Than Pensions. This standard’s primary objective is to improve accounting and
financial reporting by state and local governments for postemployment benefits other than pensions. The
Statement is effective for periods beginning after June 15, 2017. The District has not yet determined the impact
on the financial statements.

ALBANY UNIFIED SCHOOL DISTRICTNOTES TO FINANCIAL STATEMENTS, continued
JUNE 30, 2015
31
NOTE 2 – CASH AND INVESTMENTS
A. Summary of Cash and Investments
Governmental Fiduciary
Activities Funds
Cash in county 14,682,119$ ‐$
Cash on hand and in banks 3,500 113,728
Cash in revolving fund 25,000 ‐
Total cash and cash equivalents 14,710,619$ 113,728$
B. Policies and Practices
The District is authorized under California Government Code to make direct investments in local agency
bonds, notes, or warrants within the state; U.S. Treasury instruments; registered state warrants or treasury
notes; securities of the U.S. Government, or its agencies; bankers acceptances; commercial paper; certificates of
deposit placed with commercial banks and/or savings and loan companies; repurchase or reverse repurchase
agreements; medium term corporate notes; shares of beneficial interest issued by diversified management
companies, certificates of participation, obligations with first priority security; collateralized mortgage
obligations; and the County Investment Pool.
Investment in County Treasury – The District maintains substantially all of its cash in the County Treasury in
accordance with Education Code Section 41001. The Alameda County Treasurer’s pooled investments are
managed by the County Treasurer who reports on a monthly basis to the board of supervisors. In addition, the
function of the County Treasury Oversight Committee is to review and monitor the County’s investment
policy. The committee membership includes the Treasurer and Tax Collector, the Auditor‐Controller, Chief
Administrative Officer, Superintendent of Schools Representative, and a public member. The fair value of the
Districtʹs investment in the pool is based upon the Districtʹs pro‐rata share of the fair value provided by the
County Treasurer for the entire portfolio (in relation to the amortized cost of that portfolio). The balance
available for withdrawal is based on the accounting records maintained by the County Treasurer, which is
recorded on the amortized cost basis.

ALBANY UNIFIED SCHOOL DISTRICTNOTES TO FINANCIAL STATEMENTS, continued
JUNE 30, 2015
32
NOTE 2 – CASH AND INVESTMENTS (continued)
C. General Authorizations
Except for investments by trustees of debt proceeds, the authority to invest District funds deposited with the
county treasury is delegated to the County Treasurer and Tax Collector. Additional information about the
investment policy of the County Treasurer and Tax Collector may be obtained from its website. The table
below identifies the investment types permitted by California Government Code.
Authorized Investment Type
Maximum
Remaining
Maturity
Maximum
Percentage of
Portfolio
Maximum
Investment in
One Issuer
Local Agency Bonds, Notes, Warrants 5 years None None
Registered State Bonds, Notes, Warrants 5 years None None
U. S. Treasury Obligations 5 years None None
U. S. Agency Securities 5 years None None
Banker’s Acceptance 180 days 40% 30%
Commercial Paper 270 days 25% 10%
Negotiable Certificates of Deposit 5 years 30% None
Repurchase Agreements 1 year None None
Reverse Repurchase Agreements 92 days 20% of base None
Medium‐Term Corporate Notes 5 years 30% None
Mutual Funds N/A 20% 10%
Money Market Mutual Funds N/A 20% 10%
Mortgage Pass‐Through Securities 5 years 20% None
County Pooled Investment Funds N/A None None
Local Agency Investment Fund (LAIF) N/A None None
Joint Powers Authority Pools N/A None None
D. Interest Rate Risk
Interest rate risk is the risk that changes in market interest rates will adversely affect the fair value of an
investment. Generally, the longer the maturity of an investment, the greater the sensitivity of its fair value to
changes in market interest rates. The District manages its exposure to interest rate risk by investing in the
County Treasury. The District maintains a pooled investment with the County Treasury with a fair value of
approximately $14,704,261 and an amortized book value of $14,682,119. The average weighted maturity for
this pool is 466 days.
E. Credit Risk
Credit risk is the risk that an issuer of an investment will not fulfill its obligation to the holder of the
investment. This is measured by the assignment of a rating by a nationally recognized statistical rating
organization. The investments in the County Treasury are not required to be rated. As of June 30, 2015, the
pooled investments in the County Treasury were not rated.

ALBANY UNIFIED SCHOOL DISTRICTNOTES TO FINANCIAL STATEMENTS, continued
JUNE 30, 2015
33
NOTE 2 – CASH AND INVESTMENTS (continued)
F. Custodial Credit Risk – Deposits
This is the risk that in the event of a bank failure, the Districtʹs deposits may not be returned to it. The District
does not have a policy for custodial credit risk for deposits. However, the California Government Code
requires that a financial institution secure deposits made by state or local governmental units by pledging
securities in an undivided collateral pool held by a depository regulated under state law. The market value of
the pledged securities in the collateral pool must equal at least 110 percent of the total amount deposited by the
public agencies. California law also allows financial institutions to secure public deposits by pledging first
trust deed mortgage notes having a value of 150 percent of the secured public deposits and letters of credit
issued by the Federal Home Loan Bank of San Francisco having a value of 105 percent of the secured deposits.
As of June 30, 2015, the Districtʹs bank balance was not exposed to custodial credit risk.
NOTE 3 – ACCOUNTS RECEIVABLE
Accounts receivable at June 30, 2015 consisted of the following:
General Fund
Special Education
Pass‐Through
Fund
Deferred
Maintenance
Fund
Bond Interest &
Redemption Fund
Non‐Major
Governmental
Funds
Total
Governmental
Activities
Federal Government
Categorical aid 534,938$ 2,989,149$ ‐$ ‐$ 97,603$ 3,621,690$
State Government
Apportionment 254,494 ‐ ‐ ‐ ‐ 254,494
Categorical aid 201,460 696,046 ‐ ‐ 15,231 912,737
Lottery 317,972 ‐ ‐ ‐ ‐ 317,972
Local Government
Other local sources 393,161 ‐ 300 500 64,126 458,087
Total 1,702,025$ 3,685,195$ 300$ 500$ 176,960$ 5,564,980$

ALBANY UNIFIED SCHOOL DISTRICTNOTES TO FINANCIAL STATEMENTS, continued
JUNE 30, 2015
34
NOTE 4 – CAPITAL ASSETS
Capital asset activity for the year ended June 30, 2015 was as follows:
Balance Balance
July 01, 2014 Additions Deletions June 30, 2015
Governmental Activities
Capital assets not being depreciated
Land 4,394,935$ ‐$ ‐$ 4,394,935$
Construction in progress ‐ 3,066,009 ‐ 3,066,009
Total Capital Assets not Being Depreciated 4,394,935 3,066,009 ‐ 7,460,944
Capital assets being depreciated
Land improvements 19,840,079 250,324 ‐ 20,090,403
Buildings & improvements 53,073,686 252,539 ‐ 53,326,225
Furniture & equipment 6,320,259 ‐ 143,828 6,176,431
Total Capital Assets Being Depreciated 79,234,024 502,863 143,828 79,593,059
Less Accumulated Depreciation
Land improvements 3,782,012 634,784 ‐ 4,416,796
Buildings & improvements 20,379,125 1,391,327 ‐ 21,770,452
Furniture & equipment 4,548,501 399,040 143,828 4,803,713
Total Accumulated Depreciation 28,709,638 2,425,151 143,828 30,990,961
Governmental Activities
Capital Assets, net 54,919,321$ 1,143,721$ ‐$ 56,063,042$

ALBANY UNIFIED SCHOOL DISTRICTNOTES TO FINANCIAL STATEMENTS, continued
JUNE 30, 2015
35
NOTE 5 – INTERFUND TRANSACTIONS
A. Interfund Receivables/Payables (Due From/Due To)
Individual interfund receivable and payable balances at June 30, 2015 were as follows:
Due To Other Funds General Fund
Deferred
Maintenance
Fund
Non‐Major
Governmental
Funds Total
General Fund ‐$ 1,274,407$ ‐$ 1,274,407$
Deferred Maintenance Fund 1,272,318 ‐ 23,405 1,295,723
Non‐Major Governmental Funds 667 ‐ ‐ 667
Total Due From Other Funds 1,272,985$ 1,274,407$ 23,405$ 2,570,797$
Due from Deferred Maintenance Fund to General Fund to close out post‐employment benefits. 1,272,318$
Due from Deferred Maintenance Fund to Building Fund to balance the building fund. 23,405
Due from Adult Education Fund to General Fund to close out the fund. 667
Due from General Fund to Deferred Maintenance Fund for future capital outlay projects. 1,274,407
Total 2,570,797$
Due From Other Funds
B. Operating Transfers
Interfund transfers for the year ended June 30, 2015 consisted of the following:
Interfund Transfers Out
Deferred
Maintenance
Fund
Non‐Major
Governmental
Funds Total
General Fund 1,274,407$ 2,319$ 1,276,726$
Total Interfund Transfers 1,274,407$ 2,319$ 1,276,726$
Transfer from the General Fund to the Deferred Maintenance Fund for future capital projects. 1,274,407$
Transfer from the General Fund to the Cafeteria Fund for payment of negative student balances. 2,319
Total 1,276,726$
Interfund Transfers In
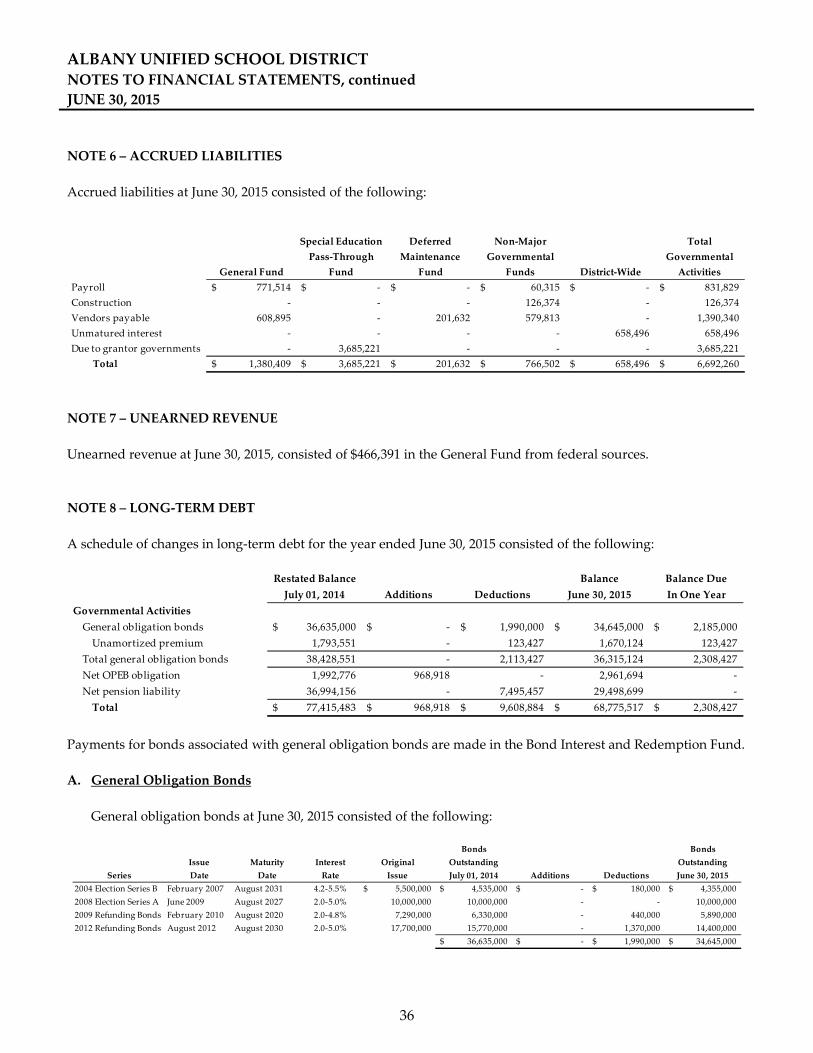
ALBANY UNIFIED SCHOOL DISTRICTNOTES TO FINANCIAL STATEMENTS, continued
JUNE 30, 2015
36
NOTE 6 – ACCRUED LIABILITIES
Accrued liabilities at June 30, 2015 consisted of the following:
General Fund
Special Education
Pass‐Through
Fund
Deferred
Maintenance
Fund
Non‐Major
Governmental
Funds District‐Wide
Total
Governmental
Activities
Payroll 771,514$ ‐$ ‐$ 60,315$ ‐$ 831,829$
Construction ‐ ‐ ‐ 126,374 ‐ 126,374
Vendors payable 608,895 ‐ 201,632 579,813 ‐ 1,390,340
Unmatured interest ‐ ‐ ‐ ‐ 658,496 658,496
Due to grantor governments ‐ 3,685,221 ‐ ‐ ‐ 3,685,221
Total 1,380,409$ 3,685,221$ 201,632$ 766,502$ 658,496$ 6,692,260$
NOTE 7 – UNEARNED REVENUE
Unearned revenue at June 30, 2015, consisted of $466,391 in the General Fund from federal sources.
NOTE 8 – LONG‐TERM DEBT
A schedule of changes in long‐term debt for the year ended June 30, 2015 consisted of the following:
Restated Balance Balance Balance Due
July 01, 2014 Additions Deductions June 30, 2015 In One Year
Governmental Activities
General obligation bonds 36,635,000$ ‐$ 1,990,000$ 34,645,000$ 2,185,000$
Unamortized premium 1,793,551 ‐ 123,427 1,670,124 123,427
Total general obligation bonds 38,428,551 ‐ 2,113,427 36,315,124 2,308,427
Net OPEB obligation 1,992,776 968,918 ‐ 2,961,694 ‐
Net pension liability 36,994,156 ‐ 7,495,457 29,498,699 ‐
Total 77,415,483$ 968,918$ 9,608,884$ 68,775,517$ 2,308,427$
Payments for bonds associated with general obligation bonds are made in the Bond Interest and Redemption Fund.
A. General Obligation Bonds
General obligation bonds at June 30, 2015 consisted of the following:
Bonds Bonds
Issue Maturity Interest Original Outstanding Outstanding
Series Date Date Rate Issue July 01, 2014 Additions Deductions June 30, 2015
2004 Election Series B February 2007 August 2031 4.2‐5.5% 5,500,000$ 4,535,000$ ‐$ 180,000$ 4,355,000$
2008 Election Series A June 2009 August 2027 2.0‐5.0% 10,000,000 10,000,000 ‐ ‐ 10,000,000
2009 Refunding Bonds February 2010 August 2020 2.0‐4.8% 7,290,000 6,330,000 ‐ 440,000 5,890,000
2012 Refunding Bonds August 2012 August 2030 2.0‐5.0% 17,700,000 15,770,000 ‐ 1,370,000 14,400,000
36,635,000$ ‐$ 1,990,000$ 34,645,000$

ALBANY UNIFIED SCHOOL DISTRICTNOTES TO FINANCIAL STATEMENTS, continued
JUNE 30, 2015
37
NOTE 8 – LONG‐TERM DEBT (continued)
A. General Obligation Bonds (continued)
The annual requirements to amortize the bonds outstanding at June 30, 2015 are as follows:
Year Ended June 30, Principal Interest Total
2016 2,185,000$ 1,533,867$ 3,718,867$
2017 2,400,000 1,436,116 3,836,116
2018 2,625,000 1,329,887 3,954,887
2019 2,875,000 1,214,027 4,089,027
2020 2,775,000 1,093,849 3,868,849
2021 ‐ 2025 11,365,000 3,693,493 15,058,493
2026 ‐ 2030 9,235,000 1,000,680 10,235,680
2031 ‐ 2032 1,185,000 39,769 1,224,769
Total 34,645,000$ 11,341,688$ 45,986,688$
B. Net Pension Liability
The District follows GASB Statement No. 68, Accounting and Financial Reporting for Pensions—an amendment of
GASB Statement No. 27. The District’s restated beginning net pension liability was $36,994,156, and decreased
by $7,495,457 during the year ended June 30, 2015. The ending net pension liability at June 30, 2015 was
$29,498,699. See Note 11 for additional information regarding the net pension liability.

ALBANY UNIFIED SCHOOL DISTRICTNOTES TO FINANCIAL STATEMENTS, continued
JUNE 30, 2015
38
NOTE 9 – FUND BALANCES
Fund balances were composed of the following elements at June 30, 2015:
General Fund
Special Education
Pass‐Through
Fund
Deferred
Maintenance
Fund
Bond Interest &
Redemption Fund
Non‐Major
Governmental
Funds
Total
Governmental
Funds
Non‐spendable
Revolving cash 25,000$ ‐$ ‐$ ‐$ ‐$ 25,000$
Stores inventory ‐ ‐ ‐ ‐ 4,757 4,757
Prepaid expenditures 29,537 ‐ ‐ ‐ ‐ 29,537
Total non‐spendable 54,537 ‐ ‐ ‐ 4,757 59,294
Restricted
Educational programs 517,609 1 ‐ ‐ ‐ 517,610
Capital projects ‐ ‐ ‐ ‐ 2,008,187 2,008,187
Debt service ‐ ‐ ‐ 3,153,951 ‐ 3,153,951
All others ‐ ‐ ‐ ‐ 184,844 184,844
Total restricted 517,609 1 ‐ 3,153,951 2,193,031 5,864,592
Committed
Deferred maintenance ‐ ‐ 696,419 ‐ ‐ 696,419
Total committed ‐ ‐ 696,419 ‐ ‐ 696,419
Assigned
Special reserve 488,072 ‐ ‐ ‐ ‐ 488,072
Other assignments ‐ ‐ ‐ ‐ 244,323 244,323
Total assigned 488,072 ‐ ‐ ‐ 244,323 732,395
Unassigned
Reserve for economic uncertainties 1,202,357 ‐ ‐ ‐ ‐ 1,202,357
Remaining unassigned 5,254,681 ‐ ‐ ‐ ‐ 5,254,681
Total unassigned 6,457,038 ‐ ‐ ‐ ‐ 6,457,038
Total 7,517,256$ 1$ 696,419$ 3,153,951$ 2,442,111$ 13,809,738$
The District is committed to maintaining a prudent level of financial resources to protect against the need to reduce
service levels because of temporary revenue shortfalls or unpredicted expenditures. The District’s Minimum Fund
Balance Policy requires a Reserve for Economic Uncertainties, consisting of unassigned amounts, equal to no less
than 3 percent of General Fund expenditures and other financing uses.

ALBANY UNIFIED SCHOOL DISTRICTNOTES TO FINANCIAL STATEMENTS, continued
JUNE 30, 2015
39
NOTE 10 –POSTEMPLOYMENT BENEFITS OTHER THAN PENSIONS (OPEB)
A. Plan Description and Contribution Information
The District provides medical, dental and vision benefits to retirees and their covered eligible dependents.
Membership of the plan consisted of the following:
Retirees and beneficiaries receiving benefits 140
Active plan members 441
Total* 581
Number of participating employers 1
*As of July 1, 2014 actuarial study
B. Funding Policy
The District’s contribution is currently based on a project pay‐as‐you‐go funding method, that is, benefits are
payable when due.
As of June 30, 2015, the District has not established a plan or equivalent that contains an irrevocable transfer of
assets dedicated to providing benefits to retirees in accordance with the terms of the plan and that are legally
protected from creditors.

ALBANY UNIFIED SCHOOL DISTRICTNOTES TO FINANCIAL STATEMENTS, continued
JUNE 30, 2015
40
NOTE 10 – POSTEMPLOYMENT BENEFITS OTHER THAN PENSIONS (OPEB) (continued)
C. Annual OPEB Cost and Net OPEB Obligation
The District’s annual OPEB cost (expense) is calculated based on the annual required contribution of the
employer (ARC), an amount actuarially determined in accordance with the parameters of GASB Statement No.
45. The ARC represents a level of funding that, if paid on an ongoing basis, is projected to cover normal cost
each year and amortize any unfunded actuarial accrued liabilities (UAAL) (or funding excess) over a period
not to exceed thirty years. The following table shows the components of the District’s annual OPEB cost for the
year, the amount actually contributed to the Plan, and changes in the District’s net OPEB obligation to the Plan:
Annual required contribution 1,636,000$
Interest on net OPEB obligation 79,711
Adjustment to annual required contribution (73,616)
Annual OPEB cost (expense) 1,642,095
Contributions made (673,177)
Increase (decrease) in net OPEB obligation 968,918
Net OPEB obligation, beginning of the year 1,992,776
Net OPEB obligation, end of the year 2,961,694$
The annual OPEB cost, the percentage of annual OPEB cost contributed to the Plan, and the net OPEB
obligation for the year ended June 30, 2015 and the preceding two years were as follows:
Annual
OPEB Percentage Net OPEB
Year Ended June 30, Cost Contributed Obligation
2015 1,642,095$ 41% 2,961,694$
2014 931,000$ 73% 1,992,776$
2013 941,000$ 63% 1,739,817$

ALBANY UNIFIED SCHOOL DISTRICTNOTES TO FINANCIAL STATEMENTS, continued
JUNE 30, 2015
41
NOTE 10 – POSTEMPLOYMENT BENEFITS OTHER THAN PENSIONS (OPEB) (continued)
D. Funded Status and Funding Progress
The funded status of the plan as of the most recent actuarial evaluation consists of the following:
Actuarial
Actuarial Accrued Unfunded UAAL as a
Valuation Actuarial Valuation Liability AAL Covered Percentage of
Date of Assets (AAL) (UAAL) Funded Ratio Payroll Covered Payroll
July 1, 2014 ‐$ 16,759,000$ 16,759,000$ 0% 25,333,493$ 66%
Actuarial valuations of an ongoing plan involve estimates of the value of reported amounts and assumptions
about the probability of occurrence of events far into the future. Examples include assumptions about future
employment, investment returns, mortality, and the healthcare cost trend. Amounts determined regarding the
funded status of the Plan and the annual required contributions of the employer are subject to continual
revision as actual results are compared with past expectations and new estimates are made about the future.
The schedule of funding progress, presented as required supplementary information following the notes to
financial statements, presents multiyear trend information about whether the actuarial value of plan assets is
increasing or decreasing over time relative to the actuarial accrued liabilities for benefits.
E. Actuarial Methods and Assumptions
Projections of benefits for financial reporting purposes are based on the substantive plan (the plan as
understood by the employer and the plan members) and include the types of benefits provided at the time of
each valuation and the historical pattern of sharing of benefit costs between the employer and plan members to
that point. The actuarial methods and assumptions used include techniques that are designed to reduce the
effects of short‐term volatility in actuarial accrued liabilities and the actuarial value of assets, consistent with
the long‐term perspective of the calculations.
In the July 1, 2014 actuarial valuation, the actuarial cost method used was Projected Unit Credit. Under this
method, the Actuarial Accrued Liability is the present value of projected benefits multiplied by the ratio of
benefits service as of the valuation date to the projected benefit service at retirement, termination, disability or
death. The Normal Cost for a plan year is the expected increase in the Accrued Liability during the plan year.
All employees eligible as of the measurement date in accordance with the provisions of the Plan listed in the
data provided by the Employer were included in the valuation.
Medical cost trend rates ranged from 4.5% to 8.0% based on benefit. The UAAL is being amortized at a level
percentage of payroll method with the remaining amortization period at June 30, 2015 of 29 years. The actuarial
value of assets was not determined in this actuarial valuation; however, any assets of the plan to be determined
will be on a market basis.

ALBANY UNIFIED SCHOOL DISTRICTNOTES TO FINANCIAL STATEMENTS, continued
JUNE 30, 2015
42
NOTE 11 – PENSION PLANS
Qualified employees are covered under multiple‐employer contributory retirement plans maintained by agencies
of the State of California. Certificated employees are members of the California State Teachersʹ Retirement System
(CalSTRS), and classified employees are members of the California Public Employeesʹ Retirement System
(CalPERS). The District recognized $2,556,792 for their proportionate share of pension expense for the year ended
June 30, 2015.
California State Teachers’ Retirement System (CalSTRS)
Plan Description
The District contributes to the California State Teachersʹ Retirement System (CalSTRS); a cost‐sharing multiple
employer public employee retirement system defined benefit pension plan administered by CalSTRS. The plan
provides retirement and disability benefits and survivor benefits to beneficiaries. Benefit provisions are established
by state statutes, as legislatively amended, within the State Teachersʹ Retirement Law. CalSTRS issues a separate
comprehensive annual financial report that includes financial statements and required supplementary information.
Copies of the CalSTRS annual financial report may be obtained from CalSTRS, 7919 Folsom Blvd., Sacramento, CA
95826.
Benefits provided
The CalSTRS defined benefit plan has two benefit formulas:
CalSTRS 2% at 60: Members first hired on or before December 31, 2012, to perform service that could be creditable
to CalSTRS
CalSTRS 2% at 62: Members first hired on or after January 1, 2013, to perform service that could be creditable to
CalSTRS
CalSTRS 2% at 60
CalSTRS 2% at 60 members are eligible for normal retirement at age 60, with a minimum of five years of credited
service. The normal retirement benefit is equal to 2.0 percent of final compensation for each year of credited service.
Early retirement options are available at age 55 with five years of credited service or as early as age 50 with 30 years
of credited service. The age factor for retirements after age 60 increases with each quarter year of age to 2.4 percent
at age 63 or older. Members who have 30 years or more of credited service receive an additional increase of up to
0.2 percent to the age factor, known as the career factor. The maximum benefit with the career factor is 2.4 percent
of final compensation.

ALBANY UNIFIED SCHOOL DISTRICTNOTES TO FINANCIAL STATEMENTS, continued
JUNE 30, 2015
43
NOTE 11 – PENSION PLANS (continued)
California State Teachers’ Retirement System (CalSTRS) (continued)
CalSTRS 2% at 62
CalSTRS 2% at 62 members are eligible for normal retirement at age 62, with a minimum of five years of credited
service. The normal retirement benefit is equal to 2.0 percent of final compensation for each year of credited service.
An early retirement option is available at age 55. The age factor for retirements after age 60 increases with each
quarter year of age to 2.4 percent at age 63 or older. Members who have 30 years or more of credited service receive
an additional increase of up to 0.2 percent to the age factor, known as the career factor. The maximum benefit with
the career factor is 2.4 percent of final compensation.
CalSTRS 2% at 62 members are eligible for normal retirement at age 62, with a minimum of five years of credited
service. The normal retirement benefit is equal to 2.0 percent of final compensation for each year of credited service.
An early retirement option is available at age 55. The age factor for retirement after age 62 increases with each
quarter year of age to 2.4 percent at age 65 or older.
Contributions
Active plan members are required to contribute 8.15% of their salary for fiscal year 2015 and the District is required
to contribute an actuarially determined rate. The actuarial methods and assumptions used for determining the rate
are those adopted by CalSTRS Teachersʹ Retirement Board. The required employer contribution rate for fiscal year
2015 was 8.88% of annual payroll. The contribution requirements of the plan members are established by state
statute. Contributions to the plan from the District were $1,684,606 for the year ended June 30, 2015.
On‐Behalf Payments
The District was the recipient of on‐behalf payments made by the State of California to CalSTRS for K‐12 education.
These payments consist of state general fund contributions of approximately $957,576 to CalSTRS (5.679% of 2012‐
13 creditable compensation subject to CalSTRS).

ALBANY UNIFIED SCHOOL DISTRICTNOTES TO FINANCIAL STATEMENTS, continued
JUNE 30, 2015
44
NOTE 11 – PENSION PLANS (continued)
California State Teachers’ Retirement System (CalSTRS) (continued)
Pension Liabilities, Pension Expense, and Deferred Outflows of Resources and Deferred Inflows of Resources
Related to Pensions
At June 30, 2015, the District reported a liability for its proportionate share of the net pension liability that reflected
a reduction for State pension support provided to the District. The amount recognized by the District as its
proportionate share of the net pension liability, the related State support, and the total portion of the net pension
liability that was associated with the District were as follows:
District ʹs proportionate share of the
net pension liability 22,999,230$
Statesʹs proportionate share of the net
pension liability associated with the District 13,887,929
Total 36,887,159$
The net pension liability was measured as of June 30, 2014, and the total pension liability used to calculate the net
pension liability was determined by applying update procedures to an actuarial valuation as of June 30, 2013, and
rolling forward the total pension liability to June 30, 2014. The District’s proportion of the net pension liability was
based on a projection of the District’s long‐term share of contributions to the pension plan relative to the projected
contributions of all participating school districts, actuarially determined. At June 30, 2014, the District’s proportion
was 0.039 percent, which did not change from its proportion measured as of June 30, 2013.
For the year ended June 30, 2015, the District recognized pension expense of $1,985,432. In addition, the District
recognized pension expense and revenue of $1,198,902 for support provided by the State. At June 30, 2015, the
District reported deferred outflows of resources and deferred inflows of resources related to pensions from the
following sources:
Deferred Outflows Deferred Inflows
of Resources of Resources
Differences between projected and
actual earnings on plan investments ‐$ 5,663,517$
District contributions subsequent
to the measurement date 1,684,606 ‐
1,684,606$ 5,663,517$

ALBANY UNIFIED SCHOOL DISTRICTNOTES TO FINANCIAL STATEMENTS, continued
JUNE 30, 2015
45
NOTE 11 – PENSION PLANS (continued)
California State Teachers’ Retirement System (CalSTRS) (continued)
Pension Liabilities, Pension Expense, and Deferred Outflows of Resources and Deferred Inflows of Resources
Related to Pensions (continued)
$1,684,606 reported as deferred outflows of resources related to pensions resulting from District contributions
subsequent to the measurement date will be recognized as a reduction of the net pension liability in the year ended
June 30, 2016. Other amounts reported as deferred outflows of resources and deferred inflows of resources related
to pensions will be recognized in pension expense as follows:
Deferred Inflows
Year Ended June 30, of Resources
2016 1,415,880$
2017 1,415,879
2018 1,415,879
2019 1,415,879
5,663,517$

ALBANY UNIFIED SCHOOL DISTRICTNOTES TO FINANCIAL STATEMENTS, continued
JUNE 30, 2015
46
NOTE 11 – PENSION PLANS (continued)
California State Teachers’ Retirement System (CalSTRS) (continued)
Actuarial assumptions
The total pension liability was determined by applying update procedures to an actuarial valuation as of June 30,
2013, and rolling forward the total pension liability to June 30, 2014 using the following actuarial assumptions,
applied to all periods included in the measurement:
Consumer Price Inflation 3.00%
Investment Yield (Net of Expenses) 7.50%
Wage Inflation 3.75%
Interest on Member Accounts 4.50%
CalSTRS uses custom mortality tables to best fit the patterns of mortality among its members. These custom tables
are based on RP2000 series tables adjusted to fit CalSTRS experience.
The actuarial assumptions used in the June 30, 2013 valuation were based on the results of an actuarial experience
study for the period July 1, 2006−June 30, 2010.
The long‐term expected rate of return on pension plan investments was determined using a building‐block method
in which best‐estimate ranges of expected future real rates of return (expected returns, net of pension plan
investment expense and inflation) are developed for each major asset class. The best‐estimate ranges were
developed using capital market assumptions from CalSTRS general investment consultant (Pension Consulting
Alliance ‐ PCA) as an input to the process. Based on the model from CalSTRS consulting actuary’s (Milliman)
investment practice, a best estimate range was determined by assuming the portfolio is re‐balanced annually and
that annual returns are lognormally distributed and independent from year to year to develop expected percentiles
for the long‐term distribution of annualized returns. The assumed asset allocation by PCA is based on board policy
for target asset allocation in effect on February 2, 2012, the date the current experience study was approved by the
board. Best estimates of 10‐year geometric real rates of return and the assumed asset allocation for each major asset
class used as input to develop the actuarial investment rate of return are summarized in the following table:
Long‐Term*
Assumed Asset Expected Real
Asset Class Allocation Rate of Return
Global Equity 47% 4.50%
Private Equity 12% 6.20%
Real Estate 15% 4.35%
Inflation Sensitive 5% 3.20%
Fixed Income 20% 0.20%
Cash/Liquidity 1% 0.00%
100%
* 10‐year geometric average
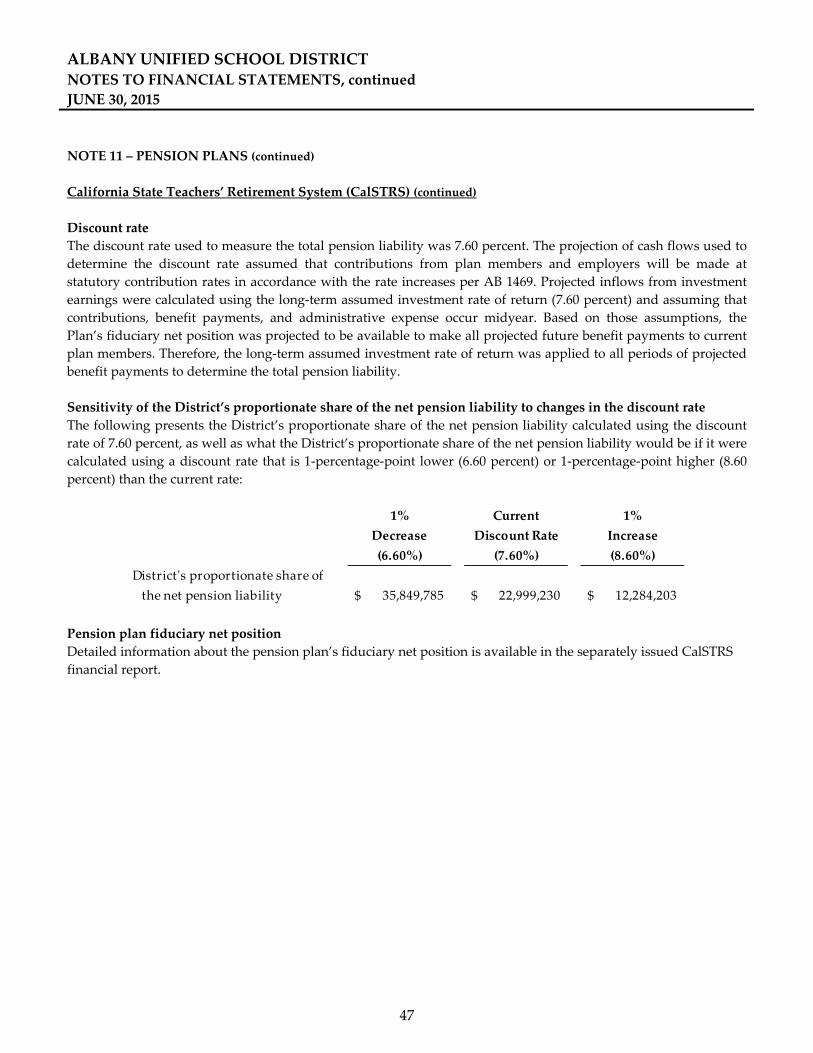
ALBANY UNIFIED SCHOOL DISTRICTNOTES TO FINANCIAL STATEMENTS, continued
JUNE 30, 2015
47
NOTE 11 – PENSION PLANS (continued)
California State Teachers’ Retirement System (CalSTRS) (continued)
Discount rate
The discount rate used to measure the total pension liability was 7.60 percent. The projection of cash flows used to
determine the discount rate assumed that contributions from plan members and employers will be made at
statutory contribution rates in accordance with the rate increases per AB 1469. Projected inflows from investment
earnings were calculated using the long‐term assumed investment rate of return (7.60 percent) and assuming that
contributions, benefit payments, and administrative expense occur midyear. Based on those assumptions, the
Plan’s fiduciary net position was projected to be available to make all projected future benefit payments to current
plan members. Therefore, the long‐term assumed investment rate of return was applied to all periods of projected
benefit payments to determine the total pension liability.
Sensitivity of the District’s proportionate share of the net pension liability to changes in the discount rate
The following presents the District’s proportionate share of the net pension liability calculated using the discount
rate of 7.60 percent, as well as what the District’s proportionate share of the net pension liability would be if it were
calculated using a discount rate that is 1‐percentage‐point lower (6.60 percent) or 1‐percentage‐point higher (8.60
percent) than the current rate:
1% Current 1%
Decrease Discount Rate Increase
(6.60%) (7.60%) (8.60%)
Districtʹs proportionate share of
the net pension liability 35,849,785$ 22,999,230$ 12,284,203$
Pension plan fiduciary net position
Detailed information about the pension plan’s fiduciary net position is available in the separately issued CalSTRS
financial report.

ALBANY UNIFIED SCHOOL DISTRICTNOTES TO FINANCIAL STATEMENTS, continued
JUNE 30, 2015
48
NOTE 11 – PENSION PLANS (continued)
California Public Employees’ Retirement System (CalPERS)
Plan Description
The District contributes to the School Employer Pool under the California Public Employeesʹ Retirement System
(CalPERS); a cost‐sharing multiple‐employer public employee retirement system defined benefit pension plan
administered by CalPERS. The plan provides retirement and disability benefits, annual cost‐of‐living adjustments,
and death benefits to plan members and beneficiaries. Benefit provisions are established by state statutes, as
legislatively amended, within the Public Employeesʹ Retirement Laws. CalPERS issues a separate comprehensive
annual financial report that includes financial statements and required supplementary information. Copies of the
CalPERS annual financial report may be obtained from the CalPERS Executive Office, 400 P Street, Sacramento, CA
95811.
Benefits provided
The benefits for the defined benefit plan are based on members’ years of service, age, final compensation, and
benefit formula. Benefits are provided for disability, death, and survivors of eligible members or beneficiaries.
Members become fully vested in their retirement benefits earned to date after five years of credited service.
Contributions
Active plan members who entered into the plan prior to January 1, 2013 are required to contribute 7.0% of their
salary. The California Public Employees’ Pension Reform Act (PEPRA) specifies that new members entering into
the plan on or after January 1, 2013, shall pay the higher of fifty percent of normal costs or 6.0% of their salary.
Additionally, for new members entering the plan on or after January 1, 2013, the employer is prohibited from
paying any of the employee contribution to CalPERS unless the employer payment of the member’s contribution is
specified in an employment agreement or collective bargaining agreement that expires after January 1, 2013.
The District is required to contribute an actuarially determined rate. The actuarial methods and assumptions used
for determining the rate are those adopted by the CalPERS Board of Administration. The required employer
contribution rate for fiscal year 2015 was 11.771% of annual payroll. Contributions to the plan from the District
were $754,444 for the year ended June 30, 2015.
Pension Liabilities, Pension Expense, and Deferred Outflows of Resources and Deferred Inflows of Resources
Related to Pensions
At June 30, 2015, the District reported a liability of $6,499,469 for its proportionate share of the net pension liability.
The net pension liability was measured as of June 30, 2014, and the total pension liability used to calculate the net
pension liability was determined by applying update procedures to an actuarial valuation as of June 30, 2013, and
rolling forward the total pension liability to June 30, 2014. The District’s proportion of the net pension liability was
based on a projection of the District’s long‐term share of contributions to the pension plan relative to the projected
contributions of all participating school districts, actuarially determined. At June 30, 2014, the District’s proportion
was 0.0573 percent, which was a decrease of 0.0002 from its proportion measured as of June 30, 2013.
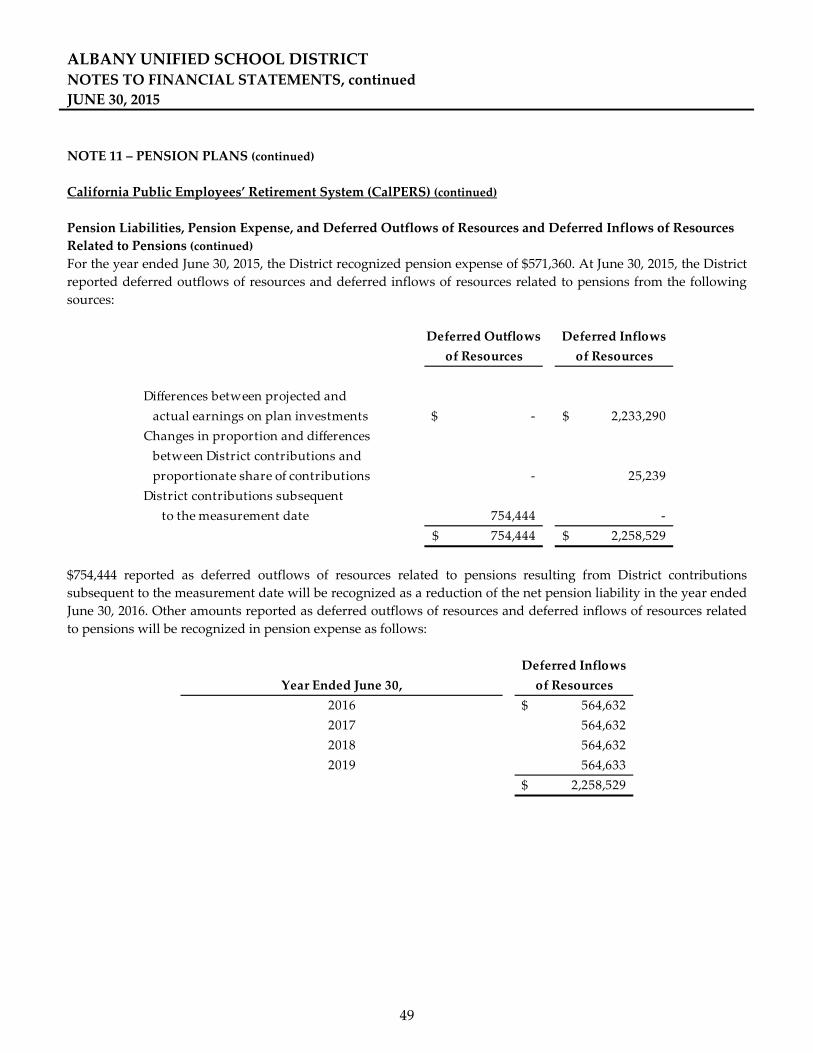
ALBANY UNIFIED SCHOOL DISTRICTNOTES TO FINANCIAL STATEMENTS, continued
JUNE 30, 2015
49
NOTE 11 – PENSION PLANS (continued)
California Public Employees’ Retirement System (CalPERS) (continued)
Pension Liabilities, Pension Expense, and Deferred Outflows of Resources and Deferred Inflows of Resources
Related to Pensions (continued)
For the year ended June 30, 2015, the District recognized pension expense of $571,360. At June 30, 2015, the District
reported deferred outflows of resources and deferred inflows of resources related to pensions from the following
sources:
Deferred Outflows Deferred Inflows
of Resources of Resources
Differences between projected and
actual earnings on plan investments ‐$ 2,233,290$
Changes in proportion and differences
between District contributions and
proportionate share of contributions ‐ 25,239
District contributions subsequent
to the measurement date 754,444 ‐
754,444$ 2,258,529$
$754,444 reported as deferred outflows of resources related to pensions resulting from District contributions
subsequent to the measurement date will be recognized as a reduction of the net pension liability in the year ended
June 30, 2016. Other amounts reported as deferred outflows of resources and deferred inflows of resources related
to pensions will be recognized in pension expense as follows:
Deferred Inflows
Year Ended June 30, of Resources
2016 564,632$
2017 564,632
2018 564,632
2019 564,633
2,258,529$
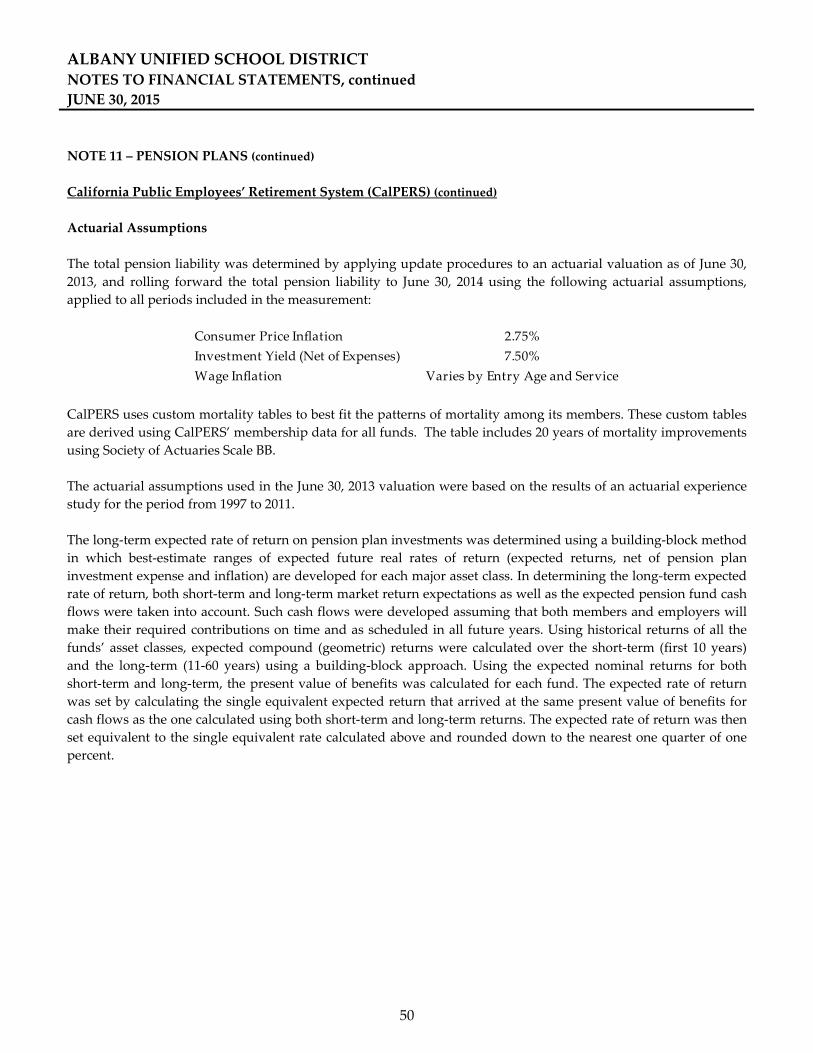
ALBANY UNIFIED SCHOOL DISTRICTNOTES TO FINANCIAL STATEMENTS, continued
JUNE 30, 2015
50
NOTE 11 – PENSION PLANS (continued)
California Public Employees’ Retirement System (CalPERS) (continued)
Actuarial Assumptions
The total pension liability was determined by applying update procedures to an actuarial valuation as of June 30,
2013, and rolling forward the total pension liability to June 30, 2014 using the following actuarial assumptions,
applied to all periods included in the measurement:
Consumer Price Inflation 2.75%
Investment Yield (Net of Expenses) 7.50%
Wage Inflation Varies by Entry Age and Service
CalPERS uses custom mortality tables to best fit the patterns of mortality among its members. These custom tables
are derived using CalPERS’ membership data for all funds. The table includes 20 years of mortality improvements
using Society of Actuaries Scale BB.
The actuarial assumptions used in the June 30, 2013 valuation were based on the results of an actuarial experience
study for the period from 1997 to 2011.
The long‐term expected rate of return on pension plan investments was determined using a building‐block method
in which best‐estimate ranges of expected future real rates of return (expected returns, net of pension plan
investment expense and inflation) are developed for each major asset class. In determining the long‐term expected
rate of return, both short‐term and long‐term market return expectations as well as the expected pension fund cash
flows were taken into account. Such cash flows were developed assuming that both members and employers will
make their required contributions on time and as scheduled in all future years. Using historical returns of all the
funds’ asset classes, expected compound (geometric) returns were calculated over the short‐term (first 10 years)
and the long‐term (11‐60 years) using a building‐block approach. Using the expected nominal returns for both
short‐term and long‐term, the present value of benefits was calculated for each fund. The expected rate of return
was set by calculating the single equivalent expected return that arrived at the same present value of benefits for
cash flows as the one calculated using both short‐term and long‐term returns. The expected rate of return was then
set equivalent to the single equivalent rate calculated above and rounded down to the nearest one quarter of one
percent.

ALBANY UNIFIED SCHOOL DISTRICTNOTES TO FINANCIAL STATEMENTS, continued
JUNE 30, 2015
51
NOTE 11 – PENSION PLANS (continued)
California Public Employees’ Retirement System (CalPERS) (continued)
Actuarial Assumptions (continued)
The table below reflects long‐term expected real rate of return by asset class. The rate of return was calculated
using the capital market assumptions applied to determine the discount rate and asset allocation. These geometric
rates of return are net of administrative expenses.
Assumed Asset Real Return Real Return
Asset Class Allocation Years 1‐10* Years 11+**
Global Equity 47% 5.25% 5.71%
Global Fixed Income 19% 0.99% 2.43%
Inflation Sensitive 6% 0.45% 3.36%
Private Equity 12% 6.83% 6.95%
Real Estate 11% 4.50% 5.13%
Infrastructure and Forestland 3% 4.50% 5.09%
Liquidity 2% ‐0.55% ‐1.05%
100%
* An expected inflation of 2.5% used for this period
** An expected inflation of 3.0% used for this period
Discount rate
The discount rate used to measure the total pension liability was 7.50 percent. A projection of the expected benefit
payments and contributions was performed to determine if assets would run out. The test revealed the assets
would not run out. Therefore the long‐term expected rate of return on pension plan investments was applied to all
periods of projected benefit payments to determine the total pension liability for the Schools Pool. The results of the
crossover testing for the Schools Pool are presented in a detailed report that can be obtained at CalPERS’ website.
According to Paragraph 30 of Statement 68, the long‐term discount rate should be determined without reduction
for pension plan administrative expense. The 7.50 percent investment return assumption used in this accounting
valuation is net of administrative expenses. Administrative expenses are assumed to be 15 basis points. An
investment return excluding administrative expenses would have been 7.65 percent. Using this lower discount rate
has resulted in a slightly higher total pension liability and net pension liability.

ALBANY UNIFIED SCHOOL DISTRICTNOTES TO FINANCIAL STATEMENTS, continued
JUNE 30, 2015
52
NOTE 11 – PENSION PLANS (continued)
California Public Employees’ Retirement System (CalPERS) (continued)
Sensitivity of the District’s proportionate share of the net pension liability to changes in the discount rate
The following presents the District’s proportionate share of the net pension liability calculated using the discount
rate of 7.50 percent, as well as what the District’s proportionate share of the net pension liability would be if it were
calculated using a discount rate that is 1‐percentage‐point lower (6.50 percent) or 1‐percentage‐point higher (8.50
percent) than the current rate:
1% Current 1%
Decrease Discount Rate Increase
(6.50%) (7.50%) (8.50%)
District ʹs proportionate share of
the net pension liability 11,401,551$ 6,499,469$ 2,403,284$
Pension plan fiduciary net position
Detailed information about the pension plan’s fiduciary net position is available in the separately issued CalPERS
financial report.

ALBANY UNIFIED SCHOOL DISTRICTNOTES TO FINANCIAL STATEMENTS, continued
JUNE 30, 2015
53
NOTE 12 – COMMITMENTS AND CONTINGENCIES
A. Grants
The District received financial assistance from federal and state agencies in the form of grants. The
disbursement of funds received under these programs generally requires compliance with terms and
conditions specified in the grant agreements and are subject to audit by the grantor agencies. Any disallowed
claims resulting from such audits could become a liability of the General Fund or other applicable funds.
However, in the opinion of management, any such disallowed claims will not have a material adverse effect on
the overall financial position of the District at June 30, 2015.
B. Litigation
The District is involved in various litigation arising from the normal course of business. In the opinion of
management and legal counsel, the disposition of all litigation pending is not expected to have a material
adverse effect on the overall financial position of the District at June 30, 2015.
C. Construction Commitments
As of June 30, 2015, the District had commitments with respect to unfinished capital projects of $2,284,997.
NOTE 13 – PARTICIPATION IN JOINT POWERS AUTHORITIES
The District participates in two joint ventures under joint powers authorities (JPAs), the Alameda County Schools
Insurance Group, and the Schools Excess Liability Fund public risk pool. The relationships between the District
and the JPAs are such that the JPAs are not component units of the District for financial reporting purposes.
The JPAs have budgeting and financial reporting requirements independent of member units, and their financial
statements are not presented in these financial statements. However, fund transactions between the JPAs and the
District are included in these statements. The audited financial statements are generally available from the
respective entities.

ALBANY UNIFIED SCHOOL DISTRICTNOTES TO FINANCIAL STATEMENTS, continued
JUNE 30, 2015
54
NOTE 14 – DEFERRED OUTFLOWS/INFLOWS OF RESOURCES
Pension Plans
Pursuant to GASB Statement No. 68, Accounting and Financial Reporting for Pensions—an amendment of GASB
Statement No. 27., the District recognized deferred outflows and inflows of resources related to pensions in the
District‐wide financial statements. The District’s deferred outflows and inflows of resources related to pensions
were as follows at June 30, 2015:
Deferred
outflows related
to pensions
Deferred inflows
related to
pensions
STRS Pension 1,684,606$ 5,663,517$
PERS Pension 754,444 2,258,529
Total 2,439,050$ 7,922,046$
NOTE 15 – RESTATEMENT OF NET POSITION
The beginning net position of Governmental Activities has been restated in order to record the District’s
proportionate share of net pension liability and deferred outflows of resources related to pensions in accordance
with GASB Statement No. 68, Accounting and Financial Reporting for Pensions—an amendment of GASB Statement No.
27. The effect on beginning net position is presented as follows:
Governmental
Activities
Net Position ‐ Beginning, as Previously Reported 31,775,737$
Restatement (34,863,953)
Net Position ‐ Beginning, as Restated (3,088,216)$

REQUIRED SUPPLEMENTARY
INFORMATION

ALBANY UNIFIED SCHOOL DISTRICT
See accompanying note to required supplementary information.
55
GENERAL FUND – BUDGETARY COMPARISON SCHEDULE
FOR THE YEAR ENDED JUNE 30, 2015
Actual* Variances ‐
Original Final (Budgetary Basis) Final to Actual
REVENUES
LCFF sources 25,969,037$ 26,057,327$ 26,490,409$ 433,082$
Federal sources 1,053,447 1,144,924 1,096,511 (48,413)
Other state sources 3,518,366 3,684,598 3,470,474 (214,124)
Other local sources 7,088,180 7,777,080 7,702,525 (74,555)
Total Revenues 37,629,030 38,663,929 38,759,919 95,990
EXPENDITURES
Certificated salaries 19,380,868 19,766,411 19,814,773 (48,362)
Classified salaries 4,703,493 4,974,343 5,170,063 (195,720)
Employee benefits 10,780,040 9,968,840 9,818,448 150,392
Books and supplies 1,558,949 1,643,144 1,657,078 (13,934)
Services and other operating expenditures 3,161,767 3,533,355 3,574,203 (40,848)
Other outgo
Transfers of indirect costs (193,400) (196,925) (196,275) (650)
Total Expenditures 39,391,717 39,689,168 39,838,290 (149,122)
Excess (Deficiency) of Revenues
Over Expenditures (1,762,687) (1,025,239) (1,078,371) (53,132)
Other Financing Sources (Uses)
Transfers in 707,750 1,274,407 1,274,407
Transfers out (1,085,281) (229,580) (1,514,374) (1,284,794)
Net Financing Sources (Uses) (377,531) (229,580) (239,967) (10,387)
NET CHANGE IN FUND BALANCE (2,140,218) (1,254,819) (1,318,338) (63,519)
Fund Balance ‐ Beginning 7,042,411 8,347,522 8,347,522 ‐
Fund Balance ‐ Ending 4,902,193$ 7,092,703$ 7,029,184$ (63,519)$
Budgeted Amounts
* The actual amounts reported on this schedule do not agree with the amounts reported on the Statement of
Revenues, Expenditures, and Changes in Fund Balance for the following reasons:
On behalf payments of $957,576 are not included in the actual revenues and expenditures reported in this
schedule.
Actual amounts reported in this schedule are for the General Fund only, and do not agree with the
amounts reported on the Statement of Revenues, Expenditures, and Changes in Fund Balances because the
amounts on that schedule include the financial activity of the Special Reserve Fund for Other Than Capital
Outlay Projects and the Special Reserve Fund for Postemployment Benefits, in accordance with the fund
type definitions promulgated by GASB Statement No. 54.

ALBANY UNIFIED SCHOOL DISTRICT
See accompanying note to required supplementary information.
56
SPECIAL EDUCATION PASS‐THROUGH FUND – BUDGETARY COMPARISON SCHEDULE
FOR THE YEAR ENDED JUNE 30, 2015
Actual Variances ‐
Original Final (Budgetary Basis) Final to Actual
REVENUES
Federal sources 4,280,158$ 4,474,785$ 4,474,785$ ‐$
Other state sources 13,098,636 13,069,620 13,206,753 137,133
Total Revenues 17,378,794 17,544,405 17,681,538 137,133
EXPENDITURES
Other outgo
Excluding transfers of indirect costs 17,378,794 17,544,405 17,681,538 (137,133)
Total Expenditures 17,378,794 17,544,405 17,681,538 (137,133)
Excess (Deficiency) of Revenues
Over Expenditures ‐ ‐ ‐ ‐
NET CHANGE IN FUND BALANCE ‐ ‐ ‐ ‐
Fund Balance ‐ Beginning 1 1 1 ‐
Fund Balance ‐ Ending 1$ 1$ 1$ ‐$
Budgeted Amounts
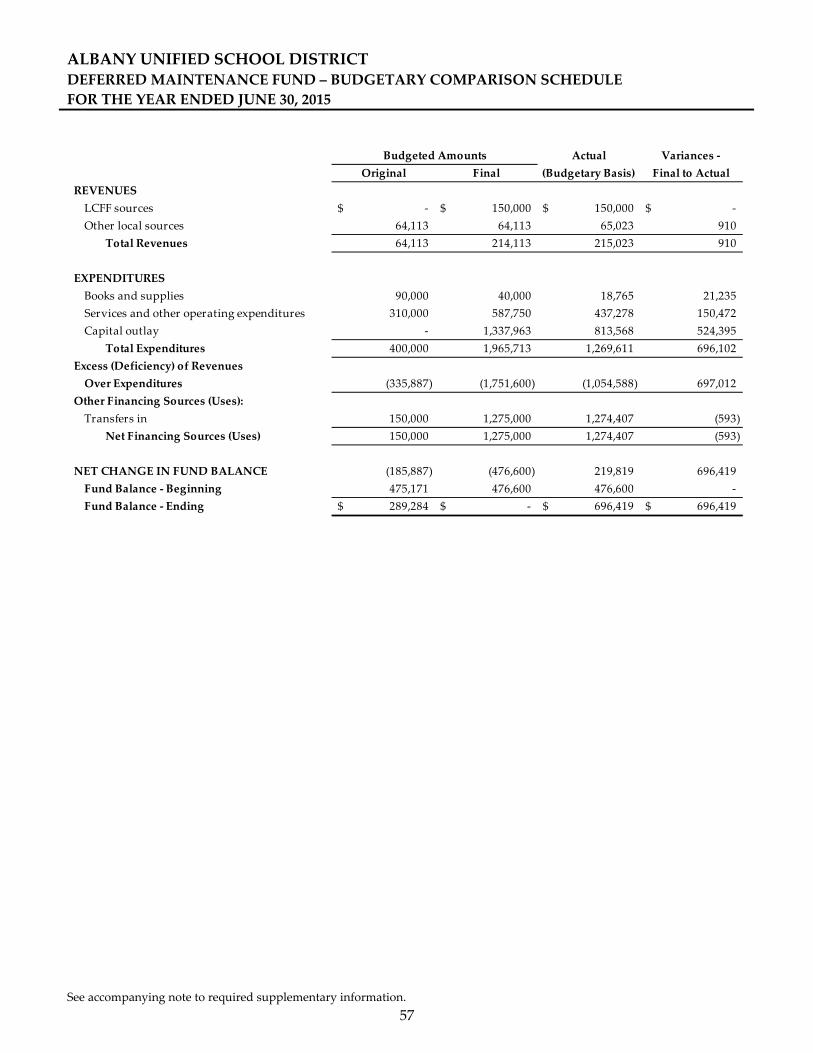
ALBANY UNIFIED SCHOOL DISTRICT
See accompanying note to required supplementary information.
57
DEFERRED MAINTENANCE FUND – BUDGETARY COMPARISON SCHEDULE
FOR THE YEAR ENDED JUNE 30, 2015
Actual Variances ‐
Original Final (Budgetary Basis) Final to Actual
REVENUES
LCFF sources ‐$ 150,000$ 150,000$ ‐$
Other local sources 64,113 64,113 65,023 910
Total Revenues 64,113 214,113 215,023 910
EXPENDITURES
Books and supplies 90,000 40,000 18,765 21,235
Services and other operating expenditures 310,000 587,750 437,278 150,472
Capital outlay ‐ 1,337,963 813,568 524,395
Total Expenditures 400,000 1,965,713 1,269,611 696,102
Excess (Deficiency) of Revenues
Over Expenditures (335,887) (1,751,600) (1,054,588) 697,012
Other Financing Sources (Uses):
Transfers in 150,000 1,275,000 1,274,407 (593)
Net Financing Sources (Uses) 150,000 1,275,000 1,274,407 (593)
NET CHANGE IN FUND BALANCE (185,887) (476,600) 219,819 696,419
Fund Balance ‐ Beginning 475,171 476,600 476,600 ‐
Fund Balance ‐ Ending 289,284$ ‐$ 696,419$ 696,419$
Budgeted Amounts

ALBANY UNIFIED SCHOOL DISTRICT
See accompanying note to required supplementary information.
58
SCHEDULE OF FUNDING PROGRESS
FOR THE YEAR ENDED JUNE 30, 2015
Actuarial
Actuarial Accrued Unfunded UAAL as a
Valuation Actuarial Valuation Liability AAL Covered Percentage of
Date of Assets (AAL) (UAAL) Funded Ratio Payroll Covered Payroll
July 1, 2014 ‐$ 16,759,000$ 16,759,000$ 0% 25,333,493$ 66%
July 1, 2013 ‐$ 9,463,000$ 9,463,000$ 0% 22,814,329$ 41%
July 1, 2011 ‐$ 9,456,000$ 9,456,000$ 0% 21,329,401$ 44%

ALBANY UNIFIED SCHOOL DISTRICT
See accompanying note to required supplementary information.
59
SCHEDULE OF THE DISTRICT’S PROPORTIONATE SHARE OF THE NET PENSION LIABILITY ‐
CALSTRS
FOR THE YEAR ENDED JUNE 30, 2015
June 30, 2015
District ʹs proportion of the net pension liability 0.039%
District ʹs proportionate share of the net
pension liability 22,999,230$
Statesʹs proportionate share of the net pension
liability associated with the District 13,887,929
Total 36,887,159$
District ʹs covered‐employee payroll 18,920,491$
District ʹs proportionate share of the net
pension liability as a percentage
of its covered‐employee payroll 121.6%
Plan fiduciary net position as a
percentage of the total pension liability. 76.5%

ALBANY UNIFIED SCHOOL DISTRICT
See accompanying note to required supplementary information.
60
SCHEDULE OF THE DISTRICT’S PROPORTIONATE SHARE OF THE NET PENSION LIABILITY ‐
CALPERS
FOR THE YEAR ENDED JUNE 30, 2015
June 30, 2015
District ʹs proportion of the net pension liability 0.057%
District ʹs proportionate share of the net
pension liability 6,499,469$
District ʹs covered‐employee payroll 6,413,002$
District ʹs proportionate share of the net
pension liability as a percentage
of its covered‐employee payroll 101.3%
Plan fiduciary net position as a
percentage of the total pension liability. 83.4%

ALBANY UNIFIED SCHOOL DISTRICT
See accompanying note to required supplementary information.
61
SCHEDULE OF DISTRICT CONTRIBUTIONS ‐ CALSTRS
FOR THE YEAR ENDED JUNE 30, 2015
June 30, 2015
Contractually required contribution 1,684,606$
Contributions in relation to the
contractually required contribution* (1,684,606)
Contribution deficiency (excess) ‐$
Districtʹs covered‐employee payroll 18,920,491$
Contributions as a percentage of
covered‐employee payroll 8.90%
*Amounts do not include on behalf contributions

ALBANY UNIFIED SCHOOL DISTRICT
See accompanying note to required supplementary information.
62
SCHEDULE OF DISTRICT CONTRIBUTIONS ‐ CALPERS
FOR THE YEAR ENDED JUNE 30, 2015
June 30, 2015
Contractually required contribution 754,444$
Contributions in relation to the
contractually required contribution (754,444)
Contribution deficiency (excess) ‐$
Districtʹs covered‐employee payroll 6,413,002$
Contributions as a percentage of
covered‐employee payroll 11.76%

ALBANY UNIFIED SCHOOL DISTRICT
63
NOTES TO REQUIRED SUPPLEMENTARY INFORMATION
FOR THE YEAR ENDED JUNE 30, 2015
NOTE 1 – PURPOSE OF SCHEDULES
Budgetary Comparison Schedule
This schedule is required by GASB Statement No. 34 as required supplementary information (RSI) for the General
Fund and for each major special revenue fund that has a legally adopted annual budget. The budgetary
comparison schedule presents both (a) the original and (b) the final appropriated budgets for the reporting period
as well as (c) actual inflows, outflows, and balances, stated on the District’s budgetary basis. A separate column to
report the variance between the final budget and actual amounts is also presented, although not required.
Schedule of Funding Progress
This schedule is required by GASB Statement No. 45 for all sole and agent employers that provide other
postemployment benefits (OPEB). The schedule presents, for the most recent actuarial valuation and the two
preceding valuations, information about the funding progress of the plan, including, for each valuation, the
actuarial valuation date, the actuarial value of assets, the actuarial accrued liability, the total unfunded actuarial
liability (or funding excess), the actuarial value of assets as a percentage of the actuarial accrued liability (funded
ratio), the annual covered payroll, and the ratio of the total unfunded actuarial liability (or funding excess) to
annual covered payroll.
Schedule of the District’s Proportionate Share of the Net Pension Liability
This 10‐year schedule is required by GASB Statement No. 68 for each cost‐sharing pension plan. Until a full 10‐
year trend is compiled, the schedule will only show those years under which GASB Statement No. 68 was
applicable. The schedule presents the District’s proportion (percentage) of the collective net pension liability, the
District’s proportionate share (amount) of the collective net pension liability, the District’s covered‐employee
payroll, the District’s proportionate share (amount) of the collective net pension liability as a percentage of the
employer’s covered‐employee payroll, and the pension plan’s fiduciary net position as a percentage of the total
pension liability.
Schedule of District Contributions
This 10‐year schedule is required by GASB Statement No. 68 for each cost‐sharing pension plan. Until a full 10‐
year trend is compiled, the schedule will only show those years under which GASB Statement No. 68 was
applicable. The schedule presents the District’s statutorily or contractually required employer contribution, the
amount of contributions recognized by the pension plan in relation to the statutorily or contractually required
employer contribution, the difference between the statutorily or contractually required employer contribution and
the amount of contributions recognized by the pension plan in relation to the statutorily or contractually required
employer contribution, the District’s covered‐employee payroll, and the amount of contributions recognized by the
pension plan in relation to the statutorily or contractually required employer contribution as a percentage of the
District’s covered‐employee payroll.
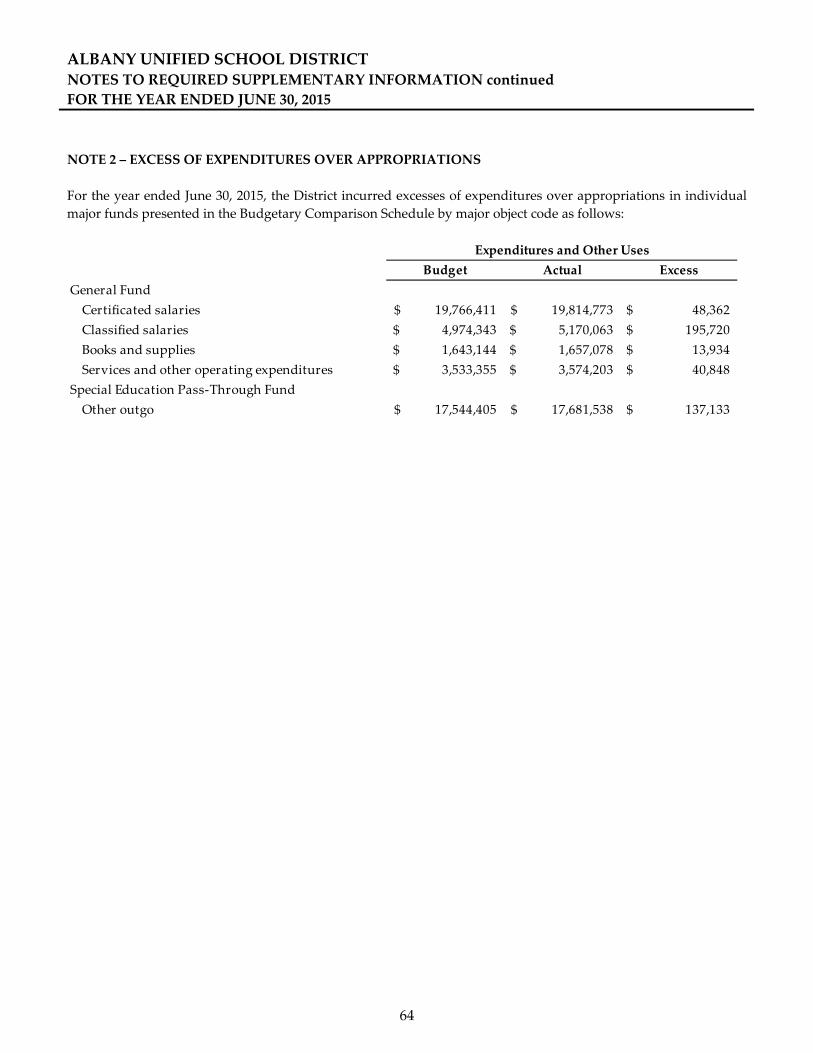
ALBANY UNIFIED SCHOOL DISTRICTNOTES TO REQUIRED SUPPLEMENTARY INFORMATION continued
FOR THE YEAR ENDED JUNE 30, 2015
64
NOTE 2 – EXCESS OF EXPENDITURES OVER APPROPRIATIONS
For the year ended June 30, 2015, the District incurred excesses of expenditures over appropriations in individual
major funds presented in the Budgetary Comparison Schedule by major object code as follows:
Budget Actual Excess
General Fund
Certificated salaries 19,766,411$ 19,814,773$ 48,362$
Classified salaries 4,974,343$ 5,170,063$ 195,720$
Books and supplies 1,643,144$ 1,657,078$ 13,934$
Services and other operating expenditures 3,533,355$ 3,574,203$ 40,848$
Special Education Pass‐Through Fund
Other outgo 17,544,405$ 17,681,538$ 137,133$
Expenditures and Other Uses

SUPPLEMENTARY
INFORMATION

ALBANY UNIFIED SCHOOL DISTRICT
See accompanying note to supplementary information.
65
SCHEDULE OF EXPENDITURES OF FEDERAL AWARDS
FOR THE YEAR ENDED JUNE 30, 2015
CFDA
Number
Pass‐Through Entity
Identifying Number
Federal
Expenditures
U. S. DEPARTMENT OF EDUCATION:
Passed through California Department of Education:
Title I, Part A, Basic Grants Low‐Income and Neglected 84.010 14329 243,070$
Title II, Part A, Teacher Quality 84.367A 14341 54,116
Title III Cluster
Title III, Limited English Proficient (LEP) Student Program 84.365 14346 86,903
Title III, Immigrant Education Program 84.365 15146 29,309
Subtotal Title III Cluster 116,212
Special Education Cluster
IDEA Basic Local Assistance Entitlement, Part B, Sec 611 84.027 13379 4,400,082
IDEA Mental Health Allocation Plan, Part B, Sec 611 84.027 14468 303,895
Part B, Preschool Grants 84.173 13430 112,942
IDEA Preschool Local Entitlement, Part B, Sec 611 84.027A 13682 208,172
Preschool Staff Development 84.173A 13431 1,197
Subtotal Special Education Cluster 5,026,288
IDEA Early Intervention Grants 84.181 23761 131,610
Total U. S. Department of Education 5,571,296
U. S. DEPARTMENT OF AGRICULTURE:
Passed through California Department of Education:
Child Nutrition Cluster
School Breakfast Program 10.553 13526 37,309
National School Lunch Program 10.555 13391 270,823
USDA Commodities 10.555 * 60,185
Subtotal Child Nutrition Cluster 368,317
Child and Adult Food Care Program 10.558 13393 85,758
Total U. S. Department of Agriculture 454,075
U. S. DEPARTMENT OF HEALTH AND HUMAN SERVICES:
Passed through California Department of Education:
Family Child Care 93.596 13609 287,484
Total U. S. Department of Health & Human Services 287,484
Total Federal Expenditures 6,312,855$
* ‐ Pass‐Through Entity Identifying Number not available or not applicable
Federal Grantor/Pass‐Through Grantor/Program or Cluster

ALBANY UNIFIED SCHOOL DISTRICT
See accompanying note to supplementary information.
66
SCHEDULE OF AVERAGE DAILY ATTENDANCE (ADA)
FOR THE YEAR ENDED JUNE 30, 2015
Second Second Period
Period Report After Annual
Report Audit Adjustments Report
SCHOOL DISTRICT
TK/K through Third
Regular ADA 1,138.24 1,138.24 1,135.35
Extended Year Special Education 2.08 2.08 2.52
Total TK/K through Third 1,140.32 1,140.32 1,137.87
Fourth through Sixth
Regular ADA 869.81 869.81 869.10
Extended Year Special Education 0.87 0.87 1.23
Special Education ‐ Nonpublic Schools 0.26 0.26 0.51
Total Fourth through Sixth 870.94 870.94 870.84
Seventh through Eighth
Regular ADA 557.06 557.06 557.52
Extended Year Special Education 0.41 0.41 0.57
Total Seventh through Eighth 557.47 557.47 558.09
Ninth through Twelfth
Regular ADA 1,186.58 1,183.81 1,176.21
Extended Year Special Education 1.08 1.08 1.36
Special Education ‐ Nonpublic Schools 3.04 3.04 2.62
Extended Year Special Education ‐ Nonpublic Schools 0.40 0.40 0.40
Total Ninth through Twelfth 1,191.10 1,188.33 1,180.59
TOTAL SCHOOL DISTRICT 3,759.83 3,757.06 3,747.39

ALBANY UNIFIED SCHOOL DISTRICT
See accompanying note to supplementary information.
67
SCHEDULE OF INSTRUCTIONAL TIME
FOR THE YEAR ENDED JUNE 30, 2015
Minutes 2014‐15
Minutes Requirement Actual Number
Grade Level Requirement Reduced Minutes of Days Status
Kindergarten 36,000 35,000 51,300 180 Complied
Grade 1 50,400 49,000 53,610 180 Complied
Grade 2 50,400 49,000 53,610 180 Complied
Grade 3 50,400 49,000 53,610 180 Complied
Grade 4 54,000 52,500 54,450 180 Complied
Grade 5 54,000 52,500 54,450 180 Complied
Grade 6 54,000 52,500 56,015 180 Complied
Grade 7 54,000 52,500 65,405 180 Complied
Grade 8 54,000 52,500 65,405 180 Complied
Grade 9 64,800 63,000 65,075 180 Complied
Grade 10 64,800 63,000 65,075 180 Complied
Grade 11 64,800 63,000 65,075 180 Complied
Grade 12 64,800 63,000 65,075 180 Complied

ALBANY UNIFIED SCHOOL DISTRICT
See accompanying note to supplementary information.
68
SCHEDULE OF FINANCIAL TRENDS AND ANALYSIS
FOR THE YEAR ENDED JUNE 30, 2015
2016 (Budget) 2015 2014 2013
General Fund ‐ Budgetary Basis**
Revenues And Other Financing Sources 42,919,787$ 40,034,326$ 38,261,120$ 35,707,001$
Expenditures And Other Financing Uses 41,015,904 41,352,664 38,413,532 34,562,885
Net change in Fund Balance 1,903,883$ (1,318,338)$ (152,412)$ 1,144,116$
Ending Fund Balance 8,933,067$ 7,029,184$ 8,347,522$ 8,499,934$
Available Reserves* 6,932,296$ 6,457,038$ 7,201,965$ 7,841,895$
Available Reserves As A
Percentage Of Outgo 16.90% 15.61% 18.75% 22.69%
Long‐term Debt 66,467,090$ 68,775,517$ 40,421,327$ 41,791,800$
Average Daily
Attendance At P‐2 3,749 3,757 3,734 3,680
The General Fund balance has decreased by $1,470,750 over the past two years. The fiscal year 2015‐16 budget
projects an increase of $1,903,883. For a District this size, the State recommends available reserves of at least 3% of
General Fund expenditures, transfers out, and other uses (total outgo).
The District has incurred operating deficits in two of the past three years and anticipates incurring an operating
surplus during the 2015‐16 fiscal year. Total long term obligations have increased by $26,983,717 over the past two
years.
Average daily attendance has increased by 77 ADA over the past two years. A slight decrease in ADA is
anticipated during the 2015‐16 fiscal year.
*Available reserves consist of all unassigned fund balance within the General Fund.
**The actual amounts reported in this schedule are for the General Fund only, and do not agree with the amounts
reported on the Statement of Revenues, Expenditures, and Changes in Fund Balances because the amounts on that
schedule include the financial activity of the Special Reserve Fund for Other Than Capital Outlay Projects and the
Special Reserve Fund for Postemployment Benefits, in accordance with the fund type definitions promulgated by
GASB Statement No. 54.
On behalf payments of $957,576 are not included in the actual revenues and expenditures reported in this schedule.

ALBANY UNIFIED SCHOOL DISTRICT
See accompanying note to supplementary information.
69
RECONCILIATION OF ANNUAL FINANCIAL AND BUDGET REPORT WITH AUDITED
FINANCIAL STATEMENTS
FOR THE YEAR ENDED JUNE 30, 2015
Special Reserve
Fund for Other
General Than Capital
Fund Outlay Projects
7,029,184$ 488,072$
Adjustments and reclassifications:
Increase (decrease) in total fund balances:
Fund balance transfer (GASB 54) 488,072 (488,072)
Net adjustments and reclassifications 488,072 (488,072)
7,517,256$ ‐$
June 30, 2015, annual financial and budget report fund balance
June 30, 2015, audited financial statement fund balance

ALBANY UNIFIED SCHOOL DISTRICT
See accompanying note to supplementary information.
70
SCHEDULE OF CHARTER SCHOOLS
FOR THE YEAR ENDED JUNE 30, 2015
The District did not sponsor any charter schools during the year ended June 30, 2015.

ALBANY UNIFIED SCHOOL DISTRICT
See accompanying note to supplementary information.
71
COMBINING BALANCE SHEET
JUNE 30, 2015
Adult Education
Fund
Child
Development
Fund Cafeteria Fund Building Fund
Capital Facilities
Fund
County School
Facilities Fund
Non‐Major
Governmental
Funds
ASSETS
Cash and cash equivalents 667$ 206,118$ 122,782$ 360,107$ 35,465$ 2,279,019$ 3,004,158$
Accounts receivable ‐ 91,638 83,598 200 25 1,499 176,960
Due from other funds ‐ ‐ ‐ 23,405 ‐ ‐ 23,405
Stores inventory ‐ ‐ 4,757 ‐ ‐ ‐ 4,757
Total Assets 667$ 297,756$ 211,137$ 383,712$ 35,490$ 2,280,518$ 3,209,280$
LIABILITIES
Accrued liabilities ‐$ 53,433$ 21,536$ 128,145$ 1,387$ 562,001$ 766,502$
Due to other funds 667 ‐ ‐ ‐ ‐ ‐ 667
Total Liabilities 667 53,433 21,536 128,145 1,387 562,001 767,169
FUND BALANCES
Non‐spendable ‐ ‐ 4,757 ‐ ‐ ‐ 4,757
Restricted ‐ ‐ 184,844 255,567 34,103 1,718,517 2,193,031
Assigned ‐ 244,323 ‐ ‐ ‐ ‐ 244,323
Total Fund Balances ‐ 244,323 189,601 255,567 34,103 1,718,517 2,442,111
Total Liabilities and Fund Balance 667$ 297,756$ 211,137$ 383,712$ 35,490$ 2,280,518$ 3,209,280$

ALBANY UNIFIED SCHOOL DISTRICT
See accompanying note to supplementary information.
72
COMBINING STATEMENT OF REVENUES, EXPENDITURES, AND CHANGES IN FUND BALANCES
FOR THE YEAR ENDED JUNE 30, 2015
Adult Education
Fund
Child
Development
Fund Cafeteria Fund Building Fund
Capital Facilities
Fund
County School
Facilities Fund
Non‐Major
Governmental
Funds
REVENUES
Federal sources ‐$ 366,757$ 374,802$ ‐$ ‐$ ‐$ 741,559$
Other state sources ‐ 593,638 22,204 ‐ ‐ ‐ 615,842
Other local sources ‐ 1,312,555 660,387 9,345 50,602 5,367 2,038,256
Total Revenues ‐ 2,272,950 1,057,393 9,345 50,602 5,367 3,395,657
EXPENDITURES
Current
Instruction ‐ 1,619,940 ‐ ‐ ‐ ‐ 1,619,940
Pupil services
Food services ‐ ‐ 1,003,334 ‐ ‐ ‐ 1,003,334
General administration
All other general administration ‐ 143,245 53,030 ‐ ‐ ‐ 196,275
Plant services ‐ 62,618 ‐ ‐ 42,956 ‐ 105,574
Facilities acquisition and maintenance ‐ ‐ ‐ 1,074,909 ‐ 1,361,392 2,436,301
Community services ‐ 434,530 ‐ ‐ ‐ ‐ 434,530
Total Expenditures ‐ 2,260,333 1,056,364 1,074,909 42,956 1,361,392 5,795,954
Excess (Deficiency) of Revenues
Over Expenditures ‐ 12,617 1,029 (1,065,564) 7,646 (1,356,025) (2,400,297)
Other Financing Sources (Uses)
Transfers in ‐ ‐ 2,319 ‐ ‐ ‐ 2,319
Net Financing Sources (Uses) ‐ ‐ 2,319 ‐ ‐ ‐ 2,319
NET CHANGE IN FUND BALANCE ‐ 12,617 3,348 (1,065,564) 7,646 (1,356,025) (2,397,978)
Fund Balance ‐ Beginning ‐ 231,706 186,253 1,321,131 26,457 3,074,542 4,840,089
Fund Balance ‐ Ending ‐$ 244,323$ 189,601$ 255,567$ 34,103$ 1,718,517$ 2,442,111$

ALBANY UNIFIED SCHOOL DISTRICT
73
NOTES TO SUPPLEMENTARY INFORMATION
JUNE 30, 2015
NOTE 1 – PURPOSE OF SCHEDULES
Schedule of Expenditures of Federal Awards
The accompanying Schedule of Expenditures of Federal Awards includes the Federal grant activity of the District
and is presented on the modified accrual basis of accounting. The information in this schedule is presented in
accordance with the requirements of the United States Office of Management and Budget Circular A‐133, Audits of
States, Local Governments, and Non‐Profit Organizations. Therefore, some amounts presented in this schedule may
differ from amounts presented in, or used in the preparation of, the financial statements.
The District passes through certain Federal assistance received to other governments (subrecipients). The
subrecipient agencies have certain compliance responsibilities related to administering these Federal programs.
Under Circular A‐133, the District is responsible for monitoring subrecipients to help assure that Federal awards
are used for authorized purposes in compliance with laws, regulations, and the provisions of contracts or grant
agreements, and that performance goals are achieved.
The following schedule provides the amounts passed‐through to subrecipients included in the Schedule of
Expenditures of Federal Awards:
. Amounts
CFDA Provided to
Program Name Number Subrecipients
Special Education Cluster:
IDEA Basic Local Assistance Entitlement, Part B, Sec 611 84.027 3,829,819$
Part B, Preschool Grants 84.173 99,236
IDEA Preschool Local Entitlement, Part B, Sec 611 84.027A 183,612
IDEA Mental Health Allocation Plan, Part B, Sec 611 84.027 255,508
IDEA Early Intervention Grants 106,610
4,474,785$
Schedule of Average Daily Attendance (ADA)
Average daily attendance (ADA) is a measurement of the number of pupils attending classes of the District. The
purpose of attendance accounting from a fiscal standpoint is to provide the basis on which apportionments of state
funds are made to school districts. This schedule provides information regarding the attendance of students at
various grade levels and in different programs.
Schedule of Instructional Time
This schedule presents information on the amount of instructional time offered by the District and whether the
District complied with the provisions of Education Code Sections 46200 through 46208. During the year ended June
30, 2015, the District participated in the Longer Day incentive funding program. As of June 30, 2015, the District
had not yet met its target funding. Through 2014‐15, the instructional day and minute requirements have been
reduced pursuant to Education Code Section 46201.2.
ALBANY UNIFIED SCHOOL DISTRICTNOTES TO SUPPLEMENTARY INFORMATION continued
JUNE 30, 2015
74
Schedule of Financial Trends and Analysis
This schedule discloses the Districtʹs financial trends by displaying past yearsʹ data along with current year budget
information. These financial trend disclosures are used to evaluate the Districtʹs ability to continue as a going
concern for a reasonable period of time.
Reconciliation of Annual Financial and Budget Report with Audited Financial Statements
This schedule provides the information necessary to reconcile the fund balance of all funds reported on the Annual
Financial and Budget Report Unaudited Actuals to the audited financial statements.
Schedule of Charter Schools
This schedule lists all Charter Schools chartered by the District, and displays information for each Charter School
on whether or not the Charter School is included in the District audit.
Combining Statements – Non‐Major Funds
These statements provide information on the District’s non‐major funds.
Local Education Agency Organization Structure
This schedule provides information about the Districtʹs boundaries and schools operated, members of the
governing board, and members of the administration. (Located in the front of the audit report)

OTHER INDEPENDENT
AUDITORS’ REPORTS
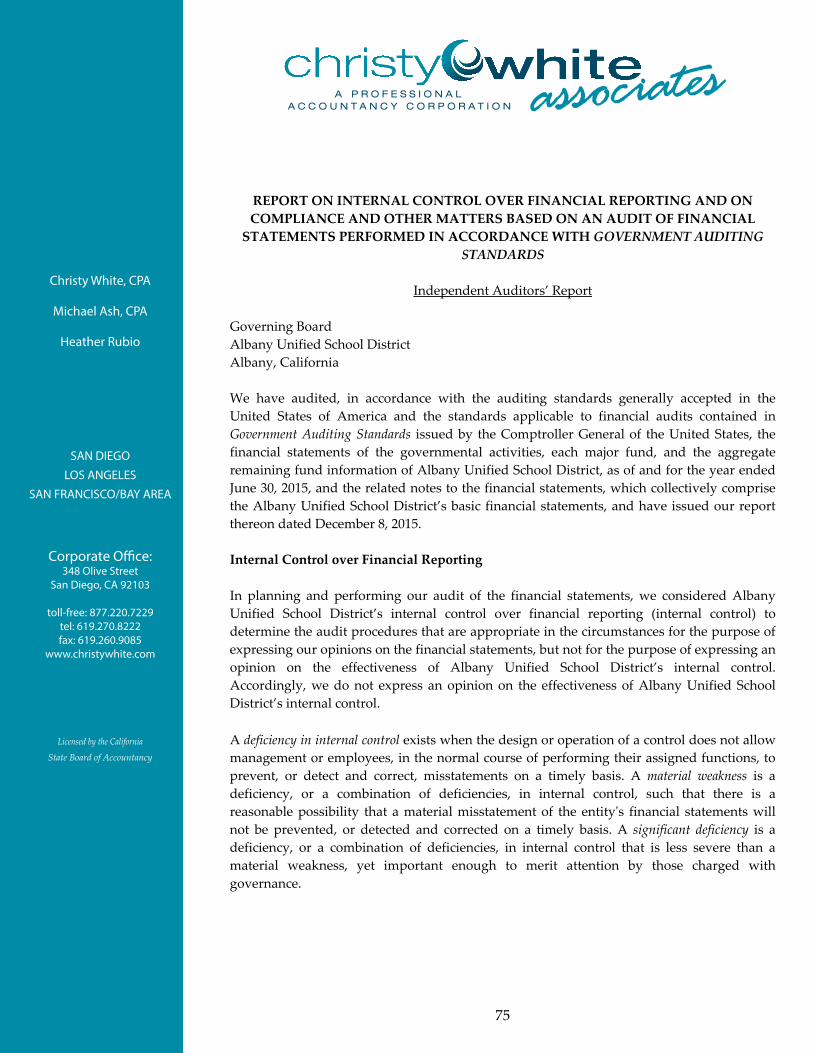
Corporate O�ce:348 Olive Street
San Diego, CA 92103
toll-free: 877.220.7229tel: 619.270.8222fax: 619.260.9085
www.christywhite.com
Christy White, CPA
Michael Ash, CPA
Heather Rubio
SAN DIEGO
LOS ANGELES
SAN FRANCISCO/BAY AREA
75
REPORT ON INTERNAL CONTROL OVER FINANCIAL REPORTING AND ON
COMPLIANCE AND OTHER MATTERS BASED ON AN AUDIT OF FINANCIAL
STATEMENTS PERFORMED IN ACCORDANCE WITH GOVERNMENT AUDITING
STANDARDS
Independent Auditors’ Report
Governing Board
Albany Unified School District
Albany, California
We have audited, in accordance with the auditing standards generally accepted in the
United States of America and the standards applicable to financial audits contained in
Government Auditing Standards issued by the Comptroller General of the United States, the
financial statements of the governmental activities, each major fund, and the aggregate
remaining fund information of Albany Unified School District, as of and for the year ended
June 30, 2015, and the related notes to the financial statements, which collectively comprise
the Albany Unified School District’s basic financial statements, and have issued our report
thereon dated December 8, 2015.
Internal Control over Financial Reporting
In planning and performing our audit of the financial statements, we considered Albany
Unified School District’s internal control over financial reporting (internal control) to
determine the audit procedures that are appropriate in the circumstances for the purpose of
expressing our opinions on the financial statements, but not for the purpose of expressing an
opinion on the effectiveness of Albany Unified School District’s internal control.
Accordingly, we do not express an opinion on the effectiveness of Albany Unified School
District’s internal control.
A deficiency in internal control exists when the design or operation of a control does not allow
management or employees, in the normal course of performing their assigned functions, to
prevent, or detect and correct, misstatements on a timely basis. A material weakness is a
deficiency, or a combination of deficiencies, in internal control, such that there is a
reasonable possibility that a material misstatement of the entityʹs financial statements will
not be prevented, or detected and corrected on a timely basis. A significant deficiency is a
deficiency, or a combination of deficiencies, in internal control that is less severe than a
material weakness, yet important enough to merit attention by those charged with
governance.

76
Our consideration of internal control was for the limited purpose described in the first paragraph of this section
and was not designed to identify all deficiencies in internal control that might be material weaknesses or significant
deficiencies. Given these limitations, during our audit we did not identify any deficiencies in internal control that
we consider to be material weaknesses. However, material weaknesses may exist that have not been identified.
Compliance and Other Matters
As part of obtaining reasonable assurance about whether Albany Unified School Districtʹs financial statements are
free of material misstatement, we performed tests of its compliance with certain provisions of laws, regulations,
contracts, and grant agreements, noncompliance with which could have a direct and material effect on the
determination of financial statement amounts. However, providing an opinion on compliance with those
provisions was not an objective of our audit, and accordingly, we do not express such an opinion. The results of
our tests disclosed no instances of noncompliance or other matters that are required to be reported under
Government Auditing Standards.
Purpose of this Report
The purpose of this report is solely to describe the scope of our testing of internal control and compliance and the
results of that testing, and not to provide an opinion on the effectiveness of the entityʹs internal control or on
compliance. This report is an integral part of an audit performed in accordance with Government Auditing Standards
in considering the entityʹs internal control and compliance. Accordingly, this communication is not suitable for any
other purpose.
San Diego, California
December 8, 2015

Corporate O�ce:348 Olive Street
San Diego, CA 92103
toll-free: 877.220.7229tel: 619.270.8222fax: 619.260.9085
www.christywhite.com
Christy White, CPA
Michael Ash, CPA
Heather Rubio
SAN DIEGO
LOS ANGELES
SAN FRANCISCO/BAY AREA
77
REPORT ON COMPLIANCE FOR EACH MAJOR FEDERAL PROGRAM; AND REPORT
ON INTERNAL CONTROL OVER COMPLIANCE REQUIRED BY OMB CIRCULAR A‐
133
Independent Auditors’ Report
Governing Board
Albany Unified School District
Albany, California
Report on Compliance for Each Major Federal Program
We have audited Albany Unified School District’s compliance with the types of compliance
requirements described in the OMB Circular A‐133 Compliance Supplement that could have a
direct and material effect on each of Albany Unified School District’s major federal programs
for the year ended June 30, 2015. Albany Unified School Districtʹs major federal programs
are identified in the summary of auditorʹs results section of the accompanying schedule of
findings and questioned costs.
Management’s Responsibility
Management is responsible for compliance with the requirements of laws, regulations,
contracts, and grants applicable to its federal programs.
Auditor’s Responsibility
Our responsibility is to express an opinion on compliance for each of Albany Unified School
Districtʹs major federal programs based on our audit of the types of compliance
requirements referred to above. We conducted our audit of compliance in accordance with
auditing standards generally accepted in the United States of America; the standards
applicable to financial audits contained in Government Auditing Standards, issued by the
Comptroller General of the United States; and OMB Circular A‐133, Audits of States, Local
Governments, and Non‐Profit Organizations. Those standards and OMB Circular A‐133 require
that we plan and perform the audit to obtain reasonable assurance about whether
noncompliance with the types of compliance requirements referred to above that could have
a direct and material effect on a major federal program occurred. An audit includes
examining, on a test basis, evidence about Albany Unified School Districtʹs compliance with
those requirements and performing such other procedures as we considered necessary in the
circumstances.
78
We believe that our audit provides a reasonable basis for our opinion on compliance for each major federal
program. However, our audit does not provide a legal determination of Albany Unified School Districtʹs
compliance.
Opinion on Each Major Federal Program
In our opinion, Albany Unified School District complied, in all material respects, with the types of compliance
requirements referred to above that could have a direct and material effect on each of its major federal programs
for the year ended June 30, 2015.
Report on Internal Control Over Compliance
Management of Albany Unified School District is responsible for establishing and maintaining effective internal
control over compliance with the types of compliance requirements referred to above. In planning and performing
our audit of compliance, we considered Albany Unified School District’s internal control over compliance with the
types of requirements that could have a direct and material effect on each major federal program to determine the
auditing procedures that are appropriate in the circumstances for the purpose of expressing an opinion on
compliance for each major federal program and to test and report on internal control over compliance in
accordance with OMB Circular A‐133, but not for the purpose of expressing an opinion on the effectiveness of
internal control over compliance. Accordingly, we do not express an opinion on the effectiveness of Albany Unified
School District’s internal control over compliance.
A deficiency in internal control over compliance exists when the design or operation of a control over compliance does
not allow management or employees, in the normal course of performing their assigned functions, to prevent, or
detect and correct, noncompliance with a type of compliance requirement of a federal program on a timely basis. A
material weakness in internal control over compliance is a deficiency, or combination of deficiencies, in internal control
over compliance, such that there is a reasonable possibility that material noncompliance with a type of compliance
requirement of a federal program will not be prevented, or detected and corrected, on a timely basis. A significant
deficiency in internal control over compliance is a deficiency, or a combination of deficiencies, in internal control over
compliance with a type of compliance requirement of a federal program that is less severe than a material
weakness in internal control over compliance, yet important enough to merit attention by those charged with
governance.
Our consideration of internal control over compliance was for the limited purpose described in the first paragraph
of this section and was not designed to identify all deficiencies in internal control over compliance that might be
material weaknesses or significant deficiencies. We did not identify any deficiencies in internal control over
compliance that we consider to be material weaknesses. However, material weaknesses may exist that have not
been identified.
The purpose of this report on internal control over compliance is solely to describe the scope of our testing of
internal control over compliance and the results of that testing based on the requirements of OMB Circular A‐133.
Accordingly, this report is not suitable for any other purpose.
San Diego, California
December 8, 2015

Corporate O�ce:348 Olive Street
San Diego, CA 92103
toll-free: 877.220.7229tel: 619.270.8222fax: 619.260.9085
www.christywhite.com
Christy White, CPA
Michael Ash, CPA
Heather Rubio
SAN DIEGO
LOS ANGELES
SAN FRANCISCO/BAY AREA
79
REPORT ON STATE COMPLIANCE
Independent Auditors’ Report
Governing Board
Albany Unified School District
Albany, California
Report on State Compliance
We have audited Albany Unified School District’s compliance with the types of compliance
requirements described in the 2014‐15 Guide for Annual Audits of K‐12 Local Education
Agencies and State Compliance Reporting, issued by the California Education Audit Appeals
Panel that could have a direct and material effect on each of Albany Unified School District’s
state programs for the fiscal year ended June 30, 2015, as identified below.
Management’s Responsibility
Management is responsible for compliance with the requirements of laws, regulations,
contracts, and grants applicable to its state programs.
Auditor’s Responsibility
Our responsibility is to express an opinion on compliance for each of Albany Unified School
Districtʹs state programs based on our audit of the types of compliance requirements
referred to above. We conducted our audit of compliance in accordance with auditing
standards generally accepted in the United States of America; the standards applicable to
financial audits contained in Government Auditing Standards, issued by the Comptroller
General of the United States; and the 2014‐15 Guide for Annual Audits of K‐12 Local Education
Agencies and State Compliance Reporting, issued by the California Education Audit Appeals
Panel as regulations. Those standards require that we plan and perform the audit to obtain
reasonable assurance about whether noncompliance with the types of compliance
requirements referred to above that could have a direct and material effect on the state
programs noted below occurred. An audit includes examining, on a test basis, evidence
about Albany Unified School Districtʹs compliance with those requirements and performing
such other procedures as we considered necessary in the circumstances.
We believe that our audit provides a reasonable basis for our opinion on compliance with
the requirements referred to above. However, our audit does not provide a legal
determination of Albany Unified School Districtʹs compliance with those requirements.

80
Opinion on State Compliance
In our opinion, Albany Unified School District complied, in all material respects, with the types of compliance
requirements referred to above that are applicable to the state programs noted in the table below for the year ended
June 30, 2015.
Other Matters
The results of our auditing procedures disclosed instances of noncompliance, which are described in the
accompanying schedule of findings and questioned costs as items #2015‐1, #2015‐2, #2015‐3. Our opinion on state
compliance is not modified with respect to these matters.
Albany Unified School District’s response to the noncompliance findings identified in our audit are described in
the accompanying schedule of findings and questioned costs and corrective action plan. Albany Unified School
District’s response was not subjected to the auditing procedures applied in the audit of compliance and,
accordingly, we express no opinion on the response.
Procedures Performed
In connection with the audit referred to above, we selected and tested transactions and records to determine
Albany Unified School Districtʹs compliance with the state laws and regulations applicable to the following items:
PROGRAM NAME
PROCEDURES
PERFORMED
Attendance Yes
Teacher Certification and Misassignments Yes
Kindergarten Continuance Yes
Independent Study Not Applicable
Continuation Education No
Instructional Time for school districts Yes
Instructional Materials, general requirements Yes
Ratios of Administrative Employees to Teachers Yes
Classroom Teacher Salaries Yes
Early Retirement Incentive Not Applicable
Gann Limit Calculation Yes
School Accountability Report Card Yes
Juvenile Court Schools Not Applicable
Middle or Early College High Schools Not Applicable
K‐3 Grade Span Adjustment Yes
Transportation Maintenance of Effort Yes
Regional Occupation Centers or Programs Maintenance of Effort Yes
Adult Education Maintenance of Effort Not Applicable
California Clean Energy Jobs Act Yes

81
PROGRAM NAME
PROCEDURES
PERFORMED
After School Education and Safety Program Not Applicable
Proper Expenditure of Education Protection Account Funds Yes
Common Core Implementation Funds Yes
Unduplicated Local Control Funding Formula Pupil Counts Yes
Local Control and Accountability Plan Yes
Attendance; for charter schools Not Applicable
Mode of Instruction; for charter schools Not Applicable
Nonclassroom‐Based Instruction/Independent Study;
for charter schools Not Applicable
Determination of Funding for Nonclassroom‐Based
Instruction; for charter schools Not Applicable
Annual Instructional Minutes – Classroom Based; for
charter schools Not Applicable
Charter School Facility Grant Program Not Applicable
We did not perform testing for Continuation Education, because it did not meet the threshold required for testing.
San Diego, California
December 8, 2015

SCHEDULE OF FINDINGS
AND QUESTIONED COSTS

ALBANY UNIFIED SCHOOL DISTRICT
82
SUMMARY OF AUDITORS’ RESULTS
FOR THE YEAR ENDED JUNE 30, 2015
FINANCIAL STATEMENTS
Type of auditorsʹ report issued: Unmodified
Internal control over financial reporting:
Material weakness(es) identified? No
Significant deficiency(ies) identified? None Reported
Non‐compliance material to financial statements noted? No
FEDERAL AWARDS
Internal control over major program:
Material weakness(es) identified? No
Significant deficiency(ies) identified? None Reported
Type of auditorsʹ report issued: Unmodified
Any audit findings disclosed that are required to be reported in accordance
with section .510(a) of OMB Circular A‐133? No
Identification of major programs:
CFDA Number(s) Name of Federal Program of Cluster
84.027, 84.173, 84.027A, 84.073A Special Education Cluster
10.553, 10.555 Child Nutrition Cluster
Dollar threshold used to distinguish between Type A and Type B programs: 300,000$
Auditee qualified as low‐risk auditee? No
STATE AWARDS
Internal control over state programs:
Material weaknesses identified? No
Significant deficiency(ies) identified? Yes
Type of auditorsʹ report issued on compliance for state programs: Unmodified

ALBANY UNIFIED SCHOOL DISTRICT
83
FINANCIAL STATEMENT FINDINGS
FOR THE YEAR ENDED JUNE 30, 2015
FIVE DIGIT CODE AB 3627 FINDING TYPE
20000
30000
Inventory of Equipment
Internal Control
There were no financial statement findings for the year ended June 30, 2015.

ALBANY UNIFIED SCHOOL DISTRICT
84
FEDERAL AWARD FINDINGS AND QUESTIONED COSTS
FOR THE YEAR ENDED JUNE 30, 2015
FIVE DIGIT CODE AB 3627 FINDING TYPE
50000
Federal Compliance
There were no federal award findings and questioned costs for the year ended June 30, 2015.

ALBANY UNIFIED SCHOOL DISTRICT
85
STATE AWARD FINDINGS AND QUESTIONED COSTS
FOR THE YEAR ENDED JUNE 30, 2015
FIVE DIGIT CODE AB 3627 FINDING TYPE
10000 Attendance
40000
41000
60000
State Compliance
CalSTRS
Miscellaneous
61000 Classroom Teacher Salaries
62000 Local Control Accountability Plan
70000 Instructional Materials
71000 Teacher Misassignments
72000 School Accountability Report Card
FINDING #2015‐1 – UNDUPLICATED LOCAL CONTROL FUNDING FORMULA PUPIL COUNTS (40000)
Criteria: Students classified as free or reduced price meal eligible (FRPM) and who are not directly certified on the
CALPADS 1.18 FRPM/English Learner/Foster Youth – Student List Report must have supporting documentation
that indicates the student was eligible for the determination. Auditors are required to verify compliance with
Education Code Section 42238.02(b)(3)(b) in Section W of the 2014‐15 Guide for Annual Audits of K‐12 Local Education
Agencies and State Compliance Reporting.
Condition: 15 of 60 students tested from the CALPADS 1.18 FRPM/English Learner/Foster Youth – Student List
Report who were classified as FRPM did not have proper supporting documentation to support their designation.
When this error rate was extrapolated to the total FRPM population of 319, it totaled 80 ineligible students.
Cause: Incorrect classification of students.
Effect: The District is not in compliance with State requirements.
Context: 80 of 2,576 (1,305 in 2013‐14 and 1,271 in 2014‐15) students reported in the District’s Unduplicated Pupil
Count did not have proper supporting documentation to support their FRPM designation.

ALBANY UNIFIED SCHOOL DISTRICTSTATE AWARD FINDINGS AND QUESTIONED COSTS, continued
FOR THE YEAR ENDED JUNE 30, 2015
86
FINDING #2015‐1 – UNDUPLICATED LOCAL CONTROL FUNDING FORMULA PUPIL COUNTS (40000)
(continued)
Questioned Cost: $18,497, as calculated below.
LCFF Target Base Grant Amount and Pupil Counts
1) Total Base Grant Amount(1)
Section 1: UPP Section 2: UPP
2) Total Enrollment Count from Unduplicated Pupil Percentage Exhibit(2)7,762 7,720
3) Unduplicated Pupil Count from Unduplicated Pupil Percentage Exhibit(3)2,542 2,576
Unduplicated Pupil Percentage Adjustment
4) Unduplicated Pupil Count 2,542 2,576
5) Number of Unduplicated Pupil Count Adjustment (plus or minus)(4)(80) (80)
6) Adjusted Unduplicated Pupil Count 2,462 2,496
7) Unduplicated Pupil Percentage calculated at P-2 0.3275 0.3337
8) Adjusted Unduplicated Pupil Percentage 0.3172 0.3233
9) Funded UPP (Greater of Section 1 or 2) 0.3233
Target Supplemental Audit Adjustment
10) Target supplemental grant funding calculated at P-2 - 1,967,875
11) Adjusted target supplemental grant funding - 1,906,545
12) Target supplemental audit adjustment - (61,330)
Target Concentration Audit Adjustment
13) Target Concentration grant funding calculated at P-2 - -
14) Adjusted target concentration grant funding - -
15) Target concentration audit adjustment - -
Value of Adjustment in Current Year
16) Total target supplemental and concentration audit adjustment - (61,330)
17) Statewide gap funding rate 0.3016000000 0.3016000000
18) Estimated value of unduplicated pupil count audit adjustment for 2014-15 - (18,497)
29,485,689
Recommendation: We recommend that the District ensure that all students listed as FRPM in the CALPADS 1.18
FRPM/English Learner/Foster Youth – Student List Report have proper documentation to support their CALPADS
designation.
District Response: The District will conduct periodical audits prior to the certification of CALPADS to ensure
compliance with the Unduplicated Local Control Funding Formula Pupil Counts.

ALBANY UNIFIED SCHOOL DISTRICTSTATE AWARD FINDINGS AND QUESTIONED COSTS, continued
FOR THE YEAR ENDED JUNE 30, 2015
87
FINDING 2015‐2: ATTENDANCE REPORTING (10000)
Criteria: The P‐2 Attendance Report should tie to supporting documentation per Education Code Section 41601.
Auditors are required to verify compliance in the 2014‐15 Guide for Annual Audits of K‐12 Local Education Agencies
and State Compliance Reporting.
Condition: The District’s P‐2 Attendance Report did not match supporting documentation.
Context: Review of the District’s P‐2 Attendance Report.
Cause: Discrepancy was due to clerical errors.
Effect: Misstatement of ADA on the P‐2 attendance report.
ADA Impact: The District’s P‐2 Report was overstated by 2.77 ADA for Grades 9‐12.
Questioned Cost: The District’s base grant ADA rate for grades 9‐12 is $8,712. Therefore, the overstatement of 2.77
ADA results in an estimated questioned cost of $24,132.
Recommendation: We recommend implementation of internal controls to ensure accuracy of attendance reporting.
District Response: The District will have staff attend the CASBO Pupil Attendance Accounting workshop. The
District will also add a review by the Budget Analyst prior to the certification and submittal of the attendance
reports to the Alameda County Office of Education.

ALBANY UNIFIED SCHOOL DISTRICTSTATE AWARD FINDINGS AND QUESTIONED COSTS, continued
FOR THE YEAR ENDED JUNE 30, 2015
88
FINDING 2015‐3: INSTRUCTIONAL MATERIALS PUBLIC HEARING (70000)
Criteria: Pursuant to Education Code 60119, the District is required to hold a public hearing regarding the
sufficiency of textbooks or other instructional materials on or before the end of the eighth week from the first day
pupils attended school for that year.
Condition: The District was found to be out of compliance with regard to when the public hearing for instructional
materials was held. The District held the hearing on October 28, 2014, while the first day of school was August 26,
2014. The meeting was after the end of the eighth week from the first day pupils attended school for that year
Cause: Oversight by District staff to be in compliance with state regulations regarding IMFRP hearing.
Effect: A public hearing, as required by Education Code, was not held on or before the end of the eighth week
from the first day pupils attended school for that year.
Questioned Cost: None. Based on an LEA advisory from the California State Controller dated October 1, 2014, the
requirements are verified for compliance only and a finding does not result in disallowance of funds.
Recommendation: We recommend the District properly monitor and oversee employees responsible for making
sure the public hearing is held at a time that encourages attendance according to Education Code 60119.
District Response: The District will add this public hearing requirement to the annual Board Governance Calendar
with notations about deadlines for each step in this process to ensure compliance.

ALBANY UNIFIED SCHOOL DISTRICT
89
SUMMARY SCHEDULE OF PRIOR AUDIT FINDINGS
FOR THE YEAR ENDED JUNE 30, 2015
FINDING #2014‐1: ALLOWABLE COSTS PRINCIPLES – DOCUMENTATION OF EMPLOYEE TIME AND EFFORT (5000)
Criteria: OMB Circular A‐87 requires that when federal funds are expended employees charged to the program document their time and effort to support
the charges. When the employee is paid from a single program or cost objective, the documentation must be completed periodically (at least semi‐
annually). When the employee is paid from multiple programs or cost objectives the documentation must be completed monthly. Documentation under
both methods must be an after‐the‐fact certification or actual effort expended.
Condition: In our review of employees charged to the Title I and Special Education programs we noted that all employees tested that were funded under
multiple cost objectives had on file a Semi‐Annual Certification rather than the required monthly personnel activity report (PARS) in accordance with OMB
Circular A‐87 for employees charged to the programs.
Questioned Costs: 84.010 Title I (2013‐14 Grant) ‐ $126,030; 84.027 and 84.173 – Special Education (2013‐14 Grant) ‐ $66,654; Total Questioned Costs ‐
$192,684
Cause: Individuals charged with responsibility for obtaining certifications to document employee time and effort did not understand the requirements of
OMB Circular A‐87. In addition, the district did not have an procedure in place to ensure that the required documentation was obtained for all employees
charged to federal programs.
Effect: The District did not comply with the requirements of OMG Circular A‐87 with regards to employees.
Recommendation: Implement procedures to ensure that all employees charged to federal programs are documented in accordance with OMB Circular A‐
87. Provide training to employees to ensure procedures are understood and followed. Implement review procedures to ensure documentation is completed
correctly and timely.
District Response: The District has reviewed the California School Accounting Manual and is working with the Alameda County Office of Education to
develop a process for Employee Time and Effort Documentation Reporting. A compliant Personnel Activity Report (PARS) will be implemented.
Current Status: Implemented.

ALBANY UNIFIED SCHOOL DISTRICTSUMMARY SCHEDULE OF PRIOR AUDIT FINDINGS, continued
FOR THE YEAR ENDED JUNE 30, 2015
90
FINDING #2014‐2: ATTENDANCE (10000)
Criteria: Determine that class attendance rosters are being signed, dated, and retained in a timely manner as proper verification of pupil attendance based
on the guidelines and provisions under Education Code Sections 46000 and 46303.
Condition: In review of class rosters at Albany Middle School for the period February 10 through March 7, 2014 which was the seventh month of
attendance, we noted that teachers were signing their rosters months after the period ended as approval for month seven attendance verification. It appears
that the attendance is not being verified and approved on a timely basis. Weekly/monthly attendance should be signed, verified, and dated immediately
after the end of each attendance month. Based on our review, we determined there are no questioned costs or loss of attendance to be identified as all
teacher rosters were approved prior to the fiscal year‐end; however, procedures need to be implemented to ensure teachers are verifying pupil attendance
on a timely basis.
Questioned Costs: None
Recommendation: Implement procedures to ensure teacher class rosters at Albany Middle School are verified, signed, and dated on a timely basis. All class
rosters should be signed, dated, and verified immediately after the end of each attendance period in a timely manner.
District Response: All applicable employees will be notified of the finding. The District will review current processes and update applicable employees as
necessary. Training will be provided as deemed necessary.
Current Status: Implemented.