alberta energy 2016 - 2017 annual report web version final · ii 201617 energy annual report aer...
TRANSCRIPT

Energy
Annual Report2016‑2017

Note to Readers: Copies of the annual report are available on the Energy website www.energy.alberta.ca
EnergyCommunications9945 ‑ 108 Street Edmonton, AB T5K 2G6
Phone: 780‑427‑8050
Fax: 780‑422‑1123
JUNE 2017
ISSN 1703‑4574 (PRINT)
ISSN 1703‑4582 (ONLINE)

2016-17 Energy Annual Report i
Acronyms and Notations ii
Preface 1
Minister’s Accountability Statement 2
Message from the Minister 3
Management’s Responsibility for Reporting 5
Results Analysis 7Ministry Overview 8
Non-Renewable Resource Revenue 11
Ministry Expenditure Highlights 27
Significant Changes 28
Outcome One 30
Outcome Two 40
Outcome Three 50
Appendix A: Energy Highlights 61
Appendix B: Performance Measure Methodologies 63
Financial Information 67Ministry of Energy 69
Department of Energy 99
Alberta Energy Regulator 123
Alberta Utilities Commission 143
Alberta Petroleum Marketing Commission 159
Post-closure Stewardship Fund 179
Balancing Pool 187
Statutory Reports 221
Other Information 222
Energy
Annual Report2016‑2017

2016-17 Energy Annual Reportii
AER Alberta Energy Regulator
AESO Alberta Electric System Operator
AMI Alberta Mineral Information
APMC Alberta Petroleum Marketing Commission
ARF Alberta Royalty Framework
ARP Alberta Natural Gas Reference Price
AUC Alberta Utilities Commission
bbl Barrel
bbl/d Barrels per day
Bcf/d Billion cubic feet per day
BP Balancing Pool
CARS2 Corporate Accounting and Reporting System
CBM Coalbed Methane
Cdn$ Canadian Dollar
Cf Cubic foot
COO Crude Oil Operations
EDAC Economic Development Advisory Committee
EFT Electronic File Transfer
EORP Enhanced Oil Recovery Program
ER&T Emerging Resources and Technologies Initiative
ETS Electronic Transfer System
FIS Field Surveillance Inspection System
GJ Gigajoule
ha Hectare
IEEP Incremental Ethane Extraction Program
Acronyms and Notations
IETP Innovative Energy Technologies Program
IMAGIS Integrated Management Alberta Government Information System
IRMS Integrated Resource Management System
LAMAS Land Automated Mineral Agreement System
MIM Metallic and Industrial Minerals
MINRS Metallic and Industrial Minerals Royalty Revenues
MRF Modernized Royalty Framework
MRIS Mineral Revenues Information System
MW Megawatt
NGDDP Natural Gas Deep Drilling Program
OASIS Oil Sands Administrative and Strategic Information System
OPEC Organization of the Petroleum Exporting Countries
OWA Orphan Well Association
PPA Power Purchase Agreement
RAM Royalty and Marketing System
RRO Regulated Rate Option
SCO Synthetic Crude Oil
Tcf Trillion cubic feet
TCPL TransCanada PipeLines Limited
US$ United States Dollar
WCS Western Canadian Select
WTI West Texas Intermediate

2016-17 Energy Annual Report 1
Preface
The Public Accounts of Alberta are prepared in accordance with the Financial Administration Act and the Fiscal Planning and Transparency Act. The Public Accounts consist of the annual report of the Government of Alberta and the annual reports of each of the 21 ministries.
The annual report of the Government of Alberta contains ministers’ accountability statements, the consolidated financial statements of the province and Measuring Up report, which compares actual performance results to desired results set out in the government’s strategic plan.
This annual report of the Ministry of Energy contains the minister’s accountability statement, the audited consolidated financial statements of the ministry and a comparison of actual performance results to desired results set out in the ministry business plan. This ministry annual report also includes:
• the financial statements of entities making up the ministry including the Department of Energy, the Alberta Energy Regulator, the Alberta Utilities Commission, the Alberta Petroleum Marketing Commission, the Post‑closure Stewardship Fund, and the Balancing Pool;
• other financial information as required by the Financial Administration Act and Fiscal Planning and Transparency Act, either as separate reports or as a part of the financial statements, to the extent that the ministry has anything to report; and
• financial information relating to trust funds.

2016-17 Energy Annual Report2
Minister’s Accountability Statement
The ministry’s annual report for the year ended March 31, 2017, was prepared under my direction in accordance with the Fiscal Planning and Transparency Act and the government’s accounting policies. All of the government’s policy decisions as at June 19, 2017 with material economic or fiscal implications of which I am aware have been considered in the preparation of this report.
Original signed by Honourable Margaret McCuaig‑BoydMinister of Energy

2016-17 Energy Annual Report 3
Alberta is a province rich in energy and our government is committed to ensuring the development of these resources benefits all Albertans.
Whether it is the oil sands across the north or wind power in the southern foothills, solar panels soaking up our prairie sun or drilling for natural gas in different parts of Alberta — not many places have a diversity of energy resources like we do. In 2016‑17, we fully committed to moving forward and taking action to make the most of all these resources while also acting to protect the environment.
This was an unprecedented year for our energy industry as wildfires struck across the Wood Buffalo region forcing the largest evacuation in our history as tens of thousands of people fled from Fort McMurray, and the surrounding oil sands facilities and work camps. I wish to thank the many
companies operating our oil sands for the assistance they provided to the people and government. Whether sheltering evacuees, helping fly them out or ensuring people had jobs to come back to, our oil sands operators were a bright spot in what became Canada’s largest natural disaster ever.
When it comes to our priorities and the work done by the Ministry of Energy, the story is more positive.
Guided by our Climate Leadership Plan, we began work to transition our electricity industry to a more sustainable, greener system with stable prices for homeowners and businesses. We began the process to move to a capacity market system for electricity; we announced plans to cap the regulated rate option price at 6.8 cents per kilowatt hour, and continued the process to phase out coal pollution from our electricity sector in favour of greener sources.
Our 30‑30 goal will see Alberta have 30 per cent renewable electricity by 2030 backstopped by strong natural gas‑fired generation. Late in the fiscal year we began this process with the Alberta Electric System Operator, who opened the first auction in the Renewable Electricity Program and I look forward to reporting on the results at this time next year. We also took steps to examine how micro‑generation can be increased in Alberta. This will help homeowners, community groups, farmers and others make decisions on their own power needs and move towards renewable options that work for them.
We anticipate these changes to our electricity system will draw significant new private sector investment and jobs for Albertans as well as position our system for a greener and more sustainable future.
In November, the prime minister credited our Climate Leadership Plan as a key factor in federal approvals of the Trans Mountain Pipeline Expansion and the Enbridge Line 3 replacement project. This was a major turning point for our oil and gas sector and came as resource prices have begun a moderate recovery from the depressed prices of the previous two years. There is still work to be done before oil flows through either of these pipelines and our government has committed to continue advocating for greater market access for our resources, including in court if necessary. Getting a Canadian pipeline to Canadian tidewater will remain a strong focus for our government in 2017 and beyond.
Message from the Minister

2016-17 Energy Annual Report4
In 2016‑17, we continued to implement recommendations from our Royalty Review Advisory Panel, and in January the new Modernized Royalty Framework took effect. This was a tremendous accomplishment that will allow oil and gas operators to continue competing globally. I look forward to seeing the next phase of this new system in place when more data on royalties is published so Albertans can see for themselves how the new Modernized Royalty Framework is working.
Over the past year, we also began the process to encourage diversification in our energy sector. Our Petrochemicals Diversification Program attracted global attention. In December 2016 we announced that two companies would receive up to $500 million in royalty credits towards the construction of two new major petrochemical manufacturing facilities in Alberta. These projects represent about $6 billion in investment and help create jobs during construction and operations.
We also appointed our Energy Diversification Advisory Committee with experts from industry, financing, and labour to explore opportunities to grow our petrochemical sector and look at options for partial upgrading and refining. This committee will report back to me in the fall of 2017 and I look forward to reporting on this next year.
The past few years have not been easy for our energy sector or our province overall. The collapse in global energy prices was something we could not control, but as prices begin to recover and stabilize our government is moving ahead with clear strategies and goals that will position Alberta for long‑term success. I look forward to another year of supporting our energy industries and making life better for all Albertans.
Original signed by Honourable Margaret McCuaig‑BoydMinister of Energy
MESSAGE FROM THE MINISTER

2016-17 Energy Annual Report 5
Management’s Responsibility for Reporting
The Ministry of Energy includes:
• Department of Energy
• Alberta Energy Regulator
• Alberta Utilities Commission
• Alberta Petroleum Marketing Commission
• Post‑closure Stewardship Fund
• Balancing Pool
The executives of the individual entities within the ministry have the primary responsibility and accountability for the respective entities. Collectively, the executives ensure the ministry complies with all relevant legislation, regulations and policies.
Ministry business plans, annual reports, performance results and the supporting management information are integral to the government’s fiscal and strategic plan, annual report, quarterly reports and other financial and performance reporting.
Responsibility for the integrity and objectivity of the consolidated financial statements and performance results for the ministry rests with the Minister of Energy. Under the direction of the minister, as senior executives, we oversee the preparation of the ministry’s annual report, including consolidated financial statements and performance results. The consolidated financial statements and the performance results, of necessity, include amounts that are based on estimates and judgments. The consolidated financial statements are prepared in accordance with Canadian public sector accounting standards. The performance measures are prepared in accordance with the following criteria:
• Reliability – Information used in applying performance measure methodologies agrees with the underlying source data for the current and prior years’ results.
• Understandability – The performance measure methodologies and results are presented clearly.
• Comparability – The methodologies for performance measure preparation are applied consistently for the current and prior years’ results.
• Completeness – Outcomes, performance measures and related targets match those included in the ministry’s Budget 2016.
As senior executives, in addition to program responsibilities, we are responsible for the ministry’s financial administration and reporting functions. The ministry maintains systems of financial management and internal control which give consideration to costs, benefits and risks that are designed to:
• provide reasonable assurance that transactions are properly authorized, executed in accordance with prescribed legislation and regulations, and properly recorded so as to maintain accountability of public money;
• provide information to manage and report on performance;
• safeguard the assets and properties of the province under ministry administration;

2016-17 Energy Annual Report6
• provide Executive Council, the President of Treasury Board, the Minister of Finance and the Minister of Energy information needed to fulfill their responsibilities; and
• facilitate preparation of ministry business plans and annual reports required under the Fiscal Planning and Transparency Act.
In fulfilling our responsibilities for the ministry, we have relied, as necessary, on the executives of the individual entities within the ministry.
Date: June 19, 2017
MANAGEMENT’S RESPONSIBILITY FOR REPORTING
Original signed by Coleen VolkDeputy MinisterDepartment of Energy
Original signed by Jim EllisPresident and CEOAlberta Energy Regulator
Original signed by Willie GrieveChairmanAlberta Utilities Commission
Original signed by Richard MassonChief Executive OfficerAlberta Petroleum Marketing Commission

2016-17 Energy Annual Report 7
Results Analysis
2016-17 Energy Annual Report8
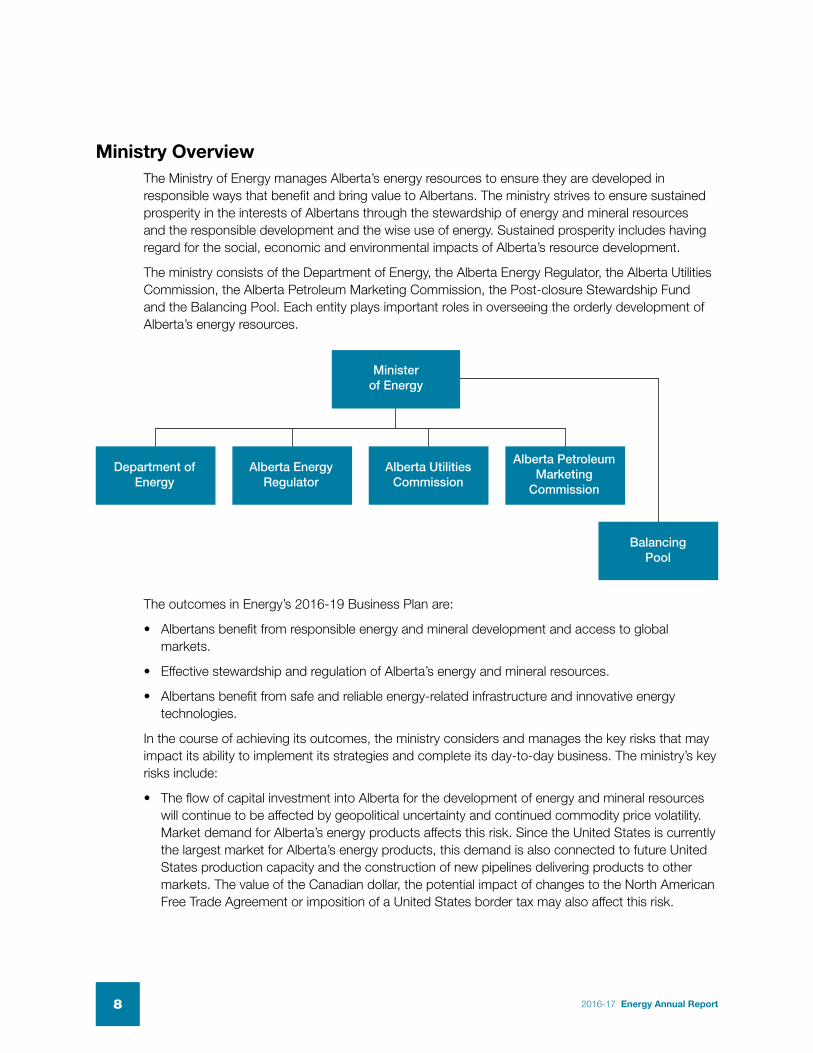
Ministry OverviewThe Ministry of Energy manages Alberta’s energy resources to ensure they are developed in responsible ways that benefit and bring value to Albertans. The ministry strives to ensure sustained prosperity in the interests of Albertans through the stewardship of energy and mineral resources and the responsible development and the wise use of energy. Sustained prosperity includes having regard for the social, economic and environmental impacts of Alberta’s resource development.
The ministry consists of the Department of Energy, the Alberta Energy Regulator, the Alberta Utilities Commission, the Alberta Petroleum Marketing Commission, the Post‑closure Stewardship Fund and the Balancing Pool. Each entity plays important roles in overseeing the orderly development of Alberta’s energy resources.
Ministerof Energy
Department of Energy
Alberta Utilities Commission
Balancing Pool
Alberta Energy Regulator
Alberta Petroleum Marketing
Commission
The outcomes in Energy’s 2016‑19 Business Plan are:
• Albertans benefit from responsible energy and mineral development and access to global markets.
• Effective stewardship and regulation of Alberta’s energy and mineral resources.
• Albertans benefit from safe and reliable energy‑related infrastructure and innovative energy technologies.
In the course of achieving its outcomes, the ministry considers and manages the key risks that may impact its ability to implement its strategies and complete its day‑to‑day business. The ministry’s key risks include:
• The flow of capital investment into Alberta for the development of energy and mineral resources will continue to be affected by geopolitical uncertainty and continued commodity price volatility. Market demand for Alberta’s energy products affects this risk. Since the United States is currently the largest market for Alberta’s energy products, this demand is also connected to future United States production capacity and the construction of new pipelines delivering products to other markets. The value of the Canadian dollar, the potential impact of changes to the North American Free Trade Agreement or imposition of a United States border tax may also affect this risk.

2016-17 Energy Annual Report 9
Department of Energy
• Acts as the steward of Alberta’s energy system on behalf of all Albertans
• Develops policy and manages development of Alberta’s non‑renewable resources, such as natural gas, oil, oil sands, coal, as well as petrochemicals and renewable energy
• Ensures the integration of natural resource policies and serves as an interface between policy development and policy assurance
• Grants industry the right to explore and develop Alberta’s energy and mineral resources
• Establishes, administers and monitors the effectiveness of Alberta’s royalty systems regarding Crown minerals
• Collects revenues from the development of Alberta’s energy and mineral resources on behalf of Albertans
• Establishes the framework for responsible industry‑led investment in electricity infrastructure and markets for the reliable delivery of electricity to consumers
• Administers the carbon capture and storage Post‑closure Stewardship Fund
Alberta Energy Regulator
• Independently makes decisions regarding resource development in accordance with applicable legislation and within the framework of Alberta’s overall energy policy
• Responds to changes in the energy industry while providing regulatory certainty for investors and the public, including assurance that risks are appropriately mitigated
• Provides for the safe, efficient, orderly, and environmentally responsible development of energy resources
• Provides geoscience information, evaluation and advice about the geology of Alberta that is used to support the exploration, resource appraisal, sustainable development, regulation, and conservation of Alberta’s resources through the Alberta Geological Survey
MINISTRY OVERVIEW
• The electricity system transition is a complex multi‑year exercise requiring careful analysis and extensive collaboration. Risk drivers, such as the medium‑ and long‑term reliability of Alberta’s current electricity system, including the level of infrastructure investment needed in new or replacement generation capacity, transmission and distribution are some of the factors driving the transition.
• Decisions on energy resource development require careful balancing of economic, environmental and social outcomes. In maintaining this balance, coordination across ministries and agencies, collaboration with Indigenous peoples, other governments, industry, environmental non‑governmental organizations and stakeholders will continue to be essential. Policy and political decisions made at the federal level as well as inter‑provincial relations may impact this risk.In addition, a shift in Canadian federal policy on energy and the environment may have both negative and positive impacts on this risk.

2016-17 Energy Annual Report10
Alberta Utilities Commission
• Regulates investor‑owned electric, natural gas and water utilities, and certain municipally‑owned electricity utilities to ensure customers receive safe and reliable utility service at just and reasonable rates
• Independently makes decisions on the need, siting, construction, alteration, operation and decommissioning of natural gas and certain electricity transmission facilities
• Regulates power plants in a similar fashion, except the need for new power plants is determined by market forces
• Develops and amends rules that support the orderly operation of the retail natural gas and electricity markets, and adjudicates on market and operational rule contraventions that the Market Surveillance Administrator may bring before the Alberta Utilities Commission
• Ensures the delivery of Alberta’s utility services takes place in a manner that is fair, responsible and in the public interest
Alberta Petroleum Marketing Commission
• Markets the Crown’s conventional crude oil royalty barrels received in lieu of cash royalties
• Develops commodity prices used in royalty calculations
• Assists with the development of new energy markets and transportation infrastructure
• Manages the implementation of Alberta’s Bitumen Royalty‑in‑Kind policy
• Evaluates strategic proposals for value‑adding to Alberta’s resources
Balancing Pool
• Acts as a risk backstop in relation to extraordinary events such as force majeure
• Acts as a buyer for the Power Purchase Agreements (PPAs) that were not sold in the public auction held by the Government of Alberta in 2000 or that have subsequently been terminated by third party buyers, and manages the resulting electricity portfolio and/ or where feasible terminate the PPAs with the owners
• Allocates or collects any forecasted cash surplus or deficit to and from electricity consumers in Alberta in annual amounts over the life of the Balancing Pool
• Holds the Hydro Power Purchase Arrangement and manages the associated stream of receipts or payments
• Participates in regulatory and dispute resolution processes
MINISTRY OVERVIEW

2016-17 Energy Annual Report 11
Non‑Renewable Resource RevenueEnergy development in Alberta is a key provider of jobs, business opportunities and tax and royalty revenues that fund important government programs for Albertans. Energy development also drives activity in a number of other industries, including construction and manufacturing, which benefit communities across Alberta and Canada.
Non‑Renewable Resource Revenue CollectedThe department is responsible for collecting non‑renewable resource revenue on behalf of Albertans.
Royalties are payments to Albertans for hydrocarbons that are produced and sold from the province’s resources. Albertans, as owners, collect value from our resources through royalties. Developing Alberta’s resources requires a partnership between the province and energy companies. The price received and the costs involved in producing and selling those resources affect the amount of value available for royalties.
The following table is a comparison of budgeted and actual revenues collected for fiscal year 2016‑17. In total, $3.10 billion of non‑renewable resource revenues were collected compared with a budgeted amount of $1.36 billion.
Revenue ($ Millions) 2016‑17 Budget 2016‑17 Actual
Bitumen 656 1,483
Crude Oil 333 716
Natural Gas and By‑products 151 520
Bonuses and Sales of Crown Leases 95 203
Rentals and Fees 118 148
Coal 11 26
Non-Renewable Resource Revenue 1,364 3,097
Crude Oil23.1%
$3.1 Billion
Natural Gas and By-products
16.8%
Bonuses & Sales
of Crown Leases6.6%
Rentals and fees4.8%
Coal 0.8%
Bitumen47.9%
Source: Government of Alberta
Source: Government of AlbertaNote: Numbers do not add up precisely to the totals due to rounding
2016-17 Non-Renewable Resource Revenue
2016-17 Energy Annual Report12
NON‑RENEWABLE RESOURCE REVENUE
For the eighth fiscal year in a row, bitumen royalty made the largest contribution to provincial resource royalty revenue. In 2016‑17, bitumen revenue collected totaled $1.48 billion, or 47.9 per cent of the non‑renewable resource revenue. Bitumen royalties were higher than budgeted due to higher than expected crude oil prices. The higher oil prices boosted the net income of projects which resulted in higher royalties paid.
Conventional crude oil royalties contributed $716 million, which is 23.1 per cent of the non‑renewable resource revenue in 2016‑17. Conventional crude oil royalties were higher than budgeted due to improved oil prices, which increased the light, medium, heavy, and ultra‑heavy oil prices that set higher conventional royalty rates. In addition, a weaker Canadian dollar, lower than budgeted costs of oil royalty programs, and revisions to past years’ results filed by industry meant that conventional oil royalties were higher than budgeted.
The third largest source of resource revenue was natural gas and by‑products royalties, which brought in $520 million. Royalties for natural gas and by‑products were above budget. Lower gas prices were more than offset by lower than expected estimates for the Crown’s share of the cost of gathering, processing and compressing gas, and industry re‑filings for the past fiscal year’s cost and royalties.
In 2016‑17, $203 million was collected from bonuses and sales of Crown leases. The majority of the sales are petroleum and natural gas and oil sands leases. The forecast for the petroleum and natural gas price per hectare relies on a statistical model using the forecasted oil and gas price and production, as well as industry cash flow. A statistical time series model is used to forecast the number of hectares that will be sold. The petroleum and natural gas bonus payments were $190 million, compared to the budget forecast of $95 million. The average price per hectare was $194 compared to the budget forecast of $113. About 149,000 more hectares were sold than budgeted. Oil sands lease sales totalled $13 million compared to the budget forecast of $1 million. There was an unexpected sale in June of $11 million.
Revenue from rentals and fees was $148 million in 2016‑17. Rentals and fees revenue was higher than budgeted as more hectares were retained by industry than budgeted, and fees for mineral activities were also higher than budgeted.
In 2016‑17, revenue from coal royalty was $26 million. Coal royalty was higher than budgeted as there was a significant spike in coal prices from October through December. Coal prices tripled during this period as there was a withdrawal of metallurgical coal export by China.
Non‑Renewable Resource Revenue ForecastingThe department is responsible for forecasting non‑renewable resource revenues for the Government of Alberta.
The Government of Alberta’s non‑renewable revenue forecasts are based on economic conditions at the time of the forecast, anticipated economic growth, non‑renewable resource demand trends and expected supply levels. Commonly, the most influential factor affecting non‑renewable resource revenue is commodity prices. Other factors such as capital and operating costs, the Canadian‑United States dollar exchange rate and production also affect royalty revenues. Unanticipated changes in these factors could result in significant differences between the budget forecast and the actual results.

2016-17 Energy Annual Report 13
NON‑RENEWABLE RESOURCE REVENUE
The Department of Energy models the complex system to calculate royalties and provide non‑renewable resource revenue forecasts. To develop price forecasts, the department uses a number of industry consultants and the futures market as well as a deep analysis of global, North American and Alberta market fundamentals.
The non‑renewable resource revenue forecast can change frequently throughout the year as new price, cost and production forecasts are issued. When the market is changing rapidly, price outlooks are frequently updated and the department incorporates the futures market to reflect those rapid developments in a timely manner. Changes in production forecasts and other variables such as industry costs and investments are also incorporated into each quarterly update.
West Texas Intermediate (WTI) is the North American price benchmark for light sweet oil. Western Canadian Select (WCS) is a
North American price benchmark for heavy crude oil, commonly used to price Canadian heavy oil.
Budget 2016 was based on a US$42.00 per barrel price for WTI crude oil and a 73.5 cent Canadian‑United States exchange rate. Crude oil prices continued their upward trajectory since they bottomed out in February 2016. A shift in the supply and demand fundamentals is still underway but prices remain volatile and range‑bound as the oil market has been exposed to more global uncertainties. The November 2016 agreement between the Organization for Petroleum Exporting Countries (OPEC) and non‑OPEC countries to cut production has diminished the risk of lower prices for the time being. However, elevated global inventory and the price response from United States shale producers are likely to restrain upward price pressure.
The WCS price was higher than budgeted due to the disruption in oil sands production from the 2016 Fort McMurray fires. Lower than anticipated heavy production from other western Canadian provinces also contributed to a higher WCS price and narrower differential.
The difference between the WTI and WCS prices is the light‑heavy differential. When oil pipelines leaving Canada reach full capacity, Canadian oil prices are discounted to reflect a higher rail transportation cost and receive a bigger price discount compared to WTI. This reduces the royalty revenue received by Albertans.
The Alberta Reference Price (ARP) for natural gas is used in natural gas royalty formulas and determines the royalty rate that will be applied to natural gas.
Factors Affecting Royalty Revenue and Forecasting
• Commodity prices
• Capital and operating costs
• Canadian‑United States dollar exchange rate
• Inflation
• Production rates Unanticipated changes in these factors could result in significant differences between the budget forecast and the actual results.
Commodity Prices 2016‑17 Budget 2016‑17 Actual 2017‑18 Forecast
WTI (US$/bbl) 42.00 47.93 55.00
Exchange rate US$0.735 US$0.762 US$0.760
Light‑heavy differential (US$/bbl) 15.20 13.93 16.00
WCS (US$/bbl) 26.80 34.01 39.01
Alberta reference price for natural gas (Cdn$/GJ) 2.40 2.01 2.90
Source: Government of AlbertaWCS data is reported in Canadian currency in the Government of Alberta budget documents. To allow for comparisons with other price data in this annual report, WCS has been converted to United States currency. Conversions may differ slightly, depending on the treatment of exchange rates.
2016-17 Energy Annual Report14
Commodity Prices
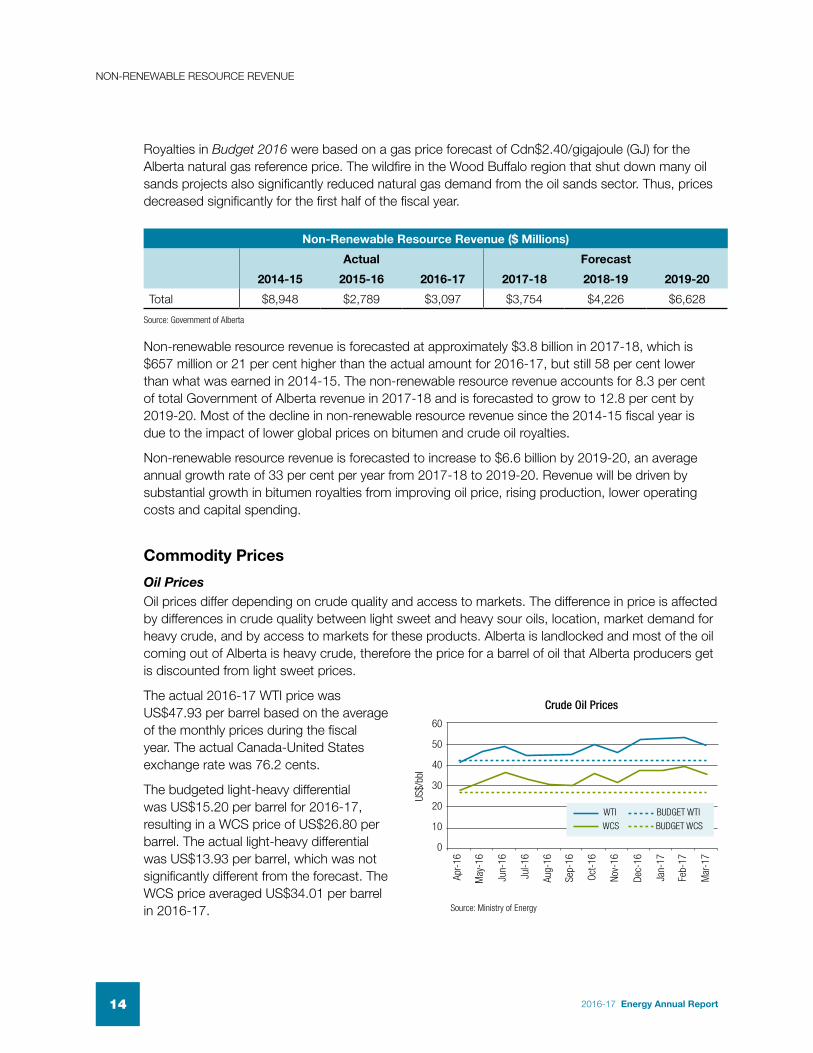
Oil PricesOil prices differ depending on crude quality and access to markets. The difference in price is affected by differences in crude quality between light sweet and heavy sour oils, location, market demand for heavy crude, and by access to markets for these products. Alberta is landlocked and most of the oil coming out of Alberta is heavy crude, therefore the price for a barrel of oil that Alberta producers get is discounted from light sweet prices.
The actual 2016‑17 WTI price was US$47.93 per barrel based on the average of the monthly prices during the fiscal year. The actual Canada‑United States exchange rate was 76.2 cents.
The budgeted light‑heavy differential was US$15.20 per barrel for 2016‑17, resulting in a WCS price of US$26.80 per barrel. The actual light‑heavy differential was US$13.93 per barrel, which was not significantly different from the forecast. The WCS price averaged US$34.01 per barrel in 2016‑17.
Non‑Renewable Resource Revenue ($ Millions)
Actual Forecast
2014‑15 2015‑16 2016‑17 2017‑18 2018‑19 2019‑20
Total $8,948 $2,789 $3,097 $3,754 $4,226 $6,628
NON‑RENEWABLE RESOURCE REVENUE
Royalties in Budget 2016 were based on a gas price forecast of Cdn$2.40/gigajoule (GJ) for the Alberta natural gas reference price. The wildfire in the Wood Buffalo region that shut down many oil sands projects also significantly reduced natural gas demand from the oil sands sector. Thus, prices decreased significantly for the first half of the fiscal year.
Non‑renewable resource revenue is forecasted at approximately $3.8 billion in 2017‑18, which is $657 million or 21 per cent higher than the actual amount for 2016‑17, but still 58 per cent lower than what was earned in 2014‑15. The non‑renewable resource revenue accounts for 8.3 per cent of total Government of Alberta revenue in 2017‑18 and is forecasted to grow to 12.8 per cent by 2019‑20. Most of the decline in non‑renewable resource revenue since the 2014‑15 fiscal year is due to the impact of lower global prices on bitumen and crude oil royalties.
Non‑renewable resource revenue is forecasted to increase to $6.6 billion by 2019‑20, an average annual growth rate of 33 per cent per year from 2017‑18 to 2019‑20. Revenue will be driven by substantial growth in bitumen royalties from improving oil price, rising production, lower operating costs and capital spending.
Source: Government of Alberta
60
50
40
30
20
10
0
US$/
bbl
Crude Oil Prices
Apr‑
16
Aug‑
16
Jun‑
16
Oct‑
16
Jan‑
17
May
‑16
Sep‑
16
Dec‑
16
Jul‑1
6
Nov‑
16
Feb‑
17
Mar
‑17
WTI
WCS
BUDGET WTI
BUDGET WCS
Source: Ministry of Energy

2016-17 Energy Annual Report 15
Natural Gas PricesOverall, the general rule of supply and demand balance determines natural gas prices in North America. Storage levels and weather patterns affect this price as it impacts the market’s ability to respond to additional demand. Lower storage levels could lead to higher prices and vice‑versa. Lower than normal temperatures in the winter and higher than normal temperatures in the summer could lead to increased demand and higher prices.
ARP averaged Cdn$2.01/GJ in 2016‑17. The actual gas prices were below budgeted levels at the end of the fiscal year due to combined impact of a much warmer than expected winter and robust United States and Canadian production that kept storage levels more than adequate for the 2016‑17 heating season.
Commodity Price TrendsEnergy commodity prices have changed significantly over the last five years.
The WTI price saw a substantial decline from US$92.07 per barrel in 2012‑13 to a low of US$47.93 per barrel in 2016‑17, with an average price of US$72.91 per barrel over the last five years. The 2016‑17 low of US$47.93 per barrel was a considerable drop in prices from the reported five‑year high in 2013‑14 of US$99.05 per barrel of oil. The decline in WTI prices is a combination of a number of factors, such as the persistent global oversupply, continuing build‑ups in global inventories and concerns over demand growth put significant downward pressure on prices. However, WTI increased slightly from US$45.00 per barrel in 2015‑16 to US$47.93 per barrel in 2016‑17.
The WCS price saw a considerable decline from US$68.40 per barrel in 2012‑13 to US$34.01 per barrel in 2016‑17. The WCS price peaked to a high of US$76.06 in 2013‑14, with an average of US$54.65 per barrel over the five‑year period. The significant decline in WCS prices follows the global crude oil price trend. A combination of factors, such as persistent global oversupply, continuing build‑ups in global inventories and concerns over demand growth put significant downward pressure on prices. However, WCS increased slightly from US$31.60 per barrel in 2015‑16 to US$34.01 per barrel in 2016‑17.
NON‑RENEWABLE RESOURCE REVENUE
3.5
3
2.5
2
1.5
1
0.5
0
Cdn$
/GJ
Alberta Gas Reference Prices
Apr‑
16
Aug‑
16
Jun‑
16
Oct‑
16
Jan‑
17
May
‑16
Sep‑
16
Dec‑
16
Jul‑1
6
Nov‑
16
Feb‑
17
Mar
‑17
ACTUAL ARP PRICES (Cdn$/GJ)BUDGET 2016
Source: Ministry of Energy
120
100
80
60
40
20
0
US$/
bbl
Crude Oil Prices
2012‑13 2013‑14 2014‑15 2015‑16 2016‑17
WTI
WCS
Source: Ministry of Energy

2016-17 Energy Annual Report16
NON‑RENEWABLE RESOURCE REVENUE
The average ARP during 2016‑17 was Cdn $2.01 per GJ, down Cdn $0.20/GJ from 2015‑16 price of Cdn $2.21/GJ. Despite North American benchmark natural gas prices firming year‑over‑year throughout 2016, AECO prices were particularly weak during the second quarter of 2016 due to high western Canadian storage levels after a mild 2015‑16 winter. AECO prices saw additional discounting to other North American benchmark prices through the balance of 2016 as relatively robust Western Canadian Sedimentary Basin production and de‑contracting of TransCanada PipeLines Limited (TCPL) Mainline long‑haul pipeline capacity to Eastern Canada required AECO prices low enough to clear demand markets in Eastern Canada and the United States midwest on short‑term and/or interruptible pipeline tolls.
Production
Crude Bitumen ProductionDespite the impact of devastating wildfires, crude bitumen production increased slightly from 2.53 million barrels per day (bbl/d) in 2015 to 2.54 million bbl/d in 2016, and therefore continued an escalating trend that has been underway since 2008. Most of the production increase was due to expansion of oil sands projects already in production. However, the Fort McMurray fires limited the increase in oil sands production. The share of crude bitumen production as a percentage of global consumption decreased in 2016, to 2.6 per cent from 2.7 per cent in 2015.
Conventional Crude Oil and Equivalent ProductionProduction of crude oil and equivalent (condensate and pentanes plus) decreased from about 715,000 bbl/d in 2015 to 666,000 bbl/d in 2016, a seven per cent decline.
Conventional production declined by 16 per cent from 2015 to 2016, from 530,000 bbl/d to 444,000 bbl/d. The decline in conventional oil production was to some extent offset by a significant increase in condensate and pentanes plus production, which went up by 20 per cent from 184,000 bbl/d in 2015 to 222,000 bbl/d in 2016. The overall increase in condensate and pentanes plus was influenced by two main factors: increased demand as it was used as a diluent for the transportation of non‑upgraded bitumen
milli
on b
arre
ls p
er d
ayAlberta Crude Bitumen Production
2012 2013 2014 2015 2016
1.922.09
2.302.53 2.54
Source: Alberta Energy Regulator
thou
sand
bar
rels
per
day
Alberta Conventional Crude and Equivalent Production
2012 2013 2014 2015 2016
672
709
743
715
666
Source: Alberta Energy Regulator
4.00
3.50
3.00
2.50
2.00
1.50
1.00
.050
0.00
Cdn$
/GJ
Alberta Gas Reference Price
2012‑13 2013‑14 2014‑15 2015‑16 2016‑17
Source: Ministry of Energy
2016-17 Energy Annual Report 17
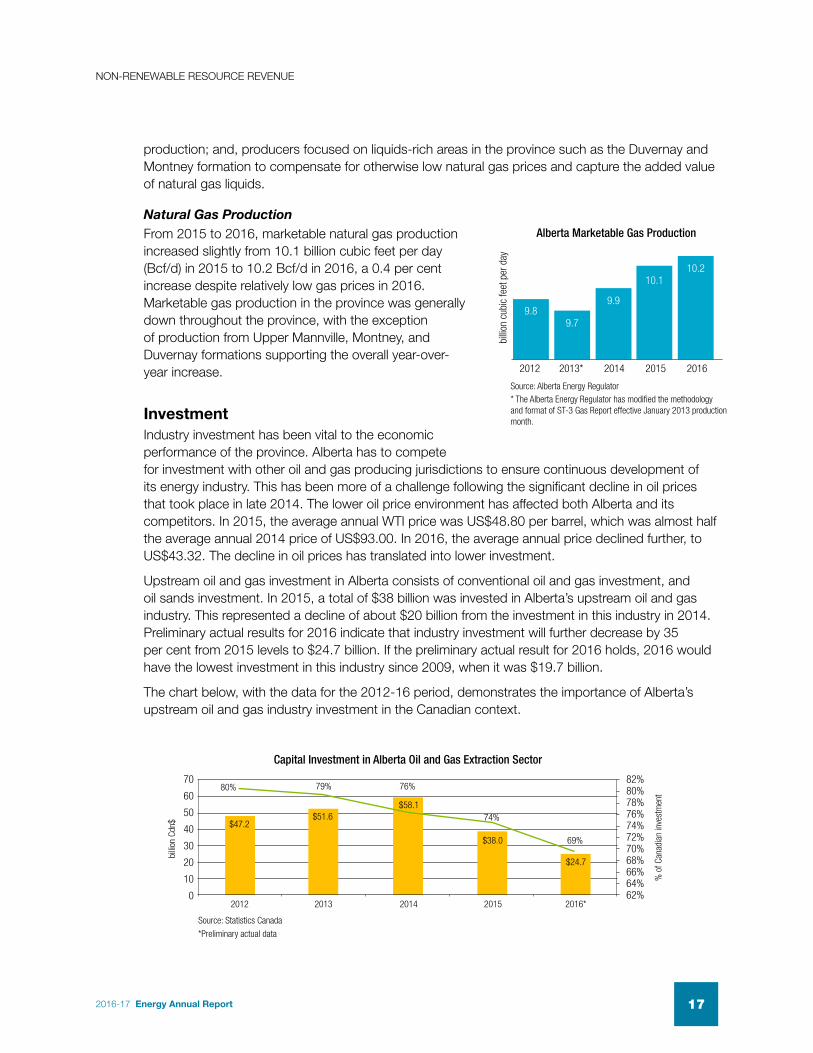
production; and, producers focused on liquids‑rich areas in the province such as the Duvernay and Montney formation to compensate for otherwise low natural gas prices and capture the added value of natural gas liquids.
Natural Gas ProductionFrom 2015 to 2016, marketable natural gas production increased slightly from 10.1 billion cubic feet per day (Bcf/d) in 2015 to 10.2 Bcf/d in 2016, a 0.4 per cent increase despite relatively low gas prices in 2016. Marketable gas production in the province was generally down throughout the province, with the exception of production from Upper Mannville, Montney, and Duvernay formations supporting the overall year‑over‑year increase.
NON‑RENEWABLE RESOURCE REVENUE
InvestmentIndustry investment has been vital to the economic performance of the province. Alberta has to compete for investment with other oil and gas producing jurisdictions to ensure continuous development of its energy industry. This has been more of a challenge following the significant decline in oil prices that took place in late 2014. The lower oil price environment has affected both Alberta and its competitors. In 2015, the average annual WTI price was US$48.80 per barrel, which was almost half the average annual 2014 price of US$93.00. In 2016, the average annual price declined further, to US$43.32. The decline in oil prices has translated into lower investment.
Upstream oil and gas investment in Alberta consists of conventional oil and gas investment, and oil sands investment. In 2015, a total of $38 billion was invested in Alberta’s upstream oil and gas industry. This represented a decline of about $20 billion from the investment in this industry in 2014. Preliminary actual results for 2016 indicate that industry investment will further decrease by 35 per cent from 2015 levels to $24.7 billion. If the preliminary actual result for 2016 holds, 2016 would have the lowest investment in this industry since 2009, when it was $19.7 billion.
The chart below, with the data for the 2012‑16 period, demonstrates the importance of Alberta’s upstream oil and gas industry investment in the Canadian context.
billio
n cu
bic
feet
per
day
Alberta Marketable Gas Production
2012 2013* 2014 2015 2016
9.89.7
9.9
10.110.2
Source: Alberta Energy Regulator* The Alberta Energy Regulator has modified the methodology and format of ST‑3 Gas Report effective January 2013 production month.
billio
n Cd
n$
Capital Investment in Alberta Oil and Gas Extraction Sector
% o
f Can
adia
n in
vest
men
t
70
60
50
40
30
20
10
0
82%80%78%76%74%72%70%68%66%64%62%
2012 2013 2014 2015 2016*
*Preliminary actual data
$47.2
80% 79% 76%
74%
69%
$51.6$58.1
$38.0
$24.7
Source: Statistics Canada

2016-17 Energy Annual Report18
NON‑RENEWABLE RESOURCE REVENUE
EmploymentEnergy industry employment has been important to the economic performance of the province. Oil prices significantly declined in late 2014, and remained relatively low throughout 2015 and 2016, which had a major impact on employment in the sector. Direct employment, after climbing to about 175,000 people in 2014, declined by 11 per cent from 2014 to 2015, and then declined further by 13 per cent from 2015 to 2016.
Within the mining, quarrying, and oil and gas extraction sector, the decline was primarily driven by employment reductions in support activities for the mining and oil and gas extraction sub‑sector. From 2014 to 2016, the overall decline in the entire mining, quarrying and oil and gas extraction sector was 23 per cent. Among the key sub‑sectors making up the sector, the oil and gas extraction sub‑sector employment declined by 13 per cent over this time period and the employment in support activities for the mining and oil and gas extraction sub‑sector declined by 31 per cent during the 2014 to 2016 period.
Although investment in Alberta was down substantially in 2015, and was estimated to further decline in 2016, Alberta still attracted a significant majority of total Canadian investment in the upstream oil and gas industry, and had more investment in this industry than all of the rest of Canada combined. In 2015, Alberta’s investment in the upstream oil and gas industry accounted for 74 per cent of the Canadian investment in this industry; in 2016, this share has been estimated to decline to 69 per cent, which is still a significant majority of Canadian investment.
The chart below presents drilling activity in Alberta over the 2012‑16 period. Wells drilled account for both development and exploratory wells. As seen in the chart, the total number of wells drilled significantly declined from 2014 to 2015, and then further declined from 2015 to 2016. Over the 2014‑15 period, total successful natural gas wells drilled declined by 37 per cent, from 1,824 in 2014 to 1,145 in 2015. They further declined by 29 per cent over the 2015‑16 period to 811 wells in 2016.
Likewise, over the 2014‑15 period, total successful crude oil wells drilled declined by 68 per cent, from 2,808 in 2014 to 912 in 2015, and further declined by 8 per cent to 836 wells in 2016. Bitumen wells drilled followed a similar trend, declining by 57 per cent from 2,036 in 2014 to 883 in 2015, and then further declining by 31 per cent over the 2015‑16 period to 610 wells to 2016.
NATURAL GAS WELLS
CRUDE OIL WELLS
BITUMEN WELLS
num
ber o
f wel
ls d
rille
d
Drilling Activity in Alberta
4,000
3,500
3,000
2,500
2,000
1,500
1,000
500
02012* 2013* 2014 2015 2016
*Amended data, based on current methodology
Source: Alberta Energy Regulator

2016-17 Energy Annual Report 19
Alberta’s total direct and indirect employment in the mining, quarrying, oil and gas extraction sector in 2016 was approximately 412,000 which corresponded to about 18 per cent of total employment in Alberta in 2016. In the case of employment in mining, quarrying, oil and gas extraction, an example of the direct employment impact is an oil rig worker; indirect impact would include an employee who works at the power station which supplies the oil rig with electricity.
Total direct and indirect employment in the sector experienced a 12.5 per cent year‑over‑year decline from its 2015 level, when it was about 470,000. When indirect employment is considered, the employment in the mining, quarrying, and oil and gas extraction sector decreased by about 120,000 employees over the 2014 to 2016 period.
NON‑RENEWABLE RESOURCE REVENUE
Royalty ProgramsOn behalf of Albertans, the ministry reviews and maintains a competitive and effective royalty regime that attracts industry investment which provides jobs, business opportunities, tax revenue and numerous other benefits to the provincial economy. This work supports outcome one from the ministry’s 2016‑19 business plan: Albertans benefit from responsible energy and mineral development and access to global markets.
Royalty programs exist for a number of reasons, such as:
• to provide appropriate royalty structures to attract investment in Alberta’s energy sector in specific situations where the overall regime needs adjustment to achieve strategic investments;
• to encourage the development, use and commercialization of innovative technologies to produce resources; and
• to achieve certain strategic policy objectives such as increased value‑added upgrading.
As the Modernized Royalty Framework (MRF) took effect on January 1, 2017 and includes two new strategic programs, wells that are currently operating under the Alberta Royalty Framework (ARF) and its programs will be grandfathered, either for a period of ten years or until they reach certain expiring milestones already built into the programs. A number of royalty programs under ARF are being phased out and no longer accepting new entrants as of 2017, such as the Natural Gas Deep Drilling Program (NGDDP) and the Enhanced Oil Recovery Program (EORP); however, the ministry will continue to monitor and report on the progress of these programs until they have officially expired.
It is important to note that this report presents a number of different royalty revenues and adjustments for crude oil, natural gas and by‑products throughout this report and in the financial statements. While related, each royalty revenue adjustment needs to be interpreted in its own
600
500
400
300
200
100
0th
ousa
nd
Employment in Mining, Quarrying, and Oil and Gas Extraction
2012 2013 2014 2015 2016
170 171 175 155 136
346
516 517 531470
412
346 356315
276
DIRECT EMPLOYMENT INDIRECT EMPLOYMENT
Source: Statistics Canada

2016-17 Energy Annual Report20
NON‑RENEWABLE RESOURCE REVENUE
unique context. These numbers are generated using different data sources and methodologies and are for different purposes and as such are not directly comparable.
• The actual royalty revenues are revenues the Crown collects on production from all wells in the province and are reported in the financial statements on a fiscal‑year basis.
• Royalty adjustment refers to the amount by which royalty was reduced from what would have been assessed under the generic royalty formulas due to a particular royalty program. The royalty adjustments are for wells that qualified under the royalty programs and are reported in the financial statements on a fiscal‑year basis.
• The total royalty revenue of each royalty program is sourced from various royalty reporting systems for crude oil, natural gas and oil sands. These systems are reported on a calendar‑year basis and reflect the amendments filed by industry each year. Amendments can be filed for up to five years from the production month. In addition, the total royalty revenue of each royalty program only reflects the revenue from wells that are qualified for the respective royalty programs in a given year; it does not represent the net revenue from those wells, as the royalty revenue on natural gas and gas products can be further reduced by eligible deductions, such as the Gas Cost Allowance.
It is important to understand that most of the royalty programs provide royalty adjustments early in the life cycle of the well or project while revenues from wells participating in the program occur during the entire production life of a well. Therefore, comparing the royalty adjustments against the royalty revenue is only relevant when done over the life of each program well or project and should take into account, as far as possible, the value of investments that would not have been made without the program.
In fiscal year 2016‑17, 11 royalty programs provided more than $1.18 billion in royalty adjustments to oil and gas producers:
Royalty Programs Royalty Adjustments 2016‑17 ($ Millions)
Natural Gas Deep Drilling 879.8
Shale Gas 142.5
Horizontal Oil 95.8
Incremental Ethane Extraction 22.4
Enhanced Oil Recovery 19.8
Horizontal Gas 14.0
Innovative Energy Technologies 2.9
Otherwise Flared Solution Gas 0.2
Proprietary Waiver 2.6
Deep Oil Exploratory Well 0.1
Coalbed Methane 0.02
Total Royalty Adjustments $1,180.1
Source: Ministry of Energy

2016-17 Energy Annual Report 21
3000m=
Figure 1: Deep drilling has a true vertical depth greater than 2000 metres
Natural Gas Deep Drilling Program The NGDDP was established in 2009 as a temporary five‑year program in conjunction with the ARF that came into effect January 1, 2009. The NGDDP was modified in 2010 to increase the overall effectiveness of the program, which included changes to the true vertical depth requirement, the supplemental length benefit and also made a permanent feature of the ARF.
The NGDDP has been making progress towards its intended outcomes. The intent of the NGDDP is to encourage new exploration, development and production from deeper, higher‑cost natural gas wells by providing a royalty adjustment to natural gas wells with a true vertical depth greater than 2,000 metres. The program has made progress towards achieving its intended outcome of enabling producers to develop deep gas resources that are more costly to access but offer the greatest resource potential.
The royalty adjustment is based on a well’s measured depth and is provided for a period of up to five years following the well’s finished drilling date. The minimum royalty rate applied to natural gas and natural gas products is five per cent and for condensate the minimum rate is zero. In 2016‑17, the program provided the largest amount of royalty adjustments to oil and gas companies with roughly $879.8 million in royalty adjustments.
The number of new gas wells eligible under the program increased steadily between 2011‑14 from 517 to 933 and dropped off slightly in 2015 to 848. Despite the decline in the number of eligible wells in 2015, new eligible wells as a proportion of total new gas wells drilled in the province has been increasing over the same period with 38 per cent of total new gas wells being eligible under the program in 2015. This could be attributed to a number of factors that include the shift in industry’s development focus to target deeper, liquids‑rich formations (such as shale) by drilling horizontal, multi‑fractured wells. Natural gas liquids improve a well’s economics due to higher product value and are driving the drilling of most natural gas wells in the province.
Natural Gas Deep Drilling Program
2011 2012 2013 2014 2015
Number of new eligible gas wells as a proportion of total new gas wells in the province
12% 17% 22% 30% 38%
Source: Ministry of Energy
NON‑RENEWABLE RESOURCE REVENUE

2016-17 Energy Annual Report22
As for production, both gas and liquids production from wells in the program has increased over the 2011‑15 period. In 2015, production from program wells accounted for 44 per cent of total methane production and 46 per cent of total liquids production in Alberta. This corresponds to an increase in the number of new eligible wells being added to the program over the same time period.
In 2015, gas wells in the program contributed about $280 million in total royalty revenues after the royalty adjustment (revenue before further deductions such as Gas Cost Allowance). This was a 26 per cent decrease in royalty from 2014, despite a total increase in gas and liquids production from eligible wells over the same period and can most likely be attributed to the drop in commodity prices which led to fewer wells being drilled. In addition, royalty rates for natural gas and field condensate are both price and production sensitive; in a low price environment, the royalty rates determined by the generic royalty formulas are also low, resulting in less total royalty being collected.
Deeper natural gas wells under the program are contributing significantly and at an increasing level to Alberta’s total gas and liquids production. This indicates that the program is making progress in incenting increased exploration and production from deeper natural gas wells that offer a high resource potential.
The Emerging Resources and Technologies Initiative (ER&T)In 2010 the ER&T was introduced and since then has effectively made progress towards its intended outcomes, which includes stimulating investment and encouraging development of Alberta’s unconventional resources through the deployment of new technologies. It supports new exploration, development, and production from Alberta’s emerging resources such as shale development and coalbed methane. The ER&T was implemented to increase investors’ ability to recover upfront investments by extending the maximum five per cent New Well Royalty Rate in four situations to acknowledge the higher costs and risks associated with these emerging resources and technologies. They are horizontal oil, shale gas, horizontal gas and coalbed methane.
The number of wells entering the program increased overall from 2011 to 2014 then fell dramatically in 2015. This is attributed to the global economic downturn and depressed commodity prices in 2015. Despite the decline in the number of wells, new eligible wells in the program made up a greater proportion (i.e., 43 per cent) of total new wells in the province in 2015. This increase was observed consistently over the past five fiscal years. This could be attributed to a number of factors such as improved economics of wells that were eligible for the program.
Production under the program is measured for wells in each of the four situations. Increased production was observed from wells in all three situations with the exception of coalbed methane. This indicates that the program is making progress in incenting increased exploration and production from these resources.
NON‑RENEWABLE RESOURCE REVENUE

2016-17 Energy Annual Report 23
NON‑RENEWABLE RESOURCE REVENUE
3000m=
Figure 2: This picture depicts the difference between vertical drilling (left) and horizontal drilling (right)
Horizontal Oil and Horizontal Gas Increasing production from horizontal oil and gas wells in the program was observed from 2011‑14 for all products (i.e., natural gas, natural gas liquids and oil). In 2015, production increased from horizontal gas wells but not horizontal oil wells; this was driven by the global collapse in oil prices that year which significantly impacted the economics of oil wells in Alberta. In 2016‑17, Horizontal Oil provided $95.8 million and Horizontal Gas provided $14 million in royalty adjustments.
Shale Gas Shale production from wells in the program saw the largest increase in production over the period of 2011‑15. This is due both to an increasing number of shale wells being drilled each year and relatively high initial production rates from shale wells. Production rates from shale wells also appear to be increasing which could be attributed to improved well drilling and completion techniques. The lower upfront royalty rate provided under the program to shale wells improved their well economics and contributed to the growth in activity in emerging shale formations. In 2016‑17, Shale Gas provided $142.5 million in royalty adjustments.
Coalbed Methane Production from coalbed methane wells in the program declined steadily from 2012 onwards. The economics of coalbed methane wells continue to be challenging compared to other gas wells. Despite relatively low drilling costs, the natural gas supply cost for coalbed methane wells are among their highest. They produce mainly dry gas and have very low initial production rates. In addition, coalbed methane wells are typically drilled on a single‑well basis and do not benefit from the economies of scale associated with pad drilling which is commonly occurring in tight and shale formations. In 2016‑17, Coalbed Methane provided $20,000 in royalty adjustments.
Total royalty revenue from all qualified wells in the program (revenue before further deductions such as Gas Cost Allowance) increased each year from 2011 to 2014 and decreased in 2015. Total royalty revenue in 2015 was $164 million for the ER&T, which is lower compared to $337 million in 2014. This is as a result of depressed oil and gas prices that year which led to fewer wells being drilled and qualifying for the program. In addition, royalty rates for oil and gas are both price and production sensitive; in a low price environment, the royalty rates determined by the generic royalty formulas are also low, resulting in less total royalty being collected.

2016-17 Energy Annual Report24
NON‑RENEWABLE RESOURCE REVENUE
Intersections among the Royalty ProgramsA number of royalty programs under the ARF intersect with each other to encourage increased development and exploration of Alberta’s resources in these higher‑cost areas. The intersection was designed so that Alberta would remain competitive with other jurisdictions through increased exploration and production. For example, a shale gas well that qualifies for the Shale Gas New Well Royalty Rate also qualifies for the NGDDP. While this is a clear overlap since multiple royalty features are targeting the same well, this overlap was intentional and aligns with the policy objectives. These overlaps were accounted for when the royalty features were designed and wells only benefit from one royalty program at a time.
Also, a shift in industry’s development focus and technological advancement created a larger portion of new deep natural gas wells that are drilled horizontally and could qualify for both the NGDDP and the Horizontal Gas New Well Royalty Rate under the ER&T.
Incremental Ethane Extraction Program The Incremental Ethane Extraction Program (IEEP) was implemented in July 2007 to encourage increased petrochemical production in Alberta. The program provides $350 million in royalty credits to petrochemical companies in Alberta that consume incremental ethane for the production of higher‑value products such as ethylene and its derivatives.
IEEP’s objective was to supply an additional 60,000 to 85,000 barrels per day of ethane for petrochemical companies to use as feedstock. While the initial program was implemented as a short‑term, five‑year program from 2007 to 2011, it was revised and extended for another five years in 2011. The additional 60,000 to 85,000 barrels per day of ethane remained the target.
The IEEP benefited Albertans by helping to sustain the petrochemical sector in the province, which requires abundant, low cost ethane feedstock to manufacture ethylene. The petrochemical sector is supportive of IEEP because it incented capital investment in extraction infrastructure that provides a sufficient volume of ethane from traditional sources such as natural gas processing plants and alternate sources such as upgrader off‑gases to support the existing petrochemical base.
For 2016, 13 of the 16 projects were in‑service. These thirteen projects are capable of providing up to 85,073 barrels per day of additional ethane for consumption by the petrochemical sector in Alberta and has met the target of the program. About 80 per cent of the incremental ethane capacity was from natural gas sources with the remaining 20 per cent obtained from off‑gas sources.
The Alberta petrochemical ethane supply and demand came into balance in 2014 and has continued to strengthen over the past two years. As a result, the current Alberta petrochemical supply and demand balance is considered stable. Over the next four years, the Department of Energy will continue to process
Source: Ministry of EnergyThis illustration depicts the number of wells between 2010‑14 that were eligible for the Emerging Resources and Technologies Initiative and the Natural Gas Deep Drilling Program. The diagram is for illustration only and is not to scale.
Horizontal Oil
Coalbed Methane
Horizontal Gas
Shale Gas
Natural Gas Deep Drilling
Natural Gas Deep Drilling Program and Emerging Resources and Technologies Initiatives
Intersections

2016-17 Energy Annual Report 25
NON‑RENEWABLE RESOURCE REVENUE
royalty credits associated with in‑service ethane extraction projects that are still within their 60‑month credit eligibility period. In 2016‑17, up to $22.4 million are eligible as royalty credits.
Enhanced Oil Recovery ProgramThe EORP has been making progress towards achieving its intended outcomes, which includes encouraging incremental crude oil production through enhanced oil recovery methods, which involves injecting the approved materials other than water to increase oil recovery from a pool. The program provides a maximum five per cent royalty rate for all oil produced from program‑approved schemes for a defined period of up to 120 months. Enhanced oil recovery is a method of crude oil production that injects materials to increase oil recovery from a pool. It is used on reservoirs that have already produced oil. Enhanced oil recovery helps sustain the province’s economic prosperity and employment as it encourages business enterprises to optimize Alberta’s resource base, while they make investments to improve well productivity.
The EORP was implemented in 2014 to replace the Enhanced Oil Recovery Royalty Relief Program, which had a similar policy intent and program objectives. With the introduction of the new Enhanced Hydrocarbon Recovery Program under the MRF, the program is being phased out and will terminate in ten years.
There was one new application to the program in 2015 and one new scheme approved into the program. This is a decrease from the four applications that were received for the program in 2014. This likely is a result of the decrease in overall new enhanced oil recovery development in the province due to the economic downturn and depressed oil prices and capital market. More broadly, the province has also seen declining capital investments in the oil and gas sector and decreasing numbers of total oil and gas wells drilled over the same period.
There were 28 active enhanced oil recovery schemes in the program in 2015 that generated a total Crown production of 930,292 cubic metres. This represents a 12 per cent decrease from 2014.
Total Crown royalty volumes from these program approved enhanced oil recovery schemes totaled 107,645 cubic metres which translates to about $34.6 million in total royalty revenue in 2015. Crown royalty on Crown’s conventional crude oil production is collected in barrels (in lieu of cash royalties) and is then marketed by the Alberta Petroleum Marketing Commission. The royalty revenue in dollars presented here is an estimate based on the commodity prices prescribed by the Minister of Energy. Of this total royalty revenue, about $31 million was considered incremental royalty to the Crown that otherwise would not have been generated without the program. Overall, total and incremental royalty revenues declined during 2015 (approximately 70 per cent) from 2014. This significant change can be largely attributed to low oil prices in 2015 as royalty rates are responsive to both production and commodity price under the ARF and the declined Crown production from these schemes.
It is important to note that, without the program support, enhanced oil recovery schemes are generally not economic and unattractive to investors due to higher production costs and lower rates of return on investments. Without the program, the enhanced oil recovery schemes may not proceed to even produce the base oil production; in that regard, any royalty generated from those enhanced oil recovery schemes could be considered ‘incremental’ to the Crown. In 2016‑17, the EORP provided $19.8 million in royalty adjustments.
Innovative Energy Technologies Program In 2004, the Government of Alberta introduced the Innovative Energy Technologies Program (IETP) program. The IETP supports development of innovative technology to enhance the production and

2016-17 Energy Annual Report26
NON‑RENEWABLE RESOURCE REVENUE
efficiency of Alberta’s oil, oil sands and gas resources. It helps industry find commercial technical solutions to the gas‑over‑bitumen issue that allow for the efficient and orderly production of both resources. It is a $200 million commitment by the Government of Alberta to provide royalty adjustments to pilot and demonstration projects that use innovative technologies to increase recoveries from existing reserves and encourage responsible development of oil, natural gas and in‑situ oil sands reserves.
The IETP provides up to 30 per cent of the funding of a project to a maximum of $10 million. After December 31, 2016, companies involved in the IETP will no longer be able to submit new claims based on allowable costs. However, unclaimed credits that have already been earned will still remain redeemable. In 2016‑17, the IETP paid $2.9 million in royalty adjustments.
Since its inception, the IETP has provided roughly $166 million in royalty abatements. In total, 42 projects have been approved and publicly announced. Of the 40 projects that proceeded:
• 16 dealt with oil sands areas;
• nine focused on oil;
• 11 were related to gas; and
• four focused on carbon dioxide (CO2)enhanced oil recovery projects.
Proprietary WaiverThe program has been a part of Alberta’s royalty system since 1977. The objective was to encourage early development of experimental oil sands and crude oil projects. Currently, the program remains in place to reflect provisions of Crown agreements whereby owners of enhanced oil recovery or oil sands projects did not pay gas royalty on gas produced and used for the projects. Gas volumes that are used as fuel in an experimental oil scheme or oil sands project are eligible for the royalty waiver. In 2016‑17, Proprietary Waiver provided over $2.6 million in royalty adjustments.
Otherwise Flared Solution Gas Royalty Waiver ProgramThe Otherwise Flared Solution Gas Royalty Waiver Program has been in place since 1999. The objective of this program is to encourage a reduction in the volume of solution gas being flared or vented in the province that would otherwise be not economic to conserve in order to minimize the environmental impact of oil and gas development.
The program has been considered royalty neutral under the assumption that solution gas under the program would not have been conserved without the program royalty waiver. In 2016‑17, the program provided $186,963 in royalty adjustments.
Deep Oil Exploratory Well Program The Deep Oil Exploratory Well Program was established in 2009 and is in effect until 2018. Exploratory oil wells from 2009 to 2013 could qualify for the program. The objective of the program was to provide incentives to producers to pursue new, deeper conventional oil wells that would be marginally economic under the generic ARF.
The program reduces the royalty rate for oil to zero per cent for the first 12 months of production or up to $1 million dollars in royalty adjustments, whichever occurs first. In 2016‑17, the program provided $66,655 in royalty adjustments.

2016-17 Energy Annual Report 27
Ministry Expenditure HighlightsEnergy’s 2016‑17 operating results would have seen a $272 million expenditure surplus from Budget 2016 except for the coal phase‑out agreements.
• On November 24, 2016, the Minister of Energy reached agreements with three coal‑fired generators. These agreements include a number of conditions that must be met on an annual basis, in addition to ceasing operations on or before December 31, 2030. In return, annual payments totalling $97 million will be made to the generators over the next 14 years. The costs of these future payments, discounted in net present value, totalled $1.1 billion and is recognized as an unbudgeted expense in 2016‑17.
• The Carbon Capture and Storage program was $172 million lower than budgeted. This is a reflection of delays in the construction of the Alberta Carbon Trunk Line. The other project in the program, Quest, is operational and has completed its first full year of injections in 2016‑17.
• Cost of Selling Oil is a non‑discretionary expense associated with the volume of crude oil received as royalties. The 2016‑17 expense was $19 million lower than 2015‑16 actual and $99 million lower than budgeted. Continued low energy price was the main reason affecting the volume of crude royalties received.
• The Bioenergy Producers Credit Program, which encouraged a variety of bioenergy products, such as renewable fuels, liquid biofuels, electricity, heat and biomass pellets and gas productions ended in 2015‑16. The completion of the program meant a reduction of $70 million is expense for fiscal 2016‑17.
The Department of Energy recognizes its people as an important part of achieving its outcomes. Human resource costs are an integral component of the department’s budget. The Government of Alberta’s Employee Engagement Survey was used to identify areas for targeted improvement, including: leadership, communications, employee development and employee recognition. The department has developed a detailed Employee Engagement Plan, with specific action items to help make our work environment even better. Each element of the plan is being led by an executive sponsor and engagement activities are well underway.

2016-17 Energy Annual Report28
Significant Changes The Balancing Pool was established in 1998 by the Government of Alberta and commenced operations in 1999 to help manage the transition to competition in Alberta’s electricity industry. The Balancing Pool’s obligations and responsibilities are governed by the Electric Utilities Act (2003) and the Balancing Pool Regulation.
On June 1, 2003 the Balancing Pool was established as a separate statutory corporation and operates independently of the Government of Alberta. The mandate of the corporation is to manage the financial accounts arising from the transition to a competitive generation market on behalf of electricity consumers and to meet the obligations and responsibilities relating to Power Purchase Arrangements (PPAs).
Between 2006 and 2016, the Balancing Pool distributed $2.6 billion to electricity consumers by way of the Consumer Allocation. The total distribution to electricity consumers including the original auction proceeds of the PPAs was $4.7 billion.
During the latter part of 2015 and early 2016, the Balancing Pool received notices of termination for six PPAs. The Balancing Pool immediately assumed responsibility for all financial obligations associated with the terminated PPAs. The PPA terminations imposed significant financial liabilities on the Balancing Pool. These financial liabilities, in combination with the current low price environment in the wholesale electricity market, were expected to result in significant operating losses over the remaining term of the PPAs.
In January 2017 the Balancing Pool signed a loan agreement with the Government of Alberta to fund operating losses of the Balancing Pool. From January 1, 2017 to April 4, 2017, the Balancing Pool borrowed $232 million to meet its current cash flow obligations. The short‑term discount notes issued to the Government of Alberta have maturity dates ranging from 31 to 90 days and corresponding annual interest charges that range from 0.9% to 1%.
On July 25, 2016, the Attorney General of Alberta filed an application with the Alberta Court of Queen’s Bench seeking declarations relating to the validity of certain provisions of the Battle River 5 PPA, Sundance A PPA, Sundance B PPA, Sundance C PPA, Sheerness PPA and Keephills PPA. The Attorney General also sought judicial review of the Balancing Pool’s decision to accept the termination by ENMAX PPA Management Inc. of the Battle River 5 PPA. The Balancing Pool, the Alberta Utilities Commission, ENMAX PPA Management Inc. and other parties with interests in PPAs were named as respondents.
On November 24, 2016 the Government of Alberta reached settlement agreements with the Buyers of the Sundance A, Sundance B, Sundance C, and Sheerness PPAs. As a result of these settlement agreements, the Balancing Pool has received various reimbursements in relation to the settlements reached with the various PPA buyers.
As a result of these recent events, the Auditor General has concluded that there has been a change in the financial relationship between the Balancing Pool and the Ministry of Energy and, for financial reporting purposes, the Balancing Pool has become a controlled entity within the Ministry of Energy. It should be noted that control for financial reporting purposes is not the same as day‑to‑day management control. The Balancing Pool retains the mandate and duties assigned to it under the

2016-17 Energy Annual Report 29
Electric Utilities Act (2003) and Balancing Pool Regulation. Accordingly, the financial statements of the Balancing Pool have been consolidated within the Ministry of Energy on January 1, 2017 on a modified equity basis, consistent with the accounting treatment of a Government Business Enterprise.
The consolidated financial statements reflect an opening accumulated loss of $2.0 billion on January 1, 2017 and an ending accumulated loss of $2.0 billion on March 31, 2017. This is partly due to the recognition of onerous contracts of $1.5 billion from the return of the PPAs, and partly due to operating losses or onerous contract determinations from other PPAs that the Balancing Pool already held, which resulted from low power pool prices. The Balancing Pool has the option to terminate the PPAs by paying the owner a termination payment equal to the net book value. The Balancing Pool has indicated that its priority in 2017 will be to evaluate whether to terminate the PPAs where these terminations can be economically justified.
SIGNIFICANT CHANGES

2016-17 Energy Annual Report30
OUTC
OME
1 Albertans benefit from responsible energy and mineral development and access to global markets.
What this means:The ministry accurately calculates and fully collects revenues from energy and mineral royalties, land sales, bonuses and rent. The ministry continues to seek opportunities to increase access to global markets to strengthen both the provincial and national economies.
Key Achievements:
1.1 ROYALTY REVIEW IMPLEMENTATION
On January 29, 2016, the Government of Alberta accepted all of the recommendations in the Alberta at a Crossroads: Royalty Review Advisory Panel Report, and committed to implement them:
1. Establish guiding principles and design criteria for Alberta’s royalty framework.
2. Modernize Alberta’s royalty framework for crude oil, liquids and natural gas.
3. Enhance royalty processes and administration for the oil sands.
4. Seize opportunities to enhance value‑added processing.
Albertans want a royalty system that is transparent, contributes to a vibrant, competitive industry and a strong, healthy economy where prosperity is shared. Development of Alberta’s royalty framework was guided by principles that relay the hopes and aspirations that Albertans, as owners of the oil and gas resource, have expressed:
• optimize returns for Albertans,
• attract investment and promote job creation,
• support downstream value‑added industries, and
• encourage environmental responsibility.
1.1 Implement recommendations from Alberta at a Crossroads: Royalty Review Advisory Panel Report, including:
• Establishing guiding principles and design criteria for Alberta’s royalty framework;
• Modernizing Alberta’s royalty framework for crude oil, liquids and natural gas;
• Enhancing royalty processes for the oil sands; and
• Seizing opportunities to enhance value‑added processing.
1.2 Foster and strengthen energy‑related relationships nationally and globally to achieve market access for Alberta’s energy resources and products.
1.3 Develop policies and conditions that support the diversification of energy resource value chains.
Key strategies to achieve this outcome included:

2016-17 Energy Annual Report 31
Recommendation 1: The Department of Energy identified performance indicators for Alberta’s royalty framework. The intent of the indicators is to demonstrate progress towards the guiding principles; explaining to Albertans, Canadians and the world what our industry stands for and ensuring Albertans have confidence in how their royalty system is performing. To improve transparency and to ensure that the MRF is optimizing returns to Albertans, attracting investment and creating jobs, and supporting downstream value‑added industries, the department will report on the guiding principles.
OUTC
OME
1
Optimize Returns to Albertans:
One of the overall principles of Alberta’s management of its petroleum resources is that exploration, development and production must result in optimized returns to Albertans, and that revenues must benefit society as a whole. The value Albertans receive for their resources is determined by the price the resources are sold for and the costs required to produce them. To optimize returns, the framework encourages the application of new processes and technologies to improve the efficiency of developing Alberta’s energy resources. There are many things to consider when we talk about fair share. Albertans benefit from the oil and gas sector in other ways than just collecting royalties.
Attract Investment and Promote Job Creation:
Developing our resources requires investment and expertise. The royalty framework is designed to obtain the optimum resource revenues possible for Albertans. It also helps Alberta attract investment to develop Alberta’s energy resources, creating jobs in the province, and supports a predictable business climate in Alberta.
Supporting Downstream Value-Added Industries:
The royalty framework is one of a number of tools to encourage investment in activities and technological advancements that add value to Alberta’s energy resources such as upgrading, refining, and petrochemical production. These activities create jobs, increase and diversify economic activity, and create value for Albertans.
Encourages Environmental Responsibility:
Encouraging environmental responsibility in the oil and gas sector is a vital part of Alberta’s resource development approach. Alberta’s royalty framework does not directly encourage enhanced environmental responsibility because it was designed as a tool to collect economic rent from our energy resources. The government has other agencies, policies and programs that continue to provide assurance that oil and gas development is happening in an environmentally responsible manner. Environmental responsibility is principally managed through regulation by the Alberta Energy Regulator (AER) and the Ministry of Environment and Parks. The AER reports on a number of environmental indicators.
2016-17 Energy Annual Report32
Recommendation 2: Alberta’s MRF came into effect on January 1, 2017 for new oil and gas wells. The new framework creates harmonized royalty formulas for crude oil, liquids and natural gas based on average industry drilling costs. The framework is intended to remove distortions and disincentives to investment and encourage industry to reduce costs. The changes will make the system more responsive to the economic realities facing industry. For new oil and gas wells, the MRF calculates a cost allowance, which is set based on average costs, updated annually, and expressed in dollars. With all hydrocarbons (excluding bitumen) treated more similarly, irrespective of well classification, there will be increased predictability in the royalty treatment for new wells drilled in Alberta. Industry has applauded government in its implementation of the royalty review recommendations and its engagement with stakeholders.
The MRF required amendments to existing regulations and creation of new regulations. Proprietary information systems went live with the MRF calculations and invoicing occurring in February 2017 for conventional oil and March 2017 for natural gas. Existing royalty structures for wells drilled prior to 2017 will be maintained until December 31, 2026.
In response to industry requests, government allowed industry to apply to opt in early to the MRF for wells that would not otherwise have been drilled in 2016. As a result, government approved 158 additional wells in 2016.
The ministry designed and implemented two new strategic programs under the MRF, which began accepting applications on January 1, 2017:
• The Enhanced Hydrocarbon Recovery Program promotes incremental production from existing developments, and
• The Emerging Resources Program encourages development of emerging resources in higher‑cost and higher‑risk areas with large resource potential.
Recommendation 3: The ministry enhanced processes and administration of the oil sands royalty framework. The review of the oil sands royalty framework resulted in:
• Improved decision‑making processes on project costs and on future project approvals;
• No change in benchmark pricing;
• Modernization and clarification of existing rules for allowable costs; and
• Modernization of valuation methodologies for pricing bitumen transacted between affiliated parties, for the purposes of royalty calculation.
Recommendation 4: The Government of Alberta appointed the Energy Diversification Advisory Committee (EDAC) in October 2016 to recommend policies and conditions that support the diversification of resource value chains. This will ensure the long‑term sustainability of Alberta’s energy sector, and create good jobs and a diversified economy. By diversifying its economy, the province can smooth out the effects of volatile energy prices. In March 2017, the committee began engaging with stakeholders to examine opportunities in partial upgrading, refining, petrochemicals and chemical manufacturing. The three phases of stakeholder engagements include expert working groups, Indigenous leadership and the public. The committee is expected to deliver its recommendations to the Minister of Energy in the fall of 2017.
OUTC
OME
1

2016-17 Energy Annual Report 33
The Ministry of Energy developed and implemented a new royalty framework for new oil and gas wells during 2016‑17. This required the coordinated effort of multiple teams across the ministry and many technical discussions with industry associations and the AER within tight timelines. This success is attributed to the strong contributions of each team, and early and regular meetings with industry stakeholders.
The cost of all Department of Energy Royalty Review Implementation activities in 2016‑17 was $4.38 million.
1.2 MARKET ACCESS
The Government of Alberta was pleased that the federal government recognized Alberta’s Climate Leadership Plan and chose to approve two pipelines. The Trans Mountain Expansion Project and the Line 3 Replacement Project will ensure Alberta and Canada benefit from our natural resources. Alberta will continue to advocate for its market access interests across Canada and to overseas markets to help create good jobs and more opportunities for Albertans.
A key challenge facing Alberta’s energy industry is the need to improve access to new global markets. The more customers any business can have the better, and Alberta’s oil and gas sector is no different. Expanded access to global markets through all proposed pipelines offers optionality – the ability to react quickly to different market conditions and move crude supplies to higher‑priced markets as supply and demand changes. By achieving greater market access for Alberta’s oil and getting new oil pipelines operating, Alberta will be in a better position to leverage this optionality to achieve a fair price for the province’s energy resources. This is essential to support the province’s energy transition and enable the programs and services that provide a high quality of life to the citizens of the province.
In 2016‑17, the Government of Alberta took some significant steps to improving market access. Unknown and shifting variables present significant challenges in the resource and energy development sectors. The government undertook a number of initiatives to strengthen energy‑related relationships and improve market access for Alberta’s products.
• Premier Notley delivered a presentation to the National Energy Board’s Trans Mountain Expansion Project panel in January 2016, which shared facts about Alberta’s Climate Leadership Plan and the oil and gas industry in the province.
• A technical submission was made to the federal government on the proposed tanker moratorium, which outlined research relating to bitumen, its properties in water and the strict tanker traffic regulations already in place.
• Premier Notley completed a mission to British Columbia in December 2016 following federal approval of the Trans Mountain Expansion Project, which shared facts about Alberta’s Climate Leadership Plan, the province’s oil and gas sector and its interconnectedness to British Columbia’s economy, and the merits of the project.
• Premier Notley also made missions to Washington, D.C., and CERA week in Houston, Texas, to discuss the challenges and opportunities facing the oil and gas market, investment and innovation.
• The ministry continued to build mutually beneficial relationships with industry, municipal organizations, and counterparts in the federal and provincial governments.
• The Government of Alberta also made a technical submission to the United States Department of State on the Line 67 Expansion Project on March 27, 2017.
OUTC
OME
1

2016-17 Energy Annual Report34
• The ministry worked with the Ministry of Economic Development and Trade and the Alberta Washington Office to ensure a coordinated approach consistent with that of the federal government relating to trade policies and their implications on Alberta’s energy industry.
• The government continued to defend the province and its key industry in court, preparing to seek intervenor status in April 2017 on legal challenges to the Trans Mountain Expansion Project.
Alberta’s resource development activities and economy are impacted by the decisions of other governments and their agencies, both in Canada and internationally. Through the Alberta Climate Leadership Plan, the province was able to demonstrate its world‑class regulatory regime and commitment to environmental stewardship which strengthened energy‑related relationships and enabled other governments to further understand Alberta’s plans on climate issues.
The Alberta Petroleum Marketing Commission (APMC) continued to steward its 100,000 barrel per day commitment on the proposed Energy East pipeline project. As part of the shippers group, the commission provided its input to TransCanada PipeLines on key decision items throughout the year. The commission also actively engaged with industry participants to explore and evaluate new market opportunities through pipeline, crude by rail and export terminal development proposals. These efforts contributed to the promotion of Alberta’s resources and products to diverse markets around the world which can lead to a more diversified market that is less dependent on a single customer.
To support Alberta’s energy development, the Department of Energy is developing an international energy strategy to create a common vision of the international energy landscape, set direction and identify priorities for international activities. Development of the draft strategy underwent a phased approach during 2016‑17, from preliminary scoping and internal research to consulting regional experts at the Ministry of Economic Development and Trade on Asia‑Pacific, Europe, the United States and Latin America. The evolving global energy landscape requires the strategy to be a living document in order to capture new challenges and opportunities as they emerge. Ongoing environmental scanning and global market analysis is required to keep the strategy and its principles up to date.
In December 2016, the China‑Alberta Petroleum Centre Memorandum of Understanding was renewed for a further five years. This non‑legally binding memorandum outlines a commitment between Alberta and the China National Petroleum Corporation to develop the China‑Alberta Petroleum Centre as a platform for learning and benefit. The China‑Alberta Petroleum Centre, established in 1989, operates as a unique venue for energy cooperation, partnership, and development of bilateral trade between Alberta and China. The functions of the China‑Alberta Petroleum Centre include technical exchange and cooperation, business facilitation, exhibition information exchange and training. The centre provides Alberta with formalized, regular access to China National Petroleum Corporation, China’s largest oil and gas producer, and creates a framework for engagement to build relationships necessary for long‑term market diversification. It also supports the Alberta Jobs Plan by diversifying our energy industry and energy markets and supporting Alberta business in the energy sector. The Ministry of Energy and the Ministry of Economic Development and Trade are responsible for Alberta’s operational components of the China‑Alberta Petroleum Centre.
The cost of all Department of Energy market access activities in 2016‑17 was $3.8 million.
OUTC
OME
1

2016-17 Energy Annual Report 35
1.3 ENERGY INDUSTRY DIVERSIFICATION
Emerging from the royalty review was the recognition that value‑added development is important for economic diversification and will be one of the cornerstones of a resilient resource‑based economy. On February 1, 2016, the Government of Alberta announced the Petrochemicals Diversification Program, which is intended to encourage companies to invest in the development of new Alberta petrochemical facilities by providing up to $500 million in incentives through royalty credits. The program is part of the government’s continued action on the economy, and will help create jobs, attract investment and diversify the economy.
On December 1, 2016, the Minister of Energy announced approval of two world‑scale projects under the program that, taken together, are expected to generate between 3,700 and 4,200 jobs during construction and more than 240 full‑time jobs when the projects are operating. The two projects approved under the Petrochemicals Diversification Program are the Propane Dehydrogenation and Polypropylene Complex located in Sturgeon County, and the Alberta Propane Dehydrogenation Project located in Strathcona County. Both projects are expected to become operational in 2021.
The Propane Dehydrogenation and Polypropylene Complex is a joint venture by Pembina Infrastructure and Logistics LP, and Petrochemical Industries Company K.S.C. This integrated facility is estimated to cost between $3.8 to $4.2 billion to construct, and would consume about 22,000 barrels per day of propane when operating to produce polypropylene. The project has been approved for a maximum royalty credit amount of up to $300 million.
The Alberta Propane Dehydrogenation Project is an initiative by Inter Pipeline Ltd. The facility is estimated to cost $1.8 billion to construct and would consume about 22,000 barrels per day of propane when operating to produce propylene. The project has been approved for a maximum royalty credit amount of up to $200 million.
Final investment decisions for the projects by their proponents are expected by June 2018 or earlier, enabling the projects to begin in the near‑term. These petrochemical diversification projects are a major step towards economic diversification and will pave the way for a future with more value‑adding, diversified activities in the province.
To support efforts to enhance value‑adding activities in the province, the APMC also dedicated its efforts on the commercialization of partial upgrading technologies. In 2016‑17, the commission pursued business development activities that included exploring commercializing partial upgrading technologies in conjunction with industry. In the process, the commission worked with industry to identify some of the unique barriers to an accelerated commercialization path for the technologies. The commission was also actively engaged with EDAC to enhance their knowledge of partial upgrading opportunities and the challenges that exist towards commercialization of these technologies. The commission has encouraged the Department of Energy to form a policy framework to advance partial upgrading.
In 2016‑17, APMC continued to steward the province’s agreements related to the Sturgeon Refinery by actively participating in executive, operations and commercial committees of the refinery. The refinery will process 50,000 barrels per day of bitumen into low sulphur diesel, low sulphur vacuum gasoil, naphtha, and diluent providing an important new market for Alberta’s bitumen production. The refinery is approximately 95 per cent complete with refining operations expected to start in the fourth quarter of 2017 and commercial operations expected to be up and running by January 1, 2018. Total spending on the project has been projected to be $9.4 billion.
OUTC
OME
1
2016-17 Energy Annual Report36
The APMC’s roles include feedstock supplier, toll payer, and subordinated debt lender. The commission has borrowed a total of $324 million from Treasury Board and Finance to lend to North West Redwater Partnership for the Sturgeon Refinery. The timing of the commission repaying the debt to Treasury Board and Finance corresponds with North West Redwater Partnership’s repayment of the term loan to the commission.
An important risk factor under these agreements is the price differential between the bitumen supplied as feedstock and the marketed refined products, relative to the costs of the processing toll. APMC performs an annual assessment using a cash flow model to determine if the North West Redwater Partnership processing agreement gives rise to unavoidable costs that exceed the expected economic benefits. The result of this assessment in 2016‑17 was that the North West Redwater Partnership processing agreement is not onerous. The Government of Alberta may consider supporting the phase two development of the Sturgeon Refinery once phase one is successfully operating in 2018.
OUTC
OME
1

2016-17 Energy Annual Report 37
Performance MeasuresPerformance Measure 1.a: Revenues from oil, oil sands, gas and land sales bonuses are fully collected
Target
One hundred per cent of amounts owed are collected.
Discussion of Results
One of the Department of Energy’s mandates is to collect the Crown’s share of energy resources on behalf of Albertans. This performance measure supports this mandate by gauging the ability of the department to collect the amounts owed through the development of Alberta’s resources.
The department requires all royalty to be calculated and paid in cash or delivered in kind by a prescribed due date. Systems and processes are in place to collect royalties and to identify and follow up expeditiously on overdue accounts. Processes are also in place to collect overdue accounts and related interest and penalties.
The results reported in this measure are based on financial obligations in which there are no disputes between the Government of Alberta and entities owing funds to the Government of Alberta. Disputed amounts are excluded from the results until all outstanding matters are resolved. Upon resolution, historical results are reviewed and, if necessary, retroactively adjusted.
During the year, all amounts have been or are in the process of being collected, and no write‑offs have been made. In 2016 and for this annual report, the revenue collection measure result was 100 per cent.
Sources: Alberta Petroleum Marketing Commission, Department of Energy Note: Excludes disputed amounts
Figure 1.a Revenues from oil, oil sands, gas and land sale bonuses are fully collected
2012 2013 2014 2015 2016
100% 100% 100%100% 100%
Perc
enta
ge o
f am
ount
s co
llect
ed
com
pare
d to
am
ount
s ow
ed
OUTC
OME
1

2016-17 Energy Annual Report38
Performance Measure 1.b: Alberta’s oil sands supply share of global oil consumption
Target
2.7 per cent of global oil consumption is supplied by Alberta’s oil sands.
Discussion of Results
Alberta’s oil sands supply share of global oil consumption performance measure was introduced for the first time in the 2012‑15 Energy Business Plan.
Development of Alberta’s oil sands, and the oil sands’ role in the global energy mix, is a highly complex system over which policy must both balance multiple priorities and adapt to changing global dynamics.
There are several levers available to the Government of Alberta, which indirectly impact the results of the measure. Key levers are the fiscal and royalty regimes, which directly act to incent industry’s resource development activities, while ensuring that Albertans receive direct financial benefits in the form of taxes and royalties. In addition, there are other government policies that influence industry performance, and therefore oil sands production levels, including promotion of market access, intergovernmental relations, energy research and development, and environmental regulations.
The oil sands industry in Alberta has been significantly affected by the decline in the oil prices that began in late 2014. The weakness in crude prices is mainly due to continued growth in the United States light tight oil, recovery in Libyan crude exports, and a decrease in expectations of the growth in global crude oil demand. Oil prices significantly declined in late 2014, and remained relatively low throughout 2015 and 2016. In September 2014, the West Texas Intermediate (WTI) price was US$93.03 per barrel (bbl) while in December 2014 it was US$59.29/bbl. The average annual WTI price declined from US$93.00/bbl in 2014 to US$48.80 in 2015. In 2016, the average annual WTI price further declined to US$43.32/bbl.
In 2016, in addition to challenges created by the relatively low price environment, the industry was also affected by the Fort McMurray fires. In fact, negative impact on production during the year was primarily due to the wildfires affecting some major projects. A local state of emergency began on May 1 and the wildfires were declared under control on July 4. According to the AER, over a dozen operating oil sands schemes near the wildfires were affected. Total mined production declined by 1 per cent from 2015 to 2016, from 1.16 million barrels per day (bbl/d) to 1.15 million bbl/d. However, in‑situ production increased over the same time period by 2 per cent, from 1.36 million bbl/d to 1.39 million bbl/d, pushing the overall crude bitumen production up by 0.5 per cent, from 2.53 million bbl/d to 2.54 million bbl/d.
Alberta’s relatively small increase in year‑over‑year bitumen production was lower than global year‑over‑year consumption increase, which went up by 1.7 per cent, from 95 million bbl/d in 2015 to 96.6 million bbl/d in 2016. As a result, for the first time since the measure was put in place, Alberta’s oil sands supply share of global oil consumption experienced a decline, from 2.7 per cent in 2015 to 2.6 per cent in 2016. Prior to 2016, crude bitumen production share was consistently increasing, from 2.1 per cent in 2012 to 2.7 per cent
Source: Alberta Energy Regulator; International Energy Agency
Figure 1.b Alberta’s oil sands supply share of global oil consumption.
2012 2013 2014 2015 2016
2.3%
2.7%2.5% 2.6%
2.1%
OUTC
OME
1

2016-17 Energy Annual Report 39
in 2015. The target for 2016, reported in the 2016‑19 Business Plan was 2.7 per cent, so the actual result for 2016 was below the target by about 0.1 per cent.
Over the past several years, and despite the challenges in 2015 and 2016, total oil sands production was consistently increasing. From 2012 to 2013, oil sands production increased by 9 per cent, from about 1.92 million bbl/d in 2012 to about 2.09 million bbl/d in 2013. Alberta oil sands production further increased to about 2.30 million bbl/d in 2014, a 10 per cent increase compared to 2013. In 2015, oil sands production reached 2.53 million bbl/d, a 10 per cent increase from the 2014 level. As mentioned above, in 2016 oil sands production increased to 2.54 million bbl/d, a 0.5 per cent increase from the 2015 level; the overall crude bitumen production in 2016 set an all‑time record.
OUTC
OME
1
2016-17 Energy Annual Report40
Effective stewardship and regulation of Alberta’s energy and mineral resources.
What this means:The ministry engages with all stakeholders on issues involving responsible resource development of Alberta’s energy and mineral resources. A strategic and integrated system approach to responsible resource development in the province strengthens the overall environmental, economic and social outcomes for the benefit of Albertans. Through the Alberta Energy Regulator (AER), the ministry regulates Alberta’s energy industry to ensure the efficient, safe, orderly and environmentally responsible development and sustainable management of energy resources. Through the Alberta Utilities Commission (AUC), the ministry further supports the interests of Albertans by ensuring that the delivery and regulation of Alberta’s utility service is fair and responsible.
Key Achievements:
2.1 LIABILITY MANAGEMENT & CUMULATIVE EFFECTS
Liability Management Review
Of approximately 450,000 oil and gas wells drilled in Alberta since the early 1900s, approximately:
• 83,000 are inactive
• 69,000 are abandoned
• More than 110,000 are reclaimed
• 180,000 are active wells
2.1 Continue to collaborate with other ministries to develop and implement policies and programs to manage the cumulative effects of resource development, including regional planning, and dealing with liabilities related to inactive, aging and orphaned wells and facilities, and reclamation timelines.
2.2 Continue to develop Alberta’s Energy Sustainability Strategy to provide a long‑term perspective on Alberta’s energy system to anticipate and adapt to emerging issues and developments that may shape energy globally over the next thirty to forty years.
2.3 Enhance regulation and oversight to ensure the safe, efficient, effective, credible and environmentally responsible development of Alberta’s energy resources.
2.4 Enhance regulation and oversight of Alberta’s utilities to ensure social, economic and environmental interests of Alberta are protected by effective utility regulation.
Key strategies to achieve this outcome included:
OUTC
OME
2

2016-17 Energy Annual Report 41
Low commodity prices are causing an increase in the number of oil and gas companies facing insolvency and the number of orphaned wells or associated facilities where the licensee does not exist. Industry is responsible for those liabilities and for the eventual reclamation and remediation of these sites.
This has increased the number of orphan sites going to the Orphan Well Association (OWA). The OWA’s mandate is to manage the decommissioning of orphan upstream oil and gas wells, pipelines, facilities, and the remediation and reclamation of their associated sites. The OWA closed 185 wells last year. As of March 2017, the OWA had an inventory of 2,084 orphaned wells to go through closure activities (1,394 to be abandoned and 690 to be reclaimed). The Government of Alberta has approved OWA’s increased resources for orphan wells, from $30 million in 2017‑18 to $45 million in 2018‑19, and to $60 million in 2019‑20. The current budget and increase will be entirely funded by industry levies. The association operates under the delegated authority of the AER.
To support the effective stewardship and regulation of Alberta’s energy and mineral resource, the Department of Energy continued to work with the AER and Environment and Parks to review the system of liability management for upstream oil and gas development to better manage historic, current and future liabilities associated with oil and gas infrastructure. External engagement for the liability management review began on May 10, 2017 and is looking at ways the system can be improved to further protect Albertans and the environment, and to keep Alberta a competitive place to invest.
Energy recognizes that safety of oil and gas sites is a concern for all Albertans. The ministry worked with the Government of Canada to create good oilfield service industry jobs and to make sure more orphaned wells are safely closed and reclaimed. This cooperation will put Albertans back to work and still respect the important principle of polluters paying for their environmental liabilities. On May 18, 2017, the government announced a $235 million loan program that will be used to address up to one third of the orphan well liabilities held by the OWA over the next three years.
Cumulative Effects Management and Land Use Planning
The cumulative impact of energy development on the environment, along with other land uses, creates challenges for government in managing cumulative effects on air, land, water and biodiversity. Through integrated decision‑making and land‑use planning in partnership with other ministries, the ministry supports cumulative effects management.
Well Status DefinitionsInactive: A well or associated facility where activities have stopped for 12 consecutive months due to technical or economic reasons. Not all sites in this category are orphaned. Many may be reopened and produce again at a later date.
Abandoned: A site that is permanently dismantled (plugged, cut and capped) and left in a safe and secure condition.
Orphaned: A well or facility confirmed not to have anyone responsible or able to deal with its closure and reclamation.
Under Remediation: The process of cleaning up a contaminated well site to meet specific soil and groundwater standards.
Under Reclamation: The process of replacing soil and re‑establishing vegetation on a well site so it can support activities similar to those it could have supported before it was disturbed.
OUTC
OME
2

2016-17 Energy Annual Report42
Energy and resource development and land‑use issues are complex, often involving shared areas of responsibility. Ensuring that initiatives in these areas reflect all perspectives is an important challenge that the Department of Energy, the Alberta Energy Regulator and their cross‑ministry partners address through an approach known as the Integrated Resource Management System (IRMS). The cross‑ministry partners of the IRMS are the Ministry of Environment and Parks, the Ministry of Agriculture and Forestry, and the Ministry of Indigenous Relations.
The coordinated approach includes setting and achieving environmental, economic and social outcomes that benefit Albertans while protecting the environment. The ministry supports collaborative relationships, and proactively engages with cross‑ministry partners on resource management policy and operational initiatives to promote harmonious, integrated natural resource and environmental policies and programs.
The Ministry of Environment and Parks is leading the development and implementation of land‑use regional plans. The current focus is on continuing to implement the Lower Athabasca Regional Plan and the South Saskatchewan Regional Plan while continuing to develop the North Saskatchewan Regional Plan. In 2017 the South Saskatchewan Regional Plan was amended to take action on government’s commitment to enhance the protection of the Castle area in southern Alberta by establishing the Castle Parks. The Ministry of Energy worked with cross‑ministry partners to support the government’s enhanced protection of the Castle initiative.
In the Lower Athabasca planning region, the Fort McKay First Nation is particularly impacted by mineable oil sands development around their Fort McKay reserves. The Ministry of Environment and Parks is leading access management planning for the Moose Lake area in collaboration with the Fort McKay First Nation. The ministry is providing support and expertise to this process. The desire is to enhance the ability of Indigenous communities to undertake traditional activities and cultural practices; maintaining biodiversity and ecological integrity while ensuring operators have reasonable and timely access to the land base for the purpose of resource development.
Caribou Range Planning
Caribou populations in Alberta are at risk, and under the federal Species at Risk Act, the federal government has imposed an October 2017 deadline for Alberta to deliver range plans for the recovery of caribou populations in Alberta’s 13 caribou ranges. The Government of Alberta accepted the recommendations of a report on the Little Smoky and A La Peche ranges in 2016, and the ministry is working with IRMS partner ministries to implement the recommendations.
Energy agreements require holders to develop the minerals held under the agreement or else the agreements will revert to the Crown upon expiry. The Ministry of Energy promoted the reduction of the impact of energy resource development on critical caribou habitat by implementing restrictions on mineral sales for untenured land in caribou ranges, and extensions for existing tenure in those areas until March 31, 2019. These restrictions and extensions have reduced the pressure on industry to develop their agreements, which is expected to reduce new impacts while effective range planning occurs to meet federal requirements.
2.2 ALBERTA ENERGY SUSTAINABILITY STRATEGY
Alberta’s Energy Sustainability Strategy is intended to position Alberta to thrive in an uncertain energy landscape by exploring a long‑term perspective on Alberta’s energy system to anticipate and adapt to emerging issues and developments that may shape energy globally over the next thirty to forty years. During 2016‑17, development of this strategy was paused to support other ministry priorities.
OUTC
OME
2

2016-17 Energy Annual Report 43
As stewards of Alberta’s energy system, the Ministry of Energy is taking a proactive networked approach to managing the many perspectives, relationships and interactions with government, stakeholders and industry who comprise or influence the energy system.
The Alberta CoLab is an in‑house innovation lab launched to advance new tools and methods to assess the changing energy landscape and support the development of strategy and/or policy that is adaptive to disruption in Alberta’s energy system.
In 2016, 38 projects across the Government of Alberta utilized the Alberta CoLab with primary focus on convening work and dialogue on longer‑term energy transition. Projects ranged from the review of royalties to energy diversification taking a futures perspective on clean technology. Since its launch in 2014, the CoLab provided interactive training on systemic design and strategic foresight to over 1200 civil servants, and currently serves in an advising and mentorship role for other jurisdictions launching similar initiative including Ontario, New Brunswick and Manitoba.
The future of Alberta’s energy system is linked with changes happening on a national and international scale. This future will be influenced by a number of factors outside the control of current leaders and stakeholders. For example, the recent decline in the price of crude exposes Alberta’s vulnerability to external shocks and stressors. It is important to look forward and identify how the province can enhance its current performance while preparing for what may lie ahead.
Energy transition will be influenced by both technology and social innovation. As such the CoLab’s structure and portfolio will be modified to incorporate these perspectives as part of work going forward.
2.3 ENHANCED REGULATION & OVERSIGHT OF RESOURCE DEVELOPMENT
The AER completed the Regulatory Excellence project in 2015‑16. This laid the foundation for developing a model for regulatory excellence specific to energy regulation in Alberta and supports the AER’s vision of being recognized for regulatory excellence, ensuring the safe, environmentally responsible development of energy resources for the benefit of all Albertans.
In April 2016, the AER released the Alberta model for regulatory excellence. The model is built around the core attributes of excellence, recognizing that utmost integrity, stellar competence and empathetic engagement are reflected in all the work the AER does.
Key challenges facing a regulatory body such as the AER include the rapid changes in technology, including resource development technology, and stakeholder expectations. By remaining focused on its vision for regulatory excellence to ensure the safe and environmentally responsible development of energy resources for the benefit of Albertans, the regulator has been able to adapt to shifting circumstances and expectations.
The AER established standard management processes to ensure consistency in the work the regulator does and to help mitigate potential risks. After merging three strong regulators into a single regulatory body, clear standards were defined and consistently applied by all staff and leaders to enable the organization to mature into its role as a single regulator.
OUTC
OME
2

2016-17 Energy Annual Report44
The AER has piloted and is now implementing the Integrated Decision Approach for energy development. The Integrated Decision Approach is based on the concept of one application, one review, one decision and is applicable across the life cycle of energy development. This supports efforts to enhance regulation and oversight of energy resource development and increases the effectiveness of AER decisions by focusing on what matters the most to Albertans and making the AER administrative processes more efficient. The approach also offers more transparency, allowing Albertans to see the whole picture of a proposed energy project. This will make it easier to find project information and understand how a project may affect the environment and people nearby. Full implementation of the Integrated Decision Approach will be rolled out incrementally starting with projects for integrated pipeline licensing, and with others to follow.
In 2016‑17, the AER also developed training for its staff in the priority areas of dam safety, mines and pipelines. Further work is underway to identify the skills needed and to strengthen the learning and development in the area of stakeholder and Indigenous engagement in support of shale oil and gas regulatory training.
The AER has also promoted the behaviours that support its culture of integrity, accountability, Albertans‑first views and enterprise‑first thinking to enable employees to move closer to achieving regulatory excellence. The AER’s cultural blueprint outlines how all levels of the organization will work together to put values into action. The right culture will help the AER attract and retain the talented individuals required and ensure they are more productive and engaged in the work they do.
The total cost for the work of the AER in 2016‑17 was $280 million and was fully funded by industry.
2.4 UTILITIES REGULATION
As a trusted leader that delivers innovative and efficient regulatory solutions for Alberta, the AUC is committed to improving its regulatory processes to ensure that they are effective, efficient, open and transparent, and to identify opportunities to reduce regulatory burden and lower costs for consumers. The commission continued to make regulation more relevant and effective through the following initiatives:
• After consultation with industry stakeholders, the commission introduced projects related to streamlining and improving the regulatory processes for rate regulation applications. Through the introduction of technical meetings and the use of issues lists to define the scope of proceedings, the commission can clarify technical aspects of rate‑related applications and improve application processing times by reducing cycle time for information requests between the commission and the applicant. Also, the commission has streamlined many compliance filings by having only the commission review routine issues within compliance filings.
• After consultation with industry stakeholders, the commission made revisions to its AUC Rule 001: Rules of Practice. The revisions were designed to:
– reorganize the rule to mirror the progression of process steps and practices of commission proceedings;
– eliminate provisions that are no longer applicable or useful;
– consolidate overlapping or redundant provisions;
OUTC
OME
2

2016-17 Energy Annual Report 45
– eliminate any gaps identified in the rule; and
– add provisions related to the commission’s enforcement functions.
The commission initiated a proceeding to explore possible regulatory efficiencies with respect to applications by electric and gas utilities to obtain commission approval for the issuance of equity or long‑term debt securities. As a result of the proceeding and with stakeholder input, the commission implemented a rule‑based conditional general exemption in connection with the issuance of equities and long‑term debt. The AUC Rule 031: Conditional Exemption from Specific Financing and Reporting Requirements will achieve the goal of permitting routine securities issuances to proceed without express approval while preserving the commission’s ability to review unusual transactions before they proceed, through a fully developed application process.
During 2015‑16, the AUC approved a new AUC Rule 030: Compliance with the Code of Conduct Regulation. This new regulation consolidated and modified the provisions that were previously contained in separate gas and electric code of conduct regulations. The AUC was required through the Code of Conduct Regulation to review and approve by December 31, 2016 new compliance plans from each distributor, regulated rate provider and affiliated retailer. A total of 42 applications were submitted and all were approved within the legislative timeline, completing the commission’s transition to, and compliance with, the Code of Conduct Regulation.
The AUC implemented an approach to assess the compliance of commission regulated transmission facilities where the application requirements have been streamlined or eliminated. This review assessed, based on self‑reported data, whether transmission facility owners were using a streamlined application process and associated checklists as intended to determine regulatory compliance with requirements for minor transmission facility projects. The compliance review confirmed that facility owners are in compliance and the streamlined approach or eliminated application requirements for capital maintenance projects and minor alterations to transmission facilities has been effective in reducing the number and workload associated with low‑risk applications.
The AUC initiated a generic proceeding to establish parameters for the next generation of performance‑based regulation plans. Performance‑based regulation is a regulatory tool to incent distribution utility companies to be more efficient so that ratepayers can benefit through lower rates over time when compared to a traditional cost‑of‑service model, while still safeguarding system reliability and service quality. This past year the AUC issued its decision and in doing so, established the parameters to be included in the next generation of performance‑based regulation plans to be implemented for the 2018 to 2022 period. Under these plans, distribution utility rates are adjusted annually by means of an indexing mechanism that tracks the rate of inflation, less an offset to reflect the productivity improvements the firm should achieve during the performance‑based regulation plan period, plus other specific adjustments.
The AUC revised and approved changes to AUC Rule 004: Alberta Tariff Billing Code Rules, in order to prepare for the implementation of the provincial carbon levy, which came into effect January 1, 2017. The amendments to the rules reflected input received from stakeholders including natural gas distribution companies, retailers and billing agents, as well as the Office of the Utilities Consumer Advocate, Treasury Board and Finance, and the Department of Energy.
The total cost for the work of the AUC in 2016‑17 was $31 million and was fully funded by industry.
OUTC
OME
2

2016-17 Energy Annual Report46
ADDITIONAL ACHIEVEMENTS
Expanded Engagement with Communities
The Ministry of Energy continues to build ministry capacity for engaging with Albertan communities, including Indigenous communities. Achievements in 2016‑17 included:
• Supporting the department’s efforts in engaging with Indigenous communities on oil sands lease continuations policy discussions;
• Building cultural awareness and engagement capacity; and
• Working with IRMS partners such as the Ministry of Indigenous Relations on initiatives implementing the principals and objectives of the United Nations Declaration on the Rights of Indigenous Peoples.
OUTC
OME
2

2016-17 Energy Annual Report 47
Performance MeasuresPerformance Measure 2.a: Regulatory compliance (AER)
Target
Greater than or equal to 97 per cent of inspections conducted are in compliance with regulatory requirements.
Discussion of Results
This performance measure helps indicate industry’s compliance with regulatory requirements. Regulatory compliance is achieved when the inspection outcome does not result in enforcement action against the licensee. An enforcement action can occur when the licensee has failed to address a serious contravention of rule(s)/regulation(s)/requirement(s), and/or has caused a significant impact to public safety, and/or environment, and/or resource conservation.
Enforcement action is defined as an exercise of statutory power of the regulator in response to a finding of noncompliance including:
• Warning letters;
• Notice of administrative penalties;
• Enforcement orders;
• Prosecutions;
• Imposing of terms and conditions;
• Shutting down of operations; and
• Suspension or cancellation of a licence, approval, permit or reclamation certificate.
In the 2016‑17 fiscal year the AER conducted 10,016 initial inspections. The inspections resulted in the issuance of 90 enforcement actions comprised of 53 suspensions, ten warning letters, ten administrative penalties, 12 orders, one Court of Queen’s Bench Interim Order, and four prosecutions. The 2016‑17 results are within the expected range of compliance and demonstrate progress toward the desired outcome of ensuring industry compliance with regulatory requirements.
Source: Field Surveillance Inspection System database *The results for 2014 have been restated from calendar year to fiscal year. The results reflect data availability from July 1, 2014 when the transition to the new Compliance Assurance Framework began. The results for 2015‑16 and forward are based on fiscal year which aligns with AER’s reporting periods.
2014‑15* 2015‑16 2016‑17
99.5% 99.3% 99.1%
Figure 2.a Regulatory compliance (AER): Percentage of inspections in compliance with regulatory requirements
*The results for 2014 have been restated from calendar year to fiscal year. The results reflect data availability from July 1, 2014 when the transition to the new Compliance Assurance Framework began. The results for 2015‑16 and forward are based on fiscal year which aligns with AER’s reporting periods.
YearNumber of inspections resulting
in a finding of complianceTotal number of
inspections
Percentage of inspections resulting in a finding of
compliance
2016‑17 9,926 10,016 99.1%
2015‑16 11,145 11,228 99.3%
2014‑15* 9,890 9,935 99.5%
OUTC
OME
2

2016-17 Energy Annual Report48
The annual results continue to indicate that, though there were fewer inspections and higher amounts of enforcement actions, overall compliance remains within the expected range due to a strong field presence, focused inspections, and positive relationship with industry.
A significant achievement this year is the publishing of the AER investigation report to make it available to the public. The report provides industry the opportunity to educate themselves on the root cause of the situation, evaluate their practices, and implement changes so as to avoid future noncompliance.
Additionally, the AER continues to refine its proactive surveillance program based on internally defined risk criteria. This past year the AER focused on activities and/or companies that have historically had poor performance, activities that have limited or non‑existent data, and emerging issues or trends. Though fewer inspections were completed in 2016‑17, they provided detailed results and a higher level of scrutiny as demonstrated through the inactive well compliance program and the venting initiative; enforcement actions increased as a result of the focused work, but operator awareness of AER requirements has also increased.
Continued AER activities that contribute to the annual compliance rate remaining within the expected range include:
• Learning and development focusing on areas or activities that require new or specialized skill sets.
• Meeting with companies that historically have poor performance, particularly those identified in the newly released external Pipeline Industry Performance Report.
• Publishing education material and bulletins externally and educating through formal operator awareness sessions, informal presentations, and joint site visits to increase knowledge of directives, rules and regulations.
The economic condition continues to challenge companies to maintain or improve compliance, especially those on the verge of insolvency. As a result overall compliance may decrease in the near future.
Over the next year, the AER intends to continue focused inspections in areas where noncompliance is likely to be found or where data is non‑existent, improve the enforcement action issuance process, and explore additional ways to share lessons learned from investigations and enforcement actions with industry.
OUTC
OME
2

2016-17 Energy Annual Report 49
Performance Measure 2.b: Timeliness of the needs and facility applications (AUC)
Target
100 per cent of needs and facility applications determined within 180 days of the application being deemed complete.
Discussion of Results
In accordance with standards established in Alberta law, the AUC, when considering an application for an approval, permit or licence in respect of a needs identification document, transmission line or part of a transmission line, must make a decision in a timely manner, and if possible, within 180 days after receipt of a complete application.
For 2016, the AUC met this standard 96.7 per cent of the time as 59 of 61 decisions were issued within the 180‑day timeline. The decisions that missed the 180‑day deadline were delayed by scheduling issues involving witnesses from Fort McMurray and unavailability of a venue during the Fort McMurray fires, as well as a procedural complexity related to a First Nations constitutional motion on a Fort McMurray transmission line project.
Source: Alberta Utilities Commission
Figure 2.b Percentage of needs and facility applications determined within 180 days of the application being deemed complete
2012 2013 2014 2015 2016
96.7%93.1%
100%96.3%
93.0%
OUTC
OME
2

2016-17 Energy Annual Report50
Albertans benefit from safe and reliable energy‑related infrastructure and innovative energy technologies.
What this means:Reliable, efficient and resilient energy systems are vital to the social and economic foundation of Alberta. To meet the increasing demand for low emissions energy, energy‑related infrastructure and innovative technology are needed both in Alberta and globally. The ministry manages and collaborates with other ministries, agencies and stakeholders in the development and delivery of effective policies and programs to support energy infrastructure and technology.
Key Achievements:Alberta’s electricity system needs to change to ensure it meets the needs of the future. The Government of Alberta has taken action to create a modern electricity system that has reasonable, predictable prices for consumers, reduces harmful pollution, creates a positive investment climate and remains reliable.
In November of 2016, the Government of Alberta announced a number of key initiatives to support the transition to a cleaner energy future and to meet the needs of a growing province:
• Coal Transition – Transitioning to a cleaner electricity system by phasing out pollution from coal‑fired power generation.
• Renewable Electricity Program – 30 per cent of Alberta’s electricity will come from renewable sources by 2030.
• Capacity Market – Creating a reliable electricity system that is affordable for Albertans and attractive to investors.
• Consumer Protection – Price ceiling to protect consumers from volatile electricity prices.
3.1 Collaborate with other ministries to implement recommendations and manage regulatory requirements from Alberta’s Climate Leadership Plan to establish Alberta as an environmentally responsible energy producer and collaborative partner in overall Canadian efforts to reduce emissions, including:
• leading development of a plan to phase out emissions from coal‑fired electricity generation by 2030;
• leading development of a plan to enable the increased development and use of renewable energy in Alberta by 2030; and
• developing a plan to reduce methane levels for the oil and gas sector by 2030.
3.2 Develop and implement policy to smart regulate Alberta’s electricity retail system that will protect consumers.
Key strategies to achieve this outcome included:
OUTC
OME
3

2016-17 Energy Annual Report 51
3.1 IMPLEMENTATION OF CLIMATE LEADERSHIP RECOMMENDATIONS
Coal Transition
In 2016‑17, the Government of Alberta set out to implement a major component of Alberta’s Climate Leadership Plan by securing the phase‑out of emissions from coal‑generated electricity by 2030. The Ministry of Energy supported Mr. Terry Boston, a consultant who served as the Coal Phase‑out Facilitator in consultations with three coal‑generation companies from April to September 2016. Based on the consultations, Mr. Boston provided recommendations to government that considered solutions that would maintain the reliability of Alberta’s electricity grid, maintain reasonable stability of prices for consumers, and avoid unnecessary stranding of capital of the coal‑fired electricity generators. Mr. Boston provided a letter on September 30, 2016 to Premier Notley containing his advice.
On November 24, 2016, based on Mr. Boston’s advice, the government announced agreements with TransAlta, Capital Power and ATCO to end emissions from coal‑fired generation by 2030. As part of the agreements, the companies will receive annual payments of $97 million until 2030, funded from carbon revenues, not electricity consumer bills. These agreements will enable the three Alberta‑based companies the opportunity to participate fully in the transition to a lower‑carbon electricity system. The agreements also ensure that the companies spend a specific amount every year to support communities, employ a certain number of people, keep their head offices in Alberta and continue to invest in Alberta’s electricity system. Bank and financial analyst reports in Canada and the United States reacted positively to the news of the agreements.
The ministry worked collaboratively across the Government of Alberta and its agencies as part of the work on coal transition in recognition that many public policy issues are increasingly interrelated. Through this process, it emerged that this file could have also benefited from a coordinated or integrated approach to stakeholder engagement. There are often many stakeholders and partners involved as the policy issues span across a number of sectors. Coordinating engagement activities with relevant partners on an issue as complex as coal transition was a significant challenge. The ministry gained some insights on partnering on stakeholder engagements, and is interested in exploring ways to ensure that its future engagement activities are coordinated with the interrelated engagement activities of other ministries to the greatest extent possible.
By December 31, 2030, all of Alberta’s coal‑fired electricity generators will shut down unless they can operate without releasing any emissions. This enables Alberta to demonstrate its commitment to environmental protection and mitigate climate change. The announcement in fall 2016 of the Government of Canada’s intent to institute a performance standard for coal generators by December 31, 2029 supports the province’s early action.
Promoting the Development of Renewable Energy
The electricity market in Alberta is currently oversupplied, which has resulted in historically low electricity prices in Alberta for more than a year now. This is partly because of lower economic growth in Alberta over the past couple of years and also the availability of a significant amount of excess electricity generation capacity in the province.
Consequently, the market has not seen the need for investing in new generation capacity simply because the current supply and demand outlook for electricity and the prevailing price levels do not support a
OUTC
OME
3

2016-17 Energy Annual Report52
prospect for making a reasonable return on investment. As a result, there has been very modest growth in renewable generation, especially in wind power, since 2014.
In 2016, renewable generating capacity was 2,831 megawatts; this represents ten per cent of total electricity generation.
Alternative and Renewable Generating Capacity (megawatts)
2012 2013 2014 2015 2016
Wind 1,113 1,113 1,459 1,491 1,491
Hydro 900 900 900 902 916
Biomass 414 417 438 424 424
Total Renewable Generating Capacity 2,427 2,430 2,797 2,817 2,831
Gas Cogeneration1 4,051 4,160 4,165 4,372 4,743
Total Alternative and Renewables Generating Capacity2 6,478 6,590 6,962 7,189 7,574
Source: Alberta Utilities Commission Notes: 1 The gas cogeneration in Alberta is primarily for self‑supply in oil sands operations and its growth is highly dependent on the growth in oil sands
development. The growth in gas cogeneration over the past two years were likely because of the completion of oil sands projects whose constructions had commenced in the prior years.
2 Alternative and renewable generation capacity in Alberta includes wind, hydroelectricity, biomass, and natural gas cogeneration technologies.
In phasing out coal‑fired electricity by 2030, government also intends to encourage the development and progressive growth of renewable electricity generation. During 2016‑17, two landmark initiatives were undertaken to ensure that renewable sources have a key place in the future of energy in Alberta. In December 2016, the Renewable Electricity Act came into force, setting a target that at least 30 per cent of the electricity produced in Alberta will be from renewable sources by 2030.
On November 3, 2016, the government announced the Renewable Electricity Program which will put Alberta on the path to achieve the 30 per cent target by encouraging the growth of renewable energy generation such as wind, solar, geothermal, sustainable biomass and hydro. The Renewable Electricity Program will add 5,000 megawatts of renewable electricity capacity by 2030 using a competitive process administered by the Alberta Electric System Operator (AESO). The Department of Energy is working closely with AESO to provide policy guidance, coordinate approvals, and ensure alignment with other climate and electricity initiatives. The first auction was launched March 31, 2017 and is designed to deliver a maximum of 400 megawatts by the end of 2019.
In developing the Renewable Electricity Act and the Renewable Electricity Program, the ministry worked closely with partners such as the Alberta Climate Change Office and the AESO. The successful development of this legislation and program reinforced that early and frequent engagement with partners is critical. Projects that start under the Renewable Electricity Program will also move through the province’s regulatory system.
The Renewable Electricity Program will play a key role in Alberta’s Climate Leadership Plan by helping to displace electricity generation from high‑emitting technologies to low‑carbon technologies. At the same time, it will also support economic growth and market diversification by promoting growth in the renewable
OUTC
OME
3

2016-17 Energy Annual Report 53
generation sector. With the increased use of renewable sources of electricity, Albertans can continue to have reliable and reasonably‑priced electricity.
The province is also encouraging Albertans and communities to get involved in the shift to greener electricity. In December 2016, amendments were made to the Micro‑generation Regulation to allow for bigger projects and a greater variety of project configurations. These changes give Albertans the opportunity to meet their own electricity needs from renewable sources, which is a step closer to meeting our 30 per cent renewable electricity target by 2030. It is one of the many ways that Alberta is demonstrating leadership on climate issues.
Changes to the regulation that governs micro‑generation include increasing the size limit to five megawatts from one megawatt and allowing a micro‑generating system to serve adjacent sites, which is especially helpful for operations with more than one building, such as farms. The revisions allow for more flexibility and a greater variety of configurations. For example, a farm operation or a university campus could have multiple buildings served by one micro‑generation system.
During the consultations for micro‑generation, Albertans expressed interest in having the opportunity to export surplus electricity to the grid. In response, the government will examine opportunities to enable electricity exports to the grid when it makes changes to the Hydro and Electric Energy Act to enable community generation connected to the electricity distribution system. Enabling communities across the province to participate in green energy initiatives supports Alberta’s Climate Leadership Plan.
The Alberta Utilities Commission (AUC) initiated a consultation into changes to the AUC Rule 024: Rules Respecting Micro‑Generation. The proposed changes to Rule 024 arise from amendments to the Micro‑Generation Regulation which allows for increased micro‑generation capacity, and comments received from industry representatives to enhance micro‑generation connection processes. The commission anticipates approving a new rule in the coming year.
Methane Reduction
As part of the 2015 Climate Leadership Plan, the government announced a 45 per cent reduction target for methane emissions from the oil and gas sector levels by 2025 from 2014 levels. The Department of Energy is collaborating with the Alberta Climate Change Office and the Alberta Energy Regulator (AER) on the Methane Emissions Reduction Initiative.
In 2016‑17, government developed and implemented a plan to engage with industry, environmental groups, Indigenous communities and the public. This involved the launch of a multi‑stakeholder process to provide expertise and input into the development of regulatory standards to reduce methane emissions from the oil and gas sector. The Ministry of Energy also participated on the multi‑stakeholder Methane Reductions Oversight Committee and associated technical committees that include representatives from the oil and gas industry, environmental non‑government organizations, and research and technical organizations to provide recommendations and help guide the development of regulatory standards on methane reductions actions. There is ongoing intergovernmental engagement between Environment and Climate Change Canada and the western provinces to coordinate methane action federally and between oil and gas producing provinces.
OUTC
OME
3

2016-17 Energy Annual Report54
3.2 SMART REGULATION OF ALBERTA’S ELECTRICITY SYSTEM TO PROTECT CONSUMERS
As announced on November 22, 2016, the Government of Alberta is protecting families, farms and small businesses with a ceiling on electricity prices as the province makes the necessary reforms to the electricity system. When fully implemented in June 2017, the government’s rate ceiling will ensure that Albertans pay no more than 6.8 cents per kilowatt hour – an available long‑term contract rate – for electricity over four years. During the period from June 2017 to June 2021, consumers on the Regulated Rate Option (RRO) will pay the lower of the market rate or the government’s ceiling rate. RRO providers will be compensated should the approved rate exceed 6.8 cents per kilowatt hour.
Historically, regulated electricity rates have been extremely volatile – increasing by as much as 65 per cent (or 4.66 cents per kilowatt hour) in a single month (April 2011) and crashing by as much as 42 per cent (or 4.14 cents per kilowatt hour) in a single month (June 2014).
Transition to an Electricity Capacity Market
In November 2016, the Government of Alberta announced that the province’s electricity system would transition from an energy‑only market to a capacity market framework. In Alberta’s current energy‑only market, generators are paid for electricity produced based solely on the wholesale price of electricity, which fluctuates as electricity prices are based on supply and demand. In a capacity market, private power generators are paid through a mix of competitively auctioned contracts, which pay the fixed capital costs, and from revenue from the energy (or spot) market. Capacity markets are used throughout the world, including in the United States and United Kingdom.
A capacity market allows the province to ensure that future electricity demand can be met and ensures that investment in new generation will occur at sufficient levels to provide a reliable supply of electricity at stable, affordable prices.
The need to transition the province’s existing energy‑only market to a capacity market was driven by analysis that shows the current energy‑only market would not support the investment in generation needed to meet the projected growth in electricity use in Alberta. This analysis is consistent with recommendations from external experts and AESO.
The transition from an energy‑only market to a capacity market framework is critical to the success of a number of government policy initiatives in the electricity sector. It will ensure that investment in new generation occurs at sufficient levels to maintain both long‑term electricity reliability and reasonable costs to consumers.
The transition to a capacity market framework must be done with thorough consideration of many different components of the electricity sector and extensive stakeholder involvement. As such, the new framework will be in place in 2021, and the Department of Energy has been engaged in internal preparations and planning for the work to be done in the coming years.
The Department of Energy has directed the AESO to lead the technical design of the capacity market and provide recommendations to government, while the department leads the policy design and necessary legislative amendments. AESO’s stakeholder technical engagement process commenced in January 2017.
OUTC
OME
3

2016-17 Energy Annual Report 55
Making the transition is a complex effort. The complexity of the design work and the significant number of interdependent changes and decisions that need to be made has potential to create challenges. A delay in one change or decision could have a negative cascading impact on implementation timelines. Design will take two to three years, and includes creation of legislative and regulatory oversight of the capacity market, development of market and procurement rules, and establishment of agency roles and responsibilities. Changes may also be required to the legislation, regulations, and rules overseeing the energy and ancillary services markets to ensure integration of the three elements of the capacity market framework. In making the transition, government will work with stakeholders and partners to ensure that all components of the electricity sector and their interdependencies are examined in the market redesign.
The cost of all departmental electricity related activities, including coal transition, renewable electricity program, and transition to a capacity market, but excluding coal transition agreements in 2016‑17 was $6.4 million.
ADDITIONAL ACHIEVEMENTS
Pipeline Safety
The AER regulates development in a way that reduces risk and ensures Albertans reap the economic rewards of energy resources. Preventing incidents ensures that Alberta’s energy related infrastructure is safe and reliable. Current economic conditions have also affected pipeline operators, resulting in some operations being turned over to receivership processes. AER is taking incremental steps to reduce the number of high‑consequence pipeline incidents and will continue to set the bar higher each year and take action to ensure that performance improves steadily.
In addition to taking enforcement actions when required, the AER achieves the outcome by examining incident data, adopting a risk‑based approach and by enhancing the investigation process. The AER is also developing a program to evaluate the effectiveness of pipeline licensees’ safety and loss management systems. The program aims to ensure that adequate systems have been implemented, which will ultimately result in fewer pipeline incidents and greater licensee accountability. This work is part of broader regulator efforts to ensure Alberta’s pipeline systems are safe and reliable.
AER believes that all pipeline incidents are preventable, and is taking steps to ensure that operators follow the rules and continue to focus on good pipeline management and incident prevention. Pipeline performance is about more than just complying with our requirements. It’s about going above and beyond and making sure that pipelines are safe and that the environment and Albertans are protected.
AER is committed to regularly reporting on industry performance in an effort to provide more transparency to the public about the energy development activities we regulate, hold operators more accountable for their actions, and drive industry to improve its performance.
The number of high consequence pipeline incidents was 31 in 2016‑17, 30 in 2015‑16, and 52 in 2014‑15. Over the past two fiscal years, the number of high consequence pipeline incidents fell by 40 per cent as the length of pipelines grew. This drop is a result of better industry education, improved inspection programs, and a greater focus on pipeline safety in the energy industry. In February 2017, as part of its commitment to industry performance, the AER issued the external Pipeline Performance Report which highlights those operators that are performing well, and those that need to make improvements.
OUTC
OME
3

2016-17 Energy Annual Report56
An important next step to improve pipeline performance is to gain a better understanding of the cumulative impacts that pipeline releases are having on the environment—especially where vulnerable species and habitats exist. The AER will do this by assessing the environmental impacts of pipeline releases and working with operators to place a greater focus on pipelines in sensitive areas.
Carbon Capture and Storage
Throughout 2016‑17, the Department of Energy continued to monitor, administer and ensure compliance under the carbon capture and storage funding agreements for both the Quest and Alberta Carbon Trunk Line projects. The Alberta Carbon Trunkline Project has had some delays in construction as the final stages of financing for the project are completed. Currently the project is scheduled to complete construction in mid 2018. To date, the Quest project has successfully injected well over one million tonnes of carbon dioxide since mid 2015 and has received payment for the carbon dioxide sequestered in its first year of operation. The payment process involved a third‑party certifying the tonnes of carbon dioxide sequestered. This process also provides confidence in the volume of carbon dioxide accounted for in the Post‑closure Stewardship Fund. Based on the first ever certification process, the ministry sees value in increased knowledge‑sharing and collaboration with other departments going forward, particularly on raising awareness of the technical aspects of the third‑party certification process. As of March 31, 2017, a total of $491 million has been paid to the two projects.
The Post‑closure Stewardship Fund is financed by the carbon capture and storage operators in Alberta. It is a liability fund that collected the first of its Injection Levy during 2016 to help provide for the maintenance of carbon capture and storage sites by the Government of Alberta, after carbon capture and storage operations cease and the government assumes liability for any stored carbon dioxide.
OUTC
OME
3

2016-17 Energy Annual Report 57
Performance MeasuresPerformance Measure 3.a: Transmission Losses
Target
To maintain a minimum level in transmission line losses. The target for 2016‑17 was 3.0 ± 0.3 per cent.
Discussion of Results
Electricity is a facilitator of economic development in Alberta. A reliable and resilient electricity transmission system is required to ensure electricity can be delivered where and when it is needed. By ensuring development of a robust transmission system, renewable or thermal generators will know that they will be able to efficiently move their product to market, and to the consumers that depend on it day in and day out. The transmission system has been, and continues to be built to accommodate greater amounts of renewable energy to support Alberta’s transition to a low carbon grid. Existing and near‑term infrastructure projects are expected to support greater amounts of renewable generation in the south and central‑east regions. Generally there is renewable energy potential throughout the province. Optimal use of power from these sources depends on our ability to bring it to where it is needed.
Transmission losses are an indicator of efficiency of the transmission system. A transmission system with adequate capacity will have lower losses than a system that requires upgrading. The hourly volumes of line losses vary based on load and export levels, the distance between generation and load, and changes in the transmission topology. Transmission and generation outage schedules, unplanned transmission and generation outages, and market dispatches also affect the volume of losses. The value of line losses is calculated on the hourly pool price.
The transmission line loss of 2.8 per cent for 2016 meets the target of 3.0 ± 0.3 per cent. Transmission line losses are an indicator of system efficiency and optimization. The benefits of maintaining low transmission line losses for Albertans are lower system costs, reduced wasted energy, and the environmental benefits associated with the need for less electricity generation.
Source: Alberta Electric System Operator
2012ACTUAL
2013 2014 2015 2016
2.8%2.9%3.1%
2.9% 2.9%
Figure 3.a Transmission Line Losses (%)(YEAR ENDING DECEMBER 31)
OUTC
OME
3

2016-17 Energy Annual Report58
Performance Measure 3.b: Power Generation
Target
Maintain a minimum seven per cent margin over peak demand.
Discussion of Results
Alberta’s economic prosperity and high standard of living relies on access to reliable and plentiful electricity. Maintaining a reliable and resilient electricity system as measured by the health of the power margin is a key objective of every electric system around the world.
For this measure, the desired outcome is to maintain a minimum seven per cent margin over the annual peak demand. The seven per cent margin is a specific identifiable reliability requirement set by the Western Electricity Coordinating Council, the regional entity responsible for coordinating electric system reliability in several jurisdictions in Canada, United States and Mexico.
In 2016, electricity market’s performance with respect to the firm generation capacity margin over the annual peak demand was beyond achieving the desired outcome as it succeeded to maintain the margin at a substantially higher level of 29 per cent. This represented a solid 22 percentage points over and above the minimum seven per cent requirement. Softer growth in demand for electricity in 2016 due to lower overall economic growth in the province was the main external factor that contributed to achieving a high margin. There are no issues or downsides arising from the electricity market achieving margins significantly above the desired outcome.
Firm electricity generating capacity was calculated at 14,727 megawatts (MW) for 2016. This was a 388 MW (or 2.7 per cent) increase over the 2015 level. The peak demand in the winter period of the climatic year (October 1, 2016 to March 31, 2017) was 11,458 MW. This was 476 MW (or 4.3 per cent) higher than the peak of 10,982 MW set in the winter climatic year (October 1, 2015 to March 31, 2016).
Under Alberta’s current energy‑only system, the province defers to market forces and private investors to build generation when needed and to determine the amount of the excess firm generating capacity to meet the highest system demand when it occurs. The electricity sector in Alberta is currently facing the prevalence and persistence of a historically low electricity price environment. Low electricity prices combined with higher compliance costs for environmental performance by coal‑fired generating units have diminished the generators’ returns.
Further, there have recently been significant changes in government policy affecting electricity generation in Alberta. After the federal government instituted end‑of‑life dates for coal‑fired units in 2012 – which are
Sources: Alberta Utilities Commission, Alberta Electric System Operator, and Alberta Department of Energy.Notes: Through industry investment, Alberta’s net supply margin of electricity will be sufficient to ensure reliable power supply.1 Firm Generating Capacity excludes:
• wind power, which is not dispatchable on a consistent basis;• small hydro, which has minimal storage capability for operation during winter,
when peak demand occurs;• 25 per cent of large hydro, to reflect limitations on its output during winter,
when peak demand occurs; and• tie line capacity, which is not dispatchable on a consistent basis.
Figure 3.b Power Generation: Margin between Firm Generating Capacity1 and Peak Demand(YEAR ENDING DECEMBER 31)
2012 2013 2014 2015 2016
29%
18%21%
18%
31%
ACTUAL
OUTC
OME
3

2016-17 Energy Annual Report 59
expected to lead to unit retirements beginning in 2019 at the latest – Alberta announced that emissions from coal‑fired electricity generation will be phased out by 2030, an acceleration from the federal end‑of‑life dates for 6 of 18 units. The federal government has since announced its intention to amend its regulations to require strict emissions controls on all units by the end of 2029. Alberta has also committed to supporting greater deployment of renewable electricity generation, in transitioning to a lower‑emissions electricity grid.
Moreover, based in part on analysis indicating financial sector reluctance to finance investments in Alberta’s volatile energy‑only market structure, the AESO made an assessment that the current energy‑only market could no longer be the right framework to support the investment in generation needed to meet both projected growth in electricity use and replacement of retiring supply, and made a recommendation to the government to transition to a capacity market. As such, there is work currently underway to transition Alberta’s electricity market to a capacity market framework. The most salient feature of a capacity market is for government to mandate and administratively provide for sufficient private investment in electricity generation capability for the province instead of relying just on the energy‑only market to serve that function. Based on the current timelines, a capacity market is due to be in place in Alberta in 2021.
OUTC
OME
3

2016-17 Energy Annual Report60

2016-17 Energy Annual Report 61
Appendix A: Energy Highlights
Resource 2015‑16 2016‑17
Bitumen Revenue $1.22 billion $1.48 billion
Percentage of non‑renewable resource revenue 44% 48%
Bitumen wells drilled1 883 (2015) 610 (2016)
Total bitumen production in barrels per day (bbl/d) 2.53 million bbl/d (2015)
2.54 million bbl/d (2016)
Marketable bitumen and Synthetic Crude Oil (SCO) production
2.37 million bbl/d (2015)
2.41 million bbl/d (2016)
Conventional Crude Oil
Revenue $0.69 billion $0.72 billion
Percentage of non‑renewable resource revenue 25% 23%
Average price for West Texas Intermediate (WTI) US$45.00/bbl US$47.93/bbl
Conventional crude oil production 0.53 million bbl/d (2015)
0.44 million bbl/d (2016)
Pentanes plus and condensate production 0.18 million bbl/d (2015)
0.22 million bbl/d (2016)
Crude oil wells drilled1 912 (2015) 836 (2016)
Total Crude andEquivalent
Revenue $1.91 billion $2.20 billion
Production (conventional, marketable bitumen and SCO, pentanes plus and condensates)
3.08 million bbl/d (2015)
3.08 million bbl/d (2016)
Total crude oil deliveries 3.49 million bbl/d (2015)2
3.65 million bbl/d (2016)
* To the United States 72% 73%
* Within Alberta 15% 13%
* To rest of Canada 13% 13%
* Offshore 0% 0%
Natural Gas and By‑Products
Revenue $0.49 billion $0.52 billion
Percentage of non‑renewable resource revenue 18% 17%
Average Alberta Gas Reference Price (ARP) $2.21/GJ $2.01/GJ
Number of conventional natural gas wells drilled1 1,145 (2015) 811 (2016)
Total marketable natural gas production including Coalbed Methane (CBM)
3.7 Tcf (2015) 3.7 Tcf (2016)
Coalbed Methane production 0.24 Tcf (2015)3 0.23 Tcf (2016)
Total natural gas deliveries 4.45 Tcf (2015) 4.65 Tcf (2016)
* To the United States 34% 36%
* Within Alberta 36% 37%
* To rest of Canada 30% 28%
Notes: 1 Data on wells drilled include both development and exploratory wells. Last year’s annual report contained data on development wells only.2 2015 total crude oil deliveries result has been retroactively revised, due to the change in the data source.3 2015 number is retroactively revised, on the basis of an updated source.

2016-17 Energy Annual Report62
Resource 2015‑16 2016‑17
Bonuses and Sales of Crown Leases
Revenue from bonuses and sales of Crown leases
$0.20 billion $0.20 billion
Revenue from rentals and fees $0.17 billion $0.15 billion
Average price per hectare (ha) paid at petroleum and natural gas rights sales
$158.64 $194.16
Petroleum and natural gas hectares sold at auction
1,284,907 ha 977,223 ha
Average price per hectare paid for oil sands mineral rights
$42.30 $239.35
Oil sands hectares sold at auction 39,909 ha 55,458 ha
Freehold Mineral Tax
Revenue $79 million $57 million
Wells and Licenses
Well Licenses issued 4,646 (2015) 3,530 (2016)
Industry drilling 5,371 (2015) 5,117 (2016)
Coal Revenue $14 million $26 million
Established coal reserves (estimate) 33.2 billion tonnes
33.2 billion tonnes
Raw coal production 30.2 million tonnes (2015)
29.6 million tonnes (2016)
Total marketable coal deliveries 27.4 million tonnes (2015)
26.1 million tonnes (2016)
Percentage of total coal deliveries exported out of province
15% (2015) 14.5% (2016)
Electricity Total generation capacity in Megawatts (MW) 16,133 MW (2015)
16,525 MW (2016)
Total generation capacity from renewable sources 2,817 MW (2015)
2,831 MW (2016)
Total generation capacity from coal 6,267 MW (2015)
6,273 MW (2016)
Metallic and Industrial Minerals
Metallic and Industrial minerals Royalty Revenues (MINRS)
$774,577 $511,693
Hectares of mineral permits issued to exploration companies (LAMAS,MIM Permits and New Application Issued)
1.3 million ha 1.5 million ha
APPENDIX A: ENERGY HIGHLIGHTS

2016-17 Energy Annual Report 63
Appendix B: Performance Measure Methodologies
Performance Measure 1.a: Revenues from oil, oil sands, gas and land sales bonuses are fully collected
Oil:Oil royalty volumes owed to the Crown are calculated in the Royalty and Marketing (RAM) system. The volumes owed to the Crown are taken in kind, rather than invoiced. The volumes owed are imported from RAM into the Crude Oil Operations (COO) system. Reconciliations between the volumes calculated by RAM and the volumes actually delivered by industry are performed by the department, who also follows up and resolves any discrepancies. The department collects the revenue for the Crown’s volumes marketed either directly, or by the Crown’s agents, then calculates the net value of all royalty sales, and remits the proceeds to Treasury Board and Finance.
Oil Sands:Oil Sands Administrative and Strategic Information System (OASIS) calculates the monthly amounts to be collected based on the Good Faith Estimates, the Monthly Royalty Calculations and the Non‑Project Royalty reports and annual adjustments based on the End of Period Statements. All royalty reporting must be submitted electronically to the Department of Energy, using the web‑based Electronic Transfer System (ETS). OASIS then sends the charge information to the Corporate Accounting and Reporting System (CARS2). During these processes, there are limited manual interfaces. An information report is available from OASIS to identify the reconciliation of OASIS to CARS2 charge transfers.
Land Sale Bonuses:The majority of oil sands and petroleum and natural gas agreements are acquired through a public tender process. Each year the department holds an average of 24 public sales, referred to as “Public Offerings.” The word “sale” is used by tradition, although it is a misnomer, since the Crown always retains title to its minerals. The rights are leased, not sold. The process is an auction, in which companies or individuals submit bids on a parcel of oil sands or petroleum and natural gas rights. The highest bidder for each parcel is generally awarded an agreement.
Individuals or companies submit a posting request electronically to the department through web‑based ETS. The Public Offering, available on the department’s website, is published eight weeks in advance of the sale date. Bidders can electronically submit bids for sale parcels through ETS until noon on the sale day. After this deadline, a user cannot submit or withdraw a bid.
The total bid for each parcel must include a $625 agreement issuance fee, the first year’s annual rental of $3.50 per hectare, and the bonus amount, as determined by the bidder. For oil sands rights, the standard minimum bonus bid is $2.50 per hectare for leases and $1.25 per hectare for permits. For petroleum and natural gas rights, the standard minimum bonus bid is $2.50 per hectare for leases and $1.25 per hectare for licences. The Electronic Funds Transfer is the form of payment accepted for winning bids. The results of the sale are published on the department’s website by 3:30 p.m. on the sale day. The sale results include the parcel number, the name of the successful bidder and the bonus amount paid for each parcel.

2016-17 Energy Annual Report64
After the sale, winning bids are uploaded from ETS to the Land Automated Mineral Agreement System (LAMAS). The following day, winning bids are uploaded from LAMAS to the Alberta Mineral Information (AMI) system. Payments are typically pulled electronically through LAMAS via EFT (Royal Bank on behalf of the department) on the day of the sale or the following day. Payments are then transferred to CARS2 as Revenues and Receivable. Payment is reflected in CARS2 as Cash in Transit and Receivables, which are then entered into IMAGIS.
Gas:The Mineral Revenues Information System (MRIS) receives the data to perform monthly royalty calculations and generates a Gas Royalty Invoice on a monthly basis. MRIS passes a file to CARS2 and a Statement of Account is generated on or before the fifteenth of each month in MRIS and then issued to industry. Payments are due on the last day of the month. Aged Analysis reports are generated monthly on the CARS2 system. Collection action occurs on accounts that are past due.
Performance Measure 1.b: Alberta’s oil sands supply share of global oil consumption
This measure is calculated as the annual ratio of the total number of barrels of Alberta oil sands production over the total number of barrels of world oil consumption:
APPENDIX B: PERFORMANCE MEASURE METHODOLOGIES
The total for annual barrels of Alberta oil sands production is the sum of total mined and in‑situ bitumen production in any given calendar year. Bitumen production data is calculated from Alberta Energy Regulator’s (AER) reports. Global oil consumption data is based on the Oil Market Report, published by the International Energy Agency.
Performance Measure 2.a: Regulatory compliance
The AER established a target of 97 per cent for this measure in 2014 based on data compiled during the transition to the new compliance assurance framework, which better reflects its new authorities and mandate. The target is the expected percentage of inspections conducted that are in compliance with regulatory requirements.
AER staff inspects operations of the upstream oil and gas and coal mining industries with respect to the drilling, production, and disposal of hydrocarbons and associated wastes. All inspection results are recorded into the Field Surveillance Inspection System (FIS) and result in an outcome of either compliant or noncompliant. If the inspection is noncompliant the triage tool is used to assess the significance of the noncompliance and determine the need for an investigation.
If an investigation is warranted, information and evidence is collected relevant to the noncompliance. The investigation will determine if an enforcement action is required.
The data is based on inspections performed in the following activities: drilling operations, gas facilities, oil facilities, pipelines, well servicing operations, drilling waste, well sites, coal mines, mineable oil sands and waste management facilities, and is counted based on the year the inspection was initiated.
Annual Barrels of Alberta Oil Sands Production
Barrels of World Oil Consumption=

2016-17 Energy Annual Report 65
APPENDIX B: PERFORMANCE MEASURE METHODOLOGIES
Performance Measure 2.b: Timeliness of the needs and facility applications
The statutory deadline for issuing decision reports is 180 days, with possible 90‑day extensions under certain circumstances. These statutory timelines begin on the date when the Alberta Utilities Commission deems the application complete. The status of applications is tracked daily.
Performance Measure 3.a: Transmission losses
Every year the Alberta Electric System Operator (AESO) publishes two data points required for transmission line loss calculations: Alberta’s annual internal load (in gigawatt hours) and line losses (in gigawatt hours). The calculation for this performance measure is:
Source Documentation: AESO publishes Alberta’s annual internal load each year in its Annual Market Statistics report. AESO publishes line losses each year in its Annual Report. AESO calculates line losses as follows:
Performance Measure 3.b: Power generation
The intent of the measure is to demonstrate that there is sufficient margin between firm electricity generating capacity and peak demand. The margin for the measure is reported as the percentage megawatt difference between firm generating capacity and peak demand. For this performance measure, all wind and a portion of the hydro capacity, which are not dispatchable on a consistent basis, are excluded from the total installed generating capacity. Peak demand is defined as the highest hourly recorded system demand (in megawatt‑hours) in the climatic year (October 1, 2016 through to March 31, 2017) as recorded by the AESO.
Transmission Losses (%) 100%
Line Losses
Alberta’s annual internal load volumes= x
Line Losses (Total Generation + Imports) (Total Consumption + Exports)= –

2016-17 Energy Annual Report66

2016-17 Energy Annual Report 67
Financial Information

2016-17 Energy Annual Report68

2016-17 Energy Annual Report 69
MINISTRY OF ENERGY
FINANCIAL STATEMENTSFor the year ended March 31, 2017
Independent Auditor’s Report
Consolidated Statement of Operations
Consolidated Statement of Financial Position
Consolidated Statement of Change in Net Debt
Consolidated Statement of Cash Flows
Notes to Consolidated Financial Statements
Schedules to Consolidated Financial Statements

2016-17 Energy Annual Report70
Independent Auditor’s Report
To the Members of the Legislative Assembly
Report on the Consolidated Financial Statements
I have audited the accompanying consolidated financial statements of the Ministry of Energy, which comprise the consolidated statement of financial position as at March 31, 2017, and the consolidated statements of operations, change in net debt and cash flows for the year then ended, and a summary of significant accounting policies and other explanatory information.
Management’s Responsibility for the Consolidated Financial Statements
Management is responsible for the preparation and fair presentation of these consolidated financial statements in accordance with Canadian public sector accounting standards, and for such internal control as management determines is necessary to enable the preparation of consolidated financial statements that are free from material misstatement, whether due to fraud or error.
Auditor’s Responsibility
My responsibility is to express an opinion on these consolidated financial statements based on my audit. I conducted my audit in accordance with Canadian generally accepted auditing standards. Those standards require that I comply with ethical requirements and plan and perform the audit to obtain reasonable assurance about whether the consolidated financial statements are free from material misstatement.
An audit involves performing procedures to obtain audit evidence about the amounts and disclosures in the consolidated financial statements. The procedures selected depend on the auditor’s judgment, including the assessment of the risks of material misstatement of the consolidated financial statements, whether due to fraud or error. In making those risk assessments, the auditor considers internal control relevant to the entity’s preparation and fair presentation of the consolidated financial statements in order to design audit procedures that are appropriate in the circumstances, but not for the purpose of expressing an opinion on the effectiveness of the entity’s internal control. An audit also includes evaluating the appropriateness of accounting policies used and the reasonableness of accounting estimates made by management, as well as evaluating the overall presentation of the consolidated financial statements.
I believe that the audit evidence I have obtained is sufficient and appropriate to provide a basis for my audit opinion.
Opinion
In my opinion, the consolidated financial statements present fairly, in all material respects, the financial position of the Ministry of Energy as at March 31, 2017, and the results of its operations, its changes in net debt and its cash flows for the year then ended in accordance with Canadian public sector accounting standards.
June 19, 2017
Edmonton, Alberta
Original signed by Merwan N. Saher, FCPA, FCA Auditor General

MINISTRY OF ENERGYCONSOLIDATED STATEMENT OF OPERATIONSYear ended March 31, 2017(in thousands)
2016Budget Actual Actual
(Note 21)
Revenues (Schedule 1)Non-Renewable Resource Revenue 1,363,692$ 3,097,162$ 2,789,120$ Freehold Mineral Rights Tax 71,000 57,059 79,395 Industry Levies and Licenses 303,441 300,114 303,338 Other Revenue (Note 3) 6,143 10,265 89,349 Net (Loss)/Income from Government Business Enterprises 28,800 (1,921,895) 20,490
1,773,076 1,542,705 3,281,692
Expenses - Directly Incurred (Schedule 2)Ministry Support Services 7,143 7,650 7,460 Resource Development and Management 91,105 92,993 101,508 Bioenergy Initiatives - - 70,498 Cost of Selling Oil 156,308 57,752 77,168 Climate Leadership Plan - 1,118,786 - Carbon Capture and Storage 202,202 30,659 159,873 Energy Regulation 245,416 245,959 249,113 Utilities Regulation 36,238 31,123 33,293 Orphan Well Abandonment (Note 4) 30,500 31,028 31,111 Post-Closure Expense 230 - -
769,142 1,615,950 730,024
Annual (Deficit)/Surplus 1,003,934$ (73,245)$ 2,551,668$
The accompanying notes and schedules are part of these consolidated financial statements.
2017
2016-17 Energy Annual Report 71

MINISTRY OF ENERGYCONSOLIDATED STATEMENT OF FINANCIAL POSITIONAs at March 31, 2017(in thousands)
2017 2016Actual Restated
(Note 21)
Financial AssetsCash and Cash Equivalents (Note 5) 274,136$ 84,600$ Accounts Receivable (Notes 6) 284,830 151,951 Inventory for Resale (Note 7) 914 277 Pension Assets/(Obligations) (Note 8) 918 (1,457) Equity in Government Business Enterprises
Alberta Petroleum Marketing Commission (Schedule 3) 65,073 34,965 The Balancing Pool (Schedule 4) (1,952,003) -
(1,326,132) 270,336
LiabilitiesAccounts Payable and Accrued Liabilities 98,082 382,361 Gas Royalty Deposits (Note 9) 112,066 212,952 Unearned Revenue 67,110 69,097 Tenant Incentives (Note 10) 20,947 22,323 Coal Phase-Out Agreements (Note 11) 1,114,613 -
1,412,818 686,733
Net Debt (2,738,950) (416,397)
Non-Financial AssetsTangible Capital Assets (Note 12) 91,381 95,054 Prepaid Expenses 12,258 12,333
Net Liabilities (2,635,311) (309,010)
Net Liabilities at Beginning of Year (309,010) (458,479) Annual Surplus (73,245) 2,551,668Net Financing Provided For General Revenues (2,253,056) (2,402,199)Net Liabilities at End of Year (2,635,311)$ (309,010)$
Contingent Liabilities, Contractual Obligations and Program Committments (Notes 13, 14 and 15)
The accompanying notes and schedules are part of these consolidated financial statements.
2016-17 Energy Annual Report72

MINISTRY OF ENERGYCONSOLIDATED STATEMENT OF CHANGE IN NET DEBTAs at March 31, 2017(in thousands)
2016Budget Actual Actual
(Note 21)
Annual (Deficit)/Surplus 1,003,934$ (73,245)$ 2,551,668$
Acquisition of Tangible Capital Assets (Note 12) (15,399) (17,932) (16,855) Amortization of Tangible Capital Assets (Note 12) 19,888 21,530 22,517 Loss on Disposal of Tangible Capital Assets 75 368 Proceeds on Disposal of Tangible Capital Assets - 18 Decrease/(Increase) in Prepaid Expenses 75 (803) Net Financing Provided For General Revenue (2,253,056) (2,402,199)
Decrease/(Increase) in Net Debt (2,322,553) 154,714 Net Debt at Beginning of Year (416,397) (571,111) Net Asset/(Debt) at End of Year (2,738,950)$ (416,397)$
The accompanying notes and schedules are part of these consolidated financial statements.
2017
2016-17 Energy Annual Report 73

MINISTRY OF ENERGYCONSOLIDATED STATEMENT OF CASH FLOWSYear ended March 31, 2017(in thousands)
2017 2016Actual Actual
(Note 21) Operating Transactions
Annual (Deficit)/Surplus (73,245)$ 2,551,668$ Net Loss/(Income) from Government Business Enterprises 1,921,895 (20,490) Non-cash Items included in Net Operating Results
Amortization of Tangible Capital Assets (Note 12) 21,530 22,517 Pension Expense 875 - Loss on Disposal of Tangible Capital Assets (Note 12) 75 368
1,871,130 2,554,063
(Increase)/Decrease in Accounts Receivable (132,879) 69,591 (Increase)/Decrease in Inventory for Resale (637) 949 Decrease/(Increase) in Prepaid Expenses 75 (803) Decrease in Accounts Payable and Accrued Liabilities (284,279) (255,562) Decrease in Unearned Revenue (1,987) (5,539) Increase in Coal Phase-Out Agreements 1,114,613 - Decrease in Tenant Incentives (1,376) (740) Increase in Pension Assets (1,202) (1,657) Cash Provided by Operating Transactions 2,563,458 2,360,302
Capital TransactionsAcquisition of Tangible Capital Assets (Note 12) (17,932) (16,855) Proceeds on Disposal of Tangible Capital Assets (Note 12) - 18 Cash Applied to Capital Transactions (17,932) (16,837)
Financing TransactionsNet Financing Provided for General Revenues (2,253,056) (2,402,199) Pension Obligations Funded (2,048) - Decrease in Gas Royalty Deposits (100,886) (34,825) Cash Applied to Financing Transactions (2,355,990) (2,437,024)
Increase/(Decrease) in Cash and Cash Equivalents 189,536 (93,559) Cash and Cash Equivalents at Beginning of Year 84,600 178,159 Cash and Cash Equivalents at End of Year 274,136$ 84,600$
The accompanying notes and schedules are part of these consolidated financial statements.
2016-17 Energy Annual Report74

MINISTRY OF ENERGYNOTES TO CONSOLIDATED FINANCIAL STATEMENTSMarch 31, 2017(in thousands)
NOTE 1 AUTHORITY
The Minister of Energy has been designated as responsible for various Acts by the Government Organization Act and its regulations. To fulfill these responsibilities, the Minister administers the organizations listed below. The authority under which each organization operates is also listed. Together, these organizations form the Ministry of Energy.
Organization Authority
Department of Energy (The Department) Government Organization ActAlberta Energy Regulator (The AER) Responsible Energy Development ActAlberta Utilities Commission (The AUC) Alberta Utilities Commission ActAlberta Petroleum Marketing Commission (The Commission) Petroleum Marketing Act (as amended on
January 10, 2014) and the Natural Gas Marketing Act
Post-Closure Stewardship Fund Mines and Minerals ActThe Balancing Pool (The BP) The Electric Utilities Act (2003)
NOTE 2 SUMMARY OF SIGNIFICANT ACCOUNTING POLICIES AND REPORTING PRACTICES
These consolidated financial statements are prepared in accordance with Canadian Public Sector Accounting Standards.
(a) Basis of Consolidation
The Department of Energy, the AER, the AUC, and the Post-Closure Stewardship Fund, which all report under Canadian public sector accounting standards, are consolidated on a line by line basis.
The accounts of government sector entities, except those designated as government business enterprises, are consolidated using the line-by-line method. Under this method, accounting policies of the consolidated entities are adjusted to conform to government accounting policies and the results of each line item in theirfinancial statements (revenue, expense, assets, and liabilities) are included in government’s results.Intra-ministry transactions (revenue, expenses, capital, investing and financing transactions, and related asset and liability accounts) have been eliminated.
The Commission and The BP are government business enterprises and are accounted for on a modified equitybasis, with the equity being computed in accordance with International Financial Reporting Standards (IFRS).Under the modified equity method, the accounting policies of the Commission and the BP are not adjusted toconform to those of the Ministry of Energy. Inter-entity revenue and expense transactions and related assetand liability balances are not eliminated. Under the proclamation of portions of the Responsible Energy Development Act (REDA) in June 2013, the AER was created and assumed all responsibilities of the ERCB including all assets, liabilities, obligations, commitmentsand contingencies. In November 2013, additional portions of REDA were proclaimed transferring the public land and geophysical jurisdictions. The remaining portions of REDA were proclaimed in March 2014 which transferredall environmental and water jurisdictions. The transfer of jurisdiction from ESRD to the AER represented the final step in creating a single regulator for upstream oil, oil sands, natural gas and coal development in Alberta.
2016-17 Energy Annual Report 75

MINISTRY OF ENERGYNOTES TO CONSOLIDATED FINANCIAL STATEMENTSMarch 31, 2017(in thousands)
NOTE 2 SUMMARY OF SIGNIFICANT ACCOUNTING POLICIES AND REPORTING PRACTICES (cont'd)
(b) Basis of Financial Reporting
Revenues
All revenues are reported on the accrual basis of accounting. Cash received for which goods or services havenot been provided by year end is recognized as unearned revenue. The provincial royalty system is predicated on self-reporting where the petroleum and natural gas industry is expected to understand the relevant energy legislation (statutes and regulations) and comply with them. This has an impact on the completeness of revenue when the petroleum and natural gas industry do not fully meet the legislative requirements and, for example, report inaccurate or incomplete production data. The ministry has implemented systems and controls to detect and correct situations where the petroleum and natural gas industry has not complied with the various Acts and Regulations the ministry administers. These systems and controls, based on areas of highest risk, include performing audits of the petroleum and natural gas industry records where determined necessary by the ministry. The ministry does not estimate the effect of misreported revenue. Any impacts on revenue of refiling by industry are recognized in the year of refiling.
Crude oil and natural gas royalties are determined based on monthly production. Revenue is recognized when the resource is produced by the mineral rights holders.
Bitumen royalty is determined based on revenues from production sold by projects less the costs of thatproduction and the costs of selling the Crown’s royalty share. Royalty revenue is recognized when the resource is produced by the mineral rights holders.
Freehold mineral rights taxes are determined at the end of a calendar year based on production and costs of production incurred in the calendar year. Revenue is recognized on a prorated basis, by month, of the estimated calendar year taxes that will be due to the Crown.
Revenue from bonuses and sales of Crown leases is recognized when the Crown leases are sold. Rentals and fees revenue is recognized over the term of the leases.
Industry levies and assessments are recognized as revenue in the year receivable.
Revenue for the Post Closure Stewardship Fund are based on reported injection of volumes of carbon dioxide provided by the operator. Third party verification on the volume of injection will take place in the month of October, for injection to September 30. The Injection Levy is calculated based on the net present value of estimated future costs arising from the injection.
Expenses
Directly Incurred
Directly incurred expenses are those costs the ministry has primary responsibility and accountability for, as reflected in the government’s budget documents.
2016-17 Energy Annual Report76

MINISTRY OF ENERGYNOTES TO CONSOLIDATED FINANCIAL STATEMENTSMarch 31, 2017(in thousands)
NOTE 2 SUMMARY OF SIGNIFICANT ACCOUNTING POLICIES AND REPORTING PRACTICES (cont'd)
(b) Basis of Financial Reporting (cont'd)
Directly Incurred (cont'd)
In addition to program operating expenses such as salaries, supplies, etc., directly incurred expenses alsoinclude:• amortization of tangible capital assets,• pension costs, which are the cost of employer contributions for current service of employees during the
year. The AER and the AUC have their own defined benefit pension plans. The AER’s and the AUC’s pension expense is actuarially determined using the projected benefit method prorated on length of serviceand management’s best estimate of expected plan investment performance, projected employees’ compensation levels, and retirement age of employees. Net accumulated actuarial gain or loss is deferredand amortized over the average remaining service period of the active employees, which is 7 years. For thepurpose of calculating the expected return, plan assets are valued at fair value. Past service costs arisingfrom plan amendments are accounted for in the period of the plan amendment.
• valuation adjustments which include changes in the valuation allowances used to reflect financial assets at their net recoverable or other appropriate value. Valuation adjustments also represent the change in management’s estimate of future payments arising from obligations relating to vacation pay, guarantees and indemnities.
Grants are recognized as expenses when authorized and eligibility criteria, if any, are met.
Incurred by Others
Services contributed by other entities in support of the department operations are not recognized and are disclosed in Schedule 5.
Valuation of Financial Assets and Liabilities
Fair value is the amount of consideration agreed upon in an arm’s length transaction between knowledgeable,willing parties who are under no compulsion to act.
The fair values of Cash and Cash Equivalents, Accounts Receivable, Loans and Advances, and AccountsPayable and Accrued Liabilities are estimated to approximate their carrying values because of the short termnature of these instruments.
Financial Assets
Financial assets are assets that could be used to discharge existing liabilities or finance future operations and are not for consumption in the normal course of operations. Financial assets of the ministry are limitedto financial claims, such as advances to and receivables from other organizations, employees and otherindividuals, as well as inventories held for resale.
Assets acquired by right are not included.
2016-17 Energy Annual Report 77

MINISTRY OF ENERGYNOTES TO CONSOLIDATED FINANCIAL STATEMENTSMarch 31, 2017(in thousands)
NOTE 2 SUMMARY OF SIGNIFICANT ACCOUNTING POLICIES AND REPORTING PRACTICES (cont'd)
(b) Basis of Financial Reporting (cont'd)
Financial Assets (cont'd)
Accounts Receivable
Accounts receivable are recognized at the lower of cost or net recoverable value. A valuation allowance isrecognized when recovery is uncertain.
Inventory for Resale
Inventory consists of conventional and synthetic oil in feeder and trunk pipelines. Inventories are stated at lower of cost or net realizable value.
Liabilities
Liabilities are recognized to the extent that they represent present obligations as a result of events and transactions occurring prior to the end of fiscal year. The settlement of liabilities will result in sacrifice of economic benefits in the future.
Liabilities include all financial claims payable by the ministry at fiscal year end.
Non-Financial Assets
Non-financial assets are acquired, constructed or developed assets that do not normally provide resourcesto discharge existing liabilities, but instead:a) are normally employed to deliver government services;b) may be consumed in the normal course of operations; andc) are not for sale in the normal course of operations.
Non-financial assets of the ministry are limited to tangible capital assets.
Tangible capital assets of the ministry are recognized at historical cost and amortized on a straight-line basis over the estimated useful lives of the assets. The threshold for capitalizing new systems developmentis $250,000 and the threshold for major systems enhancements is $100,000. The threshold for all other tangible capital assets is $5,000.
Amortization is only charged if the tangible capital asset is put into service.
When tangible capital assets are gifted or sold for a nominal sum, the net book values of these assets less any nominal proceeds are recognized as grants in kind.
2016-17 Energy Annual Report78

MINISTRY OF ENERGYNOTES TO CONSOLIDATED FINANCIAL STATEMENTSMarch 31, 2017(in thousands)
NOTE 2 SUMMARY OF SIGNIFICANT ACCOUNTING POLICIES AND REPORTING PRACTICES (cont'd)
(b) Basis of Financial Reporting (cont'd)
Measurement Uncertainty
Measurement uncertainty exists when there is a variance between the recognized or disclosed amount and anotherreasonably possible amount. Natural gas and by-products revenue recognized as $519,746 (2016 - $493,032), bitumen royalty recognized as $1,483,459 (2016 - $1,222,971), and crude oil royalty revenue recognized as $716,329 (2016 - $688,800) in these financial statements are subject to measurement uncertainty.
Natural gas and by-products revenue is calculated based on allowable costs incurred by the royalty payers andproduction volumes that are reported to the department by royalty payers. Industry may modify their royalty and gas cost allowance for non-statute barred years. These amounts could vary significantly from that which was initially reported. The department estimates what the costs, volumes and royalty rates for the fiscal year should be based on statistical analysis of industry data. Based on historical data, changes to natural gas and by-products revenues was$94,492 (2016 - $153,341).
For projects from which bitumen royalty is paid and the project has reached payout, the royalty rate used to determine the royalties is based on the average price of West Texas Intermediate crude oil in Canadian dollars for the calendar year. Royalty rates will start at 25% of net profits when oil is priced at fifty five dollars per barrel or less, and increase to a maximum of 40% of net profits when oil is priced at one hundred and twenty dollars or more. Payout is defined at the first date at which the cumulative revenue of a project first equals the cumulative cost of the project.
The Ministry, through its agent Alberta Petroleum Marketing Commission (APMC), is party to the NorthWest Redwater Partnership and the Energy East Pipeline Projects. The Ministry has used judgementto estimate the net present value of the processing agreement with the North West Redwater Partnership,as well as to estimate the monthly toll commitments as disclosed in Schedule 3.
The BP's provisions for onerous contracts have been recorded at the lower of the present value of continuing the PPAs and the expected costs of terminating them as disclosed in Schedule 4
(c) Change in Accounting Policy
During the year, the AER changed its accounting policy with respect to the disclosure of security deposits in the AER Financial Statements. The AER now discloses security held in the form of cash in the notes to the financial statements only. In prior years, the AER included these security deposits on the Statement of Financial Position as financial assets and liabilities, explaining in the notes that these deposits are held on behalf of licensees. This change aligns the accounting treatment of security deposits with other entities within the Government of Alberta.
This change in accounting policy has been applied retroactively with restatement of the prior period's Statement of Financial Position. The effect of adopting this change decreases AER's financial assets and liabilities on the March 31, 2016 Statement of Financial Position in the amount of security deposits of $138,125.
2016-17 Energy Annual Report 79

MINISTRY OF ENERGYNOTES TO CONSOLIDATED FINANCIAL STATEMENTSMarch 31, 2017(in thousands)
NOTE 2 SUMMARY OF SIGNIFICANT ACCOUNTING POLICIES AND REPORTING PRACTICES (cont'd)
(d) Future Accounting Changes
The Public Sector Accounting Board has issued the following accounting standards:
● PS2200 Related Party Disclosures and PS3420 Inter-Entity Transactions (effective April 1, 2017)PS 2200 defines a related party and establishes disclosures required for related party transactions; PS3240 establishes standards on how to account for and report transactions between public sectorentities that comprise a government's reporting entity from both a provider and recipient perspective.Management is currently assessing the impact of these standards on the financial statements.
● PS3210 Assets, PS3320 Contingent Assets and PS3380 Contractual Rights (effective April 1, 2017)PS3210 provides guidance for applying the definition of assets set out in FINANCIAL STATEMENT CONCEPTS, Section PS1000 establishes general disclosure standards for assets; PS3320 defines and establishes disclosure standards on contingent assets; PS3380 defines and establishes disclosure standardson contractual rights. Management is currently assessing the impact of these standards on the financial statements.
● PS3430 Restructuring Transactions (effective April 1, 2018)This standard provides guidance on how to account for and report restructuring transactions by both transferors and recipients of assets and/or liabilities, together with related party programs or operating responsibilities.
NOTE 3 OTHER REVENUE2017 2016
Disgorgement Payment and Monetary Penalty to TransAlta Corporation -$ 51,921$ Settlements Related to the Land-Use Framework - 25,891 Other Revenue 10,265 11,537
10,265$ 89,349$
NOTE 4 ORPHAN WELL ABANDONMENT
NOTE 5 CASH AND CASH EQUIVALENTS
Cash consists of deposits in the Canadian financial institutions which are managed by the Province of Alberta withthe objective of providing competitive interest income to depositors while maintaining appropriate security andliquidity of depositors’ capital. The Fund is comprised of high quality short-term and mid-term fixed income
securities with a maximum term to maturity of three years. Included in cash and cash equivalents is $272 (2016 - nil)restricted for use on behalf of the Post Closure Stewardship Fund.
NOTE 6 ACCOUNTS RECEIVABLE
Accounts receivable royalties are secured by a claim against the mineral leases and are interest bearing in accordance with the applicable legislation.
The AER has delegated the authority to manage the abandonment and reclamation of wells, facilities and pipelines that are licensed to defunct licensees to the Alberta Oil and Gas Orphan Abandonment and Reclamation Association (Orphan Well Association). The AER grants all of its orphan well abandonment revenues (levy and application fees) to the Orphan Well Association. During the year ended March 31, 2017, the AER collected $30,448 (2016 - $30,167) in levies and $580 (2016 - $944) in application fees.
2016-17 Energy Annual Report80

MINISTRY OF ENERGYNOTES TO CONSOLIDATED FINANCIAL STATEMENTSMarch 31, 2017(in thousands)
NOTE 7 INVENTORY FOR RESALE
Inventory reported consists of crude oil inventory held for selling by APMC. Inventory is calculated based on inventoryvolumes held in various revenue pools multiplied by average pricing.
NOTE 8 PENSION ASSETS/(OBLIGATIONS)
The ministry participates in multi-employer pension plans, Management Employees Pension Plan and Public Service Plan and Supplementary Retirement Plan for Public Service Managers. The expense for these pension plansis equivalent to the annual contributions of $28,942 for the year ended March 31, 2017 (2016 - $30,145).The ministry is not responsible for future funding of the plan deficit other than through contribution increases.
At December 31, 2016, the Management Employees Pension Plan reported a surplus of $402,033 (2015 - surplus$299,051), the Public Service Pension Plan reported a surplus of $302,975 (2015 deficiency - $133,188) andthe Supplementary Retirement Plan for Public Service Managers reported a deficiency of $50,020 (2015 - deficiency$16,305).
The ministry also participates in two multi-employer Long Term Disability Income Continuance Plans. At March 31, 2017, the Bargaining Unit Plan reported an actuarial surplus of $101,515 (2016 - surplus $83,006) and the Management, Opted Out and Excluded Plan an actuarial surplus of $31,439 (2016 - surplus $29,246). The expense for these two plans is limitedto the employer’s annual contributions for the year.
In addition, the AER and the AUC maintain their own defined benefit Senior Employees Pension Plan (SEPP) and two supplementary pension plans to compensate senior staff who do not participate in the government management pension plans. Retirement benefits are based on each employee's years of service and remuneration.
The effective date of the most recent actuarial funding valuation for SEPP was December 31, 2014. The accruedbenefit obligation as at March 31, 2017 is based on the extrapolation of the results of this valuation. The effective date of the next required funding valuation for SEPP is December 31, 2017.
Pension plan assets are valued at market values. Significant weighted average actuarial and economic assumptions used to value accrued benefit obligations and pension benefit costs are as follows:
2017 2016 2017 2016
Weighted average actual return 8.5% (3.4%) 7.9% (1.71%)
Accrued benefits obligationsDiscount rate 4.6% 4.7% 4.4% 4.5%
Rate of compensation increase 0% for 3 years, 3.5% thereafter
0% for 2 years, 3.5% thereafter 3.5% 3.5%
Long – term inflation rate 2.0% 2.0% 2.0% 2.0%
Pension benefit costs for the yearDiscount rate 4.7% 4.9% 4.5% 4.7%Expected rate of return on plan assets 4.7% 4.9% 4.5% 4.7%
Rate of compensation increase 0% for 2 years, 3.5% thereafter
0% for 1 year, 3.5% thereafter 3.5% 3.5%
AER AUC
2016-17 Energy Annual Report 81

MINISTRY OF ENERGYNOTES TO CONSOLIDATED FINANCIAL STATEMENTSMarch 31, 2017(in thousands)
NOTE 8 PENSION ASSETS/(OBLIGATIONS) (cont'd)
2017 2016 2017 2016
Funded status and amountsMarket value of plan assets $ 56,633 $ 47,853 $ 11,286 $ 8,543 Accrued benefit obligation 58,200 54,639 10,925 10,224 Plan (deficit) (1,567) (6,786) 361 (1,681)Unamortized actuarial loss 2,077 6,094 47 916 Pension obligations $ 510 $ (692) $ 408 $ (765)
Pension benefit costsCurrent period benefit costs $ 4,302 $ 4,375 $ 608 $ 647 Interest cost 2,690 2,573 477 464 Expected return on plan assets (2,358) (2,330) (396) (397) Amortization of actuarial losses 861 436 186 113
5,495$ 5,054$ 875$ 827$
Additional information Employer contribution $ 6,697 $ 6,711 $ 2,048 $ 827 Employees' contribution 840 861 109 112 Benefit paid 3,001 3,216 166 346
Asset AllocationEquity securities 48.8% 47.9% 49.7% 48.4%Debt securities 36.0% 37.7% 27.0% 28.4%Other 15.2% 14.4% 23.3% 23.2%
100.0% 100.0% 100.0% 100.0%
NOTE 9 GAS ROYALTY DEPOSITS
The ministry requires that natural gas producers maintain a deposit which in most cases is equal to one-sixth of the prior calendar year's royalties multiplied by the ratio of the long term gas reference price on the date which the recalculation of the gas deposits is determined to the prior calendar year average gas reference price. The ministry does not payinterest on the deposits.
NOTE 10 TENANT INCENTIVES
The AER has entered into various lease agreements which provide for lease incentives comprised of reduced rent benefits, rent-free periods and leasehold improvement costs. These amounts are included in deferred leaseincentives and are amortized on a straight line basis over the term of the lease.
AER AUC
2016-17 Energy Annual Report82

MINISTRY OF ENERGYNOTES TO CONSOLIDATED FINANCIAL STATEMENTSMarch 31, 2017(in thousands)
NOTE 10 TENANT INCENTIVES (cont'd)
2017 2016
LeaseholdImprovement Costs
Reduced Rent Benefits and
Rent-FreePeriods Total Total
Beginning of Year 17,899$ 4,365$ 22,264$ 23,023$ Additions During Year - - - 763 Amortization (1,252) (364) (1,616) (1,522) End of Year 16,647$ 4,001$ 20,648$ 22,264$
The AUC entered into a lease agreement which provides a lease incentive of $418 comprised of leaseholdimprovement costs and/or rent-free periods beginning March 2016. The deferred lease incentive is amortized on a straight line basis over the term of the lease.
2017 2016
LeaseholdImprovement Costs
Reduced Rent Benefits and
Rent-FreePeriods Total Total
Beginning of Year 59$ -$ 59$ 40$ Additions During Year - 324 324 59 Amortization (12) (72) (84) (40) End of Year 47$ 252$ 299$ 59$
NOTE 11 COAL PHASE-OUT AGREEMENTS
The phase out of coal-fired generators is in alignment with the Province's Climate Leadership Plan (CLP). OnNovember 24, 2016, the Minister of Energy, on behalf of the Province of Alberta, reached agreements with threecoal-fired generators to cease operations on or before December 31, 2030. The coal-fired generation plantscovered under agreements include: Sheerness 1 and 2; Genesee 1, 2, and 3; and Keephills 3.
As these and other coal-fired generation plants cease operations either because their license to operate expiredunder Federal regulations or because of these agreements, replacement electricity supply will be needed asearly as 2021-2022. Permitting and construction of new generation plants could take between four and sevenyears. It is important that there is no gap between generation supply and generation demand.
At the time these coal phase-out agreements were negotiated, there was significant uncertainty around thelikelihood of new investments in electricity generation because of the historic low electricity prices, the Albertaeconomy at the time, and the return of Power Purchase Agreements. The Province's agreement to providetransitional payments to the three coal-fired generators is to assist them in continuing as an active supplier ofelectricity to Albertans as well as to stabilize market confidence for investments in electricity generation.
2016-17 Energy Annual Report 83
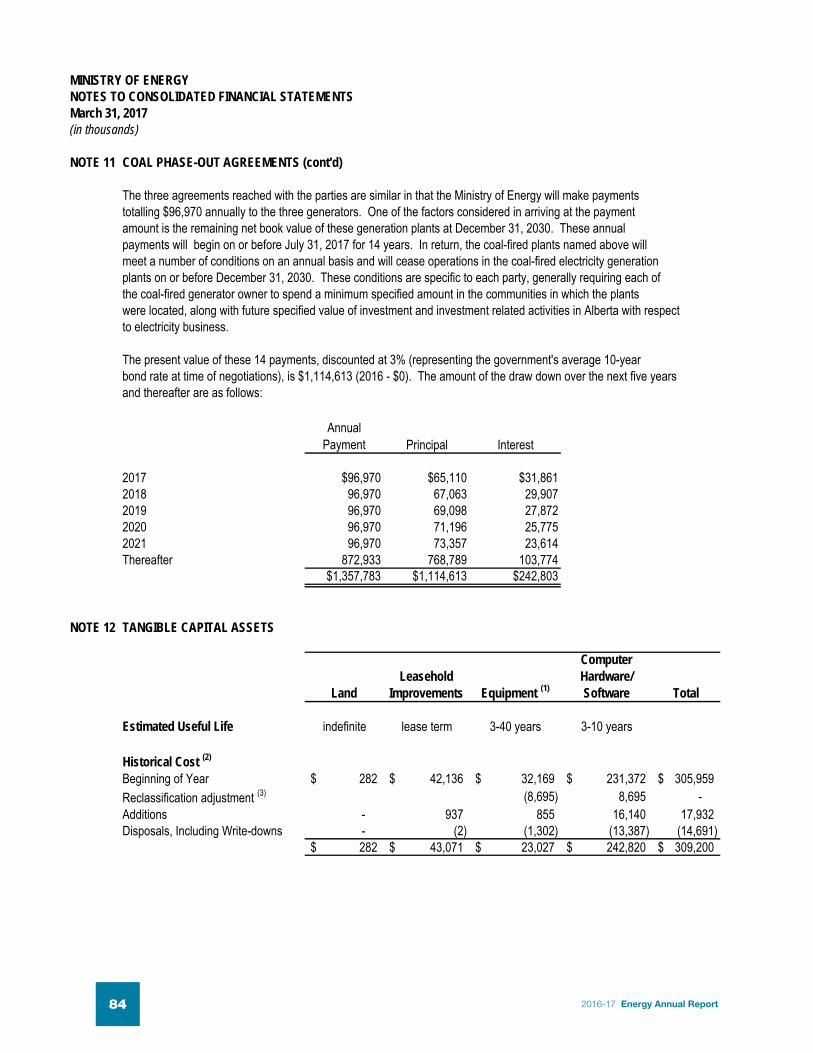
MINISTRY OF ENERGYNOTES TO CONSOLIDATED FINANCIAL STATEMENTSMarch 31, 2017(in thousands)
NOTE 11 COAL PHASE-OUT AGREEMENTS (cont'd)
The three agreements reached with the parties are similar in that the Ministry of Energy will make paymentstotalling $96,970 annually to the three generators. One of the factors considered in arriving at the paymentamount is the remaining net book value of these generation plants at December 31, 2030. These annualpayments will begin on or before July 31, 2017 for 14 years. In return, the coal-fired plants named above willmeet a number of conditions on an annual basis and will cease operations in the coal-fired electricity generationplants on or before December 31, 2030. These conditions are specific to each party, generally requiring each ofthe coal-fired generator owner to spend a minimum specified amount in the communities in which the plantswere located, along with future specified value of investment and investment related activities in Alberta with respectto electricity business.
The present value of these 14 payments, discounted at 3% (representing the government's average 10-yearbond rate at time of negotiations), is $1,114,613 (2016 - $0). The amount of the draw down over the next five yearsand thereafter are as follows:
Annual
Payment Principal Interest 2017 $96,970 $65,110 $31,8612018 96,970 67,063 29,9072019 96,970 69,098 27,8722020 96,970 71,196 25,7752021 96,970 73,357 23,614Thereafter 872,933 768,789 103,774
$1,357,783 $1,114,613 $242,803
NOTE 12 TANGIBLE CAPITAL ASSETS
LandLeasehold
Improvements Equipment (1)
ComputerHardware/Software Total
Estimated Useful Life indefinite lease term 3-40 years 3-10 years
Historical Cost (2)
Beginning of Year 282$ 42,136$ 32,169$ 231,372$ 305,959$ Reclassification adjustment (3) (8,695) 8,695 - Additions - 937 855 16,140 17,932 Disposals, Including Write-downs - (2) (1,302) (13,387) (14,691)
282$ 43,071$ 23,027$ 242,820$ 309,200$
2016-17 Energy Annual Report84

MINISTRY OF ENERGYNOTES TO CONSOLIDATED FINANCIAL STATEMENTSMarch 31, 2017(in thousands)
NOTE 12 TANGIBLE CAPITAL ASSETS (cont'd)
LandLeasehold
Improvements Equipment (1)
ComputerHardware/Software Total
Accumulated AmortizationBeginning of Year -$ 12,566$ 20,282$ 178,057$ 210,905$ Reclassification adjustment (3) (5,765) 5,765 - Amortization Expense - 2,851 1,475 17,204 21,530 Effect of Disposals - (2) (1,299) (13,315) (14,616)
-$ 15,415$ 14,693$ 187,711$ 217,819$
Net Book Value at March 31, 2017 282$ 27,656$ 8,334$ 55,109$ 91,381$
Net Book Value at March 31, 2016 282$ 29,570$ 11,887$ 53,315$ 95,054$
(1) Equipment includes office equipment and furniture and other equipment.(2) Historical cost includes work-in-progress at March 31, 2017 totaling $8,051 (2016 - $3,866) comprised
of computer hardware and software.(3) Computer hardware was previously included under equipment, should be included with computer software.
NOTE 13 CONTINGENT LIABILITIES
The department is involved in legal matters where damages are being sought. These matters may give rise tocontingent liabilities. Accruals have been made in specific instances where it is likely that losses will be incurredbased on a reasonable estimate.
The department has been named in six claims (2016 - five), all with outcomes that are not determinable. Four claims have specified amounts totalling $7,253 (2016 three claim of $7,158) and two claims (2016 - two)has no specified amounts.
The department has been jointly named with other entities in seven claims (2016 - seven). Five of these claimshave specified amounts totaling $33,550 (2016 – five claims totaling $14,350) and two claims (2016 -two) with no amounts specified.
Of the total specified claims, two claims totaling $10,007 (2016 - two claims totaling $10,007) are partially or fullycovered by the Alberta Risk Management Fund.
The resolution of the indeterminable claim may result in a liability, if any, that may be significantly lower than theclaimed amount.
2016-17 Energy Annual Report 85

MINISTRY OF ENERGYNOTES TO CONSOLIDATED FINANCIAL STATEMENTSMarch 31, 2017(in thousands)
NOTE 14 CONTRACTUAL OBLIGATIONS
As at March 31, 2017, the ministry had contractual obligations totaling $967,361 (2016 - $1,003,579).
Contractual obligations are obligations of the ministry to others that will become liabilities in the future when the terms of those contracts or agreements are met. These amounts include obligations under long-term contracts with contract payment requirements for each of the next five years and thereafter are as follows:
GrantAgreements
ServiceContracts
Long-TermLeases Total
2017 213,700$ 11,355$ 34,123$ 259,178$ 2018 129,100 4,255 21,274 154,629 2019 43,000 2,964 15,436 61,400 2020 53,300 2,947 12,886 69,133 2021 52,500 2,924 12,918 68,342 Thereafter 257,500 - 97,179 354,679
749,100$ 24,445$ 193,816$ 967,361$
NOTE 15 PROGRAM COMMITMENTS
Regulated Rate Option Price Ceiling
On November 22, 2016, the government announced a four-year price cap to protect families, farms, and small businesses from volatility in electricity prices as the province makes necessary reforms to the electricity system.The program runs from June 2017 to June 2021. During this period, consumers on the Regulated Rate Option (RRO)will pay the lower of the market rate or the government's ceiling rate of 6.8 cents per kilowatt hour.
The cost of the program is currently unknown. Current Regulated Rate Option rates are well below the 6.8 cents priceceiling; however, market changes to the supply and demand for electricity over the next four years will determinewhether or not the market rate will exceed the price ceiling. Furthermore, the cost to the government will also depend on the level of electricity consumed when the price ceiling is breached.
Renewable Energy Program
On March 24, 2017, the government announced the opening of the first of a series of competitions to creategreen electricity in the province as part of its target of 30 percent renewable electricity by 2030.
The Renewable Electricity Program (REP) is intended to encourage the development of 5,000 megawatts (MW)of renewable electricity generation capacity connected to the Alberta grid between 2017 and 2030.
The government has contracted with the Alberta Electric System Operator (AESO) to implement and administerthe program. The process from the Request for Expression of Interest (REOI), Request for Qualifications (RFQ), and Request for Proposals (RFP) is expected to take between seven to eleven months. An REOI is beingsolicited until April 21, 2017 for the first 400 MW of new renewable electric energy.
2016-17 Energy Annual Report86

MINISTRY OF ENERGYNOTES TO CONSOLIDATED FINANCIAL STATEMENTSMarch 31, 2017(in thousands)
NOTE 15 PROGRAM COMMITMENTS (cont'd)
Under the first round of this program, the government participates in the market risks of electricity prices by ensuring REP generators are kept whole by making sure the difference between the pool price and the accepted strike price is netted out, as follows:a) When the market prices are high, the government will receive payments from the REP generator for pool prices that are in excess of the accepted strike price; and b) When the market prices are low, the government will pay the REP generator the difference between the poolprices and the accepted strike price.
The cost of the program cannot be reasonably determined until acceptance of strike prices has been completed.
Petrochemicals Diversification Program
On December 5, 2016 the government announced the approval of two new petrochemicals projects to be constructed under the Petrochemicals Diversification Program.
Under the Program, the two projects may receive up to $500 million in royalty credits provided the following:a) Projects must achieve a Final Investment Decision to proceed within 18 months (June 2018).b) Commercialization of the projects in 2021.c) The amount of royalty credit is calculated based on the actual consumption of propane to produce
polypropylene.
NOTE 16 LIABILITY FOR CONTAMINATED SITES
As at March 31, 2017, the AER is not responsible, nor has it accepted responsibility, for performing remediation work at contaminated sites. As at March 31, 2017, the AER's liability for contaminated sites was $nil (2016 - $nil).
NOTE 17 TRUST FUNDS UNDER ADMINSTRATION
The Department of Energy administers the Oil and Gas Conservation Trust consisting of public money over which the Legislature has no power of appropriation. Because the Province has no equity in the fund and administers the fund for the purpose of various trusts, the fund is not included in the departments’financial statements. As at March 31, 2017, the funds in the Oil and Gas Conservation Trust are$4,674 (2016 - $4,594).
The AER collects financial security under a number of different programs to protect the public from paying costs associated with abandonment and reclamation of upstream wells, facilities, pipelines, mines, mine sites and oilfield waste management facilities. The security deposits are held on behalf of licensees. The AER administers the programs in accordance with specified acts and regulations and does not have any financial risk associated with security collected. At March 31, 2017, the AER held $162,301 (2016 - $138,125) in cash and an additional $1,583,637 (2016 - $1,528,339) in letters of credit. Security, along with any interest earned, will be returned to the depositors upon meeting specified refund criteria.
2016-17 Energy Annual Report 87

MINISTRY OF ENERGYNOTES TO CONSOLIDATED FINANCIAL STATEMENTSMarch 31, 2017(in thousands)
NOTE 18 RELATED PARTY TRANSACTIONS
The ministry paid $6,447 (2016 - $5,699) to various other Government of Alberta departments, agencies orfunds for grants, supplies and/or services during the fiscal year and received $264 (2016 - $140) asrevenue.
Alberta Petroleum Marketing Commission has borrowed $324 million from Treasury Board and Finance andadvanced the funds to the partnership. For more details, see Schedule 3.
The Balancing Pool has borrowed $232 million from Treasury Board and Finance. For more detailssee Schedule 4.
Accommodations, legal, business services, and certain financial costs were provided to the ministry by other government organizations at no cost. However, services contributed by other entities in support of theministry operations are disclosed in Schedule 5.
NOTE 19 ROYALTY REDUCTION PROGRAMS
The ministry provides eleven oil and gas royalty reduction programs. The intent of these programs is to encourageindustry to produce from wells which otherwise would not be economically productive. For the year ended March 31,2017 the royalties received under these programs were reduced by $1,180,112 (2016 - $889,507).
NOTE 20 BITUMEN CONSERVATION
In 2004-05 the Alberta Energy and Utilities (EUB) Board (now known as the AER) released its Bitumen Conservation Requirements decisions regarding the status of natural gas wells in the Wabiskaw-McMurray region of the Athabasca Oil Sands area. The decisions recommended the shut-in of Wabiskaw-McMurray natural gas totaling about 53.6 billions of cubic feet annually to protect about 25.5 billion barrels of potentially recoverable bitumen. The Natural Gas Royalty Regulations, 2002 was amended to provide a royalty mechanism that would allow the Minister of Energy to calculate a royalty adjustment each month for gas producers affected by the EUB decisions. The Natural Gas Royalty Regulations, 2002 was also amended to provide for the royalty adjustment to be recovered through additional royalty on the shut-in wells when they return to production through amendments to the provisions that deal with the calculationof the royalty share of gas. The amendments provide for an increase over and above the usual royalty rate, and extendto new wells that produce from the shut-in zone. The effect of these adjustments was to reduce natural gas and by-products revenue by $10,602 (2016 - $12,139).
NOTE 21 COMPARATIVE FIGURES
Certain 2016 figures have been reclassified to conform to 2017 presentation.
NOTE 22 APPROVAL OF FINANCIAL STATEMENTS
The financial statements were approved by the Senior Financial Officer and the Deputy Minister.
2016-17 Energy Annual Report88

MINISTRY OF ENERGY Schedule 1SCHEDULE TO CONSOLIDATED FINANCIAL STATEMENTSREVENUESYear ended March 31, 2017(in thousands)
2016Budget Actual Actual
(Note 21)
Non-Renewable Resource Revenue (Note 19)Bitumen Royalty 656,000$ 1,483,459$ 1,222,971$ Crude Oil Royalty 332,692 716,329 688,800 Natural Gas and By-Products Royalty (Note 20) 151,000 519,746 493,032 Bonuses and Sales of Crown Leases 95,000 203,276 203,267 Rentals and Fees 118,000 148,170 167,382 Coal Royalty 11,000 26,182 13,668
1,363,692 3,097,162 2,789,120
Freehold Mineral Rights Tax 71,000 57,059 79,395 Industry Levies and Licenses 303,441 300,114 303,338 Other Revenue (Note 3) 6,143 10,265 89,349
1,744,276 3,464,600 3,261,202
Net (Loss)/Income from Government Business Enterprises 28,800 (1,921,895) 20,490 Total Revenue 1,773,076$ 1,542,705$ 3,281,692$
2017
2016-17 Energy Annual Report 89
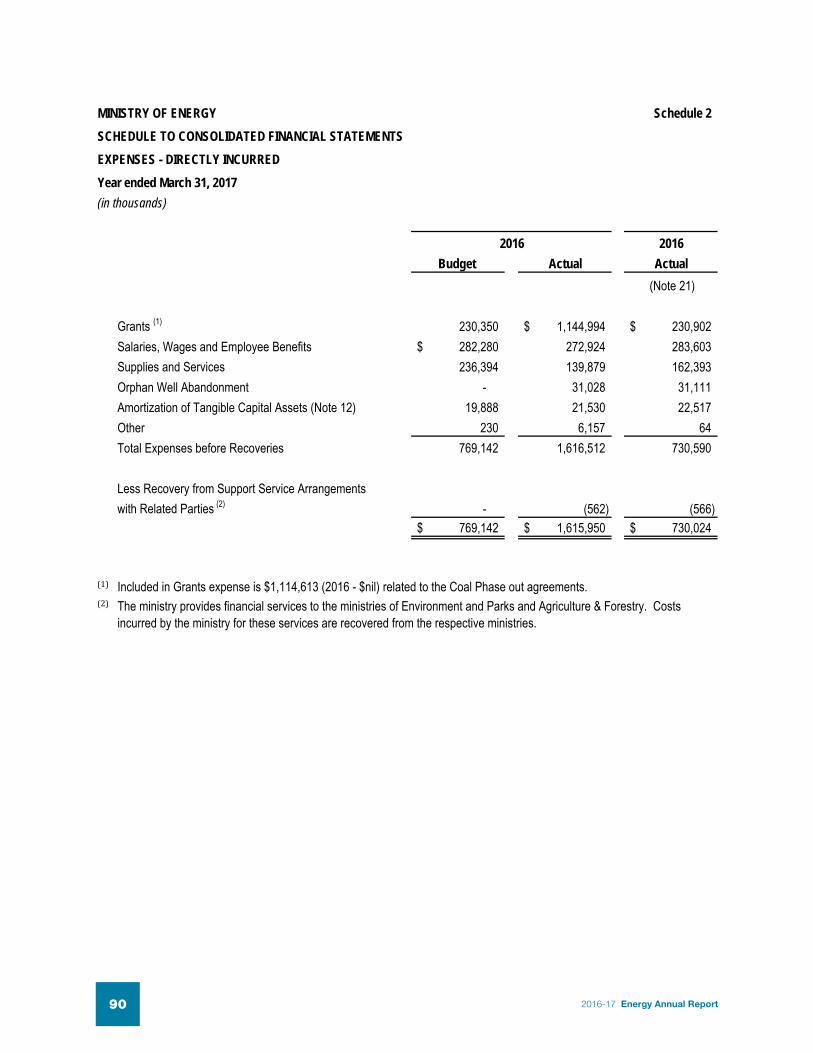
MINISTRY OF ENERGY Schedule 2SCHEDULE TO CONSOLIDATED FINANCIAL STATEMENTSEXPENSES - DIRECTLY INCURREDYear ended March 31, 2017(in thousands)
2016Budget Actual Actual
(Note 21)
Grants (1) 230,350 1,144,994$ 230,902$ Salaries, Wages and Employee Benefits 282,280$ 272,924 283,603 Supplies and Services 236,394 139,879 162,393 Orphan Well Abandonment - 31,028 31,111 Amortization of Tangible Capital Assets (Note 12) 19,888 21,530 22,517 Other 230 6,157 64 Total Expenses before Recoveries 769,142 1,616,512 730,590
Less Recovery from Support Service Arrangementswith Related Parties (2) - (562) (566)
769,142$ 1,615,950$ 730,024$
(1)(2) The ministry provides financial services to the ministries of Environment and Parks and Agriculture & Forestry. Costs
incurred by the ministry for these services are recovered from the respective ministries.
2016
Included in Grants expense is $1,114,613 (2016 - $nil) related to the Coal Phase out agreements.
2016-17 Energy Annual Report90

MINISTRY OF ENERGY Schedule 3SCHEDULE TO CONSOLIDATED FINANCIAL STATEMENTSEQUITY IN GOVERNMENT BUSINESS ENTERPRISE - APMCYear ended March 31, 2017(in thousands)
2017 2016Accumulated surplusOpening accumulated surplus 34,965$ 14,475$
RevenuesMarketing of Oil 4,531 3,820 Financing Transactions 32,702 23,780 Total revenue 37,233 27,600
Total expense 7,125 7,110 Net income for the year 30,108 20,490
Accumulated surplus at end of year 65,073$ 34,965$
Represented byAssets
Cash and short-term investments 5,392$ 2,490$ Term Loan 393,583 360,881 Other assets 88,362 34,972 Total assets 487,337 398,343
LiabilitiesAccounts payable 8,977 6,999 Due to Government of Alberta 330,249 327,888 Due to the Department of Energy 83,038 28,491 Total liabilities 422,264 363,378
65,073$ 34,965$
COMMITMENTS (in thousands)
(a) North West Redwater Partnership
On November 8, 2012 NWRP, announced the sanctioning of the construction of Phase 1 of the Sturgeon Refinery which it will build, own and operate. The Commission has entered into agreements whereby NWRP will process and market Crown royalty bitumen, or equivalent volumes, collected pursuant to the Bitumen Royalty in Kind initiative in order to capture additional value within Alberta. NWRP will market the refined products (primarily ultralow sulphur diesel and low sulphur vacuum gas oil) on behalf of the Commission. There is risk to the Commission under these agreements pertaining to the price differential between bitumen supplied as feedstock and marketed refined products, relative to the costs of the processing toll.
2016-17 Energy Annual Report 91

MINISTRY OF ENERGY Schedule 3 (Cont'd)SCHEDULE TO CONSOLIDATED FINANCIAL STATEMENTSEQUITY IN GOVERNMENT BUSINESS ENTERPRISE - APMCYear ended March 31, 2017(in thousands)
(a) North West Redwater Partnership (cont'd)
Under the processing agreement, the Commission is obligated to pay a monthly toll comprised of: senior debt; operating; class A subordinated debt; equity; and incentive fees on 37,500 barrels per day of bitumen (75% of the project’s feedstock) for 30 years. The toll includes flow through costs as well as costs related to facility construction, estimated to be $9.4 (2016 - $8.5) billion. The Commission has very restricted rights to terminate the agreement, and if it is terminated the Commission remains obligated to pay its share of the senior secured debt component of the toll incurred to date. The term of the commitment begins uponthe commencement of commercial operations. No amounts have been paid under this agreement to date.
The nominal tolls under the processing agreement, assuming an $9.4 (2016 - $8.5) billion Facility Capital Cost,market interest rates and 2% operating cost inflation rate, are estimated above. The total estimated tolls have been increased by $1.2 billion (2016 - $1.26 billion decrease) relative to March 2016, due primarily to higher debt tolls related to higher Facility Capital Cost. As at March 31, 2017. NWRP has issued $6.35 (2016 - $3.65)billion in bonds at lower than anticipated rates.
No value has been ascribed to the anticipated refining profits available to APMC over the term of the agreement.
(b) North West Redwater Partnership Monthly Toll Commitment
The Commission has used judgment to estimate the toll commitments. The components of the toll are: senior debt; operating costs; class A subordinated debt; equity; and incentive fees. To calculate the toll, management has used estimates for factors including future interest rates, operating costs, oil prices (WTI and light/heavy differentials), refined product prices, gas prices and foreign exchange.
2017-18 -$ 2018-19 671,000$ 2019-20 755,000$ 2020-21 904,000$ 2021-22 951,000$ Beyond March 2022 22,673,000$
(c) Term Loan Provided to North West Redwater Partnership
As part of the Subordinated Debt Agreement with the Partnership, the Commission provided a $324 million loan.These amounts plus the accrued interest will be repaid on a straight line basis over ten years by the Partnershipbeginning one year after commercial start-up of the Sturgeon Refinery. Upon initiation of commercial operationsthe total amount of the term loan will be adjusted to reflect an agreed equity to debt ratio.
While loans to the Partnership are outstanding, the Commission is entitled to a 25 percent voting interest on anExecutive Leadership Committee, which is charged with overseeing and making decisions on the constructionand start-up of the Sturgeon Refinery. Because of the 25 percent voting interest, the Commission has significantinfluence over the Partnership. However, the Commission has no equity ownership interest in the Partnershipand does not account for the Sturgeon Refinery or its operations in its financial statements.
NWRP targets the refinery to come on stream to process bitumen feedstock with a commercial operations anticipated to commence between April and June of 2018. The future toll commitments are estimated to be:
2016-17 Energy Annual Report92

MINISTRY OF ENERGY Schedule 3 (Cont'd)SCHEDULE TO CONSOLIDATED FINANCIAL STATEMENTSEQUITY IN GOVERNMENT BUSINESS ENTERPRISE - APMCYear ended March 31, 2017(in thousands)
(c) Term Loan Provided to North West Redwater Partnership (cont'd)
(d) North West Redwater Partnership Processing Agreement Assessment
The Commission uses a cash flow model to determine if the unavoidable costs of meeting the obligations underthe NWRP Processing Agreement exceed the economic benefits expected to be received. The model uses a number of variables to calculate a discounted net cash flow for APMC. Those variables include technical variables that arise from the design of the project such as catalyst volumes or energy consumption; pricing related variables suchas crude oil prices (WTI), heavy-light differentials, ultra-low sulphur diesel-WTI premiums, exchange rates, capital costs, operating costs, interest rates, discount rates; and operating performance compared to capacity.
Technical inputs may be estimated with reasonable accuracy for a particular operating plan; however revenuesand costs that depend upon market prices are challenging to estimate, particularly over long future time periods. The Processing Agreement has a term of 30 years and may be renewed for successive five year periods at APMC’s option. In order to perform the onerous contract analysis APMC management developed estimates for the key variables based on information from various sources including forecasts of global consultancies, reserve evaluation consultants, forward markets and the Government of Alberta.
Based on the analysis, APMC determined the agreement has a positive net present value and no provision is required.
Under the agreements related to the Facility Capital Costs for the Sturgeon Refinery, the financing structure is required to be 80% senior debt and 20% equity/subordinated debt. The Commission is committed to provide 50% of the subordinated debt required to meet this test. A final reconciliation of the amount of subordinated debt required will be done six months after Commercial Operation Date. The calculation of the 80/20 ratio allows for the deduction of cumulative debt service costs (accrued interest) at this time, while prior to this time the calculation does not allow for the deduction of accumulated debt service costs, which could result in a temporary need for additional subordinated debt lending by The Commission.
The Commission is forecasting to provide NWRP an additional $95 million in 2017 of subordinated debt. In 2018 The Commission anticipates NWRP will repay $60 million to APMC as part of the final subordinated debt true-up six months after Commercial Operations Date.
2016-17 Energy Annual Report 93

MINISTRY OF ENERGY Schedule 3 (Cont'd)SCHEDULE TO CONSOLIDATED FINANCIAL STATEMENTSEQUITY IN GOVERNMENT BUSINESS ENTERPRISE - APMCYear ended March 31, 2017(in thousands)
(e) Energy East Pipeline Project
The future toll commitments are estimated to be:
2017-18 -$ 2018-19 -$ 2019-20 -$ 2020-21 -$ 2021-22 100,000$ Beyond March 2022 4,500,000$
(f) Subsequent events
Short term debt
Term Loan to NWRP
The Commission has used judgment to estimate the toll commitments. The Commission has signed a Transportation Service Agreement (TSA) with Energy East Pipeline Limited Partnership (the “Carrier”) to purchase 100,000 barrels per day of firm capacity for a term of 20 years to transport volumes of crude oil. The construction of the pipeline is dependent upon obtaining regulatory approval. During 2016, the Canadian federal government extended the Energy East regulatory process timeline by nine months; six months was added to the National Energy Board (NEB) regulatory process and three months was added to the federal cabinet decision process. In addition the NEB regulatory process was put on hold in September when three panel members stepped down. All decisions made by the prior panel have since been voided and a new panel was appointed on January 7, 2017. As a result of the delays the new in service date has been extended to late 2021. Under the take-or-pay obligation, once required regulatory and commercial approvals are obtained, The Commission has an estimated updated minimum obligation to pay $4.6 billion ($4.6 billion – 2015) in tolls over the 20 year term. Additional tolls will be incurred depending on the volumes transported through the pipeline.
On April 5, 2017 The Commission replaced its short term debt of $114.439 million originally issued April 6, 2016 with new short term debt of $115.248 million at 0.765% interest due April 4, 2018.
On May 31, 2017 The Commission borrowed $21 million of short term debt from Treasury Board and Finance at an effective interest rate of 0.770 due May 30, 2018.
The Commission’s intention is to borrow additional short term funds when these amounts come due and repay the aggregated amount straight line over 10 years starting the year after the Sturgeon Refinery start-up.
On May 31, 2017 The Commission issued an additional $21 million term loan to NWRP on the same terms and conditions as the term loans issued previously. These monies are being forwarded in response to a Drawdown Notice issued by NWRP on May 5, 2017, pursuant to the terms and conditions of the subordinated debt agreement.
2016-17 Energy Annual Report94

MINISTRY OF ENERGY Schedule 4SCHEDULE TO CONSOLIDATED FINANCIAL STATEMENTSEQUITY IN GOVERNMENT BUSINESS ENTERPRISE - THE BALANCING POOLYear ended March 31, 2017(in thousands)
2017 2016(3 Months)
Accumulated equityOpening accumulated equity (January 1, 2017) (1,966,788)$ -$
Total revenues 177,703 - Total expense 179,803 - Receipt of Consumer Allocation 16,885 - Net income for the year 14,785 -
Accumulated equity at end of year (1,952,003)$ -$
Represented byAssets
Cash and cash equivalents 27,699$ -$ Term Loan 7,838 - Other assets 284,684 - Total assets 320,221 -
LiabilitiesAccounts payable (1) 292,483 - Reclamation and abandonment provision 29,817 - Loans and borrowing (2) 231,853 - Power Purchase Arrangement liabilities 1,718,071 - Total liabilities 2,272,224 -
(1,952,003)$ -$
(1)(2)
(a) Deemed Control
The Province created the Balancing Pool (BP) in 1998 to manage certain assets, liabilities, revenues and expenses arising from the transition to competition in Alberta's electric industry. The BP was established as a separate statutory corporation on June 1, 2003.
Included in Accounts payable is $126 million of payments in lieu of taxes that are payable to the Province.Loans and borrowing is made up short-term discount notes issued to the Province with maturity dates ranging from 31 to 90 days with annual interest charges ranging from 0.9% to 1.0%.
2016-17 Energy Annual Report 95

MINISTRY OF ENERGY Schedule 4 (Cont'd)SCHEDULE TO CONSOLIDATED FINANCIAL STATEMENTSEQUITY IN GOVERNMENT BUSINESS ENTERPRISE - THE BALANCING POOLYear ended March 31, 2017(in thousands)
(a) Deemed Control (cont'd)
(b) Measurement Uncertainty
These financial statements are primarily based on the financial statements of the BP for the year ended December 31, 2016 and do not reflect the potential outcome of ongoing settlement negotiations between the Province and other PPA buyers. While the BP continues to hold the PPAs transferred to it, it will assume responsibility for ongoing capacity payments and other PPA-related costs and is responsible for selling the output into the wholesale power market. Based on the estimated forecast average electricity market prices, the unavoidable costs of meeting the obligations under the PPAs is expected to exceed the economic benefits derived from the PPAs. As a result, onerous contract provisions have been recognized and measured at the lower of the present value of continuing the PPAs and the expected costs of terminating them.
The BP is required to respond to certain extraordinary events during the operating period of all of the Power Purchase Arrangements (PPAs) such as force majeure, unit destruction, Buyer or Owner default or termination of a PPA. When a Buyer terminates a PPA, the BP will assume all remaining rights and obligations pursuant to the PPA assuming the PPA continues. The Electric Utilities Act requires the BP to manage generation assets in a commercial manner.
Since 2006, The BP has distributed $2.6 billion to electricity consumers by way of the Consumer Allocation. The total distribution to electricity consumers including the original auction proceeds of the PPAs is $4.7 billion.
A series of legislative and regulatory changes and initiatives culminated in the Ministry to be deemed in control of the BP for financial reporting purposes with an effective date of January 1, 2017. These financial statements reflect the cost of assuming the net liabilities of the BP as at January 1, 2017 and the result of its operations for the three-month period ended March 31, 2017. However, these results do not include any valuation adjustments relating to PPAs to be terminated beyond December 31, 2016 since the information is not reasonably determinable. The impact may increase the BP's financial exposure materially.
During the latter part of 2015 and first quarter of 2016, the BP received notices of termination for six of the seven PPAs. The BP immediately assumed responsibility for all financial obligations associated with the terminated PPAs.
2016-17 Energy Annual Report96

MINISTRY OF ENERGY Schedule 4 (Cont'd)SCHEDULE TO CONSOLIDATED FINANCIAL STATEMENTSEQUITY IN GOVERNMENT BUSINESS ENTERPRISE - THE BALANCING POOLYear ended March 31, 2017(in thousands)
(b) Measurement Uncertainty (cont'd)
(c) Contingent Liabilities and Commitments
In addition, approximately $62 million of payments in lieu of taxes payable remain under dispute with a municipal entity.
Revenue is also dependent on generating capacicy factors of the different PPAs, which can vary for each PPA.
For those PPAs which have been or which may ultimately be returned to the Balancing Pool, the BP has the option to hold the PPAs, resell the PPAs or to terminate the PPAs by paying the Owner a termination payment equal to the net book value. The Power Purchase Arrangement liabilities are estimated based on the assumption that these arrangements will be terminated July 1, 2017.
Cost of termination includes the estimated net costs of holding the PPAs over the minimum six-month notice period preceding such termination plus a termination payment. For purposes of measuring the onerous contract provision, the minimum six-month notice period has been estimated to commence on January 1, 2017, except for PPA terminations which have not yet been settled. For PPA terminations which have not yet been settled, management has estimated that the minimum six-month notice period is estimated to commence onJuly 1, 2017. The termination payment represents the net book value of the units which is estimated at $1.4 billion. The estimated future costs for the PPAs were discounted at 0.6%, except one that was discounted at 1.0%.
The BP has not made a final determination of which PPAs to terminate and termination notice has not been provided to the Owner as at January 1, 2017. The actual costs may be different than those reflected in the Power Purchase Arrangement liabilities.
The BP is exposed to certain retroactive loss adjustments relating to complaints by generators in Alberta about transmission charges before the Alberta Utilities Commission. The BP will incur additional charges as a result of these adjustments. However, the total impact of these additional charges cannot be measured at this time.
A final determination of which PPAs to terminate has not yet been made.
2016-17 Energy Annual Report 97

MINI
STRY
OF
ENER
GYSc
hedu
le 5
SCHE
DULE
TO
CONS
OLID
ATED
FIN
ANCI
AL S
TATE
MENT
SAL
LOCA
TED
COST
SYe
ar en
ded
Marc
h 31
, 201
7(in
thou
sand
s)20
16 (N
ote 21
) Ac
com
mod
atio
nLe
gal
Busin
ess
Tota
lTo
tal
Prog
ram
Expe
nses
(1)
Cost
s(2)
Serv
ices (3
)Se
rvice
s (4)
Expe
nses
Expe
nses
Minis
try S
uppo
rt Se
rvice
s7,6
50$
56
8$
1,3
01$
-$
9,519
$
9,9
25$
Reso
urce
Dev
elopm
ent a
nd M
anag
emen
t92
,993
5,8
88
3,275
2,5
89
10
4,745
$
113,2
08
Bi
oene
rgy I
nitiat
ives
-
-
-
-
-
$
70,58
2
Cost
of Se
lling O
il57
,752
-
-
-
57
,752
$
77
,168
En
ergy
Reg
ulatio
n24
5,959
-
-
-
24
5,959
$
249,1
13
Ut
ilities
Reg
ulatio
n31
,123
-
-
-
31
,123
$
33
,293
Cl
imate
Lead
ersh
ip Pl
an1,1
18,78
6
63
1,118
,849
$
-
Ca
rbon
Cap
ture a
nd S
torag
e30
,659
91
-
-
30
,750
$
15
9,938
Orph
an W
ell A
band
onme
nt31
,028
-
-
-
31
,028
$
31
,111
1,6
15,95
0$
6,6
10$
4,576
$
2,5
89$
1,6
29,72
5$
74
4,338
$
(1) (2) (3)Co
sts sh
own f
or Le
gal S
ervic
es ar
e allo
cated
by es
timate
d cos
ts inc
urre
d by e
ach p
rogr
am.
(4)Co
sts sh
own f
or B
usine
ss S
ervic
e inc
lude c
harg
es fo
r infor
matio
n tec
hnolo
gy su
ppor
t, veh
icles
, inter
nal a
udit s
ervic
es an
d oth
er se
rvice
s ar
e allo
cated
by co
sts in
certa
in pr
ogra
ms.
Costs
show
n for
Acc
ommo
datio
n are
alloc
ated b
y bud
geted
Full
-Tim
e Equ
ivalen
t Emp
loyme
nt.Ex
pens
es -
Dire
ctly I
ncur
red a
s per
Stat
emen
t of O
pera
tions
.
Exp
ense
s - In
curre
d by
Oth
ers
2017
2016-17 Energy Annual Report98

2016-17 Energy Annual Report 99
DEPARTMENT OF ENERGY
FINANCIAL STATEMENTSFor the year ended March 31, 2017
Independent Auditor’s Report
Statement of Operations
Statement of Financial Position
Statement of Change in Net Debt
Statement of Cash Flows
Notes to Financial Statements
Schedules to Financial Statements

2016-17 Energy Annual Report100
Independent Auditor’s Report
To the Minister of Energy
Report on the Financial Statements
I have audited the accompanying financial statements of the Department of Energy, which comprise the statement of financial position as at March 31, 2017, and the statements of operations, change in net debt and cash flows for the year then ended, and a summary of significant accounting policies and other explanatory information.
Management’s Responsibility for the Financial Statements
Management is responsible for the preparation and fair presentation of these financial statements in accordance with Canadian public sector accounting standards, and for such internal control as management determines is necessary to enable the preparation of financial statements that are free from material misstatement, whether due to fraud or error.
Auditor’s Responsibility
My responsibility is to express an opinion on these financial statements based on my audit. I conducted my audit in accordance with Canadian generally accepted auditing standards. Those standards require that I comply with ethical requirements and plan and perform the audit to obtain reasonable assurance about whether the financial statements are free from material misstatement.
An audit involves performing procedures to obtain audit evidence about the amounts and disclosures in the financial statements. The procedures selected depend on the auditor’s judgment, including the assessment of the risks of material misstatement of the financial statements, whether due to fraud or error. In making those risk assessments, the auditor considers internal control relevant to the entity’s preparation and fair presentation of the financial statements in order to design audit procedures that are appropriate in the circumstances, but not for the purpose of expressing an opinion on the effectiveness of the entity’s internal control. An audit also includes evaluating the appropriateness of accounting policies used and the reasonableness of accounting estimates made by management, as well as evaluating the overall presentation of the financial statements.
I believe that the audit evidence I have obtained is sufficient and appropriate to provide a basis for my audit opinion.
Opinion
In my opinion, the financial statements present fairly, in all material respects, the financial position of the Department of Energy as at March 31, 2017, and the results of its operations, its changes in net debt and its cash flows for the year then ended in accordance with Canadian public sector accounting standards.
June 6, 2017
Edmonton, Alberta
Original signed by Merwan N. Saher, FCPA, FCA Auditor General

DEPARTMENT OF ENERGYSTATEMENT OF OPERATIONSYear ended March 31, 2017(in thousands)
2016Budget Actual Actual
(Note 18)
Revenues (Schedule 1)Non-Renewable Resource Revenue 1,363,692$ 3,097,162$ 2,789,120$ Freehold Mineral Rights Tax 71,000 57,059 79,395 Other Revenue (Note 3) 500 3,803 81,137
1,435,192 3,158,024 2,949,652
Expenses - Directly Incurred (Schedule 2)Ministry Support Services 7,143 7,650 7,460 Resource Development and Management 91,105 93,059 101,583 Bioenergy Initiatives - - 70,498 Cost of Selling Oil 156,308 57,752 77,168 Climate Leadership Plan - 1,119,232 - Carbon Capture and Storage 202,202 30,659 159,873
456,758 1,308,352 416,582
Annual Surplus 978,434$ 1,849,672$ 2,533,070$
The accompanying notes and schedules are part of these financial statements.
2017
2016-17 Energy Annual Report 101

DEPARTMENT OF ENERGYSTATEMENT OF FINANCIAL POSITIONAs at March 31, 2017(in thousands)
2017 2016Actual Actual
(Note 18)
Financial AssetsCash and Cash Equivalents (Note 4) 229,411$ 47,876$Accounts Receivable (Note 5) 277,663 133,431Inventory for Resale (Note 6) 914 277
507,988 181,584
LiabilitiesAccounts Payable and Accrued Liabilities (Note 7) 64,999 347,633Gas Royalty Deposits (Note 8) 112,066 212,952Unearned Revenue 65,113 67,493Coal Phase-Out Agreements (Note 9) 1,114,613 -
1,356,791 628,078Net Debt (848,803) (446,494)
Non-Financial AssetsTangible Capital Assets (Note 10) 23,200 24,275
Net Liabilities (825,603) (422,219)
Net Liabilities at Beginning of Year (422,219) (553,090)Annual Surplus 1,849,672 2,533,070Net Financing Provided For General Revenues (2,253,056) (2,402,199)Net Liabilities at End of Year (825,603)$ (422,219)$
Contingent Liabilities, Contractual Obligations and Program Committments (Notes 11, 12 and 13)
The accompanying notes and schedules are part of these financial statements.
2016-17 Energy Annual Report102

DEPARTMENT OF ENERGYSTATEMENT OF CHANGE IN NET DEBTAs at March 31, 2017(in thousands)
2016Budget Actual
(Note 18)
Annual Surplus 978,434$ 1,849,672$ 2,533,070$
Acquisition of Tangible Capital Assets (Note 10) (5,399) (4,902) (1,913) Amortization of Tangible Capital Assets (Note 10) 6,588 5,977 8,257 Proceeds on Sale of Tangible Capital Assets (Note 10) - 16 Net Financing Provided For General Revenue (2,253,056) (2,402,199)
(Increase)/Decrease in Net Debt (402,309) 137,231 Net Debt at Beginning of Year (446,494) (583,725) Net Assets/(Debt) at End of Year (848,803)$ (446,494)$
The accompanying notes and schedules are part of these financial statements.
2017
2016-17 Energy Annual Report 103

DEPARTMENT OF ENERGYSTATEMENT OF CASH FLOWSYear ended March 31, 2017(in thousands)
2017 2016Actual Actual
(Note 18)
Operating TransactionsAnnual Surplus 1,849,672$ 2,533,070$ Non-cash Items included in Net Operating Results
Amortization of Tangible Capital Assets (Note 10) 5,977 8,257 1,855,649 2,541,327
(Increase)/Decrease in Accounts Receivable (144,232) 79,752 (Increase)/Decrease in Inventory (637) 949 Decrease in Accounts Payable and Accrued Liabilities (282,634) (242,518) Decrease in Unearned Revenue (2,380) (5,087) Increase in Coal Phase-Out Agreements (Note 9) 1,114,613 - Cash Provided by Operating Transactions 2,540,379 2,374,423
Capital TransactionsAcquisition of Tangible Capital Assets (Note 10) (4,902) (1,913) Proceeds from Disposal of Tangible Capital Assets (Note 10) - 16 Cash Applied to Capital Transactions (4,902) (1,897)
Financing TransactionsNet Financing Provided for General Revenues (2,253,056) (2,402,199) Decrease in Gas Royalty Deposits (Note 8) (100,886) (34,825) Cash Applied to Financing Transactions (2,353,942) (2,437,024)
Increase (Decrease) in Cash and Cash Equivalents 181,535 (64,498) Cash and Cash Equivalents at Beginning of Year 47,876 112,374 Cash and Cash Equivalents at End of Year 229,411$ 47,876$
The accompanying notes and schedules are part of these financial statements.
2016-17 Energy Annual Report104

DEPARTMENT OF ENERGYNOTES TO FINANCIAL STATEMENTSMarch 31, 2017(in thousands)
NOTE 1 AUTHORITY & PURPOSE
The Department of Energy operates under the authority of the Government Organization Act , Chapter G‑10, RevisedStatutes of Alberta 2000.
The reporting entity is the Department of Energy, which is part of the Ministry of Energy and for which the Ministerof Energy is accountable. Other entities reporting to the Minister are the Alberta Petroleum Marketing Commission(APMC), the Alberta Energy Regulator (AER), the Alberta Utilities Commission (AUC) and the Balancing Pool(The BP). The activities of these organizations are not included in these financial statements. The ministry annualannual report provides a more comprehensive accounting of the financial position and results of the ministry’s operations for which the minister is accountable.
NOTE 2 SUMMARY OF SIGNIFICANT ACCOUNTING POLICIES AND REPORTING PRACTICES
These financial statements are prepared in accordance with Canadian Public Sector Accounting Standards.
(a) Basis of Financial Reporting
Revenues
All revenues are reported on the accrual basis of accounting. Cash received for which goods or services have not been provided by year end is recognized as deferred revenue.
The provincial royalty system is predicated on self-reporting where the petroleum and natural gas industry is expected to understand the relevant energy legislation (statutes and regulations) and comply with them. Thishas an impact on the completeness of revenue when the petroleum and natural gas industry do not fully meetthe legislative requirements and, for example, report inaccurate or incomplete production data. The department has implemented systems and controls to detect and correct situations where the petroleum andnatural gas industry has not complied with the various Acts and Regulations the department administers.These systems and controls, based on areas of highest risk, include performing audits of the petroleum and natural gas industry records where determined necessary by the department. The department does notestimate the effect of misreported revenue. Any impacts on revenue of refiling by industry are recognized in the year of refiling.
Crude oil and natural gas royalties are determined based on monthly production. Revenue is recognized when the resource is produced by the mineral rights holders.
Bitumen royalty is determined based on revenues from production sold by projects less the costs of thatproduction and the costs of selling the Crown’s royalty share. Royalty revenue is recognized when theresource is produced by the mineral rights holders.
The Department of Energy is responsible for ensuring the development of Alberta’s resources through the stewardship of energy and mineral resource systems. These resources include both non-renewable and renewable resources.
2016-17 Energy Annual Report 105

DEPARTMENT OF ENERGYNOTES TO FINANCIAL STATEMENTSMarch 31, 2017(in thousands)
NOTE 2 SUMMARY OF SIGNIFICANT ACCOUNTING POLICIES AND REPORTING PRACTICES (cont'd)
(a) Basis of Financial Reporting (cont'd)
Revenues (cont'd)
Freehold mineral rights taxes are determined at the end of a calendar year based on production and costs of production incurred in the calendar year. Revenue is recognized on a prorated basis, by month, of the estimated calendar year taxes that will be due to the Crown.
Revenue from bonuses and sales of Crown leases is recognized when the Crown leases are sold. Rentals and fees revenue is recognized over the term of the leases.
Expenses
Directly Incurred
Directly incurred expenses are those costs the department has primary responsibility and accountability for, as reflected in the government’s budget documents.
In addition to program operating expenses such as salaries, supplies, etc., directly incurred expenses also include:• amortization of tangible capital assets,• pension costs, which are the cost of employer contributions for current service of employees during the
year, and• valuation adjustments which include changes in the valuation allowances used to reflect financial assets
at their net recoverable or other appropriate value. Valuation adjustments also represent the change in management’s estimate of future payments arising from obligations relating to vacation pay, guarantees and indemnities.
Grants are recognized as expenses when authorized and eligibility criteria, if any, are met.
Incurred by Others
Services contributed by other entities in support of the department's operations are not recognized and are disclosed in Schedule 5 and allocated to programs in Schedule 6.
Valuation of Financial Assets and Liabilities
Fair value is the amount of consideration agreed upon in an arm’s length transaction between knowledgeable,willing parties who are under no compulsion to act.
The fair values of Cash and Cash Equivalents, Accounts Receivable, Loans and Advances, and AccountsPayable and Accrued Liabilities are estimated to approximate their carrying values because of the short termnature of these instruments.
2016-17 Energy Annual Report106
DEPARTMENT OF ENERGYNOTES TO FINANCIAL STATEMENTSMarch 31, 2017(in thousands)
NOTE 2 SUMMARY OF SIGNIFICANT ACCOUNTING POLICIES AND REPORTING PRACTICES (cont'd)
(a) Basis of Financial Reporting (cont'd)
Financial Assets
Financial assets are assets that could be used to discharge existing liabilities or finance future operations and are not for consumption in the normal course of operations.
Financial assets of the department are limited to financial claims, such as cash and cash equivalents, advances to and receivables from other organizations, employees and other individuals,as well as inventories held for resale.
Assets acquired by right are not included.
Accounts Receivable
Accounts receivable are recognized at the lower of cost or net recoverable value. A valuation allowance isrecognized when recovery is uncertain.
Inventory for Resale
Inventory consists of conventional and synthetic oil in feeder and trunk pipelines. Inventories are stated at lowerof cost or net realizable value.
Liabilities
Liabilities are present obligations of a government to others arising from past transactions or events, thesettlement of which is expected to result in the future sacrifice of economic benefits.
Non-Financial Assets
Non-financial assets are acquired, constructed or developed assets that do not normally provide resourcesto discharge existing liabilities, but instead:
a) are normally employed to deliver government services;b) may be consumed in the normal course of operations; andc) are not for sale in the normal course of operations.
Non-financial assets of the department are limited to tangible capital assets.
Tangible capital assets of the department are recognized at historical cost and amortized on a straight-line basis over the estimated useful lives of the assets. The threshold for capitalizing new systems developmentis $250,000 and the threshold for major systems enhancements is $100,000. The threshold for all other tangible capital assets is $5,000.
Amortization is only charged if the tangible capital asset is put into service.
2016-17 Energy Annual Report 107

DEPARTMENT OF ENERGYNOTES TO FINANCIAL STATEMENTSMarch 31, 2017(in thousands)
NOTE 2 SUMMARY OF SIGNIFICANT ACCOUNTING POLICIES AND REPORTING PRACTICES (cont'd)
(a) Basis of Financial Reporting (cont'd)
General Revenue Fund
All departments of the Government of Alberta operate within the General Revenue Fund (the Fund). The Fundis administered by the President of Treasury Board and Minister of Finance. All cash receipts of departments are deposited into the Fund and all cash disbursements made by departments are paid from the Fund. Net Financingprovided from (for) General Revenues is the difference between all cash receiptsand all cash disbursements made.
Measurement Uncertainty
Measurement uncertainty exists when there is a variance between the recognized or disclosed amount and another reasonably possible amount. Natural gas and by-products revenue recognized as $519,746(2016 - $493,032), bitumen royalty recognized as $1,483,459 (2016 - $1,222,971), and crude oil royalty revenue recognized as $716,329 (2016 - $688,800) in these financial statements are subject tomeasurement uncertainty.
Natural gas and by-products revenue is calculated based on allowable costs incurred by the royalty payers andproduction volumes that are reported to the department by royalty payers. Industry may modify their royalty andgas cost allowance for non-statute barred years. These amounts could vary significantly from that which wasinitially reported. The department estimates what the costs, volumes and royalty rates for the fiscal year shouldbe based on statistical analysis of industry data. Based on historical data, changes to natural gas and by-products revenues was $94,492 (2016 - $153,341).
For projects from which bitumen royalty is paid and the project has reached payout, the royalty rate used to determine the royalties is based on the average price of West Texas Intermediate crude oil in Canadian dollars for the calendar year. Royalty rates will start at 25% of net profits when oil is priced at fifty five dollars per barrel or less, and increase to a maximum of 40% of net profits when oil is priced at one hundred and twenty dollars or more. Payout is defined at the first date at which the cumulative revenue of a project first equals the cumulative cost of the project.
(b) Future Accounting Changes
The Public Sector Accounting Board has issued the following accounting standards:
● PS2200 Related Party Disclosures and PS3420 Inter-Entity Transactions (effective April 1, 2017)PS 2200 defines a related party and establishes disclosures required for related party transactions; PS3240 establishes standards on how to account for and report transactions between public sector entities that comprise a government's reporting entity from both a provider and recipient perspective.
2016-17 Energy Annual Report108

DEPARTMENT OF ENERGYNOTES TO FINANCIAL STATEMENTSMarch 31, 2017(in thousands)
NOTE 2 SUMMARY OF SIGNIFICANT ACCOUNTING POLICIES AND REPORTING PRACTICES (cont'd)
(b) Future Accounting Changes (cont'd)
● PS3210 Assets, PS3320 Contingent Assets, and PS3380 Contractual Rights (effective April 1, 2017)PS3210 provides guidance for applying the definition of assets set out in FINANCIAL STATEMENT CONCEPTS, Section PS1000 establishes general disclosure standards for assets; PS3320 defines and establishes disclosure standards on contingent assets; PS3380 defines and establishes disclosure standards on contractual rights.
● PS3430 Restructuring Transactions (effective April 1, 2018)This standard provides guidance on how to account for and report restructuring transactions by both transferors and recipients of assets and/or liabilities, together with related party programs or operating responsibilities.
NOTE 3 OTHER REVENUE2017 2016
Disgorgement Payment and Monetary Penalty to TransAlta Corporation -$ 51,921$ Settlements Related to the Land-Use Framework - 25,891 Other Revenue 3,803 3,325
3,803$ 81,137$
NOTE 4 CASH AND CASH EQUIVALENTS
Cash consists of deposits in Canadian financial institutions which are managed by the Province of Alberta with the objective of providing competitive interest income to depositors while maintaining appropriate security and liquidity of depositors’ capital. The Fund is comprised of high quality short-term and mid-term fixed income securities with a maximum term to maturity of three years.
NOTE 5 ACCOUNTS RECEIVABLE
Accounts receivable royalties are secured by a claim against the mineral leases and are interest bearing in accordance with the applicable legislation.
2016
GrossAmount
Allowancefor DoubtfulAccounts
NetRealizable
Value
NetRealizable
Value
Non-Renewable Royalty Receivables 277,284$ 5,491$ 271,793$ 129,693$ Bioenergy Grant Recoveries 6,615 6,615 - 3,011 Due from APMC 5,870 - 5,870 727
289,769$ 12,106$ 277,663$ 133,431$
2017
2016-17 Energy Annual Report 109

DEPARTMENT OF ENERGYNOTES TO FINANCIAL STATEMENTSMarch 31, 2017(in thousands)
NOTE 6 INVENTORY FOR RESALE
Inventory reported consists of crude oil inventory held for marketing by APMC. Inventory is calculated based oninventory volumes held in various revenue pools multiplied by average pricing.
NOTE 7 ACCOUNTS PAYABLE AND ACCRUED LIABILITIES2017 2016
Trade 64,999$ 188,977$ Overpayments of Royalties - 158,656
64,999$ 347,633$
NOTE 8 GAS ROYALTY DEPOSITS
The department requires that natural gas producers maintain a deposit which in most cases is equal to one-sixth of the prior calendar year's royalties multiplied by the ratio of the long term gas reference price on the date which the recalculation of the gas deposits is determined to the prior calendar year average gas referenceprice. The department does not pay interest on the deposits.
NOTE 9 COAL PHASE-OUT AGREEMENTS
The phase out of coal-fired generators is in alignment with the Province's Climate Leadership Plan (CLP). On November 24, 2016, the Minister of Energy, on behalf of the Province of Alberta, reached agreements with three coal-fired generators to cease operations on or before December 31, 2030. The coal-fired generation plants covered under agreements include: Sheerness 1 and 2; Genesee 1, 2, and 3; and Keephills 3.
As these and other coal-fired generation plants cease operations either because their license to operate expiredunder Federal regulations or because of these agreements, replacement electricity supply will be needed as early as 2021-2022. Permitting and construction of new generation plants could take between four and seven years. It is important that there is no gap between generation supply and generation demand.
At the time these coal phase-out agreements were negotiated, there was significant uncertainty around the likelihood of new investments in electricity generation because of the historic low electricity prices, the Alberta economy at the time, and the return of Power Purchase Agreements. The Province's agreement to provide transitional payments to the three coal-fired generators is to assist them in continuing as an active supplier of electricity to Albertans as well as to stabilize market confidence for investments in electricity generation.
The three agreements reached with the parties are similar in that the Ministry of Energy will make paymentstotalling $96,970 annually to the three generators. One of the factors considered in arriving at the payment amount is the remaining net book value of these generation plants at December 31, 2030. These annualpayments will begin on or before July 31, 2017 for 14 years. In return, the coal-fired plants named above will
2016-17 Energy Annual Report110

DEPARTMENT OF ENERGYNOTES TO FINANCIAL STATEMENTSMarch 31, 2017(in thousands)
NOTE 9 COAL PHASE-OUT AGREEMENTS (cont'd)
meet a number of conditions on an annual basis and will cease operations in the coal-fired electricity generation plants on or beforeDecember 31, 2030. These conditions are specific to each party, generally requiring each of the coal-fired generator owner to spend a minimum specified amount in the communities in which the plants were located, along with future specified value of investmentand investment related activities in Alberta with respect to electricity business.
The present value of these 14 payments, discounted at 3% (representing the government's average 10-year bond rate at time of negotiations), is $1,114,613 (2016 - $0). The amount of the draw down over the next five years and thereafter are as follows:
Annual Payment Principal Interest
2017 96,970$ 65,110$ 31,861$ 2018 96,970 67,063 29,907 2019 96,970 69,098 27,872 2020 96,970 71,196 25,775 2021 96,970 73,357 23,614 Thereafter 872,933 768,789 103,774
1,357,783$ 1,114,613$ 242,803$
NOTE 10 TANGIBLE CAPITAL ASSETS
Equipment (1)
ComputerHardware and
Software Total
Estimated Useful Life 3-40 years 3-10 years
Historical Cost (2)
Beginning of Year (reported) 14,702$ 95,491$ 110,193$ Reclassification adjustment (3) (8,695)$ 8,695$ -$ Additions -$ 4,902$ 4,902$ Disposals, Including Write-downs -$ -$ -$
6,007$ 109,089$ 115,095$
Accumulated AmortizationBeginning of Year (reported) 10,403$ 75,515$ 85,918$ Reclassification adjustment (3) (5,765)$ 5,765$ -$ Amortization Expense 383$ 5,594$ 5,977$ Effect of Disposals -$ -$ -$
5,021$ 86,874$ 91,895$
Net Book Value at March 31, 2017 986$ 22,215$ 23,200$
Net Book Value at March 31, 2016 4,299$ 19,976$ 24,275$
(1) Equipment includes office equipment and furniture and other equipment.(2) Historical cost includes work-in-progress at March 31, 2017 totaling $3,392 (2016 - $99) for computer software. (3) Computer hardware was previously included under equipment, should be included with computer software.
2016-17 Energy Annual Report 111

DEPARTMENT OF ENERGYNOTES TO FINANCIAL STATEMENTSMarch 31, 2017(in thousands)
NOTE 11 CONTINGENT LIABILITIES
The department is involved in legal matters where damages are being sought. These matters may give rise to contingent liabilities. Accruals have been made in specific instances where it is likely that losses will be incurredbased on a reasonable estimate.
The department has been named in six claims (2016 - five), all with outcomes that are not determinable.Four claims have specified amounts totalling $7,253 (2016 three claim of $7,158) and two claims (2016 - two) has no specified amounts.
The department has been jointly named with other entities in seven claims (2016 - seven). Five of these claimshave specified amounts totaling $33,550 (2016 – five claims totaling $14,350) and two claims (2016 - two) with no amounts specified.
Of the total specified claims, two claims totaling $10,007 (2016 - two claims totaling $10,007) are partially or fullycovered by the Alberta Risk Management Fund.
The resolution of the indeterminable claim may result in a liability, if any, that may be significantly lower than theclaimed amount.
NOTE 12 CONTRACTUAL OBLIGATIONS
As at March 31, 2017, the department had contractual obligations totaling $773,545 ( 2016 - $799,886).
Contractual obligations are obligations of the department to others that will become liabilities in the future when the terms of those contracts or agreements are met.
These amounts include obligations under long-term contracts with contract payment requirements for each ofthe next five years and thereafter are as follows:
GrantAgreements
ServiceContracts Total
2018 213,700$ 11,355$ 225,055$ 2019 129,100 4,255 133,355 2020 43,000 2,964 45,964 2021 53,300 2,947 56,247 2022 52,500 2,924 55,424 Thereafter 257,500 - 257,500
749,100$ 24,445$ 773,545$
2016-17 Energy Annual Report112

DEPARTMENT OF ENERGYNOTES TO FINANCIAL STATEMENTSMarch 31, 2017(in thousands)
NOTE 13 PROGRAM COMMITMENTS
Regulated Rate Option Price Ceiling
On November 22, 2016, the government announced a four-year price cap to protect families, farms, and small businesses from volatility in electricity prices as the province makes necessary reforms to the electricity system. Theprogram runs from June 2017 to June 2021. During this period, consumers on the Regulated Rate Option (RRO)will pay the lower of the market rate or the government's ceiling rate of 6.8 cents per kilowatt hour.
The cost of the program is currently unknown. Current Regulated Rate Option rates are well below the 6.8 cents priceceiling; however, market changes to the supply and demand for electricity over the next four years will determinewhether or not the market rate will exceed the price ceiling. Furthermore, the cost to the government will also dependon the level of electricity consumed when the price ceiling is breached.
Renewable Energy Program
On March 24, 2017, the government announced the opening of the first of a series of competitions to create greenelectricity in the province as part of its target of 30 percent renewable electricity by 2030.
The Renewable Electricity Program (REP) targets the development of renewable electricity generation capacity connected to the Alberta grid.
The government has contracted with the Alberta Electric System Operator (AESO) to implement and administerthe program. The process from the Request for Expression of Interest (REOI), Request for Qualifications (RFQ), and Request for Proposals (RFP) is expected to take between seven to eleven months. An REOI is being soliciteduntil April 21, 2017 for the first 400 MW of new renewable electric energy.
Under the first round of this program, the government participates in the market risks of electricity prices by ensuringREP generators are kept whole by making sure the difference between the pool price and the accepted strike price is netted out, as follows:a) When the market prices are high, the government will receive payments from the REP generator for pool prices
that are in excess of the accepted strike price; and b) When the market prices are low, the government will pay the REP generator the difference between the pool
prices and the accepted strike price.
The cost of the program cannot be reasonably determined until acceptance of strike prices has been completed.
Petrochemicals Diversification Program
On December 5, 2016 the government announced the approval of two new petrochemicals projects to be constructedunder the Petrochemicals Diversification Program.
Under the Program, the two projects may receive up to $500 million in royalty credits provided the following:a) Projects must achieve a Final Investment Decision to proceed within 18 months (June 2018).b) Commercialization of the projects in 2021.c) The amount of royalty credit is calculated based on the actual consumption of propane to produce polypropylene.
2016-17 Energy Annual Report 113
DEPARTMENT OF ENERGYNOTES TO FINANCIAL STATEMENTSMarch 31, 2017(in thousands)
NOTE 14 TRUST FUNDS UNDER ADMINSTRATION
The department administers the Oil and Gas Conservation Trust consisting of public money over which theLegislature has no power of appropriation. Because the Province has no equity in the fund and administersthe fund for the purpose of various trusts, the fund is not included in the department’s financial statements.
As at March 31, 2017, the funds in the Oil and Gas Conservation Trust are $4,674 (2016 - $4,594).
NOTE 15 BENEFIT PLANS
The department participates in the multi-employer pension plans: Management Employees Pension Plan and Public Service Pension Plan and Supplementary Retirement Plan for Public Service Managers. The expense for these pension plans is equivalent to the annual contributions of $9,395 for the year ended March 31, 2017 (2016 - $10,141). Departments are not responsible for future funding of the plan deficit other than through contribution increases.
At December 31, 2016, the Management Employees Pension Plan reported a surplus of $402,033 (2015 - surplus of $299,051), the Public Service Pension Plan reported a surplus of $302,975 (2015 deficiency - $133,188) and the Supplementary Retirement Plan for Public Service Managers reported a deficiency of $50,020 (2015 - deficiency of $16,305).
The department also participates in two multi-employer Long Term Disability Income Continuance Plans. At March 31, 2017, the Bargaining Unit Plan reported an actuarial surplus of $101,515 (2016 - surplus $83,006 ) and the Management, Opted Out and Excluded Plan an actuarial surplus of $31,439 (2016 - surplus $29,246). The expense for these twoplans is limited to the employer’s annual contributions for the year.
NOTE 16 ROYALTY REDUCTION PROGRAMS
The department provides eleven oil and gas royalty reduction programs. The intent of these programs is to encourageindustry to produce from wells which otherwise would not be economically productive. For the year ended March 31, 2017, the royalties received under these programs were reduced by $1,180,112 (2016 - $889,507).
NOTE 17 BITUMEN CONSERVATION
In 2004-05 the Alberta Energy and Utilities (EUB) Board (now known as the AER) released its Bitumen Conservation Requirements decisions regarding the status of natural gas wells in the Wabiskaw-McMurray region of the Athabasca Oil Sands area. The decisions recommended the shut-in of Wabiskaw-McMurray natural gas totaling about 53.6 billions of cubic feet annually to protect about 25.5 billion barrels of potentially recoverable bitumen. The NaturalGas Royalty Regulations, 2002 was amended to provide a royalty mechanism that would allow the Minister of Energy to calculate a royalty adjustment each month for gas producers affected by the EUB decisions. The Natural Gas Royalty Regulations, 2002 was also amended to provide for the royalty adjustment to be recovered through additional royalty on the shut-in wells when they return to production through amendments to the provisions that deal with the calculation ofthe royalty share of gas. The amendments provide for an increase over and above the usual royalty rate, and extend to new wells that produce from the shut-in zone. The effect of these adjustments was to reduce natural gas and by-products revenue by $10,602 (2016 - $12,139).
2016-17 Energy Annual Report114

DEPARTMENT OF ENERGYNOTES TO FINANCIAL STATEMENTSMarch 31, 2017(in thousands)
NOTE 18 COMPARATIVE FIGURES
Certain 2016 figures have been reclassified to conform to 2017 presentation.
NOTE 19 APPROVAL OF FINANCIAL STATEMENTS
The Deputy Minister and the Senior Financial Officer approve these financial statements.
2016-17 Energy Annual Report 115

DEPARTMENT OF ENERGY Schedule 1SCHEDULE TO FINANCIAL STATEMENTSREVENUESYear ended March 31, 2017(in thousands)
2016Budget Actual Actual
(Note 18)
Non-Renewable Resource Revenue (Note 16)Bitumen Royalty 656,000$ 1,483,459$ 1,222,971$ Crude Oil Royalty 332,692 716,329 688,800 Natural Gas and By-Products Royalty (Note 17) 151,000 519,746 493,032 Bonuses and Sales of Crown Leases 95,000 203,276 203,267 Rentals and Fees 118,000 148,170 167,382 Coal Royalty 11,000 26,182 13,668
1,363,692 3,097,162 2,789,120
Freehold Mineral Rights Tax 71,000 57,059 79,395
Other Revenue (Note 3) 500 3,803 81,137 Total Revenue 1,435,192$ 3,158,024$ 2,949,652$
2017
2016-17 Energy Annual Report116

DEPARTMENT OF ENERGY Schedule 2SCHEDULE TO FINANCIAL STATEMENTSEXPENSES - DIRECTLY INCURRED Year ended March 31, 2017(in thousands)
2016Budget Actual Actual
(Note 18)
Grants (1) 199,850$ 1,148,365$ 230,902$ Salaries, Wages and Employee Benefits 78,748 74,055 79,339 Supplies and Services 171,572 74,362 98,586 Amortization of Tangible Capital Assets (Note 10) 6,588 5,977 8,257 Other - 6,155 64 Total Expenses before Recoveries 456,758 1,308,914 417,148
Less Recovery from Support Service Arrangementswith Related Parties (2) - (562) (566)
456,758$ 1,308,352$ 416,582$
(1)(2) The department provides financial services to the departments of Environment & Parks and Agriculture & Forestry. Costs
incurred by the department for these services are recovered from the respective departments.
2017
Included in Grants expense is $1,114,613 (2016 - $nil) related to the Coal Phase out agreements.
2016-17 Energy Annual Report 117

DEPARTMENT OF ENERGY Schedule 3SCHEDULE TO FINANCIAL STATEMENTS
Year ended March 31, 2017(in thousands)
VotedEstimate (1)
SupplementaryEstimate/Adjustm
ents (2)
AdjustedVoted
EstimateVoted
Actuals (3)
Unexpended(Over
Expended)Program - Operational
Program - Ministry Support Services1.1 Minister's Office 703$ -$ 703$ $ 709 (6) $ 1.2 Associate Minister's Office - - - - - 1.3 Deputy Minister's Office 485 - 485 667 (182) 1.4 Communications 1,445 - 1,445 1,347 98 1.5 Corporate Service 4,510 - 4,510 4,927 (417)
7,143 - 7,143 7,650 (507)
Program - Resource Development and Management2.1 Revenue Collection 41,308 - 41,308 39,372 1,936 2.2 Resource Development 37,170 - 37,170 40,777 (3,607) 2.3 Royalty Review Implementation (4) 6,000 - 6,000 1,467 4,533
84,478 - 84,478 81,616 2,862
Program - Bioenergy Initiatives3 Bioenergy Initiatives - - - - -
- - - - -
Program - Cost of Selling Oil4 Cost of Selling Oil 156,308 - 156,308 57,752 98,556
156,308 - 156,308 57,752 98,556
Program - Climate Leadership Plan5.2 Climate Leadership Initiatives (5) - - - 4,619 (4,619)
- - - 4,619 (4,619)
247,929$ -$ 247,929$ 151,637$ 96,292$ Lapse/(Encumbrance) 96,292$
Program - CapitalProgram - Resource Development and Management 5,399 - 5,399 1,392 4,007 Program - Royalty Review Implementation (4) - - - 2,910 (2,910) Total 5,399$ -$ 5,399$ 4,302$ 1,097$ Lapse/(Encumbrance) 1,097$
(1) As per "Operational Vote by Program", "Voted Capital Vote by Program" and "Financial Transaction Vote by Program" page of 2016-17 Government Estimates.
(2) There was no Supplementary Estimate during the year. The only adjustment to the budget was the Coal Phase-Out Agreements(3) Actuals exclude non-voted amounts such as statutory programs, amortization and valuation adjustments.(4) Royalty review implementation costs for 2016-17 include both operating and capital expenditures.(5)
LAPSE/ENCUMBRANCE
Total
The accrual of $1,115 for the Coal Phase-Out Agreements has not been included in the Schedule as this amount was not part of the 2016-17 Voted Estimates and no payment was made during the year. The first payment is expected in July 2017 and this will be included in the 2017-18 Voted Estimates
2016-17 Energy Annual Report118

DEPARTMENT OF ENERGY Schedule 4SCHEDULE FOR FINANCIAL STATEMENTSSALARY AND BENEFITS DISCLOSUREYear ended March 31, 2017(in thousands)
BaseSalary (1)
OtherCash
Benefits (2)
OtherNon-cashBenefits (3) Total
2016Total
Deputy Minister (4) 281$ 128$ 75$ 484$ 357$
ExecutivesAssistant Deputy Minister - Strategic Policy Division (5) 190 2 50 242 253 Assistant Deputy Minister - Resource Revenue & Operations/Strategic Initiatives 200 - 53 253 254 Assistant Deputy Minister - Ministry Support Services 193 - 49 242 243 Assistant Deputy Minister - Resource Development Policy (6) 192 - 49 241 189 Assistant Deputy Minister - Electricity & Sustainable Energy (7) 187 - 48 235 250 Assistant Deputy Minister - Oil Sands (8) 119 - 30 149 244 Assistant Deputy Minister - Integration & Innovation (9) 114 - 29 143 - Assistant Deputy Minister - Resource Revenue & Operations (10) - - - - 85
Other ExecutivesSpecial Advisor - Tenure and Operational Initiatives (11) 76 - 21 97 - Director - Communications 129 - 35 164 164
(1)(2)(3)
(4)
(5)
(6)
(7)(8)(9)
(10)(11)
This position was created effective April 10, 2016. Effective November 1, 2016, a revised executive team structure was implemented. This position no longer exists.This position was occupied by an individual until July 17, 2015. This position no longer exists.Effective November 1, 2016, a revised executive team structure was implemented.
2017
This position was occupied by two individuals during the year. The first individual was in the position until April 10, 2016.
Base salary includes regular salary and earning such as acting pay.Other cash benefits include vacation payouts and lump sum payments such as Special Compensation for Wood Buffalo Wild Fire.Other non-cash benefits include government's share of all employee benefits and contributions or payments made on behalf of employees including pension, supplementary retirement plans, health care, dental coverage, group life insurance, short and long term disability plans, car allowances, health spending account expense, and professional memberships and tuition fees.
An automobile is provided to this position, no dollar amount is included in Other Non-Cash Benefits. During the year, this position was occupied by two individuals. The first individual was in the position until May 7, 2016 and included in Other Cash Benefits is $35 in severance benefits paid as a result of a termination agreement.
Effective November 1, 2016, a revised executive team structure was implemented. This position no longer exists.
This position was occupied by two individuals during the year. The first individual was in the position until May 7, 2016 and the Other Cash Benefits reflect payment of Special Compensation for Wood Buffalo Wild Fire to this individual.This position was occupied by three individuals during the year. The first individual was in the position until May 30, 2016. The second individual was in the position between June 1 and October 31, 2016.
2016-17 Energy Annual Report 119

DEPARTMENT OF ENERGY Schedule 5SCHEDULE TO FINANCIAL STATEMENTSRELATED PARTY TRANSACTIONS
2017 2016 2017 2016
Accounts Receivable 83,038$ 27,767$ -$ 41$
Accounts Payable 1,123$ -$ 2$ 309$
Revenue -$ -$ 8$ -$Expenses - Directly Incurred
Grants 3,371 - - 76Other services - 75 2,811 2,408
3,371$ 75$ 2,811$ 2,484$
Contractual Obligations -$ -$ -$ -$
2017 2016 2017 2016Expenses - Incurred by Others
Accommodation -$ -$ 6,610$ 6,478$Legal - - 4,576 5,048Business Services - - 2,589 2,745
-$ -$ 13,775$ 14,271$
The above transactions do not include support service arrangement transactions disclosed in Schedule 2.
The department also had the following transactions with related parties for which no consideration was exchanged. The amounts for these related party transactions are estimated based on the costs incurred by the service provider to provide the service. These amounts are not reported in the financial statements and are disclosed in Schedule 6.
Entities in the Ministry Other Entities
Year ended March 31, 2017(in thousands)
Related parties are those entities consolidated or accounted for on the modified equity basis in the Government of Alberta’s financial statements. Related parties also include key management personnel in the Department.
The department and its employees paid or collected certain taxes and fees set by regulation for premiums, licenses and other charges. These amounts were incurred in the normal course of business, reflect charges applicable to all users, and have been excluded from this Schedule.
The department had the following transactions with related parties reported on the Statement of Operations and the Statement of Financial Position at the amount of consideration agreed upon between the related parties:
Entities in the Ministry Other Entities
2016-17 Energy Annual Report120

DEPA
RTME
NT O
F EN
ERGY
Sche
dule
6SC
HEDU
LE T
O FI
NANC
IAL
STAT
EMEN
TSAL
LOCA
TED
COST
SYe
ar en
ded
Marc
h 31
, 201
7(in
thou
sand
s)20
16(N
ote 18
)Ac
com
mod
atio
nLe
gal
Busin
ess
Tota
lTo
tal
Prog
ram
Expe
nses
(1)
Cost
s(2)
Serv
ices (3
)Se
rvice
s (4)
Expe
nses
Expe
nses
Minis
try S
uppo
rt Se
rvice
s7,6
50$
568
$
1,301
$
-
$
9,5
19$
9,925
$Re
sour
ce D
evelo
pmen
t and
Man
agem
ent
93,05
9
5,888
3,2
75
2,589
104,8
11
11
3,283
Bioe
nerg
y Init
iative
s-
-
-
-
-
70
,582
Cost
of Se
lling O
il57
,752
-
-
-
57
,752
77
,168
Clim
ate Le
ader
ship
Plan
1,119
,232
63
-
-
1,119
,295
-Ca
rbon
Cap
ture a
nd S
torag
e30
,659
91
-
-
30
,750
15
9,938
1,308
,352
$
6,610
$
4,5
76$
2,589
$
1,322
,127
$
430,8
96$
(1) (2) (3)Le
gal S
ervic
es C
osts
are a
lloca
ted by
estim
ated c
osts
incur
red b
y eac
h pro
gram
.(4)
Busin
ess S
ervic
e Cos
ts, in
cludin
g cha
rges
for I
T su
ppor
t, veh
icles
, inter
nal a
udit s
ervic
es an
d othe
r ser
vices
are a
lloca
ted by
costs
in ce
rtain
prog
rams
.
Acco
mmod
ation
Cos
ts ar
e allo
cated
by bu
dgete
d Full
-Tim
e Equ
ivalen
t Emp
loyme
nt.Ex
pens
es -
Dire
ctly I
ncur
red a
s per
Stat
emen
t of O
pera
tions
.
Exp
ense
s - In
curre
d by
Oth
ers
2017
2016-17 Energy Annual Report 121

2016-17 Energy Annual Report122

ALBERTA ENERGY REGULATOR
FINANCIAL STATEMENTSFor the year ended March 31, 2017
Independent Auditor’s Report
Statement of Operations
Statement of Financial Position
Statement of Change in Net Debt
Statement of Cash Flows
Notes to Financial Statements
Schedules to Financial Statements
2016-17 Energy Annual Report 123
2016-17 Energy Annual Report124
Independent Auditor’s Report
To the Board of Directors of the Alberta Energy Regulator
Report on the Financial Statements
I have audited the accompanying financial statements of the Alberta Energy Regulator, which comprise the statement of financial position as at March 31, 2017, and the statements of operations, change in net debt and cash flows for the year then ended, and a summary of significant accounting policies and other explanatory information.
Management’s Responsibility for the Financial Statements
Management is responsible for the preparation and fair presentation of these financial statements in accordance with Canadian public sector accounting standards, and for such internal control as management determines is necessary to enable the preparation of financial statements that are free from material misstatement, whether due to fraud or error.
Auditor’s Responsibility
My responsibility is to express an opinion on these financial statements based on my audit. I conducted my audit in accordance with Canadian generally accepted auditing standards. Those standards require that I comply with ethical requirements and plan and perform the audit to obtain reasonable assurance about whether the financial statements are free from material misstatement.
An audit involves performing procedures to obtain audit evidence about the amounts and disclosures in the financial statements. The procedures selected depend on the auditor’s judgment, including the assessment of the risks of material misstatement of the financial statements, whether due to fraud or error. In making those risk assessments, the auditor considers internal control relevant to the entity’s preparation and fair presentation of the financial statements in order to design audit procedures that are appropriate in the circumstances, but not for the purpose of expressing an opinion on the effectiveness of the entity’s internal control. An audit also includes evaluating the appropriateness of accounting policies used and the reasonableness of accounting estimates made by management, as well as evaluating the overall presentation of the financial statements.
I believe that the audit evidence I have obtained is sufficient and appropriate to provide a basis for my audit opinion.
Opinion
In my opinion, the financial statements present fairly, in all material respects, the financial position of the Alberta Energy Regulator as at March 31, 2017, and the results of its operations, its remeasurement gains and losses, its changes in net debt, and its cash flows for the year then ended in accordance with Canadian public sector accounting standards.
May 11, 2017
Edmonton, Alberta
Original signed by Merwan N. Saher, FCPA, FCA Auditor General
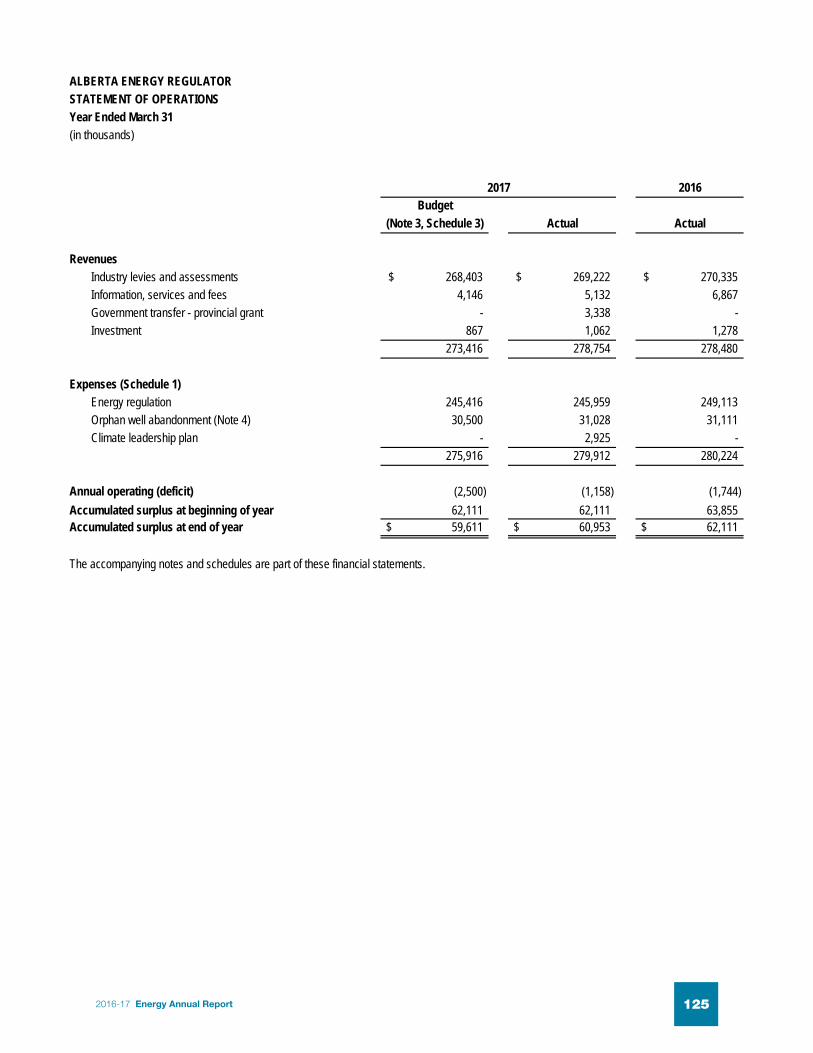
2016Budget
(Note 3, Schedule 3) Actual Actual
RevenuesIndustry levies and assessments 268,403$ 269,222$ 270,335$ Information, services and fees 4,146 5,132 6,867 Government transfer - provincial grant - 3,338 - Investment 867 1,062 1,278
273,416 278,754 278,480
Expenses (Schedule 1)Energy regulation 245,416 245,959 249,113 Orphan well abandonment (Note 4) 30,500 31,028 31,111 Climate leadership plan - 2,925 -
275,916 279,912 280,224
Annual operating (deficit) (2,500) (1,158) (1,744) Accumulated surplus at beginning of year 62,111 62,111 63,855 Accumulated surplus at end of year 59,611$ 60,953$ 62,111$
The accompanying notes and schedules are part of these financial statements.
2017
ALBERTA ENERGY REGULATORSTATEMENT OF OPERATIONS
(in thousands)Year Ended March 31
22016-17 Energy Annual Report 125

As at March 31
2017 2016Restated - Note 2 (h)
Cash and cash equivalents (Note 5) 32,975$ 24,851$ Accounts receivable (Note 6) 7,982 18,149 Pension assets (Note 12) 510 -
41,467 43,000
Accounts payable and accrued liabilities 17,302 16,643 Grant payable to Orphan Well Association 14,115 15,093 Unearned revenue (Note 9) 1,997 1,604 Deferred lease incentives (Note 10) 20,648 22,264 Pension obligations (Note 12) - 692
54,062 56,296 (12,595) (13,296)
Non-financial assetsTangible capital assets (Note 13) 62,426 64,430 Prepaid expenses and other assets 11,122 10,977
73,548 75,407
Accumulated surplus (Note 14) 60,953$ 62,111$
Contractual obligations (Note 16)
The accompanying notes and schedules are part of these financial statements.
Net debt
ALBERTA ENERGY REGULATORSTATEMENT OF FINANCIAL POSITION
Financial assets
Liabilities
(in thousands)
32016-17 Energy Annual Report126

2016Budget(Note 3) Actual Actual
Annual operating (deficit) (2,500)$ (1,158)$ (1,744)$
Acquisition of tangible capital assets (Note 13) (9,000) (12,109) (14,196) Amortization of tangible capital assets (Note 13) 11,500 14,037 12,645
76 332 Increase in prepaid expenses and other assets (145) (624) Decrease (increase) in net debt - 701 (3,587) Net debt at beginning of year (13,296) (13,296) (9,709) Net debt at end of year (13,296)$ (12,595)$ (13,296)$
The accompanying notes and schedules are part of these financial statements.
Loss on disposal and write-down of tangible capital assets
ALBERTA ENERGY REGULATORSTATEMENT OF CHANGE IN NET DEBTYear Ended March 31(in thousands)
2017
42016-17 Energy Annual Report 127

2017 2016
Operating transactionsAnnual operating (deficit) (1,158)$ (1,744)$ Non-cash items included in net operating results
Amortization of tangible capital assets (Note 13) 14,037 12,645 Loss on disposal and write-down of tangible capital assets 76 332 Change in pension obligations (1,202) (1,657) Amortization of deferred lease incentives (Note 10) (1,616) (1,522)
10,137 8,054 Decrease (increase) in accounts receivable 10,167 (5,904) (Increase) in prepaid expenses and other assets (145) (624) Increase (decrease) in accounts payable and accrued liabilities 659 (16,868) (Decrease) increase in grant payable to Orphan Well Association (978) 38 Increase (decrease) in unearned revenue 393 (452) Additions to deferred lease incentives (Note 10) - 763 Cash provided by (applied to) operating transactions 20,233 (14,993)
Capital transactionsAcquisition of tangible capital assets (Note 13) (12,109) (14,196) Cash applied to capital transactions (12,109) (14,196)
Financing transactionsProceeds from line of credit 16,138 - Debt repayment (16,138) - Cash applied to financing transactions - -
Increase (decrease) in cash and cash equivalents 8,124 (29,189) Cash and cash equivalents at beginning of year 24,851 54,040 Cash and cash equivalents at end of year 32,975$ 24,851$
The accompanying notes and schedules are part of these financial statements.
STATEMENT OF CASH FLOWS
(in thousands)Year Ended March 31
ALBERTA ENERGY REGULATOR
52016-17 Energy Annual Report128

ALBERTA ENERGY REGULATORNOTES TO THE FINANCIAL STATEMENTSMarch 31, 2017
Note 1 Authority and purpose
Note 2 Summary of significant accounting policies and reporting practices
(a) Revenues
Government transfers
(b) Expenses
(c) Valuation of financial assets and liabilitiesThe AER's financial assets and liabilities are generally measured as follows:
Financial Statement Component MeasurementCash and cash equivalents CostAccounts receivable Lower of cost or net recoverable valueAccounts payable and accrued liabilities CostGrant payable to the Orphan Well Association Cost
(d) Financial assets
Cash and cash equivalents
Accounts receivable
Pension
(in thousands)
Expenses are reported on an accrual basis. The cost of all goods consumed and services received during the year is expensed.
These financial statements are prepared in accordance with Canadian Public Sector Accounting Standards (PSAS).
The Alberta Energy Regulator (AER) is an independent and quasi-judicial organization of the Government of Alberta. The AER operates under the Responsible Energy Development Act. The AER's mandate provides for the safe, efficient, orderly, and environmentally responsible development of hydrocarbon resources over their entire life cycle. This includes allocating and conserving water resources, managing public lands, and protecting the environment while providing economic benefits for all Albertans.
The AER has not designated any financial assets or liabilities in the fair value category, has no significant foreign currency transactions and does not hold any derivative contracts. The AER has no significant remeasurement gains or losses and consequently has not presented a statement of remeasurement gains and losses.
Financial assets are AER's financial claims on external organizations and individuals at the year end.
All revenues are reported on the accrual basis of accounting. Cash received for which services have not been provided by year end is recognized as unearned revenue.
Transfers from the Government of Alberta, without stipulations for the use of the transfer, are recognized as revenue when the transfer is authorized and the AER is eligible to receive the funds.
Accrued benefit obligations are actuarially determined using the projected benefit method prorated on length of service and management's best estimate of expected plan investment performance, projected employees' compensation levels and retirement age of employees.
Cash is comprised of cash on hand and demand deposits.
Accounts receivable are recognized at the lower of cost or net recoverable value. A valuation allowance is recognized when recovery is uncertain.
62016-17 Energy Annual Report 129

ALBERTA ENERGY REGULATORNOTES TO THE FINANCIAL STATEMENTSMarch 31, 2017(in thousands)
Note 2 Summary of significant accounting policies and reporting practices (continued)(d) Financial assets (continued)
Pension (continued)
(e) Liabilities
Deferred lease incentives
Liability for contaminated sites
- an environmental standard exists; - contamination exceeds the environmental standard; - the AER is directly responsible or accepts responsibility; - it is expected that future economic benefits will be given up; and- a reasonable estimate of the amount can be made.
(f) Non-financial assets
- are normally employed to deliver AER services;- may be consumed in the normal course of operations; and- are not for sale in the normal course of operations.
Non-financial assets of the AER are limited to tangible capital assets and prepaid expenses and other assets.
Tangible capital assets
Past service cost arising from plan amendments is accounted for in the period of the plan amendments.
Actuarial gains and losses are amortized over the average remaining service period of the active employees, which is 10.5 years.
Non-financial assets are acquired, constructed or developed assets that do not normally provide resources to discharge existing liabilities, but instead:
Contaminated sites are a result of contamination of a chemical, organic or radioactive material or live organism that exceeds an environmental standard, being introduced into soil, water or sediment. The liability is recognized net of any expected recoveries. A liability for remediation of contaminated sites normally results from an operation that is no longer in productive use and is recognized when all of the following criteria are met:
Liabilities represent present obligations of the AER to external organizations and individuals arising from transactions or events occurring before the year end. They are recognized when there is an appropriate basis of measurement and management can reasonably estimate the amount.
Deferred lease incentives, consisting of leasehold improvement costs, reduced rent benefits and rent-free periods, are amortized on a straight-line basis over the term of the lease.
Defined contribution plan accounting is applied to the Government of Alberta multi-employer defined benefit pension plans as the AER has insufficient information to apply defined benefit plan accounting. Accordingly, pension expense is comprised of employer contributions to the plans that are required for its employees during the year, which are calculated based on actuarially pre-determined amounts that are expected to provide the plans' future benefits.
Accrued benefit obligations and pension benefit cost for the year are calculated using the expected rate of return on plan assets as its discount rate. The expected return on plan assets is determined using market values of plan assets.
Liabilities include all financial claims payable by the AER at fiscal year end.
Tangible capital assets are recognized at cost, which includes amounts that are directly related to the acquisition, design, construction, development, improvement or betterment of the assets and are amortized over their estimated useful lives using the following methods:
72016-17 Energy Annual Report130

ALBERTA ENERGY REGULATORNOTES TO THE FINANCIAL STATEMENTSMarch 31, 2017(in thousands)
Note 2 Summary of significant accounting policies and reporting practices (continued)(f) Non-financial assets (continued)
Tangible capital assets (continued)Leasehold improvements Straight line Term of the leaseFurniture and equipment Straight line 5 - 12 yearsComputer hardware Straight line 4 yearsComputer software - purchased Straight line 4 yearsComputer software - developed Declining balance 5 years
Amortization is only charged if the tangible capital asset is put into service.
Prepaid expense
(g) Measurement uncertainty
(h) Change in accounting policy
(i) Future accounting changes
Measurement uncertainty exists when there is a variance between the recognized or disclosed amount and another reasonably possible amount. The amounts recognized for amortization of tangible capital assets are based on estimates of the useful life of the related assets. Accrued defined benefit obligations are subject to measurement uncertainty due to the use of actuarial assumptions. The resulting estimates are within reasonable limits of materiality and are in accordance with the AER's significant accounting policies.
Work-in-progress, which includes developed computer software and leasehold improvements, is not amortized until a project is complete and the asset is put into service.
Tangible capital assets are written down when conditions indicate that they no longer contribute to the AER's ability to provide goods and services, or when the value of future economic benefits associated with the tangible capital assets is less than their net book value. The net write-downs are accounted for as expense in the Statement of Operations.
Security depositsDuring the year, the AER changed its accounting policy with respect to the disclosure of security deposits in the AER Financial Statements. The AER now discloses security held in the form of cash in the notes to the financial statements only. In prior years, the AER included these security deposits on the Statement of Financial Position as financial assets and liabilities, explaining in the notes that these deposits are held on behalf of licensees. This change aligns the accounting treatment of security deposits with other entities within the Government of Alberta.
This change in accounting policy has been applied retroactively with restatement of the prior period's Statement of Financial Position. The effect of adopting this change decreases AER's financial assets and liabilities on the March 31, 2016 Statement of Financial Position in the amount of security deposits of $138,125.
Prepaid expense is recognized at cost and amortized based on the terms of the agreements.
PS 2200 Related Party Disclosure and PS 3420 Inter-entity Transactions (effective April 1, 2017) PS 2200 defines a related party and establishes disclosures required for related party transactions; PS 3420 establishes standards on how to account for and report transactions between public sector entities that comprise a government's reporting entity from both a provider and recipient perspective.
The Public Sector Accounting Board has issued the following accounting standards:
82016-17 Energy Annual Report 131

ALBERTA ENERGY REGULATORNOTES TO THE FINANCIAL STATEMENTSMarch 31, 2017(in thousands)
Note 2 Summary of significant accounting policies and reporting practices (continued)(i) Future accounting changes (continued)
Note 3 Budget
Note 4 Orphan well abandonment
Note 5 Cash and cash equivalents
Note 6 Accounts Receivable2016
Accounts receivable 10,028$ (2,046)$ 7,982$ 18,149$
Note 7 Financial instruments
The AER has exposure to the following risks from its use of financial instruments: (a) Liquidity risk
Net realizable value
PS 3210 Assets, PS 3320 Contingent Assets and PS 3380 Contractual Rights (effective April 1, 2017) PS 3210 provides guidance for applying the definition of assets set out in Financial Statement Concepts, PS 1000, and establishes disclosure standards for assets; PS 3320 defines and establishes disclosure standards on contingent assets; PS 3380 defines and establishes disclosure standards on contractual rights.
The AER has delegated the authority to manage the abandonment and reclamation of wells, facilities and pipelines that are licensedto defunct licensees to the Alberta Oil and Gas Orphan Abandonment and Reclamation Association (Orphan Well Association). The AER grants all of its orphan well abandonment revenues (levy and application fees) to the Orphan Well Association. During the year ended March 31, 2017, the AER collected $30,448 (2016 - $30,167) in levies and $580 (2016 - $944) in application fees.
The AER has the following financial instruments: accounts receivable, accounts payable and accrued liabilities and grant payable to the Orphan Well Association.
Liquidity risk is the risk that the AER will encounter difficulty in meeting obligations associated with financial liabilities. The AER does not consider this to be a significant risk as the AER collects funding at the beginning of the year to meet all obligations that arise during the year. In addition, the available credit facility provides financial flexibility to allow the AER to meet its obligations if funding cannot be collected on a timely basis.
PS 3430 Restructuring Transactions (effective April 1, 2018) This standard provides guidance on how to account for and report restructuring transactions by both transferors and recipients of assets and/or liabilities, together with related programs or operating responsibilities.
Cash and cash equivalents are held in an account with a Canadian chartered bank and earn interest calculated based on the average monthly cash balance. The funds are available to be withdrawn upon request. During the year ended March 31, 2017, the AER earned interest at the rate of 1.0% (2016 - 1.1%).
The Budget is based on the AER Business Plan for the year ended March 31, 2017. The Budget and budget adjustments have been approved by the Government of Alberta.
Management is currently assessing the impact of these standards on the financial statements.
2017
Gross amount
Allowancefor doubtful
accountsNet realizable
value
92016-17 Energy Annual Report132

ALBERTA ENERGY REGULATORNOTES TO THE FINANCIAL STATEMENTSMarch 31, 2017(in thousands)
Note 7 Financial instruments (continued)(b) Credit risk
Note 8 Revolving line of credit
Note 9 Unearned revenue2017 2016
Balance at beginning of year 1,604$ 2,056$Received during year 1,143 395Less amounts recognized as revenue (750) (847)
1,997$ 1,604$
Note 10 Deferred lease incentives
2016
Balance at beginning of year 17,899$ 4,365$ 22,264$ 23,023$- - - 763
(1,252) (364) (1,616) (1,522)16,647$ 4,001$ 20,648$ 22,264$
Note 11 Liability for contaminated sites
Amortization
The AER has entered into various lease agreements which provide for lease incentives comprised of reduced rent benefits, rent-free periods and leasehold improvement costs. These amounts are included in deferred lease incentives and are amortized on a straight line basis over the term of the lease.
Additions during the year
Leaseholdimprovement
costs Total
Balance at end of year
Total
Balance at end of year
2017
For the year ended March 31, 2017, interest expense on the revolving line of credit was $13 (2016 - $nil) and is included in the Statement of Operations.
During 2017, the AER had an unsecured $50,000 revolving line of credit. Amounts borrowed can only be applied to general corporate purposes and exclude the funding of operating deficits and/or capital expenditures. Bank advances on the line of credit are payable on demand and bear interest at prime less 0.5%. As at March 31, 2017, the outstanding balance for the revolving line ofcredit was $nil (2016 -$nil).
The AER is exposed to credit risk from potential non-payment of accounts receivable. Accounts receivable include balances due from operators in the oil and gas industry and are subject to normal industry credit risk. The AER regularly monitors the financial status of operators and assesses the collectability of accounts receivable. The AER's maximum exposure to credit risk is limited to the carrying amount of accounts receivable at the reporting date and presented in the Statement of Financial Position. The AER established a valuation allowance that corresponds to the specific credit risk of operators, historical trends and economic circumstances.
Reducedrent benefits and rent-free
periods
As at March 31, 2017, the AER is not responsible, nor has it accepted responsibility, for performing remediation work at contaminated sites. As at March 31, 2017, the AER's liability for contaminated sites was $nil (2016 - $nil).
102016-17 Energy Annual Report 133

ALBERTA ENERGY REGULATORNOTES TO THE FINANCIAL STATEMENTSMarch 31, 2017(in thousands)
Note 12 Pension
Discount rate 4.6% 4.7%
Long-term inflation rate 2.0% 2.0%
2017 2016Discount rate 4.7% 4.9%Expected rate of return on plan assets 4.7% 4.9%
Rate of compensation increase0% for 2 years,
3.5%thereafter
0% for 1 year,3.5%
thereafter
Market value of plan assets 56,633$ 47,853$Accrued benefit obligations 58,200 54,639Plan (deficit) (1,567) (6,786)Unamortized actuarial loss 2,077 6,094Pension assets (obligations) 510$ (692)$
The pension benefit costs for the year include the following components:2017 2016
Current period benefit cost 4,302$ 4,375$Interest cost 2,690 2,573Expected return on plan assets (2,358) (2,330)Amortization of actuarial losses 861 436
5,495$ 5,054$
0% for 3 years,3.5%
thereafter
March 31, 2016Accrued benefit obligations
Pension plan assets are valued at market values. During the year ended March 31, 2017 the weighted average actual return on plan assets was 8.5% (-3.4% in 2016).
Rate of compensation increase
March 31, 2017
The funded status and amounts recognized in the Statement of Financial Position are as follows:
March 31, 2017 March 31, 2016
0% for 2 years,3.5%
thereafter
The AER participates in the Government of Alberta's multi-employer pension plans: Management Employees Pension Plan, Public Service Pension Plan and Supplementary Retirement Plan for Public Service Managers. For the year ended March 31, 2017, the expense for these pension plans is equal to the contribution of $17,766 (2016 - $18,026). The AER is not responsible for future funding of the plan deficit other than through contribution increases.
In addition, the AER maintains its own defined benefit Senior Employees Pension Plan (SEPP) and two supplementary pension plans to compensate senior staff who do not participate in the government management pension plans. Retirement benefits are based on each employee's years of service and remuneration.
The effective date of the most recent actuarial funding valuation for SEPP was December 31, 2014. The accrued benefit obligation as at March 31, 2017 is based on the extrapolation of the results of this valuation. The effective date of the next required funding valuation for SEPP is December 31, 2017.
Significant weighted average actuarial and economic assumptions used to value accrued benefit obligations and pension benefit costs are as follows:
Pension benefit costs for the year
112016-17 Energy Annual Report134

ALBERTA ENERGY REGULATORNOTES TO THE FINANCIAL STATEMENTSMarch 31, 2017(in thousands)
Note 12 Pension (continued)
Additional information about the defined benefit pension plans is as follows:2017 2016
AER contribution 6,697$ 6,711$Employees' contribution 840 861Benefits paid 3,001 3,216
48.8% 47.9%36.0% 37.7%15.2% 14.4%
100.0% 100.0%
Note 13 Tangible capital assets2016
Land Leasehold
improvements Furniture and
equipment
Computer hardware and
software Total Total
Estimated useful life Indefinite Term of the
lease 5-12 years 4-5 years
Historical costBeginning of year 282$ 38,707$ 15,249$ 126,868$ 181,106$ 176,490$ Additions - 937 802 10,370 12,109 14,196
- (2) (1,241) (13,092) (14,335) (9,580) 282 39,642 14,810 124,146 178,880 181,106
Accumulated amortizationBeginning of year -$ 9,920$ 8,804$ 97,952$ 116,676$ 113,279$ Amortization expense - 2,495 972 10,570 14,037 12,645
- (2) (1,240) (13,017) (14,259) (9,248) - 12,413 8,536 95,505 116,454 116,676
282$ 27,229$ 6,274$ 28,641$ 62,426$
282$ 28,787$ 6,445$ 28,916$ 64,430$
Other
Net book value at March 31, 2017
Historical cost includes work-in-progress at March 31, 2017 totaling $4,659 (March 31, 2016 - $3,767) comprised of: computer hardware and software $4,617 (March 31, 2016 - $3,767) and leasehold improvements $42 (March 31, 2016 - $nil).
2017
Disposals, including write-downs
Net book value at March 31, 2016
The asset allocation of the defined benefit pension plans' investments is as follows:
March 31, 2016March 31, 2017
Effect of disposals, including write-downs
Debt securitiesEquity securities
122016-17 Energy Annual Report 135

ALBERTA ENERGY REGULATORNOTES TO THE FINANCIAL STATEMENTSMarch 31, 2017(in thousands)
Note 14 Accumulated surplus
2016
Accumulated Accumulatedsurplus surplus
Balance at beginning of year 46,531$ 15,580$ 62,111$ 63,855$Annual operating (deficit) - (1,158) (1,158) (1,744)Net investment in capital assets (752) 752 - -
45,779$ 15,174$ 60,953$ 62,111$
(a)
Note 15 Contingent liabilities
Note 16 Contractual obligations
30,764$20,69115,23012,68012,918
Thereafter 97,179189,462$
Note 17 Assets under administration
2022
Estimated payment requirements for obligations under operating leases and contracts for each of the next five years and thereafter are as follows:
The AER administers security deposit programs in accordance with specified acts and regulations. Security deposits are held on behalf of depositors with no power of appropriation and therefore are not reported in these financial statements. The AER does not have any financial risk associated with security collected. Security, along with any interest earned, will be returned to the depositors upon meeting specified refund criteria.
Unrestrictednet assets
Investments in tangible capital
assets (a)
The accumulated surplus of the AER is calculated as the sum of the net debt of the AER and its non-financial assets. The accumulated surplus represents the net assets of the AER. Accumulated surplus is comprised of the following:
2017
Excludes leasehold improvement costs received by the AER as a lease incentive.
2019
2021
Contractual obligations are obligations of the AER to others that will become liabilities in the future when the terms of those contracts or agreements are met.
2020
2018
The AER, in the conduct of its normal activities, is a defendant in a number of legal proceedings. While the ultimate outcome and liability of these proceedings cannot be reasonably determined at this time, the AER believes that any settlement will not have a material adverse effect on the financial position or the results of operations of the AER. Based on legal advice, management has concluded that none of the claims meet the criteria for recognizing an accrued liability under PSAS.
Balance at end of year
132016-17 Energy Annual Report136
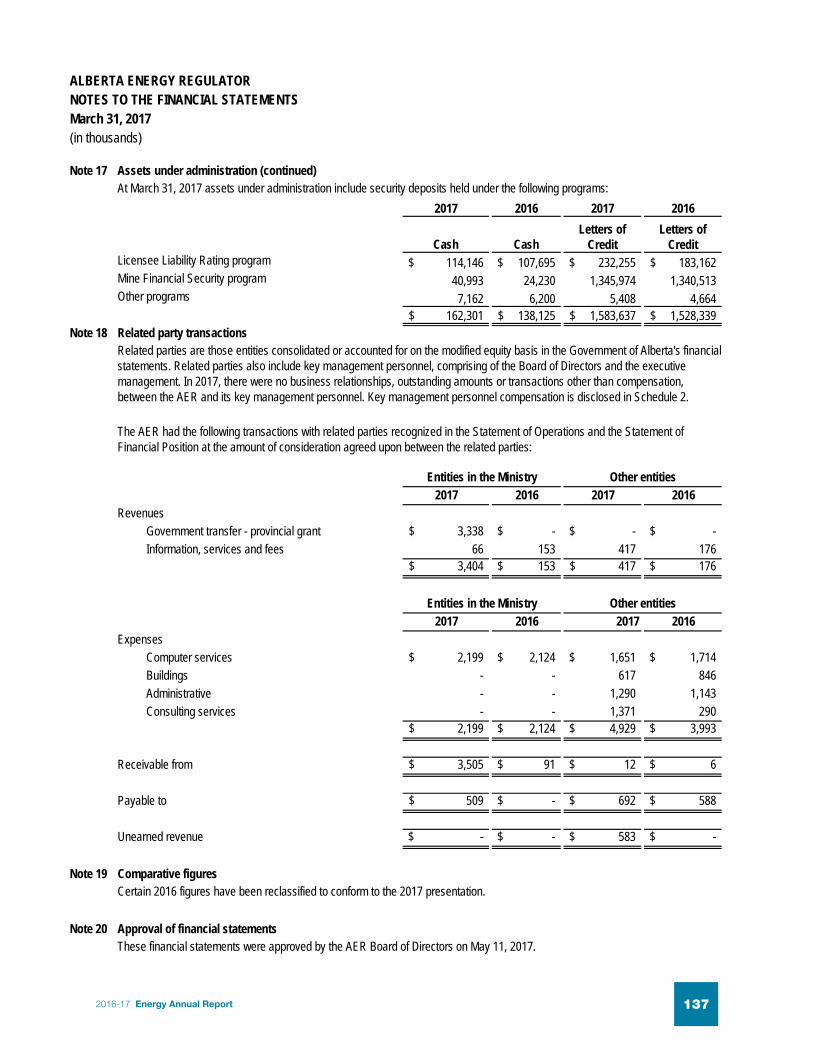
ALBERTA ENERGY REGULATORNOTES TO THE FINANCIAL STATEMENTSMarch 31, 2017(in thousands)
Note 17 Assets under administration (continued)
2017 2016 2017 2016
Cash Cash114,146$ 107,695$ 232,255$ 183,162$40,993 24,230 1,345,974 1,340,5137,162 6,200 5,408 4,664
162,301$ 138,125$ 1,583,637$ 1,528,339$Note 18 Related party transactions
2017 2016 2017 2016Revenues
Government transfer - provincial grant 3,338$ -$ -$ -$Information, services and fees 66 153 417 176
3,404$ 153$ 417$ 176$
2017 2016 2017 2016Expenses
Computer services 2,199$ 2,124$ 1,651$ 1,714$Buildings - - 617 846Administrative - - 1,290 1,143Consulting services - - 1,371 290
2,199$ 2,124$ 4,929$ 3,993$
Receivable from 3,505$ 91$ 12$ 6$
Payable to 509$ -$ 692$ 588$
Unearned revenue -$ -$ 583$ -$
Note 19 Comparative figures
Note 20 Approval of financial statements
Letters of Credit
Letters of Credit
Mine Financial Security programOther programs
Related parties are those entities consolidated or accounted for on the modified equity basis in the Government of Alberta's financialstatements. Related parties also include key management personnel, comprising of the Board of Directors and the executive management. In 2017, there were no business relationships, outstanding amounts or transactions other than compensation, between the AER and its key management personnel. Key management personnel compensation is disclosed in Schedule 2.
These financial statements were approved by the AER Board of Directors on May 11, 2017.
The AER had the following transactions with related parties recognized in the Statement of Operations and the Statement of Financial Position at the amount of consideration agreed upon between the related parties:
Entities in the Ministry
At March 31, 2017 assets under administration include security deposits held under the following programs:
Certain 2016 figures have been reclassified to conform to the 2017 presentation.
Other entities
Other entitiesEntities in the Ministry
Licensee Liability Rating program
142016-17 Energy Annual Report 137

ALBERTA ENERGY REGULATOR Schedule 1SCHEDULE TO THE FINANCIAL STATEMENTSExpenses - Detailed by ObjectYear Ended March 31, 2017(in thousands)
2017 2016
Salaries, wages and employee benefits 177,014$ 180,705$ Orphan well abandonment grant 31,028 31,111 Buildings 16,936 15,198 Computer services 16,742 15,719 Amortization of tangible capital assets 14,037 12,645 Consulting services 13,731 13,692 Administrative 5,320 4,657 Travel and transportation 4,115 4,603 Equipment rent and maintenance 884 881 Loss on disposal and write-down of tangible capital assets 76 332 Abandonment and enforcement 29 681
279,912$ 280,224$
152016-17 Energy Annual Report138

ALBERTA ENERGY REGULATOR Schedule 2
(in thousands)
2016Other
Base Other cash non-cashPosition salary (a) benefits(b) benefits (c) Total (d) Total
Board of DirectorsChairman 222$ -$ 11$ 233$ 276$ Board Director(e) 106 - 4 110 77 Board Director(f) 52 - 2 54 117 Board Director(g) 47 - 3 50 - Board Director(g) 45 - 3 48 - Board Director(g) 45 - 3 48 - Board Director(h) 24 - 2 26 119 Board Director(h) 25 - - 25 118 Board Director(h) 22 - 2 24 106 Board Director(i) - - - - 67 Board Director(j) - - - - 28
Executives527 29 139 695 725 209 18 59 286 287 274 82 75 431 440 274 83 103 460 453 316 89 116 521 524 274 95 74 443 451 274 87 37 398 386
(a)
(b)
(d)(e)(f)(g)(h)(i)(j)(k)
Chief Hearing CommissionerExecutive Vice-President, Corporate Services Executive Vice-President and General Counsel (l)
Executive Vice-President, Operations(l)
Executive Vice-President, Strategy & Regulatory(l)Executive Vice-President, Stakeholder & Government Engagement
SCHEDULE TO THE FINANCIAL STATEMENTSSalaries and Benefits DisclosureYear Ended March 31, 2017
2017
President and Chief Executive Officer (k)
Automobile provided, no dollar amount included in other non-cash benefits.The incumbent left the position effective June 16, 2015.
(c)
Includes retainers and per diems for Board Directors. Members of the Board of Directors do not participate in the AER's pension plans. Includes pensionable base pay for Executives.
Contributions to all benefits as applicable including employer's share of Employment Insurance, Canada Pension Plan, Alberta and AER pension plans, health benefits or payments made for professional memberships and tuition fees.
Payments in lieu of vacation and health benefits, vehicle allowances, and short term incentive payments for Executive Vice-Presidents.
Salaries and benefits for the Board of Directors are presented in descending order.The incumbent held the position effective August 1, 2015.The incumbent left the position effective September 30, 2016.The incumbent held the position effective October 1, 2016.The incumbent left the position effective June 16, 2016.The incumbent left the position effective September 30, 2015.
162016-17 Energy Annual Report 139

ALBERTA ENERGY REGULATOR Schedule 2 (continued)
(in thousands)
(l)
2016
Current service Prior service and other Position cost costs Total TotalExecutive Vice-President and General Counsel 43$ 10$ 53$ 47$ Executive Vice-President, Operations 57 4 61 56 Executive Vice-President, Strategy & Regulatory - 24 24 27
Accrued obligation Changes in accrued Accrued obligation Position April 1, 2016 obligation March 31, 2017 2016Executive Vice-President and General Counsel 475$ 50$ 525$ 475$ Executive Vice-President, Operations 204 66 270 204 Executive Vice-President, Strategy & Regulatory 1,175 5 1,180 1,175
SCHEDULE TO THE FINANCIAL STATEMENTSSalaries and Benefits DisclosureYear Ended March 31, 2017
2017
Under the terms of the AER's defined benefit SEPP and two supplementary retirement plans (SRP), employees may receive supplemental retirement payments. Retirement arrangement costs as detailed below are not cash payments in the period but are the period expense for rights to future compensation. Costs shown reflect the total estimated cost to provide annual pension income over an actuarially determined post-employment period. The SEPP and SRP provide future pension benefits to participants based on years of service and remuneration. The cost of these benefits is actuarially determined using the projected benefit method pro-rated on service, a market interest rate, and management's best estimate of expected costs and the period of benefit coverage. Net actuarial gains and losses of the benefit obligations are amortized over the average remaining service life of the employee group. Current service cost is the actuarial present value of the benefits earned in the fiscal year. Prior service and other costs include amortization of past service costs, amortization of actuarial gains and losses, and interest accruing on the actuarial liability. The costs detailed below are only for those employees included in Schedule 2 who participate in the SEPP and SRP maintained by the AER to compensate senior staff who do not participate in the government management pension plans.
172016-17 Energy Annual Report140

ALBERTA ENERGY REGULATOR Schedule 3
Adjustments (a) Actual
RevenuesIndustry levies and assessments 268,403$ -$ 268,403$ 269,222$ Information, services and fees 4,146 - 4,146 5,132 Government transfer - provincial grant - 3,624 3,624 3,338 Investment 867 - 867 1,062
273,416 3,624 277,040 278,754
ExpensesEnergy regulation 245,416 - 245,416 245,959 Orphan well abandonment 30,500 - 30,500 31,028 Climate leadership plan - 3,624 3,624 2,925
275,916 3,624 279,540 279,912 Annual operating (deficit) (2,500) - (2,500) (1,158)
CapitalCapital investment 9,000 - 9,000 12,109 Less: Amortization (11,500) - (11,500) (14,037) Loss on disposal and write-down of tangible capital assets - - (76)
Net capital investment (2,500) - (2,500) (2,004)
-$ -$ -$ 846$
(a)
SCHEDULE TO THE FINANCIAL STATEMENTSActual Results Compared with Budget
(in thousands)Year Ended March 31, 2017
Adjustments are for grant revenues and associated expenditures received from the Government of Alberta to implement a component of the Climate leadership plan.
Budget(Note 3)
Adjustedbudget
182016-17 Energy Annual Report 141

2016-17 Energy Annual Report142

ALBERTA UTILITIES COMMISSION
FINANCIAL STATEMENTSFor the year ended March 31, 2017
Independent Auditor’s Report
Statement of Operations
Statement of Financial Position
Statement of Change in Net Financial Assets
Statement of Cash Flows
Notes to Financial Statements
Schedules to Financial Statements
2016-17 Energy Annual Report 143

2016-17 Energy Annual Report144
Independent Auditor’s Report
To the Members of the Alberta Utilities Commission
Report on the Financial Statements
I have audited the accompanying financial statements of the Alberta Utilities Commission, which comprise the statement of financial position as at March 31, 2017, and the statements of operations, change in net financial assets and cash flows for the year then ended, and a summary of significant accounting policies and other explanatory information.
Management’s Responsibility for the Financial Statements
Management is responsible for the preparation and fair presentation of these financial statements in accordance with Canadian public sector accounting standards, and for such internal control as management determines is necessary to enable the preparation of financial statements that are free from material misstatement, whether due to fraud or error.
Auditor’s Responsibility
My responsibility is to express an opinion on these financial statements based on my audit. I conducted my audit in accordance with Canadian generally accepted auditing standards. Those standards require that I comply with ethical requirements and plan and perform the audit to obtain reasonable assurance about whether the financial statements are free from material misstatement.
An audit involves performing procedures to obtain audit evidence about the amounts and disclosures in the financial statements. The procedures selected depend on the auditor’s judgment, including the assessment of the risks of material misstatement of the financial statements, whether due to fraud or error. In making those risk assessments, the auditor considers internal control relevant to the entity’s preparation and fair presentation of the financial statements in order to design audit procedures that are appropriate in the circumstances, but not for the purpose of expressing an opinion on the effectiveness of the entity’s internal control. An audit also includes evaluating the appropriateness of accounting policies used and the reasonableness of accounting estimates made by management, as well as evaluating the overall presentation of the financial statements.
I believe that the audit evidence I have obtained is sufficient and appropriate to provide a basis for my audit opinion.
Opinion
In my opinion, the financial statements present fairly, in all material respects, the financial position of the Alberta Utilities Commission as at March 31, 2017, and the results of its operations, its remeasurement gains and losses, its changes in net financial assets, and its cash flows for the year then ended in accordance with Canadian public sector accounting standards.
May 2, 2017
Edmonton, Alberta
Original signed by Merwan N. Saher, FCPA, FCA Auditor General
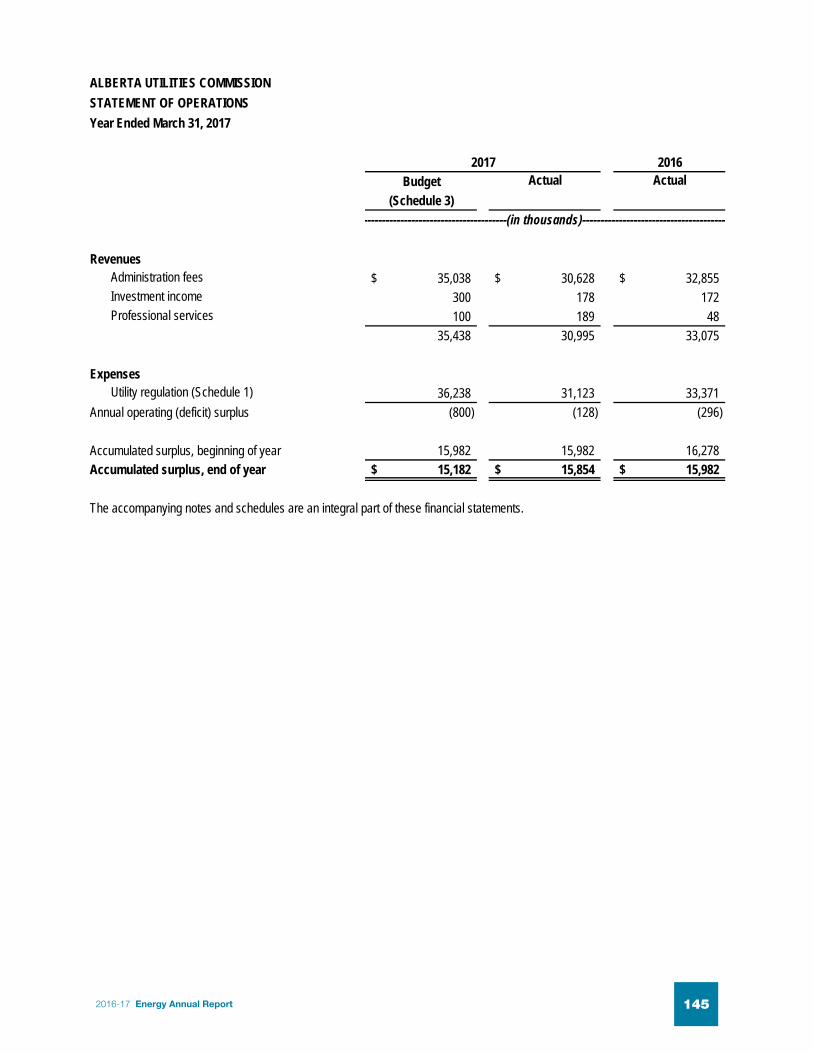
2
2016Budget
(Schedule 3)
RevenuesAdministration fees 35,038$ 30,628$ 32,855$Investment income 300 178 172Professional services 100 189 48
35,438 30,995 33,075
ExpensesUtility regulation (Schedule 1) 36,238 31,123 33,371
Annual operating (deficit) surplus (800) (128) (296)
Accumulated surplus, beginning of year 15,982 15,982 16,278Accumulated surplus, end of year 15,182$ 15,854$ 15,982$
The accompanying notes and schedules are an integral part of these financial statements.
---------------------------------------(in thousands)---------------------------------------
2017
ALBERTA UTILITIES COMMISSIONSTATEMENT OF OPERATIONSYear Ended March 31, 2017
Actual Actual
2016-17 Energy Annual Report 145

3
2017 2016
Cash and cash equivalents (Note 4) 11,478$ 11,873$Accounts receivable 255 300Pension asset (Note 6) 408 -
12,141 12,173
Accounts payable and accrued liabilities 2,876 3,071Deferred lease incentive 299 59Accrued pension liability (Note 6) - 765
3,175 3,895
Net Financial Assets 8,966 8,278
Non-Financial AssetsCapital assets (Note 7) 5,752 6,349Prepaid expenses 1,136 1,355
6,888 7,704
Net AssetsAccumulated surplus (Note 8) 15,854$ 15,982$
Contractual obligations (Note 9)
The accompanying notes and schedules are an integral part of these financial statements.
Liabilities
ALBERTA UTILITIES COMMISSIONSTATEMENT OF FINANCIAL POSITION
Financial Assets
As at March 31, 2017
-------------------------(in thousands)-------------------------
2016-17 Energy Annual Report146

4
ALBERTA UTILITIES COMMISSIONSTATEMENT OF CHANGE IN NET FINANCIAL ASSETSYear Ended March 31, 2017
2016Budget Actual Actual
(Schedule 3)-----------------------------------(in thousands)-----------------------------------
Annual operating deficit (800)$ (128)$ (296)$
Acquisition of capital assets (1,000) (921) (746)Amortization of capital assets 1,800 1,516 1,615Loss on disposal of capital assets 2 36Proceeds on disposal of capital assets - 2
Change in prepaid expenses 219 (179)Increase in net financial assets in the year - 688 432Net financial assets, beginning of year 8,278 8,278 7,846Net financial assets, end of year 8,278$ 8,966$ 8,278$
The accompanying notes and schedules are an integral part of these financial statements.
2017
2016-17 Energy Annual Report 147

5
2017 2016
Operating transactionsAnnual operating deficit (128)$ (296)$Non-cash items
Amortization of capital assets 1,516 1,615Pension expense 875 827Loss on disposal of capital assets 2 36
Decrease (increase) in accounts receivable 45 (126)Decrease (increase) in prepaid expenses 219 (179)Decrease in accounts payable and accrued liabilities (195) (197)Cash provided by operating transactions 2,334 1,680
Capital transactionsAcquisition of capital assets (921) (746)Proceeds on disposal of capital assets - 2Cash applied to capital transactions (921) (744)
Financing transactionsPension obligations funded (2,048) (827)Lease incentive received 240 19Cash applied to financing transactions (1,808) (808)
(Decrease) increase in cash and cash equivalents (395) 128Cash and cash equivalents, beginning of year 11,873 11,745Cash and cash equivalents, end of year 11,478$ 11,873$
The accompanying notes and schedules are an integral part of these financial statements.
ALBERTA UTILITIES COMMISSIONSTATEMENT OF CASH FLOWSYear Ended March 31, 2017
------------------------(in thousands)-------------------------
2016-17 Energy Annual Report148

6
ALBERTA UTILITIES COMMISSIONNOTES TO THE FINANCIAL STATEMENTS
(in thousands of dollars)
Note 1 Authority
Note 2 Summary of significant accounting policies and reporting practices
Basis of financial reporting
Revenues
Expenses
Foreign currency translation
Valuation of financial assets and liabilities
Financial Statement Component MeasurementCash and cash equivalents CostAccounts receivablePension asset Cost
Cost
March 31, 2017
The Alberta Utilities Commission (AUC) operates under authority of the Alberta Utilities Commission Act, Chapter A-37.2 . The AUC also exercises powers and authorities under a number of other statutes. The AUC is an independent, quasi-judicial agency of the government of Alberta that ensures the delivery of Alberta’s utility services takes place in a manner that is fair, responsible, and in the public interest. The AUC regulates investor owned electric, natural gas and water utilities, and certain municipally owned electricity utilities to ensure customers receive safe and reliable service at just and reasonable rates. The AUC is responsible for making timely decisions on the need, siting, construction, alteration, operation and decommissioning of natural gas and certain electricity transmission facilities. The AUC also regulates power plants in a similar fashion except the need for new power plants is determined by market forces. The AUC develops and amends rules that support the orderly operation of the retail natural gas and electricity markets, and adjudicates on market and operational rule contraventions that the Market Surveillance Administrator may bring before the AUC.
These financial statements are prepared in accordance with Canadian Public Sector Accounting Standards (PSAS). Significant accounting policies are as follows:
All revenues are reported on the accrual basis of accounting.
All expenses are reported on the accrual basis of accounting. The cost of all goods consumed and services received during the year is expensed. Contributed services are not recognized in the Statement of Operations but are disclosed in Note 10 of the financial statements.
Foreign currency transactions are translated at the exchange rate prevailing at the date of transaction. Monetary liabilities denominated in foreign currencies are translated to Canadian dollars at the exchange rate prevailing at fiscal year-end.
The AUC's financial assets and liabilities are generally measured as follows:
Lower of cost or net recoverable value
Accounts payable and accrued liabilities
The AUC does not carry any financial assets or liabilities at fair value and has no derivatives or unsettled exchange gains or losses, therefore the statement of remeasurement gains or losses is not included in these financial statements.
2016-17 Energy Annual Report 149

7
ALBERTA UTILITIES COMMISSIONNOTES TO THE FINANCIAL STATEMENTS
(in thousands of dollars)March 31, 2017
Note 2 Summary of significant accounting policies and reporting practices (continued)
Financial assetsFinancial assets are AUC's financial claims on external organizations and individuals at the year end.
Cash and cash equivalentsCash comprises cash on hand and demand deposits.
Accounts receivable
Pension asset
Liabilities
Pension
Deferred lease incentiveLease incentive benefits are amortized on a straight line basis over the term of lease as a reduction to rental expense.
Non-financial assets
Capital assets
Computer hardware and software Four to seven years Furniture and equipment Four to forty years Leasehold improvements Lease term
Defined contribution plan accounting is applied to the government of Alberta multi-employer defined benefit pension plans as the AUC has insufficient information to apply defined benefit plan accounting.
The cost, less residual value, of capital assets, are amortized on a straight-line basis over its estimated useful life as follows:
Capital assets are recognized at cost, which includes amounts that are directly related to the acquisition, design, construction, development, improvement or betterment of the assets.
Non-financial assets are limited to capital assets and prepaid expenses.
Liabilities represent present obligations of the AUC to external organizations and individuals arising from transactions or events occurring before the year end. They are recorded when there is an appropriate basis of measurement and management can reasonably estimate the amount. Generally, liabilities include trade payables, accrued liabilities and accrued employee vacation entitlements.
Pension asset represent pension plan contributions made in excess of the pension expense.
Accounts receivable are recognized at the lower of cost or net recoverable value. A valuation allowance is recorded when recovery is uncertain.
Accrued pension benefit obligations are actuarially determined using the projected benefit method prorated on length of service and management's best estimate of expected plan investment performance, projected employees' compensation levels, and length of service to the time of retirement.
For the purpose of calculating pension benefit liability and pension expense, the AUC uses the expected future rate of return on plan assets as its discount rate. For the purpose of calculating the expected return, plan assets are valued at market-related values.
Past service costs arising from plan amendments are expensed in the period of the plan amendment. Any actuarial gain or loss is amortized over the average remaining service period of the active employees, which is 6.9 years.
2016-17 Energy Annual Report150

7
ALBERTA UTILITIES COMMISSIONNOTES TO THE FINANCIAL STATEMENTS
(in thousands of dollars)March 31, 2017
Note 2 Summary of significant accounting policies and reporting practices (continued)
Financial assetsFinancial assets are AUC's financial claims on external organizations and individuals at the year end.
Cash and cash equivalentsCash comprises cash on hand and demand deposits.
Accounts receivable
Pension asset
Liabilities
Pension
Deferred lease incentiveLease incentive benefits are amortized on a straight line basis over the term of lease as a reduction to rental expense.
Non-financial assets
Capital assets
Computer hardware and software Four to seven years Furniture and equipment Four to forty years Leasehold improvements Lease term
Defined contribution plan accounting is applied to the government of Alberta multi-employer defined benefit pension plans as the AUC has insufficient information to apply defined benefit plan accounting.
The cost, less residual value, of capital assets, are amortized on a straight-line basis over its estimated useful life as follows:
Capital assets are recognized at cost, which includes amounts that are directly related to the acquisition, design, construction, development, improvement or betterment of the assets.
Non-financial assets are limited to capital assets and prepaid expenses.
Liabilities represent present obligations of the AUC to external organizations and individuals arising from transactions or events occurring before the year end. They are recorded when there is an appropriate basis of measurement and management can reasonably estimate the amount. Generally, liabilities include trade payables, accrued liabilities and accrued employee vacation entitlements.
Pension asset represent pension plan contributions made in excess of the pension expense.
Accounts receivable are recognized at the lower of cost or net recoverable value. A valuation allowance is recorded when recovery is uncertain.
Accrued pension benefit obligations are actuarially determined using the projected benefit method prorated on length of service and management's best estimate of expected plan investment performance, projected employees' compensation levels, and length of service to the time of retirement.
For the purpose of calculating pension benefit liability and pension expense, the AUC uses the expected future rate of return on plan assets as its discount rate. For the purpose of calculating the expected return, plan assets are valued at market-related values.
Past service costs arising from plan amendments are expensed in the period of the plan amendment. Any actuarial gain or loss is amortized over the average remaining service period of the active employees, which is 6.9 years.
8
ALBERTA UTILITIES COMMISSIONNOTES TO THE FINANCIAL STATEMENTS
(in thousands of dollars)March 31, 2017
Note 2 Summary of significant accounting policies and reporting practices (continued)
The capitalization threshold for all capital assets is $1.5 unless they are included in certain capital asset pools.
Prepaid expensesPrepaid expenses are recorded at cost and amortized based on the terms of the agreement.
Measurement uncertainty
Note 3 Future accounting changes
The Public Sector Accounting Board has issued the following accounting standards:
PS 2200 Related Party Disclosures and PS 3420 Inter-Entity Transactions (effective April 1, 2017)
PS 3210 Assets, PS 3320 Contingent Assets, and PS 3380 Contractual Rights (effective April 1, 2017)
PS 3430 Restructuring Transactions (effective April 1, 2018)
Capital assets are written down when conditions indicate that they no longer contribute to the AUC's ability to provide services, or when the value of future economic benefits associated with the capital assets are less than their net book value. The net write-downs are accounted for as expenses in the Statement of Operations.
This standard provides guidance on how to account for and report restructuring transactions by both transferors and recipients of assets and/or liabilities, together with related program or operating responsibilities. Management has completed a review of this standard and does not anticipate any impact on the AUC's financial statements.
Measurement uncertainty exists when there is a variance between the recognized or disclosed amount and another reasonably possible amount. The amounts recorded for amortization of capital assets are based on estimates of the useful life of the related assets. Also, the accrued pension benefit obligations incorporate multiple assumptions. Actual results for amortization and accrued pension obligations may differ from reported values.
PS 2200 defines a related party and establishes disclosures required for related party transactions; PS 3420 establishes standards on how to account for and report transactions between public sector entities that comprise a government's reporting entity from both a provider and recipient perspective. Management is currently assessing the impact of these standards on the financial statements.
PS 3210 provides guidance for applying the definition of assets set out in Financial Statement Concepts, Section PS 1000, and establishes general disclosure standards for assets; PS 3320 defines and establishes disclosure standards on contingent assets; PS 3380 defines and establishes disclosure standards on contractual rights. Management has completed a review of these standards and does not anticipate any impact on the AUC's financial statements.
2016-17 Energy Annual Report 151

9
ALBERTA UTILITIES COMMISSIONNOTES TO THE FINANCIAL STATEMENTS
(in thousands of dollars)March 31, 2017
Note 4 Cash and cash equivalents
Note 5 Financial instruments
Liquidity risk
Credit risk
Note 6 Pension
March 31, 2017 March 31, 2016Accrued benefit obligations
Discount rate 4.40% 4.48%Rate of compensation increase 3.50% 3.50%Long-term inflation rate 2.00% 2.00%
Cash and cash equivalents consist of deposits in the Consolidated Cash Investment Trust Fund which is managed by the Province of Alberta to provide interest income at competitive rates while maintaining appropriate security and liquidity of depositors' capital. The Fund is comprised of high quality short-term and mid-term fixed income securities with a maximum term to maturity of three years. As at March 31, 2017, securities held by the Fund have a time-weighted return of 0.9 per cent per annum (2016: 0.8 per cent).
The AUC participates in the Government of Alberta's multi-employer pension plans of Management Employees Pension Plan, Public Service Pension Plan, and Supplementary Retirement Plan for Public Service Managers. The expense for these pension plans is equal to the contribution of $1,781 for the year ended March 31, 2017 (2016: $1,969). The AUC is not responsible for future funding of the plans deficit other than through contribution increases.
In addition, the AUC maintains its own defined benefit Senior Employees Pension Plan (SEPP) and two supplementary pension plans to compensate senior staff who do not participate in the government management pension plans. Retirement benefits are based on each employee's years of service and remuneration.
The effective date of the most recent actuarial funding valuation for SEPP was December 31, 2014. The accrued benefit obligation as at March 31, 2017 is based on the extrapolation of the results of this valuation. The effective date of the next required funding valuation for SEPP is December 31, 2017.
Pension plan assets are valued at market values. During the year ended March 31, 2017 the weighted average actual return on plan assets was 7.89 per cent (-1.71 per cent in 2016).
Significant weighted average actuarial and economic assumptions used to value accrued benefit obligations and pension benefit costs are as follows:
The AUC has the following financial instruments: accounts receivable, accounts payable and accrued liabilities.
The AUC has exposure to the following risks from its use of financial instruments:
Liquidity risk is the risk that the AUC will encounter difficulty in meeting obligations associated with financial liabilities. The AUC does not consider this to be a significant risk as it collects the majority of annual revenues at the beginning of the year and maintains a significant cash reserve to meet all obligations that arise during the year.
The AUC is not exposed to any significant credit risk from potential non-payment of accounts receivable. As at March 31, 2017, the balance of accounts receivables does not contain amounts that were past due or uncollectible.
2016-17 Energy Annual Report152

9
ALBERTA UTILITIES COMMISSIONNOTES TO THE FINANCIAL STATEMENTS
(in thousands of dollars)March 31, 2017
Note 4 Cash and cash equivalents
Note 5 Financial instruments
Liquidity risk
Credit risk
Note 6 Pension
March 31, 2017 March 31, 2016Accrued benefit obligations
Discount rate 4.40% 4.48%Rate of compensation increase 3.50% 3.50%Long-term inflation rate 2.00% 2.00%
Cash and cash equivalents consist of deposits in the Consolidated Cash Investment Trust Fund which is managed by the Province of Alberta to provide interest income at competitive rates while maintaining appropriate security and liquidity of depositors' capital. The Fund is comprised of high quality short-term and mid-term fixed income securities with a maximum term to maturity of three years. As at March 31, 2017, securities held by the Fund have a time-weighted return of 0.9 per cent per annum (2016: 0.8 per cent).
The AUC participates in the Government of Alberta's multi-employer pension plans of Management Employees Pension Plan, Public Service Pension Plan, and Supplementary Retirement Plan for Public Service Managers. The expense for these pension plans is equal to the contribution of $1,781 for the year ended March 31, 2017 (2016: $1,969). The AUC is not responsible for future funding of the plans deficit other than through contribution increases.
In addition, the AUC maintains its own defined benefit Senior Employees Pension Plan (SEPP) and two supplementary pension plans to compensate senior staff who do not participate in the government management pension plans. Retirement benefits are based on each employee's years of service and remuneration.
The effective date of the most recent actuarial funding valuation for SEPP was December 31, 2014. The accrued benefit obligation as at March 31, 2017 is based on the extrapolation of the results of this valuation. The effective date of the next required funding valuation for SEPP is December 31, 2017.
Pension plan assets are valued at market values. During the year ended March 31, 2017 the weighted average actual return on plan assets was 7.89 per cent (-1.71 per cent in 2016).
Significant weighted average actuarial and economic assumptions used to value accrued benefit obligations and pension benefit costs are as follows:
The AUC has the following financial instruments: accounts receivable, accounts payable and accrued liabilities.
The AUC has exposure to the following risks from its use of financial instruments:
Liquidity risk is the risk that the AUC will encounter difficulty in meeting obligations associated with financial liabilities. The AUC does not consider this to be a significant risk as it collects the majority of annual revenues at the beginning of the year and maintains a significant cash reserve to meet all obligations that arise during the year.
The AUC is not exposed to any significant credit risk from potential non-payment of accounts receivable. As at March 31, 2017, the balance of accounts receivables does not contain amounts that were past due or uncollectible.
10
ALBERTA UTILITIES COMMISSIONNOTES TO THE FINANCIAL STATEMENTS
(in thousands of dollars)March 31, 2017
Note 6 Pension (continued)
2017 2016Pension Benefit costs for the year
Discount rate 4.48% 4.73%Expected rate of return on plan assets 4.48% 4.73%Rate of compensation increase 3.50% 3.50%
March 31, 2017 March 31, 2016Market value of plan assets 11,286$ 8,543$ Accrued benefit obligations 10,925 10,224Plan surplus (deficit) 361 (1,681)Unamortized actuarial loss 47 916Accrued pension asset (liability) 408$ (765)$
2017 2016Current period benefit costs 608$ 647$ Interest cost 477 464Expected return on plan assets (396) (397)Amortization of actuarial losses 186 113
875$ 827$
2017 2016AUC contribution 2,048$ 827$ Employees' contribution 109 112Benefits paid 166 346
March 31, 2017 March 31, 2016Equity securities 49.70% 48.40%Debt securities 27.00% 28.40%Other 23.30% 23.20%
100.00% 100.00%
The funded status and amounts recognized in the Statement of Financial Position are as follows:
The pension benefit costs for the year include the following components:
Additional information about the defined benefit pension plans is as follows:
The asset allocation of the defined benefit pension plans' investments is as follows:
2016-17 Energy Annual Report 153

11
ALBERTA UTILITIES COMMISSIONNOTES TO THE FINANCIAL STATEMENTS
(in thousands of dollars)March 31, 2017
Note 7 Capital assetsMarch 31, 2016
Furniture and equipment
Computer hardware and
softwareLeasehold
improvement Total TotalHistorical costBeginning of year 2,217$ 9,013$ 3,428$ 14,658$ 15,220$ Additions 53 868 - 921 746Disposals (61) (295) - (356) (1,308)
2,209$ 9,586$ 3,428$ 15,223$ 14,658$
Accumulated amortizationBeginning of year 1,074$ 4,589$ 2,646$ 8,309$ 7,964$ Amortization expense 120 1,040 356 1,516 1,615Effect of disposals (59) (295) - (354) (1,270)
1,135$ 5,334$ 3,002$ 9,471$ 8,309$
Net book value at March 31, 2017 1,074$ 4,252$ 426$ 5,752$ 6,349$ Net book value at March 31, 2016 1,143$ 4,424$ 782$ 6,349$
Note 8 Accumulated surplus
2016Investments in capital assets
Unrestricted surplus Total Total
Opening balance 6,349$ 9,633$ 15,982$ 16,278$ Annual operating (deficit) surplus - (128) (128) (296)Net investment in capital assets (597) 597 - -Closing balance 5,752$ 10,102$ 15,854$ 15,982$
Note 9 Contractual obligations
Obligations under operating leases, contracts and maintenance agreementsTotal
3,359$ 583206206
-Thereafter -
4,354$
2017
Accumulated surplus is comprised of the following:
March 31, 2017
Contractual obligations are obligations of the AUC to others that will become liabilities in the future when the terms of those contracts or agreements are met. Contractual obligations for each of the next five years and thereafter are as follows:
20182019202020212022
2016-17 Energy Annual Report154

11
ALBERTA UTILITIES COMMISSIONNOTES TO THE FINANCIAL STATEMENTS
(in thousands of dollars)March 31, 2017
Note 7 Capital assetsMarch 31, 2016
Furniture and equipment
Computer hardware and
softwareLeasehold
improvement Total TotalHistorical costBeginning of year 2,217$ 9,013$ 3,428$ 14,658$ 15,220$ Additions 53 868 - 921 746Disposals (61) (295) - (356) (1,308)
2,209$ 9,586$ 3,428$ 15,223$ 14,658$
Accumulated amortizationBeginning of year 1,074$ 4,589$ 2,646$ 8,309$ 7,964$ Amortization expense 120 1,040 356 1,516 1,615Effect of disposals (59) (295) - (354) (1,270)
1,135$ 5,334$ 3,002$ 9,471$ 8,309$
Net book value at March 31, 2017 1,074$ 4,252$ 426$ 5,752$ 6,349$ Net book value at March 31, 2016 1,143$ 4,424$ 782$ 6,349$
Note 8 Accumulated surplus
2016Investments in capital assets
Unrestricted surplus Total Total
Opening balance 6,349$ 9,633$ 15,982$ 16,278$ Annual operating (deficit) surplus - (128) (128) (296)Net investment in capital assets (597) 597 - -Closing balance 5,752$ 10,102$ 15,854$ 15,982$
Note 9 Contractual obligations
Obligations under operating leases, contracts and maintenance agreementsTotal
3,359$ 583206206
-Thereafter -
4,354$
2017
Accumulated surplus is comprised of the following:
March 31, 2017
Contractual obligations are obligations of the AUC to others that will become liabilities in the future when the terms of those contracts or agreements are met. Contractual obligations for each of the next five years and thereafter are as follows:
20182019202020212022
12
ALBERTA UTILITIES COMMISSIONNOTES TO THE FINANCIAL STATEMENTS
(in thousands of dollars)March 31, 2017
Note 10 Related party transactions
Note 11 Approval of financial statements
For the year ended March 31, 2017 the AUC received and paid $148 (2016: $156) for services from other government of Alberta organizations. The AUC also received contributed services from other government of Alberta organizations with an estimated value of $88 (2016: $2). The value of these contributed services have not been recognized in the Statement of Operations. All transactions were in the normal course of operations and measured at the amount of consideration agreed to by the related parties.
These financial statements were approved by the AUC's Commission Members.
2016-17 Energy Annual Report 155

13
ALBERTA UTILITIES COMMISSION Schedule 1EXPENSES - DETAILED BY OBJECTYear Ended March 31, 2017
2016Budget Actual Actual
25,641$ 21,855$ 23,559$8,797 7,750 8,1611,800 1,516 1,615
- 2 3636,238$ 31,123$ 33,371$
2017
Salaries, wages and employee benefitsSupplies and servicesAmortization of capital assetsLoss on disposal of capital assets
---------------------------------------(in thousands)---------------------------------------
2016-17 Energy Annual Report156

13
ALBERTA UTILITIES COMMISSION Schedule 1EXPENSES - DETAILED BY OBJECTYear Ended March 31, 2017
2016Budget Actual Actual
25,641$ 21,855$ 23,559$8,797 7,750 8,1611,800 1,516 1,615
- 2 3636,238$ 31,123$ 33,371$
2017
Salaries, wages and employee benefitsSupplies and servicesAmortization of capital assetsLoss on disposal of capital assets
---------------------------------------(in thousands)---------------------------------------
14
ALBERTA UTILITIES COMMISSION Schedule 2SALARY AND BENEFITS DISCLOSUREYear Ended March 31, 2017
2016Other Other
Base Cash Non-cashSalary (1) Benefits (2) Benefits (3) Total Total (4)
Chair of the Commission 347$ 62$ 87$ 496$ 483$Vice-Chair 218 58 16 292 267Commission Member 196 24 59 279 264Commission Member 196 2 58 256 257Commission Member 196 34 15 245 241Commission Member 196 44 14 254 240Commission Member (5) 65 32 - 97 240Commission Member (6) 17 2 5 24 -Commission Member (6) 9 2 6 17 -Commission Member (6) 10 2 3 15 -Commission Member (7) - - - - 259
(1) Includes pensionable base pay.
(2) Includes payments in lieu of vacation, health and pension benefits.
(3)
(4)
(5) Position has been vacant since August 1, 2016.
(6) New appointments commencing on February 16, 2017.
(7) Position has been vacant since March 16, 2016.
2017
-------------------------------------------------(in thousands)-------------------------------------------------
Employer's contributions to all employee benefits including Employment Insurance, Canada Pension Plan, Alberta pension plans, health benefits, professional memberships and tuition fees. Automobiles were provided but no dollar amount included in other non-cash benefits.
Total compensation for the year ended March 31, 2016 have been restated to account for a correction to pension contributions.
2016-17 Energy Annual Report 157
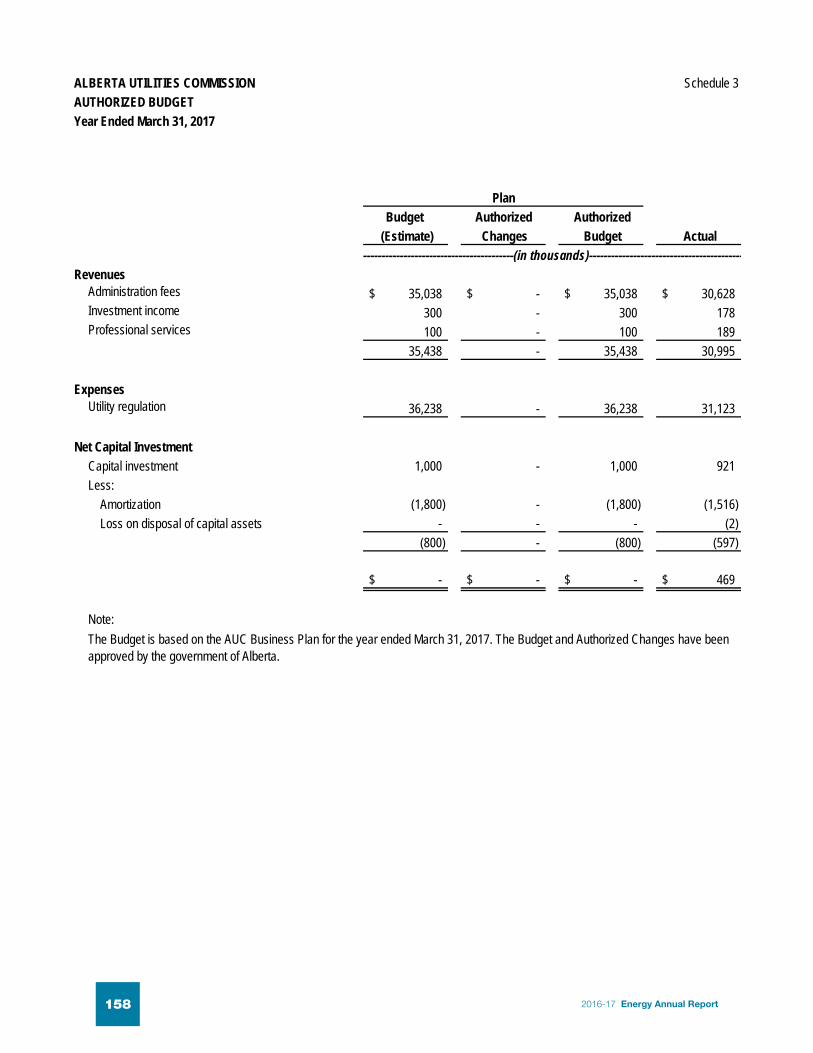
15
ALBERTA UTILITIES COMMISSION Schedule 3AUTHORIZED BUDGETYear Ended March 31, 2017
Budget Authorized Authorized (Estimate) Changes Budget Actual
RevenuesAdministration fees 35,038$ -$ 35,038$ 30,628$Investment income 300 - 300 178Professional services 100 - 100 189
35,438 - 35,438 30,995
ExpensesUtility regulation 36,238 - 36,238 31,123
Net Capital InvestmentCapital investment 1,000 - 1,000 921Less:
Amortization (1,800) - (1,800) (1,516)Loss on disposal of capital assets - - - (2)
(800) - (800) (597)
-$ -$ -$ 469$
Note:The Budget is based on the AUC Business Plan for the year ended March 31, 2017. The Budget and Authorized Changes have been approved by the government of Alberta.
Plan
------------------------------------------(in thousands)------------------------------------------
2016-17 Energy Annual Report158

ALBERTA PETROLEUM MARKETING COMMISSION
FINANCIAL STATEMENTSFor the year ended December 31, 2016
Independent Auditor’s Report
Statement of Financial Position
Statement of Income and Comprehensive Income
Statement of Changes in Net Assets
Statement of Cash Flows
Notes to Financial Statements
2016-17 Energy Annual Report 159

Independent Auditor’s Report
To the Board of Directors of the Alberta Petroleum Marketing Commission
Report on the Financial Statements
I have audited the accompanying financial statements of the Alberta Petroleum Marketing Commission, which comprise the statement of financial position as at December 31, 2016, and the statements of income and comprehensive income, changes in net assets and cash flows for the year then ended, and a summary of significant accounting policies and other explanatory information.
Management’s Responsibility for the Financial Statements
Management is responsible for the preparation and fair presentation of these financial statements in accordance with International Financial Reporting Standards, and for such internal control as management determines is necessary to enable the preparation of financial statements that are free from material misstatement, whether due to fraud or error.
Auditor’s Responsibility
My responsibility is to express an opinion on these financial statements based on my audit. I conducted my audit in accordance with Canadian generally accepted auditing standards. Those standards require that I comply with ethical requirements and plan and perform the audit to obtain reasonable assurance about whether the financial statements are free from material misstatement.
An audit involves performing procedures to obtain audit evidence about the amounts and disclosures in the financial statements. The procedures selected depend on the auditor’s judgment, including the assessment of the risks of material misstatement of the financial statements, whether due to fraud or error. In making those risk assessments, the auditor considers internal control relevant to the entity’s preparation and fair presentation of the financial statements in order to design audit procedures that are appropriate in the circumstances, but not for the purpose of expressing an opinion on the effectiveness of the entity’s internal control. An audit also includes evaluating the appropriateness of accounting policies used and the reasonableness of accounting estimates made by management, as well as evaluating the overall presentation of the financial statements.
I believe that the audit evidence I have obtained is sufficient and appropriate to provide a basis for my audit opinion.
Opinion
In my opinion, the financial statements present fairly, in all material respects, the financial position of the Alberta Petroleum Marketing Commission as at December 31, 2016, and its financial performance and its cash flows for the year then ended in accordance with International Financial Reporting Standards.
June 8, 2017
Edmonton, Alberta
2016-17 Energy Annual Report160
Original signed by Merwan N. Saher, FCPA, FCA Auditor General
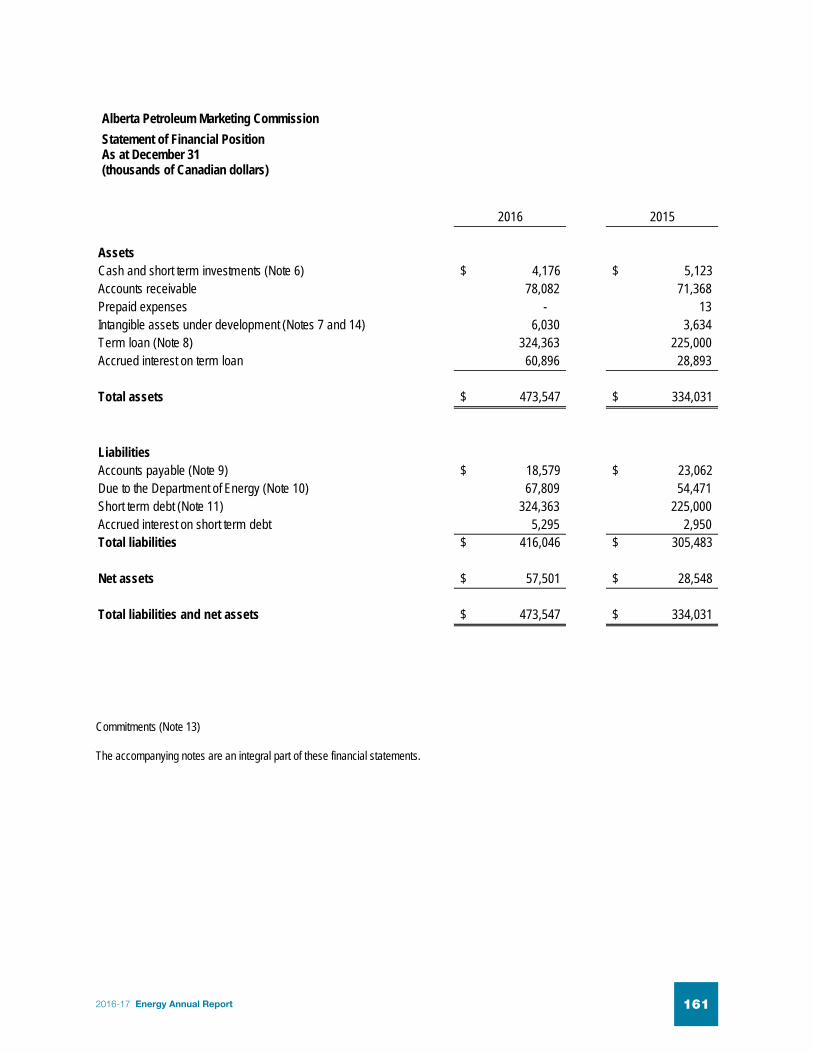
- 2 -
Alberta Petroleum Marketing Commission Statement of Financial Position As at December 31 (thousands of Canadian dollars)
Commitments (Note 13)
The accompanying notes are an integral part of these financial statements.
2016 2015
AssetsCash and short term investments (Note 6) 4,176$ 5,123$ Accounts receivable 78,082 71,368 Prepaid expenses - 13 Intangible assets under development (Notes 7 and 14) 6,030 3,634 Term loan (Note 8) 324,363 225,000 Accrued interest on term loan 60,896 28,893
Total assets 473,547$ 334,031$
LiabilitiesAccounts payable (Note 9) 18,579$ 23,062$ Due to the Department of Energy (Note 10) 67,809 54,471 Short term debt (Note 11) 324,363 225,000 Accrued interest on short term debt 5,295 2,950 Total liabilities 416,046$ 305,483$
Net assets 57,501$ 28,548$
Total liabilities and net assets 473,547$ 334,031$
2016-17 Energy Annual Report 161

- 3 -
Alberta Petroleum Marketing Commission Statement of Income and Comprehensive Income For the year ended December 31 (thousands of Canadian dollars)
The accompanying notes are an integral part of these financial statements.
2016 2015
Conventional crude oil marketing operationsMarketing fee revenue (Note 14) 4,313$ 3,895$ Finance income 28 79
4,341 3,974
ExpenseWages and benefits (Note 14) 3,765 3,776Software and maintenance (Note 14) 735 383Consulting 319 405Dues and subscriptions 95 76Travel 49 77Directors' fees 34 34Telephone 17 17Conferences 15 10Other 14 12
5,043 4,790
Net (loss) income from conventional crude oil marketing operations (702) (816)
Sturgeon RefineryFinance income 32,003 21,266Finance costs (2,345) (2,106)Trust costs (3) (3)
Net income attributable to Sturgeon Refinery 29,655 19,157
Net income and comprehensive income 28,953$ 18,341$
2016-17 Energy Annual Report162
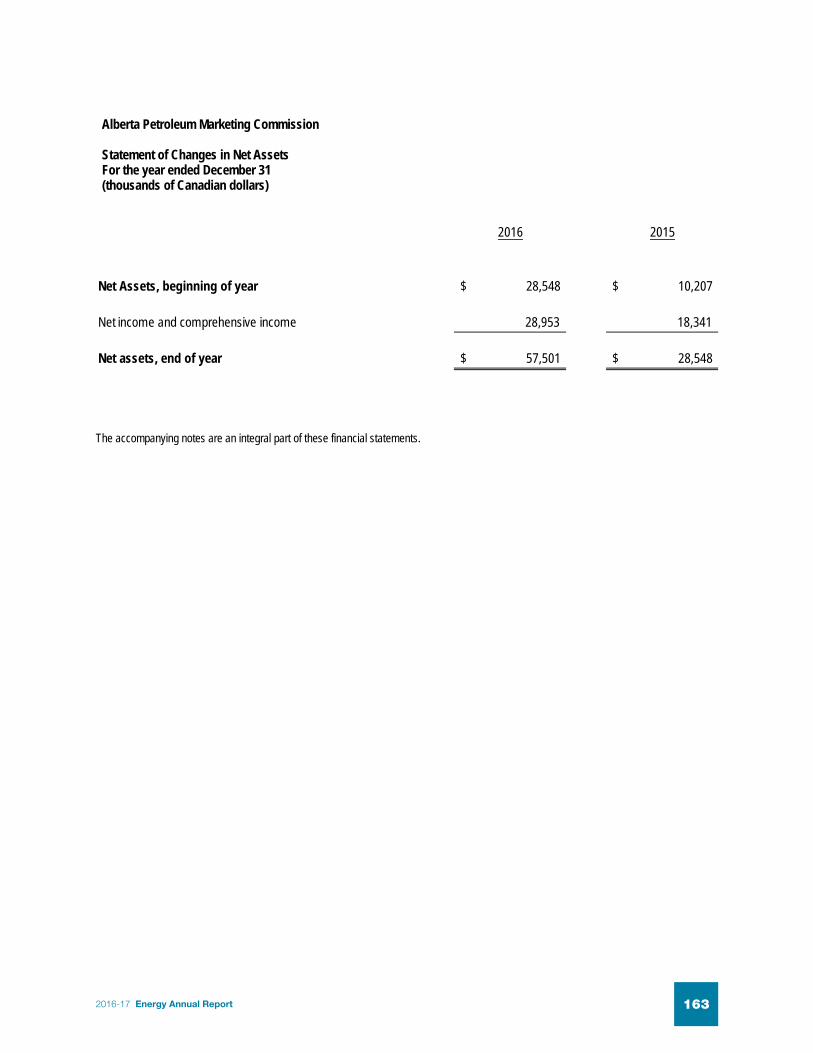
- 4 -
Alberta Petroleum Marketing Commission
Statement of Changes in Net Assets For the year ended December 31 (thousands of Canadian dollars)
The accompanying notes are an integral part of these financial statements.
2016 2015
Net Assets, beginning of year 28,548$ 10,207$ Net income and comprehensive income 28,953 18,341
Net assets, end of year 57,501$ 28,548$
2016-17 Energy Annual Report 163

- 5 -
Alberta Petroleum Marketing Commission Statement of Cash Flows For the year ended December 31 (thousands of Canadian dollars)
The accompanying notes are an integral part of these financial statements.
2016 2015
Operating activities Net income and comprehensive income 28,953$ 18,341$ Non-cash items included in net income Accrued interest on term loan (32,003) (21,266) Accrued interest on short term debt 2,345 2,106 Changes in non-cash working capital (Increase) decrease in accounts receivable (6,714) 82,190 Decrease (increase) in prepaid expenses 13 (1) (Decrease) in accounts payable (4,483) (19,992) Increase (decrease) in due to Department of Energy 13,338 (69,074) Net cash from operating activities 1,449 (7,696)
Investing activities Term loan (99,363) (112,500) Intangible assets under development (2,396) (2,363) Net cash used in investing activities (101,759) (114,863)
Financing activities Proceeds from issuance of short term debt 99,363 112,500 Net cash from financing activities 99,363 112,500 (Decrease) in cash and short term investments (947) (10,059)
Cash and short term investments, beginning of year 5,123 15,182
Cash and short term investments, end of year 4,176$ 5,123$
2016-17 Energy Annual Report164

ALBERTA PETROLEUM MARKETING COMMISSION NOTES TO THE FINANCIAL STATEMENTS (in thousands of Canadian dollars unless otherwise stated)
- 6 -
Note 1 Authority and structure
The Alberta Petroleum Marketing Commission (“APMC” or the “Commission”) operates under the authority of the Petroleum Marketing Act, Chapter P-10, Revised Statutes of Alberta 2000, and the Natural Gas Marketing Act, Chapter N-1, Revised Statutes of Alberta 2000. Pursuant to Alberta legislation the Commission as agent of the Province of Alberta (the “Province”), as represented by the Department of Energy (the “Department”), accepts delivery of and markets the Province’s royalty share of crude oil. This is achieved through the Commission receiving crude oil in kind from producers on behalf of the Department and transferring the proceeds received from the sale of the crude oil back to the Department. These financial statements disclose the transactions the Commission incurs while acting as agent on behalf of the Department.
The Petroleum Marketing Act was amended on January 10, 2014. The amendments provided the Minister with new power to give directions to the APMC; modernized and improved the basic corporate rules under which the APMC operates including the ability to appoint up to seven directors, some of whom may be from outside the public service; clarified financial tools available to the APMC and ensured proper Crown controls on use of these tools.
The Commission’s mandate has been enhanced to include assisting in the development of new energy markets and transportation infrastructure. In line with that is the Commission’s involvement with North West Redwater Partnership (“NWRP” or “Sturgeon Refinery”) and the commitment to capacity on the Energy East Pipeline Project. The Commission operates a Business Development group to identify and analyze business ideas and proposals that provide strategic value to Alberta and are financially feasible.
As an agent of the Government of Alberta, the Commission is not subject to federal or provincial corporate income taxes.
The Commission is located at the following address: #300, 801 – 6th Avenue S.W., Calgary, Alberta, T2P 3W2. These financial statements were authorized for issue by the Board of Directors on June 8, 2017.
Note 2 Basis of preparation
(a) Basis of presentation
These financial statements have been prepared in compliance with International Financial Reporting Standards (IFRS) as published by the International Accounting Standards Board (IASB).
(b) Basis of measurement
The financial statements have been prepared under the historical cost convention, except as disclosed in the significant accounting policies in Note 3.
(c) Financial and presentation currency
These financial statements are presented in Canadian dollars, which is the Commission’s functional currency.
Note 3 Significant accounting policies
The precise determination of many assets and liabilities is dependent upon future events. Accordingly, the preparation of financial statements for a reporting period necessarily involves the use of estimates and approximations which have been made using careful judgment. Actual results could differ from those estimates. These financial statements have, in the Commission’s opinion, been properly prepared within reasonable limits of materiality and within the framework of the accounting policies summarized below.
2016-17 Energy Annual Report 165
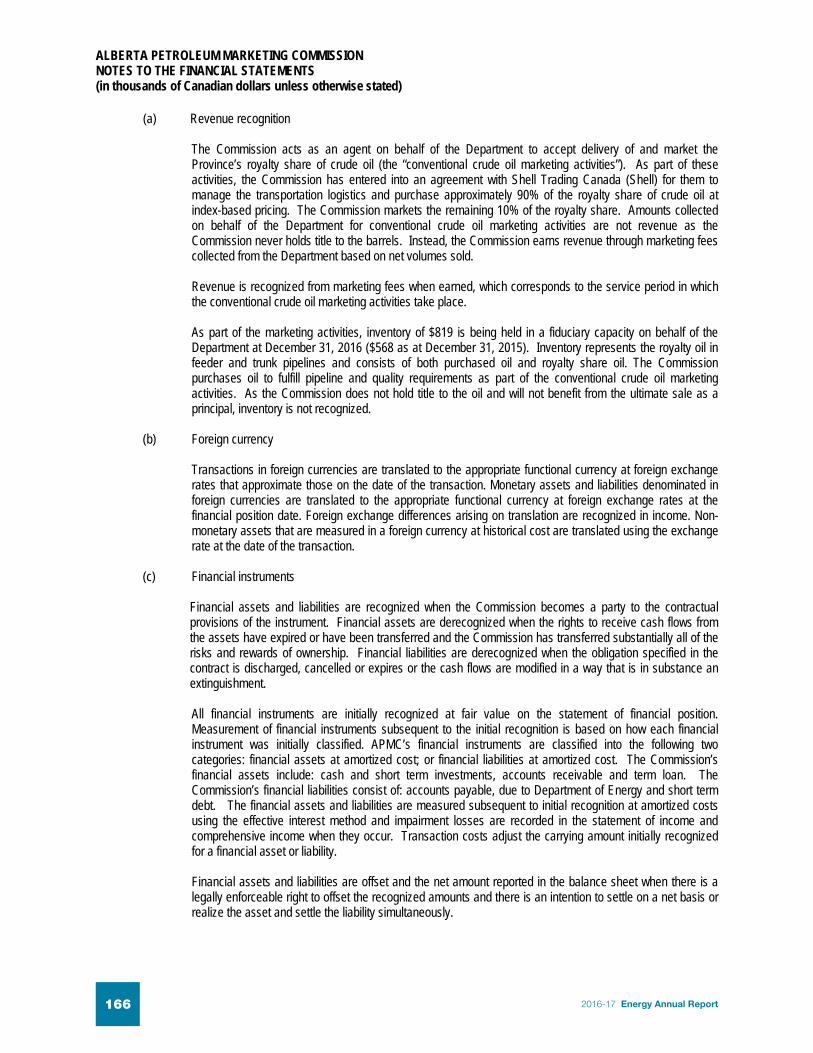
ALBERTA PETROLEUM MARKETING COMMISSION NOTES TO THE FINANCIAL STATEMENTS (in thousands of Canadian dollars unless otherwise stated)
- 7 -
(a) Revenue recognition
The Commission acts as an agent on behalf of the Department to accept delivery of and market the Province’s royalty share of crude oil (the “conventional crude oil marketing activities”). As part of these activities, the Commission has entered into an agreement with Shell Trading Canada (Shell) for them to manage the transportation logistics and purchase approximately 90% of the royalty share of crude oil at index-based pricing. The Commission markets the remaining 10% of the royalty share. Amounts collected on behalf of the Department for conventional crude oil marketing activities are not revenue as the Commission never holds title to the barrels. Instead, the Commission earns revenue through marketing fees collected from the Department based on net volumes sold.
Revenue is recognized from marketing fees when earned, which corresponds to the service period in which the conventional crude oil marketing activities take place.
As part of the marketing activities, inventory of $819 is being held in a fiduciary capacity on behalf of the Department at December 31, 2016 ($568 as at December 31, 2015). Inventory represents the royalty oil in feeder and trunk pipelines and consists of both purchased oil and royalty share oil. The Commission purchases oil to fulfill pipeline and quality requirements as part of the conventional crude oil marketing activities. As the Commission does not hold title to the oil and will not benefit from the ultimate sale as a principal, inventory is not recognized.
(b) Foreign currency
Transactions in foreign currencies are translated to the appropriate functional currency at foreign exchange rates that approximate those on the date of the transaction. Monetary assets and liabilities denominated in foreign currencies are translated to the appropriate functional currency at foreign exchange rates at the financial position date. Foreign exchange differences arising on translation are recognized in income. Non-monetary assets that are measured in a foreign currency at historical cost are translated using the exchange rate at the date of the transaction.
(c) Financial instruments
Financial assets and liabilities are recognized when the Commission becomes a party to the contractual provisions of the instrument. Financial assets are derecognized when the rights to receive cash flows from the assets have expired or have been transferred and the Commission has transferred substantially all of the risks and rewards of ownership. Financial liabilities are derecognized when the obligation specified in the contract is discharged, cancelled or expires or the cash flows are modified in a way that is in substance an extinguishment.
All financial instruments are initially recognized at fair value on the statement of financial position. Measurement of financial instruments subsequent to the initial recognition is based on how each financial instrument was initially classified. APMC’s financial instruments are classified into the following two categories: financial assets at amortized cost; or financial liabilities at amortized cost. The Commission’s financial assets include: cash and short term investments, accounts receivable and term loan. The Commission’s financial liabilities consist of: accounts payable, due to Department of Energy and short term debt. The financial assets and liabilities are measured subsequent to initial recognition at amortized costs using the effective interest method and impairment losses are recorded in the statement of income and comprehensive income when they occur. Transaction costs adjust the carrying amount initially recognized for a financial asset or liability.
Financial assets and liabilities are offset and the net amount reported in the balance sheet when there is a legally enforceable right to offset the recognized amounts and there is an intention to settle on a net basis or realize the asset and settle the liability simultaneously.
2016-17 Energy Annual Report166

ALBERTA PETROLEUM MARKETING COMMISSION NOTES TO THE FINANCIAL STATEMENTS (in thousands of Canadian dollars unless otherwise stated)
- 8 -
(d) Impairment of loans and receivables
Loans and receivables are assessed at each reporting date to determine whether there is any objective evidence of impairment. A loan or receivable is considered to be impaired if objective evidence indicates that one or more events have had a negative effect on the estimated future cash flows of that asset. An impairment loss in respect of a financial asset measured at amortized cost is calculated as the difference between its carrying amount and the present value of the estimated future cash flows discounted at the original effective interest rate. Individually significant financial assets are tested for impairment on an individual basis. The remaining financial assets are assessed collectively in groups that share similar credit risk characteristics. All impairment losses are recognized in income in the period incurred. An impairment loss is reversed if the reversal can be related objectively to an event occurring after the impairment loss was recognized. For financial assets measured at amortized cost the reversal is recognized in the statement of income and comprehensive income.
(e) Finance income
Finance income generated from conventional crude oil marketing operations comprises interest income earned on short term investments. Finance income related to the Sturgeon Refinery is earned on a term loan at prime plus six percent compounded monthly.
(f) Provisions
Provisions are recognized when the Commission has a present legal or constructive obligation as a result of past events, it is probable that an outflow of resources will be required to settle the obligation, and the amount has been reliably estimated. Provisions are not recognized for future operating losses. Provisions are measured at the present value of the expenditures expected to be required to settle the obligation using a rate that reflects current market assessments of the time value of money and the risks specific to the obligation. The increase in the provision due to passage of time is recognized as interest expense.
At each year-end APMC performs an onerous contract assessment. A provision for an onerous contract is recorded when the unavoidable costs of meeting an obligation under a contract exceed the economic benefits expected to be received under it. This provision would be recorded as an expense on the statement of income and comprehensive income and offsetting liability on the statement of financial position.
(g) Intangible assets under development
The Commission is in the process of replacing its legacy operating and accounting software. Costs related to software developed or obtained for internal use are capitalized if it is probable those future economic benefits will flow to APMC and that the cost can be measured reliably. Eligible costs include: billings from the Department’s Information Management Technical Services (IMTS) group for development; directly attributable costs; consulting and wages and benefits of people working on the project.
Once the project is complete the total cost will be amortized on a straight line basis over the estimated useful life of the software.
(h) Impairment of intangible assets under development
The carrying amounts of non-financial assets, which include the intangible assets under development, are reviewed for impairment whenever events or changes in circumstances indicate that the carrying amount of the asset may not be recoverable. Software under development is reviewed annually for impairment. Assets are grouped at the lowest level where there are separately identifiable cash inflows for the purpose of assessing impairment.
2016-17 Energy Annual Report 167

ALBERTA PETROLEUM MARKETING COMMISSION NOTES TO THE FINANCIAL STATEMENTS (in thousands of Canadian dollars unless otherwise stated)
- 9 -
If there is an indication of impairment, the asset’s recoverable amount is estimated. The recoverable amount is the greater of an asset’s fair value less cost to sell and its value in use, if the carrying amount of the asset exceeds the recoverable amount, an impairment loss is recognized. Impairment losses are recognized in the Statement of Income and Comprehensive Income.
If the circumstances leading to the impairment are no longer present, an impairment loss may be reversed. The extent of the impairment loss that can be reversed is determined by the carrying cost net of amortization that would have existed if the impairment had not occurred. Therefore reversal of the loss cannot exceed the total carrying cost less amortization of the asset had the impairment not occurred. The impairment loss reversals are recognized in the Statement of Income and Comprehensive Income.
Note 4 New standards and accounting pronouncements not yet effective
A number of new accounting standards, amendments to accounting standards and interpretations are effective for annual periods beginning on or after January 1, 2018 and have not been applied in preparing the Financial Statements for the year ended December 31, 2016. The standards applicable to the Commission are as follows and will be adopted on their respective effective dates.
(a) Revenue recognition
On May 28, 2014, the IASB issued IFRS 15, “Revenue from Contracts with Customers” (“IFRS 15”) replacing International Accounting Standard 11, “Construction Contracts” (“IAS 11”), IAS 18, “Revenue” (“IAS 18”), and several revenue-related interpretations. IFRS 15 establishes a single revenue recognition framework that applies to contracts with customers. The standard requires an entity to recognize revenue to reflect the transfer of goods and services for the amount it expects to receive, when control is transferred to the purchaser. Disclosure requirements have also been expanded.
The new standard is effective for annual periods beginning on or after January 1, 2018, with early adoption permitted. The standard may be applied retrospectively or using a modified retrospective approach. The Commission will adopt the standard when it becomes effective and does not anticipate that this standard will result in significant accounting changes to current operations. APMC is currently assessing the impact of IFRS 15 on its accounting for the Sturgeon Refinery.
(b) Financial instruments
On July 24, 2014, the IASB issued the final version of IFRS 9, “Financial Instruments” (“IFRS 9”) to replace IAS 39, “Financial Instruments: Recognition and Measurement” (“IAS 39”). IFRS 9 introduces a single approach to determine whether a financial asset is measured at amortized cost or fair value and replaces the multiple rules in IAS 39. The approach is based on how an entity manages its financial instruments in the context of its business model and the contractual cash flow characteristics of the financial assets. For financial liabilities, IFRS 9 retains most of the IAS 39 requirements; however, where the fair value option is applied to financial liabilities, the change in fair value resulting from an entity’s own credit risk is recorded in Other Comprehensive Income rather than net earnings, unless this creates an accounting mismatch. In addition, a new expected credit loss model for calculating impairment on financial assets replaces the incurred loss impairment model used in IAS 39. The new model will result in more timely recognition of expected credit losses. IFRS 9 also includes a simplified hedge accounting model, aligning hedge accounting more closely with risk management. The APMC does not currently apply hedge accounting.
IFRS 9 is effective for years beginning on or after January 1, 2018. Early adoption is permitted if IFRS 9 is adopted in its entirety at the beginning of a fiscal period. The Commission will adopt the standard when it becomes effective and is currently assessing the impact of IFRS 9 on its financial statements.
2016-17 Energy Annual Report168

ALBERTA PETROLEUM MARKETING COMMISSION NOTES TO THE FINANCIAL STATEMENTS (in thousands of Canadian dollars unless otherwise stated)
- 10 -
Note 5 Critical accounting estimates and judgments
(a) Government business enterprise
Under public sector accounting standards, organizations which are controlled by the government are either government business enterprises or other government organizations. Government business enterprises are required to apply IFRS, whereas other government organizations are provided with the accounting policy choice. The Commission has exercised judgment and determined that it is a government business enterprise because it is a separate legal entity and has been delegated financial and operational authority to carry on a business. In 2013, the Commission’s mandate was expanded, and it is expected through its involvement with other marketing activities, such as North West Redwater Partnership and Energy East Pipeline Project that it can provide services, maintain its operations and meet liabilities from sources outside of the government reporting entity. Had the Commission not been determined to be a government business enterprise, the Commission would have continued to apply public sector accounting standards, and such an alternative basis of accounting could have a pervasive effect on the measurement and presentation of items in the financial statements.
(b) Revenue recognition
The Commission has exercised significant judgment in determining whether it is acting as a principal or agent with respect to conventional crude oil marketing activities. The Commission would be acting as a principal if it has exposure to the significant risks and rewards associated with rendering the marketing services. The Commission accepts delivery of and markets the Province’s royalty share of crude oil, and has the ability to determine which customers to transact with, and whether it should purchase additional product for blending activities to change the composition of crude oil sold. However, the Commission is not exposed to significant inventory, credit, or price risk, and therefore does not have the exposure to the significant risks and rewards of ownership, which is indicative of an agency relationship. Therefore the gross inflows and economic benefits of conventional crude oil marketing activities are considered collected on behalf of the Department and are not recognized as revenue. Had the Commission been considered to be a principal the Statement of Income and Comprehensive Income would have included additional revenues, expenses and amounts to be transferred to the Department of $555,725 revenues, $58,038 expenses and $497,687 royalties to be transferred to the Department respectively ($788,728 revenues, $86,830 expenses and $701,898 royalties to be delivered to the Department - 2015).
(c) NWRP – Significant influence
In 2016 APMC lent an additional $99.363 million to NWRP (total as at December 31, 2016 $324.363 million) in the form of a term loan. NWRP is a general partnership formed by CNR (Redwater) Limited (formerly Canadian Natural Upgrading Limited), a wholly-owned subsidiary of Canadian Natural Resources Limited and by NWU LP, an indirect wholly-owned subsidiary of North West Refining Inc. NWRP was formed under the Partnership Act (Alberta) pursuant to a partnership agreement dated February 15, 2011, as amended on November 7, 2012, March 11, 2013 and April 7, 2014. The partners each have a 50% partnership interest in NWRP.
NWRP has entered into various agreements to construct and operate a refinery 45 kilometres north-east of Edmonton to have the capacity to process approximately 50,000 barrels per day (bbl/d) of bitumen at an updated Facility Capital Cost budget of $9.0 billion ($8.5 billion as at December 31, 2015). A higher than expected USD/CAD exchange rate, scope changes, and productivity challenges during construction have resulted in upward budgetary pressures. The cumulative effect of these changes may result in a further increase in Facility Capital Costs of between 2% and 5%. APMC will provide the Sturgeon Refinery with 37,500 bbl/d of bitumen feedstock and Canadian Natural Resources Partnership will provide the remaining 12,500 bbl/d of bitumen feedstock under two 30 year fee-for-service tolling agreements. NWRP targets the refinery to come on stream to process bitumen feedstock with a commercial operations date of the 2nd quarter of 2018.
2016-17 Energy Annual Report 169

ALBERTA PETROLEUM MARKETING COMMISSION NOTES TO THE FINANCIAL STATEMENTS (in thousands of Canadian dollars unless otherwise stated)
- 11 -
This term loan earns interest at a rate of prime plus six percent, compounded monthly, and will be repaid over 10 years starting one year after commercial start-up. While the loan to NWRP is outstanding APMC is entitled to a 25 percent voting interest on an Executive Leadership Committee, which is charged with overseeing and making decisions on the construction, start-up and operation of the Sturgeon Refinery.
The Commission has exercised substantial judgement in determining APMC has significant influence over NWRP. However the Commission has no equity ownership interest in NWRP. APMC will not equity account for NWRP within the accounts of the Commission’s financial statements, however will provide summarized NWRP financial information in these notes. See Note 8 for further details.
(d) NWRP - Monthly toll commitment
The Commission has used judgement to estimate the toll commitments included in Note 13 Commitments. The components of the toll are: senior debt; operating costs; class A subordinated debt; equity; and incentive fees. To calculate the toll, management has used estimates for factors including future interest rates, operating costs, oil prices (WTI and light/heavy differentials), refined product prices, gas prices and foreign exchange.
(e) NWRP - Processing agreement assessment
The Commission uses a cash flow model to determine if the unavoidable costs of meeting the obligations under the NWRP Processing Agreement exceed the economic benefits expected to be received. The model uses a number of variables to calculate a discounted net cash flow for APMC. Those variables include technical variables that arise from the design of the project such as catalyst volumes or energy consumption; pricing related variables such as crude oil prices (WTI), heavy-light differentials, ultra-low sulphur diesel-WTI premiums, exchange rates, capital costs, operating costs, interest rates, discount rates; and operating performance compared to capacity.
Technical inputs may be estimated with reasonable accuracy for a particular operating plan; however revenues and costs that depend upon market prices are challenging to estimate, particularly over long future time periods. The Processing Agreement has a term of 30 years and may be renewed for successive five year periods at APMC’s option. In order to perform the onerous contract analysis APMC management developed estimates for the key variables based on information from various sources including forecasts of global consultancies, reserve evaluation consultants, forward markets and the Government of Alberta.
Based on the analysis as at the authorization date of these financial statements, APMC determined the agreement has a positive net present value and no provision is required.
(f) Energy East – Monthly toll commitment
The Commission has used judgement to estimate the toll commitments included in Note 13 Commitments. This estimate is based on the terms and conditions agreed to within the Transportation Service Agreement (TSA), including the contract term and capacity commitment, as well as a per barrel toll estimate outlined in an updated December 2015 National Energy Board (NEB) project filing.
Note 6 Cash and short term investments
Cash and short term investments consist of deposits in the Consolidated Cash Investment Trust Fund (the “Fund”) which is managed by Treasury Board and Finance to provide competitive interest income while maintaining maximum security and liquidity of depositors’ capital. The Fund is comprised of high quality short term and mid-term fixed income securities with a maximum term to maturity of three years. As at December 31, 2016, securities held by the Fund have a rate of return of 0.85% per annum (0.93% per annum – 2015). Due to the short term nature of Fund investments the carrying value approximates fair value.
2016-17 Energy Annual Report170

ALBERTA PETROLEUM MARKETING COMMISSION NOTES TO THE FINANCIAL STATEMENTS (in thousands of Canadian dollars unless otherwise stated)
- 12 -
Note 7 Intangible assets under development
Note 8 Term loan
The Commission lent an additional $99.363 million to NWRP as a term loan on January 4, 2016. This term loan earns interest at a rate of prime plus six percent, compounded monthly, and will be repaid over 10 years starting one year after commercial start-up.
While loans to NWRP are outstanding APMC is entitled to a 25 percent voting interest on an Executive Leadership Committee, which is charged with overseeing and making decisions on the construction, start-up and operation of the Sturgeon Refinery.
Because of the 25 percent voting interest APMC has significant influence over NWRP. However the Commission has no equity ownership interest in NWRP. APMC will not equity account for the Sturgeon Refinery within the accounts of its financial statements.
Summarized audited financial information with respect to NWRP is presented below as of December 31, 2016. This information has been prepared in accordance with IFRS as issued by the IASB.
December 31, December 31,2016 2015
Balance, beginning of year 3,634$ 1,271$ Additions 2,396 2,363
Balance, end of year 6,030$ 3,634$
December 31, December 31,2016 2015
Balance, beginning of year 225,000$ 112,500$ Additions 99,363 112,500
Balance, end of year 324,363$ 225,000$
2016 2015Current assets 97,227$ 138,868$ Non-current assets 8,272,132$ 5,837,033$ Current liabilities 586,408$ 681,077$ Non-current liabilities 7,259,891$ 4,785,720$ Partners' equity 523,060$ 509,104$ Revenue -$ -$ Net (gain)/loss and comprehensive loss attributable to Partners (13,956)$ 88,094$
NWRP(100% Interest)
2016-17 Energy Annual Report 171

ALBERTA PETROLEUM MARKETING COMMISSION NOTES TO THE FINANCIAL STATEMENTS (in thousands of Canadian dollars unless otherwise stated)
- 13 -
Non-current assets primarily consist of property plant and equipment, which includes: engineering; procurement activities; site construction costs; module fabrication; capitalized interest, and other costs directly attributable to the project. Non-current liabilities chiefly comprise of senior secured long term notes, credit facilities (with both Canadian and U.S. dollar denominated debt) and subordinated debt.
The net gain and comprehensive gain attributable to Partners primarily contains foreign exchange gains offset by general and administrative costs.
Note 9 Accounts payable
Note 10 Due to the Department of Energy
Note 11 Short term debt
On January 4, 2016 the Commission borrowed $99.363 million of short term debt from Treasury Board and Finance at an interest rate of 0.715% due January 3, 2017.
On April 6, 2016 APMC replaced the original short term debt of $113.650 million with Treasury Board and Finance issued April 8, 2015 with new short term debt of $114.439 million at 0.709% interest, with a due date of April 5, 2017.
On December 23, 2016 APMC replaced the original short term debt of $113.719 million with Treasury Board and Finance issued December 31, 2015 with new short debt of $114.530 million at 0.745% interest, with a due date of December 22, 2017.
December 31, December 31,2016 2015
Trade payables 10,391$ 15,150$ GST 8,188 7,912
18,579$ 23,062$
December 31, December 31,2016 2015
Due to Department, beginning of year 54,471$ 123,545$ Amount to be transferred 497,687 701,898Amount remitted (484,349)$ (770,972)
Due to Department, end of year 67,809$ 54,471$
December 31, December 31,2016 2015
Balance, beginning of year 225,000$ 112,500$ Additions 99,363 112,500
Balance, end of year 324,363$ 225,000$
2016-17 Energy Annual Report172

ALBERTA PETROLEUM MARKETING COMMISSION NOTES TO THE FINANCIAL STATEMENTS (in thousands of Canadian dollars unless otherwise stated)
- 14 -
APMC’s intention is to borrow additional short term funds from Treasury Board and Finance when these amounts come due and repay the aggregated amounts (both principal and interest) over 10 years starting the year after the Sturgeon Refinery start-up. The timing of APMC repaying of this debt is expected to correspond to NWRP’s repayment of the term loan to the Commission (see Note 8).
Note 12 Financial instruments
The Commission’s financial instruments consist of cash and short term investments, accounts receivable, term loan, accounts payable, short term debt and amounts due to the Department. The Commission has classified cash and short term investments, accounts receivable and term loan as loans and receivables, and accounts payable, due to the Department and short term debt as financial liabilities at amortized cost. The Commission’s financial instruments are initially recorded at amortized cost using the effective interest method. The fair values of the financial instruments approximate their carrying values due to the short term maturities of those instruments.
The Commission is exposed to a variety of financial risks: market risk (interest rate risk), credit risk, and liquidity risk. The nature of the risks faced by the Commission and its policies for managing such risks remains unchanged from December 31, 2015.
(a) Interest rate risk
Interest rate risk is the risk that the future cash flows of a financial instrument will fluctuate because of changes in market interest rates. The Commission is subject to interest rate risk from fluctuations in rates on its cash balance (Note 6). For 2015 and 2016, a 100 basis point change would have a nominal effect on net income.
There is interest rate risk related to the term loans issued April 8, 2015, December 31, 2015 and January 4, 2016. APMC earns interest at a rate of prime plus 6%, compounded monthly. A 100 basis point rise in prime would have improved 2016 finance income by $3.8 million (2015 $2.5 million). A 100 basis point decline in prime would have reduced 2016 finance income by $3.8 million (2015 $2.5 million).
(b) Credit risk
Credit risk is the risk of financial loss to the Commission if a customer or party to a financial instrument fails to meet its contractual obligation and arises principally from the Commission’s cash and short term investments and accounts receivable. The maximum amount of credit risk exposure is limited to the carrying value of the balances disclosed in these financial statements.
The Commission manages its exposure to credit risk on cash and short term investments by placing these financial instruments with the Consolidated Cash Investment Trust Fund (Note 6).
A substantial portion of the Commission’s accounts receivable are with its agents and customers in the oil and gas industry and are subject to normal industry credit risk. The Commission monitors the credit risk and credit rating of all customers on a regular basis. Aged receivable balances are monitored and an allowance for credit losses is provided in the period in which losses become known. There were no balances past their contractual due date as at December 31, 2016 and December 31, 2015. Any credit losses on accounts receivable would be charged on to the Department.
APMC has issued three term loans totaling $324.363 million to NWRP on April 6, 2016, January 4, 2016 and December 23, 2016. NWRP is an investment grade counterparty. Bonds issued by NWRP received an A- credit rating from Standard and Poor’s. For NWRP, this is subordinated debt which ranks behind senior secured debt. A trust structure has been set up under which APMC receives monies owed under the term loan after amounts owed to senior debt holders and certain other amounts have been paid.
2016-17 Energy Annual Report 173

ALBERTA PETROLEUM MARKETING COMMISSION NOTES TO THE FINANCIAL STATEMENTS (in thousands of Canadian dollars unless otherwise stated)
- 15 -
(c) Liquidity risk
Liquidity risk is the risk that the Commission will not be able to meet its financial obligations as they come due. The Commission actively manages its liquidity through cash and receivables strategies, and the ability for the Commission to obtain financing through external banking credit facilities or obtaining borrowing from Treasury Board and Finance.
The term loan is structured so that APMC will receive repayments starting one year after commercial start-up of the Sturgeon Refinery. The outstanding amount owed will be repaid straight line over a 10 year period with accrued interest.
For the short term debt APMC intends to borrow additional funds from Treasury Board and Finance and then to match the repayment terms detailed for the term loan above.
(d) Offsetting financial assets and liabilities
The Commission enters into contracts with single shipper pipelines, where APMC sells oil to the carrier at the inlet and purchases the oil back at the terminus of the pipeline. The agreements are written to allow for offsetting of accounts receivable and accounts payable, which are presented on a net basis on the statement of financial position. The following table presents the recognized financial instruments that are offset as a result of netting arrangements and the intention to settle on a net basis with counterparties.
(e) Capital management
The capital structure includes the Commission’s net assets. The Commission’s objectives when managing capital are to safeguard the Commission’s ability to continue as a going concern and provide returns to the Department of Energy through responsible selling of conventional crude oil royalty volumes and its other business activities. The Commission does not have any externally imposed restrictions on its capital. There has been no change in the Commission’s capital management strategy.
Note 13 Commitments
Gross amounts of recognized financial
assets (liabilities)
Gross amounts of recognized financial
assets (liabilities) offset in the statement of financial
position
Net amounts of financial assets (liabilities) recognized in the
statement of financial position
Accounts receivable 140,768$ 62,686$ 78,082$ Accounts payable (Note 9) (82,440) (63,861) (18,579)Net position, December 31, 2016 58,328$ (1,175)$ 59,503$ Accounts receivable 125,058$ 53,690$ 71,368$ Accounts payable (Note 9) (79,218) (56,156) (23,062)Net position, December 31, 2015 45,840$ (2,466)$ 48,306$
2017 2018 2019 2020 2021 Beyond 2021 TotalNWRP Tolls -$ 490,000$ 710,000$ 890,000$ 960,000$ 22,905,000$ 25,955,000$Energy East Pipeline -$ -$ -$ -$ 40,000$ 4,560,000$ 4,600,000$
2016-17 Energy Annual Report174

ALBERTA PETROLEUM MARKETING COMMISSION NOTES TO THE FINANCIAL STATEMENTS (in thousands of Canadian dollars unless otherwise stated)
- 16 -
(a) NWRP TollsOn November 8, 2012 NWRP, announced the sanctioning of the construction of Phase 1 of the Sturgeon Refinery which it will build, own and operate. The Commission has entered into agreements whereby NWRP will process 37,500 bbls/day of bitumen (55,000 bbls/day of diluted bitumen) into refined products. NWRP will market the refined products (primarily ultra low sulphur diesel and low sulphur vacuum gas oil) on behalf of the Commission. There is risk to the Commission under these agreements pertaining to the price differential between bitumen supplied as feedstock and marketed refined products, relative to the costs of the processing toll.Under the processing agreement, the Commission is obligated to pay a monthly toll comprised of: senior debt; operating; class A subordinated debt; equity; and incentive fees on 37,500 barrels per day of bitumen (75% of the project’s feedstock) for 30 years. The toll includes flow through costs as well as costs related to facility construction, estimated to be $9.4 billion. The Commission has very restricted rights to terminate the agreement, and if it is terminated the Commission remains obligated to pay its share of the senior secured debt component of the toll incurred to date. The term of the commitment begins upon the commencement of commercial operations. No amounts have been paid under this agreement to date.The nominal tolls under the processing agreement assuming: a $9.4 billion Facility Capital Cost; market interest rates; and 2% operating cost inflation rate, are estimated above. The total estimated tolls have increased by $1.2 billion relative to 2015, due primarily to higher debt tolls related to higher Facility Capital Costs. As of the authorization date of these financial statements NWRP has issued $6.35 billion in bonds at lower than anticipated rates.No value has been ascribed to the anticipated refining profits available to APMC over the term of the agreement.
(b) Energy East Pipeline ProjectThe Commission has signed a TSA with Energy East Pipeline Limited Partnership (the “Carrier”) to purchase 100,000 barrels per day of firm capacity for a term of 20 years to transport volumes of crude oil. The construction of the pipeline is dependent upon obtaining regulatory approval. During 2016, the Canadian federal government extended the Energy East regulatory process timeline by nine months; six months was added to the National Energy Board (NEB) regulatory process and three months was added to the federal cabinet decision process. In addition the NEB regulatory process was put on hold in September when three panel members stepped down. All decisions made by the prior panel have since been voided and a new panel was appointed on January 7, 2017. As a result of the delays the new in service date has been extended to late 2021. Under the take-or-pay obligation, once required regulatory and commercial approvals are obtained, the Commission has an estimated updated minimum obligation to pay $4.6 billion ($4.6 billion –2015) in tolls over the 20 year term. Additional tolls will be incurred depending on the volumes transported through the pipeline.
(c) NWRP Term loanUnder the agreements related to the Facility Capital Costs for the Sturgeon Refinery, the financing structure is required to be 80% senior debt and 20% equity/subordinated debt. APMC is committed to provide 50% of the subordinated debt required to meet this test. A final reconciliation of the amount of subordinated debt required will be done six months after Commercial Operation Date. The calculation of the 80/20 ratio allows for the deduction of cumulative debt service costs (accrued interest) at this time, while prior to this time the calculation does not allow for the deduction of accumulated debt service costs, which could result in a temporary need for additional subordinated debt lending by APMC.We are forecasting APMC to provide NWRP an additional $95 million in 2017 ($21 million was provided on May 31, 2017) of subordinated debt. In 2018 we anticipate NWRP will repay $60 million to APMC as part of the final subordinated debt true-up six months after Commercial Operations Date.
2016-17 Energy Annual Report 175

ALBERTA PETROLEUM MARKETING COMMISSION NOTES TO THE FINANCIAL STATEMENTS (in thousands of Canadian dollars unless otherwise stated)
- 17 -
Note 14 Related party transactions
The Department pays the Commission a fee to market crude oil on its behalf under conventional crude oil marketing activities, reported as Marketing Fees within the Statement of Income and Comprehensive Income. The amounts owing to the Department have been disclosed in Note 10.
The Commission enters into transactions with the Department of Energy, a related party, in the normal course of business. The Department incurs costs for salaries on behalf of the Commission, as recognized under Wages and benefits (2016 $2,054, 2015 $2,088) and Software and maintenance (2016 $73, 2015 $163) within the statement of income and comprehensive income. In addition some of the Department salaries have been capitalized within Intangible assets under development (2016 $182, 2015 $252).
The Commission has outstanding short term debt with Treasury Board and Finance. For more details see Note 11.
The Board members of the Commission, executive management and their close family members are deemed to be related parties of the Commission. Transactions with close family members are immaterial; compensation for Board members and executive management is disclosed in Note 15.
Note 15 Salaries and benefit disclosure
Key management personnel include the Commission’s Chief Executive Officer, Executive Director Business Development and Director of Finance. The following amounts in the financial statements relating to board members and key management compensation in 2016 and 2015 are as follows:
(1) The Chair of the Board (Deputy Minister, Department of Energy) and one director (Assistant Deputy Minister, Department of Energy) are unpaid. There are two outside Board Members who receive an annual retainer and meeting fees.
(2) As per their Employment contracts the three key management personnel receive cash payments in lieu of benefits.
(3) Included in Other Non-cash benefits are employer contributions to Canada Pension Plan, Employment Insurance, reimbursement of parking and fitness facility membership costs.
2015Base
SalaryOther CashBenefits (2)
Other Non-cash
Benefits (3)
Total Total
Board Members (1) -$ 34$ -$ 34$ 34$
Chief Executive Officer 600$ 30$ 6$ 636$ 635$
Senior Management Executive Director, Business Development 420$ 25$ 9$ 454$ 453$ Director of Finance 234$ 25$ 9$ 268$ 267$
2016
2016-17 Energy Annual Report176

ALBERTA PETROLEUM MARKETING COMMISSION NOTES TO THE FINANCIAL STATEMENTS (in thousands of Canadian dollars unless otherwise stated)
- 18 -
On February 27, 2017 the Minister of Treasury Board and Finance announced that pursuant to the Reform of Agencies, Boards and Commissions Compensation Act, the salary of APMC’s Chief Executive Officer (CEO) would be reduced to a base salary range of $223 to $302. This change will be effective the earlier of June 30, 2018 (date of expiry of the current CEO’s contract) or when a new CEO is put in place. The contracts for the Executive Director, Business Development and the Director of Finance also expire on June 30, 2018. New contracts for APMC employees are expected to have base compensation below that of the CEO.
APMC’s current CEO tendered his resignation effective July 5, 2017.
Note 16 Subsequent events
Short term debt
On January 3, 2017 the Commission replaced its short term debt of $99.363 million originally issued January 4, 2016 with new short term debt of $100.074 million at 0.740% interest due January 2, 2018.
On April 5, 2017 APMC replaced its short term debt of $114.439 million originally issued April 6, 2016 with new short term debt of $115.248 million at 0.765% interest due April 4, 2018.
On May 31, 2017 APMC borrowed $21 million of short term debt from Treasury Board and Finance at an effective interest rate of 0.770 due May 30, 2018.
APMC’s intention is to borrow additional short term funds when these amounts come due and repay the aggregated amount straight line over 10 years starting the year after the Sturgeon Refinery start-up.
Term Loan to NWRP
On May 31, 2017 APMC issued an additional $21 million term loan to NWRP on the same terms and conditions as the term loans issued previously (see Note 8). These monies are being forwarded in response to a Drawdown Notice issued by NWRP on May 5, 2017, pursuant to the terms and conditions of the subordinated debt agreement.
2016-17 Energy Annual Report 177

2016-17 Energy Annual Report178

POST‑CLOSURE STEWARDSHIP FUND
FINANCIAL STATEMENTSFor the year ended March 31, 2017
Independent Auditor’s Report
Statement of Operations
Statement of Financial Position
Statement of Change in Net Financial Assets
Statement of Cash Flows
Notes to Financial Statements
2016-17 Energy Annual Report 179

2016-17 Energy Annual Report180
Independent Auditor’s Report
To the Minister of Energy
Report on the Financial Statements
I have audited the accompanying financial statements of the Post-Closure Stewardship Fund, which comprise the statement of financial position as at March 31, 2017 and the statements of operations, change in net financial assets and cash flows for the year then ended, and a summary of significant accounting policies and other explanatory information.
Management’s Responsibility for the Financial Statements
Management is responsible for the preparation and fair presentation of these financial statements in accordance with Canadian public sector accounting standards, and for such internal control as management determines is necessary to enable the preparation of financial statements that are free from material misstatement, whether due to fraud or error.
Auditor’s Responsibility
My responsibility is to express an opinion on these financial statements based on my audit. I conducted my audit in accordance with Canadian generally accepted auditing standards. Those standards require that I comply with ethical requirements and plan and perform the audit to obtain reasonable assurance about whether the financial statements are free from material misstatement.
An audit involves performing procedures to obtain audit evidence about the amounts and disclosures in the financial statements. The procedures selected depend on the auditor’s judgment, including the assessment of the risks of material misstatement of the financial statements, whether due to fraud or error. In making those risk assessments, the auditor considers internal control relevant to the entity’s preparation and fair presentation of the financial statements in order to design audit procedures that are appropriate in the circumstances, but not for the purpose of expressing an opinion on the effectiveness of the entity’s internal control. An audit also includes evaluating the appropriateness of accounting policies used and the reasonableness of accounting estimates made by management, as well as evaluating the overall presentation of the financial statements.
I believe that the audit evidence I have obtained is sufficient and appropriate to provide a basis for my audit opinion.
Opinion
In my opinion, the financial statements present fairly, in all material respects, the financial position of the Post-Closure Stewardship Fund as at March 31, 2017, and the results of its operations, its changes in net financial assets and its cash flows for the year then ended in accordance with Canadian public sector accounting standards.
June 6, 2017
Edmonton, Alberta
Original signed by Merwan N. Saher, FCPA, FCA Auditor General

POST-CLOSURE STEWARDSHIP FUNDSTATEMENT OF OPERATIONSYear ended March 31, 2017(in thousands)
2016Budget Actual Actual
RevenueInjection Levy (Note 3) 230$ 264$ 148$
Net Operating Results 230$ 264$ 148$
The accompanying notes are part of these financial statements.
2017
2016-17 Energy Annual Report 181

POST-CLOSURE STEWARDSHIP FUNDSTATEMENT OF FINANCIAL POSITIONAs at March 31, 2017(in thousands)
2017 2016
AssetsCash (Note 4) 272$ -$ Accounts Receivable 140 148
Net Assets 412$ 148$
Net Assets at Beginning of Year 148$ -$ Annual Operating Results 264 148 Net Assets at End of Year 412$ 148$
The accompanying notes are part of these financial statements.
2016-17 Energy Annual Report182

POST-CLOSURE STEWARDSHIP FUNDSTATEMENT OF CHANGE IN NET FINANCIAL ASSETSYear ended March 31, 2017(in thousands)
2016Budget Actual Actual
Annual Operating Results 230$ 264$ 148$
Increase in Net Assets 230$ 264$ 148$ Net Assets at Beginning of Year - 148 - Net Assets at End of Year 230$ 412$ 148$
The accompanying notes are part of these financial statements.
2017
2016-17 Energy Annual Report 183

POST-CLOSURE STEWARDSHIP FUNDSTATEMENT OF CASH FLOWSYear ended March 31, 2017(in thousands)
2017 2016
Operating TransactionsNet Operating Results 264$ 148$ (Increase) in Accounts Receivable 8 (148)
Increase (Decrease) in Cash and Cash Equivalents 272$ -$ Cash and Cash Equivalents at Beginning of Year - - Cash and Cash Equivalents at End of Year 272$ -$
The accompanying notes are part of these financial statements.
2016-17 Energy Annual Report184

POST-CLOSURE STEWARDSHIP FUNDNOTES TO FINANCIAL STATEMENTS March 31, 2017(in thousands)
Note 1 Authority and Purpose The Post-Closure Stewardship Fund operates under the Mines and Minerals Act (MMA), chapter M-17.
The MMA provides an option to the Minister to issue a Closure Certificate to an approved operator after the final injection ofcaptured carbon dioxide has been completed and after satisfying the closure period that is to be specified in regulations. Thereis no liability to the Fund until such a Closure Certificate has been issued.
The Fund was established to address certain long-term liabilities that may arise from approved projects for the injection of captured carbon dioxide into subsurface reservoirs for sequestration subsequent to the issuance of a Closure Certificate.The funds have been internally restricted under Section 122 of the MMA and is not available for government's general use.Any income earned on the Fund is likewise restricted in its use.
The Injection Levy rate(s) are set through Ministerial Orders. These rates are reviewed every three years at a minimum, andwill be amended if necessary.
Note 2 Basis of Financial ReportingThese financial statements are prepared in accordance with Canadian public sector accounting standards.
RevenuesRevenues are reported on the accrual basis of accounting. The volume of carbon dioxide injected is based upon reportedinjection provided by the operator. Third party verification on the volume of injection will take place in the month of October,for injection to September 30. The Injection Levy is calculated based on the net present value of estimated future costs arising from the injection.
Valuation of Financial AssetsFinancial assets are assets that could be used to discharge existing liabilities or finance future operations and are not forconsumption in the normal course of operations.
Note 3 Injection LevyThe Injection Levy is set aside for Post Closure Care of the injection site. Post Closure Care occurs after the issuance of theClosure Certificate and includes the continual monitoring costs of the captured carbon dioxide injection sites and anyremediation of the sites that may be required.
At March 31, 2017, there is only one approved carbon dioxide injection site. The estimated present value of the future costsfor this site, based on modeling of potential requirement under current technology, is $4.7 million. Currently, less than 5% ofthe site's capacity has been used. The project is expected to inject for a 25-year period.
As the site remains active and no Closure Certificate has been issued, there is no expectation of any withdrawals from theFund at this time.
Note 4 CashCash is represented by funds held within the General Revenue Fund on behalf of the Post Closure Stewardship Fund. Thefund earns interest at Prime less 2.25%.
Note 5 Approval of Financial StatementsThe financial statements were approved by the Deputy Minister and the Senior Financial Officer of the Department of Energy.
2016-17 Energy Annual Report 185

2016-17 Energy Annual Report186

2016 Annual Report
EXCERPTED PAGES 26‑56
2016-17 Energy Annual Report 187

BALANCING POOL
FINANCIAL STATEMENTSFor the year ended March 31, 2017
Independent Auditor’s Report
Statement of Financial Position
Statement of Loss and Comprehensive Loss
Statement of Cash Flows
Notes to Financial Statements
2016-17 Energy Annual Report188

PricewaterhouseCoopers LLP 111 – 5th Avenue SW, Suite 3100, Calgary, Alberta, Canada, T2P 5L3 T: +1 403 509 7500, F: +1 403 781 1825
PwC refers to PricewaterhouseCoopers LLP, an Ontario limited liability partnership.
April 26, 2017
Independent Auditor’s Report
To the members of the Board of the Balancing Pool
We have audited the accompanying financial statements of the Balancing Pool, which comprise the statements of financial position as at December 31, 2016 and December 31, 2015 and the statements of loss and comprehensive loss and cash flows for the years then ended, and the related notes, which comprise a summary of significant accounting policies and other explanatory information.
Management’s responsibility for the financial statements Management is responsible for the preparation and fair presentation of these financial statements in accordance with International Financial Reporting Standards, and for such internal control as management determines is necessary to enable the preparation of the financial statements that are free from material misstatement, whether due to fraud or error.
Auditor’s responsibility Our responsibility is to express an opinion on these financial statements based on our audits. We conducted our audits in accordance with Canadian generally accepted auditing standards. Those standards require that we comply with ethical requirements and plan and perform the audit to obtain reasonable assurance about whether the financial statements are free from material misstatement.
An audit involves performing procedures to obtain audit evidence about the amounts and disclosures in the financial statements. The procedures selected depend on the auditor’s judgment, including the assessment of the risks of material misstatement of the financial statements, whether due to fraud or error. In making those risk assessments, the auditor considers internal control relevant to the entity’s preparation and fair presentation of the financial statements in order to design audit procedures that are appropriate in the circumstances, but not for the purpose of expressing an opinion on the effectiveness of the entity’s internal control. An audit also includes evaluating the appropriateness of accounting policies used and the reasonableness of accounting estimates made by management, as well as evaluating the overall presentation of the financial statements.
We believe that the audit evidence we have obtained in our audits is sufficient and appropriate to provide a basis for our audit opinion.
Opinion In our opinion, the financial statements present fairly, in all material respects, the financial position of the Balancing Pool as at December 31, 2016 and December 31, 2015 and its financial performance and its cash flows for the years then ended in accordance with International Financial Reporting Standards.
Chartered Professional Accountants
Balancing Pool26 2016 Annual Report
2016-17 Energy Annual Report 189

Statements of Financial Position
(in thousands of Canadian dollars) 2016 2015
AssetsCurrent assetsCash and cash equivalents 16,078 5,073
Trade and other receivables (Note 5) 77,157 16,093
Current portion of Hydro power purchase arrangement (Note 8 b i) - 26,147
93,235 47,313
Long-term receivables (Note 6) 7,824 -Investments (Note 9) 15,684 704,719
Property, plant and equipment (Note 10 a) 57 330,945
Hydro power purchase arrangement (Note 8 b i) 48,484 216,486
Intangible assets (Note 7) 149,289 -
Total Assets 314,573 1,299,463
LiabilitiesCurrent liabilitiesTrade and other payables (Note 11) 372,123 74,580
Current portion of Hydro power purchase arrangement (Note 8 b i) 10,053 -
Current portion of power purchase arrangement lease obligation (Note 10 b) - 61,524
Current portion of Small Power Producer contracts (Note 8 b ii) 5,902 5,834
Current portion of reclamation and abandonment provision (Note 12) 3,671 2,925Current portion of other long-term obligations (Note 13) 1,446,361 44,200
1,838,110 189,063
Genesee power purchase arrangement lease obligation (Note 10 b) - 250,987
Small Power Producer contracts (Note 8 b ii) 5,437 5,534
Reclamation and abandonment provision (Note 12) 26,361 26,864
Other long-term obligations (Note 13) 411,453 52,500
Total Liabilities 2,281,361 524,948
Net assets (liabilities) attributable to the Balancing Pool deferral account (Note 1, 14) (1,966,788) 774,515
Contingencies and commitments (Note 15)
Subsequent events (Note 18)
Balancing Pool 27
Robert Bhatia Greg PollardChair Audit and Finance Committee Chair
On behalf of the Balancing Pool:
The accompanying notes are an integral part of these financial statements.
2016 Annual Report
2016-17 Energy Annual Report190
Original signed by Robert Bhatia, Chair Original signed by Greg Pollard, Audit and Finance Committee Chair

Statements of Loss and Comprehensive Loss
(in thousands of Canadian dollars) 2016 2015
RevenuesSale of electricity 463,923 151,083
Sale of generating capacity and termination revenue (Note 15) 28,743 71,510
Changes in fair value of investments (Note 9) (6,572) 35,535
Investment income – interest and dividends 4,836 26,555
Payments (refunds) in lieu of tax (Note 15, 18) (133,349) 3,904
357,581 288,587
ExpensesPower purchase arrangement provision (Note 13) 1, 762,437 96,700
Cost of sales (Note 10 a, 16) 639,663 321,166
Impairment loss (Note 10 a) 264,678 221,960
Changes in fair value of Hydro power purchase arrangement (Note 8 b i) 222,670 81,286
Mandated costs (Note 17) 6,155 5,958
Changes in fair value of Small Power Producer contracts (Note 8 b ii) 6,048 4,341
General and administrative 3,814 2,568
Force majeure costs 2,110 12,793
Investment management costs 534 2,352
Reclamation and abandonment provision (Note 12) (75) 2,764
2,908,034 751,888
Income from operating activities (2,550,453) (463,301)
Other income (expense)Net (losses) gains on financial derivatives (Note 8 b iii) - 271
Finance expense (Note 12) (804) (1,195)
Other income 121 116
(683) (808)
Change in net liabilities attributable to the Balancing Pool deferral account (Note 13) (2,551,136) (464,109)
The accompanying notes are an integral part of these financial statements.
Balancing Pool28 2016 Annual Report
2016-17 Energy Annual Report 191

Statements of Cash Flows
(in thousands of Canadian dollars) 2016 2015
Cash flow provided by (used in)
Operating activitiesChange in net liabilities attributable to the Balancing Pool deferral account (2,551,136) (464,109)
Items not affecting cash
Amortization, depreciation and impairment (Note 10 a) 330,888 332,555
Reclamation and abandonment provision (Note 12) (75) 2,764
Power purchase arrangement provision (Note 13) 1,761,114 96,700
Fair value changes on Small Power Producer contracts (Note 8 b ii) 6,048 4,341
Fair value changes on Hydro power purchase arrangement (Note 8 b i) 222,670 81,286
Fair value changes on financial investments (Note 9) 121,707 54,087
Finance expense (Note 12) 804 1,195
Reclamation and abandonment expenditures (Note 12) (486) (4,047)
Net change in other assets:
Intangible assets (Note 7) (139,837) -Long-term receivable (Note 6) (7,824) -
Power purchase arrangement lease obligation (Note 10 b) (250,987) -
Net change in non-cash working capital:
Trade and other receivables (61,064) 2,965Trade and other payables 297,543 2,227
Net cash provided by (used in) operating activities (270,635) 109,964
Investing activitiesInterest, dividends and other gains (119,884) (116,124)
Sale of investments (Note 9) 687,212 332,000
Purchase of intangible assets (Note 7) (9,452) -
Purchase of property, plant and equipment (Note 10 a) - (56)
Net cash provided by investing activities 557,876 215,820
Financing activities
Hydro power purchase arrangement net (payments) receipts (Note 8 b i) (18,468) 33,866
Payment of power purchase arrangement lease obligation (Note 10 b) (61,524) (61,145)
Small Power Producer contracts net (payments) receipts (Note 8 b ii) (6,077) (5,960)
Payment of the Consumer Allocation (Note 14) (190,167) (324,113)
Net cash used in financing activities (276,236) (357,352)
Change in cash and cash equivalents 11,005 (31,568)
Cash and cash equivalents, beginning of year 5,073 36,641
Cash and cash equivalents, end of year 16,078 5,073
The accompanying notes are an integral part of these financial statements.
Balancing Pool 292016 Annual Report
2016-17 Energy Annual Report192

Notes to Financial Statements
1. Reporting Entity and Nature of Operations
Formation and Duties of the Balancing Pool
The Balancing Pool was created by the Government of Alberta to help manage certain assets, liabilities, revenues and expenses arising from the transition to competition in Alberta’s electric industry. The Balancing Pool was originally established in 1998 as a separate financial account of the Power Pool Council (the “Council”) and commenced operations in 1999. The Council was a statutory corporation established under the Electric Utilities Act of Alberta (1995). The requirement to establish the Balancing Pool was set out in the Balancing Pool Regulation.
With the proclamation of the Electric Utilities Act (2003) (the “EUA”) on June 1, 2003, the Balancing Pool was established as a separate statutory corporation (the “Corporation”). The assets and liabilities of the Council that related to the duties, responsibilities and powers of the Balancing Pool were transferred to the Balancing Pool.
Under the EUA the Corporation is required to operate with no profit or loss (Note 14) and no share capital for the Corporation has been issued. The Balancing Pool Board consists of individual members who are independent of persons having a material interest in the Alberta electric industry. The members of the Board are appointed by the Minister of Energy of the Government of Alberta.
The Balancing Pool is required to respond to certain extraordinary events during the operating period of all of the Power Purchase Arrangements (“PPAs”) such as force majeure, unit destruction, Buyer or Owner default or termination of a PPA. In situations resulting in termination of a PPA by a Buyer, the Balancing Pool will assume all remaining rights and obligations pursuant to the PPA assuming the PPA continues. The Balancing Pool acted as Buyer of the PPAs that were not sold at the public auction held by the Government of Alberta in August 2000, assuming all rights and obligations of a Buyer of these PPAs. Under the EUA the Balancing Pool is required to manage generation assets in a commercial manner.
The head office and records of the Balancing Pool are located at suite 2350, 330 - 5th Avenue S.W., Calgary, Alberta, Canada.
Activities of the Balancing Pool
The initial allocation of assets and liabilities to the Balancing Pool was charged to a deferral account. Differences between annual revenues and expenditures are also charged or credited to the Balancing Pool deferral account.
The EUA requires that the Balancing Pool forecast its revenues and expenses. Any excess or shortfall of funds in the accounts is to be allocated to, or provided by, electricity consumers over time.
Following the PPA terminations, in 2016 the Government of Alberta enacted changes to the EUA which allows the Alberta Treasury Board and Finance to make loans to the Balancing Pool at the recommendation of the Minister of Energy and to guarantee the Balancing Pool’s obligations. The Government of Alberta also enacted changes in 2016 to the Balancing Pool Regulation which stipulates the Consumer Collection for 2017 is set at $65 million for the year. Any cash shortfall that the Consumer Collection is unable to satisfy will be financed by funds obtained through the loan agreement with the Government of Alberta and recovered from electricity consumers over the period of January 1, 2021 to December 31, 2030 (Note 18).
Balancing Pool30 2016 Annual Report
2016-17 Energy Annual Report 193

Revenues
The Balancing Pool has four primary sources of revenue:
i) Sale of electricity and generating capacity
The Balancing Pool earns revenue from the sale of electricity sourced from the following PPAs: Genesee, Battle River 5, Sheerness, Keephills, Sundance A, Sundance B and Sundance C.
The Balancing Pool earns revenue from the sale of generating capacity from the sale of two 100-megawatt (“MW”) strip contracts for the associated offer rights and energy output of the Genesee PPA. The contracts commenced on November 1, 2014 and were expected to expire on October 31, 2017.
See Note 15 for events related to the strip contract terminations.
Electricity that is not otherwise contracted is sold into the spot market. Ancillary services from the Genesee PPA are sold to the Alberta Electric System Operator (“AESO”) through a competitive exchange.
ii) Hydro Power Purchase Arrangement (“Hydro PPA”)
Pursuant to Section 85 of the EUA, the Balancing Pool holds the Hydro PPA. As such, the Balancing Pool has retained the right to the market value of the associated electricity and is responsible for the PPA obligations from certain hydro plants in the province of Alberta. The cash flow associated with the Hydro PPA is calculated based on the electricity market price multiplied by a notional amount of production as outlined in the PPA less PPA obligations. The net present value of these estimated payments is recorded as an asset and any revaluation adjustment is included in net results of loss.
iii) Investment income and changes in fair value of investments
Cash, cash equivalents and investments held by the Balancing Pool generate investment income consisting of interest, dividends and capital gains and losses.
iv) Payments (refunds) in lieu of tax (“PILOT”)
Pursuant to Section 147 of the EUA, the Balancing Pool collects (refunds) a notional amount of tax from electricity companies controlled by municipal entities that are active in Alberta’s competitive electricity market that are as a result of subsection 149(1) of the Income Tax Act (Canada) otherwise exempt from the payment of tax under that Act or the Alberta Corporate Tax Act. The Balancing Pool does not calculate instalment payments or refunds and it does not audit PILOT filings. PILOT instalments are calculated by the payer and PILOT filings are subject to audit by Alberta Tax and Revenue Administration.
Balancing Pool 312016 Annual Report
2016-17 Energy Annual Report194

Expenses
The Balancing Pool has expenditures, which include:
i) Cost of sales
The Balancing Pool is obligated to pay certain fixed and variable costs to the Owners of the various generation assets that are operated under the terms of the following PPAs: Genesee, Battle River 5, Sheerness, Keephills, Sundance A, Sundance B and Sundance C.
ii) Small Power Producer (“SPP”) contracts
Under the provisions of the Small Power Research and Development Act, public utilities were required to enter into production contracts with small power producers who own and operate eligible power production facilities.
Under the provisions of the Independent Power and Small Power Regulation, the Balancing Pool must pay to the public utility any deficit or receive any surplus realized by the public utility from the production contracts. The net present value of these estimated payments is recorded as a liability and any revaluation adjustment is included in net results of income.
iii) Other costs
Under the terms of Government legislation, the Balancing Pool is obligated to make payments to certain entities for such matters as reclamation and abandonment and force majeure. The Minister of Energy may direct the Balancing Pool to fund specific payments under Section 148 of the EUA, which amounts are included in mandated costs.
2. Basis of Presentation
These financial statements for the year ended December 31, 2016 have been prepared by management in accordance with International Financial Reporting Standards (“IFRS”) as issued by the International Accounting Standards Board (”IASB”) and include as comparative information the year ended December 31, 2015.
These financial statements were authorized and approved for issue by the Board of the Balancing Pool on April 26, 2017.
3. Summary of Significant Accounting Policies
The significant accounting policies used in the preparation of these financial statements are as follows:
Basis of Measurement
These financial statements have been prepared on a historical cost convention, except for the revaluation of certain financial instruments and investments, which are measured at fair value.
Balancing Pool32 2016 Annual Report
2016-17 Energy Annual Report 195

Revenue Recognition
(a) Sale of electricity and generating capacity
Revenues from the sale of electricity, generating capacity and ancillary services are recognized on an accrual basis in the period in which generation occurred. Sale of electricity and generating capacity is measured at the fair value of the consideration received or receivable.
(b) Hydro Power Purchase Arrangement
The Hydro PPA is recorded at the present value of the estimated future net receipts under this PPA. The increase in value of this asset with the passage of time (accretion) is recognized on an accrual basis. Any change in valuation as a result of changes in underlying assumptions is recognized in income from operating activities.
(c) Small Power Producer contracts
SPP contracts are recorded at the present value of the estimated future net payments to be received (or paid) under these contracts. The change in value of this liability with the passage of time (accretion) is recognized on an accrual basis. Any change in valuation as a result of changes in underlying assumptions is recognized in income from operating activities.
(d) Investment income and changes in fair value of investments
Investment income from interest and dividends is recorded on an accrual basis when there is reasonable assurance as to its measurement and collectability. Investment income also includes realized and unrealized gains and losses on investments sold and realized foreign currency exchange rate gains and losses on sale of foreign investments excluding fund management fees.
(e) Payments (refunds) in lieu of tax
PILOT funds are accrued based on instalments received from or refunds paid to a municipal entity for a particular tax year. PILOT payments are calculated by the municipal entities and are subject to assessment and audit by Alberta Tax and Revenue Administration. Adjustments, if any, arising from audits are recorded in the current year.
Income Taxes
No provision has been made for current or deferred income tax as the Balancing Pool is exempt from Federal and Provincial tax.
Cash and Cash Equivalents
Cash and cash equivalents are comprised of cash on deposit at the bank.
Trade and Other Receivables and Prepaid Expenses
Trade and other receivables are classified as loans and receivables and are measured at amortized cost less any impairment.
Balancing Pool 332016 Annual Report
2016-17 Energy Annual Report196

Intangible Assets (Emission Credits)
Emission credits, which have been purchased or acquired through PPA negotiated settlements and held for compliance purposes, are recorded by the Balancing Pool as indefinite life intangible assets. These assets are recognized initially at fair value based upon a market price. Emission credits held for compliance purposes are not amortized, but are expensed as the associated benefits are realized.
The emission credits will be used to satisfy future environmental compliance obligations of the PPAs associated with the Specified Gas Emitters Regulation and the Climate Leadership Plan.
Long-Term Receivables
Cash settlement amounts due from a former PPA counterparty are accounted as long-term receivables with fixed payments receivable on each of December 31, 2018, 2019 and 2020. These assets were recognized initially at fair value. After initial recognition they are measured at amortized cost using the effective interest method less any impairment losses. The effective interest method calculates the amortized cost of a financial asset and allocates the interest income over the term of the financial asset using the effective interest rate.
Further emission credits due from a former PPA counterparty expected to be received by December 31, 2020 are recognized as long-term receivables (see Note 13 and 15).
Hydro Power Purchase Arrangement and Small Power Producer Contracts
The Hydro PPA and SPP contracts are derivative financial instruments classified as held for trading. They are recorded as of the period end date at their fair value. Fair value is measured as the present value of the estimated future net payments to be received (or paid) under the contracts and reflects management’s best estimate based on generally accepted valuation techniques and supported by observable market prices and rates when available. Fair value for these contracts is based on forecasting future prices using a merit order dispatch model.
Electricity Price Risk Management and Financial Instruments – Risk Management Asset and Liabilities
The Balancing Pool may utilize swap contracts to manage its exposure to electricity price fluctuations which require payments to (or receipts from) counterparties based on the differential between fixed and floating prices for electricity and other contractual arrangements. The estimated fair value of all derivative instruments is based on reported values in the electricity forward market.
Derivative financial instruments are classified as held for trading and are recorded at fair value. All changes in fair value are included in results of income.
Balancing Pool34 2016 Annual Report
2016-17 Energy Annual Report 197

Investments
The Corporation has designated its fixed income and equity securities upon initial recognition at fair value through profit and loss in accordance with IAS 39, Financial Instruments: Recognition and Measurement. They are recorded at estimated fair value, as of the period end date, measured based on the bid price in active markets. Unrealized gains or losses resulting from changes in fair value are recorded in income.
Property, Plant and Equipment (“PP&E”)
PP&E are stated at cost less accumulated depreciation and accumulated impairment losses. Cost includes expenditure directly attributable to the acquisition of the asset. When parts of an item of PP&E have different useful lives, they are accounted for as separate items (major components) of property, plant and equipment. Gains and losses on disposal of an item of property, plant, and equipment are determined by comparing the proceeds from disposal with the carrying amount of PP&E, and are recognized within other income in profit and loss. The major categories of PP&E are depreciated on a straight-line basis and include:
Genesee PPA 10 yearsOffice Equipment 3 – 5 years
Genesee Power Purchase Arrangement and Related Finance Lease Obligation
The Genesee PPA transfers to the Balancing Pool substantially all the benefits and some of the risks of ownership and therefore the arrangement is classified as a finance lease, with the Corporation as the lessee. A lease is considered to be a finance lease when the terms of the lease transfer substantially all of the risks and rewards incidental to ownership of the leased assets to the lessee. Finance leases are capitalized at the lease’s commencement at the fair value of the leased property.
Each lease payment is allocated between the liability and expenses.
The capitalized asset is included in PP&E at an amount not exceeding the estimated net future cash flows arising from operations over the remaining life of the PPA. The value of the Genesee PPA is stated at cost, less accumulated depreciation and amortization.
The Genesee finance lease obligation is now recognized and reported as part of other long-term obligations. See Notes 10 and 13 for events related to impairment and recognition of an onerous contract for the Genesee PPA.
Balancing Pool 352016 Annual Report
2016-17 Energy Annual Report198

Impairment – Non-Financial Assets
For the purpose of impairment testing, non-financial assets are grouped together into the smallest group of assets that generate cash inflows from continuing use that are largely independent of the cash inflows of other assets or groups of assets – a cash generating unit (“CGU”).
The carrying amounts of non-financial assets are reviewed at each reporting date to determine whether there is any indication of impairment, such as decreased forward electricity prices. If any such indication exists, then the amount recoverable from the asset is estimated. The recoverable amount is the greater of the value in use or fair value less costs to dispose.
Value in use is based on the estimated net future cash flows discounted to their present value. The discounted cash flow is determined using a discount rate that reflects current market assessments of the time value of money and the risks specific to the asset. The recoverable amount is generally computed by reference to the present value of the future cash flows. An impairment loss is recognized if the carrying amount of an asset or its CGU exceeds its estimated recoverable amount. Impairment losses are recognized in the Statement of Loss and Comprehensive Loss.
Impairment losses recognized in prior years are reassessed at each reporting date for any indications that the loss has decreased or no longer exists. An impairment loss is reversed if there has been a change in the estimates used to determine the recoverable amount. An impairment loss is reversed only to the extent that the asset’s carrying amount does not exceed the carrying amount that would have been determined, net of depreciation and amortization, if no impairment loss had been permitted to be recognized.
Impairment – Financial Assets
Financial assets have been assessed for indicators of impairment at the end of each reporting period. Receivables are carried at amortized cost. The amount of any impairment loss is recognized as the difference between the asset’s carrying amount and the present value of estimated future cash flows, discounted at the asset’s original effective interest rate. Any impairment loss is recognized in the Statement of Loss and Comprehensive Loss. Should the amount of the estimated impairment loss increase or decrease following a subsequent event, the previously recognized impairment loss is adjusted through the Statement of Loss and Comprehensive Loss.
Reclamation and Abandonment Obligations
Reclamation and abandonment obligations include legal obligations requiring the Balancing Pool to fund the decommissioning of tangible long-lived assets such as generation and production facilities. A provision is made for the estimated cost of site restoration.
Reclamation and abandonment obligations are measured as the present value of management’s best estimate of expenditures required to settle the present obligation at the period end date. Subsequent to the initial measurement, the obligations are adjusted at the end of each period to reflect the passage of time and changes in the estimated future cash flows underlying the obligation. The increase in the provision due to the passage of time is recognized as a finance expense. Increases / decreases due to changes in the estimated future cash flows are expensed. Actual costs incurred upon settlement of the reclamation and abandonment obligations are charged against the provision to the extent the provision was established.
Balancing Pool36 2016 Annual Report
2016-17 Energy Annual Report 199

The Balancing Pool’s estimates of reclamation and abandonment obligations are based on reclamation standards that meet current regulatory requirements. The estimate of the total liability of future site restoration costs may be subject to change based on amendments to laws and regulations. Accordingly, the amount of the liability will be subject to re-measurement at each period end date.
The Balancing Pool has recorded an estimate of the cost to remediate certain Isolated Generating Unit sites in Alberta. Actual expenditures incurred to remediate these sites will reduce this liability and any increase in this liability will be charged to expense when estimated costs are known to exceed the remaining liability balance.
An amount has also been provided for the decommissioning of the H.R. Milner generating station which is being accreted annually; revisions to this estimate will be charged or credited to net results of income (loss).
Pursuant to Section 7 of the Power Purchase Arrangements Regulation, the Owner of a generating unit who applies to the Alberta Utilities Commission (“AUC”) to decommission a unit within one year of the termination of the PPA is entitled to receive from the Balancing Pool the amount by which the decommissioning costs exceed the amount the Owner collected from consumers before January 1, 2001 and subsequently through a PPA, provided that the unit has ceased generating electricity and subject to AUC approval. This provision does not apply to generation units that are decommissioned after December 31, 2018.
The reclamation and abandonment provision includes an estimate of the expected future costs associated with PPA decommissioning costs. Any underfunded decommissioning liabilities are passed to the Balancing Pool in circumstances where a plant Owner elects to discontinue operations and decommission the respective plant following a PPA termination or PPA expiry.
The discount rate used to value these liabilities is based upon the risk-free rate and adjusted for other risks associated with these liabilities.
Provisions for Onerous Contracts (Other long-term obligations)
A provision for an onerous contract is recognized when the unavoidable cost of meeting the obligations under the contract exceed the economic benefits expected to be derived from the contract. The provision is measured at the lower of the expected cost of terminating the contract and the expected cost of continuing performance under the contract. The Balancing Pool has recognized onerous contract provisions for the following PPAs: Battle River 5, Sheerness, Sundance A, Sundance B, Sundance C, Keephills and Genesee. The provisions for onerous contracts have been classified as part of other long-term obligations on the Statements of Financial Position.
The discount rate used to measure these liabilities is based upon the risk-free rate. Where the Balancing Pool expects some or all of the provision will be reimbursed by a third party, the expense relating to any provision is presented in the Statement of Loss and Comprehensive Loss net of the reimbursement. The expected reimbursement receivable is recognized as an asset if it is virtually certain that the reimbursement will be received and the amount receivable can be measured reliably.
Balancing Pool 372016 Annual Report
2016-17 Energy Annual Report200
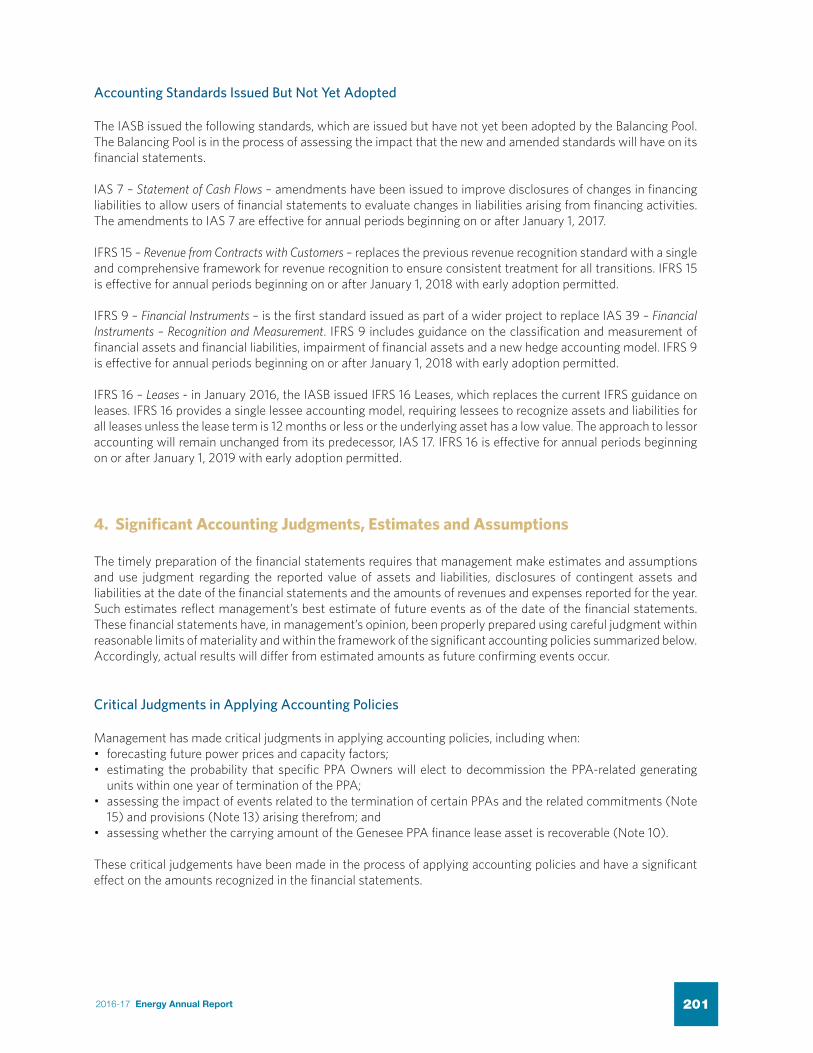
Accounting Standards Issued But Not Yet Adopted
The IASB issued the following standards, which are issued but have not yet been adopted by the Balancing Pool. The Balancing Pool is in the process of assessing the impact that the new and amended standards will have on its financial statements.
IAS 7 – Statement of Cash Flows – amendments have been issued to improve disclosures of changes in financing liabilities to allow users of financial statements to evaluate changes in liabilities arising from financing activities. The amendments to IAS 7 are effective for annual periods beginning on or after January 1, 2017.
IFRS 15 – Revenue from Contracts with Customers – replaces the previous revenue recognition standard with a single and comprehensive framework for revenue recognition to ensure consistent treatment for all transitions. IFRS 15 is effective for annual periods beginning on or after January 1, 2018 with early adoption permitted.
IFRS 9 – Financial Instruments – is the first standard issued as part of a wider project to replace IAS 39 – Financial Instruments – Recognition and Measurement. IFRS 9 includes guidance on the classification and measurement of financial assets and financial liabilities, impairment of financial assets and a new hedge accounting model. IFRS 9 is effective for annual periods beginning on or after January 1, 2018 with early adoption permitted.
IFRS 16 – Leases - in January 2016, the IASB issued IFRS 16 Leases, which replaces the current IFRS guidance on leases. IFRS 16 provides a single lessee accounting model, requiring lessees to recognize assets and liabilities for all leases unless the lease term is 12 months or less or the underlying asset has a low value. The approach to lessor accounting will remain unchanged from its predecessor, IAS 17. IFRS 16 is effective for annual periods beginning on or after January 1, 2019 with early adoption permitted.
4. Significant Accounting Judgments, Estimates and Assumptions
The timely preparation of the financial statements requires that management make estimates and assumptions and use judgment regarding the reported value of assets and liabilities, disclosures of contingent assets and liabilities at the date of the financial statements and the amounts of revenues and expenses reported for the year. Such estimates reflect management’s best estimate of future events as of the date of the financial statements. These financial statements have, in management’s opinion, been properly prepared using careful judgment within reasonable limits of materiality and within the framework of the significant accounting policies summarized below. Accordingly, actual results will differ from estimated amounts as future confirming events occur.
Critical Judgments in Applying Accounting Policies
Management has made critical judgments in applying accounting policies, including when:• forecasting future power prices and capacity factors;• estimating the probability that specific PPA Owners will elect to decommission the PPA-related generating
units within one year of termination of the PPA;• assessing the impact of events related to the termination of certain PPAs and the related commitments (Note
15) and provisions (Note 13) arising therefrom; and• assessing whether the carrying amount of the Genesee PPA finance lease asset is recoverable (Note 10).
These critical judgements have been made in the process of applying accounting policies and have a significant effect on the amounts recognized in the financial statements.
Balancing Pool38 2016 Annual Report
2016-17 Energy Annual Report 201

Key Sources of Estimation Uncertainty
Since the determination of certain assets, liabilities, revenues and expenses are dependent upon and determined by future events, the preparation of these financial statements requires the use of estimates and assumptions. These estimates and assumptions have been made using careful judgment. Actual results are likely to differ from the results derived using these estimates. The following are items that have been derived using key assumptions concerning future outcomes and subject to several other key sources of estimation uncertainty. As a consequence, there is a significant risk of a material adjustment to the carrying amount of assets and liabilities within the next financial year:
i) Property, plant and equipment (Note 10)
ii) Hydro power purchase arrangement (Note 8 b i)
iii) Intangible assets (Note 7)
iv) Reclamation and abandonment provision (Note 12)
v) Other long-term obligations (Note 13)
vi) Small Power Producer contracts (Note 8 b ii)
In the opinion of management, these financial statements have been properly prepared in accordance with IFRS, within reasonable limits of materiality and the framework of the significant accounting policies summarized in Note 3 to the financial statements.
5. Trade and Other Receivables
(in thousands of dollars)December 31,
2016December 31,
2015
Trade receivables 75,137 16,004
Other receivables 2,020 89
77,157 16,093
6. Long-term receivables
(in thousands of dollars)December 31,
2016December 31,
2015
Cash settlement receivable from PPA settlements (Note 15) 5,824 -
Emission credits receivable from PPA settlements (Note 15) 2,000 -
7,824 -
Balancing Pool 392016 Annual Report
2016-17 Energy Annual Report202

7. Intangible Assets
(in thousands of dollars) Emission Credits
At January 1, 2016 -
Additions from purchases 9,452
Additions from PPA settlements received (Note 15) 139,837
At December 31, 2016 149,289
8. Accounting for Financial Instruments
8. a) Risk Management Overview
The Balancing Pool’s activities expose the Balancing Pool to a variety of financial risks: market risk (including fluctuating market prices, plant availability, risks associated with PPA payments and receipts and currency and interest rate risk), credit risk and liquidity risk. The Balancing Pool has developed Risk Management and Credit Policies that define the organization’s tolerance for risk and set out procedures for quantifying and monitoring exposures. Exposures and compliance with the policies are regularly monitored by management, the Audit and Finance Committee and the Board.
Market Risk – Power
i) Fluctuating Market Prices: Changes in the market price for electricity and ancillary services affect the amount of revenues that the Balancing Pool receives from the PPAs, including the Hydro PPA. Changes in the market price for electricity also affect the amounts paid or received by the Balancing Pool under the Small Power Producer contracts. Electricity prices are volatile, and are affected by supply and demand, which in turn are influenced by fuel costs (e.g. natural gas prices), weather patterns, plant availability and power imports or exports. Economic activity is a key contributor to market price risk as it relates to the demand for electricity. Market price risk may be managed through the use of financial forward sale contracts for electricity.
ii) Plant Availability: Changes in plant availability can impact the expected level of generation output and associated revenues and expenses of the Balancing Pool. According to the terms of the PPA, the Balancing Pool is entitled to availability incentive payments when the plant generates at levels below target availability. If the plant generates above the target availability, the Balancing Pool is required to make payments to the Owner of the plant. The Balancing Pool is not entitled to availability incentive payments during an event of force majeure.
iii) Capacity Payment: The Balancing Pool is exposed to interest rate risk in relation to the annual capacity payments. A 1% increase to the long-term government bond rate would increase the annual capacity payments by an estimated $19.2 million for the terminated PPAs. Likewise a 1% decrease to the long-term government bond rate would decrease the annual capacity payments by an estimated $19.2 million.
Balancing Pool40 2016 Annual Report
2016-17 Energy Annual Report 203

Market Risk – Investments
i) Currency and Interest Rate Risk: The Balancing Pool is exposed to currency risk and interest rate risk. There is the possibility that the value of investments will change due to fluctuations in foreign currency exchange rates and market interest rates.
ii) Price Risk: The investment portfolio is exposed to equity securities price risk. This arises from investments held in the investment portfolio for which prices in the future are uncertain. Where non-monetary financial instruments – for example, equity securities – are denominated in currencies other than the Canadian dollar, the price initially expressed in foreign currency and then converted into Canadian dollars will also fluctuate because of changes in foreign exchange rates. Item (i) Currency and Interest Rate Risk above sets out how this component of price risk is measured.
Under the Balancing Pool’s investment policy, price risk has historically been managed through diversification
and selection of securities and other financial instruments within specified limits set by the Board. Between 15% and 35% of the net assets attributable to the investment portfolio were expected to be invested in Canadian equity securities and between 15% and 35% in Global equities, subject to a 60% cap on total equity. Between 40% and 60% of the net assets attributable to the investment portfolio were expected to be invested in fixed income securities. The investment policy required that the overall market position be monitored on a daily basis by the investment manager and is reviewed on an annual basis by the Board. Compliance with the investment policy is reported to the Board on a quarterly basis. In April 2016, the Board of Directors approved a liquidation strategy for the investment portfolio.
The table below is a summary of the significant sector concentrations within the investment portfolio at December 31, 2016 and 2015.
% of Total Fund Value2016 2015
Sector
Fixed Income
Portfolio %
Canadian Equity
Portfolio %
Global Equity
Portfolio %
Fixed Income
Portfolio %
Canadian Equity
Portfolio %
Global Equity
Portfolio %
Information technology - - - 0.1 5.6 11.7Financials - - 73.8 22.4 38.9 18.7Energy - - - 4.7 15.1 5.0Health care - - 0.8 0.0 0.0 13.8Consumer staples - - - 0.1 7.3 12.0Industrials - - - 0.2 13.5 12.8Consumer discretionary - - - 0.1 8.0 12.2Utilities - - - 2.2 2.1 0.2Infrastructure - - - 7.4 0.0 0.0Materials - - 21.6 0.4 6.0 6.3Telecommunication services - - 3.8 2.3 3.3 3.9Federal - - - 14.9 0.0 0.0Provincial / municipal - - - 26.5 0.0 0.0Cash & cash equivalents 100.0 - - 18.7 0.2 3.4Total 100.0 - 100.0 100.0 100.0 100.0
Over the course of 2016, the Balancing Pool has drawn down the investment portfolio from $704.7 million at December 31, 2015 to $15.7 million at December 31, 2016.
Balancing Pool 412016 Annual Report
2016-17 Energy Annual Report204

iii) Counterparty Credit Risk: The Balancing Pool is exposed to counterparty credit risk. In the event of a default on payments from counterparties to the Hydro PPA, Small Power Producer contracts, forward sale contracts or mark-to-market on forward sale contracts, a financial loss may be experienced by the Balancing Pool. Credit risk is managed in accordance with the Credit Policy which requires that all counterparties maintain investment-grade status level. Status of counter-party credit is regularly monitored by management and the Audit and Finance Committee. The Balancing Pool has minimal credit risk related to its receivables as they consist primarily of amounts owing from the AESO, a government-related entity. The Balancing Pool does not consider any of the trade accounts receivables to be impaired or past due.
iv) Liquidity Risk: Liquidity risk is the risk that the Balancing Pool will not be able to meet its financial obligations as they fall due. To manage this risk, management forecasts cash flows for a period of 12 months and beyond and will adjust the Consumer Collection according to the Balancing Pool Regulation and borrow from the Government of Alberta. The changes to the EUA, enacted in December of 2016, provide the Balancing Pool with the capacity to borrow from the Government of Alberta (Note 18).
The table below analyzes the Balancing Pool’s non-derivative and net-settled financial and other liabilities into relevant maturity groupings based on the remaining period from the period end date to the contract maturity date.
Less than 3 months
3 months to 1 year 2 – 5 years Total
December 31, 2016
Trade payables 120,918 - - 120,918
Other payables 7,209 201,069 5,985 214,263
Current portion of Hydro PPA 1,675 8,378 - 10,053
Small Power Producer contracts 984 4,918 5,437 11,339
Reclamation and abandonment 612 3,059 26,361 30,032
Other long-term obligations 86,617 1,359,744 411,453 1,857,814
Total 218,015 1,577,168 449,236 2,244,419
December 31, 2015
Trade payables 53,570 - - 53,570
Other payables 5,690 8,744 6,576 21,010
Genesee power purchase arrangement lease obligation 15,381 46,143 250,987 312,511
Small Power Producer contracts 817 4,085 6,466 11,368
Reclamation and abandonment 487 2,438 26,864 29,789
Other long-term obligations 7,367 36,833 52,500 96,700
Total 83,345 98,210 343,393 524,948
Balancing Pool42 2016 Annual Report
2016-17 Energy Annual Report 205

8. b) Analysis of Financial Instruments
i) Hydro Power Purchase Arrangement
The Balancing Pool is the counterparty to the Hydro PPA, a financial arrangement recorded as an asset at the present value of estimated amounts to be received, net of Hydro PPA obligations, over the remaining term of the Hydro PPA.
The notional production of electricity under the Hydro PPA is 1,620 gigawatt hours (“GWh”) per annum from 2017 to 2020. Hydro PPA receipts or payments are settled on a monthly basis.
The remaining term of the Hydro PPA is four years to December 31, 2020. At December 31, 2016, the net present value of the Hydro PPA was estimated at $38.4 million (2015 – $242.6 million). Key assumptions in this valuation are a discount rate of 10.2% (2015 – 10.1%) and an estimated forecast average market electricity price of $32.35/megawatt hour (“MWh”) for the period between 2017 through to 2020 (2015 – $48.95/MWh for 2016 to 2020).
Hydro Power Purchase Arrangement (in thousands of dollars) 2016 2015
Hydro power purchase arrangement, opening balance 242,633 357,785
Accretion and current year change (20,109) 19,126
Net cash payments (receipts) 18,468 (33,866)
Revaluation of Hydro power purchase arrangement asset (202,561) (100,412)
Hydro power purchase arrangement, closing balance 38,431 242,633
Less: Current portion payable (receivable) 10,053 (26,147)
48,484 216,486
The estimated value of this asset varies based on the assumptions used and there is a high degree of measurement uncertainty. The following table summarizes the impact on the Hydro PPA value when the estimated forecast average market price is increased or decreased by 10% and the discount rate is increased or decreased by 1%, all other inputs being constant.
(in thousands of dollars)
Impact of change to price volatility Impact of change to discount rateIncrease price
by 10%Decrease price
by 10%Increase discount
rate by 1%Decrease discount
rate by 1%December 31, 2016
Change in fair value as at December 31, 2016 9,219 (9,219) (1,319) 1,376
December 31, 2015
Change in fair value as at December 31, 2015 52,375 (52,375) (7,394) 7,730
Balancing Pool 432016 Annual Report
2016-17 Energy Annual Report206

ii) Small Power Producer Contracts
One Small Power Producer contract with a total allocated capacity of 10 MW (2015 – 20.5 MW) at December 31, 2016 remains active (2015 – 2). The contract price is $79.70/MWh and the contract completion date is February 15, 2019. Under this contract, the price that the Small Power Producer receives from the counterparty utility company is fixed. If the market price is below the contract price, the Balancing Pool must pay the difference to the utility company. If the market price exceeds the contract price, the utility company must pay the difference to the Balancing Pool.
At December 31, 2016, the net present value of cash flows from the Balancing Pool for these contracts was estimated to be $11.3 million liability (2015 – $11.4 million liability). The estimated value of this liability varies based on the assumptions used and there is a high degree of measurement uncertainty. The key assumption used in this valuation is an estimated forecast average market electricity price of $29.02/MWh for 2017 through to 2019 (2015 – $46.19/MWh for 2016 to 2019).
Small Power Producer Contracts(in thousands of dollars) 2016 2015
Small Power Producer contracts, opening balance (11,368) (12,987)
Accretion and current year change (1,391) (1,301)
Net cash payments 6,077 5,960
Revaluation of Small Power Producer contracts (4,657) (3,040)
Small Power Producer contracts, closing balance (11,339) (11,368)
Less: Current portion 5,902 5,834
(5,437) (5,534)
The value of these contracts varies depending on the assumptions used in the valuation. The following table summarizes the impact on the Small Power Producer Contract value when the estimated forecast average market price is increased or decreased by 10%, all other inputs being constant.
(in thousands of dollars)
Impact of change to price volatility Impact of change to discount rateIncrease price
by 10%Decrease price
by 10%Increase discount
rate by 1%Decrease discount
rate by 1%December 31, 2016
Change in fair value as at December 31, 2016 601 (602)
December 31, 2015
Change in fair value as at December 31, 2015 (1,234) 1,234 (181) 186
Balancing Pool44 2016 Annual Report
2016-17 Energy Annual Report 207

iii) Financial Derivatives – Electricity Price Risk Management Activities
The Balancing Pool may enter into derivative swap contracts to manage its exposure to changes in electricity prices. At December 31, 2016, the Balancing Pool had no derivative swap contracts outstanding (2015 – no derivative swap contracts outstanding). These swap contracts require payments to (or receipts from) counterparties based on the differential between the fixed contract price and variable electricity market prices as published by the AESO. At times when the Balancing Pool sells volumes forward, the swap contracts typically allow the Balancing Pool to receive a fixed price for the hedged volumes and require the Balancing Pool to remit the floating price to the counterparty.
Amounts settled under financial derivative contracts are recorded on an accrual basis in revenue against the applicable exposure.
8. c) Fair Value Hierarchy
Financial Instruments carried at fair value are categorized as follows:
(in thousands of dollars)
Quoted prices in active markets for
identical assets
Significant other observable
inputs
Significant unobservable
inputsTotalLevel 1 Level 2 Level 3
December 31, 2016
AssetsCash and cash equivalents 16,078 - - 16,078
Investments – fixed income securities - 15,684 - 15,684
Hydro power purchase arrangement - - 48,484 48,484
16,078 15,684 48,484 80,246
LiabilitiesHydro power purchase arrangement - - 10,053 10,053
Small Power Producer contracts - - 11,339 11,339
- - 21,392 21,392
16,078 15,684 27,092 58,854
December 31, 2015
AssetsCash and cash equivalents 5,073 - - 5,073
Investments – fixed income securities - 353,295 - 353,295
Investments – equity securities 135,209 216,215 - 351,424
Hydro power purchase arrangement - - 242,633 242,633
140,282 569,510 242,633 952,425
LiabilitiesSmall Power Producer contracts - - 11,368 11,368
- - 11,368 11,368
140,282 569,510 231,265 941,057
Balancing Pool 452016 Annual Report
2016-17 Energy Annual Report208

i) Level 1
Fair values of assets and liabilities included in Level 1 are determined by reference to quoted prices in active markets for identical assets and liabilities. Fair values for equity investments are determined using quoted market prices in active markets.
ii) Level 2
Assets and liabilities in Level 2 include valuations using inputs other than Level 1 quoted prices for which all significant inputs are observable, either directly or indirectly. Fair values for pooled equity and fixed income investments are determined using quoted market prices in active markets.
iii) Level 3
Level 3 valuations are based on inputs that are unobservable and significant to the overall fair value measurement. Changes in valuation methods may result in transfers into or out of an assigned level. There were no transfers between Level 3 and Level 2. The Hydro PPA and Small Power Producer contract values are determined using discounted cash flow forecast methods and supported by observable market prices when available. Methodologies have been developed to determine the fair value for these contracts based on forecast of hourly electricity market price in Alberta’s hourly market using proprietary third party merit order dispatch model. Management reviews the discounted cash flow forecasts on an annual basis. The changes in value, key assumptions and sensitivities in Level 3 instruments for the years ended December 31, 2016 and 2015 are disclosed in Note 8 b i) and in Note 8 b ii).
9. Investments
(in thousands of dollars)
December 31, 2016 December 31, 2015Market Value Cost Market Value Cost
Fixed income securities 15,670 15,670 353,295 350,950
Canadian equities - - 135,209 108,540
Global equities 14 15 216,215 123,523
Total investments 15,684 15,685 704,719 583,013
(in thousands of dollars) 2016 2015
Investments, beginning of year 704,719 974,682
Interest and dividends 4,749 26,502
Realized capital gains 115,135 89,622
Sale of investments (687,212) (332,000)
Unrealized capital loss (121,707) (54,087)
Investments, end of year 15,684 704,719
Balancing Pool46 2016 Annual Report
2016-17 Energy Annual Report 209

The following table provides disclosure on the movements in the fair value of the investments.
Unrealized Market Gain (Loss)(in thousands of dollars)
Fixed Income Securities
Canadian Equities
Global Equities Total
Unrealized market gain, December 31, 2014 5,152 59,776 110,865 175,793
Changes in value attributable to:
Change during the year 5,633 (15,531) 45,433 35,535
Realized gain on sales of investments (8,440) (17,576) (63,606) (89,622)
Net change during the year (2,807) (33,107) (18,173) (54,087)
Unrealized market gain, December 31, 2015 2,345 26,669 92,692 121,706
Changes in value attributable to:
Change during the year (987) 12,143 (17,728) (6,572)
Realized gain on sales of investments (1,358) (38,812) (74,965) (115,135)
Net change during the year (2,345) (26,669) (92,693) (121,707)
Unrealized market (loss), December 31, 2016 - - (1) (1)
10. Property, Plant and Equipment and Related Lease Obligation
10 a) Property, Plant and Equipment
(in thousands of dollars) Genesee PPA Office Equipment Total
CostsBalance as at December 31, 2014 1,505,670 519 1,506,189
Additions - 56 56
Balance as at December 31, 2015 1,505,670 575 1,506,245
Additions - - -
Balance as at December 31, 2016 1,505,670 575 1,506,245
Accumulated Amortization, Depreciation and ImpairmentBalance as at December 31, 2014 842,301 444 842,745
Amortization and Depreciation 110,561 34 110,595
Impairment loss 221,960 - 221,960
Balance as at December 31, 2015 1,174,822 478 1,175,300
Amortization and Depreciation 66,170 40 66,210
Impairment loss 264,678 - 264,678
Balance as at December 31, 2016 1,505,670 518 1,506,188
Net Book ValueAs at December 31, 2015 330,848 97 330,945
As at December 31, 2016 - 57 57
Balancing Pool 472016 Annual Report
2016-17 Energy Annual Report210
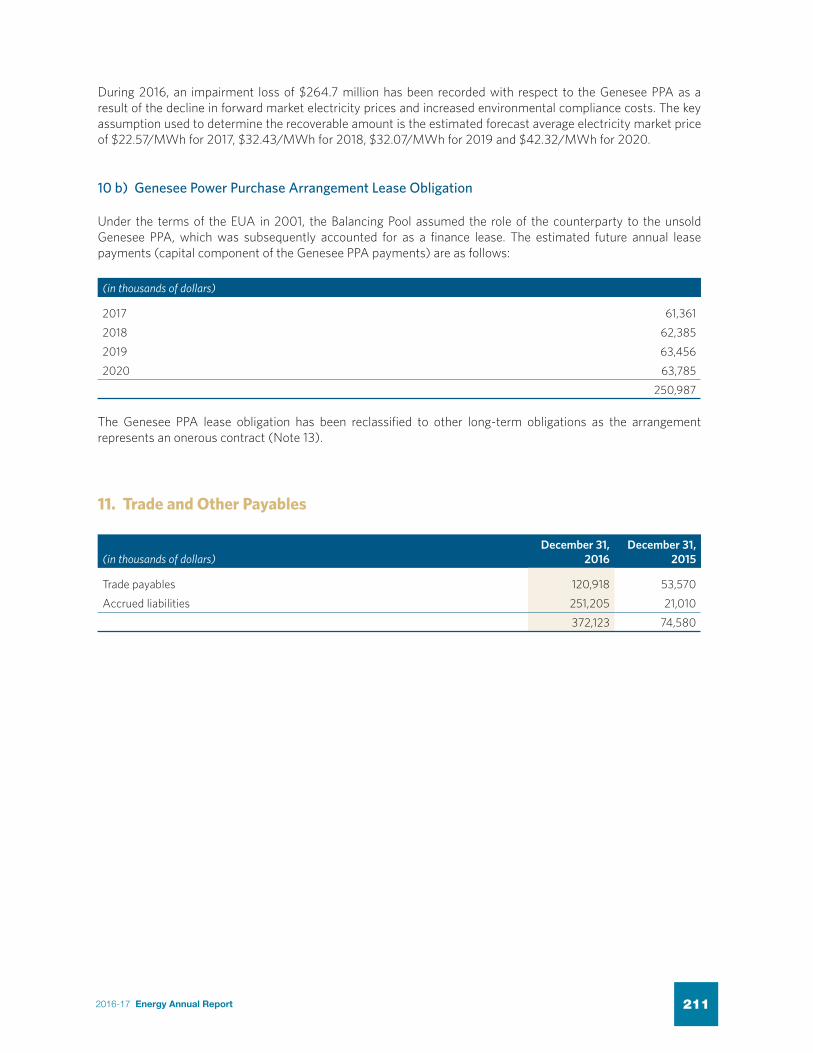
During 2016, an impairment loss of $264.7 million has been recorded with respect to the Genesee PPA as a result of the decline in forward market electricity prices and increased environmental compliance costs. The key assumption used to determine the recoverable amount is the estimated forecast average electricity market price of $22.57/MWh for 2017, $32.43/MWh for 2018, $32.07/MWh for 2019 and $42.32/MWh for 2020.
10 b) Genesee Power Purchase Arrangement Lease Obligation
Under the terms of the EUA in 2001, the Balancing Pool assumed the role of the counterparty to the unsold Genesee PPA, which was subsequently accounted for as a finance lease. The estimated future annual lease payments (capital component of the Genesee PPA payments) are as follows:
(in thousands of dollars)
2017 61,361
2018 62,385
2019 63,456
2020 63,785
250,987
The Genesee PPA lease obligation has been reclassified to other long-term obligations as the arrangement represents an onerous contract (Note 13).
11. Trade and Other Payables
(in thousands of dollars)December 31,
2016December 31,
2015
Trade payables 120,918 53,570
Accrued liabilities 251,205 21,010
372,123 74,580
Balancing Pool48 2016 Annual Report
2016-17 Energy Annual Report 211

12. Reclamation and Abandonment Provisions
(in thousands of dollars)H.R. Milner
Generating StationIsolated
Generation Sites
Cost to Decommission
PPAs Total
At January 1, 2015 11,854 6,518 11,505 29,877
Net increase in liability 800 2,731 (767) 2,764
Liabilities paid in period - (4,047) - (4,047)
Accretion expense 474 261 460 1,195
At December 31, 2015 13,128 5,463 11,198 29,789
Less: Current portion - (2,925) - (2,925)
13,128 2,538 11,198 26,864
At January 1, 2016 13,128 5,463 11,198 29,789
Net increase in liability 1,133 1,832 (3,040) (75)
Liabilities paid in period - (486) - (486)
Accretion expense 355 147 302 804
At December 31, 2016 14,616 6,956 8,460 30,032
Less: Current portion - (3,671) - (3,671)
14,616 3,285 8,460 26,361
12 a) Decommissioning Costs of H.R. Milner Generating Station
Under the Asset Sale Agreement for the H.R. Milner generating station between the Balancing Pool and ATCO Power Ltd, which was executed in 2001, the Balancing Pool assumed liability for the costs of decommissioning the station at the end of operations. When the asset was subsequently re-sold to Milner Power Limited Partnership in 2004, the Balancing Pool retained the liability for decommissioning the generating station. In 2011 a bilateral agreement was reached with Milner Power Limited Partnership wherein the Balancing Pool’s exposure to future decommissioning costs was capped at $15.0 million. It is estimated that these costs will be incurred in 2020. These costs have been discounted at 0.6% (2015 – 2.7%) yielding the present value of the related liability. At December 31, 2016, an increase of $1.1 million (2015 - $0.8 million increase) was recorded to reflect a change in the discount rate.
12 b) Isolated Generation Sites
Under the Isolated Generating Units and Customer Choice Regulations of the EUA, the Balancing Pool is liable for the reclamation and abandonment costs associated with various Isolated Generation sites. Expenditures of $0.5 million (2015 – $4.0 million) were incurred in 2016. Pursuant to the Negotiated Settlement Agreements approved by the AUC, the ultimate payment of these costs must be reviewed and approved by the Remediation Review Committee. The Remediation Review Committee was established to monitor, verify and approve all costs associated with the reclamation and abandonment of the Isolated Generation sites. Estimated reclamation and abandonment costs have been discounted at 0.6% (2015 – 2.7%). The provision is based upon management’s best estimate and the timing of the costs. Management anticipates the Isolated Generation projects will conclude at the end of 2018. At December 31, 2016, an increase of $1.8 million (2015 – $2.7 million increase) was recorded to reflect a change in estimation to complete the project.
Balancing Pool 492016 Annual Report
2016-17 Energy Annual Report212

12 c) Decommissioning Costs of PPAs Pursuant to Section 7 of the Power Purchase Arrangements Regulation, the Owner of a generating unit who applies to the AUC to decommission a unit within one year of the termination of the PPA is entitled to receive funding from the Balancing Pool. The amount of funding provided by the Balancing Pool is the amount by which the decommissioning costs exceed the decommissioning amounts the Owner collected from related consumers before January 1, 2001 and subsequently through the related PPA. Subject to AUC approval, Owners are eligible to collect this shortfall provided that the unit has ceased generating electricity. This provision does not apply to units that cease operations after December 31, 2018.
At December 31, 2016, the Balancing Pool recorded a $3.0 million decrease (2015 – $0.8 million decrease) to the provision for decommissioning the PPAs. The provision is based upon management’s best estimate of decommissioning costs, assessment of the impact of Provincial and Federal environmental legislation on the ongoing viability of the various units and the probability an Owner of a generating unit will elect to retire the unit within the timeframe and to then make an application to the AUC to proceed with decommissioning. Estimated decommissioning costs were discounted at 0.6% (2015 – 2.7%). The estimate of the decommissioning costs before discounting and probability weighting is $8.6 million.
13. Other Long-Term Obligations
(in thousands of dollars) Genesee
BattleRiver 5
SundanceA
SundanceB
SundanceC Keephills Sheerness Total
At January 1, 2015 - - - - - - - -
Net increase in liability - 96,700 - - - - - 96,700
Losses - - - - - - - -
At December 31, 2015 - 96,700 - - - - - 96,700
Less: Current portion - (44,200) - - - - - (44,200)
- 52,500 - - - - - 52,500
At January 1, 2016 - 96,700 - - - - - 96,700
Net increase in liability 626,650 136,348 144,579 277,444 218,661 298,970 497,432 2,200,084
Losses - (81,491) (53,687) (77,669) (68,492) (42,443) (115,188) (438,970)
At December 31, 2016 626,650 151,557 90,892 199,775 150,169 256,527 382,244 1,857,814
Less: Current portion (215,197) (151,557) (90,892) (199,775) (150,169) (256,527) (382,244) (1,446,361)
411,453 - - - - - - 411,453
Pursuant to Section 96 of the EUA, following Buyer-initiated terminations in Q1 and Q2 of 2016, the Battle River 5 PPA, Sundance A, Sundance B, Sundance C, Sheerness and Keephills PPAs were transferred to the Balancing Pool. While the Balancing Pool continues to hold the PPAs, it will assume responsibility for ongoing capacity payments and other PPA-related costs and is responsible for selling the output into the wholesale power market.
Balancing Pool50 2016 Annual Report
2016-17 Energy Annual Report 213

Based on the estimated forecast average electricity market price of $22.57/MWh for 2017, $32.43/MWh for 2018, $32.07/MWh for 2019 and $42.32/MWh for 2020, the unavoidable costs of meeting the obligations under the PPAs is expected to exceed the economic benefits derived from the PPAs. As a result, onerous contract provisions have been recognized and measured at the lower of the present value of continuing the PPAs and the expected costs of terminating them. Cost of termination includes the estimated net costs of holding the PPAs over the minimum six-month notice period preceding such termination plus a termination payment. For purposes of measuring the onerous contract provision under IFRS, the minimum six-month notice period is estimated to commence on January 1, 2017, except for PPA terminations which have not yet been settled. For PPA terminations which have not yet been settled, management has estimated that the minimum six-month notice period is estimated to commence on July 1, 2017. The termination payment represents the net book value of the units which is estimated at $1.4 billion. The estimated future costs for the PPAs were discounted at 0.6%, except for Genesee’s future costs which where discounted at 1%.
Should the Balancing Pool not terminate some or all of the PPAs in 2017 and instead continue to hold them to the end of their respective terms, the Balancing Pool’s financial exposure would increase materially. Future cash flow requirements may include operating losses where the price in Alberta’s hourly wholesale electricity market is less than the operating costs over the period of 2017 through to 2020. It is expected operating costs would include amounts associated with the Specified Gas Emitters Regulation and the Climate Leadership Plan for all of the PPAs for the period of 2017 through to 2020. Revenue is also dependent on generating capacity factors of the different PPAs, which can vary for each PPA.
As of the approval date of these financial statements, a final determination of which PPAs to terminate has not been made, therefore actual costs will be higher than those reflected in other long-term obligations.
As disclosed in Note 10, the Genesee PPA finance lease asset was fully impaired as at December 31, 2016 due to the decline in forward market electricity prices and increased environmental compliance costs. Furthermore, the existing Genesee PPA lease obligation has been reclassified to other long-term obligations as an onerous contract and an additional onerous contract provision has been calculated by taking the unavoidable costs that will be incurred under the contract, excluding those that were previously included within the Genesee PPA Lease Obligation, less any estimated revenue.
See Note 15, Contingencies and Commitments, for additional information with respect to the termination of PPAs and subsequent negotiation of settlement agreements.
Balancing Pool 512016 Annual Report
2016-17 Energy Annual Report214

14. Capital Management
The Balancing Pool’s objective when managing capital is to operate as per the requirements of the EUA which requires the Balancing Pool to operate with no profit or loss and no share capital and to forecast its revenues, expenses, and cash flows. Any excess or shortfall of funds in the accounts is to be allocated to, or provided by, electricity consumers over time. During 2016, the Alberta Government enacted amendments to the Balancing Pool Regulation that extends the life of the Balancing Pool to December 31, 2030.
A reconciliation of the opening and closing Balancing Pool deferral account is provided below. Balancing Pool Deferral Account(in thousands of dollars) 2016 2015
Deferral account, beginning of year 774,515 1,562,737
Change in net liabilities attributable to the Balancing Pool deferral account (2,551,136) (464,109)
Payment of Consumer Allocation (190,167) (324,113)
Deferral account, end of year (1,966,788) 774,515
In November 2015, the Balancing Pool’s Board of Directors approved a Consumer Allocation of $3.25/MWh for a total distribution to electricity consumers of $190.2 million. In December 2016, the Board of Directors approved a Consumer Collection of $65.0 million in accordance with the Balancing Pool Regulation.
15. Contingencies and Commitments
Termination of Power Purchase Arrangements
Pursuant to Section 96 of the EUA, except for an Owner’s termination for destruction, where a PPA is terminated the PPA is deemed to have been sold to the Balancing Pool. Buyer-initiated termination could be triggered by a change in law which renders the PPA unprofitable or more unprofitable for the Buyer, an event of force majeure lasting greater than six months or Owner default in performing its obligations. Termination under these provisions would result in the transfer of the PPA to the Balancing Pool. The Balancing Pool would then assume responsibility for ongoing capacity payments and other PPA-related costs and would be responsible for selling the output into the wholesale power market.
During the latter part of 2015 and first quarter of 2016, the Balancing Pool received notices of termination for six of the seven PPAs. The Balancing Pool immediately assumed responsibility for all financial obligations associated with the terminated PPAs.
On July 25, 2016, the Attorney General of Alberta filed an application with the Alberta Court of Queen’s Bench seeking declarations relating to the validity of certain provisions of the Battle River 5 PPA, Sundance A PPA, Sundance B PPA, Sundance C PPA, Sheerness PPA and Keephills PPA. The Attorney General also sought judicial review of the Balancing Pool’s decision to accept termination by ENMAX PPA Management Inc. of the Battle River 5 PPA. The Balancing Pool, the AUC, ENMAX PPA Management Inc. and other parties with interests in PPAs were named as respondents.
Balancing Pool52 2016 Annual Report
2016-17 Energy Annual Report 215

Balancing Pool 53
On November 24, 2016, the Government of Alberta reached settlement agreements with the Buyers of the Sundance A PPA, Sundance B PPA, Sundance C PPA, and Sheerness PPA. As a result of these settlement agreements, as at December 31, 2016 the Balancing Pool received reimbursement of $39.0 million in cash in relation to the onerous contract provisions disclosed in Note 13 and has recognized intangible assets (emission credits) of $139.8 million (Note 7) and long-term receivables (cash receivable and emission credits receivable) of $7.8 million (Note 6) in relation to reimbursements relating to the onerous contract provisions. The reimbursements have been recorded as an offset against the expenses related to the provision for other long-term obligations in the Statements of Loss and Comprehensive Loss.
In addition, the Balancing Pool has agreed to assume all obligations, including past obligations, as the Buyer under the Sundance A PPA, Sundance B PPA and Sheerness PPA. The Balancing Pool has recorded a provision in other long-term obligations for the line loss rule proceedings for Sundance A, Sundance B, Sheerness and Genesee PPAs. The Balancing Pool is currently not aware of any other proceedings or liabilities outstanding.
For those PPAs which have been or which may ultimately be returned to the Balancing Pool, the Balancing Pool has the option to hold the PPAs, resell the PPAs or to terminate the PPAs by paying the Owner a termination payment equal to the net book value. Should the Balancing Pool not terminate the PPAs in 2017 the financial obligations of the Balancing Pool as it relates to the PPAs will be higher (Note 13).
These financial statements do not reflect the potential outcome of ongoing settlement negotiations between the Government of Alberta and the other PPA Buyers, except for measurement considerations with the termination option under the other long-term obligation provision (Note 13).
Genesee PPA Energy Strip Contracts
In the last quarter of 2014, the Balancing Pool sold two 100-MW strip contracts for generating capacity from the Genesee PPA (representing 26% of the total Genesee PPA capacity). The two contracts commenced on November 1, 2014 and were contracted to expire on October 31, 2017. Terms of the contracts required the purchaser to pay a fixed monthly fee established by a competitive bid process and amounts intended to cover certain PPA costs payable by the Balancing Pool.
A negotiated settlement was reached in March 2016 with one of the strip buyers resulting in the termination of the strip contract. A negotiated settlement was also reached in December 2016 with the other strip buyer resulting in the termination of the other strip contract as part of the PPA settlements discussed above.
Revenue from the sale of the energy strip contracts, including termination revenue of $14.3 million has been recorded in sale of generating capacity and termination revenue on the Statements of Loss and Comprehensive Loss.
2016 Annual Report
2016-17 Energy Annual Report216
Balancing Pool54
Payments (Refunds) In Lieu of Tax
Alberta Tax and Revenue Administration has issued notices of re-assessment for several tax years (dating back to 2001) to a municipal entity that has been subject to PILOT. The municipal entity has disagreed with many aspects of the notices of re-assessment and has filed notices of objection for those tax years. The municipal entity has proceeded with litigation to resolve the various tax matters. A number of these matters were resolved through negotiations and the courts in 2016, which has resulted in the pending refund of $96.0 million to the municipal entity, which has been reflected as a refund of revenue by the Balancing Pool. This refund has been accrued in trade and other payables. Approximately $61.7 million remains under dispute with the municipal entity for the tax years of 2001 through to 2015. A provision of $30.3 million has been recorded in relation to the disputed matters and reflected as a refund of PILOT revenue. This provision has been accrued in trade and other payable.
Line Loss Rule Proceeding
The Line Loss Rule (“LLR”) proceeding, currently underway before the AUC is intended to address complaints regarding the ISO Transmission Loss Factor Rule and Loss Factor Methodology. Line loss factors form part of transmission charges that are paid by generators in Alberta. The Balancing Pool is exposed to retroactive line loss adjustment for certain PPAs.
In January 2015, the AUC determined that it has the jurisdiction and authority to retroactively adjust the line loss factors and the methodology dating back to 2006.
The AUC has been presented with three methodologies for calculating retroactive line loss adjustments, the first being the AESO methodology based on Incremental Loss Factor with load scaling. The second is the AUC methodology based on Incremental Loss Factor with generation scaling. The third method is the Maxim methodology. A description of the various methodologies can be found in the AESO’s exhibits presented in 790-140.3 of the LLR proceeding.
The Balancing Pool will incur additional charges as a result of the retroactive adjustments to line loss factors. An estimated provision in the amount of $114.0 million has been recorded in other long-term obligations for the LLR proceeding. The estimate has been prepared using the AESO’s Incremental Loss Factor method with load scaling as data was available to calculate an estimate.
Various matters before the AUC regarding the LLR proceeding are under review and appeal including the retroactive and prospective line loss factors and the AUC’s decision regarding its authority and jurisdiction. The actual line loss retroactive adjustment will be dependent upon the loss factors and methodology approved by the AUC which the Balancing Pool estimates may be higher or lower by 10% than the current estimate reflected in these financial statements.
2016 Annual Report
2016-17 Energy Annual Report 217
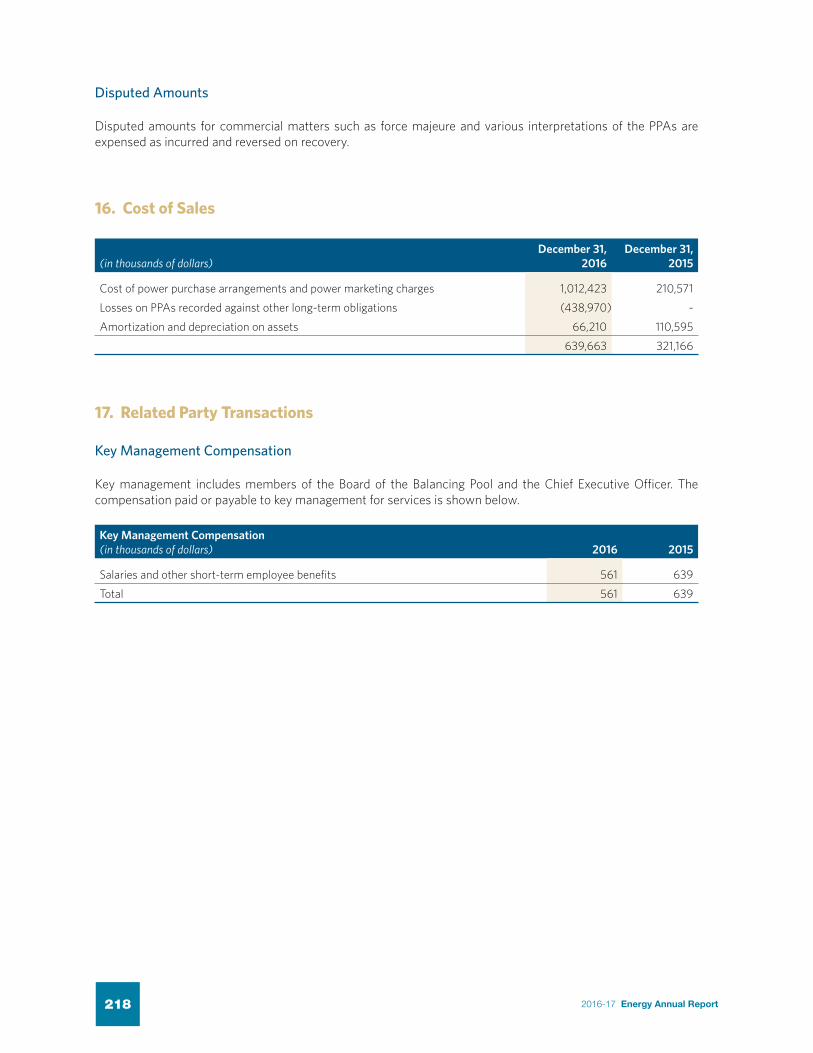
Disputed Amounts
Disputed amounts for commercial matters such as force majeure and various interpretations of the PPAs are expensed as incurred and reversed on recovery.
16. Cost of Sales
(in thousands of dollars)December 31,
2016December 31,
2015
Cost of power purchase arrangements and power marketing charges 1,012,423 210,571
Losses on PPAs recorded against other long-term obligations (438,970) -
Amortization and depreciation on assets 66,210 110,595
639,663 321,166
17. Related Party Transactions
Key Management Compensation
Key management includes members of the Board of the Balancing Pool and the Chief Executive Officer. The compensation paid or payable to key management for services is shown below.
Key Management Compensation(in thousands of dollars) 2016 2015
Salaries and other short-term employee benefits 561 639
Total 561 639
Balancing Pool 552016 Annual Report
2016-17 Energy Annual Report218

Government-Related Entity
The Balancing Pool considers itself to be a government-related entity as defined by IAS 24 – Related Party Disclosures – and applies the exemption from the disclosure requirements of Paragraph 18 of IAS 24 – Related Party Disclosures. The members of the Board are appointed by the Minister of Energy of the Government of Alberta. The Balancing Pool had no significant transactions with the Government of Alberta during 2016 and 2015.
As directed by the Minister of Energy, the Balancing Pool is mandated to make payments to the Office of the Utilities Consumer Advocate (“UCA”) to cover 80% of its annual operating costs and 100% of the annual costs for the Transmission Facilities Cost Monitoring Committee (“TFCMC”) and the Retail Market Review Committee (“RMRC”).
In 2016, the Balancing Pool expensed $5.4 million (2015 – $4.8 million) for the UCA and $0.7 million (2015 – $1.0 million) for the TFCMC and RMRC in aggregate.
The Balancing Pool also considers the AESO a government-related entity. The EUA requires the Balancing Pool to forecast its revenues and expenses with any excess or shortfall of funds in the accounts to be allocated to, or provided by, electricity consumers over time. Pursuant to the EUA, the AESO facilitates the collection or distribution of any excess or shortfall through an annualized amount included in the AESO’s transmission tariff. In 2016, the Balancing Pool distributed $190.2 million to electricity consumers through the AESO’s transmission tariff (2015 – $324.1 million distributed).
18. Subsequent Events
In January 2017 the Balancing Pool signed a loan agreement with the Government of Alberta. The loan agreement was put in place through Alberta Treasury Board and Finance to fund operating losses of the Balancing Pool, including obligations associated with the terminated PPAs. From January 1, 2017 to April 4, 2017, the Balancing Pool borrowed $232.0 million to meet its current cash flow obligations. The short-term discount notes issued to the Government of Alberta have maturity dates ranging from 31 to 90 days and corresponding annual interest charges that range from 0.9% to 1%.
In April 2017 the Balancing Pool issued PILOT refunds of $6.6 million to a municipal entity subject to PILOT for refunds that relate to prior tax years, which were accrued in 2016 (Note 15).
Balancing Pool56 2016 Annual Report
2016-17 Energy Annual Report 219

2016-17 Energy Annual Report220

2016-17 Energy Annual Report 221
Statutory Reports
Public Interest Disclosure (Whistleblower Protection) ActSection 32 of the Public Interest Disclosure (Whistleblower Protection) Act requires the ministry to report annually on the following:
(a) the number of disclosures received by the designated officer, the number of disclosures acted on and the number of disclosures not acted on by the designated officer;
(b) the number of investigations commenced by the designated officer as a result of disclosures;
(c) in the case of an investigation that results in a finding of wrongdoing, a description of the wrongdoing and any recommendations made or corrective measures taken in relation to the wrongdoing or the reasons why no corrective measure was taken.
There were no disclosures of wrongdoing filed with the Public Interest Disclosure Office for the ministry between April 1, 2016 and March 31, 2017.

2016-17 Energy Annual Report222
Other Information
For additional copies, please contact:
Energy Communications 8th Floor, North Petroleum Plaza 9945 ‑ 108 Street Edmonton, Alberta T5K 2G6
Tel: 780‑427‑8050 To call toll free within Alberta, dial 310‑0000 first.
The Ministry of Energy Annual Report 2016‑17 is available on the following website: www.energy.alberta.ca
Current information about the organizations that were part of the Ministry of Energy in 2016‑17 is available at the following websites
For the Department of Energy: www.energy.alberta.ca
For the Alberta Energy Regulator: www.aer.ca
For the Alberta Utilities Commission: www.auc.ab.ca


MINISTRY OF ENERGY 2016‑2017
www.energy.alberta.ca
www.aer.ca
www.auc.ab.ca
ISSN 1703‑4574 (Print)
ISSN 1703‑4582 (Online)