alberta's occupational demand and supply outlook...
TRANSCRIPT

Alberta’s Occupational Demand and Supply
OutlookOutlook
2011‐2021

2
Disclaimer Statement
Alberta Human Services provides labour market information to
assist both the government and the public in decision-making.
Occupational demand and supply outlooks are affected by a
variety of factors and will change over time. When making
decisions based on projections, multiple sources of information
should always be considered.
Work began on the Alberta Occupational Demand Outlook Model
ten years ago. Currently, the model is able to predict occupational
demand for 520 occupations for Alberta.
In 2003, work began on a counterpart model, the Alberta
Occupational Supply Outlook Model, which helps provide insight
into current labour market supply and possible supply and
demand imbalances that may occur in the future.
Human Services continues to enhance this model’s precision and
encourages readers to provide advice and feedback on its
usefulness and opportunities for improvements to

3
Overview To better understand and respond to future labour market needs, Human Services has
developed both the Alberta Occupational Demand and Supply Outlook Models. Figure 1
provides an overview of the two models. These models project the demand and supply
for different occupations in Alberta between 2011 and 2021. By calculating imbalances
between demand and supply, future occupational shortages or surpluses can be
forecasted. Results from the two models help users make better decisions about
developing and funding programs and policies as well as personal decisions about
education, jobs and careers.
Figure 1: An Overview of the Occupational Demand and Supply Models
Each model can be broken down into sub-models, which use many data sources. The
Alberta Occupational Supply Outlook Model (AOSOM) has 30 linked sub-models and
over 100,000 data series. The Alberta Occupational Demand Outlook Model (AODOM)
has been used for the past ten years and has proven to be reliable.
Once occupational demand and supply have been projected, the cumulative labour
shortages are calculated to measure imbalances.
Occupational Supply
Education Demographics
Occupational Demand/Supply
Imbalances
Economic Outlook
Occupational Outlook
Occupational Demand
Occupational Demand Model
Occupational Supply Model

4
Over the forecast period 2011 to 2021, using both the Alberta Occupational Demand and
Supply Outlook Models, potential labour imbalances for different occupations can be
anticipated. It should be noted that both of these models make projections and therefore
carry assumptions that may change in the future. Hence, a labour shortage or surplus
may not be as severe as the models predict. For example, as occupational demand and
supply conditions change, individuals may decide to enter a field of study that reflects
these current conditions and more people may be attracted to the province. The results
of these models are intended as indicators of where the current situation in Alberta may
lead in future years.
This year’s findings of the two models are provided in this report. Human Services
believes that continued work on and development of the AOSOM will help to provide
important information on labour market imbalances. Human Services encourages
readers to provide advice and feedback on the model’s usefulness, construction and
results. Please see Appendices A and B for a detailed view of the model’s methodology
and assumptions.

5
Overall Occupational Outlook
Over the next ten years, Alberta’s labour market is projected to grow by approximately
607,000 workers at an annual average rate of 2.4%. A net increase of 492,000 workers
is expected to join the labour force, as occupational supply increases at an annual rate
of 1.9%. For the coming decade, Alberta could experience a labour shortage of
approximately 114,0001 workers. Table 1 shows more detailed information about the
overall occupational outlook. The numbers in the table represent the number of workers
in Alberta.
Table 12
Overall Occupational Demand and Supply Outlook for Alberta, 2010 - 2021
2010 2011 2012 2013 2014 2015 2016 2017 2018 2019 2020 2021
Demand (000s) 2,016 2,071 2,123 2,176 2,232 2,294 2,360 2,415 2,472 2,522 2,568 2,623
Supply (000s) 2,157 2,196 2,241 2,288 2,337 2,392 2,449 2,496 2,543 2,580 2,611 2,650
Annual Shortage2 15,814 6,397 6,997 6,746 7,279 8,638 8,100 9,909 12,419 15,145 16,834
Cumulative Shortage 15,814 22,211 29,208 35,954 43,233 51,871 59,971 69,880 82,299 97,444 114,278
Appendices C and D list occupational demand and supply projections, along with
forecasted imbalances, for 129 occupations at the 3-digit NOC-S3 and 280 occupations
at the 4-digit NOC-S.
1 Both models carry assumptions that may change in the future, therefore, these numbers are likely to change 2 Labour shortage = (Demand [year t+1] – Demand [year t]) – (Supply [year t+1] – Supply [year t]) 3 NOC-S: National Occupational Classification – Statistics, link: http://www.statcan.gc.ca/subjects-sujets/standard-norme/soc-cnp/2001/noc2001-cnp2001-menu-eng.htm

6
Appendix A
Alberta Occupational Demand and Supply Outlook Models’ Methodologies Figure 2 provides a detailed view of how occupational demand and supply imbalances
are projected. Two main components in the Alberta Occupational Demand Outlook Model (AODOM)
are the economic and occupational components. The economic component produces an
outlook of Alberta’s economy. Once the performance of the economy is projected, the
occupational component calculates the employment that is required to maintain the
projected growth. The Alberta Occupational Supply Outlook Model (AOSOM) makes occupational supply
projections with a series of changes that begin with a demographic outlook and end with
occupational supply for occupations. The model has three major components:
demographic, education and replacement demand. Education has a central importance
in this model because of its role in training the labour force.
Industry Output Forecast
Industry Employment Forecast
Changing Distribution of Occupations by Industry
Overall Occupational Growth (Net New Jobs)
Projected Annual Employment Levels For All Occupations
Demographic Projection Gross Migration & Ethnicity/Disability
Distribution Assumptions
Demographic Outlook Age/Sex/ Net Migration.
Participation Rate Stock-Flow Coefficient
projection
Labour Supply by OccupationAge/Gender/Ethnicity/
Work Activity Limitations
Projected Death, Retirements and Other
Outflow Attrition/Separation Coefficients
Attrition Coefficients Applied To
Employment Levels
Projected Replacement Demand by Occupation
Supply/Demand Imbalances
Employment by OccupationAge/Gender/Ethnicity/
Work Activity Limitations (based on historic share)
Enrolment, Graduation, Educational Attainment by
Level of Schooling & Major Field of
Study
Replacement Demand Component
Demographic Component
Education Component
Alberta Occupational
Demand Outlook Model
Figure 2: A Detailed View of the Alberta Occupational Supply and Demand Outlook Models

7
Appendix B
Alberta Occupational Supply Outlook Model Assumptions
As with all forecasts, a number of assumptions are used to derive the results. The model
can utilize different assumptions to test various economic scenarios. The assumptions
used to generate the results in Appendix C & D are set out below.
Alberta’s Key Economic Indicators • The average annual1 growth rate for the Gross Domestic Product (GDP) is 3.1%.
• The average annual unemployment rate is 4.7%.
• The average annual employment growth rate is 1.6%.
• The average annual participation rate is 72.2%.
Demographic Component • Population levels by age and gender groups are determined by a detailed
population projection by single year age cohorts. Total population averages 1.6% growth over 2011 - 2021.
Migration • The level of in-migration equals the projected net-migration plus the assumed
out-migration.
• Age and gender distributions for in-migration and out-migration are determined by the historic age and gender distribution for net migration.
• Future immigrants by education type will experience similar occupational outcomes as existing residents of Alberta.
Aboriginals • The Alberta aboriginal population’s age specific birth and death rates are the
same as the Canadian aboriginal population’s rates.
Visible Minorities • The visible minorities’ age/gender birth and death rates are equal to the Alberta
general population’s birth and death rates.
• The visible minorities’ less than 15 years old age groups (less than 1, 1-3, 4-9, 10-15 years) are assumed to have the same distributions as the Alberta younger age groups.
1 The average annual data is for the period 2011 - 2021

8
Appendix B
Demographic Component (Cont.)
Activity Limitations • To calculate the number of people with activity limitations, a share approach by
age and gender was used.2
Education Component Enrolment & Graduation
• The number of people who attend school is calculated as a share of the total number in that age or gender group. This proportion is based on historic shares.
• The secondary school enrolment rates for males and females over the forecast follow the historic trends from 2004-2005 to 2009-2010.
• Enrolment rates for post-secondary institutions over the forecast follow the historic trends from 2002 to 2009.
• Graduation rates are determined by level of schooling, field of study, age and gender. Graduation rates are calculated as a share of those who could potentially graduate and are kept constant over the forecast period.
• The overall number of university, college, vocational and trades graduates is determined by applying the graduate rate to the different age groups who are enrolled in that institution and could potentially graduate.
• Drop out rates and mature student rates are used for the different fields of study and level of schooling.
• Migration rates by educational attainment are allowed to adjust to reflect relative demand conditions in Alberta.
Educational Attainment • To calculate the number of people with university, college, vocational and trades,
and high school education, a stock-flow approach3 is used.
• Those with less than a high school education are determined to be those not already accounted for in other educational attainment categories.
2 Share Approach: A method to estimate the future number of people in a group of interest. The proportion of the group of interest to the general population is applied to the forecasted general population estimates to find the predicted group of interest’s population. Example:
Activity LimitationsAlberta Population t t+1 t+1
The proportion at time t
Is Multiplied by the Projected Alberta Population for time t+1
To find the projected number of people with activities limitations
for time t+1
x Alberta Population Projection = Activity Limitation Population
3 Stock-Flow Approach: A method in estimating the future population of people in a group of interest. To find the forecasted population, the population from the previous year is adjusted to add those expected to enter that group and subtract those that are expected to leave that group. Example:
t+1 t t+1 t+1
plusRecent
Graduates of College/Trades
minus
People Leaving Group due to
death, retirement, etc.
Number of people with
College/Trades Training
=Number of people with
College/Trades Training

9
Appendix B
Education Component (Cont.) Educational Attainment (Cont.)
• Less than high school educational attainment is adjusted to reflect the estimated portion of mature students in post-secondary institutions that do not have a high school diploma. High school educational attainment is also adjusted to subtract recent graduates from university, college and vocational and trades.
• The overall enrolment rate for mature students is used for all age groups within the mature student category.
• To project educational attainment by field of study, the historic relative enrolment rate for each age and sex cohort is maintained over the projection period.
• The share of new graduates by field of study for each age, sex group is constant over time.
• Educational attainment is based on the new graduate forecast plus net inflows from migration less deaths.
Replacement Demand Component
• Retirement rates are derived from Alberta Labour Force Survey (LFS) data, at a fairly aggregate occupational level.
• Retirement by occupation uses the age distribution in that occupation given by the census. As people working in a specific occupation enter older age cohorts a larger share will retire. Age specific retirement rates rise over time to the long-term trend toward falling median retirement ages.
• Other labour force separation rates are derived from the Alberta LFS data at the major group level of aggregation. These separation rates are kept constant over the forecast period.
• Emigration, out-migration and death rates are assumed to be the same for those employed as the general population for a particular age/gender group.
Occupational Component
• Potential occupational supply is determined over the historical period by the historical distribution of occupation by educational attainment—four levels of schooling and 46 post-secondary fields of study.
• The estimated number of individuals by occupation, age and gender is scaled up to ensure that, in general, the relative balance between labour supply and demand in 2006 is maintained.
• Over the forecast period, the distribution of occupation by educational attainment will adjust to changes in relative occupation to educational demand at a pace that is consistent with differences in occupational separation rates.
• Potential occupational supply is translated into actual occupational supply by using historic participation rates by occupation. Over the forecast period, occupational participation rates adjust to reflect changes in relative occupational demand.
10
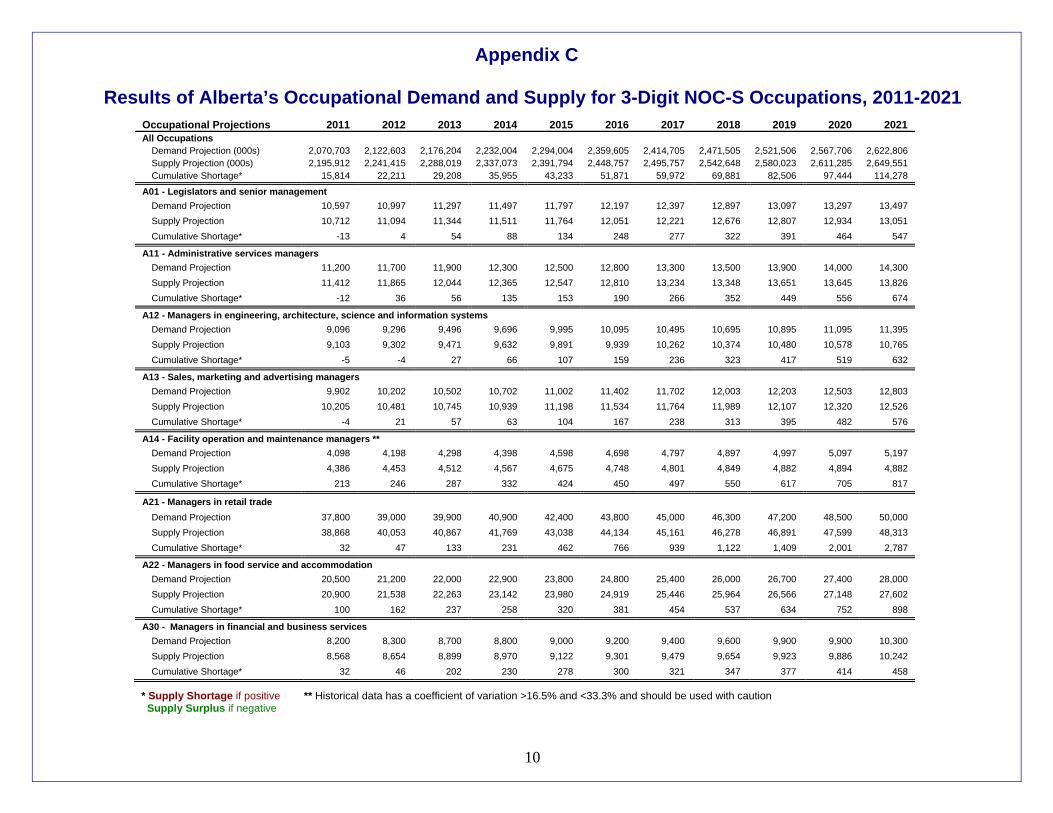
Results of Alberta’s Occupational Demand and Supply for 3-Digit NOC-S Occupations, 2011-2021
Occupational Projections 2011 2012 2013 2014 2015 2016 2017 2018 2019 2020 2021 All Occupations
Demand Projection (000s) 2,070,703 2,122,603 2,176,204 2,232,004 2,294,004 2,359,605 2,414,705 2,471,505 2,521,506 2,567,706 2,622,806 Supply Projection (000s) 2,195,912 2,241,415 2,288,019 2,337,073 2,391,794 2,448,757 2,495,757 2,542,648 2,580,023 2,611,285 2,649,551 Cumulative Shortage* 15,814 22,211 29,208 35,955 43,233 51,871 59,972 69,881 82,506 97,444 114,278
A01 - Legislators and senior management Demand Projection 10,597 10,997 11,297 11,497 11,797 12,197 12,397 12,897 13,097 13,297 13,497 Supply Projection 10,712 11,094 11,344 11,511 11,764 12,051 12,221 12,676 12,807 12,934 13,051 Cumulative Shortage* -13 4 54 88 134 248 277 322 391 464 547
A11 - Administrative services managers Demand Projection 11,200 11,700 11,900 12,300 12,500 12,800 13,300 13,500 13,900 14,000 14,300 Supply Projection 11,412 11,865 12,044 12,365 12,547 12,810 13,234 13,348 13,651 13,645 13,826 Cumulative Shortage* -12 36 56 135 153 190 266 352 449 556 674
A12 - Managers in engineering, architecture, science and information systems Demand Projection 9,096 9,296 9,496 9,696 9,995 10,095 10,495 10,695 10,895 11,095 11,395 Supply Projection 9,103 9,302 9,471 9,632 9,891 9,939 10,262 10,374 10,480 10,578 10,765 Cumulative Shortage* -5 -4 27 66 107 159 236 323 417 519 632
A13 - Sales, marketing and advertising managers Demand Projection 9,902 10,202 10,502 10,702 11,002 11,402 11,702 12,003 12,203 12,503 12,803 Supply Projection 10,205 10,481 10,745 10,939 11,198 11,534 11,764 11,989 12,107 12,320 12,526 Cumulative Shortage* -4 21 57 63 104 167 238 313 395 482 576
A14 - Facility operation and maintenance managers ** Demand Projection 4,098 4,198 4,298 4,398 4,598 4,698 4,797 4,897 4,997 5,097 5,197 Supply Projection 4,386 4,453 4,512 4,567 4,675 4,748 4,801 4,849 4,882 4,894 4,882 Cumulative Shortage* 213 246 287 332 424 450 497 550 617 705 817
A21 - Managers in retail trade Demand Projection 37,800 39,000 39,900 40,900 42,400 43,800 45,000 46,300 47,200 48,500 50,000 Supply Projection 38,868 40,053 40,867 41,769 43,038 44,134 45,161 46,278 46,891 47,599 48,313 Cumulative Shortage* 32 47 133 231 462 766 939 1,122 1,409 2,001 2,787
A22 - Managers in food service and accommodation Demand Projection 20,500 21,200 22,000 22,900 23,800 24,800 25,400 26,000 26,700 27,400 28,000 Supply Projection 20,900 21,538 22,263 23,142 23,980 24,919 25,446 25,964 26,566 27,148 27,602 Cumulative Shortage* 100 162 237 258 320 381 454 537 634 752 898
A30 - Managers in financial and business services Demand Projection 8,200 8,300 8,700 8,800 9,000 9,200 9,400 9,600 9,900 9,900 10,300 Supply Projection 8,568 8,654 8,899 8,970 9,122 9,301 9,479 9,654 9,923 9,886 10,242 Cumulative Shortage* 32 46 202 230 278 300 321 347 377 414 458
Appendix C
* Supply Shortage if positive ** Historical data has a coefficient of variation >16.5% and <33.3% and should be used with caution Supply Surplus if negative

11
Results of Alberta’s Occupational Demand and Supply for 3-Digit NOC-S Occupations, 2011-2021
Occupational Projections 2011 2012 2013 2014 2015 2016 2017 2018 2019 2020 2021 A32 - Managers in health, education, social and community services
Demand Projection 11,102 11,402 11,802 12,102 12,402 12,902 13,202 13,502 13,803 14,103 14,403 Supply Projection 11,298 11,595 11,989 12,281 12,555 13,035 13,325 13,601 13,873 14,139 14,399 Cumulative Shortage* 3 6 13 20 46 66 76 100 129 163 203
A33 - Managers in public administration ** Demand Projection 2,598 2,698 2,698 2,698 2,798 2,798 2,998 2,998 3,098 3,198 3,298 Supply Projection 2,595 2,692 2,687 2,682 2,772 2,760 2,946 2,917 2,983 3,044 3,097 Cumulative Shortage* 4 7 13 18 28 39 53 82 117 155 202
A36 - Managers in other services ** Demand Projection 1,700 1,800 1,800 1,800 1,900 2,000 2,000 2,100 2,100 2,200 2,200 Supply Projection 1,863 1,951 1,948 1,942 2,043 2,142 2,140 2,244 2,239 2,291 2,271 Cumulative Shortage* -40 -28 -25 -19 -20 -19 -17 -21 -16 32 52
A37 - Managers in construction and transportation Demand Projection 29,500 30,100 31,100 32,000 32,900 33,800 34,200 34,800 35,200 35,100 35,500 Supply Projection 30,111 30,700 31,609 32,419 33,204 33,916 34,232 34,843 35,163 34,956 35,213 Cumulative Shortage* -11 1 91 181 296 484 568 557 638 745 887
A38 - Managers in primary production (except agriculture) ** Demand Projection 4,500 4,600 4,700 4,800 4,900 5,100 5,200 5,400 5,500 5,600 5,600 Supply Projection 4,497 4,560 4,643 4,708 4,776 4,907 4,968 5,103 5,127 5,147 5,069 Cumulative Shortage* 4 40 57 92 124 193 232 297 373 453 531
A39 - Managers in manufacturing and utilities Demand Projection 6,602 6,902 7,002 7,202 7,302 7,503 7,703 7,803 8,103 8,203 8,303 Supply Projection 6,916 7,199 7,290 7,474 7,559 7,741 7,899 7,949 8,198 8,237 8,269 Cumulative Shortage* -15 2 12 27 43 61 103 153 204 265 333
B01 - Auditors, accountants and investment professionals Demand Projection 40,098 41,098 42,198 43,198 44,198 45,298 46,298 47,398 48,397 49,297 50,397 Supply Projection 40,940 41,878 42,939 43,890 44,853 45,935 46,900 47,937 48,816 49,534 50,394 Cumulative Shortage* 259 321 359 408 446 464 498 561 682 864 1,105
B02 - Human resources and business service professionals Demand Projection 21,104 21,704 22,204 22,704 23,205 23,805 24,305 24,905 25,505 26,005 26,605 Supply Projection 21,774 22,373 22,852 23,306 23,730 24,184 24,664 25,207 25,722 26,121 26,590 Cumulative Shortage* 28 29 51 97 173 319 339 396 481 583 713
B11 - Finance and insurance administrative occupations Demand Projection 38,498 39,598 40,498 41,498 42,598 43,598 44,598 45,597 46,497 47,197 48,297 Supply Projection 39,326 40,370 41,207 42,081 43,002 43,901 44,803 45,700 46,492 47,074 48,005 Cumulative Shortage* 173 229 292 417 596 698 796 898 1,007 1,125 1,294
Appendix C
* Supply Shortage if positive ** Historical data has a coefficient of variation >16.5% and <33.3% and should be used with caution Supply Surplus if negative

12
Results of Alberta’s Occupational Demand and Supply for 3-Digit NOC-S Occupations, 2011-2021
Occupational Projections 2011 2012 2013 2014 2015 2016 2017 2018 2019 2020 2021 B21 - Secretaries, recorders and transcriptionists
Demand Projection 14,502 14,702 15,202 15,502 15,902 16,302 16,802 17,202 17,503 17,803 18,303 Supply Projection 15,116 15,318 15,828 16,133 16,542 16,951 17,454 17,848 18,125 18,392 18,850 Cumulative Shortage* -15 -17 -27 -32 -40 -50 -53 -46 -23 10 51
B31 - Administrative and regulatory occupations Demand Projection 54694 56394 57593 58993 60493 62193 63693 64993 66492 67692 68992 Supply Projection 55868 57466 58573 59760 61260 62750 64121 65269 66597 67600 68664 Cumulative Shortage* 429 531 623 836 837 1,046 1,174 1,326 1,499 1,695 1,931
B41 - Clerical supervisors Demand Projection 18696 19296 19696 20295 20695 21195 21795 22195 22695 23095 23695 Supply Projection 19102 19695 20084 20672 21059 21543 22122 22484 22926 23258 23771 Cumulative Shortage* -4 3 14 25 39 54 75 113 171 238 326
B51 - Clerical occupations, general office skills Demand Projection 31602 32202 33102 34002 34902 35802 36702 37603 38303 39103 40103 Supply Projection 32926 33520 34355 35219 36083 36896 37690 38302 38621 38763 38862 Cumulative Shortage* 575 581 646 682 718 806 911 1,199 1,581 2,239 3,140
B52 - Office equipment operators Demand Projection 7702 7902 8102 8202 8402 8702 8902 9102 9302 9502 9702 Supply Projection 8151 8258 8382 8478 8611 8768 8931 9084 9224 9355 9468 Cumulative Shortage* 50 143 219 223 291 434 470 517 577 647 734
B53 - Finance and insurance clerks Demand Projection 46100 47400 48600 49700 51000 52400 53500 54900 55800 56900 58000 Supply Projection 47764 49088 50306 51420 52732 54028 55032 56044 56417 56965 57450 Cumulative Shortage* 136 112 94 80 68 172 268 656 1,183 1,735 2,350
B54 - Administrative support clerks Demand Projection 32402 33302 34202 35002 36002 36902 37702 38702 39403 40203 41003 Supply Projection 32842 33746 34652 35458 36464 37362 38143 39080 39700 40406 41086 Cumulative Shortage* 60 56 50 44 37 40 58 122 201 296 416
B55 - Library, correspondence and related information clerks Demand Projection 16300 16800 17100 17500 18100 18600 19100 19500 19900 20400 20900 Supply Projection 17505 17924 18168 18532 19052 19420 19676 19817 19940 20150 20331 Cumulative Shortage* 95 176 232 268 348 480 724 983 1,260 1,550 1,869
B56 - Mail and message distribution occupations Demand Projection 10902 11102 11402 11502 11802 12102 12302 12602 12902 13103 13403 Supply Projection 11190 11330 11586 11682 11949 12191 12367 12639 12904 13063 13305 Cumulative Shortage* 111 171 215 219 253 311 334 363 398 439 497
Appendix C
* Supply Shortage if positive Supply Surplus if negative

13
Results of Alberta’s Occupational Demand and Supply for 3-Digit NOC-S Occupations, 2011-2021
Occupational Projections 2011 2012 2013 2014 2015 2016 2017 2018 2019 2020 2021 B57 - Recording, scheduling and distributing occupations
Demand Projection 31300 32100 32900 33700 34600 35400 36500 37400 38200 39000 39900 Supply Projection 33212 33817 34445 35054 35744 36421 37232 37784 38206 38596 39050 Cumulative Shortage* 188 383 555 746 956 1,079 1,368 1,716 2,094 2,504 2,950
C01 - Physical science professionals Demand Projection 7100 7300 7400 7500 7800 7900 8100 8400 8500 8600 8800 Supply Projection 7371 7519 7570 7632 7881 7966 8139 8406 8467 8524 8669 Cumulative Shortage* 130 182 230 268 320 334 362 394 433 476 531
C02 - Life science professionals ** Demand Projection 2198 2198 2198 2298 2398 2398 2598 2598 2598 2697 2697 Supply Projection 2198 2198 2198 2298 2374 2370 2534 2498 2456 2492 2430 Cumulative Shortage* 1 1 1 1 24 29 65 100 143 206 269
C03 -Civil, mechanical, electrical and chemical engineers Demand Projection 21598 22298 22698 23198 23598 24298 24798 25397 25797 26297 26997 Supply Projection 22436 22965 23350 23736 24048 24600 24983 25446 25690 26009 26514 Cumulative Shortage* 63 234 249 363 450 599 715 853 1,009 1,189 1,385
C04 - Other engineers Demand Projection 22102 22802 23102 23702 24302 24902 25603 26203 26903 27503 28003 Supply Projection 22625 23327 23588 24134 24687 25206 25794 26260 26815 27232 27539 Cumulative Shortage* 76 74 113 167 215 296 407 542 686 869 1,063
C05 - Architects, urban planners and land surveyors ** Demand Projection 4804 4804 5005 5005 5105 5305 5405 5505 5605 5705 5905 Supply Projection 4945 4937 5087 5067 5163 5312 5381 5448 5514 5576 5703 Cumulative Shortage* 58 66 116 135 140 191 222 255 289 328 400
C07 - Computer and information systems professionals Demand Projection 38996 40096 40896 41995 42895 44195 45095 46195 47095 48095 49195 Supply Projection 39581 40652 41401 42388 43231 44230 45045 46006 46761 47561 48431 Cumulative Shortage* 317 346 396 509 567 867 952 1,091 1,236 1,435 1,666
C11 - Technical occupations in physical sciences Demand Projection 7302 7502 7602 7802 8003 8103 8403 8603 8703 8903 9103 Supply Projection 7852 7952 8007 8105 8186 8281 8487 8558 8507 8542 8557 Cumulative Shortage* 250 350 394 497 616 621 714 844 995 1,160 1,345
C12 - Technical occupations in life sciences ** Demand Projection 4202 4202 4302 4602 4702 4702 4803 4803 5003 5003 5103 Supply Projection 4287 4285 4373 4661 4726 4717 4798 4770 4915 4857 4893 Cumulative Shortage* 14 16 28 41 75 85 103 132 187 244 308
Appendix C
* Supply Shortage if positive ** Historical data has a coefficient of variation >16.5% and <33.3% and should be used with caution Supply Surplus if negative

14
Results of Alberta’s Occupational Demand and Supply for 3-Digit NOC-S Occupations, 2011-2021
Occupational Projections 2011 2012 2013 2014 2015 2016 2017 2018 2019 2020 2021 C13 - Technical occupations in civil, mechanical and industrial engineering
Demand Projection 7200 7400 7600 7800 7900 8100 8300 8500 8700 8700 8900 Supply Projection 7274 7443 7607 7778 7861 8014 8169 8310 8449 8386 8507 Cumulative Shortage* 26 57 93 123 139 186 231 290 351 414 493
C14 - Technical occupations in electronics and electrical engineering Demand Projection 14402 14902 15302 15602 16002 16503 16803 17303 17603 18003 18403 Supply Projection 14772 15218 15567 15813 16164 16607 16861 17270 17466 17755 18036 Cumulative Shortage* 29 83 135 189 238 295 341 432 535 647 766
C15 - Technical occupations in architecture, drafting and surveying Demand Projection 9502 9802 10102 10302 10502 10602 11002 11202 11402 11603 12003 Supply Projection 9928 10114 10307 10464 10610 10694 11035 11144 11248 11340 11535 Cumulative Shortage* 74 187 294 337 391 408 466 557 653 762 966
C16 - Other technical inspectors and regulatory officers Demand Projection 10,196 10,496 10,596 10,896 11,195 11,495 11,695 11,895 12,295 12,395 12,695 Supply Projection 10,571 10,857 10,950 11,232 11,493 11,767 11,931 12,087 12,440 12,485 12,721 Cumulative Shortage* 127 141 148 166 204 231 267 310 357 412 476
C17 - Transportation officers and controllers ** Demand Projection 3,000 3,000 3,100 3,100 3,200 3,300 3,300 3,400 3,400 3,500 3,500 Supply Projection 3,000 3,000 3,099 3,099 3,170 3,268 3,267 3,362 3,354 3,444 3,431 Cumulative Shortage* 0 0 1 1 30 32 33 39 46 56 69
C18 - Technical occupations in computer and information systems Demand Projection 10,200 10,500 10,700 10,900 11,300 11,500 11,800 12,200 12,500 12,700 13,000 Supply Projection 10,711 10,958 11,070 11,144 11,439 11,589 11,841 12,129 12,299 12,301 12,368 Cumulative Shortage* -11 42 130 257 361 411 459 571 701 899 1,132
D01 - Physicians, dentists and veterinarians Demand Projection 10,800 10,800 10,900 11,300 11,500 11,900 12,200 12,400 12,900 13,000 13,400 Supply Projection 10,800 10,799 10,840 11,118 11,195 11,463 11,536 11,489 11,667 11,447 11,419 Cumulative Shortage* 100 101 160 282 405 538 764 1,011 1,333 1,653 2,081
D03 - Pharmacists, dietitians and nutritionists ** Demand Projection 2,298 2,398 2,398 2,398 2,598 2,698 2,698 2,798 2,798 2,998 2,998 Supply Projection 2,302 2,402 2,400 2,399 2,598 2,695 2,690 2,732 2,668 2,785 2,703 Cumulative Shortage* -3 -2 -1 0 1 4 8 67 130 214 295
D04 - Therapy and assessment professionals Demand Projection 7,004 6,904 7,004 7,304 7,404 7,604 7,804 8,104 8,304 8,505 8,605 Supply Projection 7,089 6,972 7,057 7,340 7,420 7,569 7,718 7,910 7,939 7,906 7,763 Cumulative Shortage* 13 29 45 61 82 133 184 292 463 697 939
Appendix C
* Supply Shortage if positive ** Historical data has a coefficient of variation >16.5% and <33.3% and should be used with caution Supply Surplus if negative

15
Results of Alberta’s Occupational Demand and Supply for 3-Digit NOC-S Occupations, 2011-2021
Occupational Projections 2011 2012 2013 2014 2015 2016 2017 2018 2019 2020 2021 D11 - Nurse supervisors and registered nurses
Demand Projection 36,502 36,302 36,902 37,702 38,702 39,902 41,002 42,102 43,002 43,902 44,902 Supply Projection 36,796 36,592 36,925 37,533 38,313 39,027 39,541 39,983 40,164 40,301 40,462 Cumulative Shortage* -195 -191 77 268 488 974 1,560 2,218 2,938 3,701 4,540
D21 - Medical technologists and technicians (except dental health) Demand Projection 11,302 11,302 11,402 11,902 12,102 12,602 12,802 13,102 13,302 13,802 14,103 Supply Projection 11,264 11,235 11,312 11,755 11,934 12,336 12,491 12,748 12,879 13,249 13,398 Cumulative Shortage* 37 66 89 147 167 266 311 354 422 553 703
D22 - Technical occupations in dental health care ** Demand Projection 3,198 3,198 3,298 3,398 3,498 3,598 3,598 3,798 3,798 3,898 3,998 Supply Projection 3,284 3,270 3,369 3,468 3,560 3,639 3,633 3,791 3,739 3,783 3,812 Cumulative Shortage* 15 29 30 31 39 60 66 108 159 215 286
D23 - Other technical occupations in health care (except dental) Demand Projection 15,098 15,198 15,398 15,798 16,098 16,698 17,098 17,598 17,998 18,398 18,797 Supply Projection 15,457 15,508 15,687 16,024 16,256 16,870 17,250 17,598 17,802 17,979 18,144 Cumulative Shortage* 42 91 112 175 243 229 249 401 597 819 1,054
D31 - Assisting occupations in support of health services Demand Projection 33,600 33,700 34,300 35,100 36,100 37,200 38,300 39,100 40,100 41,100 41,900 Supply Projection 34,342 34,347 34,702 35,268 36,076 36,861 37,802 38,419 39,191 39,900 40,378 Cumulative Shortage* 58 153 398 632 824 1,139 1,298 1,481 1,709 2,000 2,322
E01 - Judges, lawyers and Quebec notaries ** Demand Projection 7,000 7,200 7,300 7,500 7,600 7,800 8,000 8,100 8,400 8,600 8,800 Supply Projection 7,093 7,293 7,393 7,592 7,691 7,892 8,090 8,181 8,469 8,651 8,826 Cumulative Shortage* 7 7 7 8 9 8 11 19 31 49 74
E02 - Psychologists, social workers, counsellors, clergy and probation officers Demand Projection 14,004 14,204 14,604 14,904 15,504 15,904 16,405 16,805 17,305 17,605 18,005 Supply Projection 14,241 14,446 14,850 15,153 15,696 16,059 16,539 16,923 17,406 17,665 18,022 Cumulative Shortage* 61 56 52 49 106 144 164 180 197 238 281
E03 - Policy and program officers, researchers and consultants Demand Projection 23,200 24,000 24,500 25,100 25,700 26,400 27,000 27,700 28,300 28,900 29,500 Supply Projection 23,580 24,389 24,893 25,490 26,085 26,774 27,356 28,032 28,599 29,159 29,710 Cumulative Shortage* 20 12 7 10 15 26 44 68 101 141 190
E11 - University professors and assistants Demand Projection 16,198 16,998 17,598 18,198 18,798 19,397 19,997 20,397 20,797 21,197 21,497 Supply Projection 16,174 16,946 17,527 18,106 18,686 19,261 19,833 20,204 20,570 20,935 21,197 Cumulative Shortage* 25 52 71 93 113 138 166 195 228 264 301
Appendix C
* Supply Shortage if positive ** Historical data has a coefficient of variation >16.5% and <33.3% and should be used with caution Supply Surplus if negative

16
Results of Alberta’s Occupational Demand and Supply for 3-Digit NOC-S Occupations, 2011-2021
Occupational Projections 2011 2012 2013 2014 2015 2016 2017 2018 2019 2020 2021 E12 - College and other vocational instructors
Demand Projection 11,202 11,702 12,002 12,402 12,802 13,203 13,603 13,903 14,203 14,403 14,703 Supply Projection 11,265 11,754 12,040 12,427 12,810 13,192 13,574 13,856 14,135 14,313 14,588 Cumulative Shortage* 36 48 61 75 92 109 127 146 167 189 214
E13 - Secondary and elementary school teachers and educational counsellors Demand Projection 43,700 45,900 47,200 49,100 50,600 52,300 53,900 55,000 56,000 57,100 58,100 Supply Projection 44,995 47,157 48,396 50,134 51,562 53,191 54,659 55,607 56,421 57,315 58,072 Cumulative Shortage* 5 43 104 266 338 409 541 694 879 1,085 1,328
E21 - Paralegals, social services and occupations in education and religion, n.e.c. *** (**) Demand Projection 46,396 46,796 47,696 49,096 50,295 51,795 53,095 54,295 55,695 56,995 57,995 Supply Projection 47,616 48,012 48,864 50,223 51,350 52,729 53,904 54,943 56,171 57,276 58,055 Cumulative Shortage* -18 -14 34 74 147 268 394 555 726 921 1,142
F01 - Librarians, archivists, conservators and curators ** Demand Projection 1,100 1,100 1,100 1,100 1,200 1,200 1,200 1,300 1,400 1,500 1,500 Supply Projection 1,171 1,160 1,143 1,133 1,224 1,213 1,202 1,288 1,372 1,450 1,427 Cumulative Shortage* 29 40 57 67 76 87 98 112 128 150 173
F02 - Writing, translating and public relations professionals Demand Projection 9,800 10,000 10,400 10,600 10,800 11,200 11,400 11,800 12,000 12,300 12,500 Supply Projection 9,805 9,998 10,388 10,577 10,767 11,137 11,311 11,650 11,785 12,011 12,118 Cumulative Shortage* -5 2 12 23 33 63 89 150 215 289 382
F03 - Creative and performing artists Demand Projection 8,502 8,802 9,102 9,402 9,703 10,103 10,403 10,703 10,803 11,103 11,403 Supply Projection 8,714 8,982 9,256 9,525 9,799 10,129 10,394 10,648 10,689 10,924 11,148 Cumulative Shortage* -12 19 45 77 102 173 207 254 313 378 454
F11 - Technical occupations in libraries, archives, museums and art galleries ** Demand Projection 2,100 2,100 2,200 2,200 2,400 2,400 2,500 2,600 2,600 2,600 2,700 Supply Projection 2,202 2,185 2,266 2,247 2,432 2,413 2,498 2,580 2,561 2,540 2,614 Cumulative Shortage* 98 115 134 153 168 187 202 220 239 260 286
F12 - Photographers, graphic arts technicians and technical and co-ordinating occupations in motion pictures, broadcasting and the performing arts ** Demand Projection 3,600 3,600 3,600 3,700 4,100 4,200 4,300 4,300 4,400 4,500 4,700 Supply Projection 3,708 3,705 3,701 3,799 4,174 4,255 4,333 4,307 4,378 4,447 4,606 Cumulative Shortage* -8 -5 -1 1 26 45 67 93 122 153 194
F14 - Creative designers and craftspersons Demand Projection 11,695 11,995 12,095 12,495 12,795 13,095 13,495 13,695 14,095 14,195 14,694 Supply Projection 11,965 12,235 12,297 12,653 12,904 13,157 13,508 13,646 13,971 13,985 14,345 Cumulative Shortage* 33 62 101 145 193 240 289 351 426 512 652
Appendix C
* Supply Shortage if positive ** Historical data has a coefficient of variation >16.5% and <33.3% and should be used with caution Supply Surplus if negative *** Not elsewhere classified

17
Results of Alberta’s Occupational Demand and Supply for 3-Digit NOC-S Occupations, 2011-2021
Occupational Projections 2011 2012 2013 2014 2015 2016 2017 2018 2019 2020 2021 F15 - Athletes, coaches, referees and related occupations
Demand Projection 10,200 10,400 10,700 11,000 11,300 11,700 12,000 12,400 12,700 13,000 13,200 Supply Projection 11,213 11,300 11,470 11,633 11,832 12,057 12,279 12,584 12,776 12,960 13,028 Cumulative Shortage* -13 100 230 367 468 643 722 816 924 1,040 1,173
G01 - Sales and service supervisors Demand Projection 35,300 36,300 37,500 38,600 39,700 41,100 42,300 43,400 44,300 45,500 46,800 Supply Projection 36,067 37,008 38,155 39,209 40,268 41,519 42,681 43,718 44,525 45,602 46,705 Cumulative Shortage* 433 493 545 591 632 782 819 882 975 1,098 1,295
G11 - Sales representatives, wholesale trade Demand Projection 26,202 27,002 27,602 28,302 29,202 30,102 31,002 31,803 32,503 33,303 34,303 Supply Projection 27,303 28,060 28,588 29,213 30,041 30,875 31,692 32,369 32,913 33,547 34,357 Cumulative Shortage* 98 141 213 288 360 426 509 632 789 954 1,145
G12 - Technical sales specialists, wholesale trade Demand Projection 14,500 14,900 15,200 15,600 16,100 16,600 17,000 17,500 17,900 18,300 18,800 Supply Projection 14,886 15,275 15,564 15,928 16,380 16,862 17,241 17,713 18,065 18,405 18,829 Cumulative Shortage* 114 125 136 172 221 239 259 287 335 395 471
G13 - Insurance and real estate sales occupations and buyers Demand Projection 21,198 21,798 22,298 22,898 23,598 24,098 24,698 25,198 25,697 26,197 26,797 Supply Projection 21,392 21,992 22,491 23,085 23,778 24,269 24,858 25,334 25,797 26,256 26,800 Cumulative Shortage* 7 7 8 14 20 30 40 65 101 143 198
G21 - Retail salespersons and sales clerks Demand Projection 70,898 72,998 74,698 76,698 79,298 81,898 84,198 86,597 88,397 90,697 93,597 Supply Projection 76,318 78,085 79,621 81,346 83,237 85,136 86,970 88,789 89,847 91,328 93,284 Cumulative Shortage* -19 314 478 753 1,462 2,162 2,629 3,209 3,952 4,770 5,714
G31 - Cashiers Demand Projection 35,500 36,600 37,600 38,700 40,100 41,500 42,600 43,900 44,800 46,000 47,500 Supply Projection 38,693 39,239 39,963 40,843 41,910 42,896 43,829 44,913 45,564 46,473 47,646 Cumulative Shortage* 8 561 837 1,058 1,390 1,805 1,971 2,187 2,436 2,727 3,054
G41 - Chefs and cooks Demand Projection 26,004 26,604 27,604 28,905 30,005 31,105 31,805 32,705 33,505 34,205 35,206 Supply Projection 28,022 28,466 29,319 30,462 31,406 32,317 32,823 33,515 34,079 34,525 35,238 Cumulative Shortage* -20 137 283 441 596 786 981 1,188 1,424 1,679 1,966
G51 - Occupations in food and beverage service Demand Projection 32,500 33,500 34,900 36,400 37,800 39,300 40,400 41,400 42,400 43,500 44,600 Supply Projection 34,347 35,238 36,437 37,718 38,879 40,218 41,189 42,028 42,846 43,743 44,600 Cumulative Shortage* 53 162 363 583 821 982 1,112 1,272 1,454 1,657 1,900
Appendix C
* Supply Shortage if positive Supply Surplus if negative

18
Results of Alberta’s Occupational Demand and Supply for 3-Digit NOC-S Occupations, 2011-2021
Occupational Projections 2011 2012 2013 2014 2015 2016 2017 2018 2019 2020 2021 G61 - Police officers and firefighters
Demand Projection 10,696 10,896 11,196 11,496 11,696 11,995 12,395 12,695 12,895 13,195 13,595 Supply Projection 10,711 10,908 11,206 11,503 11,699 11,995 12,382 12,663 12,837 13,106 13,459 Cumulative Shortage* -13 -11 -8 -5 -1 2 15 35 61 91 138
G62 - Other occupations in protective service ** Demand Projection 6,200 6,300 6,400 6,600 6,800 7,100 7,100 7,400 7,500 7,800 7,800 Supply Projection 6,200 6,299 6,396 6,592 6,786 7,079 7,070 7,360 7,449 7,735 7,720 Cumulative Shortage* 0 1 4 8 14 21 30 40 51 65 81
G63 - Security guards and related occupations Demand Projection 7,700 7,900 8,100 8,300 8,400 8,600 8,800 9,000 9,200 9,400 9,700 Supply Projection 8,498 8,646 8,774 8,895 8,941 9,086 9,229 9,365 9,492 9,612 9,821 Cumulative Shortage* 602 654 726 805 860 914 971 1,035 1,108 1,189 1,279
G71 - Occupations in travel and accommodation Demand Projection 10,902 11,302 11,502 11,902 12,302 12,602 13,003 13,303 13,503 13,903 14,203 Supply Projection 11,208 11,589 11,748 12,124 12,501 12,774 13,156 13,431 13,597 13,958 14,205 Cumulative Shortage* -7 12 53 77 101 128 145 171 205 243 297
G72 - Tour and recreational guides and casino occupations ** Demand Projection 3,300 3,300 3,400 3,500 3,600 3,800 3,900 4,100 4,200 4,300 4,400 Supply Projection 3,397 3,393 3,493 3,591 3,689 3,888 3,984 4,179 4,271 4,362 4,449 Cumulative Shortage* 3 7 7 9 11 13 16 21 30 38 51
G73 - Other occupations in travel, accommodation, amusement and recreation Demand Projection 7,500 7,700 8,000 8,200 8,500 8,800 9,000 9,200 9,500 9,700 9,900 Supply Projection 8,005 8,168 8,416 8,578 8,823 9,080 9,264 9,442 9,720 9,893 10,062 Cumulative Shortage* 295 333 384 422 477 520 536 558 580 608 638
G81 - Childcare and home support workers Demand Projection 29,998 31,098 31,898 32,898 33,898 34,998 35,998 36,797 37,597 38,297 38,997 Supply Projection 31,574 32,688 33,488 34,472 35,446 36,505 37,441 38,143 38,825 39,396 39,950 Cumulative Shortage* 25 11 11 26 52 94 158 255 374 502 648
G91 - Technical occupations in personal service Demand Projection 10,602 10,802 11,102 11,402 11,802 12,202 12,602 13,003 13,303 13,703 14,103 Supply Projection 10,697 10,894 11,193 11,492 11,885 12,284 12,682 13,072 13,360 13,746 14,117 Cumulative Shortage* 4 7 8 9 17 17 20 30 41 55 84
G92 - Other occupations in personal service Demand Projection 12,296 12,596 12,795 13,195 13,695 13,995 14,595 14,995 15,295 15,694 16,094 Supply Projection 12,570 12,866 13,063 13,454 13,947 14,227 14,808 15,180 15,444 15,802 16,142 Cumulative Shortage* 28 32 34 44 51 71 89 117 153 194 254
Appendix C
* Supply Shortage if positive ** Historical data has a coefficient of variation >16.5% and <33.3% and should be used with caution Supply Surplus if negative

19
Results of Alberta’s Occupational Demand and Supply for 3-Digit NOC-S Occupations, 2011-2021
Occupational Projections 2011 2012 2013 2014 2015 2016 2017 2018 2019 2020 2021 G93 - Cleaners
Demand Projection 55,000 56,500 58,000 59,500 61,100 62,900 64,300 65,900 67,300 68,600 70,300 Supply Projection 58,621 59,742 60,483 61,491 62,625 63,892 65,171 66,639 67,857 68,955 70,426 Cumulative Shortage* 379 758 1,517 2,009 2,475 3,008 3,129 3,261 3,443 3,645 3,875
G94 - Butchers and bakers Demand Projection 7,800 8,100 8,300 8,500 8,800 9,100 9,300 9,600 9,700 10,000 10,300 Supply Projection 8,066 8,371 8,569 8,767 9,066 9,358 9,552 9,846 9,932 10,219 10,503 Cumulative Shortage* 34 29 31 33 34 42 48 55 68 81 97
G96 - Food counter attendants, kitchen helpers and related occupations Demand Projection 36,596 37,596 38,996 40,595 42,095 43,795 44,895 45,995 47,095 48,195 49,494 Supply Projection 39,634 40,511 41,840 43,351 44,719 46,312 47,253 48,160 49,037 49,890 50,915 Cumulative Shortage* -37 86 158 246 379 485 644 837 1,059 1,307 1,582
G97 - Other sales and related occupations Demand Projection 22,902 23,602 24,002 24,702 25,602 26,502 27,202 28,003 28,603 29,403 30,403 Supply Projection 25,307 25,740 25,945 26,474 27,143 27,908 28,519 29,199 29,647 30,287 31,052 Cumulative Shortage* 194 461 656 827 1,059 1,193 1,283 1,403 1,555 1,715 1,950
G98 - Other elemental service occupations Demand Projection 5,204 5,304 5,504 5,604 5,804 6,005 6,205 6,305 6,505 6,705 6,805 Supply Projection 5,623 5,683 5,847 5,923 6,106 6,288 6,466 6,538 6,710 6,879 6,941 Cumulative Shortage* 79 119 155 179 196 215 236 265 293 324 362
H01 - Contractors and supervisors, trades and related workers Demand Projection 44,600 45,400 46,900 48,100 49,500 50,900 51,400 52,600 53,300 53,500 54,300 Supply Projection 46,084 46,814 48,205 49,317 50,609 51,924 52,290 53,347 53,879 53,900 54,507 Cumulative Shortage* 116 186 295 383 491 576 710 853 1,021 1,200 1,393
H02 - Supervisors, railway and motor transportation occupations ** Demand Projection 6,298 6,498 6,698 6,698 6,898 7,098 7,198 7,398 7,498 7,597 7,797 Supply Projection 6,488 6,682 6,872 6,859 7,050 7,242 7,328 7,516 7,599 7,681 7,858 Cumulative Shortage* 11 17 27 40 49 57 70 83 100 118 141
H11 - Plumbers, pipefitters and gas fitters Demand Projection 16,000 16,200 16,700 17,200 17,700 18,300 18,500 18,800 19,200 19,100 19,300 Supply Projection 17,007 17,132 17,569 18,043 18,514 19,087 19,238 19,484 19,821 19,635 19,745 Cumulative Shortage* 193 268 331 358 386 413 462 517 579 665 755
H12 - Carpenters and cabinetmakers Demand Projection 20,600 21,000 21,700 22,400 23,100 23,700 23,900 24,300 24,700 24,600 24,800 Supply Projection 21,863 22,100 22,640 23,235 23,843 24,346 24,432 24,714 24,987 24,750 24,799 Cumulative Shortage* 437 601 760 865 957 1,054 1,169 1,286 1,413 1,550 1,701
Appendix C
* Supply Shortage if positive ** Historical data has a coefficient of variation >16.5% and <33.3% and should be used with caution Supply Surplus if negative

20
Results of Alberta’s Occupational Demand and Supply for 3-Digit NOC-S Occupations, 2011-2021
Occupational Projections 2011 2012 2013 2014 2015 2016 2017 2018 2019 2020 2021 H13 - Masonry and plastering trades
Demand Projection 13,202 13,402 14,003 14,403 14,803 15,203 15,203 15,603 15,803 15,603 15,803 Supply Projection 13,892 14,051 14,604 14,956 15,342 15,703 15,644 15,985 16,110 15,824 15,938 Cumulative Shortage* 310 350 398 445 460 499 558 617 692 778 864
H14 - Other construction trades Demand Projection 15,998 16,298 16,898 17,398 17,997 18,397 18,597 18,997 19,097 19,097 19,197 Supply Projection 17,047 17,295 17,773 18,140 18,592 18,942 19,084 19,423 19,444 19,360 19,371 Cumulative Shortage* 651 704 826 958 1,106 1,157 1,214 1,275 1,354 1,438 1,527
H21 - Electrical trades and telecommunications occupations Demand Projection 27,798 28,298 29,198 29,998 30,898 31,598 32,098 32,698 33,198 33,198 33,597 Supply Projection 28,857 29,249 30,058 30,761 31,551 32,167 32,590 33,085 33,471 33,336 33,585 Cumulative Shortage* 442 550 641 738 848 932 1,008 1,114 1,228 1,362 1,514
H22 - Stationary engineers and power station and system operators ** Demand Projection 5,900 6,000 6,200 6,400 6,500 6,600 6,800 6,900 7,100 7,200 7,300 Supply Projection 5,900 5,997 6,191 6,384 6,474 6,560 6,738 6,813 6,982 7,048 7,109 Cumulative Shortage* 0 3 9 16 26 40 62 87 118 152 191
H31 - Machinists and related occupations Demand Projection 4,402 4,602 4,702 4,802 4,902 5,002 5,202 5,302 5,402 5,502 5,502 Supply Projection 4,587 4,785 4,862 4,943 5,029 5,122 5,315 5,405 5,493 5,578 5,557 Cumulative Shortage* 14 16 39 58 72 79 86 96 109 123 144
H32 - Metal forming, shaping and erecting trades Demand Projection 23,202 23,702 24,402 24,902 25,702 26,503 27,003 27,603 28,103 28,403 29,003 Supply Projection 25,421 25,841 26,397 26,735 27,376 28,027 28,342 28,744 29,025 29,091 29,454 Cumulative Shortage* -120 -40 104 266 425 575 759 957 1,177 1,411 1,647
H41 - Machinery and transportation equipment mechanics Demand Projection 25,800 26,300 27,100 27,700 28,400 29,200 29,900 30,500 31,200 31,600 32,200 Supply Projection 26,864 27,330 28,009 28,568 29,242 29,940 30,535 31,019 31,597 31,862 32,314 Cumulative Shortage* 436 470 591 632 658 760 865 981 1,103 1,238 1,386
H42 - Automotive service technicians Demand Projection 20,802 21,302 21,902 22,502 23,202 23,902 24,603 25,303 25,903 26,503 27,203 Supply Projection 21,427 21,925 22,481 23,030 23,676 24,319 24,955 25,578 26,093 26,603 27,204 Cumulative Shortage* 75 76 120 171 225 282 347 423 509 598 698
H43 - Other mechanics ** Demand Projection 2,296 2,395 2,395 2,595 2,595 2,695 2,695 2,695 2,695 2,994 2,994 Supply Projection 2,503 2,499 2,499 2,704 2,699 2,745 2,746 2,745 2,745 3,010 3,010 Cumulative Shortage* 96 200 200 194 199 253 252 253 254 287 287
Appendix C
* Supply Shortage if positive ** Historical data has a coefficient of variation >16.5% and <33.3% and should be used with caution Supply Surplus if negative

21
Results of Alberta’s Occupational Demand and Supply for 3-Digit NOC-S Occupations, 2011-2021
Occupational Projections 2011 2012 2013 2014 2015 2016 2017 2018 2019 2020 2021 H51 - Upholsterers, tailors, shoe repairers, jewellers and related occupations **
Demand Projection 3,604 3,704 3,704 3,804 3,904 4,004 4,104 4,304 4,405 4,505 4,605 Supply Projection 3,791 3,879 3,863 3,955 4,051 4,144 4,236 4,429 4,518 4,604 4,688 Cumulative Shortage* 110 122 138 147 151 158 166 173 185 199 214
H52 - Printing press operators, commercial divers and other trades and related occupations, n.e.c *** (**). Demand Projection 3,602 3,702 3,802 3,902 4,002 4,102 4,203 4,203 4,403 4,403 4,503 Supply Projection 3,885 3,955 4,024 4,090 4,155 4,235 4,311 4,280 4,447 4,406 4,463 Cumulative Shortage* 16 46 77 111 147 167 191 222 255 295 339
H53 - Other installers, repairers and servicers Demand Projection 11,100 11,400 11,800 12,100 12,500 12,900 13,100 13,400 13,600 13,700 14,000 Supply Projection 11,595 11,866 12,235 12,508 12,890 13,261 13,433 13,701 13,859 13,911 14,157 Cumulative Shortage* 105 134 165 192 210 239 267 299 341 389 444
H61 - Heavy equipment operators Demand Projection 18,100 18,500 19,100 19,600 20,100 20,600 20,900 21,400 21,800 21,800 22,200 Supply Projection 19,775 20,020 20,467 20,842 21,186 21,519 21,632 21,942 22,139 21,923 22,100 Cumulative Shortage* 725 880 1,033 1,158 1,314 1,481 1,668 1,858 2,061 2,277 2,500
H62 - Crane operators, drillers and blasters ** Demand Projection 3,096 3,196 3,495 3,495 3,595 3,695 3,695 3,795 3,895 3,895 3,895 Supply Projection 3,189 3,284 3,583 3,574 3,668 3,761 3,752 3,844 3,934 3,922 3,908 Cumulative Shortage* 8 14 14 23 29 36 45 53 63 75 88
H71 - Motor vehicle and transit drivers Demand Projection 64,398 66,098 67,598 68,498 70,098 71,898 73,398 75,098 76,398 77,797 79,197 Supply Projection 67,931 69,235 70,399 70,970 72,333 73,910 75,155 76,590 77,589 78,665 79,706 Cumulative Shortage* 568 963 1,300 1,628 1,865 2,089 2,344 2,609 2,910 3,234 3,593
H72 - Train crew operating occupations ** Demand Projection 1,202 1,202 1,202 1,202 1,202 1,202 1,302 1,302 1,302 1,403 1,403 Supply Projection 1,282 1,268 1,257 1,244 1,235 1,227 1,326 1,325 1,325 1,390 1,386 Cumulative Shortage* 20 33 45 57 66 75 75 76 77 112 116
H73 - Other transport equipment operators and related workers ** Demand Projection 2,299 2,399 2,399 2,499 2,499 2,698 2,698 2,798 2,798 2,798 2,898 Supply Projection 2,558 2,575 2,577 2,642 2,641 2,836 2,835 2,940 2,939 2,939 3,010 Cumulative Shortage* -158 -76 -77 -42 -41 -36 -36 -40 -40 -40 -10
H81 - Longshore workers and material handlers Demand Projection 22,998 23,598 24,198 24,698 25,398 26,098 26,798 27,397 27,897 28,497 29,197 Supply Projection 24,206 24,715 25,257 25,668 26,300 26,914 27,528 28,032 28,427 28,913 29,484 Cumulative Shortage* 193 284 342 431 499 584 670 767 871 985 1,114
Appendix C
* Supply Shortage if positive ** Historical data has a coefficient of variation >16.5% and <33.3% and should be used with caution Supply Surplus if negative *** Not elsewhere classified

22
Results of Alberta’s Occupational Demand and Supply for 3-Digit NOC-S Occupations, 2011-2021
Occupational Projections 2011 2012 2013 2014 2015 2016 2017 2018 2019 2020 2021 H82 - Trades helpers and labourers
Demand Projection 25,798 26,298 27,198 27,998 28,898 29,597 29,797 30,397 30,897 30,897 31,297 Supply Projection 28,437 28,666 29,390 30,040 30,729 31,276 31,294 31,732 32,053 31,849 32,029 Cumulative Shortage* 1,962 2,233 2,408 2,559 2,769 2,923 3,105 3,266 3,446 3,649 3,869
H83 - Public works and other labourers, n.e.c. ***(**) Demand Projection 2,902 2,902 3,002 3,102 3,102 3,302 3,402 3,402 3,503 3,503 3,603 Supply Projection 3,153 3,135 3,223 3,311 3,289 3,479 3,563 3,540 3,620 3,595 3,670 Cumulative Shortage* 48 67 78 90 112 122 139 162 182 207 231
I01 - Contractors, operators and supervisors in agriculture, horticulture, and aquaculture Demand Projection 41,000 41,200 41,500 41,500 41,700 41,800 41,800 41,900 41,900 42,000 42,000 Supply Projection 41,486 41,663 41,939 41,914 42,092 42,164 42,130 42,180 42,114 42,128 42,017 Cumulative Shortage* 14 37 61 86 108 137 170 221 286 372 483
I02 - Agriculture and horticulture workers Demand Projection 8,298 8,298 8,298 8,298 8,298 8,398 8,398 8,298 8,298 8,298 8,298 Supply Projection 8,863 8,834 8,805 8,781 8,755 8,834 8,809 8,674 8,642 8,608 8,568 Cumulative Shortage* 36 65 94 118 144 165 190 225 257 291 331
I11 - Supervisors, logging & forestry ** Demand Projection 402 402 402 402 402 402 402 402 402 402 402 Supply Projection 406 406 406 406 406 406 406 406 406 406 406 Cumulative Shortage* 50 50 50 50 50 50 50 50 50 50 50
I12 - Supervisors, mining, oil and gas Demand Projection 14,698 15,298 15,498 15,798 16,298 16,698 17,098 17,598 17,998 18,298 18,598 Supply Projection 14,766 15,333 15,496 15,758 16,213 16,565 16,915 17,359 17,700 17,935 18,166 Cumulative Shortage* 34 66 103 141 186 234 284 340 399 463 533
I13 - Underground miners, oil and gas drillers and related workers Demand Projection 18,800 19,400 19,700 20,100 20,600 21,200 21,800 22,500 23,000 23,400 23,700 Supply Projection 19,721 20,230 20,450 20,786 21,221 21,749 22,268 22,872 23,255 23,531 23,690 Cumulative Shortage* 79 170 250 314 379 451 532 628 745 869 1,010
I14 - Mine service workers and operators in oil and gas drilling Demand Projection 6,698 6,898 7,098 7,198 7,398 7,698 7,898 8,098 8,297 8,397 8,597 Supply Projection 7,373 7,525 7,676 7,718 7,867 8,121 8,265 8,404 8,539 8,567 8,692 Cumulative Shortage* 126 174 223 281 332 378 434 494 559 631 706
I21 - Primary production labourers Demand Projection 14,800 15,300 15,600 15,900 16,300 16,600 17,100 17,500 17,800 18,100 18,600 Supply Projection 16,995 17,221 17,295 17,471 17,727 17,888 18,256 18,506 18,640 18,768 19,093 Cumulative Shortage* 205 480 705 829 973 1,112 1,244 1,394 1,560 1,732 1,907
Appendix C
* Supply Shortage if positive ** Historical data has a coefficient of variation >16.5% and <33.3% and should be used with caution Supply Surplus if negative *** Not elsewhere classified

23
Results of Alberta’s Occupational Demand and Supply for 3-Digit NOC-S Occupations, 2011-2021
Occupational Projections 2011 2012 2013 2014 2015 2016 2017 2018 2019 2020 2021 J01 - Supervisors, processing occupations
Demand Projection 6,502 6,902 7,102 7,202 7,302 7,502 7,602 7,702 7,902 8,102 8,202 Supply Projection 6,650 7,043 7,231 7,317 7,401 7,577 7,650 7,722 7,891 8,058 8,115 Cumulative Shortage* 51 58 70 84 100 124 151 179 210 244 286
J02 - Supervisors, assembly and fabrication ** Demand Projection 3,401 3,601 3,601 3,701 3,802 3,902 4,002 4,202 4,302 4,402 4,402 Supply Projection 3,453 3,639 3,624 3,708 3,792 3,875 3,956 4,135 4,213 4,288 4,258 Cumulative Shortage* 47 61 77 92 109 126 144 166 188 213 243
J11 - Central control and process operators in manufacturing and processing Demand Projection 7,804 8,004 8,304 8,404 8,604 8,905 9,105 9,305 9,505 9,705 9,805 Supply Projection 7,788 7,971 8,253 8,334 8,514 8,790 8,964 9,137 9,308 9,477 9,547 Cumulative Shortage* 14 31 49 68 89 112 138 165 195 226 256
J12 - Machine operators and related workers in metal and mineral products processing ** Demand Projection 1,103 1,103 1,103 1,103 1,103 1,203 1,303 1,303 1,303 1,303 1,303 Supply Projection 1,317 1,320 1,323 1,324 1,324 1,314 1,305 1,309 1,312 1,312 1,311 Cumulative Shortage* 61 57 54 54 54 164 273 269 266 266 267
J13 - Machine operators and related workers in chemical, plastic and rubber processing ** Demand Projection 2,300 2,400 2,400 2,400 2,600 2,600 2,700 2,700 2,900 2,900 2,900 Supply Projection 2,568 2,646 2,641 2,627 2,732 2,710 2,754 2,764 2,853 2,854 2,852 Cumulative Shortage* 132 154 159 173 268 290 346 336 447 446 448
J14 - Machine operators and related workers in pulp and paper production and wood processing ** Demand Projection 1,502 1,602 1,602 1,702 1,702 1,802 1,802 1,802 2,002 2,002 2,002 Supply Projection 1,507 1,606 1,620 1,709 1,717 1,793 1,796 1,801 1,977 1,977 1,977 Cumulative Shortage* -7 -5 -19 -8 -16 9 5 0 24 24 24
J16 - Machine operators and related workers in fabric, fur and leather products manufacturing ** Demand Projection 1,100 1,100 1,100 1,200 1,200 1,200 1,200 1,200 1,300 1,300 1,300 Supply Projection 1,205 1,205 1,206 1,277 1,277 1,278 1,278 1,278 1,302 1,301 1,302 Cumulative Shortage* 155 155 154 183 183 183 182 182 258 259 259
J17 - Machine operators and related workers in food, beverage and tobacco processing ** Demand Projection 8,797 8,997 9,197 9,397 9,597 9,797 10,097 10,197 10,397 10,697 10,797 Supply Projection 9,047 9,210 9,370 9,529 9,690 9,842 10,089 10,131 10,269 10,498 10,523 Cumulative Shortage* -49 -12 29 69 108 156 209 267 329 400 475
J18 - Printing machine operators and related occupations ** Demand Projection 2,100 2,200 2,200 2,300 2,300 2,300 2,400 2,400 2,500 2,600 2,600 Supply Projection 2,100 2,200 2,200 2,300 2,299 2,299 2,398 2,396 2,494 2,590 2,585 Cumulative Shortage* 0 0 0 0 1 1 2 4 6 10 15
Appendix C
* Supply Shortage if positive ** Historical data has a coefficient of variation >16.5% and <33.3% and should be used with caution Supply Surplus if negative
24
Results of Alberta’s Occupational Demand and Supply for 3-Digit NOC-S Occupations, 2011-2021
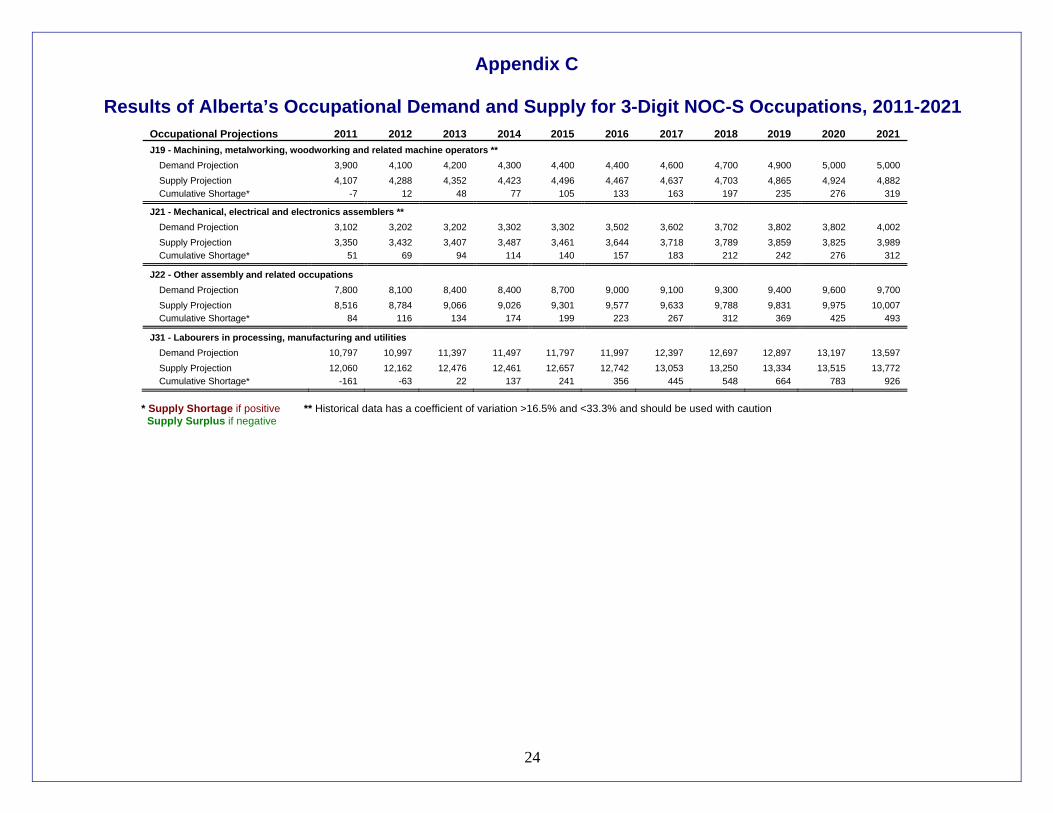
Occupational Projections 2011 2012 2013 2014 2015 2016 2017 2018 2019 2020 2021 J19 - Machining, metalworking, woodworking and related machine operators **
Demand Projection 3,900 4,100 4,200 4,300 4,400 4,400 4,600 4,700 4,900 5,000 5,000 Supply Projection 4,107 4,288 4,352 4,423 4,496 4,467 4,637 4,703 4,865 4,924 4,882 Cumulative Shortage* -7 12 48 77 105 133 163 197 235 276 319
J21 - Mechanical, electrical and electronics assemblers ** Demand Projection 3,102 3,202 3,202 3,302 3,302 3,502 3,602 3,702 3,802 3,802 4,002 Supply Projection 3,350 3,432 3,407 3,487 3,461 3,644 3,718 3,789 3,859 3,825 3,989 Cumulative Shortage* 51 69 94 114 140 157 183 212 242 276 312
J22 - Other assembly and related occupations Demand Projection 7,800 8,100 8,400 8,400 8,700 9,000 9,100 9,300 9,400 9,600 9,700 Supply Projection 8,516 8,784 9,066 9,026 9,301 9,577 9,633 9,788 9,831 9,975 10,007 Cumulative Shortage* 84 116 134 174 199 223 267 312 369 425 493
J31 - Labourers in processing, manufacturing and utilities Demand Projection 10,797 10,997 11,397 11,497 11,797 11,997 12,397 12,697 12,897 13,197 13,597 Supply Projection 12,060 12,162 12,476 12,461 12,657 12,742 13,053 13,250 13,334 13,515 13,772 Cumulative Shortage* -161 -63 22 137 241 356 445 548 664 783 926
Appendix C
* Supply Shortage if positive ** Historical data has a coefficient of variation >16.5% and <33.3% and should be used with caution Supply Surplus if negative

25
Results of Alberta’s Occupational Demand and Supply for 4-Digit NOC-S Occupations, 2011-2021
Occupational Projections 2011 2012 2013 2014 2015 2016 2017 2018 2019 2020 2021 A012 - Senior government managers and officials ** Demand Projection 1,500 1,600 1,600 1,600 1,700 1,700 1,800 1,800 1,900 1,900 1,900 Supply Projection 1,491 1,588 1,581 1,576 1,669 1,659 1,753 1,750 1,841 1,836 1,831 Cumulative Shortage* 8 11 18 23 30 41 46 49 59 63 69 A013 - Senior managers – Financial, communications and other business services ** Demand Projection 3,099 3,199 3,299 3,399 3,399 3,499 3,599 3,699 3,799 3,799 3,899 Supply Projection 3,082 3,177 3,265 3,358 3,350 3,431 3,513 3,604 3,669 3,661 3,722 Cumulative Shortage* 17 22 34 41 49 69 86 95 130 138 177 A016 - Senior managers - Goods production, utilities, transportation and construction ** Demand Projection 2,299 2,299 2,399 2,399 2,499 2,599 2,599 2,699 2,699 2,799 2,799 Supply Projection 2,286 2,285 2,362 2,351 2,435 2,488 2,485 2,574 2,562 2,628 2,611 Cumulative Shortage* 13 15 38 48 64 111 115 125 137 172 189 A111 - Financial managers ** Demand Projection 4,400 4,600 4,700 4,800 4,900 5,000 5,200 5,300 5,400 5,500 5,600 Supply Projection 4,505 4,692 4,772 4,858 4,945 5,033 5,196 5,217 5,297 5,305 5,348 Cumulative Shortage* -5 8 28 42 55 67 104 183 203 295 352 A112 - Human resources managers** Demand Projection 3,500 3,600 3,700 3,800 3,900 4,000 4,100 4,200 4,300 4,300 4,400 Supply Projection 3,605 3,683 3,784 3,874 3,972 4,064 4,161 4,259 4,346 4,338 4,419 Cumulative Shortage* -5 17 16 26 28 36 39 41 54 62 81 A114 - Other administrative services managers Demand Projection 1,800 1,900 1,900 2,000 2,000 2,100 2,200 2,200 2,300 2,300 2,400 Supply Projection 1,801 1,899 1,898 1,966 1,964 2,052 2,130 2,128 2,189 2,186 2,252 Cumulative Shortage* -1 1 2 34 36 48 70 72 111 114 148 A121 - Engineering managers** Demand Projection 2,699 2,799 2,799 2,899 2,999 2,999 3,099 3,199 3,199 3,298 3,398 Supply Projection 2,701 2,801 2,799 2,874 2,948 2,939 3,002 3,045 3,040 3,076 3,110 Cumulative Shortage* -2 -2 0 25 51 59 97 153 159 222 289 A122 - Computer and information systems managers** Demand Projection 5,697 5,797 5,997 6,097 6,297 6,397 6,597 6,697 6,897 6,997 7,197 Supply Projection 5,702 5,801 5,972 6,060 6,247 6,304 6,466 6,539 6,651 6,717 6,872 Cumulative Shortage* -4 -4 25 38 50 93 131 158 246 280 325 A131 - Sales marketing and advertising managers Demand Projection 9,902 10,202 10,502 10,702 11,002 11,402 11,702 12,003 12,203 12,503 12,803 Supply Projection 10,205 10,481 10,745 10,938 11,197 11,534 11,764 11,989 12,107 12,320 12,526 Cumulative Shortage* -3 22 58 64 105 168 239 314 396 483 577
Appendix D
* Supply Shortage if positive ** Historical data has a coefficient of variation >16.5% and <33.3% and should be used with caution Supply Surplus if negative

26
Results of Alberta’s Occupational Demand and Supply for 4-Digit NOC-S Occupations, 2011-2021
Occupational Projections 2011 2012 2013 2014 2015 2016 2017 2018 2019 2020 2021 A141 - Facility operation and maintenance managers** Demand Projection 4,098 4,198 4,298 4,398 4,598 4,698 4,797 4,897 4,997 5,097 5,197 Supply Projection 4,386 4,453 4,512 4,567 4,674 4,748 4,801 4,849 4,881 4,893 4,882 Cumulative Shortage* 212 245 286 331 423 449 496 549 616 704 816 A211 - Retail trade managers Demand Projection 37,800 39,000 39,900 40,900 42,400 43,800 45,000 46,300 47,200 48,500 50,000 Supply Projection 38,868 40,053 40,867 41,769 43,038 44,134 45,161 46,278 46,891 47,599 48,313 Cumulative Shortage* 32 47 133 231 462 766 939 1,122 1,409 2,001 2,787 A221 - Restaurant and food service managers
Demand Projection 15,200 15,700 16,300 17,000 17,600 18,400 18,800 19,300 19,800 20,300 20,800 Supply Projection 15,554 16,027 16,594 17,290 17,865 18,644 19,010 19,463 19,918 20,361 20,787 Cumulative Shortage* 46 73 106 110 135 156 190 237 282 339 413
A222 - Accommodation service managers ** Demand Projection 5,300 5,500 5,700 5,900 6,200 6,400 6,600 6,700 6,900 7,100 7,200 Supply Projection 5,346 5,511 5,669 5,852 6,115 6,275 6,436 6,501 6,648 6,786 6,815 Cumulative Shortage* 54 89 131 148 185 225 264 299 352 414 485
A302 – Banking, credit and other investment managers ** Demand Projection 4,500 4,600 4,800 4,900 5,000 5,100 5,200 5,300 5,500 5,500 5,700 Supply Projection 4,683 4,777 4,893 4,966 5,045 5,135 5,225 5,312 5,485 5,461 5,643 Cumulative Shortage* 17 23 107 134 155 165 175 188 215 239 257
A303 - Other business services managers ** Demand Projection 2,100 2,100 2,200 2,200 2,300 2,300 2,400 2,400 2,500 2,500 2,600 Supply Projection 2,171 2,165 2,255 2,254 2,329 2,325 2,415 2,410 2,508 2,506 2,600 Cumulative Shortage* 29 35 45 46 71 75 85 90 92 94 100
A321 - Managers in health care ** Demand Projection 2,801 2,801 2,901 2,901 3,001 3,101 3,201 3,301 3,401 3,401 3,501 Supply Projection 2,900 2,900 2,998 2,997 3,081 3,176 3,271 3,358 3,442 3,431 3,508 Cumulative Shortage* 0 1 3 4 19 25 30 43 59 69 92
A323 - School principals and administrators of elementary and secondary education ** Demand Projection 3,901 4,101 4,201 4,401 4,501 4,701 4,801 4,901 5,001 5,101 5,201 Supply Projection 3,900 4,099 4,192 4,387 4,482 4,669 4,766 4,860 4,954 5,039 5,130 Cumulative Shortage* 0 1 9 14 19 32 35 41 47 62 71
A324 - Managers in social community and correctional services ** Demand Projection 3,601 3,701 3,801 3,901 4,001 4,101 4,201 4,301 4,401 4,501 4,601 Supply Projection 3,597 3,696 3,790 3,889 3,984 4,075 4,173 4,268 4,362 4,450 4,542 Cumulative Shortage* 3 4 11 12 17 26 28 33 39 50 59
Appendix D
* Supply Shortage if positive ** Historical data has a coefficient of variation >16.5% and <33.3% and should be used with caution Supply Surplus if negative

27
Results of Alberta’s Occupational Demand and Supply for 4-Digit NOC-S Occupations, 2011-2021
Occupational Projections 2011 2012 2013 2014 2015 2016 2017 2018 2019 2020 2021 A361 - Other services managers **
Demand Projection 1,700 1,800 1,800 1,800 1,900 2,000 2,000 2,100 2,100 2,200 2,200 Supply Projection 1,863 1,951 1,948 1,942 2,043 2,142 2,140 2,244 2,239 2,291 2,271 Cumulative Shortage* -40 -28 -25 -19 -20 -19 -17 -21 -16 32 52
A371 - Construction managers Demand Projection 9,700 9,900 10,300 10,600 10,900 11,200 11,300 11,500 11,600 11,600 11,700 Supply Projection 9,909 10,106 10,460 10,758 11,019 11,271 11,350 11,555 11,634 11,606 11,671 Cumulative Shortage* -9 -6 40 42 81 129 150 146 166 193 229
A372 - Residential home builders and renovators Demand Projection 15,600 15,900 16,400 17,000 17,500 17,900 18,100 18,400 18,600 18,500 18,700 Supply Projection 15,900 16,195 16,684 17,200 17,663 17,985 18,151 18,457 18,625 18,480 18,624 Cumulative Shortage* 0 5 16 100 137 215 249 243 275 320 376
A373 - Transportation managers ** Demand Projection 4,200 4,300 4,400 4,400 4,500 4,700 4,800 4,900 5,000 5,000 5,100 Supply Projection 4,302 4,399 4,465 4,462 4,522 4,660 4,731 4,831 4,904 4,869 4,918 Cumulative Shortage* -2 1 35 38 78 140 169 169 196 231 282
A381 - Primary production managers (except agriculture) ** Demand Projection 4,500 4,600 4,700 4,800 4,900 5,100 5,200 5,400 5,500 5,600 5,600 Supply Projection 4,496 4,560 4,643 4,708 4,776 4,907 4,968 5,103 5,127 5,147 5,069 Cumulative Shortage* 4 40 57 92 124 193 232 297 373 453 531
A391 - Manufacturing managers Demand Projection 5,002 5,202 5,302 5,402 5,502 5,702 5,802 5,902 6,102 6,202 6,302 Supply Projection 5,314 5,511 5,602 5,688 5,774 5,959 6,020 6,074 6,227 6,270 6,306 Cumulative Shortage* -12 -9 0 13 28 43 82 128 175 232 296
A392 - Utilities managers ** Demand Projection 1,601 1,701 1,701 1,801 1,801 1,801 1,901 1,901 2,001 2,001 2,001 Supply Projection 1,602 1,688 1,688 1,786 1,785 1,782 1,879 1,875 1,971 1,967 1,963 Cumulative Shortage* -2 12 13 15 16 19 22 25 30 34 38
B011 - Financial auditors and accountants Demand Projection 25,899 26,699 27,299 27,899 28,498 29,198 29,898 30,698 31,298 31,898 32,598 Supply Projection 26,296 27,038 27,610 28,151 28,729 29,398 30,077 30,804 31,325 31,742 32,256 Cumulative Shortage* 203 261 289 347 369 400 421 494 573 756 942
B012 - Financial and investment analysts ** Demand Projection 2,200 2,200 2,300 2,400 2,400 2,500 2,500 2,600 2,600 2,700 2,700 Supply Projection 2,491 2,490 2,600 2,712 2,709 2,821 2,819 2,931 2,924 3,034 3,025 Cumulative Shortage* 9 10 0 -12 -9 -22 -19 -31 -24 -34 -25
Appendix D
* Supply Shortage if positive ** Historical data has a coefficient of variation >16.5% and <33.3% and should be used with caution Supply Surplus if negative

28
Results of Alberta’s Occupational Demand and Supply for 4-Digit NOC-S Occupations, 2011-2021
Occupational Projections 2011 2012 2013 2014 2015 2016 2017 2018 2019 2020 2021 B013 - Securities agents, investment dealers and brokers **
Demand Projection 1,900 1,900 2,000 2,000 2,100 2,100 2,200 2,200 2,300 2,300 2,400 Supply Projection 1,981 1,981 2,073 2,073 2,171 2,171 2,270 2,270 2,359 2,359 2,443 Cumulative Shortage* 19 19 26 26 29 29 30 30 41 41 57
B014 - Other financial officers Demand Projection 10,099 10,299 10,599 10,899 11,199 11,499 11,699 11,899 12,199 12,399 12,699 Supply Projection 10,172 10,370 10,656 10,954 11,243 11,544 11,734 11,932 12,209 12,399 12,669 Cumulative Shortage* 128 130 143 145 156 156 166 167 191 200 230
B021 - Specialists in human resources Demand Projection 6,101 6,201 6,401 6,501 6,701 6,901 7,001 7,201 7,401 7,501 7,702 Supply Projection 6,408 6,501 6,684 6,756 6,904 7,005 7,088 7,248 7,389 7,421 7,531 Cumulative Shortage* -7 0 17 46 97 196 213 253 312 380 471
B022 - Professional occupations in business services to management Demand Projection 15,003 15,503 15,803 16,203 16,503 16,903 17,303 17,703 18,104 18,504 18,904 Supply Projection 15,366 15,872 16,167 16,550 16,826 17,178 17,576 17,959 18,333 18,699 19,060 Cumulative Shortage* 37 31 36 53 77 125 128 144 171 204 244
B111 - Bookkeepers Demand Projection 24,799 25,499 26,099 26,699 27,298 27,998 28,598 29,298 29,798 30,298 30,998 Supply Projection 25,233 25,897 26,450 26,963 27,453 28,052 28,592 29,220 29,630 30,059 30,614 Cumulative Shortage* 65 101 149 236 346 447 507 578 668 739 884
B112 - Loan officers Demand Projection 6,900 7,100 7,300 7,500 7,700 7,900 8,000 8,200 8,400 8,500 8,700 Supply Projection 7,086 7,278 7,474 7,660 7,840 8,037 8,121 8,308 8,501 8,581 8,776 Cumulative Shortage* 14 22 26 40 60 63 79 92 99 119 123
B113 - Insurance adjusters and claims examiners ** Demand Projection 2,400 2,500 2,500 2,600 2,700 2,700 2,800 2,900 2,900 3,000 3,000 Supply Projection 2,496 2,588 2,587 2,670 2,742 2,742 2,833 2,923 2,923 3,008 3,008 Cumulative Shortage* 4 12 13 30 58 58 67 77 77 92 92
B114 - Insurance underwriters ** Demand Projection 2,200 2,300 2,300 2,400 2,500 2,500 2,600 2,600 2,700 2,700 2,800 Supply Projection 2,297 2,397 2,394 2,492 2,589 2,587 2,685 2,679 2,779 2,772 2,872 Cumulative Shortage* 3 3 6 7 11 13 15 20 21 28 28
B115 - Assessors, valuators and appraisers ** Demand Projection 2,000 2,000 2,100 2,100 2,200 2,200 2,300 2,300 2,400 2,400 2,500 Supply Projection 1,993 1,990 2,082 2,077 2,160 2,159 2,248 2,245 2,333 2,329 2,410 Cumulative Shortage* 7 10 18 23 40 41 52 55 67 71 90
Appendix D
* Supply Shortage if positive ** Historical data has a coefficient of variation >16.5% and <33.3% and should be used with caution Supply Surplus if negative

29
Results of Alberta’s Occupational Demand and Supply for 4-Digit NOC-S Occupations, 2011-2021
Occupational Projections 2011 2012 2013 2014 2015 2016 2017 2018 2019 2020 2021 B211 - Secretaries (except legal and medical)
Demand Projection 9,701 9,901 10,201 10,502 10,702 11,002 11,302 11,502 11,802 12,002 12,202 Supply Projection 10,216 10,421 10,731 11,039 11,246 11,557 11,862 12,057 12,340 12,509 12,683 Cumulative Shortage* -15 -20 -29 -37 -44 -55 -60 -55 -38 -8 19
B213 - Medical secretaries ** Demand Projection 2,600 2,600 2,700 2,700 2,800 2,900 3,000 3,100 3,100 3,200 3,300 Supply Projection 2,600 2,598 2,696 2,694 2,793 2,892 2,990 3,087 3,083 3,181 3,272 Cumulative Shortage* 0 2 4 6 7 8 11 13 18 20 29
B214 - Court recorders and medical transcriptionists ** Demand Projection 1,200 1,200 1,200 1,200 1,300 1,300 1,300 1,400 1,400 1,400 1,500 Supply Projection 1,252 1,252 1,251 1,251 1,353 1,353 1,352 1,453 1,452 1,452 1,551 Cumulative Shortage* -17 -17 -16 -15 -18 -18 -17 -18 -17 -17 -16
B311 - Administrative officers Demand Projection 28,897 29,697 30,397 31,196 31,996 32,896 33,696 34,396 35,096 35,696 36,496 Supply Projection 29,672 30,437 31,092 31,794 32,599 33,422 34,170 34,815 35,433 35,945 36,643 Cumulative Shortage* 224 259 304 402 398 474 526 581 663 751 853
B312 - Executive assistants ** Demand Projection 4,599 4,799 4,899 4,999 5,099 5,299 5,399 5,499 5,699 5,799 5,899 Supply Projection 4,561 4,751 4,840 4,921 5,018 5,171 5,260 5,331 5,513 5,595 5,670 Cumulative Shortage* 39 49 59 78 81 128 140 169 186 204 229
B313 - Personnel and recruitment officers ** Demand Projection 3,200 3,300 3,400 3,500 3,500 3,600 3,700 3,800 3,900 4,000 4,000 Supply Projection 3,173 3,266 3,358 3,445 3,444 3,532 3,623 3,714 3,802 3,891 3,878 Cumulative Shortage* 27 34 41 55 56 68 76 86 97 109 122
B314 - Property administrators ** Demand Projection 3,700 3,800 3,900 4,000 4,100 4,200 4,300 4,300 4,399 4,500 4,599 Supply Projection 3,844 3,941 4,031 4,108 4,209 4,282 4,361 4,337 4,417 4,490 4,557 Cumulative Shortage* 56 58 68 91 91 118 138 162 182 209 243
B315 - Purchasing agents and officers Demand Projection 9,899 10,199 10,399 10,599 10,899 11,199 11,399 11,699 11,999 12,199 12,399 Supply Projection 10,195 10,457 10,641 10,804 11,106 11,376 11,559 11,839 12,112 12,280 12,441 Cumulative Shortage* 104 142 158 195 193 223 239 259 287 319 358
B316 - Conference and event planners ** Demand Projection 2,700 2,800 2,800 2,900 3,000 3,100 3,200 3,300 3,300 3,400 3,500 Supply Projection 2,739 2,832 2,832 2,916 3,015 3,103 3,193 3,281 3,281 3,365 3,449 Cumulative Shortage* 61 68 68 84 85 97 107 118 118 134 151
Appendix D
* Supply Shortage if positive ** Historical data has a coefficient of variation >16.5% and <33.3% and should be used with caution Supply Surplus if negative

30
Results of Alberta’s Occupational Demand and Supply for 4-Digit NOC-S Occupations, 2011-2021
Occupational Projections 2011 2012 2013 2014 2015 2016 2017 2018 2019 2020 2021 B411 - Supervisors, general office and administrative support clerks **
Demand Projection 3,699 3,799 3,899 3,999 4,099 4,199 4,299 4,399 4,499 4,599 4,699 Supply Projection 3,699 3,796 3,887 3,983 4,075 4,166 4,260 4,344 4,431 4,504 4,582 Cumulative Shortage* 0 3 12 16 24 33 39 55 68 95 117
B412 - Supervisors, finance and insurance clerks Demand Projection 4,799 4,899 4,999 5,199 5,299 5,399 5,599 5,699 5,799 5,899 5,999 Supply Projection 4,903 5,001 5,100 5,299 5,397 5,494 5,691 5,783 5,870 5,958 6,039 Cumulative Shortage* -4 -2 -2 0 2 5 8 16 29 41 59
B413 - Supervisors, library, correspondence and related information clerks ** Demand Projection 1,600 1,700 1,700 1,800 1,800 1,800 1,900 1,900 2,000 2,000 2,100 Supply Projection 1,674 1,777 1,776 1,876 1,874 1,873 1,971 1,969 2,059 2,055 2,140 Cumulative Shortage* -5 -9 -8 -7 -6 -5 -2 0 10 14 28
B415 - Supervisors, recording, distributing and scheduling occupations Demand Projection 8,098 8,298 8,498 8,698 8,898 9,198 9,398 9,598 9,798 9,998 10,198 Supply Projection 8,302 8,497 8,696 8,891 9,088 9,387 9,578 9,767 9,946 10,123 10,294 Cumulative Shortage* -4 1 2 7 10 11 20 31 52 75 104
B511 - General office clerks ** Demand Projection 2,600 2,600 2,700 2,800 2,900 2,900 3,000 3,100 3,100 3,200 3,300 Supply Projection 2,691 2,688 2,772 2,864 2,956 2,936 3,014 3,060 3,016 3,017 3,000 Cumulative Shortage* 9 12 28 36 45 64 86 140 184 284 400
B513 - Records management and filing clerks Demand Projection 5,200 5,300 5,500 5,600 5,700 5,900 6,000 6,200 6,300 6,400 6,600 Supply Projection 5,652 5,748 5,950 6,047 6,145 6,321 6,409 6,515 6,544 6,529 6,510 Cumulative Shortage* 48 52 51 53 56 79 92 185 256 371 590
B514 - Receptionists and switchboard operators Demand Projection 23,802 24,302 24,902 25,602 26,302 27,002 27,702 28,302 28,902 29,502 30,202 Supply Projection 24,583 25,084 25,634 26,308 26,983 27,638 28,267 28,727 29,061 29,217 29,351 Cumulative Shortage* 519 518 568 594 619 664 735 875 1,141 1,585 2,151
B522 - Data entry clerks Demand Projection 7,102 7,302 7,502 7,602 7,802 8,002 8,202 8,402 8,602 8,802 9,002 Supply Projection 7,551 7,660 7,786 7,883 8,015 8,083 8,248 8,401 8,542 8,674 8,789 Cumulative Shortage* 50 142 216 219 287 419 454 501 560 628 714
B531 - Accounting and related clerks Demand Projection 20,400 21,000 21,500 22,000 22,500 23,200 23,700 24,300 24,800 25,200 25,800 Supply Projection 21,255 21,876 22,389 22,893 23,404 24,023 24,425 24,781 24,843 24,893 24,989 Cumulative Shortage* 45 24 11 7 -4 77 175 419 857 1,207 1,711
Appendix D
* Supply Shortage if positive ** Historical data has a coefficient of variation >16.5% and <33.3% and should be used with caution Supply Surplus if negative
31
Results of Alberta’s Occupational Demand and Supply for 4-Digit NOC-S Occupations, 2011-2021
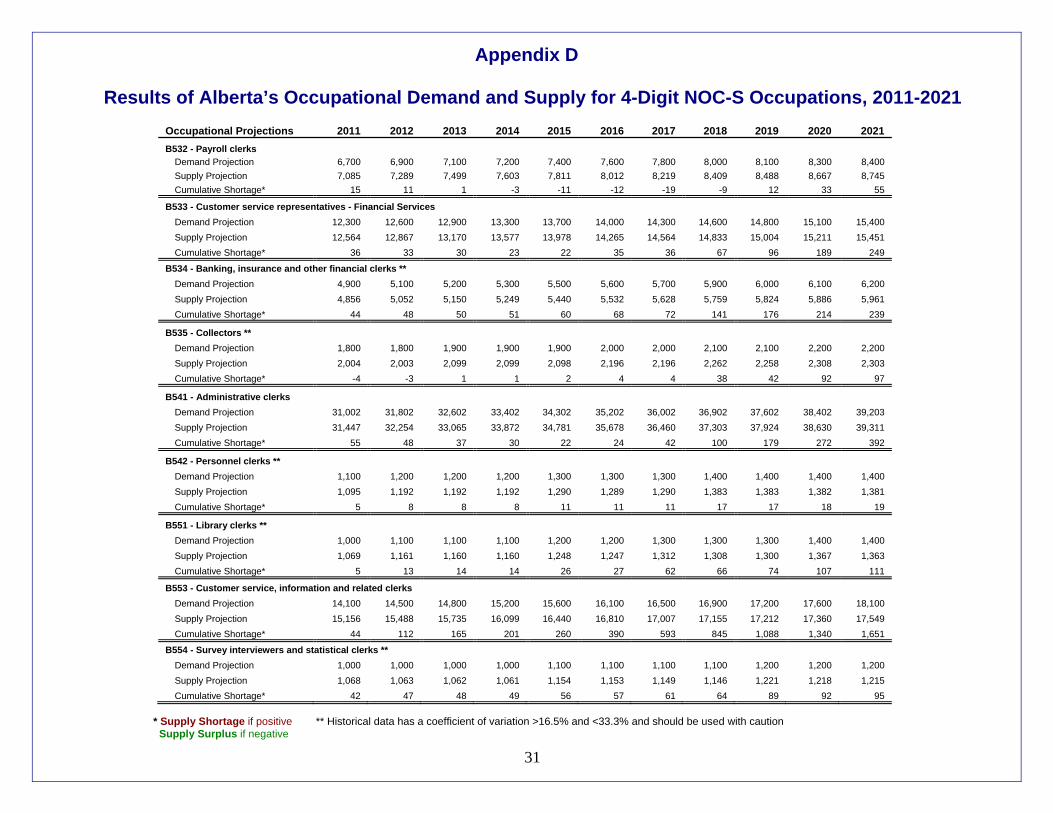
Occupational Projections 2011 2012 2013 2014 2015 2016 2017 2018 2019 2020 2021 B532 - Payroll clerks
Demand Projection 6,700 6,900 7,100 7,200 7,400 7,600 7,800 8,000 8,100 8,300 8,400 Supply Projection 7,085 7,289 7,499 7,603 7,811 8,012 8,219 8,409 8,488 8,667 8,745 Cumulative Shortage* 15 11 1 -3 -11 -12 -19 -9 12 33 55
B533 - Customer service representatives - Financial Services Demand Projection 12,300 12,600 12,900 13,300 13,700 14,000 14,300 14,600 14,800 15,100 15,400 Supply Projection 12,564 12,867 13,170 13,577 13,978 14,265 14,564 14,833 15,004 15,211 15,451 Cumulative Shortage* 36 33 30 23 22 35 36 67 96 189 249
B534 - Banking, insurance and other financial clerks ** Demand Projection 4,900 5,100 5,200 5,300 5,500 5,600 5,700 5,900 6,000 6,100 6,200 Supply Projection 4,856 5,052 5,150 5,249 5,440 5,532 5,628 5,759 5,824 5,886 5,961 Cumulative Shortage* 44 48 50 51 60 68 72 141 176 214 239
B535 - Collectors ** Demand Projection 1,800 1,800 1,900 1,900 1,900 2,000 2,000 2,100 2,100 2,200 2,200 Supply Projection 2,004 2,003 2,099 2,099 2,098 2,196 2,196 2,262 2,258 2,308 2,303 Cumulative Shortage* -4 -3 1 1 2 4 4 38 42 92 97
B541 - Administrative clerks Demand Projection 31,002 31,802 32,602 33,402 34,302 35,202 36,002 36,902 37,602 38,402 39,203 Supply Projection 31,447 32,254 33,065 33,872 34,781 35,678 36,460 37,303 37,924 38,630 39,311 Cumulative Shortage* 55 48 37 30 22 24 42 100 179 272 392
B542 - Personnel clerks ** Demand Projection 1,100 1,200 1,200 1,200 1,300 1,300 1,300 1,400 1,400 1,400 1,400 Supply Projection 1,095 1,192 1,192 1,192 1,290 1,289 1,290 1,383 1,383 1,382 1,381 Cumulative Shortage* 5 8 8 8 11 11 11 17 17 18 19
B551 - Library clerks ** Demand Projection 1,000 1,100 1,100 1,100 1,200 1,200 1,300 1,300 1,300 1,400 1,400 Supply Projection 1,069 1,161 1,160 1,160 1,248 1,247 1,312 1,308 1,300 1,367 1,363 Cumulative Shortage* 5 13 14 14 26 27 62 66 74 107 111
B553 - Customer service, information and related clerks Demand Projection 14,100 14,500 14,800 15,200 15,600 16,100 16,500 16,900 17,200 17,600 18,100 Supply Projection 15,156 15,488 15,735 16,099 16,440 16,810 17,007 17,155 17,212 17,360 17,549 Cumulative Shortage* 44 112 165 201 260 390 593 845 1,088 1,340 1,651
B554 - Survey interviewers and statistical clerks ** Demand Projection 1,000 1,000 1,000 1,000 1,100 1,100 1,100 1,100 1,200 1,200 1,200 Supply Projection 1,068 1,063 1,062 1,061 1,154 1,153 1,149 1,146 1,221 1,218 1,215 Cumulative Shortage* 42 47 48 49 56 57 61 64 89 92 95
Appendix D
* Supply Shortage if positive ** Historical data has a coefficient of variation >16.5% and <33.3% and should be used with caution Supply Surplus if negative

32
Results of Alberta’s Occupational Demand and Supply for 4-Digit NOC-S Occupations, 2011-2021
Occupational Projections 2011 2012 2013 2014 2015 2016 2017 2018 2019 2020 2021 B561 - Mail, postal and related clerks **
Demand Projection 4,601 4,701 4,801 4,901 5,001 5,101 5,201 5,401 5,501 5,601 5,701 Supply Projection 4,677 4,739 4,826 4,922 5,012 5,094 5,174 5,364 5,454 5,519 5,601 Cumulative Shortage* 24 62 75 79 89 107 127 137 147 182 200
B562 - Letter carriers ** Demand Projection 3,801 3,901 4,001 4,001 4,101 4,201 4,301 4,301 4,401 4,501 4,601 Supply Projection 3,818 3,914 4,002 4,002 4,093 4,178 4,275 4,269 4,360 4,456 4,540 Cumulative Shortage* 82 87 98 98 108 123 126 132 140 145 161
B563 - Couriers, messengers and door-to-door distributors ** Demand Projection 2,500 2,500 2,601 2,601 2,701 2,801 2,801 2,901 3,001 3,001 3,101 Supply Projection 2,694 2,678 2,758 2,758 2,844 2,919 2,919 3,006 3,090 3,088 3,164 Cumulative Shortage* 6 23 43 43 57 82 82 95 111 113 137
B571 - Shippers and receivers Demand Projection 16,800 17,300 17,700 18,100 18,600 19,200 19,700 20,200 20,600 21,100 21,600 Supply Projection 17,584 17,939 18,283 18,589 18,999 19,486 19,907 20,161 20,366 20,626 20,882 Cumulative Shortage* 116 261 317 411 501 614 693 939 1,134 1,374 1,618
B572 - Storekeepers and parts clerks ** Demand Projection 4,500 4,600 4,700 4,800 5,000 5,100 5,300 5,400 5,500 5,700 5,800 Supply Projection 4,646 4,729 4,809 4,879 5,010 5,106 5,205 5,260 5,302 5,359 5,414 Cumulative Shortage* 54 71 91 121 190 194 295 340 398 541 586
B573 - Production clerks ** Demand Projection 1,600 1,700 1,700 1,800 1,800 1,800 1,900 1,900 2,000 2,000 2,000 Supply Projection 1,699 1,783 1,780 1,856 1,853 1,852 1,919 1,912 1,978 1,975 1,971 Cumulative Shortage* -1 15 18 42 45 46 79 86 120 123 127
B574 - Purchasing and inventory clerks ** Demand Projection 2,800 2,800 2,900 3,000 3,100 3,100 3,200 3,300 3,400 3,400 3,500 Supply Projection 3,088 3,080 3,153 3,221 3,286 3,285 3,349 3,386 3,415 3,407 3,442 Cumulative Shortage* 12 20 47 79 114 115 151 214 285 293 358
B575 - Dispatchers and radio operators ** Demand Projection 5,100 5,200 5,400 5,500 5,600 5,700 5,900 6,000 6,100 6,200 6,400 Supply Projection 5,366 5,457 5,591 5,679 5,766 5,863 6,023 6,099 6,181 6,267 6,379 Cumulative Shortage* 34 43 109 121 134 137 177 201 219 233 321
C012 - Chemists ** Demand Projection 1,200 1,300 1,300 1,300 1,400 1,400 1,400 1,500 1,500 1,500 1,500 Supply Projection 1,328 1,414 1,412 1,410 1,490 1,490 1,490 1,584 1,581 1,578 1,577 Cumulative Shortage* 24 38 40 42 62 62 62 68 71 74 75
Appendix D
* Supply Shortage if positive ** Historical data has a coefficient of variation >16.5% and <33.3% and should be used with caution Supply Surplus if negative

33
Results of Alberta’s Occupational Demand and Supply for 4-Digit NOC-S Occupations, 2011-2021
Occupational Projections 2011 2012 2013 2014 2015 2016 2017 2018 2019 2020 2021 C013 - Geologists, geochemists and geophysicists **
Demand Projection 5,500 5,600 5,700 5,800 6,000 6,100 6,300 6,500 6,600 6,700 6,900 Supply Projection 5,609 5,674 5,728 5,793 5,963 6,049 6,222 6,397 6,461 6,522 6,669 Cumulative Shortage* 91 126 172 207 237 251 278 303 339 378 431
C032 - Mechanical engineers ** Demand Projection 5,599 5,799 5,899 5,999 6,099 6,299 6,399 6,599 6,699 6,799 6,999 Supply Projection 5,962 6,074 6,163 6,260 6,317 6,438 6,520 6,641 6,673 6,732 6,836 Cumulative Shortage* 37 126 136 140 182 262 279 358 426 467 563
C033 - Electrical and electronics engineers ** Demand Projection 5,899 6,099 6,199 6,399 6,499 6,699 6,799 6,999 7,099 7,199 7,399 Supply Projection 6,157 6,334 6,435 6,595 6,693 6,875 6,972 7,158 7,252 7,343 7,516 Cumulative Shortage* 43 66 64 105 106 124 127 141 147 156 184
C034 - Chemical engineers ** Demand Projection 3,100 3,200 3,300 3,300 3,400 3,500 3,600 3,600 3,700 3,800 3,900 Supply Projection 3,171 3,267 3,363 3,362 3,439 3,533 3,627 3,627 3,696 3,783 3,874 Cumulative Shortage* 29 33 37 38 61 66 72 72 103 117 125
C041 - Industrial and manufacturing engineers ** Demand Projection 1,800 1,800 1,800 1,900 1,900 2,000 2,000 2,100 2,100 2,200 2,200 Supply Projection 1,784 1,784 1,779 1,869 1,869 1,952 1,940 2,020 2,000 2,067 2,037 Cumulative Shortage* 16 16 21 31 31 48 60 80 100 134 164
C045 - Petroleum engineers Demand Projection 13,601 14,001 14,201 14,501 14,901 15,302 15,702 16,102 16,502 16,802 17,102 Supply Projection 13,849 14,252 14,432 14,700 15,070 15,425 15,761 16,080 16,401 16,598 16,799 Cumulative Shortage* 53 49 69 102 132 177 240 321 400 503 603
C048 - Other professional engineers n.e.c***(**) Demand Projection 4,100 4,200 4,300 4,400 4,500 4,600 4,700 4,800 5,001 5,101 5,201 Supply Projection 4,284 4,385 4,481 4,572 4,664 4,752 4,834 4,913 5,097 5,168 5,235 Cumulative Shortage* 16 16 20 29 36 48 66 87 103 132 165
C054 - Land surveyors ** Demand Projection 1,902 1,902 2,002 2,002 2,002 2,102 2,102 2,202 2,202 2,302 2,302 Supply Projection 1,989 1,988 2,041 2,024 2,019 2,087 2,059 2,131 2,100 2,167 2,136 Cumulative Shortage* 13 13 61 78 83 115 143 171 202 235 267
C071 - Information systems analysts and consultants Demand Projection 18,398 18,898 19,298 19,798 20,198 20,798 21,298 21,798 22,198 22,698 23,197 Supply Projection 18,823 19,308 19,667 20,099 20,454 20,829 21,256 21,668 21,974 22,299 22,642 Cumulative Shortage* 175 190 231 298 343 568 642 730 824 998 1,156
Appendix D
* Supply Shortage if positive ** Historical data has a coefficient of variation >16.5% and <33.3% and should be used with caution Supply Surplus if negative

34
Results of Alberta’s Occupational Demand and Supply for 4-Digit NOC-S Occupations, 2011-2021
Occupational Projections 2011 2012 2013 2014 2015 2016 2017 2018 2019 2020 2021 C072 - Database analysts and data administrators **
Demand Projection 2,800 2,900 2,900 3,000 3,100 3,200 3,200 3,300 3,400 3,500 3,500 Supply Projection 2,873 2,974 2,973 3,070 3,165 3,259 3,258 3,355 3,447 3,546 3,537 Cumulative Shortage* 26 25 26 30 35 40 42 45 52 54 62
C073 - Software engineers and designers ** Demand Projection 3,500 3,600 3,700 3,800 3,900 4,000 4,100 4,200 4,200 4,300 4,400 Supply Projection 3,429 3,520 3,613 3,702 3,796 3,883 3,976 4,065 4,065 4,154 4,241 Cumulative Shortage* 71 80 87 97 104 116 124 135 135 146 159
C074 - Computer programmers and interactive media developers Demand Projection 12,599 12,999 13,299 13,599 13,898 14,298 14,598 14,898 15,298 15,598 15,998 Supply Projection 12,774 13,172 13,472 13,751 14,050 14,416 14,714 14,990 15,346 15,634 16,002 Cumulative Shortage* 125 127 127 148 149 182 185 209 252 264 297
C075 - Web designers and developers ** Demand Projection 1,700 1,700 1,700 1,800 1,800 1,900 1,900 2,000 2,000 2,000 2,100 Supply Projection 1,682 1,678 1,677 1,766 1,766 1,842 1,842 1,929 1,929 1,929 2,009 Cumulative Shortage* 18 22 23 34 34 58 58 71 71 71 91
C112 - Geological and mineral technologists and technicians ** Demand Projection 5,502 5,602 5,702 5,902 6,002 6,102 6,302 6,502 6,602 6,702 6,902 Supply Projection 5,635 5,701 5,773 5,878 5,913 6,011 6,156 6,242 6,237 6,263 6,307 Cumulative Shortage* 367 401 429 524 589 591 646 760 865 939 1,095
C125 - Landscape and horticultural technicians and specialists ** Demand Projection 2,001 2,001 2,101 2,101 2,201 2,201 2,301 2,301 2,401 2,401 2,501 Supply Projection 1,991 1,989 2,078 2,072 2,141 2,133 2,216 2,191 2,248 2,198 2,242 Cumulative Shortage* 10 12 23 30 60 68 85 110 153 203 259
C131 - Civil engineering technologists and technicians ** Demand Projection 3,200 3,300 3,400 3,500 3,500 3,600 3,700 3,800 3,900 3,900 4,000 Supply Projection 3,186 3,277 3,365 3,456 3,449 3,530 3,617 3,697 3,777 3,757 3,815 Cumulative Shortage* 14 23 35 44 51 70 83 103 123 143 185
C133 - Industrial engineering and manufacturing technologists and technicians ** Demand Projection 1,500 1,600 1,600 1,700 1,700 1,700 1,800 1,800 1,900 1,900 1,900 Supply Projection 1,490 1,575 1,571 1,657 1,654 1,645 1,724 1,717 1,787 1,781 1,767 Cumulative Shortage* 10 25 29 43 46 55 76 83 113 119 133
C134 - Construction estimators ** Demand Projection 1,600 1,600 1,700 1,700 1,800 1,800 1,800 1,900 1,900 1,900 1,900 Supply Projection 1,666 1,661 1,744 1,740 1,834 1,824 1,818 1,891 1,884 1,850 1,836 Cumulative Shortage* 0 5 22 26 32 42 48 75 82 116 130
Appendix D
* Supply Shortage if positive ** Historical data has a coefficient of variation >16.5% and <33.3% and should be used with caution Supply Surplus if negative

35
Results of Alberta’s Occupational Demand and Supply for 4-Digit NOC-S Occupations, 2011-2021
Occupational Projections 2011 2012 2013 2014 2015 2016 2017 2018 2019 2020 2021 C141 - Electrical and electronics engineering technologists and technicians **
Demand Projection 1,900 1,900 2,000 2,000 2,000 2,100 2,200 2,200 2,200 2,300 2,300 Supply Projection 1,895 1,887 1,970 1,959 1,944 2,024 2,106 2,085 2,062 2,130 2,115 Cumulative Shortage* 5 14 30 42 57 76 94 115 138 170 185
C142 - Electronic service technicians (household and business equipment) Demand Projection 8,501 8,801 9,001 9,201 9,501 9,801 10,002 10,302 10,502 10,702 11,002 Supply Projection 8,889 9,174 9,354 9,529 9,810 10,089 10,271 10,524 10,668 10,817 11,036 Cumulative Shortage* 12 27 47 73 92 113 130 178 233 285 366
C143 - Industrial instrument technicians and mechanics Demand Projection 3,401 3,501 3,601 3,701 3,801 3,901 3,901 4,001 4,101 4,201 4,301 Supply Projection 3,391 3,463 3,550 3,635 3,722 3,809 3,799 3,882 3,961 4,038 4,117 Cumulative Shortage* 9 37 50 65 78 92 102 118 139 163 183
C153 - Drafting technologists and technicians Demand Projection 5,101 5,201 5,401 5,501 5,601 5,701 5,801 6,001 6,101 6,201 6,401 Supply Projection 5,281 5,341 5,489 5,574 5,645 5,729 5,806 5,924 5,974 6,013 6,087 Cumulative Shortage* 20 61 112 127 156 172 195 278 328 388 515
C155 - Mapping and related technologists and technicians ** Demand Projection 1,500 1,600 1,600 1,700 1,700 1,700 1,800 1,800 1,900 1,900 1,900 Supply Projection 1,473 1,539 1,526 1,607 1,600 1,600 1,684 1,681 1,749 1,740 1,725 Cumulative Shortage* 27 62 74 94 101 101 116 119 152 160 175
C161 - Non-Destructive testers and inspectors ** Demand Projection 2,799 2,899 2,899 2,999 3,099 3,199 3,199 3,299 3,399 3,399 3,499 Supply Projection 2,998 3,101 3,098 3,199 3,292 3,391 3,380 3,475 3,569 3,554 3,641 Cumulative Shortage* 0 -2 1 0 6 7 18 24 30 44 58
C163 - Inspectors in public and environmental health and occupational health and safety Demand Projection 5,398 5,598 5,698 5,798 5,998 6,098 6,297 6,397 6,597 6,697 6,797 Supply Projection 5,579 5,766 5,864 5,956 6,138 6,227 6,412 6,491 6,672 6,747 6,817 Cumulative Shortage* 119 132 133 141 159 171 185 207 226 250 280
C164 - Construction inspectors ** Demand Projection 1,599 1,599 1,599 1,699 1,699 1,799 1,799 1,799 1,899 1,899 1,899 Supply Projection 1,595 1,592 1,589 1,679 1,667 1,754 1,744 1,729 1,809 1,794 1,777 Cumulative Shortage* 4 7 10 20 33 45 55 70 90 105 122
C171 - Air pilots, flight engineers and flying instructors ** Demand Projection 2,300 2,300 2,400 2,400 2,400 2,500 2,500 2,600 2,600 2,700 2,700 Supply Projection 2,282 2,282 2,381 2,381 2,362 2,461 2,460 2,554 2,548 2,638 2,626 Cumulative Shortage* 118 118 119 119 138 139 140 146 152 162 174
Appendix D
* Supply Shortage if positive ** Historical data has a coefficient of variation >16.5% and <33.3% and should be used with caution Supply Surplus if negative

36
Results of Alberta’s Occupational Demand and Supply for 4-Digit NOC-S Occupations, 2011-2021
Occupational Projections 2011 2012 2013 2014 2015 2016 2017 2018 2019 2020 2021 C181 - Computer network technicians
Demand Projection 4,800 4,900 5,000 5,100 5,300 5,400 5,500 5,700 5,800 5,900 6,000 Supply Projection 5,109 5,210 5,229 5,216 5,323 5,378 5,434 5,534 5,518 5,439 5,354 Cumulative Shortage* -9 -10 71 184 277 322 366 466 582 761 946
C182 - User support technicians Demand Projection 5,000 5,200 5,300 5,400 5,600 5,700 5,900 6,000 6,200 6,300 6,500 Supply Projection 5,102 5,249 5,342 5,430 5,620 5,716 5,913 5,990 6,177 6,260 6,416 Cumulative Shortage* -2 51 58 70 80 84 87 110 123 140 184
D011 - Specialist physicians ** Demand Projection 1,900 1,900 1,900 2,000 2,000 2,100 2,200 2,200 2,300 2,300 2,400 Supply Projection 1,889 1,889 1,887 1,943 1,938 1,990 2,002 1,967 1,973 1,921 1,881 Cumulative Shortage* 11 11 13 57 62 110 198 233 327 379 519
D012 - General practitioners and family physicians ** Demand Projection 5,100 5,000 5,100 5,200 5,400 5,500 5,700 5,800 6,000 6,100 6,200 Supply Projection 5,072 4,973 5,031 5,104 5,196 5,264 5,345 5,305 5,372 5,282 5,222 Cumulative Shortage* 28 27 69 96 204 236 355 495 628 818 978
D013 - Dentists ** Demand Projection 1,500 1,500 1,500 1,600 1,600 1,700 1,700 1,700 1,800 1,800 1,900 Supply Projection 1,591 1,591 1,578 1,643 1,640 1,704 1,697 1,652 1,686 1,627 1,642 Cumulative Shortage* 9 9 22 57 60 96 103 148 214 273 358
D014 - Veterinarians ** Demand Projection 2,300 2,400 2,400 2,500 2,500 2,600 2,600 2,700 2,800 2,800 2,900 Supply Projection 2,248 2,346 2,344 2,429 2,422 2,505 2,493 2,565 2,635 2,617 2,673 Cumulative Shortage* 52 54 56 71 78 95 107 135 165 183 227
D031 - Pharmacists ** Demand Projection 1,699 1,799 1,799 1,799 1,898 1,998 1,998 2,098 2,098 2,198 2,198 Supply Projection 1,701 1,801 1,800 1,799 1,898 1,997 1,993 2,037 1,977 1,998 1,922 Cumulative Shortage* -3 -3 -1 -1 0 1 6 62 121 200 276
D042 - Physiotherapists ** Demand Projection 4,102 4,002 4,102 4,202 4,302 4,402 4,602 4,703 4,803 4,903 5,003 Supply Projection 4,114 4,006 4,096 4,185 4,270 4,352 4,510 4,570 4,535 4,527 4,450 Cumulative Shortage* -12 -4 7 17 32 50 92 133 267 376 552
D043 - Occupational therapists ** Demand Projection 1,601 1,601 1,601 1,701 1,701 1,801 1,801 1,901 1,901 2,001 2,001 Supply Projection 1,605 1,599 1,596 1,692 1,689 1,764 1,759 1,819 1,795 1,783 1,745 Cumulative Shortage* -5 2 5 9 12 37 42 82 106 218 256
Appendix D
* Supply Shortage if positive ** Historical data has a coefficient of variation >16.5% and <33.3% and should be used with caution Supply Surplus if negative

37
Results of Alberta’s Occupational Demand and Supply for 4-Digit NOC-S Occupations, 2011-2021
Occupational Projections 2011 2012 2013 2014 2015 2016 2017 2018 2019 2020 2021 D111 - Head nurses and supervisors **
Demand Projection 400 400 400 400 400 400 400 500 500 500 500 Supply Projection 432 429 427 423 419 415 412 501 500 498 496 Cumulative Shortage* 68 71 73 77 81 85 88 99 100 102 104
D112 - Registered nurses Demand Projection 36,102 35,902 36,502 37,302 38,302 39,502 40,602 41,602 42,502 43,402 44,402 Supply Projection 36,364 36,163 36,498 37,109 37,894 38,613 39,129 39,482 39,663 39,802 39,965 Cumulative Shortage* -262 -261 4 193 408 890 1,473 2,120 2,839 3,600 4,437
D211 - Medical laboratory technologists and pathologists' assistants ** Demand Projection 1,600 1,600 1,600 1,700 1,700 1,800 1,800 1,900 1,900 2,000 2,000 Supply Projection 1,589 1,588 1,583 1,668 1,663 1,733 1,725 1,808 1,795 1,854 1,820 Cumulative Shortage* 11 12 18 32 38 67 75 92 106 147 180
D212 - Medical laboratory technicians ** Demand Projection 4,901 4,801 4,901 5,001 5,201 5,301 5,501 5,601 5,701 5,901 6,001 Supply Projection 4,848 4,724 4,815 4,898 5,087 5,163 5,341 5,427 5,507 5,662 5,722 Cumulative Shortage* 53 76 86 103 114 138 160 174 194 239 279
D215 - Medical radiation technologists ** Demand Projection 1,500 1,500 1,500 1,600 1,600 1,700 1,700 1,800 1,800 1,800 1,900 Supply Projection 1,490 1,489 1,487 1,580 1,578 1,669 1,664 1,759 1,753 1,741 1,819 Cumulative Shortage* 10 11 13 20 22 31 36 42 47 59 81
D223 - Dental technologists, technicians and laboratory bench workers ** Demand Projection 1,499 1,499 1,599 1,599 1,699 1,699 1,699 1,799 1,799 1,899 1,899 Supply Projection 1,588 1,577 1,678 1,678 1,771 1,769 1,764 1,840 1,809 1,859 1,852 Cumulative Shortage* 11 23 21 21 28 30 35 59 90 140 147
D233 - Licensed practical nurses Demand Projection 7,799 7,799 7,899 8,099 8,299 8,499 8,799 8,999 9,199 9,399 9,599 Supply Projection 7,891 7,860 7,946 8,118 8,255 8,456 8,736 8,861 8,942 8,953 9,003 Cumulative Shortage* 8 39 53 81 144 143 163 238 356 546 695
D234 - Ambulance attendants and other paramedical occupations ** Demand Projection 3,999 3,999 3,999 4,099 4,199 4,399 4,499 4,599 4,699 4,799 4,899 Supply Projection 4,080 4,065 4,059 4,146 4,243 4,446 4,546 4,614 4,700 4,784 4,866 Cumulative Shortage* 19 35 40 54 56 53 53 85 99 115 133
D235 - Other technical occupations in therapy and assessment ** Demand Projection 1,800 1,900 1,900 2,000 2,000 2,100 2,100 2,200 2,300 2,300 2,400 Supply Projection 1,898 1,996 1,993 2,077 2,076 2,180 2,180 2,249 2,292 2,285 2,324 Cumulative Shortage* 2 4 7 23 24 20 20 51 108 115 175
Appendix D
* Supply Shortage if positive ** Historical data has a coefficient of variation >16.5% and <33.3% and should be used with caution Supply Surplus if negative

38
Results of Alberta’s Occupational Demand and Supply for 4-Digit NOC-S Occupations, 2011-2021
Occupational Projections 2011 2012 2013 2014 2015 2016 2017 2018 2019 2020 2021 D311 - Dental assistants **
Demand Projection 3,000 3,000 3,100 3,100 3,200 3,300 3,400 3,500 3,600 3,700 3,700 Supply Projection 3,181 3,165 3,214 3,210 3,284 3,333 3,411 3,481 3,538 3,599 3,593 Cumulative Shortage* 19 35 86 90 116 167 189 219 262 301 307
D312 - Nurse aides, orderlies and patient service associates Demand Projection 21,400 21,300 21,600 22,100 22,700 23,400 24,100 24,600 25,200 25,800 26,300 Supply Projection 21,918 21,794 21,974 22,338 22,815 23,292 23,883 24,265 24,725 25,136 25,432 Cumulative Shortage* 82 106 226 362 485 708 817 935 1,075 1,264 1,468
D313 - Other assisting occupations in support of health services Demand Projection 9,200 9,400 9,600 9,900 10,200 10,500 10,800 11,000 11,300 11,600 11,900 Supply Projection 9,244 9,388 9,514 9,720 9,978 10,237 10,508 10,673 10,927 11,165 11,353 Cumulative Shortage* 56 112 186 280 322 363 392 427 473 535 647
E012 - Lawyers and Quebec notaries ** Demand Projection 6,900 7,100 7,200 7,400 7,500 7,700 7,900 8,000 8,200 8,400 8,600 Supply Projection 6,993 7,193 7,293 7,492 7,591 7,792 7,990 8,081 8,270 8,452 8,627 Cumulative Shortage* 7 7 7 8 9 8 10 19 30 48 73
E021 - Psychologists ** Demand Projection 2,101 2,101 2,201 2,201 2,301 2,401 2,401 2,501 2,601 2,601 2,701 Supply Projection 2,095 2,095 2,195 2,195 2,290 2,386 2,385 2,483 2,581 2,575 2,672 Cumulative Shortage* 5 5 6 6 11 15 15 17 20 25 29
E022 - Social workers ** Demand Projection 4,401 4,501 4,601 4,701 4,901 5,001 5,101 5,201 5,402 5,502 5,602 Supply Projection 4,589 4,694 4,798 4,902 5,100 5,198 5,299 5,400 5,603 5,697 5,794 Cumulative Shortage* 12 7 3 0 1 4 2 1 -2 4 7
E023 - Family, marriage and other related counsellors ** Demand Projection 3,301 3,301 3,401 3,501 3,601 3,701 3,801 3,901 4,001 4,101 4,101 Supply Projection 3,392 3,393 3,495 3,597 3,692 3,790 3,891 3,991 4,090 4,185 4,180 Cumulative Shortage* 9 8 6 4 9 11 10 10 11 16 21
E024 - Ministers of religion ** Demand Projection 3,901 4,001 4,101 4,201 4,401 4,501 4,701 4,801 4,901 5,001 5,201 Supply Projection 3,865 3,964 4,062 4,160 4,316 4,386 4,566 4,651 4,736 4,812 4,981 Cumulative Shortage* 36 37 39 41 86 115 136 151 166 189 221
E031 - Natural and applied science policy researchers, consultants and program officers Demand Projection 5,800 6,000 6,100 6,200 6,300 6,500 6,600 6,800 7,000 7,100 7,300 Supply Projection 5,870 6,072 6,171 6,270 6,369 6,566 6,662 6,856 7,047 7,141 7,332 Cumulative Shortage* 30 28 29 30 31 34 38 44 53 59 68
Appendix D
* Supply Shortage if positive ** Historical data has a coefficient of variation >16.5% and <33.3% and should be used with caution Supply Surplus if negative

39
Results of Alberta’s Occupational Demand and Supply for 4-Digit NOC-S Occupations, 2011-2021
Occupational Projections 2011 2012 2013 2014 2015 2016 2017 2018 2019 2020 2021 E032 - Economists and economic policy researchers and analysts **
Demand Projection 1,600 1,700 1,700 1,800 1,800 1,900 1,900 1,900 2,000 2,000 2,100 Supply Projection 1,591 1,690 1,690 1,788 1,788 1,885 1,884 1,882 1,978 1,976 2,071 Cumulative Shortage* 9 10 10 12 12 15 16 18 22 24 29
E033 - Business development officers and marketing researchers and consultants ** Demand Projection 3,000 3,100 3,200 3,200 3,300 3,400 3,500 3,600 3,600 3,700 3,800 Supply Projection 2,983 3,082 3,181 3,180 3,275 3,369 3,463 3,554 3,551 3,637 3,721 Cumulative Shortage* 17 18 19 20 25 31 37 46 49 63 79
E034 - Social policy researchers, consultants and program officers ** Demand Projection 3,200 3,200 3,300 3,400 3,500 3,600 3,700 3,800 3,800 3,900 4,000 Supply Projection 3,182 3,182 3,280 3,378 3,475 3,572 3,668 3,762 3,758 3,852 3,945 Cumulative Shortage* 18 18 20 22 25 28 32 38 42 48 55
E035 - Education policy researchers, consultants and program officers ** Demand Projection 3,300 3,500 3,600 3,700 3,800 3,900 4,000 4,100 4,200 4,300 4,300 Supply Projection 3,487 3,698 3,803 3,906 4,010 4,112 4,214 4,315 4,413 4,513 4,507 Cumulative Shortage* 13 2 -3 -6 -10 -12 -14 -15 -13 -13 -7
E036 - Recreation, sports and fitness program supervisors and consultants ** Demand Projection 3,200 3,200 3,300 3,400 3,500 3,600 3,700 3,800 3,900 4,000 4,100 Supply Projection 3,387 3,388 3,492 3,596 3,700 3,802 3,904 4,005 4,105 4,205 4,303 Cumulative Shortage* 13 12 8 4 0 -2 -4 -5 -5 -5 -3
E039 - Health policy researchers, consultants and program officers ** Demand Projection 2,300 2,400 2,400 2,500 2,600 2,600 2,700 2,700 2,800 2,900 2,900 Supply Projection 2,287 2,386 2,386 2,483 2,579 2,578 2,672 2,670 2,762 2,850 2,848 Cumulative Shortage* 13 14 14 17 21 22 28 30 38 50 52
E111 - University professors ** Demand Projection 5,799 6,099 6,299 6,499 6,699 6,899 7,099 7,299 7,399 7,599 7,699 Supply Projection 5,797 6,095 6,294 6,492 6,691 6,888 7,086 7,284 7,381 7,578 7,675 Cumulative Shortage* 2 4 5 7 9 11 13 15 18 21 24
E112 - Post-Secondary teaching and research assistants Demand Projection 10,399 10,899 11,299 11,698 12,098 12,498 12,898 13,098 13,398 13,598 13,798 Supply Projection 10,377 10,851 11,233 11,614 11,995 12,372 12,747 12,920 13,189 13,356 13,522 Cumulative Shortage* 22 47 65 85 103 126 152 179 209 242 276
E121 - College and other vocational instructors Demand Projection 11,202 11,702 12,002 12,402 12,802 13,203 13,603 13,903 14,203 14,403 14,703 Supply Projection 11,265 11,754 12,040 12,427 12,810 13,192 13,574 13,856 14,135 14,313 14,588 Cumulative Shortage* 37 49 62 76 93 110 128 147 168 190 215
Appendix D
* Supply Shortage if positive ** Historical data has a coefficient of variation >16.5% and <33.3% and should be used with caution Supply Surplus if negative

40
Results of Alberta’s Occupational Demand and Supply for 4-Digit NOC-S Occupations, 2011-2021
Occupational Projections 2011 2012 2013 2014 2015 2016 2017 2018 2019 2020 2021 E131 - Secondary school teachers **
Demand Projection 16,200 17,000 17,500 18,200 18,800 19,400 20,000 20,400 20,800 21,200 21,600 Supply Projection 16,777 17,586 18,030 18,670 19,228 19,825 20,358 20,685 21,001 21,308 21,601 Cumulative Shortage* 23 14 70 130 172 175 242 315 399 492 599
E132 - Elementary school and kindergarten teachers Demand Projection 25,100 26,400 27,100 28,200 29,100 30,100 31,000 31,600 32,200 32,800 33,400 Supply Projection 25,715 26,964 27,656 28,651 29,521 30,451 31,284 31,801 32,302 32,788 33,254 Cumulative Shortage* -15 36 44 149 179 249 316 399 498 612 746
E133 - Educational counsellors ** Demand Projection 2,400 2,500 2,600 2,700 2,700 2,800 2,900 3,000 3,000 3,100 3,100 Supply Projection 2,504 2,607 2,711 2,813 2,812 2,915 3,017 3,120 3,118 3,219 3,217 Cumulative Shortage* -4 -7 -11 -13 -12 -15 -17 -20 -18 -19 -17
E211 - Paralegal and related occupations Demand Projection 7,999 8,199 8,399 8,599 8,699 8,999 9,199 9,399 9,599 9,799 9,999 Supply Projection 8,208 8,414 8,607 8,803 8,881 9,166 9,344 9,515 9,688 9,852 10,014 Cumulative Shortage* -9 -14 -7 -3 18 33 55 84 111 148 185
E212 - Community and social service workers Demand Projection 12,199 12,399 12,699 13,099 13,499 13,899 14,199 14,499 14,799 15,199 15,499 Supply Projection 12,502 12,704 12,993 13,389 13,775 14,139 14,404 14,658 14,919 15,265 15,500 Cumulative Shortage* -3 -5 5 9 24 60 94 141 180 233 298
E213 - Employment counsellors ** Demand Projection 2,900 2,900 3,000 3,100 3,200 3,200 3,300 3,400 3,500 3,600 3,600 Supply Projection 2,901 2,901 2,996 3,093 3,187 3,176 3,267 3,355 3,444 3,530 3,514 Cumulative Shortage* -1 -1 3 7 13 24 33 45 56 70 86
E215 - Other instructors ** Demand Projection 1,300 1,400 1,400 1,500 1,500 1,600 1,600 1,600 1,700 1,700 1,700 Supply Projection 1,290 1,380 1,380 1,470 1,470 1,560 1,560 1,560 1,650 1,650 1,650 Cumulative Shortage* 10 20 20 30 30 40 40 40 50 50 50
E217 - Early childhood educators and assistants Demand Projection 20,798 20,698 20,998 21,498 22,098 22,798 23,398 23,998 24,498 25,098 25,598 Supply Projection 21,515 21,413 21,687 22,178 22,747 23,398 23,948 24,475 24,905 25,414 25,812 Cumulative Shortage* -17 -15 11 20 51 100 150 223 292 384 486
F024 - Professional occupations in public relations and communications ** Demand Projection 5,700 5,800 6,000 6,100 6,300 6,400 6,600 6,800 6,900 7,100 7,200 Supply Projection 5,720 5,817 6,014 6,109 6,299 6,385 6,561 6,725 6,783 6,946 6,983 Cumulative Shortage* 80 83 86 91 101 115 139 175 217 254 317
Appendix D
* Supply Shortage if positive ** Historical data has a coefficient of variation >16.5% and <33.3% and should be used with caution Supply Surplus if negative
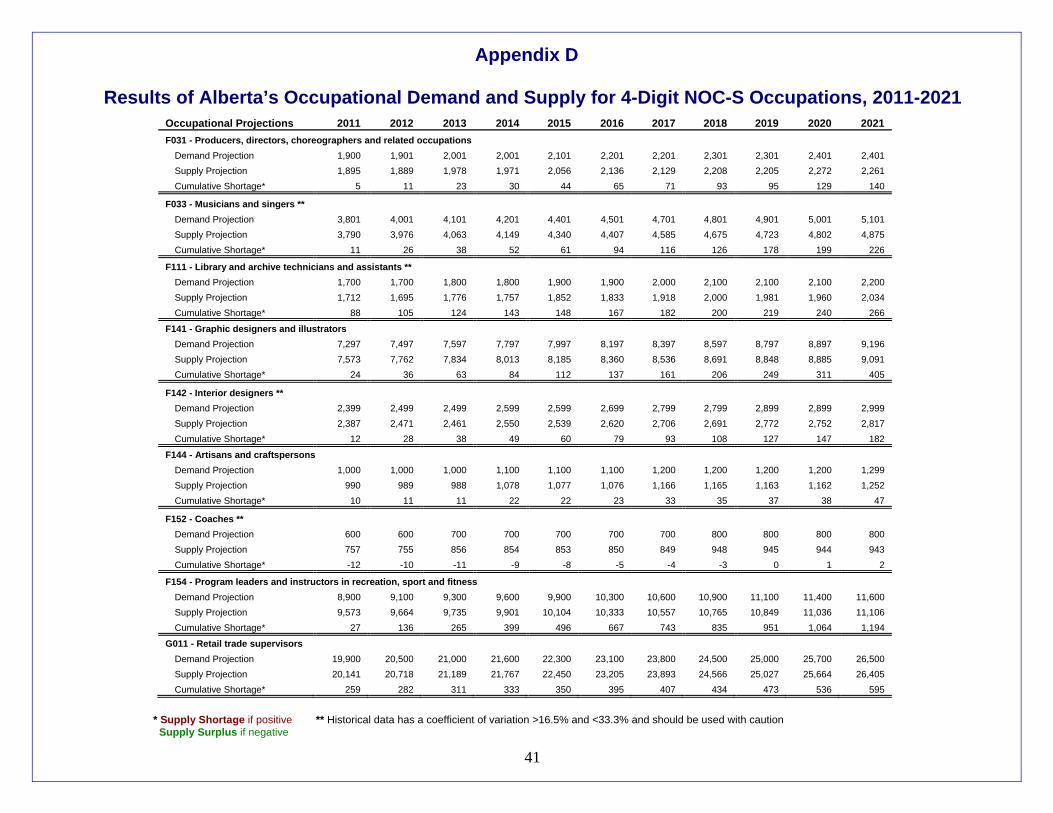
41
Results of Alberta’s Occupational Demand and Supply for 4-Digit NOC-S Occupations, 2011-2021
Occupational Projections 2011 2012 2013 2014 2015 2016 2017 2018 2019 2020 2021 F031 - Producers, directors, choreographers and related occupations
Demand Projection 1,900 1,901 2,001 2,001 2,101 2,201 2,201 2,301 2,301 2,401 2,401 Supply Projection 1,895 1,889 1,978 1,971 2,056 2,136 2,129 2,208 2,205 2,272 2,261 Cumulative Shortage* 5 11 23 30 44 65 71 93 95 129 140
F033 - Musicians and singers ** Demand Projection 3,801 4,001 4,101 4,201 4,401 4,501 4,701 4,801 4,901 5,001 5,101 Supply Projection 3,790 3,976 4,063 4,149 4,340 4,407 4,585 4,675 4,723 4,802 4,875 Cumulative Shortage* 11 26 38 52 61 94 116 126 178 199 226
F111 - Library and archive technicians and assistants ** Demand Projection 1,700 1,700 1,800 1,800 1,900 1,900 2,000 2,100 2,100 2,100 2,200 Supply Projection 1,712 1,695 1,776 1,757 1,852 1,833 1,918 2,000 1,981 1,960 2,034 Cumulative Shortage* 88 105 124 143 148 167 182 200 219 240 266
F141 - Graphic designers and illustrators Demand Projection 7,297 7,497 7,597 7,797 7,997 8,197 8,397 8,597 8,797 8,897 9,196 Supply Projection 7,573 7,762 7,834 8,013 8,185 8,360 8,536 8,691 8,848 8,885 9,091 Cumulative Shortage* 24 36 63 84 112 137 161 206 249 311 405
F142 - Interior designers ** Demand Projection 2,399 2,499 2,499 2,599 2,599 2,699 2,799 2,799 2,899 2,899 2,999 Supply Projection 2,387 2,471 2,461 2,550 2,539 2,620 2,706 2,691 2,772 2,752 2,817 Cumulative Shortage* 12 28 38 49 60 79 93 108 127 147 182
F144 - Artisans and craftspersons Demand Projection 1,000 1,000 1,000 1,100 1,100 1,100 1,200 1,200 1,200 1,200 1,299 Supply Projection 990 989 988 1,078 1,077 1,076 1,166 1,165 1,163 1,162 1,252 Cumulative Shortage* 10 11 11 22 22 23 33 35 37 38 47
F152 - Coaches ** Demand Projection 600 600 700 700 700 700 700 800 800 800 800 Supply Projection 757 755 856 854 853 850 849 948 945 944 943 Cumulative Shortage* -12 -10 -11 -9 -8 -5 -4 -3 0 1 2
F154 - Program leaders and instructors in recreation, sport and fitness Demand Projection 8,900 9,100 9,300 9,600 9,900 10,300 10,600 10,900 11,100 11,400 11,600 Supply Projection 9,573 9,664 9,735 9,901 10,104 10,333 10,557 10,765 10,849 11,036 11,106 Cumulative Shortage* 27 136 265 399 496 667 743 835 951 1,064 1,194
G011 - Retail trade supervisors Demand Projection 19,900 20,500 21,000 21,600 22,300 23,100 23,800 24,500 25,000 25,700 26,500 Supply Projection 20,141 20,718 21,189 21,767 22,450 23,205 23,893 24,566 25,027 25,664 26,405 Cumulative Shortage* 259 282 311 333 350 395 407 434 473 536 595
Appendix D
* Supply Shortage if positive ** Historical data has a coefficient of variation >16.5% and <33.3% and should be used with caution Supply Surplus if negative

42
Results of Alberta’s Occupational Demand and Supply for 4-Digit NOC-S Occupations, 2011-2021
Occupational Projections 2011 2012 2013 2014 2015 2016 2017 2018 2019 2020 2021 G012 - Food service supervisors
Demand Projection 6,300 6,500 6,800 7,100 7,300 7,600 7,800 8,000 8,200 8,400 8,600 Supply Projection 6,455 6,632 6,913 7,194 7,378 7,607 7,787 7,961 8,122 8,277 8,405 Cumulative Shortage* 45 68 87 106 122 193 213 239 278 323 395
G015 - Cleaning supervisors ** Demand Projection 4,600 4,700 4,800 4,900 5,000 5,200 5,300 5,400 5,500 5,600 5,800 Supply Projection 4,670 4,762 4,856 4,952 5,047 5,222 5,319 5,412 5,504 5,590 5,735 Cumulative Shortage* 30 38 44 48 53 78 81 88 96 110 165
G016 - Other service supervisors ** Demand Projection 4,100 4,200 4,400 4,500 4,600 4,700 4,900 5,000 5,100 5,200 5,300 Supply Projection 4,207 4,304 4,499 4,597 4,695 4,788 4,985 5,082 5,175 5,263 5,351 Cumulative Shortage* 93 96 101 103 105 112 115 118 125 137 149
G111 - Sales representatives - Wholesale trade (non-technical) Demand Projection 26,202 27,002 27,602 28,302 29,202 30,102 31,002 31,803 32,503 33,303 34,303 Supply Projection 27,303 28,060 28,588 29,213 30,041 30,875 31,692 32,369 32,913 33,547 34,357 Cumulative Shortage* 99 142 214 289 361 427 510 633 790 955 1,146
G121 - Technical sales specialists - Wholesale trade Demand Projection 14,500 14,900 15,200 15,600 16,100 16,600 17,000 17,500 17,900 18,300 18,800 Supply Projection 14,886 15,275 15,564 15,928 16,379 16,861 17,241 17,713 18,065 18,405 18,829 Cumulative Shortage* 114 125 136 172 221 239 259 287 335 395 471
G131 - Insurance agents and brokers Demand Projection 7,499 7,699 7,899 8,099 8,299 8,499 8,699 8,799 8,999 9,199 9,399 Supply Projection 7,594 7,793 7,993 8,195 8,395 8,590 8,790 8,887 9,058 9,239 9,404 Cumulative Shortage* 5 6 6 4 4 9 9 12 41 60 95
G132 - Real estate agents and salespersons Demand Projection 8,499 8,799 8,999 9,199 9,499 9,699 9,899 10,099 10,299 10,399 10,599 Supply Projection 8,697 9,000 9,202 9,406 9,710 9,910 10,112 10,309 10,508 10,604 10,801 Cumulative Shortage* 2 0 -3 -7 -11 -11 -13 -10 -9 -5 -2
G133 - Retail and wholesale buyers Demand Projection 5,199 5,299 5,399 5,599 5,799 5,899 6,099 6,299 6,399 6,599 6,799 Supply Projection 5,101 5,200 5,296 5,484 5,674 5,769 5,956 6,138 6,232 6,413 6,595 Cumulative Shortage* 98 100 104 115 126 130 144 161 168 187 205
G211 - Retail salespersons and sales clerks Demand Projection 70,898 72,998 74,698 76,698 79,298 81,898 84,198 86,597 88,397 90,697 93,597 Supply Projection 76,318 78,084 79,621 81,346 83,237 85,136 86,970 88,789 89,847 91,328 93,284 Cumulative Shortage* -20 313 477 752 1,461 2,161 2,628 3,208 3,951 4,769 5,713
Appendix D
* Supply Shortage if positive ** Historical data has a coefficient of variation >16.5% and <33.3% and should be used with caution Supply Surplus if negative

43
Results of Alberta’s Occupational Demand and Supply for 4-Digit NOC-S Occupations, 2011-2021
Occupational Projections 2011 2012 2013 2014 2015 2016 2017 2018 2019 2020 2021 G311 - Cashiers
Demand Projection 35,500 36,600 37,600 38,700 40,100 41,500 42,600 43,900 44,800 46,000 47,500 Supply Projection 38,693 39,239 39,963 40,843 41,910 42,895 43,829 44,913 45,564 46,473 47,646 Cumulative Shortage* 7 561 837 1,057 1,390 1,805 1,971 2,187 2,436 2,727 3,054
G411 - Chefs ** Demand Projection 4,901 5,001 5,201 5,501 5,701 5,901 6,001 6,201 6,401 6,501 6,701 Supply Projection 5,505 5,609 5,822 6,144 6,358 6,568 6,667 6,878 7,087 7,183 7,389 Cumulative Shortage* -5 -8 -21 -43 -57 -67 -66 -77 -86 -82 -88
G412 - Cooks Demand Projection 21,103 21,603 22,404 23,404 24,304 25,204 25,804 26,504 27,104 27,704 28,505 Supply Projection 22,516 22,857 23,498 24,318 25,049 25,749 26,155 26,637 26,992 27,341 27,848 Cumulative Shortage* -13 147 306 486 655 855 1,049 1,267 1,512 1,763 2,056
G511 - Maîtres d'hôtel and hosts/hostesses Demand Projection 6,500 6,700 7,000 7,300 7,600 7,900 8,100 8,300 8,500 8,700 9,000 Supply Projection 6,869 7,015 7,318 7,621 7,920 8,225 8,416 8,613 8,809 8,998 9,293 Cumulative Shortage* 31 85 82 79 80 75 84 87 91 102 107
G512 - Bartenders ** Demand Projection 4,100 4,200 4,400 4,600 4,700 4,900 5,100 5,200 5,300 5,500 5,600 Supply Projection 4,501 4,595 4,731 4,881 4,976 5,131 5,296 5,389 5,479 5,629 5,709 Cumulative Shortage* -1 5 68 119 124 169 204 211 221 271 291
G513 - Food and beverage servers Demand Projection 21,900 22,600 23,500 24,500 25,500 26,500 27,200 27,900 28,600 29,300 30,000 Supply Projection 22,977 23,629 24,388 25,216 25,982 26,862 27,477 28,026 28,558 29,116 29,598 Cumulative Shortage* 23 71 212 384 618 738 823 974 1,142 1,284 1,502
G611 - Police officers (except commissioned) Demand Projection 7,897 8,097 8,297 8,497 8,697 8,897 9,196 9,396 9,596 9,796 10,096 Supply Projection 7,908 8,107 8,306 8,505 8,704 8,902 9,190 9,382 9,559 9,743 10,000 Cumulative Shortage* -11 -10 -9 -8 -7 -5 7 15 37 53 97
G612 - Firefighters ** Demand Projection 2,799 2,799 2,899 2,999 2,999 3,099 3,199 3,299 3,299 3,399 3,499 Supply Projection 2,803 2,801 2,899 2,998 2,995 3,094 3,193 3,281 3,277 3,363 3,459 Cumulative Shortage* -4 -2 0 1 4 5 6 18 21 36 40
G622 - Correctional service officers ** Demand Projection 2,500 2,600 2,700 2,700 2,800 2,900 2,900 3,000 3,100 3,200 3,200 Supply Projection 2,500 2,600 2,699 2,697 2,795 2,892 2,888 2,985 3,077 3,170 3,163 Cumulative Shortage* 0 0 1 3 5 8 12 15 23 30 37
Appendix D
* Supply Shortage if positive ** Historical data has a coefficient of variation >16.5% and <33.3% and should be used with caution Supply Surplus if negative

44
Results of Alberta’s Occupational Demand and Supply for 4-Digit NOC-S Occupations, 2011-2021
Occupational Projections 2011 2012 2013 2014 2015 2016 2017 2018 2019 2020 2021 G631 - Security guards and related occupations
Demand Projection 7,700 7,900 8,100 8,300 8,400 8,600 8,800 9,000 9,200 9,400 9,700 Supply Projection 8,498 8,646 8,774 8,895 8,941 9,086 9,229 9,365 9,492 9,611 9,821 Cumulative Shortage* 602 654 726 805 859 914 971 1,035 1,108 1,189 1,279
G711 - Travel counsellors ** Demand Projection 2,601 2,701 2,701 2,801 2,801 2,901 3,001 3,001 3,101 3,201 3,301 Supply Projection 2,602 2,687 2,682 2,763 2,756 2,838 2,925 2,920 3,005 3,082 3,151 Cumulative Shortage* -2 13 18 37 45 63 76 81 96 118 149
G715 - Hotel front desk clerks ** Demand Projection 4,901 5,001 5,201 5,501 5,701 5,901 6,101 6,301 6,401 6,601 6,701 Supply Projection 5,007 5,105 5,277 5,578 5,778 5,975 6,176 6,369 6,458 6,652 6,741 Cumulative Shortage* -6 -4 25 23 23 26 25 33 43 50 60
G723 - Casino occupations ** Demand Projection 2,700 2,700 2,800 2,900 3,000 3,100 3,200 3,300 3,400 3,500 3,600 Supply Projection 2,699 2,695 2,795 2,894 2,992 3,082 3,179 3,264 3,356 3,447 3,535 Cumulative Shortage* 1 5 5 6 8 18 21 36 44 53 65
G731 - Operators and attendants in amusement, recreation and sport Demand Projection 7,200 7,400 7,600 7,800 8,100 8,400 8,600 8,800 9,100 9,300 9,500 Supply Projection 7,708 7,871 8,028 8,190 8,435 8,693 8,877 9,055 9,334 9,506 9,676 Cumulative Shortage* 292 329 372 410 465 507 523 545 566 594 624
G811 - Visiting homemakers, housekeepers and related occupations Demand Projection 7,499 7,599 7,799 7,999 8,199 8,399 8,599 8,799 8,999 9,199 9,299 Supply Projection 7,911 7,997 8,199 8,406 8,605 8,805 9,000 9,193 9,385 9,566 9,650 Cumulative Shortage* -11 3 0 -6 -6 -5 0 6 14 33 49
G812 - Elementary and secondary school teacher assistants Demand Projection 14,199 14,999 15,399 15,999 16,499 17,099 17,599 17,899 18,299 18,599 18,899 Supply Projection 15,251 16,087 16,502 17,083 17,600 18,210 18,718 19,006 19,368 19,630 19,909 Cumulative Shortage* -52 -88 -103 -84 -101 -111 -119 -108 -69 -31 -10
G814 - Babysitters, nannies and parents' helpers Demand Projection 8,299 8,499 8,699 8,899 9,199 9,499 9,799 10,099 10,299 10,499 10,799 Supply Projection 8,412 8,604 8,787 8,984 9,241 9,490 9,723 9,944 10,071 10,200 10,391 Cumulative Shortage* -13 -5 13 16 58 110 176 256 328 400 508
G911 - Hairstylists and barbers Demand Projection 10,402 10,602 10,902 11,202 11,602 12,002 12,402 12,802 13,103 13,403 13,803 Supply Projection 10,462 10,659 10,959 11,260 11,653 12,055 12,454 12,845 13,134 13,406 13,779 Cumulative Shortage* -60 -57 -57 -58 -51 -53 -51 -42 -31 -3 24
Appendix D
* Supply Shortage if positive ** Historical data has a coefficient of variation >16.5% and <33.3% and should be used with caution Supply Surplus if negative

45
Results of Alberta’s Occupational Demand and Supply for 4-Digit NOC-S Occupations, 2011-2021
Occupational Projections 2011 2012 2013 2014 2015 2016 2017 2018 2019 2020 2021 G922 - Estheticians, electrologists and related occupations **
Demand Projection 4,798 4,898 4,998 5,098 5,298 5,498 5,698 5,798 5,998 6,098 6,298 Supply Projection 4,898 4,995 5,091 5,187 5,375 5,554 5,740 5,832 5,998 6,082 6,233 Cumulative Shortage* 0 3 8 11 24 44 58 66 100 116 164
G923 - Pet groomers and animal care workers ** Demand Projection 4,698 4,898 4,998 5,098 5,298 5,398 5,598 5,798 5,898 6,098 6,198 Supply Projection 4,881 5,084 5,186 5,285 5,492 5,593 5,796 5,978 6,078 6,254 6,353 Cumulative Shortage* 17 15 13 13 7 5 2 20 20 43 45
G924 - Other personal service occupations ** Demand Projection 1,899 1,899 1,899 1,999 2,099 2,099 2,199 2,299 2,299 2,399 2,399 Supply Projection 1,897 1,895 1,894 1,993 2,092 2,091 2,189 2,287 2,286 2,383 2,382 Cumulative Shortage* 2 4 5 7 8 8 11 13 13 16 17
G931 - Light duty cleaners Demand Projection 22,400 23,000 23,600 24,200 24,900 25,600 26,200 26,900 27,500 28,000 28,700 Supply Projection 23,694 24,291 24,756 25,335 25,980 26,664 27,278 27,991 28,599 29,102 29,811 Cumulative Shortage* 406 409 544 565 620 636 622 609 601 598 589
G932 - Specialized cleaners Demand Projection 5,700 5,800 6,000 6,100 6,300 6,500 6,600 6,800 6,900 7,100 7,300 Supply Projection 6,311 6,411 6,497 6,586 6,712 6,859 6,962 7,142 7,243 7,396 7,582 Cumulative Shortage* -11 -11 103 114 188 241 238 258 257 304 318
G933 - Janitors, caretakers and building superintendents Demand Projection 26,900 27,700 28,400 29,200 29,900 30,800 31,500 32,200 32,900 33,500 34,300 Supply Projection 28,616 29,040 29,229 29,570 29,933 30,369 30,931 31,506 32,015 32,457 33,033 Cumulative Shortage* -16 360 871 1,330 1,667 2,131 2,269 2,394 2,585 2,743 2,967
G941 - Butchers, meat cutters and fishmongers - Retail and wholesale ** Demand Projection 2,400 2,500 2,600 2,600 2,700 2,800 2,900 3,000 3,000 3,100 3,200 Supply Projection 2,570 2,673 2,774 2,774 2,874 2,968 3,065 3,161 3,161 3,253 3,342 Cumulative Shortage* 30 27 26 26 26 32 35 39 39 47 58
G942 - Bakers Demand Projection 5,400 5,600 5,700 5,900 6,100 6,300 6,400 6,600 6,700 6,900 7,100 Supply Projection 5,496 5,698 5,795 5,992 6,192 6,390 6,486 6,684 6,771 6,967 7,161 Cumulative Shortage* 104 102 105 108 108 110 114 116 129 133 139
G961 - Food counter attendants, kitchen helpers and related occupations Demand Projection 36,596 37,596 38,996 40,595 42,095 43,795 44,895 45,995 47,095 48,195 49,494 Supply Projection 39,634 40,511 41,840 43,351 44,719 46,312 47,253 48,160 49,037 49,890 50,915 Cumulative Shortage* -39 84 156 244 377 483 642 835 1,057 1,305 1,579
Appendix D
* Supply Shortage if positive ** Historical data has a coefficient of variation >16.5% and <33.3% and should be used with caution Supply Surplus if negative

46
Results of Alberta’s Occupational Demand and Supply for 4-Digit NOC-S Occupations, 2011-2021
Occupational Projections 2011 2012 2013 2014 2015 2016 2017 2018 2019 2020 2021 G971 - Service station attendants **
Demand Projection 1,600 1,700 1,700 1,700 1,800 1,900 1,900 2,000 2,000 2,100 2,200 Supply Projection 1,799 1,906 1,867 1,839 1,904 1,984 1,974 2,053 2,035 2,114 2,180 Cumulative Shortage* 1 -6 33 62 96 116 127 148 165 186 220
G972 - Grocery clerks and store shelf stockers Demand Projection 18,202 18,702 19,102 19,702 20,402 21,102 21,702 22,302 22,802 23,402 24,202 Supply Projection 20,202 20,432 20,737 21,256 21,836 22,460 23,019 23,567 23,973 24,476 25,150 Cumulative Shortage* 0 270 365 446 566 642 683 735 829 927 1,052
G973 - Other elemental sales occupations ** Demand Projection 3,100 3,200 3,200 3,300 3,400 3,500 3,600 3,700 3,800 3,900 4,000 Supply Projection 3,306 3,402 3,341 3,380 3,402 3,464 3,526 3,579 3,639 3,697 3,722 Cumulative Shortage* -6 -2 59 120 198 237 274 321 361 403 478
G981 - Dry cleaning and laundry occupations ** Demand Projection 2,102 2,202 2,302 2,302 2,402 2,502 2,602 2,602 2,702 2,802 2,802 Supply Projection 2,298 2,361 2,461 2,461 2,562 2,664 2,764 2,764 2,865 2,954 2,953 Cumulative Shortage* 103 141 141 141 140 138 138 138 138 148 149
G983 - Other elemental service occupations ** Demand Projection 2,702 2,702 2,802 2,902 3,002 3,102 3,202 3,302 3,403 3,403 3,503 Supply Projection 2,935 2,933 2,997 3,073 3,154 3,235 3,313 3,384 3,457 3,444 3,506 Cumulative Shortage* 67 69 105 129 148 167 190 218 246 259 296
H012 - Contractors and supervisors, electrical trades and telecommunications occupations ** Demand Projection 5,300 5,400 5,600 5,700 5,900 6,100 6,100 6,200 6,300 6,300 6,400 Supply Projection 5,363 5,458 5,645 5,732 5,918 6,105 6,090 6,175 6,255 6,237 6,314 Cumulative Shortage* 37 42 55 68 82 95 110 125 145 163 186
H013 - Contractors and supervisors, pipefitting trades ** Demand Projection 2,800 2,900 3,000 3,100 3,100 3,200 3,300 3,300 3,400 3,400 3,500 Supply Projection 3,100 3,206 3,307 3,409 3,400 3,502 3,601 3,592 3,686 3,674 3,768 Cumulative Shortage* 0 -6 -7 -9 0 -2 -1 8 14 26 32
H014 - Contractors and supervisors, metal forming shaping and erecting trades ** Demand Projection 2,100 2,100 2,200 2,200 2,300 2,400 2,400 2,500 2,500 2,500 2,600 Supply Projection 2,302 2,299 2,395 2,390 2,492 2,594 2,587 2,688 2,680 2,672 2,767 Cumulative Shortage* -2 1 5 10 8 6 13 12 20 28 33
H015 - Contractors and supervisors, carpentry trades ** Demand Projection 3,000 3,000 3,100 3,200 3,300 3,400 3,400 3,500 3,500 3,500 3,600 Supply Projection 2,989 2,986 3,063 3,146 3,228 3,312 3,291 3,365 3,351 3,327 3,395 Cumulative Shortage* 11 14 37 54 72 88 109 135 149 173 205
Appendix D
* Supply Shortage if positive ** Historical data has a coefficient of variation >16.5% and <33.3% and should be used with caution Supply Surplus if negative

47
Results of Alberta’s Occupational Demand and Supply for 4-Digit NOC-S Occupations, 2011-2021
Occupational Projections 2011 2012 2013 2014 2015 2016 2017 2018 2019 2020 2021 H016 - Contractors and supervisors, mechanic trades
Demand Projection 9,400 9,600 9,900 10,100 10,400 10,700 10,900 11,200 11,400 11,600 11,800 Supply Projection 9,571 9,765 10,043 10,221 10,501 10,780 10,954 11,228 11,390 11,552 11,712 Cumulative Shortage* 29 35 57 79 99 120 146 172 210 248 288
H017 - Contractors and supervisors, heavy construction equipment crews Demand Projection 6,900 7,100 7,300 7,500 7,700 7,900 8,000 8,200 8,300 8,300 8,400 Supply Projection 7,083 7,281 7,466 7,653 7,836 8,022 8,103 8,286 8,356 8,329 8,400 Cumulative Shortage* 17 19 34 47 64 78 97 114 144 171 200
H019 - Contractors and supervisors,other construction trades, installers, repairers and servicers Demand Projection 13,700 13,900 14,400 14,900 15,300 15,700 15,800 16,100 16,300 16,300 16,400 Supply Projection 14,285 14,428 14,900 15,382 15,759 16,136 16,195 16,455 16,608 16,560 16,606 Cumulative Shortage* 15 72 100 118 141 164 205 245 292 340 394
H022 - Supervisors, motor transport and other ground transit operators ** Demand Projection 6,198 6,398 6,598 6,598 6,798 6,998 7,098 7,298 7,398 7,498 7,697 Supply Projection 6,388 6,582 6,773 6,759 6,950 7,142 7,229 7,416 7,499 7,581 7,759 Cumulative Shortage* 10 16 25 39 48 56 69 82 98 116 139
H111 - Plumbers Demand Projection 8,600 8,700 9,000 9,300 9,600 9,900 9,900 10,100 10,300 10,200 10,300 Supply Projection 8,884 8,976 9,244 9,533 9,823 10,111 10,105 10,273 10,469 10,355 10,447 Cumulative Shortage* 116 124 156 167 177 189 195 227 231 245 253
H112 - Steamfitters, pipefitters and sprinkler system installers Demand Projection 6,700 6,800 7,000 7,200 7,400 7,600 7,800 7,900 8,100 8,100 8,200 Supply Projection 7,424 7,464 7,634 7,818 8,000 8,200 8,357 8,434 8,577 8,511 8,532 Cumulative Shortage* 76 136 166 182 200 200 243 266 323 389 468
H121 - Carpenters Demand Projection 18,200 18,500 19,200 19,800 20,400 21,000 21,100 21,500 21,800 21,700 21,900 Supply Projection 19,374 19,551 20,094 20,617 21,153 21,656 21,669 21,953 22,163 21,960 22,024 Cumulative Shortage* 326 449 606 683 747 844 931 1,047 1,137 1,240 1,376
H122 - Cabinetmakers ** Demand Projection 2,400 2,500 2,500 2,600 2,700 2,700 2,800 2,800 2,900 2,900 2,900 Supply Projection 2,489 2,548 2,546 2,619 2,690 2,690 2,762 2,761 2,824 2,791 2,776 Cumulative Shortage* 11 52 54 81 110 110 138 139 176 209 224
H131 - Bricklayers ** Demand Projection 1,400 1,400 1,500 1,500 1,600 1,600 1,600 1,700 1,700 1,700 1,700 Supply Projection 1,992 1,991 2,102 2,102 2,227 2,227 2,207 2,312 2,308 2,281 2,276 Cumulative Shortage* 5 6 -5 -5 -30 -31 -11 -16 -11 15 20
Appendix D
* Supply Shortage if positive ** Historical data has a coefficient of variation >16.5% and <33.3% and should be used with caution Supply Surplus if negative

48
Results of Alberta’s Occupational Demand and Supply for 4-Digit NOC-S Occupations, 2011-2021
Occupational Projections 2011 2012 2013 2014 2015 2016 2017 2018 2019 2020 2021 H132 - Concrete finishers **
Demand Projection 2,400 2,500 2,600 2,700 2,700 2,801 2,801 2,901 2,901 2,901 2,901 Supply Projection 2,353 2,433 2,519 2,596 2,592 2,671 2,658 2,728 2,717 2,692 2,680 Cumulative Shortage* 148 167 181 204 209 229 243 272 284 308 320
H134 - Plasterers, drywall installers and finishers and lathers Demand Projection 7,901 8,001 8,301 8,602 8,802 9,102 9,102 9,302 9,402 9,302 9,402 Supply Projection 8,139 8,221 8,498 8,776 8,954 9,237 9,214 9,384 9,442 9,304 9,361 Cumulative Shortage* 463 480 504 526 548 565 588 618 659 698 740
H141 - Roofers and shinglers ** Demand Projection 2,000 2,100 2,100 2,200 2,300 2,300 2,300 2,400 2,400 2,400 2,400 Supply Projection 2,051 2,134 2,123 2,184 2,248 2,243 2,236 2,317 2,309 2,290 2,279 Cumulative Shortage* 49 66 77 116 152 157 164 182 191 210 220
H143 - Insulators ** Demand Projection 1,700 1,700 1,800 1,800 1,900 1,900 2,000 2,000 2,000 2,000 2,000 Supply Projection 2,070 2,065 2,140 2,133 2,199 2,195 2,291 2,287 2,282 2,267 2,257 Cumulative Shortage* 30 35 59 66 101 105 109 113 118 133 142
H144 - Painters and decorators Demand Projection 8,399 8,499 8,799 9,099 9,399 9,599 9,699 9,899 9,999 9,999 9,999 Supply Projection 8,713 8,794 9,050 9,306 9,571 9,748 9,816 9,998 10,046 10,025 9,984 Cumulative Shortage* 486 505 549 593 627 651 682 701 753 774 815
H145 - Floor covering installers ** Demand Projection 2,700 2,800 2,900 3,000 3,100 3,200 3,200 3,300 3,300 3,300 3,300 Supply Projection 2,934 3,025 3,104 3,166 3,230 3,318 3,307 3,390 3,378 3,351 3,336 Cumulative Shortage* 66 75 95 133 170 182 192 209 221 248 263
H211 - Electricians (except industrial and power system) Demand Projection 18,299 18,599 19,199 19,898 20,498 20,998 21,098 21,598 21,798 21,698 21,898 Supply Projection 19,277 19,527 20,082 20,704 21,247 21,714 21,790 22,232 22,372 22,214 22,338 Cumulative Shortage* 422 472 516 594 651 685 709 767 826 884 960
H212 - Industrial electricians ** Demand Projection 4,500 4,700 4,800 4,900 5,000 5,100 5,300 5,400 5,500 5,600 5,600 Supply Projection 4,489 4,652 4,735 4,819 4,901 4,972 5,161 5,229 5,309 5,358 5,336 Cumulative Shortage* 11 47 64 80 99 128 139 170 190 242 263
H214 - Electrical power line and cable workers ** Demand Projection 1,600 1,600 1,700 1,700 1,800 1,800 1,800 1,800 1,900 1,900 1,900 Supply Projection 1,596 1,585 1,671 1,671 1,758 1,755 1,755 1,744 1,829 1,815 1,797 Cumulative Shortage* 4 15 29 29 42 45 45 56 71 85 103
Appendix D
* Supply Shortage if positive ** Historical data has a coefficient of variation >16.5% and <33.3% and should be used with caution Supply Surplus if negative

49
Results of Alberta’s Occupational Demand and Supply for 4-Digit NOC-S Occupations, 2011-2021
Occupational Projections 2011 2012 2013 2014 2015 2016 2017 2018 2019 2020 2021 H216 - Telecommunications installation and repair workers **
Demand Projection 2,100 2,100 2,200 2,200 2,300 2,400 2,500 2,500 2,600 2,600 2,700 Supply Projection 2,199 2,192 2,282 2,280 2,364 2,448 2,544 2,542 2,627 2,619 2,693 Cumulative Shortage* 0 8 18 20 36 52 55 58 73 80 106
H221 - Stationary engineers and auxiliary equipment operators ** Demand Projection 3,900 4,000 4,100 4,200 4,300 4,400 4,500 4,600 4,700 4,800 4,900 Supply Projection 3,900 3,999 4,094 4,187 4,277 4,365 4,445 4,522 4,593 4,661 4,726 Cumulative Shortage* 0 1 6 13 23 35 55 78 107 139 174
H222 - Power systems and power station operators ** Demand Projection 2,000 2,000 2,100 2,200 2,200 2,200 2,300 2,300 2,400 2,400 2,400 Supply Projection 2,000 1,998 2,098 2,197 2,196 2,195 2,293 2,291 2,389 2,386 2,383 Cumulative Shortage* 0 2 2 3 4 5 7 9 11 14 17
H311 - Machinists and machining and tooling inspectors ** Demand Projection 4,102 4,202 4,302 4,402 4,502 4,602 4,802 4,902 5,002 5,102 5,102 Supply Projection 4,287 4,387 4,465 4,545 4,631 4,725 4,918 5,008 5,096 5,182 5,161 Cumulative Shortage* 15 14 37 57 71 77 84 94 107 120 141
H321 - Sheet metal workers ** Demand Projection 2,500 2,600 2,700 2,700 2,800 2,900 2,900 3,000 3,000 3,000 3,100 Supply Projection 2,706 2,812 2,899 2,895 2,992 3,092 3,085 3,167 3,162 3,155 3,234 Cumulative Shortage* -6 -12 2 5 9 8 15 33 39 45 66
H324 - Ironworkers ** Demand Projection 3,300 3,300 3,400 3,500 3,600 3,700 3,800 3,900 3,900 3,900 4,000 Supply Projection 3,617 3,582 3,679 3,770 3,868 3,969 4,059 4,151 4,145 4,138 4,223 Cumulative Shortage* -16 18 21 30 32 31 41 49 55 62 77
H326 - Welders and related machine operators Demand Projection 15,601 16,001 16,402 16,802 17,302 17,802 18,202 18,602 19,002 19,302 19,702 Supply Projection 17,033 17,385 17,676 17,930 18,277 18,645 18,881 19,112 19,323 19,407 19,610 Cumulative Shortage* -32 16 126 271 425 557 721 889 1,079 1,295 1,492
H411 - Construction millwrights and industrial mechanics (except textile) Demand Projection 9,500 9,700 10,000 10,200 10,500 10,700 11,000 11,200 11,500 11,600 11,800 Supply Projection 10,158 10,362 10,634 10,830 11,146 11,322 11,632 11,824 12,098 12,191 12,382 Cumulative Shortage* 342 338 366 370 354 378 368 376 402 409 418
H412 - Heavy-duty equipment mechanics Demand Projection 11,800 12,100 12,400 12,700 13,100 13,400 13,800 14,100 14,400 14,700 15,000 Supply Projection 12,115 12,383 12,636 12,907 13,266 13,523 13,811 14,029 14,259 14,437 14,625 Cumulative Shortage* 85 117 164 193 234 277 389 471 540 663 775
Appendix D
* Supply Shortage if positive ** Historical data has a coefficient of variation >16.5% and <33.3% and should be used with caution Supply Surplus if negative
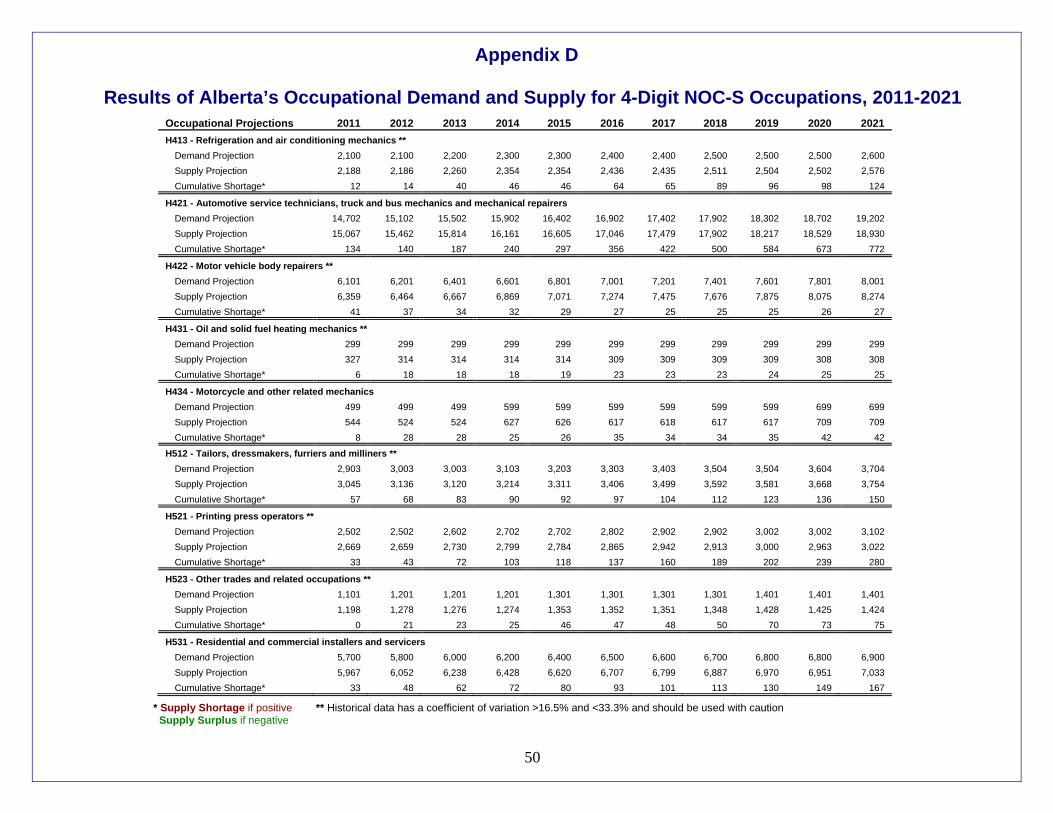
50
Results of Alberta’s Occupational Demand and Supply for 4-Digit NOC-S Occupations, 2011-2021
Occupational Projections 2011 2012 2013 2014 2015 2016 2017 2018 2019 2020 2021 H413 - Refrigeration and air conditioning mechanics **
Demand Projection 2,100 2,100 2,200 2,300 2,300 2,400 2,400 2,500 2,500 2,500 2,600 Supply Projection 2,188 2,186 2,260 2,354 2,354 2,436 2,435 2,511 2,504 2,502 2,576 Cumulative Shortage* 12 14 40 46 46 64 65 89 96 98 124
H421 - Automotive service technicians, truck and bus mechanics and mechanical repairers Demand Projection 14,702 15,102 15,502 15,902 16,402 16,902 17,402 17,902 18,302 18,702 19,202 Supply Projection 15,067 15,462 15,814 16,161 16,605 17,046 17,479 17,902 18,217 18,529 18,930 Cumulative Shortage* 134 140 187 240 297 356 422 500 584 673 772
H422 - Motor vehicle body repairers ** Demand Projection 6,101 6,201 6,401 6,601 6,801 7,001 7,201 7,401 7,601 7,801 8,001 Supply Projection 6,359 6,464 6,667 6,869 7,071 7,274 7,475 7,676 7,875 8,075 8,274 Cumulative Shortage* 41 37 34 32 29 27 25 25 25 26 27
H431 - Oil and solid fuel heating mechanics ** Demand Projection 299 299 299 299 299 299 299 299 299 299 299 Supply Projection 327 314 314 314 314 309 309 309 309 308 308 Cumulative Shortage* 6 18 18 18 19 23 23 23 24 25 25
H434 - Motorcycle and other related mechanics Demand Projection 499 499 499 599 599 599 599 599 599 699 699 Supply Projection 544 524 524 627 626 617 618 617 617 709 709 Cumulative Shortage* 8 28 28 25 26 35 34 34 35 42 42
H512 - Tailors, dressmakers, furriers and milliners ** Demand Projection 2,903 3,003 3,003 3,103 3,203 3,303 3,403 3,504 3,504 3,604 3,704 Supply Projection 3,045 3,136 3,120 3,214 3,311 3,406 3,499 3,592 3,581 3,668 3,754 Cumulative Shortage* 57 68 83 90 92 97 104 112 123 136 150
H521 - Printing press operators ** Demand Projection 2,502 2,502 2,602 2,702 2,702 2,802 2,902 2,902 3,002 3,002 3,102 Supply Projection 2,669 2,659 2,730 2,799 2,784 2,865 2,942 2,913 3,000 2,963 3,022 Cumulative Shortage* 33 43 72 103 118 137 160 189 202 239 280
H523 - Other trades and related occupations ** Demand Projection 1,101 1,201 1,201 1,201 1,301 1,301 1,301 1,301 1,401 1,401 1,401 Supply Projection 1,198 1,278 1,276 1,274 1,353 1,352 1,351 1,348 1,428 1,425 1,424 Cumulative Shortage* 0 21 23 25 46 47 48 50 70 73 75
H531 - Residential and commercial installers and servicers Demand Projection 5,700 5,800 6,000 6,200 6,400 6,500 6,600 6,700 6,800 6,800 6,900 Supply Projection 5,967 6,052 6,238 6,428 6,620 6,707 6,799 6,887 6,970 6,951 7,033 Cumulative Shortage* 33 48 62 72 80 93 101 113 130 149 167
Appendix D
* Supply Shortage if positive ** Historical data has a coefficient of variation >16.5% and <33.3% and should be used with caution Supply Surplus if negative

51
Results of Alberta’s Occupational Demand and Supply for 4-Digit NOC-S Occupations, 2011-2021
Occupational Projections 2011 2012 2013 2014 2015 2016 2017 2018 2019 2020 2021 H533 - Automotive mechanical installers and servicers
Demand Projection 2,700 2,800 2,900 3,000 3,100 3,200 3,300 3,400 3,400 3,500 3,600 Supply Projection 2,876 2,973 3,067 3,151 3,247 3,344 3,427 3,519 3,507 3,587 3,665 Cumulative Shortage* 24 27 33 49 53 56 73 81 93 113 135
H535 - Other repairers and servicers ** Demand Projection 1,100 1,100 1,200 1,200 1,200 1,300 1,300 1,300 1,400 1,400 1,400 Supply Projection 1,120 1,118 1,211 1,211 1,209 1,300 1,298 1,297 1,386 1,382 1,381 Cumulative Shortage* 26 28 35 35 37 46 48 49 60 64 65
H611 - Heavy equipment operators (except crane) Demand Projection 14,600 14,900 15,400 15,800 16,300 16,700 16,900 17,300 17,600 17,600 17,900 Supply Projection 16,251 16,454 16,809 17,091 17,438 17,679 17,702 17,920 18,027 17,818 17,910 Cumulative Shortage* 449 546 691 809 962 1,121 1,298 1,480 1,673 1,882 2,090
H612 - Public works maintenance equipment operators ** Demand Projection 3,500 3,600 3,700 3,800 3,800 3,900 4,000 4,100 4,200 4,200 4,300 Supply Projection 3,524 3,566 3,659 3,752 3,748 3,840 3,931 4,022 4,112 4,105 4,190 Cumulative Shortage* 176 234 241 248 252 260 269 278 288 295 310
H621 - Crane operators ** Demand Projection 2,696 2,796 2,896 2,896 2,996 3,096 3,096 3,196 3,295 3,295 3,295 Supply Projection 2,800 2,894 3,000 2,992 3,085 3,178 3,170 3,262 3,352 3,340 3,327 Cumulative Shortage* 97 102 96 104 110 117 125 134 144 155 168
H711 - Truck drivers Demand Projection 41,799 42,799 43,799 44,299 45,399 46,499 47,498 48,498 49,398 50,198 51,098 Supply Projection 44,660 45,427 46,117 46,406 47,288 48,264 49,073 49,937 50,564 51,187 51,763 Cumulative Shortage* 439 672 982 1,192 1,411 1,534 1,725 1,861 2,134 2,311 2,635
H712 - Bus drivers, subway operators and other transit operators Demand Projection 10,600 10,900 11,200 11,300 11,600 11,900 12,100 12,400 12,600 12,800 13,100 Supply Projection 10,955 11,248 11,537 11,615 11,909 12,208 12,396 12,693 12,884 13,069 13,356 Cumulative Shortage* 245 252 262 285 291 292 304 307 315 331 343
H713 - Taxi and limousine drivers and chauffeurs Demand Projection 6,100 6,300 6,400 6,500 6,600 6,800 6,900 7,100 7,200 7,400 7,500 Supply Projection 6,086 6,208 6,297 6,349 6,440 6,588 6,677 6,809 6,897 7,028 7,114 Cumulative Shortage* 114 192 203 251 259 312 323 391 403 472 486
H714 - Delivery and courier service drivers Demand Projection 5,900 6,100 6,200 6,400 6,500 6,700 6,900 7,100 7,200 7,400 7,500 Supply Projection 6,231 6,353 6,447 6,600 6,696 6,850 7,009 7,151 7,244 7,381 7,473 Cumulative Shortage* 69 147 152 200 204 249 290 349 356 419 427
Appendix D
* Supply Shortage if positive ** Historical data has a coefficient of variation >16.5% and <33.3% and should be used with caution Supply Surplus if negative

52
Results of Alberta’s Occupational Demand and Supply for 4-Digit NOC-S Occupations, 2011-2021
Occupational Projections 2011 2012 2013 2014 2015 2016 2017 2018 2019 2020 2021 H721 - Railway and yard locomotive engineers **
Demand Projection 401 401 401 401 401 401 401 401 401 501 501 Supply Projection 437 432 428 424 421 418 418 418 417 499 498 Cumulative Shortage* 8 13 16 21 24 27 27 27 27 46 47
H732 - Railway track maintenance workers ** Demand Projection 200 200 200 200 200 300 300 300 300 300 300 Supply Projection 205 203 203 195 195 296 296 296 296 296 287 Cumulative Shortage* -5 -3 -3 5 5 3 3 4 4 4 13
H737 - Air transport ramp attendants ** Demand Projection 1,999 2,099 2,099 2,199 2,199 2,299 2,299 2,399 2,399 2,399 2,499 Supply Projection 2,156 2,177 2,179 2,255 2,254 2,349 2,349 2,454 2,453 2,453 2,536 Cumulative Shortage* -57 22 20 44 45 49 50 45 45 45 63
H812 - Material handlers Demand Projection 22,998 23,598 24,198 24,698 25,398 26,098 26,798 27,397 27,897 28,497 29,197 Supply Projection 24,106 24,615 25,157 25,568 26,200 26,814 27,428 27,931 28,327 28,813 29,384 Cumulative Shortage* 192 283 341 430 498 583 669 766 870 984 1,113
H821 - Construction trades helpers and labourers Demand Projection 22,498 22,898 23,698 24,398 25,198 25,798 25,998 26,498 26,898 26,798 27,098 Supply Projection 24,955 25,137 25,766 26,316 26,911 27,369 27,393 27,756 28,014 27,769 27,904 Cumulative Shortage* 1,443 1,661 1,832 1,982 2,187 2,329 2,505 2,642 2,784 2,928 3,094
H822 - Other trades helpers and labourers ** Demand Projection 3,300 3,400 3,500 3,600 3,700 3,800 3,800 3,900 4,000 4,100 4,200 Supply Projection 3,481 3,529 3,625 3,724 3,819 3,907 3,901 3,976 4,039 4,080 4,125 Cumulative Shortage* 518 571 575 576 581 593 599 623 661 720 774
H831 - Public works and maintenance labourers ** Demand Projection 2,502 2,502 2,602 2,702 2,702 2,802 2,902 2,902 3,002 3,002 3,102 Supply Projection 2,655 2,637 2,726 2,814 2,794 2,869 2,953 2,931 3,011 2,987 3,063 Cumulative Shortage* 47 65 76 87 108 133 149 171 191 215 239
I011 - Farmers and farm managers Demand Projection 33,700 33,800 33,800 33,700 33,700 33,600 33,500 33,400 33,300 33,200 33,100 Supply Projection 33,708 33,785 33,762 33,631 33,631 33,507 33,369 33,225 33,056 32,882 32,670 Cumulative Shortage* -8 15 38 69 69 93 131 175 244 318 430
I015 - Landscaping and grounds maintenance contractors and managers ** Demand Projection 4,200 4,300 4,400 4,500 4,600 4,700 4,800 4,900 5,000 5,100 5,200 Supply Projection 4,516 4,618 4,723 4,829 4,937 5,041 5,147 5,249 5,354 5,449 5,552 Cumulative Shortage* -16 -18 -23 -29 -37 -41 -47 -49 -54 -49 -52
Appendix D
* Supply Shortage if positive ** Historical data has a coefficient of variation >16.5% and <33.3% and should be used with caution Supply Surplus if negative

53
Results of Alberta’s Occupational Demand and Supply for 4-Digit NOC-S Occupations, 2011-2021
Occupational Projections 2011 2012 2013 2014 2015 2016 2017 2018 2019 2020 2021 I016 - Supervisors, landscape and horticulture **
Demand Projection 1,900 1,900 2,000 2,000 2,000 2,100 2,100 2,200 2,200 2,300 2,300 Supply Projection 2,050 2,048 2,144 2,143 2,143 2,235 2,235 2,327 2,326 2,422 2,420 Cumulative Shortage* 150 152 156 157 157 165 165 173 174 178 180
I021 - General farm workers Demand Projection 6,898 6,898 6,898 6,898 6,898 6,898 6,898 6,798 6,798 6,798 6,798 Supply Projection 7,466 7,447 7,418 7,395 7,369 7,360 7,335 7,202 7,170 7,137 7,099 Cumulative Shortage* 33 52 80 103 129 139 164 197 228 261 299
I022 - Nursery and greenhouse workers ** Demand Projection 1,400 1,400 1,400 1,400 1,400 1,500 1,500 1,500 1,500 1,500 1,500 Supply Projection 1,398 1,387 1,387 1,386 1,385 1,475 1,474 1,473 1,472 1,471 1,469 Cumulative Shortage* 2 12 13 14 14 25 25 27 28 29 31
I111 - Supervisors, logging and forestry ** Demand Projection 402 402 402 402 402 402 402 402 402 402 402 Supply Projection 406 406 406 406 406 406 406 406 406 406 406 Cumulative Shortage* 51 51 51 51 51 51 51 51 51 51 51
I121 - Supervisors, mining and quarrying ** Demand Projection 300 400 400 400 400 400 400 400 400 400 400 Supply Projection 298 370 370 370 370 370 370 369 369 369 369 Cumulative Shortage* 2 30 30 30 30 30 30 30 30 31 31
I122 - Supervisors, oil and gas drilling and service Demand Projection 14,398 14,898 15,098 15,398 15,898 16,298 16,698 17,198 17,598 17,898 18,198 Supply Projection 14,467 14,963 15,127 15,388 15,843 16,196 16,545 16,989 17,330 17,566 17,797 Cumulative Shortage* 131 135 171 210 254 302 353 409 467 532 601
I131 - Underground production and development miners ** Demand Projection 300 300 300 300 300 300 300 400 400 400 400 Supply Projection 299 299 298 298 298 297 297 341 341 341 340 Cumulative Shortage* 1 1 2 2 2 3 3 59 59 59 60
I132 - Oil and gas well drillers, servicers, testers and related workers Demand Projection 18,500 19,100 19,400 19,800 20,300 20,900 21,500 22,100 22,600 23,000 23,300 Supply Projection 19,422 19,932 20,152 20,488 20,924 21,452 21,971 22,531 22,914 23,190 23,350 Cumulative Shortage* 78 168 248 312 376 448 529 569 686 810 950
I142 - Oil and gas well drilling workers and services operators Demand Projection 6,598 6,798 6,998 7,098 7,298 7,498 7,698 7,898 8,098 8,198 8,397 Supply Projection 7,223 7,377 7,528 7,571 7,721 7,864 8,009 8,149 8,284 8,313 8,438 Cumulative Shortage* 75 121 170 227 277 333 389 449 513 585 660
Appendix D
* Supply Shortage if positive ** Historical data has a coefficient of variation >16.5% and <33.3% and should be used with caution Supply Surplus if negative

54
Results of Alberta’s Occupational Demand and Supply for 4-Digit NOC-S Occupations, 2011-2021
Occupational Projections 2011 2012 2013 2014 2015 2016 2017 2018 2019 2020 2021 I212 - Landscaping and grounds maintenance labourers
Demand Projection 8,700 9,000 9,200 9,400 9,600 9,800 10,100 10,300 10,500 10,700 11,000 Supply Projection 9,944 10,099 10,158 10,279 10,451 10,564 10,805 10,974 11,070 11,164 11,380 Cumulative Shortage* 156 301 442 521 549 636 695 726 830 936 1,020
I215 - Oil and gas drilling, servicing and related labourers Demand Projection 5,500 5,700 5,800 5,900 6,100 6,200 6,400 6,600 6,700 6,800 7,000 Supply Projection 6,191 6,265 6,283 6,340 6,427 6,478 6,607 6,691 6,730 6,767 6,878 Cumulative Shortage* 9 135 217 260 373 422 493 609 670 733 822
J012 - Supervisors, petroleum, gas and chemical processing and utilities ** Demand Projection 3,501 3,601 3,701 3,801 3,901 4,001 4,001 4,101 4,201 4,301 4,401 Supply Projection 3,472 3,564 3,658 3,744 3,829 3,917 3,907 3,981 4,061 4,143 4,203 Cumulative Shortage* 29 37 43 57 72 84 94 120 140 158 198
J013 - Supervisors, food, beverage and tobacco processing ** Demand Projection 1,901 2,001 2,101 2,101 2,101 2,201 2,301 2,301 2,301 2,401 2,401 Supply Projection 2,073 2,178 2,275 2,275 2,275 2,365 2,451 2,450 2,445 2,530 2,529 Cumulative Shortage* 28 22 26 26 26 36 50 51 55 71 72
J015 - Supervisors, forest products processing ** Demand Projection 400 400 400 400 400 400 400 400 500 500 500 Supply Projection 397 397 396 396 396 395 394 394 489 488 488 Cumulative Shortage* 3 3 4 4 4 5 6 6 11 12 12
J026 - Supervisors, other mechanical and metal products manufacturing ** Demand Projection 3,101 3,201 3,201 3,301 3,401 3,501 3,601 3,601 3,701 3,802 3,802 Supply Projection 3,003 3,127 3,112 3,196 3,280 3,363 3,444 3,470 3,548 3,623 3,593 Cumulative Shortage* 98 74 89 105 121 139 157 132 154 178 208
J112 - Petroleum, gas and chemical process operators Demand Projection 7,704 7,904 8,104 8,204 8,404 8,705 8,905 9,105 9,305 9,505 9,605 Supply Projection 7,631 7,814 8,000 8,081 8,261 8,537 8,711 8,884 9,055 9,224 9,294 Cumulative Shortage* 73 90 104 123 144 167 193 220 250 281 311
J134 - Water and waste plant operators ** Demand Projection 800 900 900 900 900 900 1,000 1,000 1,000 1,000 1,000 Supply Projection 889 972 967 956 934 917 968 971 929 929 928 Cumulative Shortage* 44 61 66 77 99 116 165 162 204 204 205
J171 - Process control and machine operators, food and beverage processing ** Demand Projection 2,699 2,799 2,799 2,899 2,899 2,999 3,099 3,099 3,199 3,299 3,299 Supply Projection 2,794 2,884 2,868 2,957 2,942 3,028 3,115 3,091 3,173 3,253 3,223 Cumulative Shortage* 5 16 31 43 57 71 84 108 126 146 176
Appendix D
* Supply Shortage if positive ** Historical data has a coefficient of variation >16.5% and <33.3% and should be used with caution Supply Surplus if negative

55
Results of Alberta’s Occupational Demand and Supply for 4-Digit NOC-S Occupations, 2011-2021
Occupational Projections 2011 2012 2013 2014 2015 2016 2017 2018 2019 2020 2021 J172 - Industrial butchers and meat cutters, poultry preparers and related workers **
Demand Projection 4,099 4,199 4,299 4,399 4,499 4,599 4,699 4,799 4,899 4,999 5,099 Supply Projection 4,085 4,159 4,242 4,314 4,398 4,465 4,534 4,603 4,663 4,720 4,778 Cumulative Shortage* 14 40 57 85 101 133 165 196 236 279 320
J194 - Metalworking machine operators ** Demand Projection 1,500 1,600 1,600 1,700 1,700 1,700 1,800 1,800 1,900 1,900 1,900 Supply Projection 1,582 1,676 1,674 1,747 1,745 1,741 1,834 1,820 1,907 1,905 1,896 Cumulative Shortage* 18 24 26 53 55 59 66 80 93 95 104
J216 - Mechanical assemblers and inspectors ** Demand Projection 800 800 800 800 800 901 901 901 901 901 1,001 Supply Projection 1,323 1,332 1,321 1,319 1,309 1,431 1,426 1,418 1,421 1,407 1,515 Cumulative Shortage* 218 209 219 222 231 210 214 222 220 234 226
J222 - Furniture and fixture assemblers and inspectors ** Demand Projection 1,900 2,000 2,100 2,100 2,100 2,200 2,300 2,300 2,300 2,400 2,400 Supply Projection 1,878 1,969 2,059 2,039 2,032 2,121 2,191 2,175 2,163 2,231 2,209 Cumulative Shortage* 22 31 41 61 68 79 109 125 137 169 191
J223 - Other wood products assemblers and inspectors ** Demand Projection 2,400 2,400 2,500 2,500 2,600 2,700 2,700 2,800 2,800 2,900 2,900 Supply Projection 2,570 2,561 2,656 2,648 2,744 2,839 2,833 2,923 2,905 2,998 2,974 Cumulative Shortage* 30 39 44 52 56 61 67 77 95 102 126
J225 - Plastic products assemblers, finishers and inspectors ** Demand Projection 700 700 700 700 700 800 800 800 800 800 800 Supply Projection 803 803 800 798 795 899 897 897 892 889 886 Cumulative Shortage* 10 10 13 15 18 14 16 16 21 24 27
J228 - Other assemblers and inspectors ** Demand Projection 1,100 1,200 1,200 1,200 1,300 1,300 1,300 1,400 1,400 1,400 1,400 Supply Projection 1,260 1,352 1,349 1,345 1,440 1,436 1,434 1,526 1,518 1,512 1,507 Cumulative Shortage* 2 10 13 17 22 26 28 36 44 50 55
J312 - Labourers in metal fabrication ** Demand Projection 2,000 2,099 2,199 2,199 2,299 2,299 2,399 2,399 2,499 2,499 2,599 Supply Projection 2,312 2,376 2,468 2,450 2,561 2,518 2,609 2,581 2,689 2,644 2,743 Cumulative Shortage* -113 -76 -68 -50 -62 -19 -9 19 11 55 57
J317 - Labourers in food, beverage and tobacco processing ** Demand Projection 3,499 3,599 3,699 3,699 3,799 3,899 3,999 4,099 4,199 4,299 4,399 Supply Projection 3,889 3,958 4,020 3,988 4,016 4,075 4,135 4,233 4,254 4,322 4,369 Cumulative Shortage* -189 -159 -121 -89 -17 24 64 66 145 177 230
Appendix D
* Supply Shortage if positive ** Historical data has a coefficient of variation >16.5% and <33.3% and should be used with caution Supply Surplus if negative

56
Results of Alberta’s Occupational Demand and Supply for 4-Digit NOC-S Occupations, 2011-2021
Occupational Projections 2011 2012 2013 2014 2015 2016 2017 2018 2019 2020 2021 J319 - Other labourers in processing, manufacturing and utilities **
Demand Projection 1,800 1,800 1,900 1,900 1,900 2,000 2,099 2,099 2,099 2,199 2,199 Supply Projection 1,884 1,854 1,922 1,902 1,863 1,934 2,001 1,979 1,935 1,998 1,961 Cumulative Shortage* -84 -54 -22 -2 36 65 99 121 164 201 238
Appendix D
* Supply Shortage if positive ** Historical data has a coefficient of variation >16.5% and <33.3% and should be used with caution Supply Surplus if negative