alberto alemán zubieta administrator autoridad del canal de … · in the relevant routes...
TRANSCRIPT

Alberto Alemán Zubieta
Administrator
Autoridad del Canal de Panamá
February 1, 2011
The Panama Canal Expansion Program

1915 - 2010
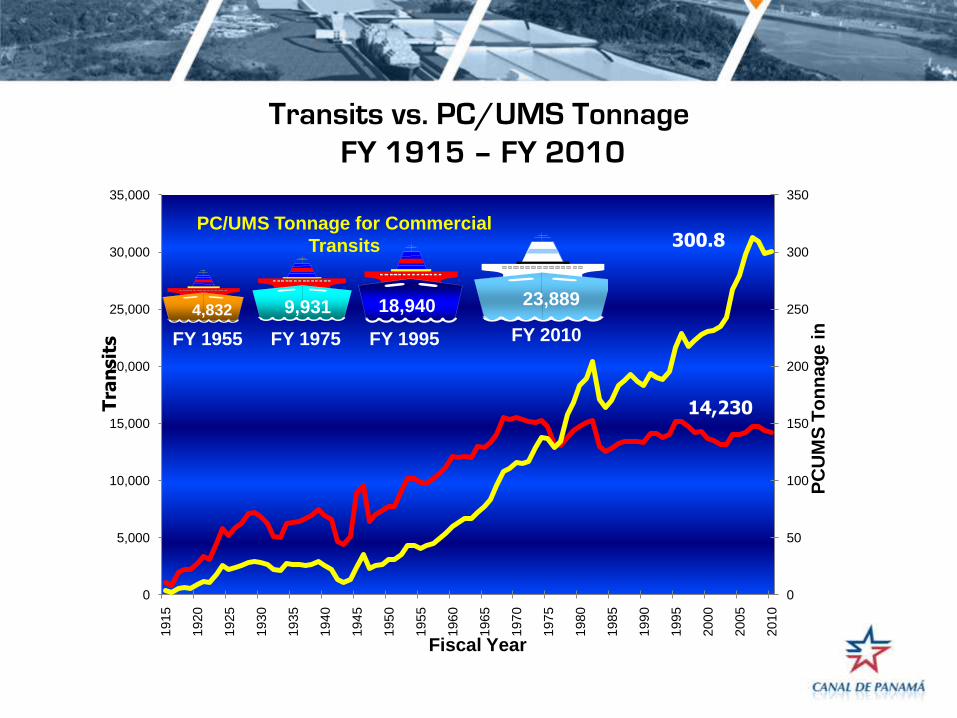
Transits: 1,000,972
Cargo: 8,587,711,605 LT
0
50
100
150
200
250
300
350
0
5,000
10,000
15,000
20,000
25,000
30,000
35,000
1915
1920
1925
1930
1935
1940
1945
1950
1955
1960
1965
1970
1975
1980
1985
1990
1995
2000
2005
2010
Fiscal Year
PC
UM
S T
on
nag
e in
4,832 9,931 18,940 23,889
FY 2010FY 1995FY 1975FY 1955
300.8
14,230
PC/UMS Tonnage for Commercial
Transits
Tra
nsit
sTransits vs. PC/UMS Tonnage
FY 1915 – FY 2010

Panamax Transits of 100’ (30.5m) + of Beam
FY 2001 – FY 2010
36.3%
38.5%
40.4%
42.6%
44.5%
47.6%47.10%
46.3%46.8%
49.5%
25%
30%
35%
40%
45%
50%2
00
1
20
02
20
03
20
04
20
05
20
06
20
07
20
08
20
09
20
10
Perc
en
tag
e P
an
am
ax t
ran
sit
s
Fiscal Year

Average Canal Waters TimeFY 2001 – FY 2010
23.9
27.4
22.7
26.7
24.6
30.1
27.8
31.6
23.1
21.1
0
5
10
15
20
25
30
35
2001 2002 2003 2004 2005 2006 2007 2008 2009 2010
Ho
ras
Fiscal Year
Average Canal Waters Time

East Coast US -- Asia 83.2M
West Coast South America -- Europe 13.3M
Total (long tons) 204.8 M
West Coast Central America – East Coast US 10.3M
West Coast South America – East Coast US 23.8M
West Coast US – Europe 7.7M
Main Routes - FY 2010
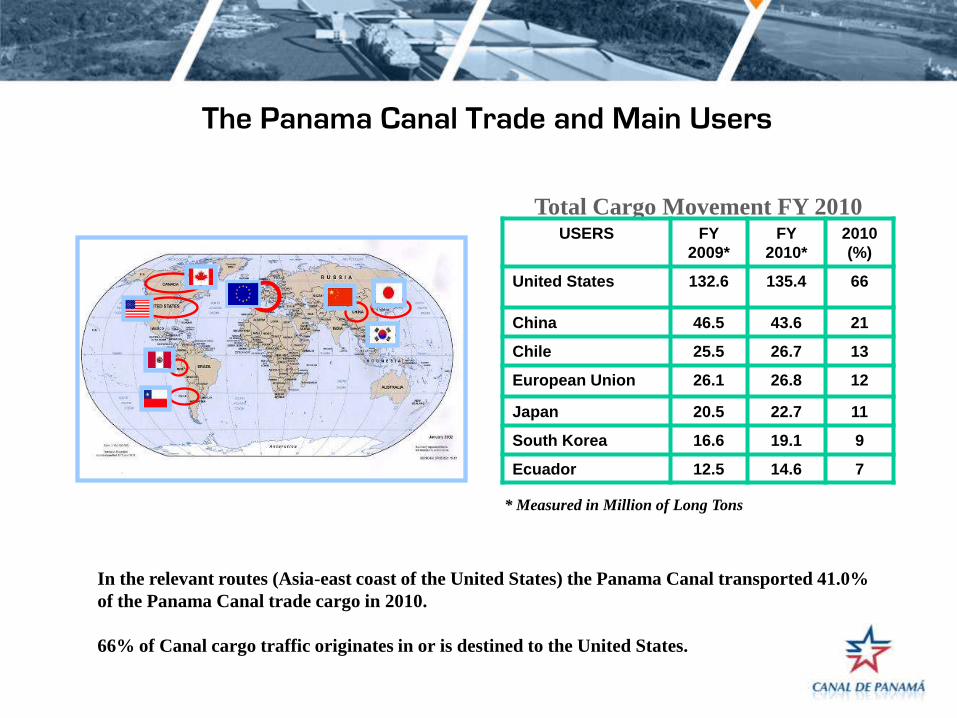
In the relevant routes (Asia-east coast of the United States) the Panama Canal transported 41.0%
of the Panama Canal trade cargo in 2010.
66% of Canal cargo traffic originates in or is destined to the United States.
The Panama Canal Trade and Main Users
* Measured in Million of Long Tons
Total Cargo Movement FY 2010USERS FY
2009*
FY
2010*
2010
(%)
United States 132.6 135.4 66
China 46.5 43.6 21
Chile 25.5 26.7 13
European Union 26.1 26.8 12
Japan 20.5 22.7 11
South Korea 16.6 19.1 9
Ecuador 12.5 14.6 7

These customers are accountable for 64% of tolls revenue in FY 2010
Panama Canal
Customer Ranking -
FY 2010(Weighted average: 40% Transits,
60% Tolls)
Rango Compañía
1 NIPPON YUSEN KAISHA (NYKLINE)
2 MAERSK LINE
3 EVERGREEN MARINE
4 MITSUI O.S.K.
5 CSAV-COMPAÑÍA SURAMERICANA DE VAPORES
6 HAPAG LLOYD
7 MEDITERRANEAN SHIPPING COMPANY
8 COSCO
9 HAMBURG-SUD
10 CMA CGM
11 HANJIN SHIPPING CO.
12
ZIM AMERICAN INTEGRATED SHIPPING SERVICES CO. INC.
13 SEATRADE REEFER CHRTERING NV
14 SONAP
15 WALLENIUS-WILHEMSEN
16 KAWASAKI KISEN (K LINE)
17 STX PAN OCEAN COMPANY LTD.
18 DAMPSKIBSSELSKABET NORDEN AS
19 YANGMING MAR. TRANS.
20 CARGILL INTERNATIONAL
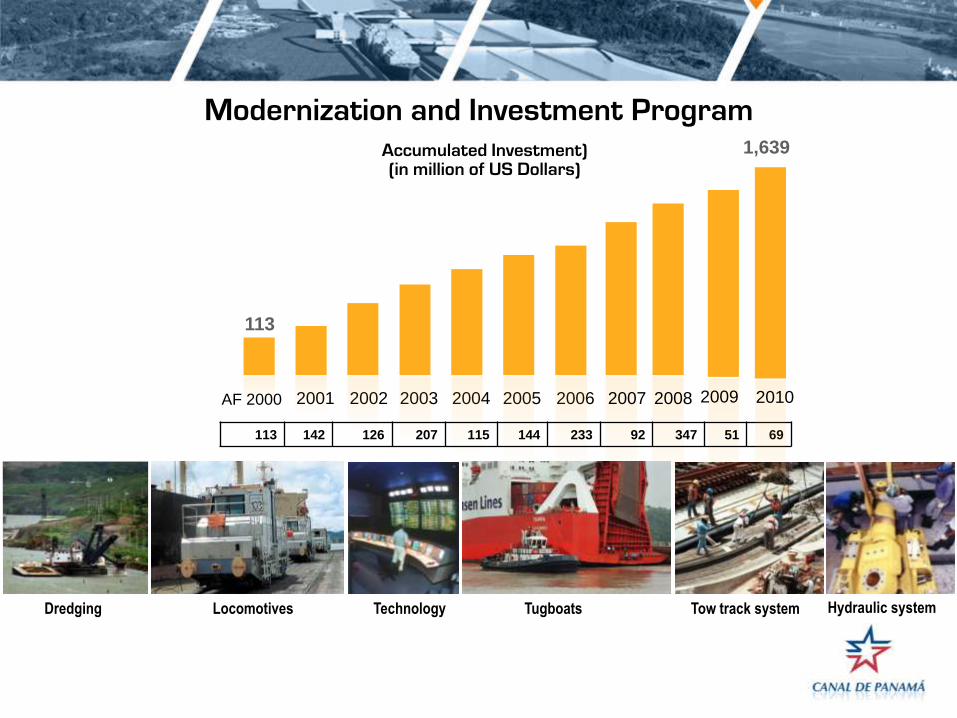
Accumulated Investment)(in million of US Dollars)
Modernization and Investment Program
2001 2002 2003 2004 2005 2006
113
2007AF 2000 2008
1,639
2009
113 142 126 207 115 144 233 92 347 51 69
TugboatsDredging Technology Tow track system Hydraulic systemLocomotives
2010
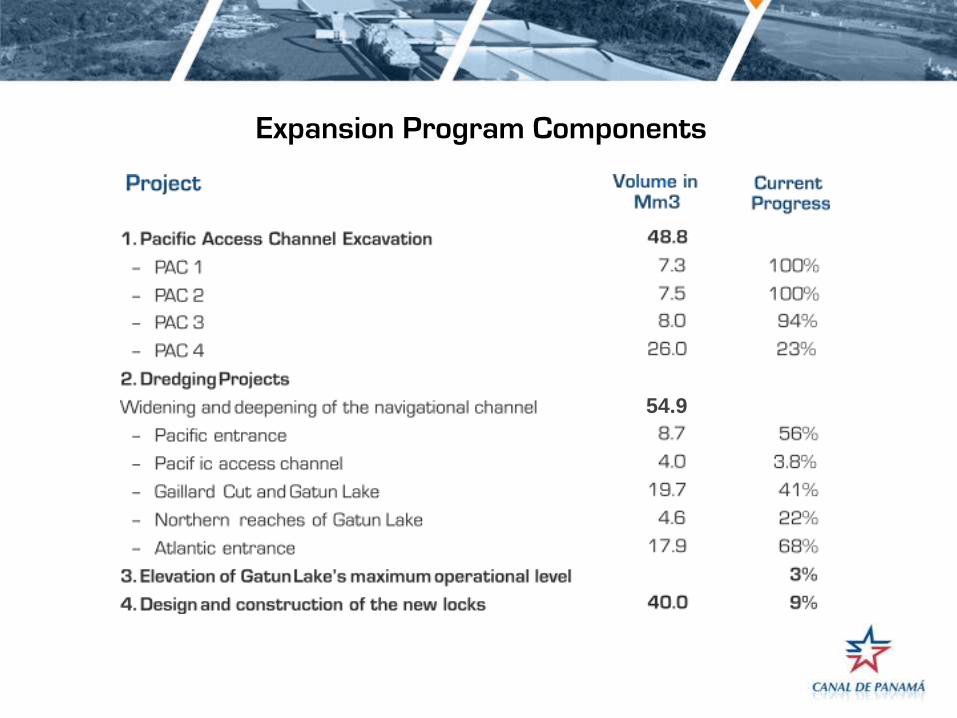
Expansion Program Components
54.9

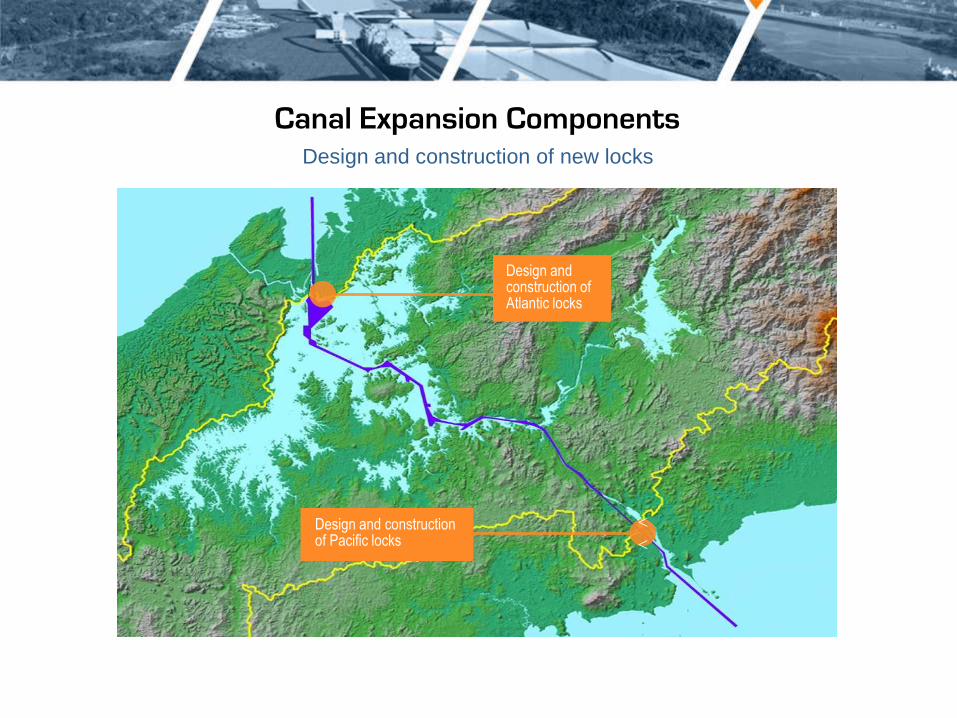
Canal Expansion Components
<<
Design and construction of Atlantic LocksWidening and deepeningof Atlantic entrance
Deepening of Gaillard Cutnavigational channels
Widening and deepeningof Pacific entrance
Deepening and widening of Gatun Lake navigationalchannel
26.7 m 27.1 m
Elevation of Gatun Lake’smaximum operationalchannel
Pacific accesschannel excavation Design and construction of
Pacific Locks
46 M m3
15.8 M m3

Canal Expansion Components
Pacific Access Channel Excavation
49 Mm3 dry excavation
<
<

2009 2010
Phase 1 - 7.3 Mm3 excavated
2009
Phase 2 - 7.5 Mm3 excavated
2010
Pacific Access Channel

Pacific Access Channel – Phase 3
Total volume: 8 Mm3, cleaning 190 hectares in T6 area
Current progress: 94%
8.09 Mm3 excavated
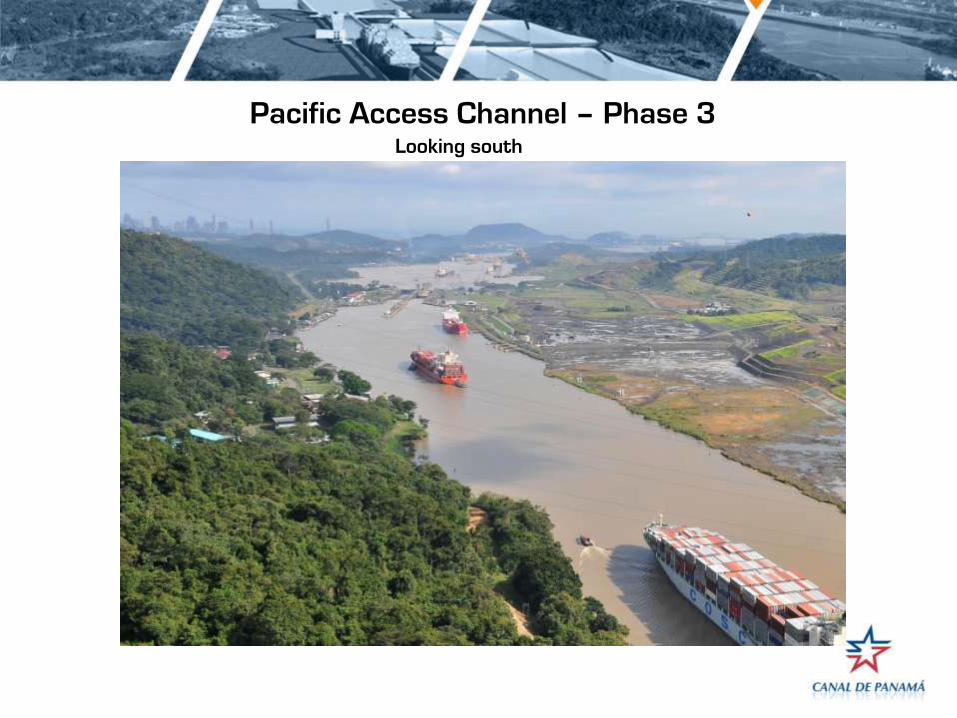
Pacific Access Channel – Phase 3Looking south

Pacific Access Channel Phase 4 – Dry
Excavation
Total volume: 26 M m3 dry excavation, construction
of Borinquen Dam, cleaning of 80 hectares of UXOs
Current progress: 23% 2.24 Mm3 excavated
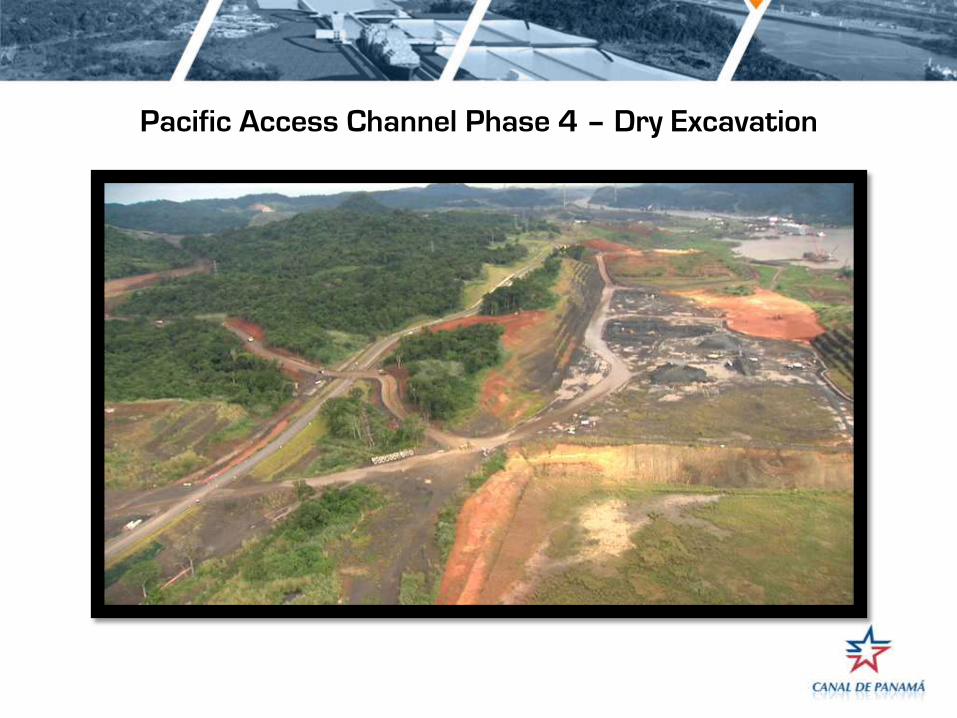
Pacific Access Channel Phase 4 – Dry Excavation

Cofferdam Construction

Borinquen Dam

Canal Expansion ComponentsDredging projects: 54.9 Mm3
<
<
Atlantic entrancedeepening and widening
Deepening andwidening of Gatun Lake
Deepening of Gaillard Cut
Pacific entrance deepening and widening

Pacific entrance deepening and widening
Total volume: 8.7 Mm3
Current progress: 64% 5.6 Mm3 dredged

Dredging at the North Entrance to the
Pacific Access Channel
Scope:• Dredging volume: 4 Mm3• Deepening from 27.5m to 9.14m PLD• Channel width: 218m• Length: 1.6km
Paraiso
CentennialBridge

Dredging areas in Gatun Lake and Gaillard CutExecuted by ACP
Total volume: 19.7 Mm3
Current progress: 41% 9.5 Mm3 dredged
De Lesseps Island
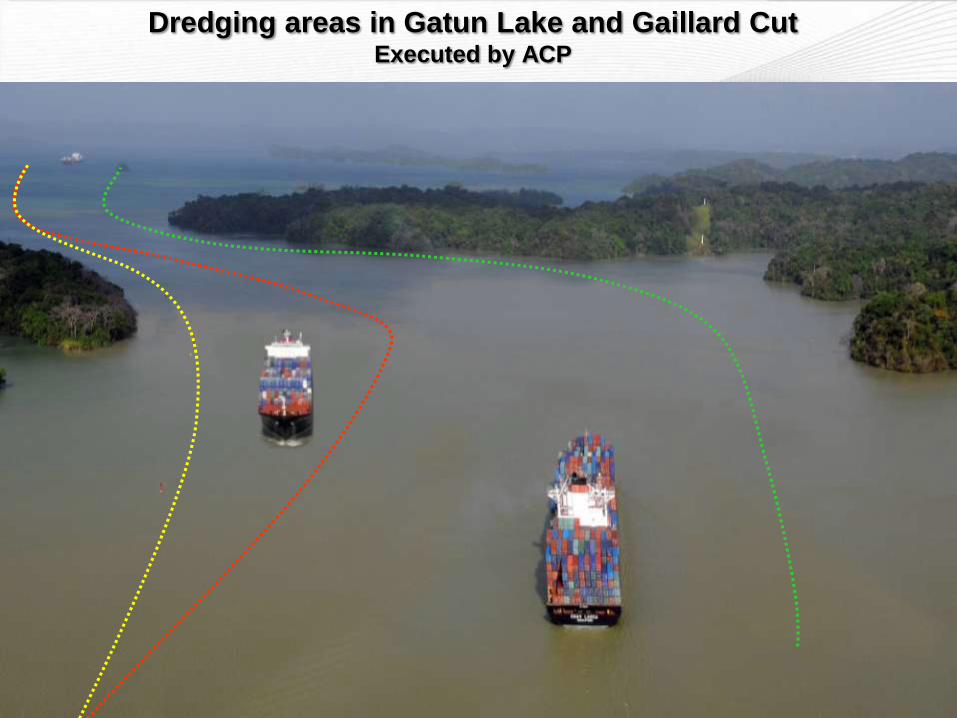
Dredging areas in Gatun Lake and Gaillard CutExecuted by ACP

Atlantic entrance deepening and widening
Width: 225m (740´)
Total volume: 17.9 M m3
Current progress: 68% 12.2 Mm3 dredged
Company: Jan de Nul NV

June 2010
Atlantic entrance deepening and widening
Canal Expansion Components
<
<
Design and construction of new locks
Design and construction of Atlantic locks
Design and construction of Pacific locks

Size of Locks and Vessels
Existing locks’ maximum vessel size: New locks’ maximum vessel size:
12,600 TEU4,400 TEU

PostPanamax Locks Operation
7% less water than
the existing locksExisting LocksNew Locks
Wa
ter
Uti
liza
tio
n
WSB 1WSB 2WSB 3

Design and Construction of Pacific Locks

Industrial Park – Pacific Side
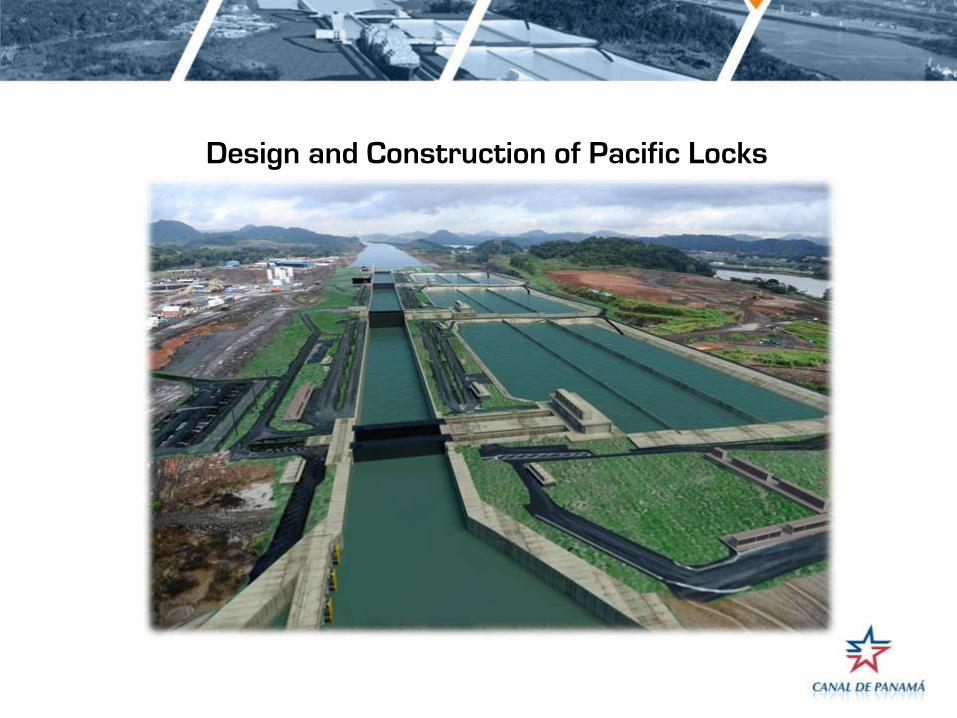
Design and Construction of Pacific Locks

Design and Construction of Pacific Locks

Design and Construction of Atlantic Locks

Industrial Park – Atlantic side
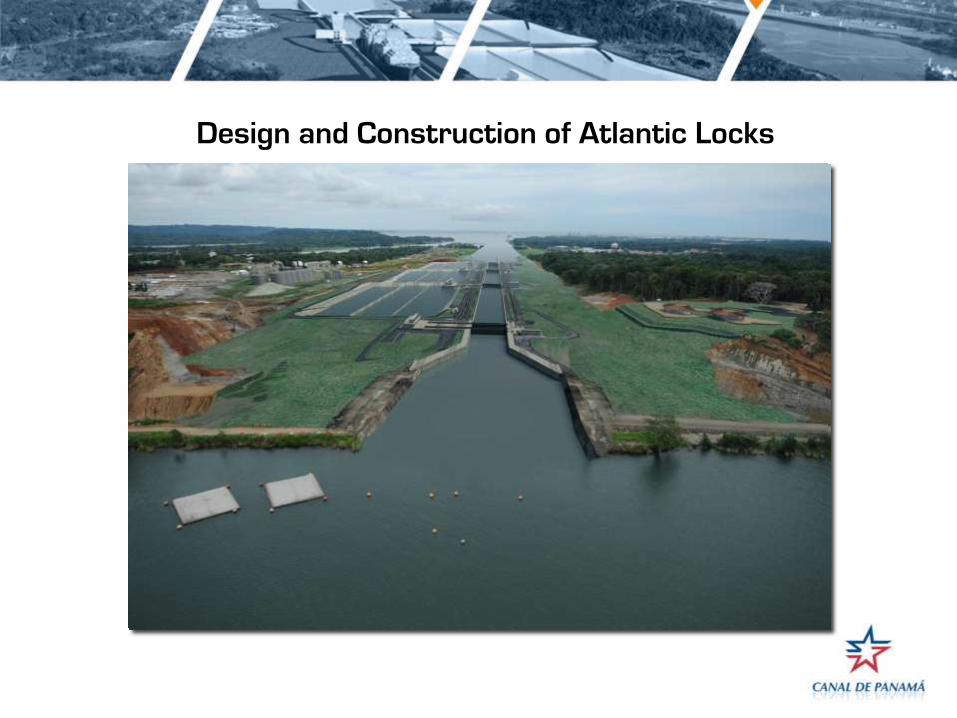
Design and Construction of Atlantic Locks
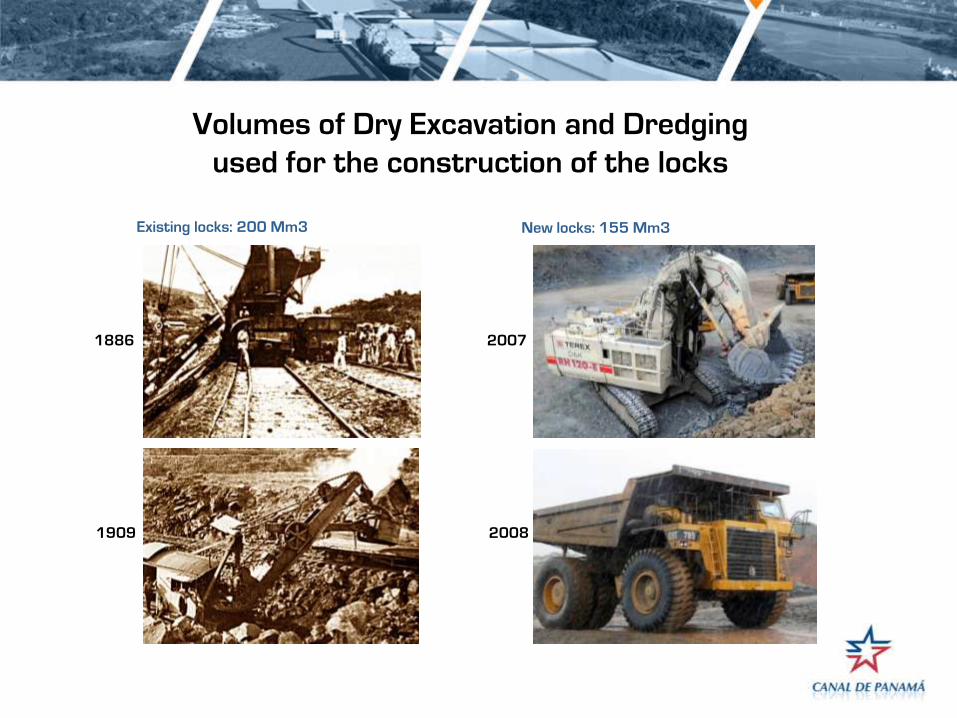
Volumes of Dry Excavation and Dredging
used for the construction of the locks
Existing locks: 200 Mm3 New locks: 155 Mm3
1886
1909
2007
2008
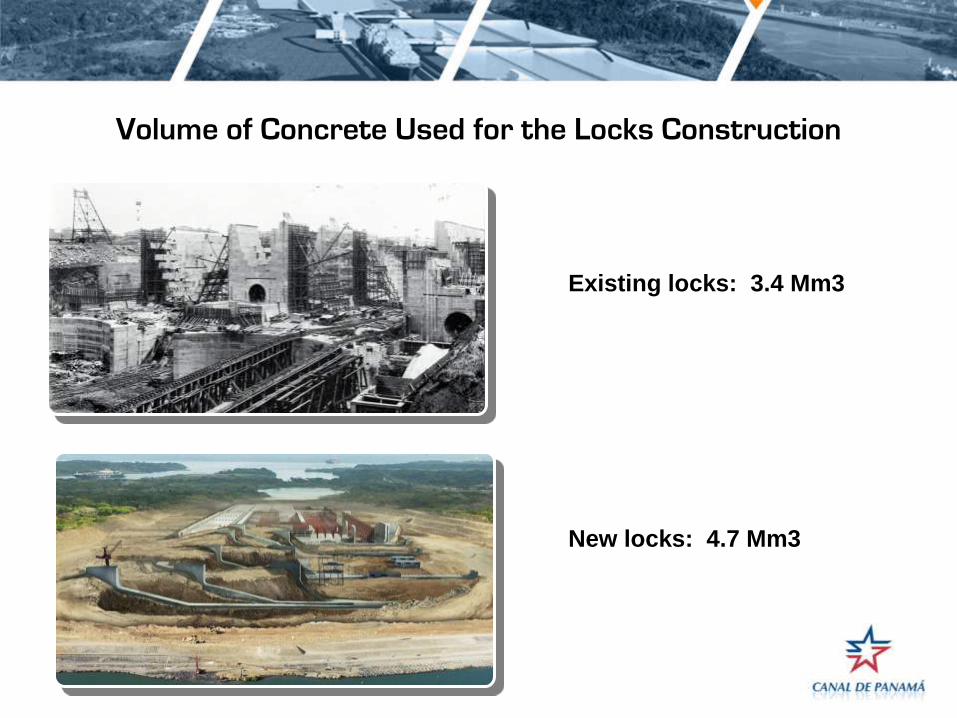
Volume of Concrete Used for the Locks Construction
Existing locks: 3.4 Mm3
New locks: 4.7 Mm3

Bid price behavior of principal Expansion
Program projects

Direct employment generated during Canal Expansion
Contract # Jobs
Completed contracts (December 2010) 1,801
Contracts under execution (December 2010) 10,688
ACP (December 2010) 889
Subtotal (December 2010) 13,378
Employment estimates:
Design and construction of locks 2,194
Employment estimates subtotal 2,194
Projected total cumulative direct employment 15,172

Panama Canal MOUs
UNITED STATES EAST COAST
• GEORGIA PORTS AUTHORITY
• PORT OF MIAMI
• THE PORT AUTHORITY OF NEW YORK AND
NEW JERSEY
• MASSACHUSETTS PORT AUTHORITY
• SOUTH CAROLINA STATE PORTS
AUTHORITY
• VIRGINIA PORT AUTHORITY
• MARYLAND PORT ADMINISTRATION
• PHILADELPHIA REGIONAL PORT AUTHORITY
• BROWARD COUNTY S PORT EVERGLADES
DEPARTMENT
• PORT OF PALM BEACH
• JACKSONVILLE PORT AUTHORITY
• PORT OF NORTH CAROLINA
UNITED STATES GULF COAST
• PORT OF HOUSTON AUTHORITY
• PORT OF NEW ORLEANS
• TAMPA PORT AUTHORITY
• MANATEE COUNTY PORT AUTHORITY
• ALABAMA STATE PORT AUTHORITY
• PORT OF GALVESTON
• TENNESSEE-TOMBIGBEE WATERWAY
DEVELOPMENT AUTHORITY
• MISSISSIPPI STATE PORT AUTHORITY AT
GULFPORT
UNITED STATES WEST COAST
• PORT OF LONG BEACH
CARIBBEAN PORTS
• CURACAO PORTS AUTHORITY
EUROPEAN PORTS
• AUTORIDAD PORTUARIA BAHIA DE
ALGECIRAS
• PORT OF ANTWERP

0-5,000 teu 5-10,000 teu 10,000+ teu
Fleet Capacity and Vessel Size Composition
0-4,000+ teu 4,000-6,000+ teu
85%
Pmax and Below
15% P.Pmax
Containership Fleet 2000
(4.79 Million TEU)
Containership Fleet 2014
(16.8 Million TEU)
371 Panamax vessels134 Post Panamax vessels
956 Panamax vessels804 Post Panamax vessels
0-5,000 teu 5-10,000 teu 10,000+ teu
12.5%
35.6%
51.9%
Pmax and Below
48.1% Total P.Pmax
Source: Clarkson’s Research Studies 2011
Containership Fleet 2010
(13.78 Million TEU)
949 Panamax vessels775 Post Panamax vessels
37.2%
3.2%
59.6%
Pmax and Below
40.4% Total P.Pmax

Impact of Expansion on Container Services (Lines Perspective)
For an expanded Canal, the costs per one way slot for a container service
would reduce by $26 for 8,000 TEU vessels, and by a further $48 for 10,000
TEU vessels.
Cost Based on:
• 4000 TEU Vessel
• Canal Tolls proposal January 2011
• $ 467/ MT Bunker (HFO)
• Actual Charter Rate
Cost Based on:
• 8000 TEU Vessel
• Canal Tolls proposal January 2011
• $ 467/ MT Bunker (HFO)
• Actual Charter Rate
The Impact of Canal Expansion on Dry Bulks
1. The USG-Asia grain trade will take advantage of
expansion, but probably only to vessels of under 100,000
dwt. Likely to benefit Canal routes to remain lower cost
than the WCUS gateway.
2. Potential for increased trade in coal and iron ore to China
from Colombia and Venezuela.

The Impact of Canal Expansion on Liquid Bulks
1. Canal expansion will make Ecuador – USG crude shipments
more competitive vs. alternative sources (e.g., ex Nigeria).
2. New trade between Venezuela – China could develop, and
trade flows between Asia and USG/ECSA should also
increase.
3. The expanded Canal will be the first route choice for LNG
trades between Trinidad-Chile and Peru-USG should these
develop. The ability of 200,000+ cbm LNG tankers to transit
will be crucial.

Port Development in Panama
1996: 235 Thousand TEUs
2010: 5.6 Million TEUs
2015: 7.4 Million TEUs
Panama Ports Company – Cristobal Colon Container Terminal Manzanillo International Terminal (MIT) Panama Ports Company - Balboa
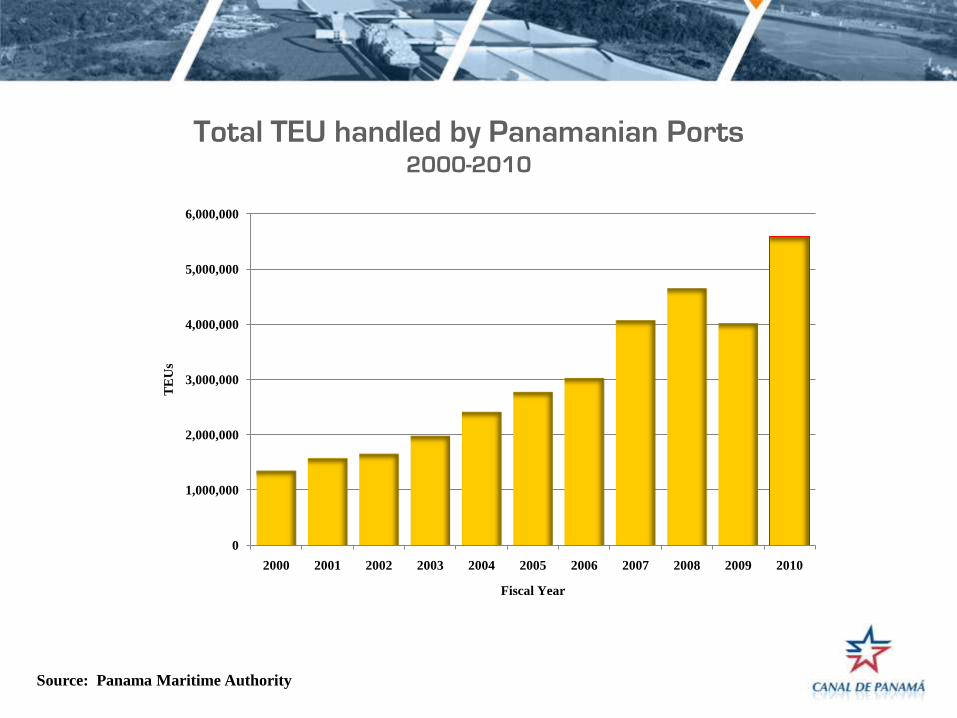
Total TEU handled by Panamanian Ports2000-2010
0
1,000,000
2,000,000
3,000,000
4,000,000
5,000,000
6,000,000
2000 2001 2002 2003 2004 2005 2006 2007 2008 2009 2010
TE
Us
Fiscal Year
Source: Panama Maritime Authority

Panama provides easy access to consumers located in Latin America,
the Caribbean, North America, Asian and European markets
After the expansion, the cost per TEU will be $123 lower than the current one-way cost
Main markets today comprise the east coast of the United
States, Latin America, the Caribbean and Asia

The expansion will provide for economies of scale that will make the route more competitive,
and will enhance the benefits of doing transshipment in the country
After the expansion, the cost per TEU will be $123 lower than the current one-way cost
The expansion will extend the Canal’s area of influence

Routes, ports and connectivities - GCSN
Kaluza P et al. J. R. Soc. Interface doi:10.1098/rsif.2009.0495
Global Cargo Ship Network
Routes, ports and betweenness centralities in the GCSN. (a) The trajectories of all cargo ships bigger than 10 000 GT during 2007. The colour scale indicates the number of journeys along each route. Ships are assumed to travel along the shortest (geodesic) paths on water. (b) A map of the 50 ports of highest betweenness centrality and a ranked list of the 20 most central ports.

SavannahYantian
Kwangyang
Hong Kong
Pusan
SavannahKeelung
WilmingtonPusan
NJ/NYLe Havre
Halifax
Felixstowe
Long BeachLos Angeles
Bremerhaven
Kaohsiung
Charleston
Nagoya Thamesport
Oakland
Seattle
Tokyo
Colombo
Shanghai
Yokohama
Newport News
Hakata Manzanillo (Mx)
Rotterdam
Kobe
Osaka Hamburg
Shimizu Port Said
Zeebrugge
Chabang
Tahiti
Auckland
Doniambo
Brisbane
Sydney
Melbourne
Tanjung Priok
Singapore
Marseilles
La Spezia
Tilbury
Dunkerque
Qingdao
Buenaventura
GuayaquilCallaoArica
Coquimbo
San AntonioSan Vicente
Puerto Limón
Iquique
Manta
AntofagastaValparaíso
.
Balboa
Antwerp
Itajai
SavannahBaltimore
New Orleans
ParanaguaSantos
Puerto Cabello
Veracruz ManzanilloColon
Cartagena
La GuairaGuanta
Maracaibo
Everglades
Kingston
Miami
Boston
Source: ACP and ComPairData
Transit the Canal
Feeder services
Panama: only port of the world with terminals in two oceans