albuquerque election financing: an analysis by … · 27 contests for city council were contested,...
TRANSCRIPT

Albuquerque Election Financing:An Analysis by Anthony Gierzynski, Ph.D.
professor of political science at The University of Vermont

2
Table of Contents
I. Personal Background
II. Introduction: Albuquerque’s Government and Campaign Finance Law
III. Methodology
IV. Electoral Competition
A. Incumbency Success Rates, Contested Races, and Competition
B. Voter Turnout
V. Spending
A. Spending as a percent of spending limits
B. Spending per voter comparison
C. Incumbent v. Challenger Spending
D. Spending on Voter Contact
VI. Conclusions

3
I. Personal Background
I am an associate professor of political science (with tenure) at the University of
Vermont. I have been a professor at the University of Vermont for over eight academic years.
Prior to that I held a research position at the Social Science Research Institute at Northern Illinois
University. I earned a doctorate in political science at the University of Kentucky in 1989. I am
a nationally recognized scholar on the financing of campaigns.
As indicated in my curriculum vitae, my areas of academic expertise are campaign
finance, elections, and political parties. Since 1989, I have authored two books and authored or
co-authored about a dozen academic articles and book chapters related to the subject of financing
elections. The second and most recent book, Money Rules: Financing Elections in America, was
published in January 2000. Additionally, I have been the co-principal investigator on grants
from the National Science Foundation and the Joyce Foundation for the purpose of studying
campaign finance at the state and local level. The project funded by the National Science
Foundation involved a group of scholars collecting campaign finance revenues from 18 states
over 4 election cycles. The Joyce Foundation funded project was a study of the financing of city
elections in Chicago, Illinois.

4
I. Introduction: Albuquerque’s Government and Campaign Finance Law
Albuquerque voters adopted campaign-spending limits in 1974 as part of a revision to the
city’s charter. Proposition 2—the ballot question that established the election code and the
limits—passed with over 90% of the vote.1 The fact that Albuquerque has had campaign
spending limits since the 1970s affords us a unique opportunity to test the claims of those who
oppose such limits. Opponents of campaign spending limits argue that spending limits protect
incumbents by reducing the amount challengers can spend in their attempts to unseat incumbents
and they argue that spending limits restrict candidates’ ability to communicate with voters and
that reduces interest and thus participation in elections. The analysis in this report will
demonstrate that the reality of Albuquerque elections contradicts the claims of opponents of
spending limits, and that democracy in Albuquerque is actually as healthy, if not healthier than in
other cities due in part to Albuquerque’s campaign finance regulations. Incumbents are more
vulnerable in Albuquerque than is typical for city elections, incumbents have less of a campaign
spending advantage, and voter turnout is as high or higher than in the typical city. At the same
time, this report will show that the limits set under the Albuquerque statute are not overly
stringent, that many candidates do not spend the maximum allowed and that, while spending may
be lower than in other local elections, a greater proportion of what is spent in Albuquerque
elections is spent on voter contact.
II. Methodology
The analysis in this report is based in part on campaign finance records filed with the Board
of Ethics & Campaign Practices and provided by the Legal Department of the City of
Albuquerque. The itemized spending, spending totals, revenue totals, and election information
1 Marc Bernabo, “Election Code, Code of Ethics Win Approval,” Albuquerque Journal, Wednesday, February 27,1974, p. A1.

5
were entered into a Microsoft Access file by my research assistant and checked over by me.
From the Access file I created additional files in Excel and SPSS for the purpose of the analysis.
Regarding voter contact spending: itemized spending was coded as being for the purpose of voter
contact if it was for the following purposes
• direct mail spending (postage/printing)• newspaper advertising• television and radio advertising• campaign signs• bumperstickers• voter lists• web site design/work• literature/pamphlets• materials for signs and design/layouts for ads• and, phone banks.2
In addition to data on Albuquerque, information about financing, voter turnout,
competitiveness and incumbency success rates in local elections elsewhere were culled from a
number of different sources—including major studies of the financing of California and New
Jersey local elections and of the City of Seattle, which were sponsored or produced by those
governments, as well as a study of Chicago elections conducted by this author. These studies
will be cited when presented in the report below. It is important to note that it is impossible to
use all of these elections in each comparison made because the information available from these
sources is limited.
IV. Electoral Competition
Incumbency Success Rates, Contested Races and Competition
Albuquerque’s spending limits do not seem to have harmed competition for city offices
nor have they made it more difficult to unseat an incumbent. In terms of incumbency,
Albuquerque’s spending limits have clearly not acted as incumbent protection. Since 1974 no
2 These categories of voter contact spending match the categories used by the studies of California and New Jerseylocal elections, which will be compared with Albuquerque spending later in this report.

6
incumbent has won reelection to the mayor’s office in Albuquerque (4 have tried). Compare that
0% incumbency success rate to the 1999 mayoral races in the US:
“Election returns tabulated by the Conference showed a remarkable rate ofincumbency—88 percent—for Mayors who sought reelection” (Iallonardo and Welfley1999).
And the 2000 mayoral races:
“The U. S. Conference of Mayors compiled election results from 180 cities around thecountry; of those, incumbents ran for re-election in 140 mayoral races. In the races wherethe incumbent mayor was up-for re-election, citizens re-elected the incumbent in 126races—more than 4 out of 5 times” (Headley and Welfley 2000).
Clearly the spending limits do not protect incumbent mayors from strong challenges in elections.
For city council races, between 1989 and 1999, 14 incumbents have sought reelection and
10, or 71%, have won. The average reelection rate for city council members between 1988 and
1996 nationwide was 86% (MacManus 1999). Here too it is very clear that Albuquerque’s
campaign spending limitations have not made it harder to unseat incumbents, indeed, it seems
that incumbents are actually more vulnerable in Albuquerque than are the typical incumbents in
mayoral or city council races.
Since 1974, no Albuquerque mayoral contest has gone without serious competition. The
average margin of victory was 5.4% in the first round and 7.4% in the second (median margin of
victory in first round was 4% and 4.3% in the second round). Between 1989 and 1999, 23 out of
27 contests for city council were contested, that is 85.2% of contests for the city council had at
least two serious competitors. Seventeen, or 63% of the contests would be considered
competitive (with margin of victory within 20 percentage points) and 11, or 56% considered
close (a margin of victory under 10 percent). While there is no comparable data on other city
elections an examination of New Mexico legislative races (which have no expenditure limits) is
instructive. Between 1968 and 1995 only 60% of state legislative races were contested and only

7
30 percent were considered competitive, that is, with a margin of victory of 20% or less (Hamm
and Moncrief 1999, p. 157).
Voter Turnout
Opponents of campaign expenditure limits often argue that the limits impede candidate
contact with voters and thus will limit the information voters have, voters’ interest and ultimately
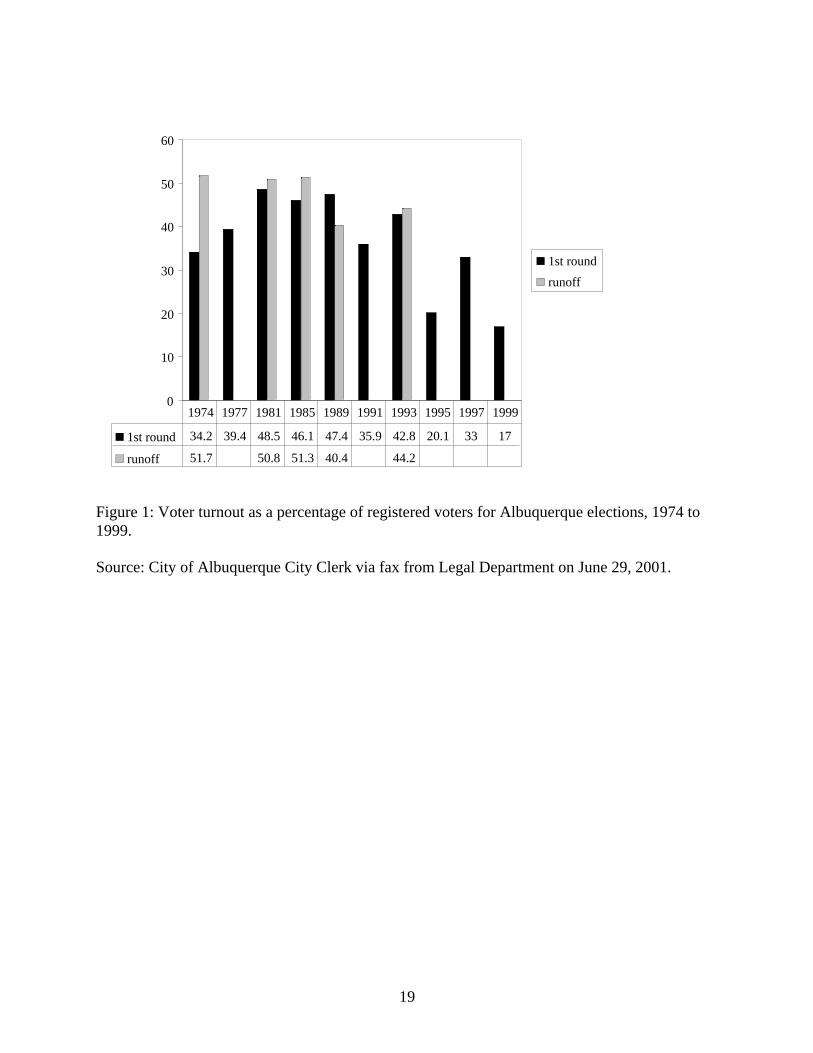
their participation in elections. Voter turnout statistics for Albuquerque elections clearly show
that the city’s voter participation has not been hurt, and indeed may have been improved, by the
spending limits. In Figure 1 you will find voter turnout as a percent of registered voters for the
1974 to 1999 elections. The average turnout for all city elections in this time frame was 40.2%.
Compare that to turnout rates for city elections across the country, which are “typically in the 25-
to 35-percent range” (MacManus 1999, p. 175). Localities that hold their elections separately
from presidential or congressional elections, as Albuquerque does, have even lower turnout.
Turnout in Pasadena in May of 1987 was 20% and in Sacramento in September of 1987 it was
33% (California Commission on Campaign Finance 1989).3
A comparison of voter turnout as a percent of registered voters for a number of cities for
which data are available can be found in Figure 2. Voter turnout in Albuquerque is much higher
than turnout in Austin, Texas and Pensacola, Florida for the 1988 to 1999 time period.
Albuquerque turnout compares favorably to larger cities as well: voter turnout for city elections
in Los Angeles between 1989 and 2001 averaged 23.9% of registered voters (City of Los
3 It should be noted that the downward trend apparent in Figure 1 reflects the downward trend invoter turnout in the US in general. Thus the most valid way to assess voter turnout inAlbuquerque is to make comparisons over similar time periods with other cities that hold theirelections in odd numbered years. For evidence and discussion of the downward trend in voterturnout in the US in general see almost any book on voter turnout in US elections includingWilliam H. Flannigan and Nancy H. Zingale, Political Behavior of the American Electorate,Ninth Edition (Washington, D.C.: Congressional Quarterly Press, 1998).

8
Angeles, Office of the City Clerk-Elections Division 2001); and, voter turnout in Boston for city
elections between 1991 and 1999 averaged 35% (Boston VOTES 2001). Turnout in
Albuquerque between 1989 and 1999 was 35.1%; it was 37.7% if the 1997 election (in which the
spending limits were enjoined) is excluded. My research failed to uncover any city holding
elections in odd numbered years that had higher turnout than Albuquerque.
A survey conducted by Lake Snell Perry & Associates, suggests that the relatively high
turnout in Albuquerque elections is due in part to the spending limits. Fifty-nine percent of the
random sample of city residents believe that the spending limits law has “made Albuquerque
elections more fair and honest” (a finding that crosses party lines among the electorate), and this
belief that spending limits improve the honesty and integrity of elections grew after respondents
heard arguments for and against spending limits (Lake Snell Perry & Associates 1998).
Additionally the survey found that voters don’t believe that “debate among candidates will be
more vigorous if spending limits were removed or that they will get more information on the
candidates if spending limits are removed” (Lake Snell Perry & Associates 1998). It is also
interesting to note that the lowest voter turnout for an election with a mayoral contest, 33%,
occurred the year that the spending limits were enjoined, 1997.
V. Spending
Spending as a percent of spending limits
If Albuquerque’s spending limits were overly restrictive, one would expect to find almost
all candidates spending the maximum allowable with no candidates winning contested races who
did not spend close to the maximum allowable. The history of spending by candidates in
Albuquerque from 1989 to 1999 shows that that is not the case. Figure 3 shows the total

9
spending (including in-kind contributions)4 of all city council candidates from 1989 to 1999.
Candidates are ordered by district and within district in descending order of the votes received;
the black shaded bars represent spending by winning candidates. The horizontal lines represent
the spending limit for that year (calculated as 10% of the mayor’s salary for that year). Figure 4
shows the council candidates’ spending relative to the spending limit (the spending limits minus
the total spent by the candidates). Bars below the $0 line show the amount candidates fell short
of the spending cap, bars above represent the amount exceeding the cap.
The first thing to note from both Figures 3 and 4 is that most city council candidates
spend well below the maximum allowed by Albuquerque’s law. When one looks just at the
competitive candidates, it is clear that many of them, including many of the victorious candidates
spent less than the spending limit (candidates are ordered from left to right within districts in
descending order of votes received). In 1999, for example, three of the four council contests
were won by candidates who spent substantially less than the spending limit (more than $2,500
below the spending cap). Additionally, the winning candidate was not the candidate who spent
the most in all cases; this was the case in 12 of the 25 contested races.
Figures 5 and 6 tell the story of spending in mayoral contests between 1989 and 1997
(formatted the same as Figures 3 and 4). A number of competitive candidates in 1989 and 1993
(the years when the limits were legally binding) did not spend the maximum allowed, and, the
winning candidate in all three years was not necessarily the candidate who spent the most money
(in 3 out of the 5 contests—1989 regular and runoff elections, and the 1997 election—the winner
was not the top spender).
4 Since in-kind contributions—that is donations of items of value to a campaign, such as computers—are items acandidate would have had to spend money on to utilize, these contributions are counted as expenditures.

10
Spending per voter comparison
In 1989, the California Commission on Campaign Financing found that
“[I]n most localities, large and small, a pattern of increasing expenditures may becomeself-perpetuating as communities become used to higher and higher local campaign costs.. . . In many cases, when candidates project costs for upcoming campaigns, they take thetop spending levels in the last election as the starting point for their new budgets”(California Commission on Campaign Financing 1989, p. 60).
When compared with California cities, it is clear that Albuquerque’s expenditure limits
have succeeded in preventing the development of this “arms race” mentality evident in the quote
above and have kept the costs of elections relatively low. For all Albuquerque contests in
regular elections between 1989 and 1999 the median spending per vote was $2.47 (it was $1.36
for runoff elections). The median spending per vote for council races was $2.12 per vote ($1.24
for runoffs) and for mayoral contests it was $4.72 ($1.54 for runoffs). Compared to median
spending per vote in mayoral and city council races for a sample of California medium sized
local governments (with populations between 150,000 and 1,000,000 in population) of $8.46 in
the previous decade5, it is clear that costs of running in Albuquerque elections is much lower
than typical. The median spending per voter in Albuquerque is even lower than the median of
$5.62 for a sample of small California local governments (population under 150,000).6
Keeping the costs of running for office down has a number of benefits. Studies have
found that the increasing costs of campaigns affects the type of candidate that is able to run in the
elections. One study found that the high costs of campaigns “tends to reduce the numbers of
lower-income and lower-middle-income citizens who can run with some expectations of
winning” (Welch and Bledsoe 1988, p. 113; also see California Commission on Campaign
Financing 1989). Evidence that high spending campaigns act as a deterrent to running is even
5 California figure from California Commission on Campaign Financing (1989). If adjusted for inflation alone, thefigures for California would be even higher in the 1990s.6 California Commission on Campaign Financing (1989).

11
evident among incumbents (candidates who traditionally have little problem raising money); a
sample of Florida city council members found 23.1% citing fund raising and 21.5% citing
campaign costs as deterrents to running for the city council (MacManus 1999, p. 190). And,
finally, another survey of city council members in the US found that “rising campaign costs” was
cited as a source of frustration by 49% of respondents (Svara 1991).
Incumbent v. Challenger Spending
One of the greatest barriers to competitive elections is the often times enormous gap in
financial resources between incumbent candidates and those who challenge them (this is a well-
documented fact in the extant literature on campaign finance). Some examples: in each election
since 1984, challengers running for the US house have been unable to spend even 50% of the
amounts incumbents spent and in 1998 the median spending for challengers was 25% of that of
incumbents; a study of state legislative contests in 18 states found the median spending of
challengers well below that of incumbents and in 12 of the states amounted to less than 50% of
incumbent spending; in New Mexico legislative races in 1996, the average house challenger
spent 47.1% of the average amount spent by house incumbents while senate challengers
averaged 69.7% of incumbent spending7; and, in Chicago aldermanic races incumbents outspend
challengers 4 to 1 (see Gierzynski 2000 for evidence from national, state and local elections as
well as references to additional literature supporting this point).
Since the connection between spending and votes is well documented in the literature,
this spending gap between incumbents and challengers is very important because it diminishes
competitiveness in elections. And, to quote one of the most respected political scientists in the
history of the discipline,
7 Calculated by author from data published by Re-Visioning New Mexico, “Money in New Mexico Politics:Escalating Costs, 1988-1996,” February 1998.
12
[a]bove everything, the people are powerless if the political enterprise is not competitive.It is the competition of political organizations that provides the people with theopportunity to make a choice. Without this opportunity popular sovereignty amounts tonothing.8
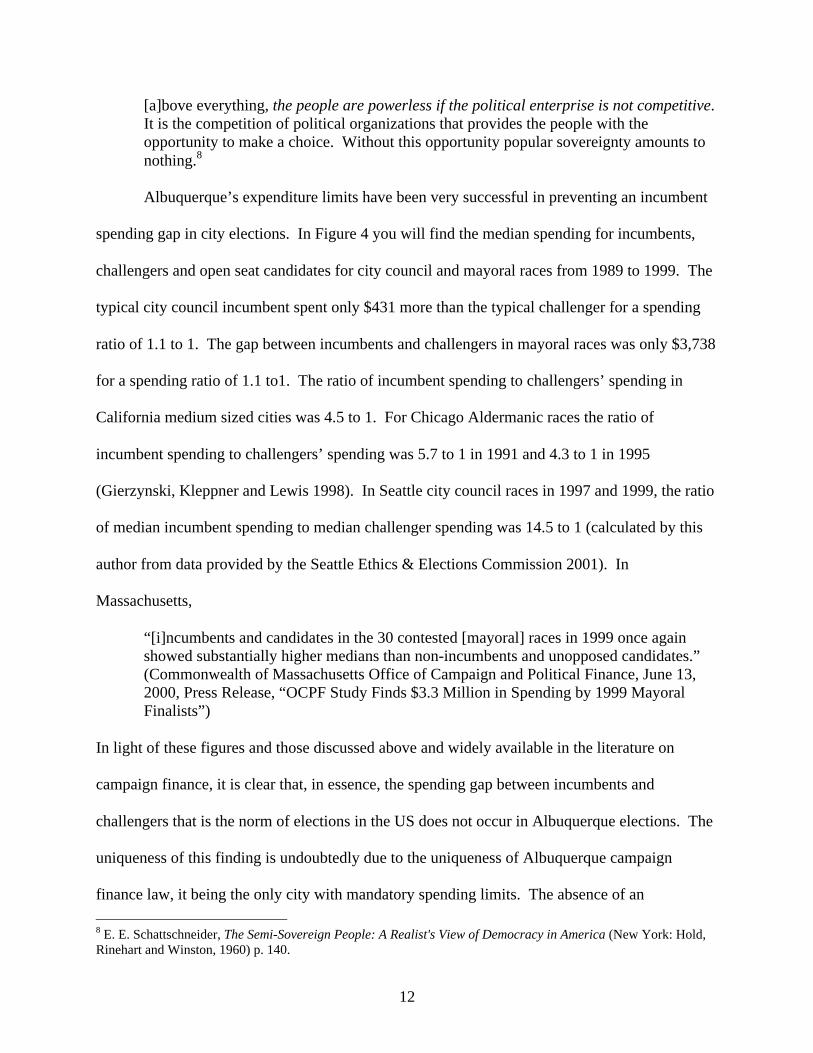
Albuquerque’s expenditure limits have been very successful in preventing an incumbent
spending gap in city elections. In Figure 4 you will find the median spending for incumbents,
challengers and open seat candidates for city council and mayoral races from 1989 to 1999. The
typical city council incumbent spent only $431 more than the typical challenger for a spending
ratio of 1.1 to 1. The gap between incumbents and challengers in mayoral races was only $3,738
for a spending ratio of 1.1 to1. The ratio of incumbent spending to challengers’ spending in
California medium sized cities was 4.5 to 1. For Chicago Aldermanic races the ratio of
incumbent spending to challengers’ spending was 5.7 to 1 in 1991 and 4.3 to 1 in 1995
(Gierzynski, Kleppner and Lewis 1998). In Seattle city council races in 1997 and 1999, the ratio
of median incumbent spending to median challenger spending was 14.5 to 1 (calculated by this
author from data provided by the Seattle Ethics & Elections Commission 2001). In
Massachusetts,
“[i]ncumbents and candidates in the 30 contested [mayoral] races in 1999 once againshowed substantially higher medians than non-incumbents and unopposed candidates.”(Commonwealth of Massachusetts Office of Campaign and Political Finance, June 13,2000, Press Release, “OCPF Study Finds $3.3 Million in Spending by 1999 MayoralFinalists”)
In light of these figures and those discussed above and widely available in the literature on
campaign finance, it is clear that, in essence, the spending gap between incumbents and
challengers that is the norm of elections in the US does not occur in Albuquerque elections. The
uniqueness of this finding is undoubtedly due to the uniqueness of Albuquerque campaign
finance law, it being the only city with mandatory spending limits. The absence of an
8 E. E. Schattschneider, The Semi-Sovereign People: A Realist's View of Democracy in America (New York: Hold,Rinehart and Winston, 1960) p. 140.

13
incumbent-challenger spending gap is also undoubtedly largely responsible for the fact
(discussed above) that Albuquerque incumbents are much more vulnerable to electoral defeat
than incumbents of other offices.
Spending on Voter Contact
The most important purpose of spending in elections is to purchase contact with voters
and through that contact persuade enough of eligible voters to vote for you (or against your
opponent, or, sometimes, not to vote at all). Not all spending in elections, however, is spent on
voter contact. Candidates spend money on overhead (office space, equipment, staff), contribute
money to other candidates or organizations, and spend money trying to raise more money (see
California Commission on Campaign Financing 1989, Hogan 1997, and Hernson 1998). In
many cases, “candidates spend surprisingly little money actually communicating with the voters”
(California Commission on Campaign Financing 1989, p. 2). Additionally, a lot of money that
is raised is not actually spent. “Much of what candidates now collect in campaign contributions
is used to build war chests and deter serious challengers” (California Commission on Campaign
Financing 1989, p. 7).
Given what is known about candidate spending, it is possible that the effect of spending
limits would not be to reduce the amount spent on voter contact (it being unquestionably the
most important thing to spend money on), but instead to reduce the amounts spent for overhead,
contributions to other candidates or organizations, and what is spent to raise more money. In
effect, spending limits may provide an incentive for more efficient spending, i.e., spending a
greater proportion of one’s money on voter contact.
14
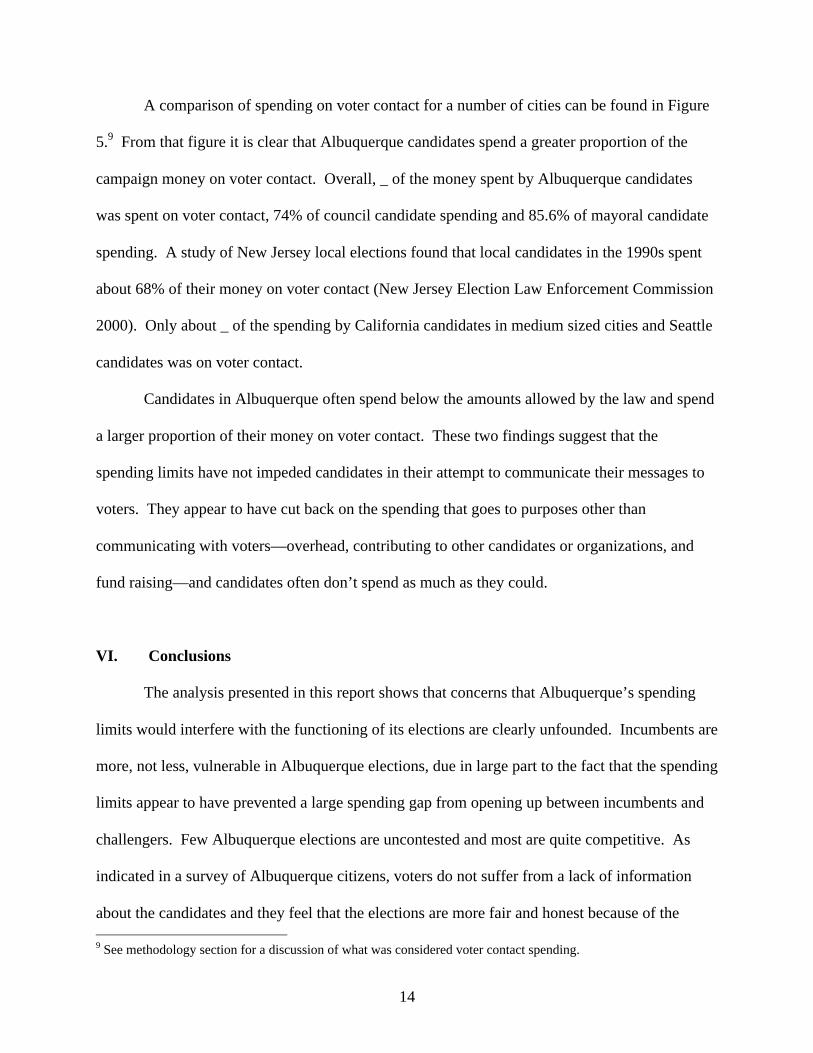
A comparison of spending on voter contact for a number of cities can be found in Figure
5.9 From that figure it is clear that Albuquerque candidates spend a greater proportion of the
campaign money on voter contact. Overall, _ of the money spent by Albuquerque candidates
was spent on voter contact, 74% of council candidate spending and 85.6% of mayoral candidate
spending. A study of New Jersey local elections found that local candidates in the 1990s spent
about 68% of their money on voter contact (New Jersey Election Law Enforcement Commission
2000). Only about _ of the spending by California candidates in medium sized cities and Seattle
candidates was on voter contact.
Candidates in Albuquerque often spend below the amounts allowed by the law and spend
a larger proportion of their money on voter contact. These two findings suggest that the
spending limits have not impeded candidates in their attempt to communicate their messages to
voters. They appear to have cut back on the spending that goes to purposes other than
communicating with voters—overhead, contributing to other candidates or organizations, and
fund raising—and candidates often don’t spend as much as they could.
VI. Conclusions
The analysis presented in this report shows that concerns that Albuquerque’s spending
limits would interfere with the functioning of its elections are clearly unfounded. Incumbents are
more, not less, vulnerable in Albuquerque elections, due in large part to the fact that the spending
limits appear to have prevented a large spending gap from opening up between incumbents and
challengers. Few Albuquerque elections are uncontested and most are quite competitive. As
indicated in a survey of Albuquerque citizens, voters do not suffer from a lack of information
about the candidates and they feel that the elections are more fair and honest because of the 9 See methodology section for a discussion of what was considered voter contact spending.

15
limits. All of this is reflected in the fact that turnout in Albuquerque is relatively high for local
elections held at times with no national or state campaigns. Candidates often spend less than
what the spending limits allow and are more efficient in their spending, spending a greater
proportion of their money on voter contact than candidates in any other comparable elections for
which data is available.
While Albuquerque has kept spending down and maintained competitive elections with
its spending limits in place, campaigns in the rest of the US has struggled with the problems that
accompany lightly regulated privately funded campaigns.
“The heavy campaign costs once associated only with state and federal elections are nowapparent in many California cities and counties. As a direct result, local jurisdictionshave witnessed diminished competition, increased incumbent dominance and anaccompanying decline in campaign expenditures applied to voter communicationmethods” (California Commission on Campaign Financing 1989, p. 69).
The great gaps in spending that appear in other races, from Congressional to state legislative, to
city councils, reduces the competitiveness of elections, engenders cynicism among the public,
and ultimately weakens the institutions of elections as a mechanism for representation
(Gierzynski 2000).
“The flood of money from business interests to incumbent mayors, city council membersand county supervisors has given many members of the public the impression thatcampaign contributions improperly influence votes. This is particularly prevalentconcerning developer contributions and local land use decisions” (California Commissionon Campaign Financing 1989, p. 15).
The lessons afforded by campaign finance practices over the past several decades are clear and
leave large majorities of the public wishing to see some campaign finance reform and the lessons
from Albuquerque show that spending limits are an important component of that reform. The
Commission that studied California elections acknowledged the importance of spending limits.
“The Commission believes that expenditure ceilings must be the cornerstone of effectivecampaign finance reforms. Spending caps free candidates from the constant necessities
16
of fundraising, the fear of last-minute spending blitzes and the temptation to exchangevotes for contributions. At the same time, expenditure ceilings encourage newcomers toenter political contests, increase the time candidates have to address relevant issues andabate the fundraising wars” (California Commission on Campaign Financing 1989, p.24).
Given the analysis presented in this report and the knowledge that comes from
researching campaign finance over the past 12 years, it is clear to me that the minimal costs of
Albuquerque’s restrictions on campaign spending are far outweighed by the benefits those limits
provide in terms of healthy functioning elections. The citizens stand to lose much more of their
voice in government from the removal of the limits than they would gain, and the survey results
show that they know this.

17
References
Arrington, Theodore, and Gerald Ingalls. 1984. “The Effects of Campaign Spending on LocalElections.” American Politics Quarterly 12 (January): 117-127.
Boston VOTES. 2001. “Voter Turnout History 1990 - 2000 City of Boston by Wards andPrecincts,” http://www.bostonvote.org/voterinfo/voter_turnout.html, July 4, 2001.
California Commission on Campaign Financing. 1989. Money and Politics in the Golden State:Financing California’s Local Elections (Los Angeles: Center for ResponsiveGovernment).
DeSantis, Victor S and Tari Renner. 1999. “Term Limits and Turnover Among ElectedOfficials.” In Roger L. Kemp (editor) Local Government Election Practices: AHandbook for Public Officials and Citizens (Jefferson, NC: McFarland & Company).
Gierzynski, Anthony. 2000. Money Rules: Financing Elections in America. (Boulder, CO:Westview Press).
Gierzynski, Anthony, Paul Kleppner, and James Lewis, "Money or the Machine: Money andVotes in Chicago Aldermanic Elections." American Politics Quarterly 26 (1998) 160-173.
Hamm, Keith E. and Gary F. Moncrief. 1999. “Legislative Politics in the States.” In VirginiaGray, Russell L. Hanson, and Herbert Jacob (editors) Politics in the American States: AComparative Analysis (Washington, D.C.: Congressional Quarterly Press) pp. 144-190.
Headley, Jubi and Jim Welfley. 2000. “Election Results Indicate Voter Satisfaction with LocalPublic Servants: Incumbents Win 80 Percent of Their Elections.” US Conference ofMayors, November 20, 2000.
Herrnson, Paul. 1998. Campaigning at Home and in Washington (second edition).(Washington, D.C.: Congressional Quarterly Press).
Hogan, Robert E. “Voter Contact Techniques in State Legislative Campaigns: The Prevalence ofMass Media Advertising.” Legislative Studies Quarterly 22 (1997): 551-571.
Iallonardo, Tony with Jim Welfley. 1999. “While Incumbency Reigns, City Elections BringSeveral New Leaders.” US Conference of Mayors, November 15, 1999.
Lake Snell Perry & Associates and John Deardourff/The Media Company. 1998. “PublicPerceptions of Campaign Spending Limits: Findings from a Survey of 400 RegisteredVoters in the City of Albuquerque, New Mexico.”

18
Los Angeles, City of, Office of the City Clerk-Election Division. 2001. “City of Los AngelesVoter Registration and Turnout, All Regularly Scheduled Elections, 1978-2001.”http://www.lacity.org/CLK/election/voterreg.pdf, July 4, 2001.
MacManus, Susan. 1999. “The Resurgent City Councils.” In Ronald E. Weber and Paul Brace(editors) American State and Local Politics: Directions for the 21st Century (New York:Chatham House Publishers).
New Jersey Election Law Enforcement Commission. 2000. “Local Campaign Financing.”White Paper 14.
Seattle Ethics & Elections Commission. 2001. “1999 Seattle Election Information.”http://www.ci.seattle.wa.us/ethics/el99a/report/expsumm/etcam_l.htm, July 6, 2001.
Seattle Ethics & Elections Commission. 2001. “SEEC 1997 Election Report.”http://www.ci.seattle.wa.us/ethics/el97a/report/expsumm/etcam_l.htm, July 6, 2001.
Svara, James. 1991. A Survey of American City Councils (Washington, D.C.: National Leagueof Cities).
Van Noy, Carolyn M. 2000. “The City of Seattle and Campaign Finance Reform: A CaseStudy.” Public Integrity 2 (Fall): 303-316.
Welch, Susan and Timothy Bledsoe. 1988. Urban Reform and its Consequences: A Study inRepresentation (Chicago: University of Chicago Press).
19
0
10
20
30
40
50
60
1st round
runoff
1st round 34.2 39.4 48.5 46.1 47.4 35.9 42.8 20.1 33 17
runoff 51.7 50.8 51.3 40.4 44.2
1974 1977 1981 1985 1989 1991 1993 1995 1997 1999
Figure 1: Voter turnout as a percentage of registered voters for Albuquerque elections, 1974 to1999.
Source: City of Albuquerque City Clerk via fax from Legal Department on June 29, 2001.

20
0.0%
5.0%
10.0%
15.0%
20.0%
25.0%
30.0%
35.0%
40.0%
turnout 35.1% 18.1% 35.0% 23.9% 22.0%
Albuquerque
Austin, TX
BostonLos
AngelesPensacola,
FL
Figure 2: Voter turnout for selected cities, 1988-1999.
Sources: Albuquerque data from the same source as in Figure 1; City of Los Angeles, Office ofthe City Clerk-Elections Division 2001; Boston VOTES 2001; Austin City Clerk’s office; andJames A. Robinson, Clarence C. Elebash, and Andrea C. Hatcher, “Pensacola Votes by Mail: AReport on Pensacola’s January 2001 Referendum,” The University of West Florida.
Note: All of these cities, but Austin, hold their elections during odd number years. Austin holdsits municipal elections in both odd and even-numbered years.

21
-$5,000
$5,000
$15,000
$25,000
$35,000
$45,000
$55,000
$65,000
$75,000
incumbents
challengers
open
incumbents $6,897 $56,607
challengers $6,466 $52,869
open $4,784 $67,439
council mayor
Figure 7: Median spending by council and mayoral candidates by incumbency status, 1989-1999.
Source: Calculated by the author from records filed with the Albuquerque Board of Ethics &Campaign Practices.

22
76.5%
49.0%
68.0%
56.0%
46.0%
58.0%
74.0%
55.8%
85.6%
55.0%
0.0% 20.0% 40.0% 60.0% 80.0% 100.0%
Albuquerque
California medium cities
New Jersey
Pasadena, CA
SanFrancisco, CA
Sacramento, CA
Albuquerque council
Seattle council
Albuquerque mayor
Seattle mayor
Figure 8: Percent of candidate spending spent on voter contact for Albuquerque, Seattle,California and New Jersey cities.
Sources: New Jersey Election Law Enforcement Commission, Seattle Ethics & ElectionsCommission, California Commission on Campaign Financing, and Albuquerque Board of Ethics& Campaign Practices.
Note: Bottom set of bars include executive plus council contests.

$0
$20,000
$40,000
$60,000
$80,000
$100,000
$120,000
$140,000
$160,000
$180,000
$200,000
C C C I C C C C C O O O O O O O O O O O O O O O O O O O O O O O
1989 1989R
1993 1993R
1997
Figure 5: Total spending (including in-kind contributions) by Mayoral candidates 1989 to 1997.
Note: Winning candidates’ spending is shaded black, all others gray. Candidates are ordered from left to right within districts indescending order of votes received.
Spending limits: 1989: $59,5091993: $67,5791997 (enjoined): 79,4772001: $174,720

24
$0
$2,000
$4,000
$6,000
$8,000
$10,000
$12,000
$14,000
$16,000
$18,000
O O O O O I O O O O O O O O O O O O I C I O O O O O I C C I C C O O O O O O O O O O I C C O O O I C I I C O O C I C O O O I C I C C C C C I C O O C I C
1 3 5 7 9 1 2 4 6 8 1 3 5 7 9 5 5 2 4 6 8 1 3 5 7 9 2 4 6 8
1989 1989R
1991 1993 1993R
1995 1997 1999
Figure 3: Total spending (including in-kind contributions) by city council candidates 1989 to 1999.
Note: Winning candidates’ spending is shaded black, all others gray. Candidates are ordered from left to right within districts indescending order of votes received. The O, I and C underneath the bars indicate whether the candidate was an open-seat candidate(O), that is, no incumbent in the race, an incumbent (I), or a challenger C). The Numbers below O, I, and C are the council districtnumbers. Below them are the years of the election with an ‘R’ signifying a runoff election.
Spending limits: 1989: $5,951 1995: $7,3801991: $6,248 1997: $7,9471993: $6,758 1999: $16,200

25
864422977531864227755311864299755111
spen
ding
rel
ativ
e to
spe
ndin
g li
mit
$10,000
$5,000
$0
$-5,000
$-10,000
$-15,000
$-20,000
1989 1991 1993 1995 1997 1999
Figure 4: Spending cap minus total spending (including in-kind contributions) by Albuquerque city council candidates, 1989-1999

26
YEAR
1997199319931993198919891989
spen
ding
rel
ativ
e to
spe
ndin
g li
mit
$200,000
$150,000
$100,000
$50,000
$0
$-50,000
$-100,000
Figure 6: Spending cap minus total spending (including in-kind contributions) by mayoral candidates, 1989-1997