alcatel-lucent 7750sr health indicators v0-1b
DESCRIPTION
7750TRANSCRIPT

Alcatel-Lucent 7750SR – Health Indicators
1
ALCATEL SERVICES — A BALANCED PARTNERSHIP
TitleTitle Continued
Service Description
OPERATE AND MAINTAIN PORTFOLIO
DIVISION NAME

Table of Content
1. INTRODUCTION AND SCOPE.....................................3
2. HEALTH INDICATORS...............................................3
2.1. HARDWARE PLATFORM STATUS..................................................3
2.1.1. Line cards and MDA’s......................................................32.1.2. Power suppply.................................................................32.1.3. FANs................................................................................32.1.4. Temperature...................................................................32.1.5. Switching fabric..............................................................32.1.6. Compact Flash file system capacity................................3
2.2. HIGH AVAILABILITY STATUS.......................................................3
2.3. SYSTEM RESOURCES STATUS.....................................................3
2.3.1. CPU usage.......................................................................32.3.2. Memory usage................................................................32.3.3. IOM forwarding complex resources.................................3
2.4. OTHER TOOLS........................................................................3
2.4.1. Event logging..................................................................32.4.2. RMON threshold monitoring............................................3
3. Glossary................................................................................3
2

1. Introduction and scope
The aim of this document is to provide operational guidelines to monitor the general health state of a 7750 SR box deployed in a production environment.
3

2. Health Indicators
2.1. Hardware platform status
2.1.1. Line cards and MDA’s
A:PE_SR7# show card state
===============================================================================Card State===============================================================================Slot/ Provisioned Equipped Admin Operational Num Num CommentsMDA Type Type State State Ports MDA -------------------------------------------------------------------------------1 iom2-20g iom2-20g up up 2 1/1 m4-choc3-as-sfp m4-choc3-as-sfp up up 4 1/2 m10-1gb-sfp m10-1gb-sfp up up 10 A sfm-400g sfm-400g up up Active B sfm-400g sfm-400g up up Standby ===============================================================================
2.1.2. Power suppply
The two power supply units operate in load sharing.
A:PE_SR7# show chassis power-supply
===============================================================================Chassis Information===============================================================================
Power Supply Information Number of power supplies : 2
Power supply number : 1 Defaulted power supply type : dc Status : up
Power supply number : 2 Defaulted power supply type : dc Status : up ===============================================================================
2.1.3. FANs
The fan rate is reduced at normal temperatures and gradually increases to full speed when the operating temperature rises.
A:PE_SR7# show chassis environment
===============================================================================Chassis Information===============================================================================
Environment Information Number of fan trays : 2 Number of fans : 4
Fan tray number : 1
4

Status : up Speed : half speed
Fan tray number : 2 Status : up Speed : half speed ===============================================================================
2.1.4. Temperature
There are three temperature sensors per line card (IOM) and Switch Fabric / Control Plane Module (SF/CPM) and 1 temperature sensor per MDA. The highest temperature from any sensor is reported as the temperature for that slot. If the temperature exceeds a pre-set threshold of 75º C for any slot then the SF/CPM will signal the fans/impellers to operate at full speed and an alarm event is generated (trap sent).
Temperature reading and threshold can be displayed per card
A:PE_SR7# show card 1 detail
===============================================================================Card 1===============================================================================Slot Provisioned Equipped Admin Operational Card-type Card-type State State -------------------------------------------------------------------------------1 iom2-20g iom2-20g up up
IOM Card Specific Data Clock source : none Available MDA slots : 2 Installed MDAs : 2
Hardware Data Part number : 3HE01473AAAA01 CLEI code : IPUIAVADAA Serial number : NS061450327 Manufacture date : 04052006 Manufacturing string : Manufacturing deviations : D00334 Administrative state : up Operational state : up Temperature : 64C Temperature threshold : 75C Software boot version : X-4.0.R6 on Tue Sep 26 15:04:22 PST 2006 b* Software version : TiMOS-I-4.0.R9 iom/hops ALCATEL SR 7750 Co* Time of last boot : 2007/02/07 10:12:49 Current alarm state : alarm cleared Base MAC address : 00:03:fa:ac:e5:ee Memory capacity : 1,024 MB ===============================================================================
5
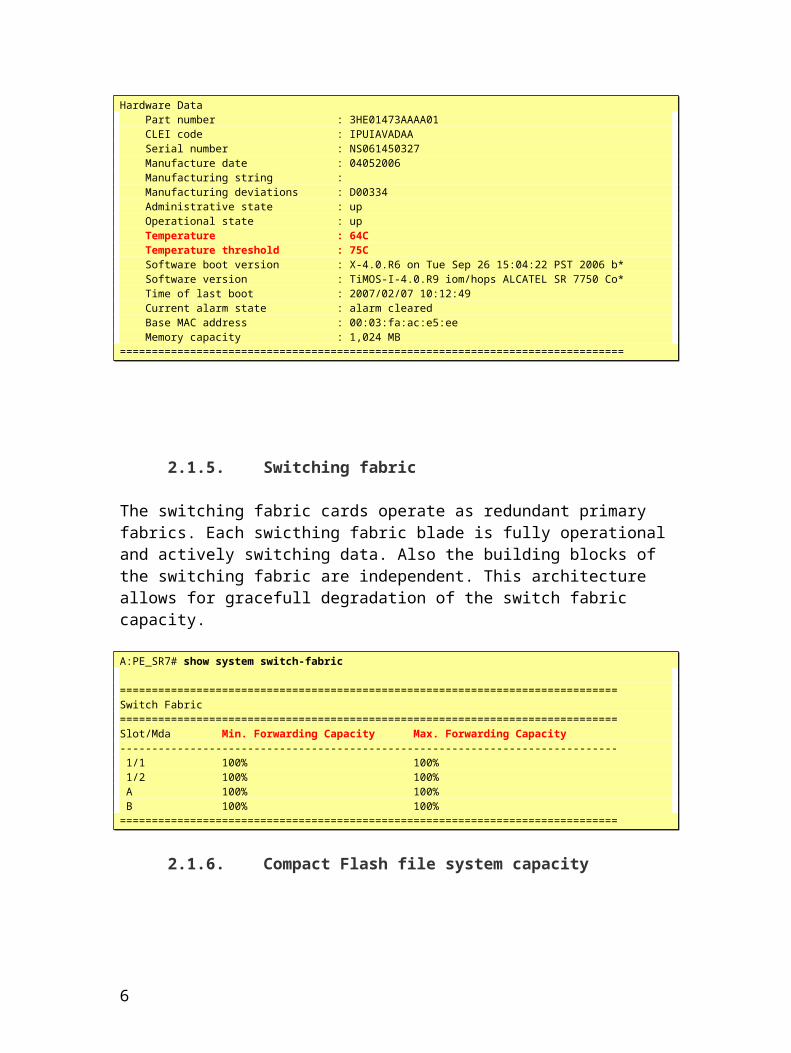
2.1.5. Switching fabric
The switching fabric cards operate as redundant primary fabrics. Each swicthing fabric blade is fully operational and actively switching data. Also the building blocks of the switching fabric are independent. This architecture allows for gracefull degradation of the switch fabric capacity.
A:PE_SR7# show system switch-fabric
==============================================================================Switch Fabric==============================================================================Slot/Mda Min. Forwarding Capacity Max. Forwarding Capacity ------------------------------------------------------------------------------ 1/1 100% 100% 1/2 100% 100% A 100% 100% B 100% 100% ==============================================================================
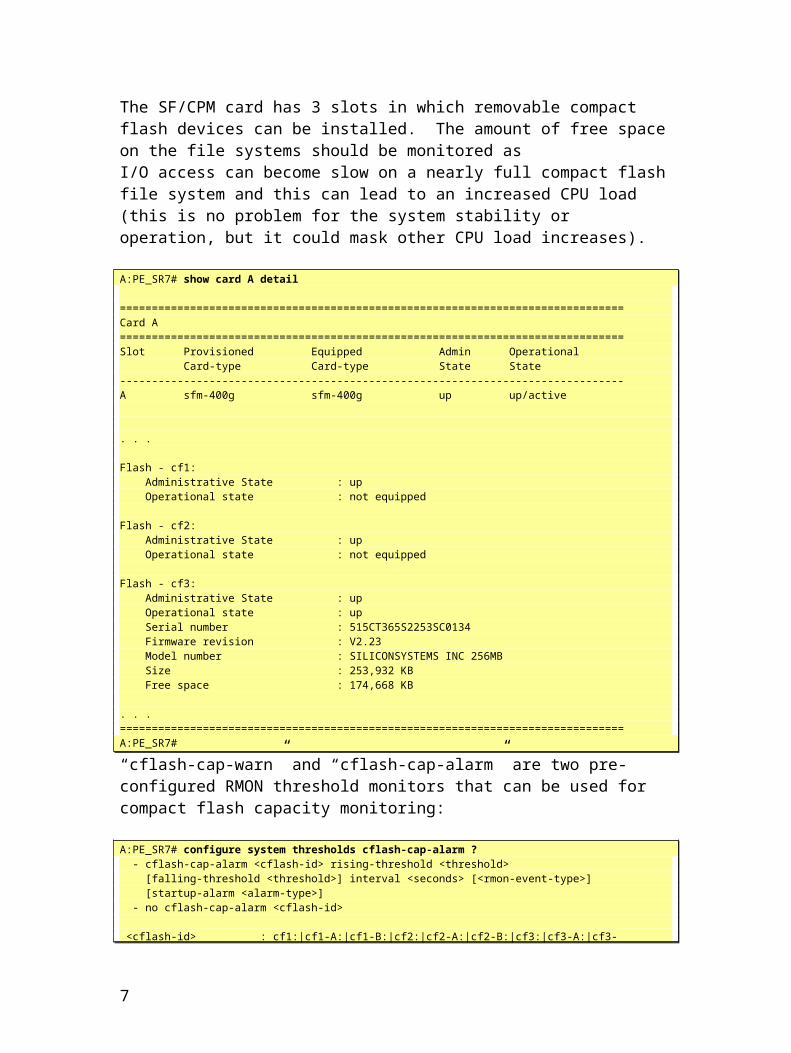
2.1.6. Compact Flash file system capacity
The SF/CPM card has 3 slots in which removable compact flash devices can be installed. The amount of free space on the file systems should be monitored as I/O access can become slow on a nearly full compact flash file system and this can lead to an increased CPU load (this is no problem for the system stability or operation, but it could mask other CPU load increases).
A:PE_SR7# show card A detail
===============================================================================Card A===============================================================================Slot Provisioned Equipped Admin Operational Card-type Card-type State State -------------------------------------------------------------------------------A sfm-400g sfm-400g up up/active
. . .
Flash - cf1: Administrative State : up Operational state : not equipped
Flash - cf2: Administrative State : up Operational state : not equipped
Flash - cf3: Administrative State : up Operational state : up Serial number : 515CT365S2253SC0134 Firmware revision : V2.23 Model number : SILICONSYSTEMS INC 256MB Size : 253,932 KB Free space : 174,668 KB
6
. . . ===============================================================================A:PE_SR7#
“cflash-cap-warn” and “cflash-cap-alarm” are two pre-configured RMON threshold monitors that can be used for compact flash capacity monitoring:
A:PE_SR7# configure system thresholds cflash-cap-alarm ? - cflash-cap-alarm <cflash-id> rising-threshold <threshold> [falling-threshold <threshold>] interval <seconds> [<rmon-event-type>] [startup-alarm <alarm-type>] - no cflash-cap-alarm <cflash-id>
<cflash-id> : cf1:|cf1-A:|cf1-B:|cf2:|cf2-A:|cf2-B:|cf3:|cf3-A:|cf3- B: <threshold> : [-2147483648..2147483647] <seconds> : [1..2147483647] <event-type> : [log | trap | both | none] Def: both <alarm-type> : [rising | falling | either] Def: either
The memory thresholds are based on monitoring the TIMETRA-SYSTEM-MIB “tmnxCmpFlashUsed” object. The value of this object indicates the amount used of this flash unit's total capacity."
2.2. High availability status
The two CPM blades operate in a 1:1 hot redundancy scheme. This enables non-stop routing and non-stop services on the system. The High Availability synschronisation status can be verified:
A:PE_SR7# show card
===============================================================================Card Summary===============================================================================Slot Provisioned Equipped Admin Operational Card-type Card-type State State -------------------------------------------------------------------------------1 iom2-20g iom2-20g up up A sfm-400g sfm-400g up up/active B sfm-400g sfm-400g up up/standby ===============================================================================
A:PE_SR7# show redundancy synchronization
===============================================================================Synchronization Information===============================================================================Standby Status : standby ready Last Standby Failure : N/A Standby Up Time : 2007/02/09 09:35:22 Standby Version : TiMOS-C-4.0.R9 cpm/hops ALCATEL SR 7750 Copyright (c) 2000-2007 Alcatel-Lucent. All rights reserved. All use subject to applicable license agreements. Built on Tue Dec 19 15:43:17 PST 2006 by builder in /rel4. Failover Time : N/A Failover Reason : N/A Boot/Config Sync Mode : Boot Environment
7

Boot/Config Sync Status : All boot environment synchronized Last Config File Sync Time : Never Last Boot Env Sync Time : 02/09/2007 09:36:03 ===============================================================================
2.3. System resources status
2.3.1. CPU usage
The 7750 SR OS uses a pre-emptive multi-tasking operating system which allocates CPU cycles in a round robin fashion based on priority and process state. No one task can run for more than 20ms before other processes will have an opportunity to run. Special care and testing resources has gone into insuring that no one process or group of processes can exclusively claim any one system resource such as CPU cycles, memory or bandwidth.
With this architecture, high CPU usage (burst of near 100%) are perfectly normal. It simply means that the control plane has work to do, usually related to routing (e.g. BGP updates to process) or management (e.g. SNMP requests to respond). The system will employ all of its CPU resources to get the job done as fast as possible. If that was not the case, the system wouldn't be running as fast and efficient as it could.
Therefore, high CPU utilization on its own is not a problem on the 7750 SR.
However, very prolonged periods of high CPU utilization (hours), while not service impacting per se, is not normal and should be looked into. It could for example mean the the network has flapping links and/or routing adjacencies.
The "show system cpu" figures are all for the primary CPU of the SF/CPM on a distributed system, or for the one and only CPU on 1-slot 7x50s. This is the CPU where all main control plain functions are running (routing protocols, system functions).
There is currently no CLI command to view utilization levels on the secondary CPU of an SF/CPM (mainly used for cflowd), the IOM CPUs, or the many network processors in the system.
A:PE_SR7# show system cpu sample-period 10
=========================================CPU Utilization (Test time 9999341 uSec)=========================================Name CPU Time CPU Usage (uSec)
8

-----------------------------------------System 219681 2.19% Icc 3314 0.03% RTM/Policies 326 ~0.00% OSPF 0 0.00% MPLS/RSVP 24 ~0.00% LDP 8255 0.08% IS-IS 12025 0.12% RIP 0 0.00% VRRP 0 0.00% BGP 6063 0.06% Services 2835 0.02% IOM 0 0.00% CFLOWD 0 0.00% IGMP 0 0.00% PIM 0 0.00% MCast Stack 0 0.00% IP Stack 25907 0.25% MBUF 0 0.00% IGMP Snooping 533 ~0.00% TLS MFIB 7810 0.07% WEB Redirect 1921 0.01% Idle 9710647 97.11% =========================================
2.3.2. Memory usage
The "show system memory-pools" figures are all for the primary CPU of the SF/CPM on a distributed system, or for the one and only CPU on 1-slot 7x50s. This is the CPU where all main control plain functions are running (routing protocols, system functions). This CPU has a memory capacity of 2Gbyte
A:PE_SR7# show system memory-pools
===============================================================================Memory Pools===============================================================================Name Max Allowed Current Size Max So Far In Use -------------------------------------------------------------------------------System No limit 56,923,848 56,923,848 45,988,344 Icc 8,388,608 1,048,576 1,048,576 32,152 RTM/Policies No limit 3,145,728 3,145,728 1,331,752 OSPF No limit 1,048,576 1,048,576 310,232 MPLS/RSVP No limit 3,145,752 3,145,752 2,088,144 LDP No limit 3,145,728 3,145,728 2,352,112 IS-IS No limit 3,448,896 3,448,896 3,340,712 RIP No limit 0 0 0 VRRP No limit 1,048,576 1,048,576 136 BGP No limit 8,060,992 8,060,992 7,079,320 Services No limit 3,145,728 3,145,728 2,703,592 IOM No limit 0 0 0 CFLOWD No limit 0 0 0 IGMP No limit 0 0 0 PIM No limit 0 0 0 MCast Stack No limit 0 0 0 IP Stack No limit 29,837,008 29,837,008 28,508,040 MBUF No limit 5,837,312 5,837,312 4,831,872 IGMP Snooping No limit 1,048,576 1,048,576 76,080 TLS MFIB No limit 2,097,152 2,097,152 1,204,352 WEB Redirect 8,388,608 2,097,152 2,097,152 1,361,648 -------------------------------------------------------------------------------Current Total Size : 125,079,600 bytesTotal In Use : 101,208,488 bytes
9

Available Memory : 1,865,003,136 bytes===============================================================================
“memory-use-warn” and “memory-use-alarm” are two pre-configured RMON threshold monitors that can be used for memory usage:
A:PE_SR7# configure system thresholds memory-use-alarm ? - memory-use-alarm rising-threshold <threshold> [falling-threshold <threshold>] interval <seconds> [<rmon-event-type>] [startup-alarm <alarm-type>] - no memory-use-alarm
<threshold> : [-2147483648..2147483647] <seconds> : [1..214783647] <rmon-event-type> : [log | trap | both | none] Def: both <alarm-type> : [rising | falling | either] Def: either
The memory thresholds are based on monitoring the TIMETRA-SYSTEM-MIB sgiMemoryUsed object. This object contains the amount of memory currently used by the system.
2.3.3. IOM forwarding complex resources
For each 10Gbps forwarding complex on a line card (IOM), you can display the hardware resource limits (Total), usage (Allocated) and spares (Free).
A:PE_SR7# tools dump system-resources 1Resource Manager info at 001 22:43:22.140:
Hardware Resource Usage for Slot #1, Cmplx #0:
| Total | Allocated | Free -------------------------+-----------+-----------+------------ SAP Ingress QoS Policies | 1791| 5| 1786 SAP Egress QoS Policies | 2047| 6| 2041 Ingress Queues | 8192| 72| 8120 Egress Queues | 8192| 33| 8159 Ingress CAM Entries | 32768| 2| 32766 Egress CAM Entries | 16384| 2| 16382 Ing IPv6 QOS CAM Entries | 2048| 2| 2046 Ing IPv6 ACL CAM Entries | 14336| 2| 14334 Egress IPv6 CAM Entries | 8192| 2| 8190 QoS Virtual Schedulers | 24575| 43| 24532 Subscriber Host Entries | 8191| 0| 8191
Hardware Resource Usage for Slot #1, Cmplx #1:
| Total | Allocated | Free -------------------------+-----------+-----------+------------ SAP Ingress QoS Policies | 1791| 5| 1786 SAP Egress QoS Policies | 2047| 6| 2041 Ingress Queues | 8192| 189| 8003 Egress Queues | 8192| 88| 8104 Ingress CAM Entries | 32768| 2| 32766 Egress CAM Entries | 16384| 2| 16382 Ing IPv6 QOS CAM Entries | 2048| 2| 2046
10

Ing IPv6 ACL CAM Entries | 14336| 2| 14334 Egress IPv6 CAM Entries | 8192| 2| 8190 QoS Virtual Schedulers | 24575| 43| 24532 Subscriber Host Entries | 8191| 0| 8191
Note: For IOM-20g-b or IOM2-20g, “Slot #1, Cmplx #0” corresponds with the IOM forwarding complex connected to MDA 1/1.
2.4. Other tools
2.4.1. Event logging
System event logging features include: event filtering, logging to multiple different destinations (Memory, File, Syslog, SNMP trap, Console/Session)
All main events are logged in the default memory logger (log-id 99). It is good common practise to scan this log for unusual errors, repeated events, etc.
Note: Major and critical main events are stored in default memory logger (log-id 100).
A:PE_SR7# show log log-id 99
===============================================================================Event Log 99===============================================================================Description : Default System LogMemory Log contents [size=500 next event=444 (not wrapped)]
443 2007/02/09 13:04:38.38 UTC MINOR: CHASSIS #2003 - Mda 3/1"Class MDA Module : removed". . .
2.4.2. RMON threshold monitoring
RMON threshold monitoring allows the monitoring of any “integer” MIB Object for rising and/or falling thresholds. Only MIB variables that resolve to an ASN.1 primitive data type of INTEGER (INTEGER, Integer32, Counter32, Counter64, Gauge32, or TimeTicks) may be monitored.
Upon crossing the threshold, an SNMP trap and a log message are generated by the system
11

Memory and compact flash usage (see above) are two pre-configured RMON threshold monitors.
A:PE_SR7# configure system thresholds ? - thresholds
[no] cflash-cap-ala* - Configure cflash capacity alarm thresholds [no] cflash-cap-warn - Configure cflash capacity warning thresholds [no] memory-use-ala* - Configure memory use alarm thresholds [no] memory-use-warn - Configure memory usage warning thresholds rmon + Configure RMON monitoring thresholds
12

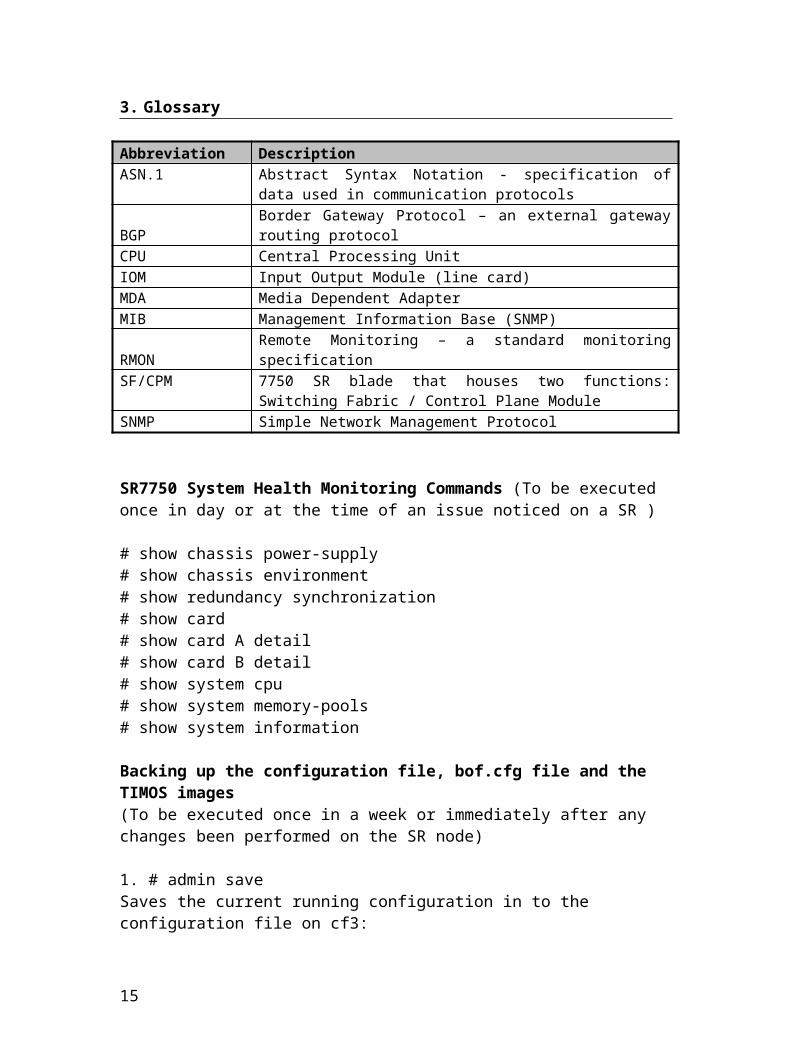
3. Glossary
Abbreviation DescriptionASN.1 Abstract Syntax Notation - specification of data used in
communication protocols
BGPBorder Gateway Protocol – an external gateway routing protocol
CPU Central Processing UnitIOM Input Output Module (line card)MDA Media Dependent AdapterMIB Management Information Base (SNMP)
RMONRemote Monitoring – a standard monitoring specification
SF/CPM 7750 SR blade that houses two functions: Switching Fabric / Control Plane Module
SNMP Simple Network Management Protocol
SR7750 System Health Monitoring Commands (To be executed once in day or at the time of an issue noticed on a SR )
# show chassis power-supply# show chassis environment# show redundancy synchronization# show card# show card A detail# show card B detail# show system cpu# show system memory-pools# show system information
Backing up the configuration file, bof.cfg file and the TIMOS images(To be executed once in a week or immediately after any changes been performed on the SR node)
1. # admin saveSaves the current running configuration in to the configuration file on cf3:
2. # show bof bootedWill display the contents of the bof.cfg file, the path of the primary-image, primary-config, secondary-image and secondary-config files are located
13

3. Regular availability check of bof.cfg, SR config, Boot loader (boot.ldr) & TiMOS files from boot locations (cf3 or ftp server)
# file dir cf3:displays the contents of the cf3: boot.ldr, bof.cfg, config.cfg and Timos directory.4. # file dir cf3:\7750-TiMOS-8.0.R5 displays the contents of the TiMOS directory, cpm.tim, iom.tim,isa-aa.tim and both.tim files must be present
5. To manually synchronize the configuration files and boot-env files are between active and standy CPM# synchronize boot-env# synchronize config
6. To back up the current configuration from SR 7750 to a ftp server# admin save ftp://userame:password@ftp-server-ip/config.cfg# admin save ftp://user:[email protected]/config.cfg
7. To back up the bof.cfg to the local cf3: (flash drive)#file copy cf3:/bof.cfg cf3:/bof.bak
8. To back up the bof.cfg file to the ftp server#file copy cf3:/bof.cfg ftp://userame:password@ftp-server-ip/bof.cfg#file copy cf3:/bof.cfg ftp://user:[email protected]/bof.cfg
9. To display the contents of the folder storing the image files# file dir cf3:7750-TiMOS-8.0.R5
10. To backup the TIMOS image files to the ftp server (once in a month or before performing a software image code upgrade)
# file copy cf3:\7750-TiMOS-8.0.R5\iom.tim ftp://username: password@ftp-server-ip/iom.tim
# file copy cf3:\7750-TiMOS-8.0.R5\iom.tim ftp://user:[email protected]/iom.tim
# file copy cf3:\7750-TiMOS-8.0.R5\cpm.tim ftp://user:[email protected]/cpm.tim
# file copy cf3:\7750-TiMOS-8.0.R5\isa-aa.tim ftp://user:[email protected]/isa-aa.tim
# file copy cf3:\7750-TiMOS-8.0.R5\BOTH.TIM ftp://user:[email protected]/BOTH.TIM
14
--- END OF DOCUMENT ---
15