alcohol factors arrests in the 2008
TRANSCRIPT

Department of Transportation
Evaluation ofAlcohol Factorsin CustodialArrests in theState of Wyoming
Highway Safety Program
20082008Wyoming Association of Sheriffs and Chiefs of Police
Supplemental Report
WYOMING DEPARTMENT OF TRANSPORTATION – Highway Safety Program
EVALUATION OF ALCOHOL FACTORS IN CUSTODIAL ARRESTS IN THE STATE OF WYOMING
2008 SUPPLEMENTAL REPORT
(COUNTY STATISTICS)
November 2008
This evaluation project was conducted by the Wyoming Association of Sheriffs and Chiefs of Police with Federal 402 Highway Safety funds received from a grant from the Wyoming Department of Transportation - Project No. HS00108.


Evaluation of Alcohol Factors in Wyoming Custodial Arrests
Wyoming Association of Sheriffs and Chiefs of Police
INTRODUCTION The report contains alcohol-related information collected in all twenty-three counties in the State of Wyoming for a period of twelve months (October 1, 2007 through September 30, 2008) by the Wyoming Association of Sheriffs and Chiefs of Police. Information was collected from a total of 21,758 persons who were arrested and subsequently detained in a county detention facility. It also includes statistics from persons booked into the Fremont County Alcohol Crisis Center. This report provides detailed county specific alcohol-related information and is a Supplemental Report to the Evaluation of Alcohol Factors – 2008 Report.
TABLE OF CONTENTS
1. ALBANY…………………………………………………….……..... 1-4 2. BIG HORN ……………………………………………………..……. 5-8 3. CAMPBELL ………………………………………………….…….. 9-12 4. CARBON ……………………………………………………..…....13-16 5. CONVERSE ………………………………………………….….... 17-20 6. CROOK ……………………………………………………….…... 21-24 7. FREMONT …………………………………………………….….. 25-28 8. FREMONT – Alcohol Crisis Center ………………………..….…. 29-32 9. GOSHEN ………………………………………………………...... 33-36 10. HOT SPRINGS ………………………………………………........ 37-40 11. JOHNSON ………………………………………………………... 41-44 12. LARAMIE …………………………………………………….…... 45-48 13. LINCOLN …………………………………………………….….... 49-52 14. NATRONA ………………………………………………………... 53-56 15. NIOBRARA ………………………………………………….….…57-60 16. PARK ……………………………………………………………... 61-64 17. PLATTE …………………………………………………………. 65-68 18. SHERIDAN …………………………………………………….…. 69-72 19. SUBLETTE …………………………………………………….…. 73-76 20. SWEETWATER ……………………………………………….….. 77-80 21. TETON ……………………………………………………………. 81-84 22. UINTA …………………………………………………………….. 85-88 23. WASHAKIE ………………………………………………………. 89-92 24. WESTON ………………………………………………………….. 93-96 25. Project Manager Vita………………………………………………..97-98

Numbers by Department
CountyTotal
OffensesMisde-meanor Felony
Domestic Violence
Resist Arrest Assault
Public Intox
Alcohol Involved
DrugsInvolved
Traffic Crash Female Male
Unknown Gender
Average Age
Albany County 758 639 58 38 24 15 101 585 69 49 120 620 18 28.32Albany SO 66 51 6 5 35 9 3 8 57 1 28.86DCI 12 3 10 10 1 11 22.50Game & Fish 1 1 1 19.00Laramie PD 546 474 31 33 20 14 94 462 36 37 100 432 14 27.88Other 7 6 1 5 1 1 1 4 2 35.67UW PD 40 38 1 3 1 7 34 2 38 23.76WHP 86 66 10 49 13 8 8 77 1 33.08
Percents by Department *
CountyTotal
OffensesMisde-meanor Felony
Domestic Violence
Resist Arrest Assault
Public Intox
Alcohol Involved
DrugsInvolved
Traffic Crash Female Male
Unkown Gender
Albany County 758 84.30% 7.65% 5.01% 3.17% 1.98% 13.32% 77.18% 9.10% 6.46% 15.83% 81.79% 2.37%Albany SO 66 77.27% 9.09% 7.58% 53.03% 13.64% 4.55% 12.12% 86.36% 1.52%DCI 12 25.00% 83.33% 83.33% 8.33% 91.67%Game & Fish 1 100.00% 100.00%Laramie PD 546 86.81% 5.68% 6.04% 3.66% 2.56% 17.22% 84.62% 6.59% 6.78% 18.32% 79.12% 2.56%Other 7 85.71% 14.29% 71.43% 14.29% 14.29% 14.29% 57.14% 28.57%UW PD 40 95.00% 2.50% 7.50% 2.50% 17.50% 85.00% 5.00% 95.00%WHP 86 76.74% 11.63% 56.98% 15.12% 9.30% 9.30% 89.53% 1.16%
* Total percents may not equal 100 due to lack of information, or a single arrest involving multiple crimes.
Albany County ArrestsOctober 1, 2007 - September 30, 2008
Albany County 1

MIP Arrests Meth, Drugs & Public Intoxication
County DUI MIP % MIP Average County Total Meth Drugs Public Pub. Intox. Department Offenses Arrests to DUI MIP BAC Department Offenses Involved Involved Intox. Ave. BACAlbany County 329 55 16.72% 0.153 Albany County 758 5 69 101 0.230Albany SO 26 3 11.54% 0.124 Albany SO 66 9DCI DCI 12 10Game & Fish Game & Fish 1Laramie PD 242 40 16.53% 0.152 Laramie PD 546 2 36 94 0.230Other 2 1 50.00% Other 7 1 1UW PD 10 9 90.00% 0.169 UW PD 40 7 0.225WHP 49 2 4.08% WHP 86 2 13
DUI Arrests Traffic Crashes
County Total DUI % DUI Ave.DUI
Involving% DUI
Involving County Traffic Alcohol % Alcohol Average Drugs % Drugs Department Offenses Offenses Of Total BAC Drugs Drugs Department Crashes Involved Involved BAC Involved InvolvedAlbany County 758 329 43.40% 0.161 18 2.37% Albany County 49 48 97.96% 0.160 3 6.12%Albany SO 66 26 39.39% 0.169 1 1.52% Albany SO 3 3 100.00% 0.130DCI 12 DCIGame & Fish 1 Game & FishLaramie PD 546 242 44.32% 0.166 15 2.75% Laramie PD 37 36 97.30% 0.162 2 5.41%Other 7 2 28.57% 0.124 Other 1 1 100.00% 0.008UW PD 40 10 25.00% 0.121 UW PDWHP 86 49 56.98% 0.143 2 2.33% WHP 8 8 100.00% 0.213 1 12.50%
Underage DUI ArrestsCounty DUI Underage % DUI Ave. Drugs % DUI Department Offenses Offenses Of Total BAC Involved Drugs Inv.Albany County 329 58 17.63% 0.143 6 1.82%Albany SO 26 3 11.54% 0.182 1 3.85%DCIGame & FishLaramie PD 242 41 16.94% 0.150 5 2.07%Other 2UW PD 10 7 70.00% 0.131WHP 49 7 14.29% 0.073
Albany County 2

Total Offenses Domestic Violence
County TotalNumber Involving
PercentInvolving
NumberInvolving
PercentInvolving County
Domestic Violence
Number Involving
PercentInvolving
NumberInvolving
PercentInvolving
Department Offenses Alcohol Alcohol Drugs Drugs Department Offenses Alcohol Alcohol Drugs DrugsAlbany County 758 585 77.18% 69 9.10% Albany County 38 24 63.16% 1 2.63%Albany SO 66 35 53.03% 9 13.64% Albany SO 5 2DCI 12 10 83.33% DCIGame & Fish 1 Game & FishLaramie PD 546 462 84.62% 36 6.59% Laramie PD 33 22 66.67% 1 3.03%Other 7 5 71.43% 1 14.29% OtherUW PD 40 34 85.00% UW PDWHP 86 49 56.98% 13 15.12% WHP
Felony Offenses Resisting Arrest
County FelonyNumber Involving
PercentInvolving
NumberInvolving
PercentInvolving County
Resisting Arrest
Number Involving
PercentInvolving
NumberInvolving
PercentInvolving
Department Offenses Alcohol Alcohol Drugs Drugs Department Offenses Alcohol Alcohol Drugs DrugsAlbany County 58 11 18.97% 19 32.76% Albany County 24 23 95.83% 2 8.33%Albany SO 6 1 16.67% 1 16.67% Albany SODCI 10 8 80.00% DCIGame & Fish Game & FishLaramie PD 31 9 29.03% 3 9.68% Laramie PD 20 20 100.00% 2 10.00%Other Other 1 1 100.00%UW PD 1 UW PD 3 2 66.67%WHP 10 1 10.00% 7 70.00% WHP
Misdemeanor Offenses Assault
CountyMisde-meanor
Number Involving
PercentInvolving
NumberInvolving
PercentInvolving County Assault
Number Involving
PercentInvolving
NumberInvolving
PercentInvolving
Department Offenses Alcohol Alcohol Drugs Drugs Department Offenses Alcohol Alcohol Drugs DrugsAlbany County 639 524 82.00% 47 7.36% Albany County 15 9 60.00% 2 13.33%Albany SO 51 30 58.82% 8 15.69% Albany SODCI 3 3 100.00% DCIGame & Fish 1 Game & FishLaramie PD 474 417 87.97% 29 6.12% Laramie PD 14 9 64.29% 2 14.29%Other 6 4 66.67% 1 16.67% OtherUW PD 38 33 86.84% UW PD 1WHP 66 40 60.61% 6 9.09% WHP
Alcohol and Drug Involvement
Albany County 3

Alcohol No Drive Liquor No Department Involved Home Bar Party Car Other Response Home Bar Up Party Store ResponseAlbany SO 35 8 6 3 2 3 12 5 7 3 2 15DCIGame & FishLaramie PD 462 48 138 48 1 10 189 31 133 22 15 213Other 5 1 1 2 1 1 2UW PD 34 5 5 11 3 9 5 5 3 5 13WHP 49 6 7 3 4 1 27 3 8 1 3 29Albany County Totals 585 68 157 65 7 17 239 44 154 0 29 26 272
Location of Alcohol Consumption
Dept.Number of
ReportsAlbany SO 3rd Street Cowboy 2
Buckhorn 2Eagles 1Northridge 1
Laramie PD 3rd Street Cowboy 30Altitude 1Applebee's 1Beartrap 1Buckhorn 33Coppers 3Eagles 3Elks 1Jeffries 1Laramie Lanes 2Library 2Lovejoys 6Mingles 5Ranger 16Reed's 1Roughed Up Duck 1VFW 1
Probation & Parole Ranger 1UW PD Buckhorn 1
Library 2Ranger 2
WHP 3rd Street Cowboy 1Buckhorn 1Coppers 2Ranger 1Reed's 1
* Total of percents in Location of Consumption and Point of Sale categories may exceed 100% due to single arrests involving more than on location or point of sale.
Location of Alcohol Consumption and Point of Sale by Department
Location of Consumption Point of Sale
Bar Name
Albany County 4

Numbers by Department
CountyTotal
OffensesMisde-meanor Felony
Domestic Violence
Resist Arrest Assault
Public Intox
Alcohol Involved
DrugsInvolved
Traffic Crash Female Male
Unknown Gender
Average Age
Big Horn County 144 136 7 10 7 10 20 111 20 10 28 114 2 37.26Basin PD 8 8 1 6 7 1 34.25Big Horn SO 37 32 4 7 2 5 3 30 4 2 7 29 1 36.30Byron PD 1 1 1 1 30.00Greybull PD 64 62 2 2 3 5 16 46 12 4 15 49 38.34Lovell PD 6 6 1 1 5 1 5 27.00Other 3 3 2 1 2 31.00WHP 25 24 1 1 21 4 4 3 22 40.78
Percents by Department *
CountyTotal
OffensesMisde-meanor Felony
Domestic Violence
Resist Arrest Assault
Public Intox
Alcohol Involved
DrugsInvolved
Traffic Crash Female Male
Unkown Gender
Big Horn County 144 94.44% 4.86% 6.94% 4.86% 6.94% 13.89% 77.08% 13.89% 6.94% 19.44% 79.17% 1.39%Basin PD 8 100.00% 12.50% 75.00% 87.50% 12.50%Big Horn SO 37 86.49% 10.81% 18.92% 5.41% 13.51% 8.11% 81.08% 10.81% 5.41% 18.92% 78.38% 2.70%Byron PD 1 100.00% 100.00% 100.00%Greybull PD 64 96.88% 3.13% 3.13% 4.69% 7.81% 25.00% 71.88% 18.75% 6.25% 23.44% 76.56%Lovell PD 6 100.00% 0.00% 16.67% 16.67% 83.33% 16.67% 83.33%Other 3 100.00% 66.67% 33.33% 66.67%WHP 25 96.00% 4.00% 4.00% 84.00% 16.00% 16.00% 12.00% 88.00%
* Total percents may not equal 100 due to lack of information, or a single arrest involving multiple crimes.
Big Horn County ArrestsOctober 1, 2007 - September 30, 2008
Big Horn County 5

MIP Arrests Meth, Drugs & Public Intoxication
County DUI MIP % MIP Average County Total Meth Drugs Public Pub. Intox. Department Offenses Arrests to DUI MIP BAC Department Offenses Involved Involved Intox. Ave. BACBig Horn County 80 5 6.25% 0.108 Big Horn County 144 2 20 20 0.177Basin PD 4 1 25.00% Basin PD 8 1Big Horn SO 20 1 5.00% 0.149 Big Horn SO 37 4 3Byron PD 1 Byron PD 1Greybull PD 29 Greybull PD 64 1 12 16 0.177Lovell PD 3 1 33.33% 0.091 Lovell PD 6Other 2 Other 3WHP 21 2 9.52% 0.095 WHP 25 1 4
DUI Arrests Traffic Crashes
County Total DUI % DUI Ave.DUI
Involving% DUI
Involving County Traffic Alcohol % Alcohol Average Drugs % Drugs Department Offenses Offenses Of Total BAC Drugs Drugs Department Crashes Involved Involved BAC Involved InvolvedBig Horn County 144 80 55.56% 0.147 8 5.56% Big Horn County 10 8 80.00% 0.163 2 20.00%Basin PD 8 4 50.00% Basin PDBig Horn SO 37 20 54.05% 0.152 1 2.70% Big Horn SO 2 2 100.00% 0.210Byron PD 1 1 100.00% 0.275 Byron PDGreybull PD 64 29 45.31% 0.126 4 6.25% Greybull PD 4 3 75.00% 1 25.00%Lovell PD 6 3 50.00% 0.164 Lovell PDOther 3 2 66.67% 0.077 OtherWHP 25 21 84.00% 0.165 3 12.00% WHP 4 3 75.00% 0.070 1 25.00%
Underage DUI ArrestsCounty DUI Underage % DUI Ave. Drugs % DUI Department Offenses Offenses Of Total BAC Involved Drugs Inv.Big Horn County 80 3 3.75% 0.066 0Basin PD 4Big Horn SO 20Byron PD 1Greybull PD 29 1 3.45%Lovell PD 3Other 2 1 50.00% 0.061WHP 21 1 4.76% 0.070
Big Horn County 6

Total Offenses Domestic Violence
County TotalNumber Involving
PercentInvolving
NumberInvolving
PercentInvolving County
Domestic Violence
Number Involving
PercentInvolving
NumberInvolving
PercentInvolving
Department Offenses Alcohol Alcohol Drugs Drugs Department Offenses Alcohol Alcohol Drugs DrugsBig Horn County 144 111 77.08% 20 13.89% Big Horn County 10 7 70.00% 0Basin PD 8 6 75.00% Basin PDBig Horn SO 37 30 81.08% 4 10.81% Big Horn SO 7 5 71.43%Byron PD 1 1 100.00% Byron PDGreybull PD 64 46 71.88% 12 18.75% Greybull PD 2 1 50.00%Lovell PD 6 5 83.33% Lovell PD 1 1 100.00%Other 3 2 66.67% OtherWHP 25 21 84.00% 4 16.00% WHP
Felony Offenses Resisting Arrest
County FelonyNumber Involving
PercentInvolving
NumberInvolving
PercentInvolving County
Resisting Arrest
Number Involving
PercentInvolving
NumberInvolving
PercentInvolving
Department Offenses Alcohol Alcohol Drugs Drugs Department Offenses Alcohol Alcohol Drugs DrugsBig Horn County 7 2 28.57% 3 42.86% Big Horn County 7 5 71.43% 1 14.29%Basin PD Basin PDBig Horn SO 4 2 50.00% Big Horn SO 2 2 100.00%Byron PD Byron PDGreybull PD 2 1 50.00% 1 50.00% Greybull PD 3 2 66.67% 1 33.33%Lovell PD Lovell PD 1Other OtherWHP 1 1 100.00% WHP 1 1 100.00%
Misdemeanor Offenses Assault
CountyMisde-meanor
Number Involving
PercentInvolving
NumberInvolving
PercentInvolving County Assault
Number Involving
PercentInvolving
NumberInvolving
PercentInvolving
Department Offenses Alcohol Alcohol Drugs Drugs Department Offenses Alcohol Alcohol Drugs DrugsBig Horn County 136 108 79.41% 18 13.24% Big Horn County 10 4 40.00% 0Basin PD 8 6 75.00% 1 12.50% Basin PDBig Horn SO 32 29 90.63% 1 3.13% Big Horn SO 5 2 40.00%Byron PD 1 1 100.00% Byron PDGreybull PD 62 45 72.58% 12 19.35% Greybull PD 5 2 40.00%Lovell PD 6 5 83.33% Lovell PDOther 3 2 66.67% OtherWHP 24 20 83.33% 4 16.67% WHP
Alcohol and Drug Involvement
Big Horn County 7

Alcohol No Drive Liquor No Department Involved Home Bar Party Car Other Response Home Bar Up Party Store ResponseBasin PD 6 3 3Big Horn SO 30 8 7 4 6 2 1 6 9 3 3 5Byron PD 1 1 1Greybull PD 46 7 20 3 4 6 3 3 22 2 1 7Lovell PD 5 2 2 1 1 1 1 1Other 2 2 1 1WHP 21 2 8 1 9 2 2 1 9 1 3 5Big Horn County Totals 111 19 35 10 22 10 10 13 41 0 7 8 21
Location of Alcohol Consumption
Dept.Number of
ReportsBig Horn PD Burlington 2
Cowley Bar 1Meadowlark Lodge 1Oasis Bar 1Shotgun Willy's 1
Greybull PD Branding Iron 2Lisa's 3Silver Spur 3Smokehouse 7Stockman's 5
WHP Eagles 1Hyattville 4Joe's Martini Bar 1
* Total of percents in Location of Consumption and Point of Sale categories may exceed 100% due to single arrests involving more than on location or point of sale.
Location of Alcohol Consumption and Point of Sale by Department
Location of Consumption Point of Sale
Bar Name
Big Horn County 8
Numbers by Department
CountyTotal
OffensesMisde-meanor Felony
Domestic Violence
Resist Arrest Assault
Public Intox
Alcohol Involved
DrugsInvolved
Traffic Crash Female Male
Unknown Gender
Average Age
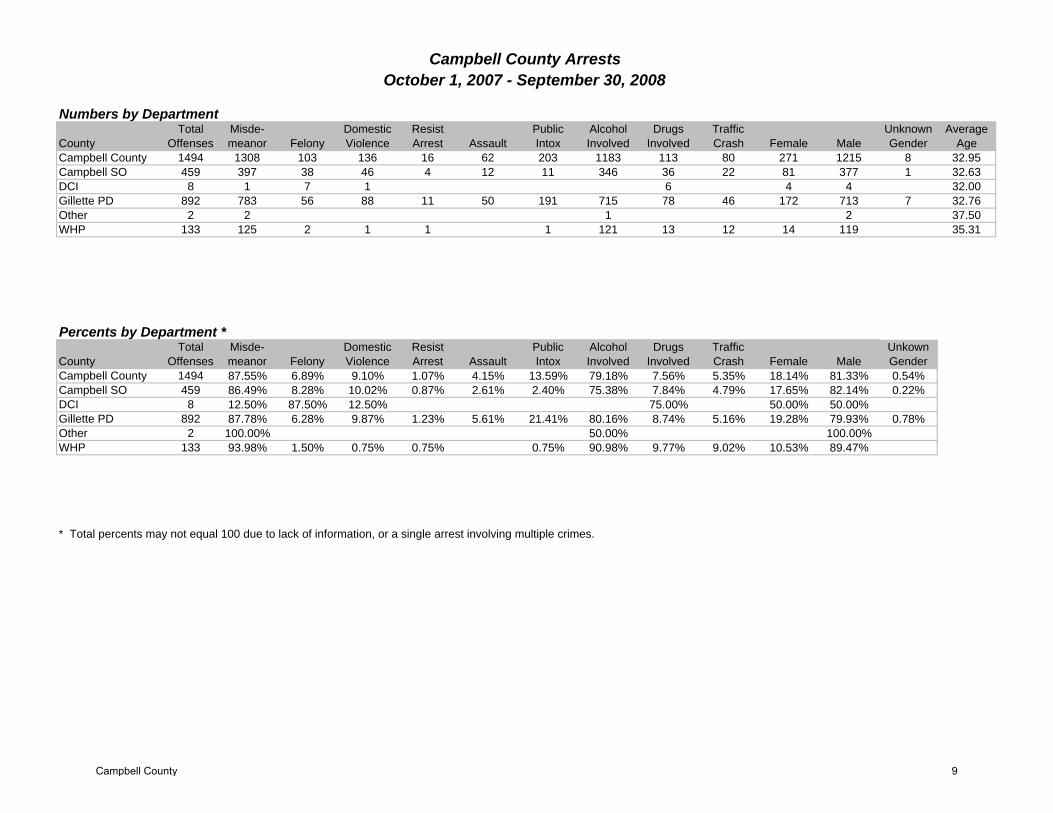
Campbell County 1494 1308 103 136 16 62 203 1183 113 80 271 1215 8 32.95Campbell SO 459 397 38 46 4 12 11 346 36 22 81 377 1 32.63DCI 8 1 7 1 6 4 4 32.00Gillette PD 892 783 56 88 11 50 191 715 78 46 172 713 7 32.76Other 2 2 1 2 37.50WHP 133 125 2 1 1 1 121 13 12 14 119 35.31
Percents by Department *
CountyTotal
OffensesMisde-meanor Felony
Domestic Violence
Resist Arrest Assault
Public Intox
Alcohol Involved
DrugsInvolved
Traffic Crash Female Male
Unkown Gender
Campbell County 1494 87.55% 6.89% 9.10% 1.07% 4.15% 13.59% 79.18% 7.56% 5.35% 18.14% 81.33% 0.54%Campbell SO 459 86.49% 8.28% 10.02% 0.87% 2.61% 2.40% 75.38% 7.84% 4.79% 17.65% 82.14% 0.22%DCI 8 12.50% 87.50% 12.50% 75.00% 50.00% 50.00%Gillette PD 892 87.78% 6.28% 9.87% 1.23% 5.61% 21.41% 80.16% 8.74% 5.16% 19.28% 79.93% 0.78%Other 2 100.00% 50.00% 100.00%WHP 133 93.98% 1.50% 0.75% 0.75% 0.75% 90.98% 9.77% 9.02% 10.53% 89.47%
* Total percents may not equal 100 due to lack of information, or a single arrest involving multiple crimes.
Campbell County ArrestsOctober 1, 2007 - September 30, 2008
Campbell County 9

MIP Arrests Meth, Drugs & Public Intoxication
County DUI MIP % MIP Average County Total Meth Drugs Public Pub. Intox. Department Offenses Arrests to DUI MIP BAC Department Offenses Involved Involved Intox. Ave. BACCampbell County 780 31 3.97% 0.139 Campbell County 1494 33 113 203 0.198Campbell SO 290 7 2.41% 0.117 Campbell SO 459 9 36 11 0.197DCI DCI 8 5 6Gillette PD 376 22 5.85% 0.160 Gillette PD 892 17 78 191 0.199Other Other 2WHP 114 2 1.75% 0.041 WHP 133 2 13 1
DUI Arrests Traffic Crashes
County Total DUI % DUI Ave.DUI
Involving% DUI
Involving County Traffic Alcohol % Alcohol Average Drugs % Drugs Department Offenses Offenses Of Total BAC Drugs Drugs Department Crashes Involved Involved BAC Involved InvolvedCampbell County 1494 780 52.21% 0.151 41 2.74% Campbell County 80 71 88.75% 0.166 6 7.50%Campbell SO 459 290 63.18% 0.152 13 2.83% Campbell SO 22 21 95.45% 0.146DCI 8 DCIGillette PD 892 376 42.15% 0.158 21 2.35% Gillette PD 46 39 84.78% 0.190 5 10.87%Other 2 OtherWHP 133 114 85.71% 0.133 7 5.26% WHP 12 11 91.67% 0.148 1 8.33%
Underage DUI ArrestsCounty DUI Underage % DUI Ave. Drugs % DUI Department Offenses Offenses Of Total BAC Involved Drugs Inv.Campbell County 780 52 6.67% 0.111 8 1.03%Campbell SO 290 16 5.52% 0.118 3 1.03%DCIGillette PD 376 25 6.65% 0.123 3 0.80%OtherWHP 114 11 9.65% 0.081 2 1.75%
Campbell County 10

Total Offenses Domestic Violence
County TotalNumber Involving
PercentInvolving
NumberInvolving
PercentInvolving County
Domestic Violence
Number Involving
PercentInvolving
NumberInvolving
PercentInvolving
Department Offenses Alcohol Alcohol Drugs Drugs Department Offenses Alcohol Alcohol Drugs DrugsCampbell County 1494 1183 79.18% 113 7.56% Campbell County 136 71 52.21% 3 2.21%Campbell SO 459 346 75.38% 36 7.84% Campbell SO 46 25 54.35%DCI 8 6 75.00% DCI 1Gillette PD 892 715 80.16% 78 8.74% Gillette PD 88 45 51.14% 2 2.27%Other 2 1 50.00% OtherWHP 133 121 90.98% 13 9.77% WHP 1 1 100.00% 1 100.00%
Felony Offenses Resisting Arrest
County FelonyNumber Involving
PercentInvolving
NumberInvolving
PercentInvolving County
Resisting Arrest
Number Involving
PercentInvolving
NumberInvolving
PercentInvolving
Department Offenses Alcohol Alcohol Drugs Drugs Department Offenses Alcohol Alcohol Drugs DrugsCampbell County 103 30 29.13% 31 30.10% Campbell County 16 11 68.75% 1 6.25%Campbell SO 38 10 26.32% 8 21.05% Campbell SO 4 3 75.00%DCI 7 5 71.43% DCIGillette PD 56 18 32.14% 17 30.36% Gillette PD 11 8 72.73% 1 9.09%Other OtherWHP 2 2 100.00% 1 50.00% WHP 1
Misdemeanor Offenses Assault
CountyMisde-meanor
Number Involving
PercentInvolving
NumberInvolving
PercentInvolving County Assault
Number Involving
PercentInvolving
NumberInvolving
PercentInvolving
Department Offenses Alcohol Alcohol Drugs Drugs Department Offenses Alcohol Alcohol Drugs DrugsCampbell County 1308 1083 82.80% 99 7.57% Campbell County 62 43 69.35% 5 8.06%Campbell SO 397 318 80.10% 27 6.80% Campbell SO 12 7 58.33% 1 8.33%DCI 1 1 100.00% DCIGillette PD 783 650 83.01% 60 7.66% Gillette PD 50 36 72.00% 4 8.00%Other 2 1 50.00% OtherWHP 125 114 91.20% 11 8.80% WHP
Alcohol and Drug Involvement
Campbell County 11

Alcohol No Drive Liquor No Department Involved Home Bar Party Car Other Response Home Bar Up Party Store ResponseCampbell SO 346 66 128 17 10 27 72 133 3 19 23 82DCIGillette PD 715 117 319 28 12 38 171 3 326 4 19 44 196Other 1 1 1WHP 121 23 44 11 7 9 23 12 46 1 9 11 29Campbell County Totals 1183 206 491 56 29 75 266 15 505 8 47 79 307
Location of Alcohol Consumption
Dept.Number of
Reports Dept.Number of
Reports Dept.Number of
Reports
Campbell SO Applebee's 1Gillette PD American Legion 1 WHP Attitudes 1
Attitudes 9 Applebee's 1 Brian's Place 8Brian's Place 12 Attitudes 39 Buella Bar 1Casa Del Ray 1 Bass Lodge 1 Camel Lanes 1Center Bar 4 Beverage Broker 1 Chop House 2Chop House 1 Bootleggers 3 Dewey's 1Clarion 1 Brian's Place 2 East Side 2Cowboy 1 Camel Lanes 1 Fireside 1Dewey's 1 Casa Del Ray 2 Good Times 2East Side 4 Center Bar 10 Hank's Bar 2Fireside 7 Chop House 2 Jake's 2Good Times 3 Clarion 4 Lakeside 1Hank's Bar 5 East Side 15 Little Powder Bar 1Jack's Liquor 1 Far Side 1 Mingles 1Jake's 24 Fireside 22 Montgomery 1Knights of Columbus 3 Frontier Lanes 1 National 9 Inn 1Lakeside 4 Good Times 17 Other Side 2Mingles 11 Jack's Liquor 7 Roset Bar 1Montgomery 2 Jake's 19 Ruffs 1Moose 1 Knights of Columbus 3Other Side 2 Lakeside 8Our Place 1 Mingles 69Pat's Liquor 1 Monkey 1Roset Bar 1 Montgomery 12Sports Bar 6 Moose 1Spotted Horse 1 Other Side 16Towers West 2 Pat's Liquor 3
Prime Rib 2Roadhouse 1Sports Bar 2Sundance Bar 4Towers West 2
* Total of percents in Location of Consumption and Point of Sale categories may exceed 100% due to single arrests involving more than on location or point of sale.
Location of Alcohol Consumption and Point of Sale by Department
Location of Consumption Point of Sale
Bar Name Bar NameBar Name
Campbell County 12

Numbers by Department
CountyTotal
OffensesMisde-meanor Felony
Domestic Violence
Resist Arrest Assault
Public Intox
Alcohol Involved
DrugsInvolved
Traffic Crash Female Male
Unknown Gender
Average Age
Carbon County 814 684 83 40 14 71 20 440 119 58 136 648 30 32.35Baggs PD 12 11 1 11 12 34.50Carbon SO 81 59 13 6 2 12 2 37 12 8 13 66 2 32.73DCI 1 1 1 1 22.00Encampment PD 3 3 3 1 1 2 46.33Hanna Marshal's Office 1 1 1 1 1 50.00Hanna PD 4 4 4 1 3 42.75Manderson PD 1 1 1 24.00Other 4 3 1 2 1 3 36.00Rawlins PD 459 385 46 31 11 57 14 268 76 28 83 356 20 31.51Saratoga PD 15 14 1 13 1 1 6 9 39.21Sinclair PD 9 7 1 3 3 4 5 30.44WHP 224 197 20 1 1 2 4 97 29 17 27 190 7 32.99
Percents by Department *
CountyTotal
OffensesMisde-meanor Felony
Domestic Violence
Resist Arrest Assault
Public Intox
Alcohol Involved
DrugsInvolved
Traffic Crash Female Male
Unkown Gender
Carbon County 814 84.03% 10.20% 4.91% 1.72% 8.72% 2.46% 54.05% 14.62% 7.13% 16.71% 79.61% 3.69%Baggs PD 12 91.67% 8.33% 91.67% 100.00%Carbon SO 81 72.84% 16.05% 7.41% 2.47% 14.81% 2.47% 45.68% 14.81% 9.88% 16.05% 81.48% 2.47%DCI 1 100.00% 100.00% 100.00%Encampment PD 3 100.00% 100.00% 33.33% 33.33% 66.67%Hanna Marshal's Office 1 100.00% 100.00% 100.00% 100.00%Hanna PD 4 100.00% 100.00% 25.00% 75.00%Manderson PD 1 100.00% 100.00%Other 4 75.00% 25.00% 50.00% 25.00% 75.00%Rawlins PD 459 83.88% 10.02% 6.75% 2.40% 12.42% 3.05% 58.39% 16.56% 6.10% 18.08% 77.56% 4.36%Saratoga PD 15 93.33% 6.67% 86.67% 6.67% 6.67% 40.00% 60.00%Sinclair PD 9 77.78% 11.11% 33.33% 33.33% 44.44% 55.56%WHP 224 87.95% 8.93% 0.45% 0.45% 0.89% 1.79% 43.30% 12.95% 7.59% 12.05% 84.82% 3.13%
* Total percents may not equal 100 due to lack of information, or a single arrest involving multiple crimes.
Carbon County ArrestsOctober 1, 2007 - September 30, 2008
Carbon County 13

MIP Arrests Meth, Drugs & Public Intoxication
County DUI MIP % MIP Average County Total Meth Drugs Public Pub. Intox. Department Offenses Arrests to DUI MIP BAC Department Offenses Involved Involved Intox. Ave. BACCarbon County 293 12 4.10% 0.112 Carbon County 814 13 119 20 0.196Baggs PD 9 Baggs PD 12Carbon SO 14 1 7.14% 0.040 Carbon SO 81 3 12 2 0.107DCI DCI 1 1 1Encampment PD 3 Encampment PD 3Hanna Marshal's Office
Hanna Marshal's Office 1
Hanna PD 4 Hanna PD 4Manderson PD 1 Manderson PD 1Other 2 Other 4Rawlins PD 151 9 5.96% 0.115 Rawlins PD 459 4 76 14 0.226Saratoga PD 12 Saratoga PD 15 1Sinclair PD 3 1 33.33% Sinclair PD 9WHP 94 1 1.06% 0.170 WHP 224 5 29 4
DUI Arrests Traffic Crashes
County Total DUI % DUI Ave. DUI Involving% DUI
Involving County Traffic Alcohol % Alcohol Average Drugs % Drugs Department Offenses Offenses Of Total BAC Drugs Drugs Department Crashes Involved Involved BAC Involved InvolvedCarbon County 814 293 36.00% 0.164 23 7.85% Carbon County 58 37 63.79% 0.163 8 13.79%Baggs PD 12 9 75.00% 0.198 Baggs PDCarbon SO 81 14 17.28% 0.169 1 7.14% Carbon SO 8 7 87.50% 0.128 1 12.50%DCI 1 DCIEncampment PD 3 3 100.00% 0.142 Encampment PD 1 1 100.00% 0.164Hanna Marshal's Office 1
Hanna Marshal's Office
Hanna PD 4 4 100.00% Hanna PDManderson PD 1 1 100.00% Manderson PDOther 4 2 50.00% OtherRawlins PD 459 151 32.90% 0.172 16 10.60% Rawlins PD 28 18 64.29% 0.186 5 17.86%Saratoga PD 15 12 80.00% 0.245 Saratoga PD 1 1 100.00% 0.123Sinclair PD 9 3 33.33% Sinclair PD 3 1 33.33%WHP 224 94 41.96% 0.150 6 6.38% WHP 17 9 52.94% 0.169 2 11.76%
Underage DUI ArrestsCounty DUI Underage % DUI Ave. Drugs % DUI Department Offenses Offenses Of Total BAC Involved Drugs Inv.Carbon County 293 19 6.48% 0.175 1 5.26%Baggs PD 9Carbon SO 14DCIEncampment PD 3Hanna Marshal's OfficeHanna PD 4Manderson PD 1Other 2Rawlins PD 151 15 9.93% 0.176 1 6.67%Saratoga PD 12Sinclair PD 3 1 33.33%WHP 94 3 3.19% 0.170
Carbon County 14

Total Offenses Domestic Violence
County TotalNumber Involving
PercentInvolving
NumberInvolving
PercentInvolving County
Domestic Violence
Number Involving
PercentInvolving
NumberInvolving
PercentInvolving
Department Offenses Alcohol Alcohol Drugs Drugs Department Offenses Alcohol Alcohol Drugs DrugsCarbon County 814 440 54.05% 119 14.62% Carbon County 40 31 77.50% 5 12.50%Baggs PD 12 11 91.67% Baggs PDCarbon SO 81 37 45.68% 12 14.81% Carbon SO 6 5 83.33% 2 33.33%DCI 1 1 100.00% DCIEncampment PD 3 3 100.00% Encampment PDHanna Marshal's Office 1 1 100.00%
Hanna Marshal's Office 1 1 100.00%
Hanna PD 4 4 100.00% Hanna PDManderson PD 1 1 100.00% Manderson PDOther 4 2 50.00% OtherRawlins PD 459 268 58.39% 76 16.56% Rawlins PD 31 23 74.19% 3 9.68%Saratoga PD 15 13 86.67% 1 6.67% Saratoga PD 1 1 100.00%Sinclair PD 9 3 33.33% Sinclair PDWHP 224 97 43.30% 29 12.95% WHP 1 1 100.00%
Felony Offenses Resisting Arrest
County FelonyNumber Involving
PercentInvolving
NumberInvolving
PercentInvolving County
Resisting Arrest
Number Involving
PercentInvolving
NumberInvolving
PercentInvolving
Department Offenses Alcohol Alcohol Drugs Drugs Department Offenses Alcohol Alcohol Drugs DrugsCarbon County 83 20 24.10% 28 33.73% Carbon County 14 10 71.43% 7 50.00%Baggs PD 1 Baggs PDCarbon SO 13 2 15.38% Carbon SO 2 1 50.00% 1 50.00%DCI 1 1 100.00% DCIEncampment PD Encampment PDHanna Marshal's Office
Hanna Marshal's Office
Hanna PD Hanna PDManderson PD Manderson PDOther 1 OtherRawlins PD 46 15 32.61% 14 30.43% Rawlins PD 11 9 81.82% 3 27.27%Saratoga PD Saratoga PDSinclair PD 1 Sinclair PDWHP 20 3 15.00% 13 65.00% WHP 1
Misdemeanor Offenses Assault
CountyMisde-meanor
Number Involving
PercentInvolving
NumberInvolving
PercentInvolving County Assault
Number Involving
PercentInvolving
NumberInvolving
PercentInvolving
Department Offenses Alcohol Alcohol Drugs Drugs Department Offenses Alcohol Alcohol Drugs DrugsCarbon County 684 395 57.75% 82 11.99% Carbon County 71 39 54.93% 5 7.04%Baggs PD 11 11 100.00% Baggs PDCarbon SO 59 31 52.54% 8 13.56% Carbon SO 12 6 50.00% 1 8.33%DCI DCIEncampment PD 3 3 100.00% Encampment PDHanna Marshal's Office 1 1 100.00%
Hanna Marshal's Office
Hanna PD 4 4 100.00% Hanna PDManderson PD Manderson PDOther 3 2 66.67% OtherRawlins PD 385 237 61.56% 58 15.06% Rawlins PD 57 31 54.39% 4 7.02%Saratoga PD 14 15 107.14% 1 7.14% Saratoga PDSinclair PD 7 Sinclair PDWHP 197 91 46.19% 15 7.61% WHP 2 2 100.00%
Alcohol and Drug Involvement
Carbon County 15

Alcohol No Drive Liquor No Department Involved Home Bar Party Car Other Response Home Bar Up Party Store ResponseBaggs PD 11 1 7 1 1 1 1 7 3Carbon SO 37 9 14 5 3 2 3 14 1 3 3DCIEncampment PD 3 1 1 1 2 1 1Hanna Marshal's Office 1 1 1 1Hanna PD 4 3 1 3Manderson PD 1 1 1Other 2 1Rawlins PD 268 70 105 4 11 6 40 39 101 2 4 12 56Saratoga PD 13 2 1 1 6 1 1 2 7Sinclair PD 3 3 3WHP 97 8 35 3 15 12 15 2 34 3 10 29Carbon County Totals 440 91 172 13 31 21 64 46 167 2 8 28 99
Location of Alcohol Consumption
Dept.Number of
Reports Dept.Number of
Reports
Baggs PD Dixon Club 1Masterson PD Keg 1
Drifters Inn 6 Michael's Big City 14Carbon SO Days Inn 1 Office Bar 4
Desert Bar 1 Peppermill 35Dixon Club 2 Rifleman 15Michael's Big City 1 Sanford's 2Office Bar 1 Sportsman's Bar 2Peppermill 2 Tiko's Tavern 2Rifleman 1 Wyoming Bar 3
Skinny's 1 Sinclair PD Astro Lounge 1Sportsman's Bar 1 Corner Bar 1The Place 1 Michael's Big City 1Virginian 1 WHP Corner Bar 3
Encampment PD Bear Trap 1 Dingy Dan's 1Hanna Marshal's Dingy Dan's 1 Drifters Inn 1Hanna PD Dingy Dan's 1 Hole in the Wall 1
Skinny's 2 Keg 2Masterson PD Peppermill 1 Michael's Big City 3
Days Inn 1 Peppermill 14Elk's Lodge 1 Quality Inn 1Fat Boys' 1 Skinny's 2Hole in the Wall 7 Street Bar 1Hoot 'n' Howl 4
* Total of percents in Location of Consumption and Point of Sale categories may exceed 100% due to single arrests involving more than on location or point of sale.
Location of Alcohol Consumption and Point of Sale by Department
Location of Consumption Point of Sale
Bar Name Bar Name
Carbon County 16

Numbers by Department
CountyTotal
OffensesMisde-meanor Felony
Domestic Violence
Resist Arrest Assault
Public Intox
Alcohol Involved
DrugsInvolved
Traffic Crash Female Male
Unknown Gender
Average Age
Converse County 629 470 58 42 18 26 33 408 117 25 130 480 19 31.92Converse SO 183 141 16 7 3 5 1 98 55 4 38 139 6 34.31Douglas PD 277 183 29 23 10 12 11 185 38 14 64 209 4 30.34Glenrock PD 107 96 4 11 5 9 20 82 10 3 21 80 6 30.25Other 3 2 2 1 3 30.00WHP 59 50 7 1 41 13 4 7 49 3 35.59
Percents by Department *
CountyTotal
OffensesMisde-meanor Felony
Domestic Violence
Resist Arrest Assault
Public Intox
Alcohol Involved
DrugsInvolved
Traffic Crash Female Male
Unkown Gender
Converse County 629 74.72% 9.22% 6.68% 2.86% 4.13% 5.25% 64.86% 18.60% 3.97% 20.67% 76.31% 3.02%Converse SO 183 77.05% 8.74% 3.83% 1.64% 2.73% 0.55% 53.55% 30.05% 2.19% 20.77% 75.96% 3.28%Douglas PD 277 66.06% 10.47% 8.30% 3.61% 4.33% 3.97% 66.79% 13.72% 5.05% 23.10% 75.45% 1.44%Glenrock PD 107 89.72% 3.74% 10.28% 4.67% 8.41% 18.69% 76.64% 9.35% 2.80% 19.63% 74.77% 5.61%Other 3 66.67% 66.67% 33.33% 100.00%WHP 59 84.75% 11.86% 1.69% 69.49% 22.03% 6.78% 11.86% 83.05% 5.08%
* Total percents may not equal 100 due to lack of information, or a single arrest involving multiple crimes.
Converse County ArrestsOctober 1, 2007 - September 30, 2008
Converse County 17

MIP Arrests Meth, Drugs & Public Intoxication
County DUI MIP % MIP Average County Total Meth Drugs Public Pub. Intox. Department Offenses Arrests to DUI MIP BAC Department Offenses Involved Involved Intox. Ave. BACConverse County 246 46 18.70% 0.097 Converse County 629 21 117 33 0.218Converse SO 88 7 7.95% 0.023 Converse SO 183 10 55 1 0.265Douglas PD 96 23 23.96% 0.079 Douglas PD 277 3 38 11 0.185Glenrock PD 24 13 54.17% 0.156 Glenrock PD 107 2 10 20 0.231Other 1 Other 3 1 1WHP 37 3 8.11% 0.078 WHP 59 5 13 0.138
DUI Arrests Traffic Crashes
County Total DUI % DUI Ave.DUI
Involving% DUI
Involving County Traffic Alcohol % Alcohol Average Drugs % Drugs Department Offenses Offenses Of Total BAC Drugs Drugs Department Crashes Involved Involved BAC Involved InvolvedConverse County 629 246 39.11% 0.142 38 15.45% Converse County 25 19 76.00% 0.151 3 12.00%Converse SO 183 88 48.09% 0.135 21 23.86% Converse SO 4 4 100.00% 0.187Douglas PD 277 96 34.66% 0.015 10 10.42% Douglas PD 14 9 64.29% 0.129 3 21.43%Glenrock PD 107 24 22.43% 0.146 3 12.50% Glenrock PD 3 3 100.00% 0.133Other 3 1 33.33% OtherWHP 59 37 62.71% 0.141 4 10.81% WHP 4 3 75.00% 0.245
Underage DUI ArrestsCounty DUI Underage % DUI Ave. Drugs % DUI Department Offenses Offenses Of Total BAC Involved Drugs Inv.Converse County 246 15 6.10% 0.100 4 26.67%Converse SO 88 6 6.82% 0.090 2 33.33%Douglas PD 96 2 2.08% 0.118Glenrock PD 24 4 16.67% 0.116 1 25.00%Other 1WHP 37 3 8.11% 0.064 1 33.33%
Converse County 18

Total Offenses Domestic Violence
County TotalNumber Involving
PercentInvolving
NumberInvolving
PercentInvolving County
Domestic Violence
Number Involving
PercentInvolving
NumberInvolving
PercentInvolving
Department Offenses Alcohol Alcohol Drugs Drugs Department Offenses Alcohol Alcohol Drugs DrugsConverse County 629 408 64.86% 117 18.60% Converse County 42 22 52.38% 1 2.38%Converse SO 183 98 53.55% 55 30.05% Converse SO 7 3 42.86%Douglas PD 277 185 66.79% 38 13.72% Douglas PD 23 10 43.48% 1 4.35%Glenrock PD 107 82 76.64% 10 9.35% Glenrock PD 11 9 81.82%Other 3 2 66.67% 1 33.33% OtherWHP 59 41 69.49% 13 22.03% WHP 1
Felony Offenses Resisting Arrest
County FelonyNumber Involving
PercentInvolving
NumberInvolving
PercentInvolving County
Resisting Arrest
Number Involving
PercentInvolving
NumberInvolving
PercentInvolving
Department Offenses Alcohol Alcohol Drugs Drugs Department Offenses Alcohol Alcohol Drugs DrugsConverse County 58 11 18.97% 25 43.10% Converse County 18 15 83.33% 2 11.11%Converse SO 16 10 62.50% Converse SO 3 1 33.33%Douglas PD 29 8 27.59% 6 20.69% Douglas PD 10 9 90.00%Glenrock PD 4 1 25.00% 2 50.00% Glenrock PD 5 5 100.00% 2 40.00%Other 2 1 50.00% 1 50.00% OtherWHP 7 1 14.29% 6 85.71% WHP
Misdemeanor Offenses Assault
CountyMisde-meanor
Number Involving
PercentInvolving
NumberInvolving
PercentInvolving County Assault
Number Involving
PercentInvolving
NumberInvolving
PercentInvolving
Department Offenses Alcohol Alcohol Drugs Drugs Department Offenses Alcohol Alcohol Drugs DrugsConverse County 470 318 67.66% 91 19.36% Converse County 26 16 61.54% 0Converse SO 141 78 55.32% 46 32.62% Converse SO 5 3 60.00%Douglas PD 183 128 69.95% 27 14.75% Douglas PD 12 6 50.00%Glenrock PD 96 74 77.08% 9 9.38% Glenrock PD 9 7 77.78%Other OtherWHP 50 38 76.00% 9 18.00% WHP
Alcohol and Drug Involvement
Converse County 19

Alcohol No Drive Liquor No Department Involved Home Bar Party Car Other Response Home Bar Up Party Store ResponseConverse SO 98 15 37 10 19 8 6 6 41 3 6 10 21Douglas PD 185 34 90 10 11 15 19 11 89 12 43Glenrock PD 82 15 29 11 6 3 14 13 31 1 6 2 17Other 2 1WHP 41 4 13 4 6 9 6 5 12 5 4 12Converse County Totals 408 68 169 35 42 36 45 35 173 4 17 28 93
Location of Alcohol Consumption
Dept.Number of
Reports Dept.Number of
Reports
Converse SO 4 Aces 2Douglas PD La Bonte 44
Applebee's 1 North Gate 3Bruce's 1 Old Chicago 1Butch's 1 Plains 1Chutes 1 Sunset 1College Inn 1 Waterhole 23Knotty Pine 1 Glenrock 4 Aces 10La Bonte 7 Deer Creek Bar 1Plains 1 Knotty Pine 8Shoreliner 1 Shoreliner 3Taylor's 1 WHP 4 Aces 1Tony's 1 Bowling Alley 1Waterhole 8 Butch's 1
Douglas PD Best Western 1 Deer Creek Bar 1Chutes 7 La Bonte 1College Inn 4 North Gate 1Curtains 1 Shoreliner 1Douglas Liquor 1
* Total of percents in Location of Consumption and Point of Sale categories may exceed 100% due to single arrests involving more than on location or point of sale.
Location of Alcohol Consumption and Point of Sale by Department
Location of Consumption Point of Sale
Bar Name Bar Name
Converse County 20

Numbers by Department
CountyTotal
OffensesMisde-meanor Felony
Domestic Violence
Resist Arrest Assault
Public Intox
Alcohol Involved
DrugsInvolved
Traffic Crash Female Male
Unknown Gender
Average Age
Crook County 140 120 3 9 4 6 22 130 5 13 17 121 2 35.70Crook SO 36 32 2 3 1 3 1 31 5 31 35.17Game & Fish 1 1 1 1 28.00Hulett PD 3 3 1 3 3 25.00Moorcroft PD 15 14 1 3 1 1 7 14 2 13 43.93Other 11 8 1 4 11 1 10 30.73State Parks 10 7 7 9 1 2 8 30.50Sundance PD 15 13 2 1 1 3 15 1 1 2 12 1 34.57WHP 49 42 1 46 3 12 5 43 1 37.09
Percents by Department *
CountyTotal
OffensesMisde-meanor Felony
Domestic Violence
Resist Arrest Assault
Public Intox
Alcohol Involved
DrugsInvolved
Traffic Crash Female Male
Unkown Gender
Crook County 140 85.71% 2.14% 6.43% 2.86% 4.29% 15.71% 92.86% 3.57% 9.29% 12.14% 86.43% 1.43%Crook SO 36 88.89% 5.56% 8.33% 2.78% 8.33% 2.78% 86.11% 13.89% 86.11%Game & Fish 1 100.00% 100.00% 100.00%Hulett PD 3 100.00% 33.33% 100.00% 100.00%Moorcroft PD 15 93.33% 6.67% 20.00% 6.67% 6.67% 46.67% 93.33% 13.33% 86.67%Other 11 72.73% 9.09% 36.36% 100.00% 9.09% 90.91%State Parks 10 70.00% 70.00% 90.00% 10.00% 20.00% 80.00%Sundance PD 15 86.67% 13.33% 6.67% 6.67% 20.00% 100.00% 6.67% 6.67% 13.33% 80.00% 6.67%WHP 49 85.71% 2.04% 93.88% 6.12% 24.49% 10.20% 87.76% 2.04%
* Total percents may not equal 100 due to lack of information, or a single arrest involving multiple crimes.
Crook County ArrestsOctober 1, 2007 - September 30, 2008
Crook County 21

MIP Arrests Meth, Drugs & Public Intoxication
County DUI MIP % MIP Average County Total Meth Drugs Public Pub. Intox. Department Offenses Arrests to DUI MIP BAC Department Offenses Involved Involved Intox. Ave. BACCrook County 81 8 9.88% 0.060 Crook County 140 0 5 22 0.214Crook SO 19 6 31.58% 0.060 Crook SO 36 1Game & Fish Game & Fish 1Hulett PD Hulett PD 3Moorcroft PD 3 Moorcroft PD 15 7 0.156Other 6 Other 11 4State Parks 2 2 100.00% State Parks 10 1 7 0.330Sundance PD 8 Sundance PD 15 1 3WHP 43 WHP 49 3
DUI Arrests Traffic Crashes
County Total DUI % DUI Ave.DUI
Involving% DUI
Involving County Traffic Alcohol % Alcohol Average Drugs % Drugs Department Offenses Offenses Of Total BAC Drugs Drugs Department Crashes Involved Involved BAC Involved InvolvedCrook County 140 81 57.86% 0.168 0 Crook County 13 11 84.62% 0.165 2 15.38%Crook SO 36 19 52.78% 0.199 Crook SOGame & Fish 1 Game & FishHulett PD 3 Hulett PDMoorcroft PD 15 3 20.00% 0.181 Moorcroft PDOther 11 6 54.55% 0.125 OtherState Parks 10 2 20.00% State ParksSundance PD 15 8 53.33% 0.185 Sundance PD 1 1 100.00% 0.150WHP 49 43 87.76% 0.174 WHP 12 10 83.33% 0.168 2 16.67%
Underage DUI ArrestsCounty DUI Underage % DUI Ave. Drugs % DUI Department Offenses Offenses Of Total BAC Involved Drugs Inv.Crook County 81 3 3.70% - 0Crook SO 19Game & FishHulett PDMoorcroft PD 3Other 6State Parks 2 1 50.00%Sundance PD 8 1 12.50%WHP 43 1 2.33%
Crook County 22

Total Offenses Domestic Violence
County TotalNumber Involving
PercentInvolving
NumberInvolving
PercentInvolving County
Domestic Violence
Number Involving
PercentInvolving
NumberInvolving
PercentInvolving
Department Offenses Alcohol Alcohol Drugs Drugs Department Offenses Alcohol Alcohol Drugs DrugsCrook County 140 130 92.86% 5 3.57% Crook County 9 8 88.89% 1 11.11%Crook SO 36 31 86.11% Crook SO 3 2 66.67%Game & Fish 1 1 100.00% Game & FishHulett PD 3 3 100.00% Hulett PDMoorcroft PD 15 14 93.33% Moorcroft PD 3 3 100.00%Other 11 11 100.00% OtherState Parks 10 9 90.00% 1 10.00% State ParksSundance PD 15 15 100.00% 1 6.67% Sundance PD 2 2 100.00%WHP 49 46 93.88% 3 6.12% WHP 1 1 100.00% 1 100.00%
Felony Offenses Resisting Arrest
County FelonyNumber Involving
PercentInvolving
NumberInvolving
PercentInvolving County
Resisting Arrest
Number Involving
PercentInvolving
NumberInvolving
PercentInvolving
Department Offenses Alcohol Alcohol Drugs Drugs Department Offenses Alcohol Alcohol Drugs DrugsCrook County 3 3 100.00% 0 Crook County 4 4 100.00% 0Crook SO 2 2 100.00% Crook SO 1 1 100.00%Game & Fish Game & FishHulett PD Hulett PDMoorcroft PD 1 1 100.00% Moorcroft PD 1 1 100.00%Other Other 1 1 100.00%State Parks State ParksSundance PD Sundance PD 1 1 100.00%WHP WHP
Misdemeanor Offenses Assault
CountyMisde-meanor
Number Involving
PercentInvolving
NumberInvolving
PercentInvolving County Assault
Number Involving
PercentInvolving
NumberInvolving
PercentInvolving
Department Offenses Alcohol Alcohol Drugs Drugs Department Offenses Alcohol Alcohol Drugs DrugsCrook County 120 111 92.50% 3 2.50% Crook County 6 4 66.67% 0Crook SO 32 27 84.38% Crook SO 3 2 66.67%Game & Fish 1 1 100.00% Game & FishHulett PD 3 3 100.00% Hulett PD 1 1 100.00%Moorcroft PD 14 13 92.86% Moorcroft PD 1Other 8 8 100.00% OtherState Parks 7 7 100.00% State ParksSundance PD 13 13 100.00% Sundance PD 1 1 100.00%WHP 42 39 92.86% 3 7.14% WHP
Alcohol and Drug Involvement
Crook County 23

Alcohol No Drive Liquor No Department Involved Home Bar Party Car Other Response Home Bar Up Party Store ResponseCrook SO 31 5 13 4 2 5 2 13 4 1 7Game & Fish 1 1 1Hulett PD 3 1 2 3Moorcroft PD 14 2 7 3 1 9 4Other 11 2 9 1 2 7State Parks 9 2 2 7 1 7Sundance PD 15 1 7 2 2 3 8 7WHP 46 3 15 4 5 4 11 2 19 3 2 15Crook County Totals 130 14 42 10 11 25 22 5 49 0 8 6 51
Location of Alcohol Consumption
Dept.Number of
ReportsCrook SO Beulah Bar 1
Crook Co. Saloon 1Dewey's 2Dugon's 1Ft. Devil's Tower 1R Place 1Sand Cr. Trading 2Turf 3
Moorcroft PD Dewey's 6Hopper's Bar 1
Sundance PD Dime Bar 2Longhorn Bar 1Turf 4
WHP Bryan's Place 2Crook Co. Saloon 1Dewey's 3Fireside in Gillette 1Hopper's Bar 1Hulett 1Jake's 1Monkey 1Moorcroft 1R Place 2
* Total of percents in Location of Consumption and Point of Sale categories may exceed 100% due to single arrests involving more than on location or point of sale.
Location of Alcohol Consumption and Point of Sale by Department
Location of Consumption Point of Sale
Bar Name
Crook County 24

Numbers by Department
CountyTotal
OffensesMisde-meanor Felony
Domestic Violence
Resist Arrest Assault
Public Intox
Alcohol Involved
DrugsInvolved
Traffic Crash Female Male
Unknown Gender
Average Age
Fremont County 1279 1056 57 55 69 56 161 1008 66 69 297 938 44 32.35Fremont SO 441 357 32 22 13 21 11 290 25 32 114 322 5 32.50Lander PD 275 221 6 19 10 14 58 205 26 15 59 211 5 32.67Other 20 13 5 1 3 5 1 7 1 7 11 2 29.33Riverton PD 377 331 4 12 39 12 84 373 6 13 94 278 5 32.03Shoshoni PD 7 6 1 4 1 1 1 6 30.14WHP 119 94 7 1 3 100 6 7 22 96 1 36.80WRPD 40 34 3 1 2 4 4 29 1 1 14 26 16.90
Percents by Department *
CountyTotal
OffensesMisde-meanor Felony
Domestic Violence
Resist Arrest Assault
Public Intox
Alcohol Involved
DrugsInvolved
Traffic Crash Female Male
Unkown Gender
Fremont County 1279 82.56% 4.46% 4.30% 5.39% 4.38% 12.59% 78.81% 5.16% 5.39% 23.22% 73.34% 3.44%Fremont SO 441 80.95% 7.26% 4.99% 2.95% 4.76% 2.49% 65.76% 5.67% 7.26% 25.85% 73.02% 1.13%Lander PD 275 80.36% 2.18% 6.91% 3.64% 5.09% 21.09% 74.55% 9.45% 5.45% 21.45% 76.73% 1.82%Other 20 65.00% 25.00% 5.00% 15.00% 25.00% 5.00% 35.00% 5.00% 35.00% 55.00% 10.00%Riverton PD 377 87.80% 1.06% 3.18% 10.34% 3.18% 22.28% 98.94% 1.59% 3.45% 24.93% 73.74% 1.33%Shoshoni PD 7 85.71% 14.29% 57.14% 14.29% 14.29% 14.29% 85.71%WHP 119 78.99% 5.88% 0.84% 2.52% 84.03% 5.04% 5.88% 18.49% 80.67% 0.84%WRPD 40 85.00% 7.50% 2.50% 5.00% 10.00% 10.00% 72.50% 2.50% 2.50% 35.00% 65.00%
* Total percents may not equal 100 due to lack of information, or a single arrest involving multiple crimes.
Fremont County ArrestsOctober 1, 2007 - September 30, 2008
Fremont County ArrestsOctober 1, 2007 - September 30, 2008
Fremont County 25

MIP Arrests Meth, Drugs & Public Intoxication
County DUI MIP % MIP Average County Total Meth Drugs Public Pub. Intox. Department Offenses Arrests to DUI MIP BAC Department Offenses Involved Involved Intox. Ave. BACFremont County 540 90 16.67% 0.137 Fremont County 1279 10 66 161 0.256Fremont SO 167 14 8.38% 0.139 Fremont SO 441 4 25 11 0.214Lander PD 72 13 18.06% 0.120 Lander PD 275 2 26 58 0.217Other 1 3 300.00% Other 20 1 1 0.050Riverton PD 198 40 20.20% 0.136 Riverton PD 377 1 6 84 0.286Shoshoni PD 3 Shoshoni PD 7 1WHP 93 1 1.08% 0.166 WHP 119 3 6 3 0.131WRPD 6 19 316.67% 0.147 WRPD 40 1 4 0.147
DUI Arrests Traffic Crashes
County Total DUI % DUI Ave.DUI
Involving% DUI
Involving County Traffic Alcohol % Alcohol Average Drugs % Drugs Department Offenses Offenses Of Total BAC Drugs Drugs Department Crashes Involved Involved BAC Involved InvolvedFremont County 1279 540 42.22% 0.161 21 3.89% Fremont County 69 66 95.65% 0.186 6 8.70%Fremont SO 441 167 37.87% 0.163 7 4.19% Fremont SO 32 31 96.88% 0.196 2 6.25%Lander PD 275 72 26.18% 0.151 11 15.28% Lander PD 15 14 93.33% 0.156 3 20.00%Other 20 1 5.00% OtherRiverton PD 377 198 52.52% 0.168 2 1.01% Riverton PD 13 13 100.00% 0.212Shoshoni PD 7 3 42.86% 0.203 Shoshoni PD 1 1 100.00%WHP 119 93 78.15% 0.152 1 1.08% WHP 7 6 85.71% 0.170 1 14.29%WRPD 40 6 15.00% 0.118 WRPD 1 1 100.00% 0.099
Underage DUI ArrestsCounty DUI Underage % DUI Ave. Drugs % DUI Department Offenses Offenses Of Total BAC Involved Drugs Inv.Fremont County 540 45 8.33% 0.126 0 0.00%Fremont SO 167 9 5.39% 0.126Lander PD 72 9 12.50% 0.140Other 1 1 100.00%Riverton PD 198 18 9.09% 0.121Shoshoni PD 3WHP 93 4 4.30% 0.121WRPD 6 4 66.67% 0.140
Fremont County 26

Total Offenses Domestic Violence
County TotalNumber Involving
PercentInvolving
NumberInvolving
PercentInvolving County
Domestic Violence
Number Involving
PercentInvolving
NumberInvolving
PercentInvolving
Department Offenses Alcohol Alcohol Drugs Drugs Department Offenses Alcohol Alcohol Drugs DrugsFremont County 1279 1008 78.81% 66 5.16% Fremont County 55 39 70.91% 0 0.00%Fremont SO 441 290 65.76% 25 5.67% Fremont SO 22 15 68.18%Lander PD 275 205 74.55% 26 9.45% Lander PD 19 11 57.89%Other 20 7 35.00% 1 5.00% Other 1Riverton PD 377 373 98.94% 6 1.59% Riverton PD 12 12 100.00%Shoshoni PD 7 4 57.14% 1 14.29% Shoshoni PDWHP 119 100 84.03% 6 5.04% WHPWRPD 40 29 72.50% 1 2.50% WRPD 1 1 100.00%
Felony Offenses Resisting Arrest
County FelonyNumber Involving
PercentInvolving
NumberInvolving
PercentInvolving County
Resisting Arrest
Number Involving
PercentInvolving
NumberInvolving
PercentInvolving
Department Offenses Alcohol Alcohol Drugs Drugs Department Offenses Alcohol Alcohol Drugs DrugsFremont County 57 17 29.82% 7 12.28% Fremont County 69 63 91.30% 8 11.59%Fremont SO 32 6 18.75% 3 9.38% Fremont SO 13 11 84.62% 2 15.38%Lander PD 6 2 33.33% 2 33.33% Lander PD 10 10 100.00% 1 10.00%Other 5 2 40.00% Other 3 1 33.33% 1 33.33%Riverton PD 4 4 100.00% 1 25.00% Riverton PD 39 38 97.44% 3 7.69%Shoshoni PD Shoshoni PD 1 1 100.00%WHP 7 2 28.57% 1 14.29% WHP 1 1 100.00%WRPD 3 1 33.33% WRPD 2 2 100.00%
Misdemeanor Offenses Assault
CountyMisde-meanor
Number Involving
PercentInvolving
NumberInvolving
PercentInvolving County Assault
Number Involving
PercentInvolving
NumberInvolving
PercentInvolving
Department Offenses Alcohol Alcohol Drugs Drugs Department Offenses Alcohol Alcohol Drugs DrugsFremont County 1056 866 82.01% 49 4.64% Fremont County 56 34 60.71% 2 3.57%Fremont SO 357 256 71.71% 21 5.88% Fremont SO 21 14 66.67% 1 4.76%Lander PD 221 165 74.66% 16 7.24% Lander PD 14 7 50.00% 1 7.14%Other 13 5 38.46% 1 7.69% Other 5 1 20.00%Riverton PD 331 328 99.09% 4 1.21% Riverton PD 12 11 91.67%Shoshoni PD 6 4 66.67% 1 16.67% Shoshoni PDWHP 94 82 87.23% 5 5.32% WHPWRPD 34 26 76.47% 1 2.94% WRPD 4 1 25.00%
Alcohol and Drug Involvement
Fremont County 27
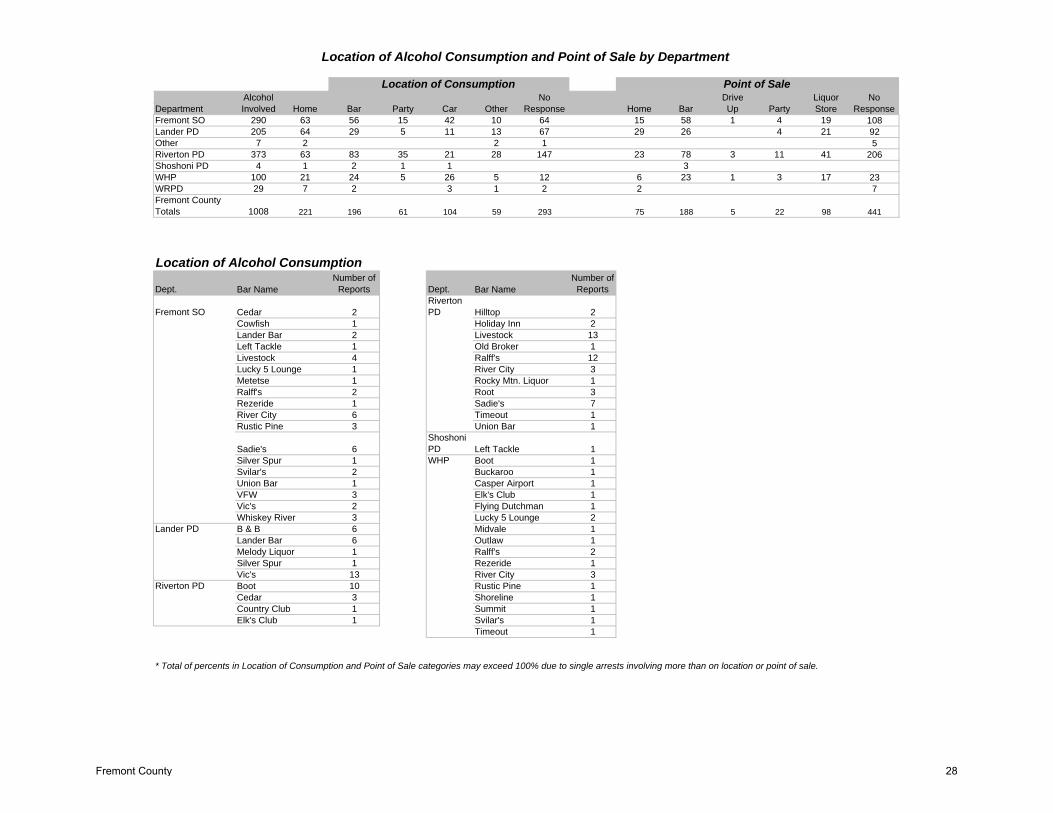
Alcohol No Drive Liquor No Department Involved Home Bar Party Car Other Response Home Bar Up Party Store ResponseFremont SO 290 63 56 15 42 10 64 15 58 1 4 19 108Lander PD 205 64 29 5 11 13 67 29 26 4 21 92Other 7 2 2 1 5Riverton PD 373 63 83 35 21 28 147 23 78 3 11 41 206Shoshoni PD 4 1 2 1 1 3WHP 100 21 24 5 26 5 12 6 23 1 3 17 23WRPD 29 7 2 3 1 2 2 7Fremont County Totals 1008 221 196 61 104 59 293 75 188 5 22 98 441
Location of Alcohol Consumption
Dept.Number of
Reports Dept.Number of
Reports
Fremont SO Cedar 2Riverton PD Hilltop 2
Cowfish 1 Holiday Inn 2Lander Bar 2 Livestock 13Left Tackle 1 Old Broker 1Livestock 4 Ralff's 12Lucky 5 Lounge 1 River City 3Metetse 1 Rocky Mtn. Liquor 1Ralff's 2 Root 3Rezeride 1 Sadie's 7River City 6 Timeout 1Rustic Pine 3 Union Bar 1
Sadie's 6Shoshoni PD Left Tackle 1
Silver Spur 1 WHP Boot 1Svilar's 2 Buckaroo 1Union Bar 1 Casper Airport 1VFW 3 Elk's Club 1Vic's 2 Flying Dutchman 1Whiskey River 3 Lucky 5 Lounge 2
Lander PD B & B 6 Midvale 1Lander Bar 6 Outlaw 1Melody Liquor 1 Ralff's 2Silver Spur 1 Rezeride 1Vic's 13 River City 3
Riverton PD Boot 10 Rustic Pine 1Cedar 3 Shoreline 1Country Club 1 Summit 1Elk's Club 1 Svilar's 1
Timeout 1
* Total of percents in Location of Consumption and Point of Sale categories may exceed 100% due to single arrests involving more than on location or point of sale.
Location of Alcohol Consumption and Point of Sale by Department
Location of Consumption Point of Sale
Bar Name Bar Name
Fremont County 28

Numbers by Department
CountyTotal
OffensesMisde-meanor Felony
Domestic Violence
Resist Arrest Assault
Public Intox
Alcohol Involved
DrugsInvolved
Traffic Crash Female Male
Unknown Gender
Average Age
Fremont Co. Alcohol Crisis Ctr. 3122 2473 1 7 8 5 2399 2985 14 6 614 2426 82 38.99Court 36 10 2 1 9 15 1 7 29 31.89ER 81 8 8 76 2 2 15 62 4 40.35Fremont SO 137 132 1 1 1 134 136 1 35 97 5 36.17No. Chey. Recovery 17 3 7 10 36.94Other 53 13 13 30 18 33 2 35.77Probation & Parole 19 3 1 8 2 4 15 36.89Riverton PD 1869 1806 4 6 3 1729 1860 5 2 357 1479 33 40.02Self/Family/Friend 412 17 17 360 3 73 312 27 42.68WHP 17 16 16 17 16 38.53WRPD 481 468 2 472 480 1 1 98 373 11 33.44
Percents by Department *
CountyTotal
OffensesMisde-meanor Felony
Domestic Violence
Resist Arrest Assault
Public Intox
Alcohol Involved
DrugsInvolved
Traffic Crash Female Male
Unkown Gender
Fremont Co. Alcohol Crisis Ctr. 3122 79.21% 0.03% 0.22% 0.26% 0.16% 76.84% 95.61% 0.45% 0.19% 19.67% 77.71% 2.63%Court 36 27.78% 5.56% 2.78% 25.00% 41.67% 2.78% 19.44% 80.56%ER 81 9.88% 9.88% 93.83% 2.47% 2.47% 18.52% 76.54% 4.94%Fremont SO 137 96.35% 0.73% 0.73% 0.73% 97.81% 99.27% 0.73% 25.55% 70.80% 3.65%No. Chey. Recovery 17 17.65% 41.18% 58.82%Other 53 24.53% 24.53% 56.60% 33.96% 62.26% 3.77%Probation & Parole 19 15.79% 5.26% 42.11% 10.53% 21.05% 78.95%Riverton PD 1869 96.63% 0.21% 0.32% 0.16% 92.51% 99.52% 0.27% 0.11% 19.10% 79.13% 1.77%Self/Family/Friend 412 4.13% 4.13% 87.38% 0.73% 17.72% 75.73% 6.55%WHP 17 94.12% 94.12% 100.00% 94.12%WRPD 481 97.30% 0.42% 98.13% 99.79% 0.21% 0.21% 20.37% 77.55% 2.29%
* Total percents may not equal 100 due to lack of information, or a single arrest involving multiple crimes.
Fremont County Alcohol Crisis Center ArrestsOctober 1, 2007 - September 30, 2008
Fremont County Alcohol Crisis Center 29

MIP Arrests Meth, Drugs & Public Intoxication
County DUI MIP % MIP Average County Total Meth Drugs Public Pub. Intox. Department Offenses Arrests to DUI MIP BAC Department Offenses Involved Involved Intox. Ave. BACFCACC 105 58 55.24% 0.146 FCACC 3122 8 14 2399 0.241Court 2 0.080 Court 36 1 1 9 0.118ER ER 81 1 2 8 0.236Fremont SO 1 0.190 Fremont SO 137 134 0.226
No. Chey. Recovery No. Chey. Recovery 17Other Other 53 13 0.271Probation & Parole 1 Probation & Parole 19 1 2 1 0.270Riverton PD 105 44 41.90% 0.139 Riverton PD 1869 2 5 1729 0.247Self/Family/Friend Self/Family/Friend 412 2 3 17 0.183WHP WHP 17 16 0.268WRPD 10 0.177 WRPD 481 1 1 472 0.226
DUI Arrests Traffic Crashes
County Total DUI % DUI Ave.DUI
Involving% DUI
Involving County Traffic Alcohol % Alcohol Average Drugs % Drugs Department Offenses Offenses Of Total BAC Drugs Drugs Department Crashes Involved Involved BAC Involved InvolvedFCACC 3122 105 3.36% 0.141 0 0.00% FCACC 6 6 100.00% 0.162 0 0.00%Court 36 CourtER 81 ER 2 2 100.00% 0.200Fremont SO 137 Fremont SO 1 1 100.00% 0.240
No. Chey. Recovery 17 No. Chey. RecoveryOther 53 OtherProbation & Parole 19 Probation & ParoleRiverton PD 1869 105 5.62% 0.141 Riverton PD 2 2 100.00% 0.075Self/Family/Friend 412 Self/Family/FriendWHP 17 WHPWRPD 481 WRPD 1 1 100.00% 0.180
Underage DUI ArrestsCounty DUI Underage % DUI Ave. Drugs % DUI Department Offenses Offenses Of Total BAC Involved Drugs Inv.FCACC 105 6 5.71% 0.137 0 0.00%CourtERFremont SO
No. Chey. RecoveryOtherProbation & ParoleRiverton PD 105 3 2.86% 0.137Self/Family/FriendWHPWRPD
Fremont County Alcohol Crisis Center 30

Total Offenses Domestic Violence
County TotalNumber Involving
PercentInvolving
NumberInvolving
PercentInvolving County
Domestic Violence
Number Involving
PercentInvolving
NumberInvolving
PercentInvolving
Department Offenses Alcohol Alcohol Drugs Drugs Department Offenses Alcohol Alcohol Drugs DrugsFCACC 3122 2985 95.61% 14 0.45% FCACC 7 7 100.00% 0 0.00%Court 36 15 41.67% 1 2.78% CourtER 81 76 93.83% 2 2.47% ERFremont SO 137 136 99.27% Fremont SO 1 1 100.00%
No. Chey. Recovery 17 3 17.65% No. Chey. RecoveryOther 53 30 56.60% OtherProbation & Parole 19 8 42.11% 2 10.53% Probation & ParoleRiverton PD 1869 1860 99.52% 5 0.27% Riverton PD 4 4 100.00%Self/Family/Friend 412 360 87.38% 3 0.73% Self/Family/FriendWHP 17 17 100.00% WHPWRPD 481 480 99.79% 1 0.21% WRPD 2 2 100.00%
Felony Offenses Resisting Arrest
County FelonyNumber Involving
PercentInvolving
NumberInvolving
PercentInvolving County
Resisting Arrest
Number Involving
PercentInvolving
NumberInvolving
PercentInvolving
Department Offenses Alcohol Alcohol Drugs Drugs Department Offenses Alcohol Alcohol Drugs DrugsFCACC 1 0 0.00% 0 0.00% FCACC 8 7 87.50% 0 0.00%Court Court 2 1 50.00%ER ERFremont SO 1 Fremont SO
No. Chey. Recovery No. Chey. RecoveryOther OtherProbation & Parole Probation & ParoleRiverton PD Riverton PD 6 6 100.00%Self/Family/Friend Self/Family/FriendWHP WHPWRPD WRPD
Misdemeanor Offenses Assault
CountyMisde-meanor
Number Involving
PercentInvolving
NumberInvolving
PercentInvolving County Assault
Number Involving
PercentInvolving
NumberInvolving
PercentInvolving
Department Offenses Alcohol Alcohol Drugs Drugs Department Offenses Alcohol Alcohol Drugs DrugsFCACC 2473 2467 99.76% 7 0.28% FCACC 5 3 60.00% 0 0.00%Court 10 8 80.00% 1 10.00% Court 1ER 8 8 100.00% ERFremont SO 132 132 100.00% Fremont SO 1
No. Chey. Recovery No. Chey. RecoveryOther 13 11 84.62% OtherProbation & Parole 3 2 66.67% 1 33.33% Probation & ParoleRiverton PD 1806 1806 100.00% 4 0.22% Riverton PD 3 3 100.00%Self/Family/Friend 17 17 100.00% Self/Family/FriendWHP 16 16 100.00% WHPWRPD 468 467 99.79% 1 0.21% WRPD
Alcohol and Drug Involvement
Fremont County Alcohol Crisis Center 31

Alcohol No Drive Liquor No Department Involved Home Bar Party Car Other Response Home Bar Up Party Store ResponseCourt 15 2 1 12 2 1 12ER 76 3 1 7 64 1 1 5 68Fremont SO 136 10 2 1 8 4 111 1 2 1 1 21 109No. Chey. Recovery 3 2 2Other 30 4 2 1 1 1 20 3 1 25
Probation & Parole 8 1 1 6 1 7Riverton PD 1860 38 51 24 66 118 1567 5 45 6 14 248 1528
Self/Family/Friend 360 42 5 1 8 14 286 2 3 1 47 295WHP 17 2 1 14 2 15WRPD 480 32 2 3 5 11 426 5 3 2 9 28 433FCACC Totals 2985 130 62 33 90 158 2508 14 56 10 28 353 2494
Location of Alcohol Consumption
Dept.Number of
ReportsFremont SO Boot 1
River City 1Other Holiday Inn 1
Moonlight 1Riverton PD Boot 3
Cedar 6Country Club 1Depot 1Discount Liquor 1Livestock 2Ralph's 3River City 14Sadie's 1Stockman's 1Time Out 4T's 1
Self/Family/Friend Ralph's 2River City 2
WRPD Barl 1River City 1
* Total of percents in Location of Consumption and Point of Sale categories may exceed 100% due to single arrests involving more than on location or point of sale.
Location of Alcohol Consumption and Point of Sale by Department
Location of Consumption Point of Sale
Bar Name
Fremont County Alcohol Crisis Center 32

Numbers by Department
CountyTotal
OffensesMisde-meanor Felony
Domestic Violence
Resist Arrest Assault
Public Intox
Alcohol Involved
DrugsInvolved
Traffic Crash Female Male
Unknown Gender
Average Age
Goshen County 220 170 28 22 19 19 30 161 14 7 40 179 1 32.45Goshen SO 41 31 12 9 2 2 22 2 1 6 35 31.78Lingle PD 5 4 1 1 4 1 4 27.20Other 4 3 1 1 1 1 1 1 1 3 41.25Torrington PD 149 113 14 12 17 16 27 117 10 5 26 122 1 31.86WHP 21 19 1 17 1 1 6 15 37.14
Percents by Department *
CountyTotal
OffensesMisde-meanor Felony
Domestic Violence
Resist Arrest Assault
Public Intox
Alcohol Involved
DrugsInvolved
Traffic Crash Female Male
Unkown Gender
Goshen County 220 77.27% 12.73% 10.00% 8.64% 8.64% 13.64% 73.18% 6.36% 3.18% 18.18% 81.36% 0.45%Goshen SO 41 75.61% 29.27% 21.95% 4.88% 4.88% 53.66% 4.88% 2.44% 14.63% 85.37%Lingle PD 5 80.00% 20.00% 20.00% 80.00% 20.00% 80.00%Other 4 75.00% 25.00% 25.00% 25.00% 25.00% 25.00% 25.00% 25.00% 75.00%Torrington PD 149 75.84% 9.40% 8.05% 11.41% 10.74% 18.12% 78.52% 6.71% 3.36% 17.45% 81.88% 0.67%WHP 21 90.48% 4.76% 80.95% 4.76% 4.76% 28.57% 71.43%
* Total percents may not equal 100 due to lack of information, or a single arrest involving multiple crimes.
Goshen County ArrestsOctober 1, 2007 - September 30, 2008
Goshen County 33
MIP Arrests Meth, Drugs & Public Intoxication
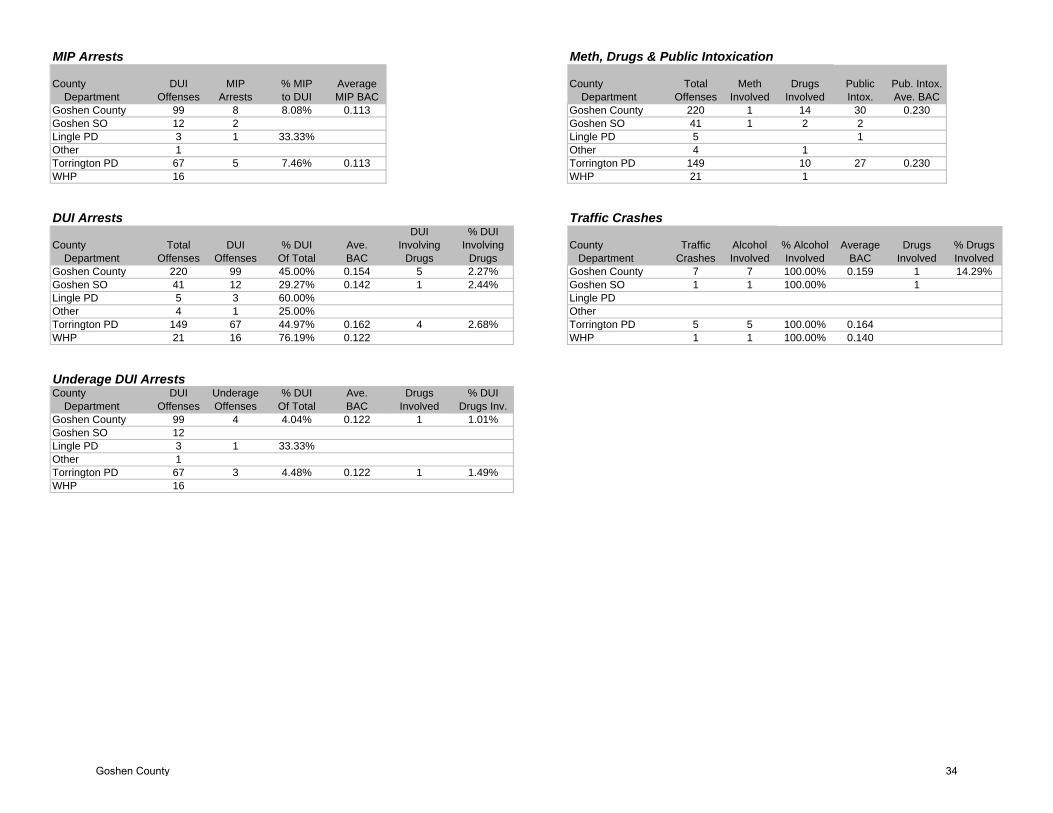
County DUI MIP % MIP Average County Total Meth Drugs Public Pub. Intox. Department Offenses Arrests to DUI MIP BAC Department Offenses Involved Involved Intox. Ave. BACGoshen County 99 8 8.08% 0.113 Goshen County 220 1 14 30 0.230Goshen SO 12 2 Goshen SO 41 1 2 2Lingle PD 3 1 33.33% Lingle PD 5 1Other 1 Other 4 1Torrington PD 67 5 7.46% 0.113 Torrington PD 149 10 27 0.230WHP 16 WHP 21 1
DUI Arrests Traffic Crashes
County Total DUI % DUI Ave.DUI
Involving% DUI
Involving County Traffic Alcohol % Alcohol Average Drugs % Drugs Department Offenses Offenses Of Total BAC Drugs Drugs Department Crashes Involved Involved BAC Involved InvolvedGoshen County 220 99 45.00% 0.154 5 2.27% Goshen County 7 7 100.00% 0.159 1 14.29%Goshen SO 41 12 29.27% 0.142 1 2.44% Goshen SO 1 1 100.00% 1Lingle PD 5 3 60.00% Lingle PDOther 4 1 25.00% OtherTorrington PD 149 67 44.97% 0.162 4 2.68% Torrington PD 5 5 100.00% 0.164WHP 21 16 76.19% 0.122 WHP 1 1 100.00% 0.140
Underage DUI ArrestsCounty DUI Underage % DUI Ave. Drugs % DUI Department Offenses Offenses Of Total BAC Involved Drugs Inv.Goshen County 99 4 4.04% 0.122 1 1.01%Goshen SO 12Lingle PD 3 1 33.33%Other 1Torrington PD 67 3 4.48% 0.122 1 1.49%WHP 16
Goshen County 34

Total Offenses Domestic Violence
County TotalNumber Involving
PercentInvolving
NumberInvolving
PercentInvolving County
Domestic Violence
Number Involving
PercentInvolving
NumberInvolving
PercentInvolving
Department Offenses Alcohol Alcohol Drugs Drugs Department Offenses Alcohol Alcohol Drugs DrugsGoshen County 220 161 73.18% 14 6.36% Goshen County 22 14 63.64% 2 9.09%Goshen SO 41 22 53.66% 2 4.88% Goshen SO 9 6 66.67%Lingle PD 5 4 80.00% Lingle PDOther 4 1 25.00% 1 25.00% Other 1Torrington PD 149 117 78.52% 10 6.71% Torrington PD 12 8 66.67% 2 16.67%WHP 21 17 80.95% 1 4.76% WHP
Felony Offenses Resisting Arrest
County FelonyNumber Involving
PercentInvolving
NumberInvolving
PercentInvolving County
Resisting Arrest
Number Involving
PercentInvolving
NumberInvolving
PercentInvolving
Department Offenses Alcohol Alcohol Drugs Drugs Department Offenses Alcohol Alcohol Drugs DrugsGoshen County 28 8 28.57% 1 3.57% Goshen County 19 13 68.42% 0Goshen SO 12 1 8.33% Goshen SOLingle PD Lingle PD 1 1 100.00%Other 1 Other 1 1 100.00%Torrington PD 14 6 42.86% 1 7.14% Torrington PD 17 11 64.71%WHP 1 1 100.00% WHP
Misdemeanor Offenses Assault
CountyMisde-meanor
Number Involving
PercentInvolving
NumberInvolving
PercentInvolving County Assault
Number Involving
PercentInvolving
NumberInvolving
PercentInvolving
Department Offenses Alcohol Alcohol Drugs Drugs Department Offenses Alcohol Alcohol Drugs DrugsGoshen County 170 134 78.82% 9 5.29% Goshen County 19 13 68.42% 1 5.26%Goshen SO 31 20 64.52% 2 6.45% Goshen SO 2 1 50.00%Lingle PD 4 4 100.00% Lingle PDOther 3 1 33.33% 1 33.33% Other 1 0.00%Torrington PD 113 94 83.19% 5 4.42% Torrington PD 16 12 75.00% 1 6.25%WHP 19 15 78.95% 1 5.26% WHP
Alcohol and Drug Involvement
Goshen County 35

Alcohol No Drive Liquor No Department Involved Home Bar Party Car Other Response Home Bar Up Party Store ResponseGoshen SO 22 3 9 2 3 1 3 2 10 2 4Lingle PD 4 2 1 1 1 2 1Other 1Torrington PD 117 15 48 5 2 5 37 5 47 1 3 4 45WHP 17 7 1 1 1 5 6 1 6Goshen County Totals 161 18 66 8 7 7 46 8 65 1 6 4 56
Location of Alcohol Consumption
Dept.Number of
ReportsGoshen SO Bronco 2
Moose 1Stateline Oasis 2Tote Away 3
Lingle PD Blue Dog 1Murphy's 1
Torrington PD Bronco 14Hi-Way 2J&B Liquor 2Moose 1Stateline Oasis 1Tote Away 26Trail 2
WHP Blue Dog 1Bronco 1Bucking Horse 1Hi-Way 1Tote Away 2
* Total of percents in Location of Consumption and Point of Sale categories may exceed 100% due to single arrests involving more than on location or point of sale.
Location of Alcohol Consumption and Point of Sale by Department
Location of Consumption Point of Sale
Bar Name
Goshen County 36

Numbers by Department
CountyTotal
OffensesMisde-meanor Felony
Domestic Violence
Resist Arrest Assault
Public Intox
Alcohol Involved
DrugsInvolved
Traffic Crash Female Male
Unknown Gender
Average Age
Hot Springs County 73 66 3 3 2 0 7 61 15 2 19 53 1 34.07Hot Springs SO 17 17 2 1 2 14 6 2 1 16 37.25Thermopolis PD 50 43 3 1 1 5 44 6 16 33 1 33.37WHP 6 6 3 3 2 4 31.00
Percents by Department *
CountyTotal
OffensesMisde-meanor Felony
Domestic Violence
Resist Arrest Assault
Public Intox
Alcohol Involved
DrugsInvolved
Traffic Crash Female Male
Unkown Gender
Hot Springs County 73 90.41% 4.11% 4.11% 2.74% 0.00% 9.59% 83.56% 20.55% 2.74% 26.03% 72.60% 1.37%Hot Springs SO 17 100.00% 11.76% 5.88% 11.76% 82.35% 35.29% 11.76% 5.88% 94.12%Thermopolis PD 50 86.00% 6.00% 2.00% 2.00% 10.00% 88.00% 12.00% 32.00% 66.00% 2.00%WHP 6 100.00% 50.00% 50.00% 33.33% 66.67%
* Total percents may not equal 100 due to lack of information, or a single arrest involving multiple crimes.
Hot Springs County ArrestsOctober 1, 2007 - September 30, 2008
Hot Springs County 37

MIP Arrests Meth, Drugs & Public Intoxication
County DUI MIP % MIP Average County Total Meth Drugs Public Pub. Intox. Department Offenses Arrests to DUI MIP BAC Department Offenses Involved Involved Intox. Ave. BAC
Hot Springs County 43 6 13.95% 0.108 Hot Springs County 73 1 15 7 0.109Hot Springs SO 10 Hot Springs SO 17 6 2 0.060Thermopolis PD 29 6 20.69% 0.108 Thermopolis PD 50 6 5 0.158WHP 4 WHP 6 1 3
DUI Arrests Traffic Crashes
County Total DUI % DUI Ave.DUI
Involving% DUI
Involving County Traffic Alcohol % Alcohol Average Drugs % Drugs Department Offenses Offenses Of Total BAC Drugs Drugs Department Crashes Involved Involved BAC Involved Involved
Hot Springs County 73 43 58.90% 0.155 7 16.28% Hot Springs County 2 2 100.00% 0.158 0Hot Springs SO 17 10 58.82% 0.183 3 30.00% Hot Springs SO 2 2 100.00% 0.158Thermopolis PD 50 29 58.00% 0.154 3 10.34% Thermopolis PDWHP 6 4 66.67% 0.081 1 25.00% WHP
Underage DUI ArrestsCounty DUI Underage % DUI Ave. Drugs % DUI Department Offenses Offenses Of Total BAC Involved Drugs Inv.
Hot Springs County 43 3 6.98% 0.147 2 66.67%Hot Springs SO 10 1 10.00% 0.180 1 100.00%Thermopolis PD 29 2 6.90% 0.130 1 50.00%WHP 4
Hot Springs County 38

Total Offenses Domestic Violence
County TotalNumber Involving
PercentInvolving
NumberInvolving
PercentInvolving County
Domestic Violence
Number Involving
PercentInvolving
NumberInvolving
PercentInvolving
Department Offenses Alcohol Alcohol Drugs Drugs Department Offenses Alcohol Alcohol Drugs Drugs
Hot Springs County 73 61 83.56% 15 20.55% Hot Springs County 3 2 66.67% 1 33.33%Hot Springs SO 17 14 82.35% 6 35.29% Hot Springs SO 2 2 100.00% 1 50.00%Thermopolis PD 50 44 88.00% 6 12.00% Thermopolis PD 1WHP 6 3 50.00% 3 50.00% WHP
Felony Offenses Resisting Arrest
County FelonyNumber Involving
PercentInvolving
NumberInvolving
PercentInvolving County
Resisting Arrest
Number Involving
PercentInvolving
NumberInvolving
PercentInvolving
Department Offenses Alcohol Alcohol Drugs Drugs Department Offenses Alcohol Alcohol Drugs Drugs
Hot Springs County 3 2 66.67% 1 33.33% Hot Springs County 2 2 100.00% 0Hot Springs SO Hot Springs SO 1 1 100.00%Thermopolis PD 3 2 66.67% 1 33.33% Thermopolis PD 1 1 100.00%WHP WHP
Misdemeanor Offenses Assault
CountyMisde-meanor
Number Involving
PercentInvolving
NumberInvolving
PercentInvolving County Assault
Number Involving
PercentInvolving
NumberInvolving
PercentInvolving
Department Offenses Alcohol Alcohol Drugs Drugs Department Offenses Alcohol Alcohol Drugs Drugs
Hot Springs County 66 55 83.33% 14 21.21% Hot Springs County 0Hot Springs SO 17 14 82.35% 6 35.29% Hot Springs SOThermopolis PD 43 38 88.37% 5 11.63% Thermopolis PDWHP 6 3 50.00% 3 50.00% WHP
Alcohol and Drug Involvement
Hot Springs County 39

Alcohol No Drive Liquor No Department Involved Home Bar Party Car Other Response Home Bar Up Party Store ResponseHot Springs SO 14 2 6 3 1 2 1 7 3 2Thermopolis PD 44 11 15 8 7 2 3 9 17 1 4 3 10WHP 3 1 2Hot Springs County Totals 61 14 23 11 8 2 5 10 24 1 7 3 12
Location of Alcohol Consumption
Dept.Number of
ReportsHot Springs SO Eagle's 1
Flying Dutchman 1Goggles 1Holiday Inn 2Mac's 1
Thermopolis PD Eagle's 1Holiday Inn 1Mac's 11Safari Club 2
WHP Holiday Inn 1Mac's 1
* Total of percents in Location of Consumption and Point of Sale categories may exceed 100% due to single arrests involving more than on location or point of sale.
Location of Alcohol Consumption and Point of Sale by Department
Location of Consumption Point of Sale
Bar Name
Hot Springs County 40

Numbers by Department
CountyTotal
OffensesMisde-meanor Felony
Domestic Violence
Resist Arrest Assault
Public Intox
Alcohol Involved
DrugsInvolved
Traffic Crash Female Male
Unknown Gender
Average Age
Johnson County 271 207 21 11 2 11 27 178 35 14 52 216 3 34.69Buffalo PD 124 98 4 6 1 6 24 97 22 6 26 97 1 35.55DCI 1 1 1 25.00Johnson SO 107 83 13 5 1 5 57 6 4 19 86 2 33.35Kaycee PD 5 1 1 4 1 4 33.00Other 4 1 1 1 3 38.00WHP 30 24 3 2 19 7 4 5 25 35.72
Percents by Department *
CountyTotal
OffensesMisde-meanor Felony
Domestic Violence
Resist Arrest Assault
Public Intox
Alcohol Involved
DrugsInvolved
Traffic Crash Female Male
Unkown Gender
Johnson County 271 76.38% 7.75% 4.06% 0.74% 4.06% 9.96% 65.68% 12.92% 5.17% 19.19% 79.70% 1.11%Buffalo PD 124 79.03% 3.23% 4.84% 0.81% 4.84% 19.35% 78.23% 17.74% 4.84% 20.97% 78.23% 0.81%DCI 1 100.00% 100.00%Johnson SO 107 77.57% 12.15% 4.67% 0.93% 4.67% 53.27% 5.61% 3.74% 17.76% 80.37% 1.87%Kaycee PD 5 20.00% 20.00% 80.00% 20.00% 80.00%Other 4 25.00% 25.00% 25.00% 75.00%WHP 30 80.00% 10.00% 6.67% 63.33% 23.33% 13.33% 16.67% 83.33%
* Total percents may not equal 100 due to lack of information, or a single arrest involving multiple crimes.
Johnson County ArrestsOctober 1, 2007 - September 30, 2008
Johnson County 41

MIP Arrests Meth, Drugs & Public Intoxication
County DUI MIP % MIP Average County Total Meth Drugs Public Pub. Intox. Department Offenses Arrests to DUI MIP BAC Department Offenses Involved Involved Intox. Ave. BACJohnson County 113 8 7.08% 0.112 Johnson County 271 7 35 27 0.227Buffalo PD 51 3 5.88% 0.057 Buffalo PD 124 3 22 24 0.228DCI DCI 1Johnson SO 41 4 9.76% 0.170 Johnson SO 107 3 6Kaycee PD 1 Kaycee PD 5 1Other Other 4WHP 20 1 5.00% 0.220 WHP 30 1 7 2 0.213
DUI Arrests Traffic Crashes
County Total DUI % DUI Ave.DUI
Involving% DUI
Involving County Traffic Alcohol % Alcohol Average Drugs % Drugs Department Offenses Offenses Of Total BAC Drugs Drugs Department Crashes Involved Involved BAC Involved InvolvedJohnson County 271 113 41.70% 0.162 8 7.08% Johnson County 14 14 100.00% 0.162 2 14.29%Buffalo PD 124 51 41.13% 0.159 5 9.80% Buffalo PD 6 6 100.00% 0.154 2 33.33%DCI 1 DCIJohnson SO 107 41 38.32% 0.171 2 4.88% Johnson SO 4 4 100.00% 0.210Kaycee PD 5 1 20.00% Kaycee PDOther 4 OtherWHP 30 20 66.67% 0.146 3 15.00% WHP 4 4 100.00% 0.115
Underage DUI ArrestsCounty DUI Underage % DUI Ave. Drugs % DUI Department Offenses Offenses Of Total BAC Involved Drugs Inv.Johnson County 113 9 7.96% 0.135 3 33.33%Buffalo PD 51 5 9.80% 0.114 1 20.00%DCIJohnson SO 41 2 4.88% 0.240 1 50.00%Kaycee PD 1OtherWHP 20 2 10.00% 1 50.00%
Johnson County 42

Total Offenses Domestic Violence
County TotalNumber Involving
PercentInvolving
NumberInvolving
PercentInvolving County
Domestic Violence
Number Involving
PercentInvolving
NumberInvolving
PercentInvolving
Department Offenses Alcohol Alcohol Drugs Drugs Department Offenses Alcohol Alcohol Drugs DrugsJohnson County 271 178 65.68% 35 12.92% Johnson County 11 9 81.82% 0Buffalo PD 124 97 78.23% 22 17.74% Buffalo PD 6 5 83.33%DCI 1 DCIJohnson SO 107 57 53.27% 6 5.61% Johnson SO 5 4 80.00%Kaycee PD 5 4 80.00% Kaycee PDOther 4 1 25.00% OtherWHP 30 19 63.33% 7 23.33% WHP
Felony Offenses Resisting Arrest
County FelonyNumber Involving
PercentInvolving
NumberInvolving
PercentInvolving County
Resisting Arrest
Number Involving
PercentInvolving
NumberInvolving
PercentInvolving
Department Offenses Alcohol Alcohol Drugs Drugs Department Offenses Alcohol Alcohol Drugs DrugsJohnson County 21 3 14.29% 4 19.05% Johnson County 2 1 50.00% 0Buffalo PD 4 2 50.00% 2 50.00% Buffalo PD 1DCI 1 DCIJohnson SO 13 1 7.69% Johnson SO 1 1 100.00%Kaycee PD Kaycee PDOther OtherWHP 3 1 33.33% 1 33.33% WHP
Misdemeanor Offenses Assault
CountyMisde-meanor
Number Involving
PercentInvolving
NumberInvolving
PercentInvolving County Assault
Number Involving
PercentInvolving
NumberInvolving
PercentInvolving
Department Offenses Alcohol Alcohol Drugs Drugs Department Offenses Alcohol Alcohol Drugs DrugsJohnson County 207 148 71.50% 28 13.53% Johnson County 11 5 45.45% 0Buffalo PD 98 77 78.57% 19 19.39% Buffalo PD 6 3 50.00%DCI DCIJohnson SO 83 53 63.86% 4 4.82% Johnson SO 5 2 40.00%Kaycee PD 1 1 100.00% Kaycee PDOther 1 1 100.00% OtherWHP 24 16 66.67% 5 20.83% WHP
Alcohol and Drug Involvement
Johnson County 43

Alcohol No Drive Liquor No Department Involved Home Bar Party Car Other Response Home Bar Up Party Store ResponseBuffalo PD 97 18 37 6 4 4 17 8 37 1 1 4 23DCIJohnson SO 57 7 18 1 10 6 6 3 19 1 1 14Kaycee PD 4 1 3 1 3Other 1 1 1WHP 19 4 3 5 5 1 2 2 6Johnson County Totals 178 25 61 10 19 15 27 11 60 1 4 5 46
Location of Alcohol Consumption
Dept.Number of
ReportsBuffalo PD Century Club 18
Cowboy 2Hoot N Howl 11Occidental 2Outback 1
DCI Arvada Bar 1Century Club 4Cowboy 7Hoot N Howl 2Occidental 1
Kaycee PD Invasion Bar 1Other Outback 1WHP Cowboy 2
Wahoo Liquors 1
* Total of percents in Location of Consumption and Point of Sale categories may exceed 100% due to single arrests involving more than on location or point of sale.
Location of Alcohol Consumption and Point of Sale by Department
Location of Consumption Point of Sale
Bar Name
Johnson County 44

Numbers by Department
CountyTotal
OffensesMisde-meanor Felony
Domestic Violence
Resist Arrest Assault
Public Intox
Alcohol Involved
DrugsInvolved
Traffic Crash Female Male
Unknown Gender
Average Age
Laramie County 1677 1226 155 136 37 44 221 1130 141 74 278 1366 33 33.33Burns PD 9 5 1 3 1 1 7 1 26.25Cheyenne PD 910 654 87 93 30 21 211 630 55 40 164 730 16 32.46DCI 7 5 4 6 1 27.25Laramie SO 448 336 41 39 5 21 7 263 43 7 66 378 4 33.30Other 11 7 3 1 1 5 2 1 10 1 28.75Pine Bluffs PD 12 7 3 1 3 1 10 30.75WHP 280 217 19 2 1 1 226 36 26 46 225 9 36.60
Percents by Department *
CountyTotal
OffensesMisde-meanor Felony
Domestic Violence
Resist Arrest Assault
Public Intox
Alcohol Involved
DrugsInvolved
Traffic Crash Female Male
Unkown Gender
Laramie County 1677 73.11% 9.24% 8.11% 2.21% 2.62% 13.18% 67.38% 8.41% 4.41% 16.58% 81.45% 1.97%Burns PD 9 55.56% 11.11% 33.33% 11.11% 11.11% 77.78% 11.11%Cheyenne PD 910 71.87% 9.56% 10.22% 3.30% 2.31% 23.19% 69.23% 6.04% 4.40% 18.02% 80.22% 1.76%DCI 7 71.43% 57.14% 85.71% 14.29%Laramie SO 448 75.00% 9.15% 8.71% 1.12% 4.69% 1.56% 58.71% 9.60% 1.56% 14.73% 84.38% 0.89%Other 11 63.64% 27.27% 9.09% 9.09% 45.45% 18.18% 9.09% 90.91% 9.09%Pine Bluffs PD 12 58.33% 25.00% 8.33% 25.00% 8.33% 83.33%WHP 280 77.50% 6.79% 0.71% 0.36% 0.36% 80.71% 12.86% 9.29% 16.43% 80.36% 3.21%
* Total percents may not equal 100 due to lack of information, or a single arrest involving multiple crimes.
Laramie County ArrestsOctober 1, 2007 - September 30, 2008
Laramie County 45

MIP Arrests Meth, Drugs & Public Intoxication
County DUI MIP % MIP Average County Total Meth Drugs Public Pub. Intox. Department Offenses Arrests to DUI MIP BAC Department Offenses Involved Involved Intox. Ave. BACLaramie County 640 16 2.50% 0.144 Laramie County 1677 33 141 221 0.258Burns PD 1 Burns PD 9 1Cheyenne PD 248 4 1.61% 0.237 Cheyenne PD 910 19 55 211 0.275DCI DCI 7 1 4Laramie SO 174 7 4.02% 0.141 Laramie SO 448 9 43 7 0.191Other Other 11 2 1Pine Bluffs PD 1 Pine Bluffs PD 12 1WHP 216 5 2.31% 0.101 WHP 280 4 36 1
DUI Arrests Traffic Crashes
County Total DUI % DUI Ave.DUI
Involving% DUI
Involving County Traffic Alcohol % Alcohol Average Drugs % Drugs Department Offenses Offenses Of Total BAC Drugs Drugs Department Crashes Involved Involved BAC Involved InvolvedLaramie County 1677 640 38.16% 0.162 35 5.47% Laramie County 74 65 87.84% 0.151 3 4.05%Burns PD 9 1 11.11% Burns PDCheyenne PD 910 248 27.25% 0.166 9 3.63% Cheyenne PD 40 37 92.50% 0.171 1 2.50%DCI 7 DCILaramie SO 448 174 38.84% 0.170 12 6.90% Laramie SO 7 6 85.71% 0.125Other 11 Other 1Pine Bluffs PD 12 1 8.33% 0.110 Pine Bluffs PDWHP 280 216 77.14% 0.153 14 6.48% WHP 26 22 84.62% 0.124 2 7.69%
Underage DUI ArrestsCounty DUI Underage % DUI Ave. Drugs % DUI Department Offenses Offenses Of Total BAC Involved Drugs Inv.Laramie County 640 49 7.66% 0.131 7 14.29%Burns PD 1Cheyenne PD 248 31 12.50% 0.144 2 6.45%DCILaramie SO 174 16 9.20% 0.107 4 25.00%OtherPine Bluffs PD 1WHP 216 8 3.70% 0.120 1 12.50%
Laramie County 46

Total Offenses Domestic Violence
County TotalNumber Involving
PercentInvolving
NumberInvolving
PercentInvolving County
Domestic Violence
Number Involving
PercentInvolving
NumberInvolving
PercentInvolving
Department Offenses Alcohol Alcohol Drugs Drugs Department Offenses Alcohol Alcohol Drugs DrugsLaramie County 1677 1130 67.38% 141 8.41% Laramie County 136 64 47.06% 3 2.21%Burns PD 9 3 33.33% 1 11.11% Burns PDCheyenne PD 910 630 69.23% 55 6.04% Cheyenne PD 93 44 47.31% 2 2.15%DCI 7 4 57.14% DCILaramie SO 448 263 58.71% 43 9.60% Laramie SO 39 19 48.72% 1 2.56%Other 11 5 45.45% 2 18.18% Other 1 1 100.00%Pine Bluffs PD 12 3 25.00% Pine Bluffs PD 3WHP 280 226 80.71% 36 12.86% WHP
Felony Offenses Resisting Arrest
County FelonyNumber Involving
PercentInvolving
NumberInvolving
PercentInvolving County
Resisting Arrest
Number Involving
PercentInvolving
NumberInvolving
PercentInvolving
Department Offenses Alcohol Alcohol Drugs Drugs Department Offenses Alcohol Alcohol Drugs DrugsLaramie County 155 29 18.71% 34 21.94% Laramie County 37 25 67.57% 1 2.70%Burns PD Burns PDCheyenne PD 87 18 20.69% 11 12.64% Cheyenne PD 30 21 70.00% 1 3.33%DCI 5 3 60.00% DCILaramie SO 41 9 21.95% 7 17.07% Laramie SO 5 3 60.00%Other 3 1 33.33% OtherPine Bluffs PD Pine Bluffs PDWHP 19 2 10.53% 12 63.16% WHP 2 1 50.00%
Misdemeanor Offenses Assault
CountyMisde-meanor
Number Involving
PercentInvolving
NumberInvolving
PercentInvolving County Assault
Number Involving
PercentInvolving
NumberInvolving
PercentInvolving
Department Offenses Alcohol Alcohol Drugs Drugs Department Offenses Alcohol Alcohol Drugs DrugsLaramie County 1226 918 74.88% 75 6.12% Laramie County 44 19 43.18% 2 4.55%Burns PD 5 2 40.00% Burns PD 1Cheyenne PD 654 499 76.30% 30 4.59% Cheyenne PD 21 8 38.10% 1 4.76%DCI DCILaramie SO 336 222 66.07% 27 8.04% Laramie SO 21 11 52.38% 1 4.76%Other 7 4 57.14% 2 28.57% OtherPine Bluffs PD 7 2 28.57% 0.00% Pine Bluffs PDWHP 217 189 87.10% 16 7.37% WHP 1
Alcohol and Drug Involvement
Laramie County 47

Alcohol No Drive Liquor No Department Involved Home Bar Party Car Other Response Home Bar Up Party Store ResponseBurns PD 3 1 1 1 3Cheyenne PD 630 135 194 28 25 75 125 81 202 4 26 86 149DCILaramie SO 263 86 87 14 12 20 34 46 91 11 44 47Other 5 1 1 1 1 1 1 2Pine Bluffs PD 3 2 2WHP 226 40 82 10 37 13 34 22 82 2 10 25 62Laramie County Totals 1130 263 366 53 76 109 194 150 379 6 47 155 261
Location of Alcohol Consumption
Dept.Number of
Reports Dept.Number of
Reports Dept.Number of
Reports
Cheyenne PD Albany 11Cheyenne PD Mingles 3
Pine Bluffs PD Pal's Pub 2
Alf's 2 Old Chicago 3 WHP Albany 1American Vets 2 Outlaw 14 American Legion 1American Legion 1 Redwood 1 Antelope 2Anderson's 2 Scooter's 5 Bunkhouse 3Big Horn 1 Shadows 1 CB Potts 1Black Hank 1 Skeeter's 1 Charlie's 1CB Potts 1 Snake River 1 Country Club 1Charlie's 3 Two Bar 1 Clown's Den 1Chili's 2 VFW 1 Cowboy Bar 3
Clown's Den 1Laramie SO Antelope 1 Crown 2
Crown 29 Brown 1 DTs 3Depot Brewfest 1 Camp Lounge 1 Eagle's Nest 3Diamond Horseshoe 1 CB Potts 1 Frontier 1DTs 7 Chili's 1 Goofy's 3Eagle's Nest 5 Clown's Den 4 Jackson Hole 1Four Winds 2 Cowboy Bar 1 Keg & Cork 1Frontier 1 Crown 6 Lamp Lounge 3Game On 2 DTs 2 Outback 1Goofy's 20 Goofy's 6 Outlaw 13Green Door 6 Green Door 3 Redwood 2Hitching Post 1 Holiday Inn 1 Scooter's 1Holiday Inn 2 Keg & Cork 2 Steakhouse 1Jackon's 3 Lamp Lounge 5 T Joe's 3Jake's 4 Outlaw 32 Tommy Jack's 1Keg & Cork 2 Pal's Pub 1 Tumbleweed 8Knights of Columbus 1 Scooter's 1 Two Bar 1Lamp Lounge 16 Snake River 2 VFW 1Mayflower 1 VFW 2
* Total of percents in Location of Consumption and Point of Sale categories may exceed 100% due to single arrests involving more than on location or point of sale.
Location of Alcohol Consumption and Point of Sale by Department
Location of Consumption Point of Sale
Bar Name Bar NameBar Name
Laramie County 48

Numbers by Department
CountyTotal
OffensesMisde-meanor Felony
Domestic Violence
Resist Arrest Assault
Public Intox
Alcohol Involved
DrugsInvolved
Traffic Crash Female Male
Unknown Gender
Average Age
Lincoln County 387 307 39 32 15 27 16 230 64 20 55 315 17 32.45Afton PD 10 10 2 9 1 1 2 8 30.29Alpine PD 4 3 1 1 2 3 4 38.75Cokeville PD 9 3 6 4 2 7 24.00Diamondville PD 23 17 1 6 1 1 1 14 2 8 13 2 29.06Kemmerer PD 104 86 5 12 5 15 10 67 4 1 11 87 6 31.21La Barge PD 17 16 2 1 1 1 1 10 3 17 29.44Lincoln SO 152 111 18 12 7 8 2 89 38 7 26 122 4 33.46Other 5 3 2 2 1 4 1 37.25WHP 63 58 4 1 36 11 11 6 53 4 34.42
Percents by Department *
CountyTotal
OffensesMisde-meanor Felony
Domestic Violence
Resist Arrest Assault
Public Intox
Alcohol Involved
DrugsInvolved
Traffic Crash Female Male
Unkown Gender
Lincoln County 387 79.33% 10.08% 8.27% 3.88% 6.98% 4.13% 59.43% 16.54% 5.17% 14.21% 81.40% 4.39%Afton PD 10 100.00% 20.00% 90.00% 10.00% 10.00% 20.00% 80.00%Alpine PD 4 75.00% 25.00% 25.00% 50.00% 75.00% 100.00%Cokeville PD 9 33.33% 66.67% 44.44% 22.22% 77.78%Diamondville PD 23 73.91% 4.35% 26.09% 4.35% 4.35% 4.35% 60.87% 8.70% 34.78% 56.52% 8.70%Kemmerer PD 104 82.69% 4.81% 11.54% 4.81% 14.42% 9.62% 64.42% 3.85% 0.96% 10.58% 83.65% 5.77%La Barge PD 17 94.12% 11.76% 5.88% 5.88% 5.88% 5.88% 58.82% 17.65% 100.00%Lincoln SO 152 73.03% 11.84% 7.89% 4.61% 5.26% 1.32% 58.55% 25.00% 4.61% 17.11% 80.26% 2.63%Other 5 60.00% 40.00% 40.00% 20.00% 80.00% 20.00%WHP 63 92.06% 6.35% 1.59% 57.14% 17.46% 17.46% 9.52% 84.13% 6.35%
* Total percents may not equal 100 due to lack of information, or a single arrest involving multiple crimes.
Lincoln County ArrestsOctober 1, 2007 - September 30, 2008
Lincoln County 49

MIP Arrests Meth, Drugs & Public Intoxication
County DUI MIP % MIP Average County Total Meth Drugs Public Pub. Intox. Department Offenses Arrests to DUI MIP BAC Department Offenses Involved Involved Intox. Ave. BACLincoln County 142 28 19.72% 0.101 Lincoln County 387 14 64 16 0.370Afton PD 5 Afton PD 10 1 2 0.346Alpine PD 1 Alpine PD 4Cokeville PD 1 Cokeville PD 9 4Diamondville PD 6 2 33.33% 0.095 Diamondville PD 23 2 1Kemmerer PD 22 14 63.64% 0.100 Kemmerer PD 104 4 10 0.335La Barge PD 7 2 28.57% 0.122 La Barge PD 17 3 1Lincoln SO 62 9 14.52% 0.090 Lincoln SO 152 11 38 2 0.430Other 2 1 50.00% 0.177 Other 5 1WHP 36 WHP 63 3 11
DUI Arrests Traffic Crashes
County Total DUI % DUI Ave.DUI
Involving% DUI
Involving County Traffic Alcohol % Alcohol Average Drugs % Drugs Department Offenses Offenses Of Total BAC Drugs Drugs Department Crashes Involved Involved BAC Involved InvolvedLincoln County 387 142 36.69% 0.147 14 9.86% Lincoln County 20 18 90.00% 0.168 2 10.00%Afton PD 10 5 50.00% 0.180 1 20.00% Afton PD 1 1 100.00%Alpine PD 4 1 25.00% 0.177 Alpine PDCokeville PD 9 1 11.11% 1 100.00% Cokeville PDDiamondville PD 23 6 26.09% 0.145 Diamondville PDKemmerer PD 104 22 21.15% 0.145 Kemmerer PD 1 1 100.00%La Barge PD 17 7 41.18% 0.229 1 14.29% La Barge PDLincoln SO 152 62 40.79% 0.134 5 8.06% Lincoln SO 7 7 100.00% 0.215Other 5 2 40.00% 0.140 OtherWHP 63 36 57.14% 0.149 6 16.67% WHP 11 9 81.82% 0.160 2 18.18%
Underage DUI ArrestsCounty DUI Underage % DUI Ave. Drugs % DUI Department Offenses Offenses Of Total BAC Involved Drugs Inv.Lincoln County 142 7 4.93% 0.127 1 14.29%Afton PD 5Alpine PD 1Cokeville PD 1Diamondville PD 6 1 16.67%Kemmerer PD 22La Barge PD 7 1 14.29% 0.122Lincoln SO 62 2 3.23% 0.127 1 50.00%Other 2WHP 36 3 8.33% 0.129
Lincoln County 50

Total Offenses Domestic Violence
County TotalNumber Involving
PercentInvolving
NumberInvolving
PercentInvolving County
Domestic Violence
Number Involving
PercentInvolving
NumberInvolving
PercentInvolving
Department Offenses Alcohol Alcohol Drugs Drugs Department Offenses Alcohol Alcohol Drugs DrugsLincoln County 387 230 59.43% 64 16.54% Lincoln County 32 18 56.25% 0Afton PD 10 9 90.00% 1 10.00% Afton PDAlpine PD 4 3 75.00% Alpine PD 1Cokeville PD 9 4 44.44% Cokeville PDDiamondville PD 23 14 60.87% 2 8.70% Diamondville PD 6 1 16.67%Kemmerer PD 104 67 64.42% 4 3.85% Kemmerer PD 12 8 66.67%La Barge PD 17 10 58.82% 3 17.65% La Barge PD 1Lincoln SO 152 89 58.55% 38 25.00% Lincoln SO 12 9 75.00%Other 5 2 40.00% 1 20.00% OtherWHP 63 36 57.14% 11 17.46% WHP
Felony Offenses Resisting Arrest
County FelonyNumber Involving
PercentInvolving
NumberInvolving
PercentInvolving County
Resisting Arrest
Number Involving
PercentInvolving
NumberInvolving
PercentInvolving
Department Offenses Alcohol Alcohol Drugs Drugs Department Offenses Alcohol Alcohol Drugs DrugsLincoln County 39 8 20.51% 9 23.08% Lincoln County 15 13 86.67% 1 6.67%Afton PD Afton PDAlpine PD 1 1 100.00% Alpine PDCokeville PD 6 3 50.00% Cokeville PDDiamondville PD 1 1 100.00% 1 100.00% Diamondville PD 1 1 100.00%Kemmerer PD 5 3 60.00% Kemmerer PD 5 4 80.00%La Barge PD 2 1 50.00% La Barge PD 1 1 100.00%Lincoln SO 18 1 5.56% 4 22.22% Lincoln SO 7 6 85.71% 1 14.29%Other 2 OtherWHP 4 1 25.00% 1 25.00% WHP 1 1 100.00%
Misdemeanor Offenses Assault
CountyMisde-meanor
Number Involving
PercentInvolving
NumberInvolving
PercentInvolving County Assault
Number Involving
PercentInvolving
NumberInvolving
PercentInvolving
Department Offenses Alcohol Alcohol Drugs Drugs Department Offenses Alcohol Alcohol Drugs DrugsLincoln County 307 197 64.17% 43 14.01% Lincoln County 27 17 62.96% 2 7.41%Afton PD 10 9 90.00% 1 10.00% Afton PDAlpine PD 3 2 66.67% Alpine PD 2 2 100.00%Cokeville PD 3 1 33.33% Cokeville PDDiamondville PD 17 10 58.82% Diamondville PD 1 1 100.00% 1 100.00%Kemmerer PD 86 57 66.28% 4 4.65% Kemmerer PD 15 9 60.00%La Barge PD 16 9 56.25% 3 18.75% La Barge PD 1 1 100.00%Lincoln SO 111 75 67.57% 24 21.62% Lincoln SO 8 4 50.00% 1 12.50%Other 3 2 66.67% 1 33.33% OtherWHP 58 33 56.90% 9 15.52% WHP
Alcohol and Drug Involvement
Lincoln County 51

Alcohol No Drive Liquor No Department Involved Home Bar Party Car Other Response Home Bar Up Party Store ResponseAfton PD 9 2 6 6Alpine PD 3 1 2 1 2Cokeville PDDiamondville PD 14 5 1 3 4 1 3 6Kemmerer PD 67 22 21 8 1 7 6 9 18 1 3 3 19La Barge PD 10 1 4 3 2 4 3Lincoln SO 89 17 32 6 6 5 16 2 28 2 7 28Other 2 2WHP 36 5 10 2 7 5 5 1 12 1 5 12Lincoln County Totals 230 52 75 16 20 19 35 12 70 1 6 18 70
Location of Alcohol Consumption
Dept.Number of
ReportsAfton PD Colter's 4
Cooter's 1Alpine PD Tavern on the Grey 1Diamondville PD Bowling Alley 1Kemmerer PD Eagle's 1
Gridiron 2Grumpy's 1Hans Fork Grill 1Stock Exchange 10
La Barge PD Eagle's 1Location Bar 2Water Hole #3 1
Lincoln SO Bull Moose 2Colter's 1Cowboy 1Dad's 4Eagle's 3Elk's Club 2Location Bar 2Outlaw 2Pines 1Silo 1Stock Exchange 2Tavern on the Grey 3
WHP Bull Moose 3Dad's 1Michelle's Rest & Pub 1Stock Exchange 1Tavern on the Grey 1
* Total of percents in Location of Consumption and Point of Sale categories may exceed 100% due to single arrests involving more than on location or point of sale.
Location of Alcohol Consumption and Point of Sale by Department
Location of Consumption Point of Sale
Bar Name
Lincoln County 52

Numbers by Department
CountyTotal
OffensesMisde-meanor Felony
Domestic Violence
Resist Arrest Assault
Public Intox
Alcohol Involved
DrugsInvolved
Traffic Crash Female Male
Unknown Gender
Average Age
Natrona County 3749 2921 284 173 73 136 653 2171 329 225 833 2759 157 32.88Casper PD 2431 1875 187 127 52 98 597 1451 173 153 554 1760 117 32.81DCI 20 2 15 16 19 7 13 33.00Evansville PD 184 166 6 4 5 113 10 8 47 130 7 32.65Game & Fish 9 8 8 9 33.33Midwest PD 6 4 1 1 4 1 1 3 2 30.00Mills PD 395 324 27 13 4 11 29 195 60 13 74 308 13 32.85Natrona SO 464 341 47 27 9 21 4 225 35 17 104 353 7 33.56Other 42 20 5 1 4 24 3 3 7 26 9 32.42WHP 198 181 2 3 1 2 151 28 31 39 157 2 32.46
Percents by Department *
CountyTotal
OffensesMisde-meanor Felony
Domestic Violence
Resist Arrest Assault
Public Intox
Alcohol Involved
DrugsInvolved
Traffic Crash Female Male
Unkown Gender
Natrona County 3749 77.91% 7.58% 4.61% 1.95% 3.63% 17.42% 57.91% 8.78% 6.00% 22.22% 73.59% 4.19%Casper PD 2431 77.13% 7.69% 5.22% 2.14% 4.03% 24.56% 59.69% 7.12% 6.29% 22.79% 72.40% 4.81%DCI 20 10.00% 75.00% 80.00% 95.00% 35.00% 65.00%Evansville PD 184 90.22% 3.26% 2.17% 2.72% 61.41% 5.43% 4.35% 25.54% 70.65% 3.80%Game & Fish 9 88.89% 88.89% 100.00%Midwest PD 6 66.67% 16.67% 16.67% 66.67% 16.67% 16.67% 50.00% 33.33%Mills PD 395 82.03% 6.84% 3.29% 1.01% 2.78% 7.34% 49.37% 15.19% 3.29% 18.73% 77.97% 3.29%Natrona SO 464 73.49% 10.13% 5.82% 1.94% 4.53% 0.86% 48.49% 7.54% 3.66% 22.41% 76.08% 1.51%Other 42 47.62% 11.90% 2.38% 9.52% 57.14% 7.14% 7.14% 16.67% 61.90% 21.43%WHP 198 91.41% 1.01% 1.52% 0.51% 1.01% 76.26% 14.14% 15.66% 19.70% 79.29% 1.01%
* Total percents may not equal 100 due to lack of information, or a single arrest involving multiple crimes.
Natrona County ArrestsOctober 1, 2007 - September 30, 2008
Natrona County 53

MIP Arrests Meth, Drugs & Public Intoxication
County DUI MIP % MIP Average County Total Meth Drugs Public Pub. Intox. Department Offenses Arrests to DUI MIP BAC Department Offenses Involved Involved Intox. Ave. BACNatrona County 1024 68 6.64% 0.120 Natrona County 3749 98 329 653 0.182Casper PD 501 51 10.18% 0.120 Casper PD 2431 53 173 597 0.182DCI DCI 20 10 19 16Evansville PD 64 1 1.56% 0.120 Evansville PD 184 2 10 0.219Game & Fish 8 Game & Fish 9Midwest PD 1 Midwest PD 6 1 1Mills PD 128 6 4.69% 0.099 Mills PD 395 23 60 29 0.177Natrona SO 169 7 4.14% 0.120 Natrona SO 464 5 35 4 0.130Other 13 1 7.69% Other 42 1 3 4WHP 140 2 1.43% 0.150 WHP 198 4 28 2
DUI Arrests Traffic Crashes
County Total DUI % DUI Ave.DUI
Involving% DUI
Involving County Traffic Alcohol % Alcohol Average Drugs % Drugs Department Offenses Offenses Of Total BAC Drugs Drugs Department Crashes Involved Involved BAC Involved InvolvedNatrona County 3749 1024 27.31% 0.153 89 8.69% Natrona County 225 180 80.00% 0.157 21 9.33%Casper PD 2431 501 20.61% 0.157 38 7.58% Casper PD 153 120 78.43% 0.157 10 6.54%DCI 20 DCIEvansville PD 184 64 34.78% 0.142 6 9.38% Evansville PD 8 7 87.50% 0.123 1 12.50%Game & Fish 9 8 88.89% 0.134 Game & FishMidwest PD 6 1 16.67% Midwest PDMills PD 395 128 32.41% 0.152 15 11.72% Mills PD 13 8 61.54% 0.100 2 15.38%Natrona SO 464 169 36.42% 0.155 12 7.10% Natrona SO 17 14 82.35% 0.181 3 17.65%Other 42 13 30.95% 0.200 Other 3 28 933.33% 0.225WHP 198 140 70.71% 0.147 18 12.86% WHP 31 3 9.68% 0.158 5 16.13%
Underage DUI ArrestsCounty DUI Underage % DUI Ave. Drugs % DUI Department Offenses Offenses Of Total BAC Involved Drugs Inv.Natrona County 1024 62 6.05% 0.128 4 6.45%Casper PD 501 27 5.39% 0.133DCIEvansville PD 64 2 3.13% 0.160Game & Fish 8Midwest PD 1Mills PD 128 13 10.16% 0.127Natrona SO 169 11 6.51% 0.132 1 9.09%Other 13WHP 140 9 6.43% 0.101 3 33.33%
Natrona County 54

Total Offenses Domestic Violence
County TotalNumber Involving
PercentInvolving
NumberInvolving
PercentInvolving County
Domestic Violence
Number Involving
PercentInvolving
NumberInvolving
PercentInvolving
Department Offenses Alcohol Alcohol Drugs Drugs Department Offenses Alcohol Alcohol Drugs DrugsNatrona County 3749 2171 57.91% 329 8.78% Natrona County 173 100 57.80% 7 4.05%Casper PD 2431 1451 59.69% 173 7.12% Casper PD 127 73 57.48% 5 3.94%DCI 20 19 95.00% DCIEvansville PD 184 113 61.41% 10 5.43% Evansville PD 6 5 83.33%Game & Fish 9 8 88.89% Game & FishMidwest PD 6 4 66.67% 1 16.67% Midwest PDMills PD 395 195 49.37% 60 15.19% Mills PD 13 6 46.15% 1 7.69%Natrona SO 464 225 48.49% 35 7.54% Natrona SO 27 16 59.26% 1 3.70%Other 42 24 57.14% 3 7.14% OtherWHP 198 151 76.26% 28 14.14% WHP
Felony Offenses Resisting Arrest
County FelonyNumber Involving
PercentInvolving
NumberInvolving
PercentInvolving County
Resisting Arrest
Number Involving
PercentInvolving
NumberInvolving
PercentInvolving
Department Offenses Alcohol Alcohol Drugs Drugs Department Offenses Alcohol Alcohol Drugs DrugsNatrona County 284 70 24.65% 54 19.01% Natrona County 73 48 65.75% 8 10.96%Casper PD 187 59 31.55% 25 13.37% Casper PD 52 33 63.46% 8 15.38%DCI 15 14 93.33% DCIEvansville PD Evansville PD 4 3 75.00%Game & Fish Game & FishMidwest PD 1 1 100.00% Midwest PDMills PD 27 1 3.70% 5 18.52% Mills PD 4 3 75.00%Natrona SO 47 8 17.02% 7 14.89% Natrona SO 9 6 66.67%Other 5 2 40.00% 1 20.00% Other 1 1 100.00%WHP 2 1 50.00% WHP 3 2 66.67%
Misdemeanor Offenses Assault
CountyMisde-meanor
Number Involving
PercentInvolving
NumberInvolving
PercentInvolving County Assault
Number Involving
PercentInvolving
NumberInvolving
PercentInvolving
Department Offenses Alcohol Alcohol Drugs Drugs Department Offenses Alcohol Alcohol Drugs DrugsNatrona County 2921 1802 61.69% 230 7.87% Natrona County 136 75 55.15% 8 5.88%Casper PD 1875 1172 62.51% 124 6.61% Casper PD 98 56 57.14% 3 3.06%DCI 2 2 100.00% DCIEvansville PD 166 104 62.65% 9 5.42% Evansville PD 5 2 40.00%Game & Fish 8 7 87.50% Game & FishMidwest PD 4 2 50.00% 1 25.00% Midwest PDMills PD 324 179 55.25% 46 14.20% Mills PD 11 4 36.36% 2 18.18%Natrona SO 341 183 53.67% 25 7.33% Natrona SO 21 12 57.14%Other 20 12 60.00% 1 5.00% OtherWHP 181 143 79.01% 22 12.15% WHP 1 1 100.00%
Alcohol and Drug Involvement
Natrona County 55

Alcohol No Drive Liquor No Department Involved Home Bar Party Car Other Response Home Bar Up Party Store ResponseCasper PD 1451 305 472 72 37 1451 278 178 449 3 44 87 367DCIEvansville PD 113 20 40 3 3 113 14 8 32 3 5 17Game & Fish 8 1 2 5 1 1 4 1Midwest PD 4 3 1 3 1Mills PD 195 36 80 15 6 195 17 17 64 1 3 1 21Natrona SO 225 43 86 17 18 225 27 22 88 6 9 14 47Other 24 7 13 1 2 1 1 10 2 2WHP 151 27 63 10 17 151 15 11 60 3 7 12 31Natrona County Totals 2171 441 756 120 81 2142 352 240 705 13 67 125 486
Location of Alcohol Consumption
Dept.Number of
Reports Dept.Number of
Reports Dept.Number of
ReportsCasper PD 303 2 Casper PD VFW 7 Natrona SO Edd's 1
Airport 1 Wonder Bar 30 El Marko 1Alibi 32 Yellowstone 1 Elixir's 1American Legion 7 Evansville PD Butch's 27 Frosty's 1Applebee's 1 Lazy 8 1 Hidaway 2Armor's 1 Sandbar 2 Horseshoe 6Avalon 1 Taylor's 9 Lazy 8 1Back Door Lounge 1 Game & Fish Casper Boat Club 1 Mill View 1Balles 1 Midwest PD Beacon 1 Moonlight 1Beacon 23 Mills PD Baja Beach 1 Northern Dreams 3Bowling Alley 5 Bayou 3 Oregon Trail 1Butch's 29 Beacon 33 Outback 1Chatters 3 Butch's 1 Sandbar 10CY Liquors 5 Eagles 1 Sidelines 9Drake's 7 FireRock 1 Sunset 1El Marko 6 Fireside 1 TJ's 1Elixir 5 Hidaway 3 Wonder Bar 2Fireside 7 Horseshoe 2 WHP Alibi 1Frosty's 2 Keyhole 1 American Legion 1Galles 1 Mill View 1 Beacon 5Galloway's 1 Moonlight 2 Butch's 6Holly St. 1 OTB 5 Chatters 1Horseshoe 1 Parkway Plaza 1 Eagles 1Hotel 1 Sandbar 6 Glenrock 1Johnny O's 4 Shoshoni 1 Hidaway 1Karen & Jim's 2 Sidelines 4 Hiland 2Moonlight 41 Taylor's 2 Horseshoe 5Northern Dreams 1 VFW 4 Karen & Jim's 1Old Chicago's 10 Wonder Bar 1 Lazy 8 1Oregon Trail 3 Natrona SO Airport 1 Moonlight 1OTB 1 Alibi 3 North 40 3Parkway Plaza 2 American Legion 1 Northern Dreams 4Poor Boys 2 Applebee's 1 Oregon Trail 1PV Liquors 3 Baja Beach 2 Rimrock 1Ramkota Inn 1 Bayou 1 Sandbar 10Sandbar 123 Beacon 16 Sidelines 8Sanford's 2 Butch's 5 Sunset 1Sidelines 49 Chatters 2 Wonder Bar 2Taylor's 4 Cowboys 2TJ's 3 Drake's 1
* Total of percents in Location of Consumption and Point of Sale categories may exceed 100% due to single arrests involving more than on location or point of sale.
Location of Alcohol Consumption and Point of Sale by Department
Location of Consumption Point of Sale
Bar Name Bar NameBar Name
Natrona County 56

Numbers by Department
CountyTotal
OffensesMisde-meanor Felony
Domestic Violence
Resist Arrest Assault
Public Intox
Alcohol Involved
DrugsInvolved
Traffic Crash Female Male
Unknown Gender
Average Age
Niobrara County 40 30 5 4 11 2 6 27 4 4 7 33 0 34.03Lusk PD 28 23 2 2 8 2 5 19 4 2 4 24 31.59Niobrara SO 10 5 3 2 3 1 6 1 3 7 41.67WHP 2 2 2 1 2 32.50
Percents by Department *
CountyTotal
OffensesMisde-meanor Felony
Domestic Violence
Resist Arrest Assault
Public Intox
Alcohol Involved
DrugsInvolved
Traffic Crash Female Male
Unkown Gender
Niobrara County 40 75.00% 12.50% 10.00% 27.50% 5.00% 15.00% 67.50% 10.00% 10.00% 17.50% 82.50% 0.00%Lusk PD 28 82.14% 7.14% 7.14% 28.57% 7.14% 17.86% 67.86% 14.29% 7.14% 14.29% 85.71%Niobrara SO 10 50.00% 30.00% 20.00% 30.00% 10.00% 60.00% 10.00% 30.00% 70.00%WHP 2 100.00% 100.00% 50.00% 100.00%
* Total percents may not equal 100 due to lack of information, or a single arrest involving multiple crimes.
Niobrara County ArrestsOctober 1, 2007 - September 30, 2008
Niobrara County 57

MIP Arrests Meth, Drugs & Public Intoxication
County DUI MIP % MIP Average County Total Meth Drugs Public Pub. Intox. Department Offenses Arrests to DUI MIP BAC Department Offenses Involved Involved Intox. Ave. BACNiobrara County 14 3 21.43% 0.090 Niobrara County 40 1 4 6 0.220Lusk PD 8 3 37.50% 0.090 Lusk PD 28 1 4 5 0.326Niobrara SO 4 Niobrara SO 10 1 0.114WHP 2 WHP 2
DUI Arrests Traffic Crashes
County Total DUI % DUI Ave.DUI
Involving% DUI
Involving County Traffic Alcohol % Alcohol Average Drugs % Drugs Department Offenses Offenses Of Total BAC Drugs Drugs Department Crashes Involved Involved BAC Involved InvolvedNiobrara County 40 14 35.00% 0.185 0 Niobrara County 4 4 100.00% 0.287 0Lusk PD 28 8 28.57% 0.229 Lusk PD 2 2 100.00% 0.369Niobrara SO 10 4 40.00% 0.143 Niobrara SO 1 1 100.00%WHP 2 2 100.00% 0.116 WHP 1 1 100.00% 0.124
Underage DUI ArrestsCounty DUI Underage % DUI Ave. Drugs % DUI Department Offenses Offenses Of Total BAC Involved Drugs Inv.Niobrara County 14 2 14.29% 0.110 0Lusk PD 8 2 25.00% 0.110Niobrara SO 4WHP 2
Niobrara County 58

Total Offenses Domestic Violence
County TotalNumber Involving
PercentInvolving
NumberInvolving
PercentInvolving County
Domestic Violence
Number Involving
PercentInvolving
NumberInvolving
PercentInvolving
Department Offenses Alcohol Alcohol Drugs Drugs Department Offenses Alcohol Alcohol Drugs DrugsNiobrara County 40 27 67.50% 4 10.00% Niobrara County 4 1 25.00% 0Lusk PD 28 19 67.86% 4 14.29% Lusk PD 2Niobrara SO 10 6 60.00% Niobrara SO 2 1 50.00%WHP 2 2 100.00% WHP
Felony Offenses Resisting Arrest
County FelonyNumber Involving
PercentInvolving
NumberInvolving
PercentInvolving County
Resisting Arrest
Number Involving
PercentInvolving
NumberInvolving
PercentInvolving
Department Offenses Alcohol Alcohol Drugs Drugs Department Offenses Alcohol Alcohol Drugs DrugsNiobrara County 5 1 20.00% 1 20.00% Niobrara County 11 4 36.36% 0Lusk PD 2 1 50.00% Lusk PD 8 3 37.50%Niobrara SO 3 1 33.33% Niobrara SO 3 1 33.33%WHP WHP
Misdemeanor Offenses Assault
CountyMisde-meanor
Number Involving
PercentInvolving
NumberInvolving
PercentInvolving County Assault
Number Involving
PercentInvolving
NumberInvolving
PercentInvolving
Department Offenses Alcohol Alcohol Drugs Drugs Department Offenses Alcohol Alcohol Drugs DrugsNiobrara County 30 23 76.67% 3 10.00% Niobrara County 2 0 0Lusk PD 23 17 73.91% 3 13.04% Lusk PD 2Niobrara SO 5 4 80.00% Niobrara SOWHP 2 2 100.00% WHP
Alcohol and Drug Involvement
Niobrara County 59

Alcohol No Drive Liquor No Department Involved Home Bar Party Car Other Response Home Bar Up Party Store ResponseLusk PD 19 1 2 3 1 7 1 2 3 8Niobrara SO 6 1 1 4 1 5WHP 2 1 1 1 1Niobrara County Totals 27 2 3 4 2 0 11 2 3 0 4 0 13
Location of Alcohol Consumption
Dept.Number of
ReportsLusk PD Silver Dolar 1
* Total of percents in Location of Consumption and Point of Sale categories may exceed 100% due to single arrests involving more than on location or point of sale.
Location of Alcohol Consumption and Point of Sale by Department
Location of Consumption Point of Sale
Bar Name
Niobrara County 60

Numbers by Department
CountyTotal
OffensesMisde-meanor Felony
Domestic Violence
Resist Arrest Assault
Public Intox
Alcohol Involved
DrugsInvolved
Traffic Crash Female Male
Unknown Gender
Average Age
Park County 723 549 81 44 15 34 66 466 58 39 172 540 11 31.81Cody PD 385 292 29 18 4 15 43 243 31 19 97 283 5 32.02Other 14 7 5 1 4 3 8 2 24.60Park Service 4 2 2 1 3 35.00Park SO 91 64 20 17 2 3 1 38 6 5 19 72 33.54Powell PD 202 161 24 9 9 15 21 157 17 8 46 153 3 30.56WHP 27 23 3 1 22 4 7 6 21 37.71
Percents by Department *
CountyTotal
OffensesMisde-meanor Felony
Domestic Violence
Resist Arrest Assault
Public Intox
Alcohol Involved
DrugsInvolved
Traffic Crash Female Male
Unkown Gender
Park County 723 75.93% 11.20% 6.09% 2.07% 4.70% 9.13% 64.45% 8.02% 5.39% 23.79% 74.69% 1.52%Cody PD 385 75.84% 7.53% 4.68% 1.04% 3.90% 11.17% 63.12% 8.05% 4.94% 25.19% 73.51% 1.30%Other 14 50.00% 35.71% 7.14% 28.57% 21.43% 57.14% 14.29%Park Service 4 50.00% 50.00% 25.00% 75.00%Park SO 91 70.33% 21.98% 18.68% 2.20% 3.30% 1.10% 41.76% 6.59% 5.49% 20.88% 79.12%Powell PD 202 79.70% 11.88% 4.46% 4.46% 7.43% 10.40% 77.72% 8.42% 3.96% 22.77% 75.74% 1.49%WHP 27 85.19% 11.11% 3.70% 81.48% 14.81% 25.93% 22.22% 77.78%
* Total percents may not equal 100 due to lack of information, or a single arrest involving multiple crimes.
Park County ArrestsOctober 1, 2007 - September 30, 2008
Park County 61

MIP Arrests Meth, Drugs & Public Intoxication
County DUI MIP % MIP Average County Total Meth Drugs Public Pub. Intox. Department Offenses Arrests to DUI MIP BAC Department Offenses Involved Involved Intox. Ave. BACPark County 284 29 10.21% 0.098 Park County 723 3 58 66 0.193Cody PD 150 13 8.67% 0.093 Cody PD 385 31 43 0.177Other 1 Other 14 1Park Service Park Service 4Park SO 17 3 17.65% 0.045 Park SO 91 2 6 1 0.284Powell PD 97 12 12.37% 0.108 Powell PD 202 1 17 21 0.200WHP 19 1 5.26% 0.132 WHP 27 4
DUI Arrests Traffic Crashes
County Total DUI % DUI Ave.DUI
Involving% DUI
Involving County Traffic Alcohol % Alcohol Average Drugs % Drugs Department Offenses Offenses Of Total BAC Drugs Drugs Department Crashes Involved Involved BAC Involved InvolvedPark County 723 284 39.28% 0.159 24 8.45% Park County 39 33 84.62% 0.171 6 15.38%Cody PD 385 150 38.96% 0.156 12 8.00% Cody PD 19 15 78.95% 0.164 2 10.53%Other 14 1 7.14% OtherPark Service 4 Park ServicePark SO 91 17 18.68% 0.131 1 5.88% Park SO 5 5 100.00% 0.194Powell PD 202 97 48.02% 0.155 7 7.22% Powell PD 8 7 87.50% 0.191 2 25.00%WHP 27 19 70.37% 0.209 4 21.05% WHP 7 6 85.71% 0.147 2 28.57%
Underage DUI ArrestsCounty DUI Underage % DUI Ave. Drugs % DUI Department Offenses Offenses Of Total BAC Involved Drugs Inv.Park County 284 24 8.45% 0.109 5 20.83%Cody PD 150 14 9.33% 0.103 3 21.43%Other 1Park ServicePark SO 17 3 17.65% 0.123Powell PD 97 7 7.22% 0.112 2 28.57%WHP 19
Park County 62

Total Offenses Domestic Violence
County TotalNumber Involving
PercentInvolving
NumberInvolving
PercentInvolving County
Domestic Violence
Number Involving
PercentInvolving
NumberInvolving
PercentInvolving
Department Offenses Alcohol Alcohol Drugs Drugs Department Offenses Alcohol Alcohol Drugs DrugsPark County 723 466 64.45% 58 8.02% Park County 44 27 61.36% 1 2.27%Cody PD 385 243 63.12% 31 8.05% Cody PD 18 9 50.00% 1 5.56%Other 14 4 28.57% OtherPark Service 4 2 50.00% Park ServicePark SO 91 38 41.76% 6 6.59% Park SO 17 11 64.71%Powell PD 202 157 77.72% 17 8.42% Powell PD 9 7 77.78%WHP 27 22 81.48% 4 14.81% WHP
Felony Offenses Resisting Arrest
County FelonyNumber Involving
PercentInvolving
NumberInvolving
PercentInvolving County
Resisting Arrest
Number Involving
PercentInvolving
NumberInvolving
PercentInvolving
Department Offenses Alcohol Alcohol Drugs Drugs Department Offenses Alcohol Alcohol Drugs DrugsPark County 81 16 19.75% 11 13.58% Park County 15 13 86.67% 2 13.33%Cody PD 29 5 17.24% 4 13.79% Cody PD 4 4 100.00%Other 5 1 20.00% OtherPark Service Park ServicePark SO 20 2 10.00% 4 20.00% Park SO 2 1 50.00%Powell PD 24 7 29.17% 3 12.50% Powell PD 9 8 88.89% 2 22.22%WHP 3 1 33.33% WHP
Misdemeanor Offenses Assault
CountyMisde-meanor
Number Involving
PercentInvolving
NumberInvolving
PercentInvolving County Assault
Number Involving
PercentInvolving
NumberInvolving
PercentInvolving
Department Offenses Alcohol Alcohol Drugs Drugs Department Offenses Alcohol Alcohol Drugs DrugsPark County 549 395 71.95% 41 7.47% Park County 34 21 61.76% 1 2.94%Cody PD 292 203 69.52% 23 7.88% Cody PD 15 10 66.67%Other 7 3 42.86% OtherPark Service 2 Park ServicePark SO 64 32 50.00% 4 6.25% Park SO 3 1 33.33%Powell PD 161 138 85.71% 10 6.21% Powell PD 15 10 66.67% 1 6.67%WHP 23 19 82.61% 4 17.39% WHP 1
Alcohol and Drug Involvement
Park County 63
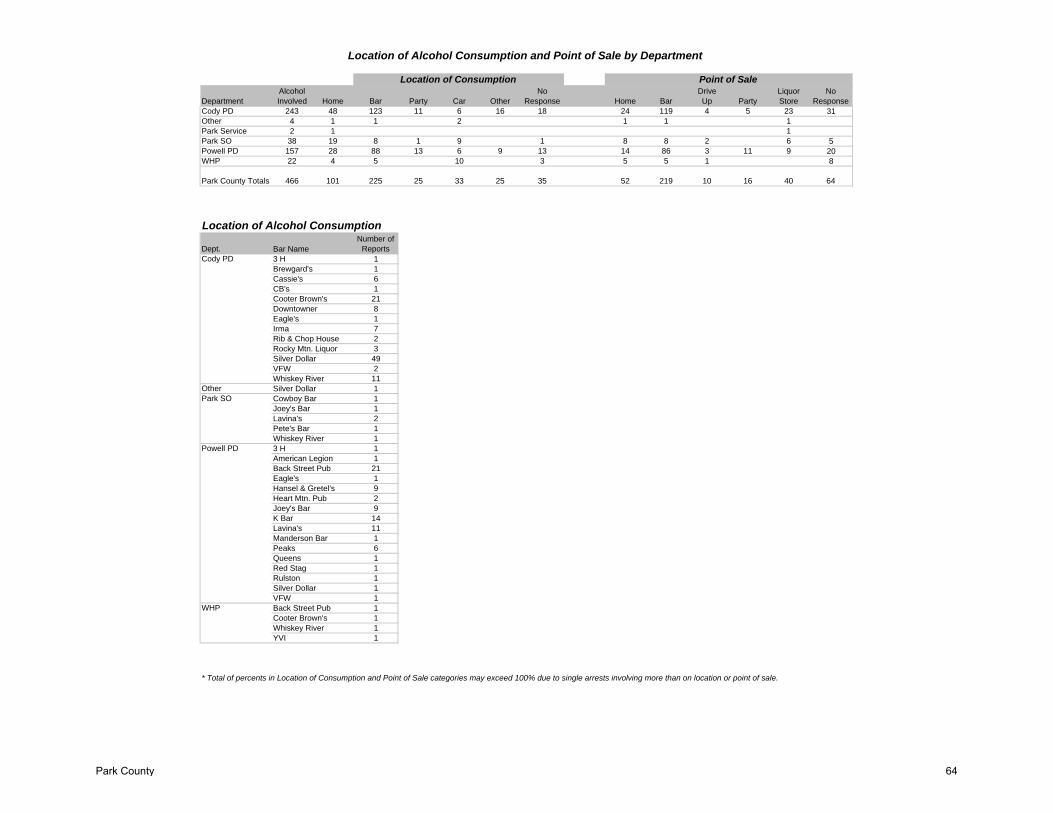
Alcohol No Drive Liquor No Department Involved Home Bar Party Car Other Response Home Bar Up Party Store ResponseCody PD 243 48 123 11 6 16 18 24 119 4 5 23 31Other 4 1 1 2 1 1 1Park Service 2 1 1Park SO 38 19 8 1 9 1 8 8 2 6 5Powell PD 157 28 88 13 6 9 13 14 86 3 11 9 20WHP 22 4 5 10 3 5 5 1 8
Park County Totals 466 101 225 25 33 25 35 52 219 10 16 40 64
Location of Alcohol Consumption
Dept.Number of
ReportsCody PD 3 H 1
Brewgard's 1Cassie's 6CB's 1Cooter Brown's 21Downtowner 8Eagle's 1Irma 7Rib & Chop House 2Rocky Mtn. Liquor 3Silver Dollar 49VFW 2Whiskey River 11
Other Silver Dollar 1Park SO Cowboy Bar 1
Joey's Bar 1Lavina's 2Pete's Bar 1Whiskey River 1
Powell PD 3 H 1American Legion 1Back Street Pub 21Eagle's 1Hansel & Gretel's 9Heart Mtn. Pub 2Joey's Bar 9K Bar 14Lavina's 11Manderson Bar 1Peaks 6Queens 1Red Stag 1Rulston 1Silver Dollar 1VFW 1
WHP Back Street Pub 1Cooter Brown's 1Whiskey River 1YVI 1
* Total of percents in Location of Consumption and Point of Sale categories may exceed 100% due to single arrests involving more than on location or point of sale.
Location of Alcohol Consumption and Point of Sale by Department
Location of Consumption Point of Sale
Bar Name
Park County 64

Numbers by Department
CountyTotal
OffensesMisde-meanor Felony
Domestic Violence
Resist Arrest Assault
Public Intox
Alcohol Involved
DrugsInvolved
Traffic Crash Female Male
Unknown Gender
Average Age
Platte County 277 232 20 25 4 17 2 190 39 12 62 212 3 33.62Game & Fish 4 4 3 1 4 37.00Guernsey PD 5 3 1 1 1 3 1 5 38.75Other 7 6 1 1 6 3 4 21.50Platte SO 43 37 4 11 1 23 5 6 7 36 35.67State Parks 10 7 1 1 9 1 3 7 24.22Wheatland PD 172 143 10 11 4 21 1 122 16 5 42 127 3 33.80WHP 36 32 4 1 24 16 7 29 33.85
Percents by Department *
CountyTotal
OffensesMisde-meanor Felony
Domestic Violence
Resist Arrest Assault
Public Intox
Alcohol Involved
DrugsInvolved
Traffic Crash Female Male
Unkown Gender
Platte County 277 83.75% 7.22% 9.03% 1.44% 6.14% 0.72% 68.59% 14.08% 4.33% 22.38% 76.53% 1.08%Game & Fish 4 100.00% 75.00% 25.00% 100.00%Guernsey PD 5 60.00% 20.00% 20.00% 20.00% 60.00% 20.00% 100.00%Other 7 85.71% 14.29% 14.29% 85.71% 42.86% 57.14%Platte SO 43 86.05% 9.30% 25.58% 2.33% 53.49% 11.63% 13.95% 16.28% 83.72%State Parks 10 70.00% 10.00% 10.00% 90.00% 10.00% 30.00% 70.00%Wheatland PD 172 83.14% 5.81% 6.40% 2.33% 12.21% 0.58% 70.93% 9.30% 2.91% 24.42% 73.84% 1.74%WHP 36 88.89% 11.11% 2.78% 66.67% 44.44% 19.44% 80.56%
* Total percents may not equal 100 due to lack of information, or a single arrest involving multiple crimes.
Platte County ArrestsOctober 1, 2007 - September 30, 2008
Platte County 65

MIP Arrests Meth, Drugs & Public Intoxication
County DUI MIP % MIP Average County Total Meth Drugs Public Pub. Intox. Department Offenses Arrests to DUI MIP BAC Department Offenses Involved Involved Intox. Ave. BACPlatte County 135 27 20.00% 0.072 Platte County 277 7 39 2 -Game & Fish 3 Game & Fish 4 1Guernsey PD 2 Guernsey PD 5Other 1 4 400.00% 0.008 Other 7Platte SO 14 4 28.57% 0.074 Platte SO 43 5State Parks 4 4 100.00% 0.114 State Parks 10 1Wheatland PD 85 13 15.29% 0.092 Wheatland PD 172 4 16 1WHP 26 2 7.69% WHP 36 3 16 1
DUI Arrests Traffic Crashes
County Total DUI % DUI Ave.DUI
Involving% DUI
Involving County Traffic Alcohol % Alcohol Average Drugs % Drugs Department Offenses Offenses Of Total BAC Drugs Drugs Department Crashes Involved Involved BAC Involved InvolvedPlatte County 277 135 48.74% 0.137 22 16.30% Platte County 12 9 75.00% 0.151 2 16.67%Game & Fish 4 3 75.00% 0.115 Game & FishGuernsey PD 5 2 40.00% 0.165 Guernsey PD 1 1 100.00% 0.180Other 7 1 14.29% OtherPlatte SO 43 14 32.56% 0.134 3 21.43% Platte SO 6 4 66.67% 0.149 2 33.33%State Parks 10 4 40.00% 0.100 1 25.00% State ParksWheatland PD 172 85 49.42% 0.142 6 7.06% Wheatland PD 5 4 80.00% 0.130WHP 36 26 72.22% 0.131 12 46.15% WHP
Underage DUI ArrestsCounty DUI Underage % DUI Ave. Drugs % DUI Department Offenses Offenses Of Total BAC Involved Drugs Inv.Platte County 135 13 9.63% 0.122 4 30.77%Game & Fish 3Guernsey PD 2Other 1Platte SO 14State Parks 4 1 25.00% 0.001Wheatland PD 85 8 9.41% 0.170 3 37.50%WHP 26 4 15.38% 0.147 1 25.00%
Platte County 66

Total Offenses Domestic Violence
County TotalNumber Involving
PercentInvolving
NumberInvolving
PercentInvolving County
Domestic Violence
Number Involving
PercentInvolving
NumberInvolving
PercentInvolving
Department Offenses Alcohol Alcohol Drugs Drugs Department Offenses Alcohol Alcohol Drugs DrugsPlatte County 277 190 68.59% 39 14.08% Platte County 25 17 68.00% 0Game & Fish 4 3 75.00% 1 25.00% Game & FishGuernsey PD 5 3 60.00% Guernsey PD 1Other 7 6 85.71% Other 1 1 100.00%Platte SO 43 23 53.49% 5 11.63% Platte SO 11 4 36.36%State Parks 10 9 90.00% 1 10.00% State Parks 1 1 100.00%Wheatland PD 172 122 70.93% 16 9.30% Wheatland PD 11 11 100.00%WHP 36 24 66.67% 16 44.44% WHP
Felony Offenses Resisting Arrest
County FelonyNumber Involving
PercentInvolving
NumberInvolving
PercentInvolving County
Resisting Arrest
Number Involving
PercentInvolving
NumberInvolving
PercentInvolving
Department Offenses Alcohol Alcohol Drugs Drugs Department Offenses Alcohol Alcohol Drugs DrugsPlatte County 20 4 20.00% 6 30.00% Platte County 4 3 75.00% 0Game & Fish Game & FishGuernsey PD 1 1 100.00% Guernsey PDOther 1 OtherPlatte SO 4 2 50.00% 1 25.00% Platte SOState Parks State ParksWheatland PD 10 1 10.00% 1 10.00% Wheatland PD 4 3 75.00%WHP 4 4 100.00% WHP
Misdemeanor Offenses Assault
CountyMisde-meanor
Number Involving
PercentInvolving
NumberInvolving
PercentInvolving County Assault
Number Involving
PercentInvolving
NumberInvolving
PercentInvolving
Department Offenses Alcohol Alcohol Drugs Drugs Department Offenses Alcohol Alcohol Drugs DrugsPlatte County 232 166 71.55% 34 14.66% Platte County 17 16 94.12% 0Game & Fish 4 3 75.00% 1 25.00% Game & FishGuernsey PD 3 1 33.33% Guernsey PD 1 1 100.00%Other 6 6 100.00% OtherPlatte SO 37 20 54.05% 3 8.11% Platte SO 1 1 100.00%State Parks 7 6 85.71% State Parks 1 1 100.00%Wheatland PD 143 107 74.83% 16 11.19% Wheatland PD 21 13 61.90%WHP 32 23 71.88% 14 43.75% WHP
Alcohol and Drug Involvement
Platte County 67

Alcohol No Drive Liquor No Department Involved Home Bar Party Car Other Response Home Bar Up Party Store ResponseGame & Fish 3 2 2 3Guernsey PD 3 1 1 1 1 1 1Other 6 2 4 1 1 2 1Platte SO 23 4 4 3 1 5 5 1 5 2 5 7State Parks 9 1 4 3 1 4 4Wheatland PD 122 38 39 8 6 9 22 15 41 8 7 15 28WHP 24 2 5 4 6 3 4 4 5 4 4 5Platte County Totals 190 45 50 21 13 22 38 21 54 8 18 33 42
Location of Alcohol Consumption
Dept.Number of
ReportsPlatte SO Bowling Alley 1
Commodore 2Crazy Tony's 1Vimbo's 1
State Parks Glendo Bar 1Wheatland PD Big A 4
Bowling Alley 1Casey's 1Commodore 13Landmark 11Moose Lodge 1Timber House 5Vimbo's 1
WHP Big A 1Commodore 2Fireside/Gillette 1
* Total of percents in Location of Consumption and Point of Sale categories may exceed 100% due to single arrests involving more than on location or point of sale.
Location of Alcohol Consumption and Point of Sale by Department
Location of Consumption Point of Sale
Bar Name
Platte County 68

Numbers by Department
CountyTotal
OffensesMisde-meanor Felony
Domestic Violence
Resist Arrest Assault
Public Intox
Alcohol Involved
DrugsInvolved
Traffic Crash Female Male
Unknown Gender
Average Age
Sheridan County 879 680 47 39 18 23 91 645 78 50 155 709 15 33.71Court 3 3 1 1 3 23.67DCI 7 4 3 5 4 3 28.50Other 27 20 1 2 1 3 12 2 1 4 21 2 28.96Ranchester PD 6 6 3 3 6 29.50Sheridan PD 537 416 22 20 16 8 81 417 45 20 98 433 6 33.60Sheridan SO 255 193 19 17 2 14 3 172 22 14 43 205 7 34.41WHP 44 38 2 1 40 3 15 6 38 36.88
Percents by Department *
CountyTotal
OffensesMisde-meanor Felony
Domestic Violence
Resist Arrest Assault
Public Intox
Alcohol Involved
DrugsInvolved
Traffic Crash Female Male
Unkown Gender
Sheridan County 879 77.36% 5.35% 4.44% 2.05% 2.62% 10.35% 73.38% 8.87% 5.69% 17.63% 80.66% 1.71%Court 3 100.00% 33.33% 33.33% 100.00%DCI 7 57.14% 42.86% 71.43% 57.14% 42.86%Other 27 74.07% 3.70% 7.41% 3.70% 11.11% 44.44% 7.41% 3.70% 14.81% 77.78% 7.41%Ranchester PD 6 100.00% 50.00% 50.00% 100.00%Sheridan PD 537 77.47% 4.10% 3.72% 2.98% 1.49% 15.08% 77.65% 8.38% 3.72% 18.25% 80.63% 1.12%Sheridan SO 255 75.69% 7.45% 6.67% 0.78% 5.49% 1.18% 67.45% 8.63% 5.49% 16.86% 80.39% 2.75%WHP 44 86.36% 4.55% 2.27% 90.91% 6.82% 34.09% 13.64% 86.36%
* Total percents may not equal 100 due to lack of information, or a single arrest involving multiple crimes.
Sheridan County ArrestsOctober 1, 2007 - September 30, 2008
Sheridan County 69

MIP Arrests Meth, Drugs & Public Intoxication
County DUI MIP % MIP Average County Total Meth Drugs Public Pub. Intox. Department Offenses Arrests to DUI MIP BAC Department Offenses Involved Involved Intox. Ave. BACSheridan County 396 19 4.80% 0.092 Sheridan County 879 17 78 91 0.247Court 1 1 100.00% Court 3 1DCI DCI 7 1 5Other 7 Other 27 1 2 3 0.236Ranchester PD 1 Ranchester PD 6 3Sheridan PD 233 16 6.87% 0.090 Sheridan PD 537 9 45 81 0.252Sheridan SO 118 2 1.69% 0.203 Sheridan SO 255 4 22 3 0.130WHP 36 WHP 44 2 3 1
DUI Arrests Traffic Crashes
County Total DUI % DUI Ave.DUI
Involving% DUI
Involving County Traffic Alcohol % Alcohol Average Drugs % Drugs Department Offenses Offenses Of Total BAC Drugs Drugs Department Crashes Involved Involved BAC Involved InvolvedSheridan County 879 396 45.05% 0.154 19 4.80% Sheridan County 50 48 96.00% 0.141 2 4.00%Court 3 1 33.33% 0.170 CourtDCI 7 DCIOther 27 7 25.93% 0.118 1 14.29% Other 1 1 100.00% 0.125Ranchester PD 6 1 16.67% Ranchester PDSheridan PD 537 233 43.39% 0.151 12 5.15% Sheridan PD 20 19 95.00% 0.148 1 5.00%Sheridan SO 255 118 46.27% 0.160 6 5.08% Sheridan SO 14 13 92.86% 0.133 1 7.14%WHP 44 36 81.82% 0.160 WHP 15 15 100.00% 0.144
Underage DUI ArrestsCounty DUI Underage % DUI Ave. Drugs % DUI Department Offenses Offenses Of Total BAC Involved Drugs Inv.Sheridan County 396 24 6.06% 0.122 2 8.33%Court 1DCIOther 7 2 28.57% 0.088Ranchester PD 1Sheridan PD 233 13 5.58% 0.126 2 15.38%Sheridan SO 118 7 5.93% 0.120WHP 36 2 5.56% 0.170
Sheridan County 70

Total Offenses Domestic Violence
County TotalNumber Involving
PercentInvolving
NumberInvolving
PercentInvolving County
Domestic Violence
Number Involving
PercentInvolving
NumberInvolving
PercentInvolving
Department Offenses Alcohol Alcohol Drugs Drugs Department Offenses Alcohol Alcohol Drugs DrugsSheridan County 879 645 73.38% 78 8.87% Sheridan County 39 25 64.10% 3 7.69%Court 3 1 33.33% 1 33.33% CourtDCI 7 5 71.43% DCIOther 27 12 44.44% 2 7.41% Other 2 2 100.00%Ranchester PD 6 3 50.00% Ranchester PDSheridan PD 537 417 77.65% 45 8.38% Sheridan PD 20 14 70.00% 2 10.00%Sheridan SO 255 172 67.45% 22 8.63% Sheridan SO 17 9 52.94% 1 5.88%WHP 44 40 90.91% 3 6.82% WHP
Felony Offenses Resisting Arrest
County FelonyNumber Involving
PercentInvolving
NumberInvolving
PercentInvolving County
Resisting Arrest
Number Involving
PercentInvolving
NumberInvolving
PercentInvolving
Department Offenses Alcohol Alcohol Drugs Drugs Department Offenses Alcohol Alcohol Drugs DrugsSheridan County 47 12 25.53% 13 27.66% Sheridan County 18 16 88.89% 0Court CourtDCI 3 3 100.00% DCIOther 1 OtherRanchester PD Ranchester PDSheridan PD 22 7 31.82% 4 18.18% Sheridan PD 16 14 87.50%Sheridan SO 19 5 26.32% 4 21.05% Sheridan SO 2 2 100.00%WHP 2 2 100.00% WHP
Misdemeanor Offenses Assault
CountyMisde-meanor
Number Involving
PercentInvolving
NumberInvolving
PercentInvolving County Assault
Number Involving
PercentInvolving
NumberInvolving
PercentInvolving
Department Offenses Alcohol Alcohol Drugs Drugs Department Offenses Alcohol Alcohol Drugs DrugsSheridan County 680 512 75.29% 58 8.53% Sheridan County 23 16 69.57% 0Court 3 1 33.33% 1 33.33% CourtDCI 4 2 50.00% DCIOther 20 8 40.00% 2 10.00% Other 1 1 100.00%Ranchester PD 6 3 50.00% Ranchester PDSheridan PD 416 333 80.05% 34 8.17% Sheridan PD 8 5 62.50%Sheridan SO 193 133 68.91% 16 8.29% Sheridan SO 14 10 71.43%WHP 38 34 89.47% 3 7.89% WHP
Alcohol and Drug Involvement
Sheridan County 71

Alcohol No Drive Liquor No Department Involved Home Bar Party Car Other Response Home Bar Up Party Store ResponseCourt 1DCIOther 12 1 2 1 2 4 1 3 1 1 5Ranchester PD 3 1 2 1 2Sheridan PD 417 37 113 20 14 9 181 14 108 21 16 176Sheridan SO 172 21 37 10 12 4 69 9 38 1 7 8 78WHP 40 3 9 1 4 2 16 1 9 1 5 17Sheridan County Totals 645 62 161 33 30 17 272 25 158 3 29 30 278
Location of Alcohol Consumption
Dept.Number of
ReportsOther Astro 1
Rainbow 1Sheridan PD Beaver Creek 9
Buddy's Place 10Cloud Peak Lanes 1Eagle's 2Last Chance 1Mint 19Mountain Inn 1OK Corral 3Pony 1Rails 8Rainbow 16Rendezvous 2Sanford's 1Scooter's 2Sheridan Center 1Shriner's 1Silver Spur 1Stair Licker 1Sutton's 7VFW 1Willy's 4
Sheridan SO 3 Pole 1Bear Lodge 1Buddy's Place 8Crazy Woman 1Ladore 1Mint 3Mountain Inn 3Piney 1Rails 2Rainbow 2Silver Spur 1Street Dance 1Sutton's 1Wagon Box 1Willy's 1
WHP Flanigan's 1Mint 1Park 1Pony 2Wagon Box 1
* Total of percents in Location of Consumption and Point of Sale categories may exceed 100% due to single arrests involving more than on location or point of sale.
Location of Alcohol Consumption and Point of Sale by Department
Location of Consumption Point of Sale
Bar Name
Sheridan County 72

Numbers by Department
CountyTotal
OffensesMisde-meanor Felony
Domestic Violence
Resist Arrest Assault
Public Intox
Alcohol Involved
DrugsInvolved
Traffic Crash Female Male
Unknown Gender
Average Age
Sublette County 345 255 41 25 1 13 39 213 36 18 43 292 10 33.94Game & Fish 2 2 2 2 39.00Other 5 3 1 2 1 2 2 47.20Sublette SO 286 210 38 25 1 12 39 180 30 13 38 242 6 33.22WHP 52 40 3 31 3 3 4 46 2 36.31
Percents by Department *
CountyTotal
OffensesMisde-meanor Felony
Domestic Violence
Resist Arrest Assault
Public Intox
Alcohol Involved
DrugsInvolved
Traffic Crash Female Male
Unkown Gender
Sublette County 345 73.91% 11.88% 7.25% 0.29% 3.77% 11.30% 61.74% 10.43% 5.22% 12.46% 84.64% 2.90%Game & Fish 2 100.00% 100.00% 100.00%
Sublette County ArrestsOctober 1, 2007 - September 30, 2008
Other 5 60.00% 20.00% 40.00% 20.00% 40.00% 40.00%Sublette SO 286 73.43% 13.29% 8.74% 0.35% 4.20% 13.64% 62.94% 10.49% 4.55% 13.29% 84.62% 2.10%WHP 52 76.92% 5.77% 59.62% 5.77% 5.77% 7.69% 88.46% 3.85%
* Total percents may not equal 100 due to lack of information, or a single arrest involving multiple crimes.
Sublette County 73

MIP Arrests Meth, Drugs & Public Intoxication
County DUI MIP % MIP Average County Total Meth Drugs Public Pub. Intox. Department Offenses Arrests to DUI MIP BAC Department Offenses Involved Involved Intox. Ave. BACSublette County 110 19 17.27% 0.100 Sublette County 345 9 36 39 0.172Game & Fish Game & Fish 2Other 2 Other 5Sublette SO 77 19 24.68% 0.110 Sublette SO 286 8 30 39 0.172WHP 31 WHP 52 1 3
DUI Arrests Traffic Crashes
County Total DUI % DUI Ave.DUI
Involving% DUI
Involving County Traffic Alcohol % Alcohol Average Drugs % Drugs Department Offenses Offenses Of Total BAC Drugs Drugs Department Crashes Involved Involved BAC Involved InvolvedSublette County 345 110 31.88% 0.144 5 4.55% Sublette County 18 16 88.89% 0.154 1 5.56%Game & Fish 2 Game & Fish 2Other 5 2 40.00% 0.141 OtherSublette SO 286 77 26.92% 0.152 3 3.90% Sublette SO 13 13 100.00% 0.154WHP 52 31 59.62% 0.123 2 6.45% WHP 3 3 100.00% 1 33.33%
Underage DUI ArrestsCounty DUI Underage % DUI Ave. Drugs % DUI Department Offenses Offenses Of Total BAC Involved Drugs Inv.Sublette County 110 4 3.64% 0.135 0Game & FishOther 2Sublette SO 77 4 5.19% 0.135WHP 31
Sublette County 74

Total Offenses Domestic Violence
County TotalNumber Involving
PercentInvolving
NumberInvolving
PercentInvolving County
Domestic Violence
Number Involving
PercentInvolving
NumberInvolving
PercentInvolving
Department Offenses Alcohol Alcohol Drugs Drugs Department Offenses Alcohol Alcohol Drugs DrugsSublette County 345 213 61.74% 36 10.43% Sublette County 25 7 28.00% 1 4.00%Game & Fish 2 Game & FishOther 5 2 40.00% OtherSublette SO 286 180 62.94% 30 10.49% Sublette SO 25 7 28.00% 1 4.00%WHP 52 31 59.62% 3 5.77% WHP
Felony Offenses Resisting Arrest
County FelonyNumber Involving
PercentInvolving
NumberInvolving
PercentInvolving County
Resisting Arrest
Number Involving
PercentInvolving
NumberInvolving
PercentInvolving
Department Offenses Alcohol Alcohol Drugs Drugs Department Offenses Alcohol Alcohol Drugs DrugsSublette County 41 6 14.63% 14 34.15% Sublette County 1 1 100.00% 1 100.00%Game & Fish Game & FishOther OtherSublette SO 38 6 15.79% 11 28.95% Sublette SO 1 1 100.00% 1 100.00%WHP 3 3 100.00% WHP
Misdemeanor Offenses Assault
CountyMisde-meanor
Number Involving
PercentInvolving
NumberInvolving
PercentInvolving County Assault
Number Involving
PercentInvolving
NumberInvolving
PercentInvolving
Department Offenses Alcohol Alcohol Drugs Drugs Department Offenses Alcohol Alcohol Drugs DrugsSublette County 255 177 69.41% 14 5.49% Sublette County 13 11 84.62% 0Game & Fish 2 Game & FishOther 3 Other 1Sublette SO 210 151 71.90% 14 6.67% Sublette SO 12 11 91.67%WHP 40 26 65.00% WHP
Alcohol and Drug Involvement
Sublette County 75

Alcohol No Drive Liquor No Department Involved Home Bar Party Car Other Response Home Bar Up Party Store ResponseGame & FishOther 2 1 1 1 1Sublette SO 180 30 56 7 7 12 47WHP 31 1 5 3 2 14 5 1 3 13Sublette County Totals 213 31 61 10 7 15 62 0 5 1 0 4 14
Location of Alcohol Consumption
Dept.Number of
ReportsSublette SO Corral 26
Cowboy 3Green River Bar 2Lakeside Lodge 1Silver Spur 3Sportsman's 1Stockman's 5VFW 1Wheel Inn 2
WHP Corral 2Green River Bar 1VFW 1
* Total of percents in Location of Consumption and Point of Sale categories may exceed 100% due to single arrests involving more than on location or point of sale.
Location of Alcohol Consumption and Point of Sale by Department
Location of Consumption Point of Sale
Bar Name
Sublette County 76

Numbers by Department
CountyTotal
OffensesMisde-meanor Felony
Domestic Violence
Resist Arrest Assault
Public Intox
Alcohol Involved
DrugsInvolved
Traffic Crash Female Male
Unknown Gender
Average Age
Sweetwater County 2906 2624 309 132 62 121 565 1604 465 112 502 2400 4 30.99Court 54 38 12 2 9 6 1 11 43 27.74DCI 10 2 9 9 1 9 31.50Green River PD 429 397 31 35 11 18 105 238 53 8 78 351 31.08Other 116 91 23 5 13 21 20 51 28 2 20 93 2 30.30Rock Springs PD 1445 1300 177 57 26 59 424 793 269 46 260 1184 3 30.69Sweetwater SO 657 614 40 35 10 15 14 383 75 34 101 556 30.77Wamsutter PD 4 4 17 1 2 1 4 46.25WHP 191 178 2 5 2 128 24 31 160 34.79
Percents by Department *
CountyTotal
OffensesMisde-meanor Felony
Domestic Violence
Resist Arrest Assault
Public Intox
Alcohol Involved
DrugsInvolved
Traffic Crash Female Male
Unkown Gender
Sweetwater County 2906 90.30% 10.63% 4.54% 2.13% 4.16% 19.44% 55.20% 16.00% 3.85% 17.27% 82.59% 0.14%Court 54 70.37% 22.22% 3.70% 16.67% 11.11% 1.85% 20.37% 79.63%DCI 10 20.00% 90.00% 90.00% 10.00% 90.00%Green River PD 429 92.54% 7.23% 8.16% 2.56% 4.20% 24.48% 55.48% 12.35% 1.86% 18.18% 81.82%Other 116 78.45% 19.83% 4.31% 11.21% 18.10% 17.24% 43.97% 24.14% 1.72% 17.24% 80.17% 1.72%Rock Springs PD 1445 89.97% 12.25% 3.94% 1.80% 4.08% 29.34% 54.88% 18.62% 3.18% 17.99% 81.94% 0.21%Sweetwater SO 657 93.46% 6.09% 5.33% 1.52% 2.28% 2.13% 58.30% 11.42% 5.18% 15.37% 84.63%Wamsutter PD 4 100.00% 425.00% 25.00% 50.00% 25.00% 100.00%WHP 191 93.19% 1.05% 2.62% 1.05% 67.02% 12.57% 16.23% 83.77%
* Total percents may not equal 100 due to lack of information, or a single arrest involving multiple crimes.
Sweetwater County ArrestsOctober 1, 2007 - September 30, 2008
Sweetwater County 77

MIP Arrests Meth, Drugs & Public Intoxication
County DUI MIP % MIP Average County Total Meth Drugs Public Pub. Intox.Department Offenses Arrests to DUI MIP BAC Department Offenses In ol ed In ol ed Into A e BAC Department Offenses Arrests to DUI MIP BAC Department Offenses Involved Involved Intox. Ave. BAC
Sweetwater County 888 50 5.63% 0.096 Sweetwater County 2906 150 465 565 0.167Court 2 7 350.00% Court 54 3 6DCI DCI 10 9 9Green River PD 117 4 3.42% Green River PD 429 15 53 105 0.127Other 22 6 27.27% 0.081 Other 116 6 28 20 0.201Rock Springs PD 297 Rock Springs PD 1445 98 269 424 0.171Sweetwater SO 321 26 8 10% 0 105 Sweetwater SO 657 15 75 14 0 165Sweetwater SO 321 26 8.10% 0.105 Sweetwater SO 657 15 75 14 0.165Wamsutter PD 2 Wamsutter PD 4 1WHP 127 7 5.51% 0.083 WHP 191 4 24 2
DUI Arrests Traffic Crashes
County Total DUI % DUI AveDUI
Involving% DUI
Involving County Traffic Alcohol % Alcohol Average Drugs % DrugsCounty Total DUI % DUI Ave. Involving Involving County Traffic Alcohol % Alcohol Average Drugs % Drugs Department Offenses Offenses Of Total BAC Drugs Drugs Department Crashes Involved Involved BAC Involved InvolvedSweetwater County 2906 888 30.56% 0.146 51 5.74% Sweetwater County 112 78 69.64% 0.149 5 4.46%Court 54 2 3.70% Court 1DCI 10 DCIGreen River PD 429 117 27.27% 0.146 5 4.27% Green River PD 8 7 87.50% 0.174Other 116 22 18.97% 0.146 4 18.18% Other 2 1 50.00%Rock Springs PD 1445 297 20.55% 0.150 18 6.06% Rock Springs PD 46 32 69.57% 0.133 3 6.52%Rock Springs PD 1445 297 20.55% 0.150 18 6.06% Rock Springs PD 46 32 69.57% 0.133 3 6.52%Sweetwater SO 657 321 48.86% 0.143 14 4.36% Sweetwater SO 34 24 70.59% 0.168 1 2.94%Wamsutter PD 4 2 50.00% 1 50.00% Wamsutter PDWHP 191 127 66.49% 0.141 9 7.09% WHP 21 14 66.67% 0.1380 1 4.76%
Underage DUI ArrestsCounty DUI Underage % DUI Ave. Drugs % DUICounty DUI Underage % DUI Ave. Drugs % DUI Department Offenses Offenses Of Total BAC Involved Drugs Inv.Sweetwater County 888 93 10.47% 0.115 13 13.98%Court 2DCIGreen River PD 117 7 5.98% 0.135 1 14.29%Other 22 2 9.09% 0.090Rock Springs PD 297 26 8.75% 0.136 4 15.38%p gSweetwater SO 321 45 14.02% 0.110 7 15.56%Wamsutter PD 2WHP 127 13 10.24% 0.088 1 7.69%
Sweetwater County 78

Total Offenses Domestic Violence
County TotalNumber Involving
PercentInvolving
NumberInvolving
PercentInvolving County
Domestic Violence
Number Involving
PercentInvolving
NumberInvolving
PercentInvolving
Department Offenses Alcohol Alcohol Drugs Drugs Department Offenses Alcohol Alcohol Drugs Drugs
Sweetwater County 2906 1604 55.20% 465 16.00% Sweetwater County 132 52 39.39% 7 5.30%Court 54 9 16.67% 6 11.11% CourtDCI 10 9 90.00% DCIGreen River PD 429 238 55.48% 53 12.35% Green River PD 35 8 22.86% 2 5.71%Other 116 51 43.97% 28 24.14% Other 5 3 60.00% 1 20.00%Rock Springs PD 1445 793 54.88% 269 18.62% Rock Springs PD 57 28 49.12% 4 7.02%Sweetwater SO 657 383 58.30% 75 11.42% Sweetwater SO 35 13 37.14%Wamsutter PD 4 2 50.00% 1 25.00% Wamsutter PDWHP 191 128 67.02% 24 12.57% WHP
Felony Offenses Resisting Arrest
County FelonyNumber Involving
PercentInvolving
NumberInvolving
PercentInvolving County
Resisting Arrest
Number Involving
PercentInvolving
NumberInvolving
PercentInvolving
Department Offenses Alcohol Alcohol Drugs Drugs Department Offenses Alcohol Alcohol Drugs Drugs
Sweetwater County 309 51 16.50% 88 28.48% Sweetwater County 62 40 64.52% 3 4.84%Court 12 CourtDCI 9 9 100.00% DCIGreen River PD 31 5 16.13% 3 9.68% Green River PD 11 8 72.73%Other 23 6 26.09% 6 26.09% Other 13 7 53.85% 2 15.38%Rock Springs PD 177 30 16.95% 51 28.81% Rock Springs PD 26 19 73.08% 1 3.85%Sweetwater SO 40 8 20.00% 12 30.00% Sweetwater SO 10 5 50.00%Wamsutter PD 17 2 11.76% 7 41.18% Wamsutter PDWHP WHP 2 1 50.00%
Misdemeanor Offenses Assault
CountyMisde-meanor
Number Involving
PercentInvolving
NumberInvolving
PercentInvolving County Assault
Number Involving
PercentInvolving
NumberInvolving
PercentInvolving
Department Offenses Alcohol Alcohol Drugs Drugs Department Offenses Alcohol Alcohol Drugs Drugs
Sweetwater County 2624 1523 58.04% 430 16.39% Sweetwater County 121 49 40.50% 11 9.09%Court 38 7 18.42% 5 13.16% Court 2DCI 2 1 50.00% DCIGreen River PD 397 227 57.18% 53 13.35% Green River PD 18 5 27.78% 2 11.11%Other 91 39 42.86% 23 25.27% Other 21 12 57.14% 3 14.29%Rock Springs PD 1300 754 58.00% 256 19.69% Rock Springs PD 59 25 42.37% 5 8.47%Sweetwater SO 614 369 60.10% 71 11.56% Sweetwater SO 15 5 33.33% 1 6.67%Wamsutter PD 4 2 50.00% 1 25.00% Wamsutter PD 1WHP 178 125 70.22% 20 11.24% WHP 5 2 40.00%
Alcohol and Drug Involvement
Sweetwater County 79

Alcohol No Drive Liquor No Department Involved Home Bar Party Car Other Response Home Bar Up Party Store ResponseCourt 9 8 8DCIGreen River PD 238 5 25 19 5 9 171 26 18 3 188Other 51 2 1 1 3 44 1 1 49Rock Springs PD 793 30 63 29 11 6 645 2 65 2 28 19 667Sweetwater SO 383 13 26 6 51 3 285 2 25 6 8 336Wamsutter PD 2 2 2WHP 128 4 9 4 11 100 2 8 5 2 111Sweetwater County Totals 1604 54 124 59 81 18 1255 6 125 2 58 32 1361
Location of Alcohol Consumption
Dept.Number of
ReportsGreen River PD Brewery 1
Clearview Lanes 1Club 86 2Eagle's 1Green Gander 4Liquid Emotions 2Mast 10Ponderosa 2Red Feather 1Silver Arrow 1
Other Mast 1Rock Springs PD Applebee's 3
Astro 18Bomber's 3Budda Bob's 6Fiesta Guadalajara 1Joe's 1Johnny Mac's 7Killpepper's 7Millenium 3Park Lounge 1Poor House 2Porky's 4Sands 1Satellite 2Toastmaster 2Wild Horse 2
Sweetwater SO Applebee's 1Astro 8Casey 1Club 86 1Killpepper's 1Little America 1Mast 2Millenium 1Park Lounge 1Satellite 7
WHP Astro 2Bomber's 2Killpepper's 1Millenium 1Porky's 1Sammy Brown 1Ted's Supper Club 1
* Total of percents in Location of Consumption and Point of Sale categories may exceed 100% due to single arrests involving more than on location or point of sale.
Location of Alcohol Consumption and Point of Sale by Department
Location of Consumption Point of Sale
Bar Name
Sweetwater County 80

Numbers by Department
CountyTotal
OffensesMisde-meanor Felony
Domestic Violence
Resist Arrest Assault
Public Intox
Alcohol Involved
DrugsInvolved
Traffic Crash Female Male
Unknown Gender
Average Age
Teton County 1001 860 28 47 4 12 272 821 69 43 149 833 19 32.69Jackson PD 627 532 16 25 2 8 233 549 37 15 92 530 5 32.01Other 8 4 1 2 6 1 4 4 35.63Park Service PD 26 23 10 26 4 1 4 21 1 35.58Teton SO 282 249 11 21 2 4 26 199 22 16 49 226 7 33.07WHP 58 52 1 1 41 5 11 4 52 2 36.47
Percents by Department *
CountyTotal
OffensesMisde-meanor Felony
Domestic Violence
Resist Arrest Assault
Public Intox
Alcohol Involved
DrugsInvolved
Traffic Crash Female Male
Unkown Gender
Teton County 1001 85.91% 2.80% 4.70% 0.40% 1.20% 27.17% 82.02% 6.89% 4.30% 14.89% 83.22% 1.90%Jackson PD 627 84.85% 2.55% 3.99% 0.32% 1.28% 37.16% 87.56% 5.90% 2.39% 14.67% 84.53% 0.80%Other 8 50.00% 12.50% 25.00% 75.00% 12.50% 50.00% 50.00%Park Service PD 26 88.46% 38.46% 100.00% 15.38% 3.85% 15.38% 80.77% 3.85%Teton SO 282 88.30% 3.90% 7.45% 0.71% 1.42% 9.22% 70.57% 7.80% 5.67% 17.38% 80.14% 2.48%WHP 58 89.66% 1.72% 1.72% 70.69% 8.62% 18.97% 6.90% 89.66% 3.45%
* Total percents may not equal 100 due to lack of information, or a single arrest involving multiple crimes.
Teton County ArrestsOctober 1, 2007 - September 30, 2008
Teton County 81

MIP Arrests Meth, Drugs & Public Intoxication
County DUI MIP % MIP Average County Total Meth Drugs Public Pub. Intox.Department Offenses Arrests to DUI MIP BAC Department Offenses In ol ed In ol ed Into A e BAC Department Offenses Arrests to DUI MIP BAC Department Offenses Involved Involved Intox. Ave. BAC
Teton County 445 14 3.15% 0.152 Teton County 1001 2 69 272 0.205Jackson PD 258 6 2.33% 0.169 Jackson PD 627 37 233 0.206Other 4 Other 8 1 2Park Service PD 14 1 7.14% 0.186 Park Service PD 26 4 10 0.227Teton SO 128 7 5.47% 0.094 Teton SO 282 2 22 26 0.189WHP 41 WHP 58 5 1
DUI Arrests Traffic Crashes
County Total DUI % DUI Ave.DUI
Involving% DUI
Involving County Traffic Alcohol % Alcohol Average Drugs % Drugs Department Offenses Offenses Of Total BAC Drugs Drugs Department Crashes Involved Involved BAC Involved InvolvedTeton County 1001 445 44.46% 0.139 22 4.94% Teton County 43 35 81.40% 0.133 10 23.26%Jackson PD 627 258 41 15% 0 140 9 3 49% Jackson PD 15 12 80 00% 0 125 8 53 33%Jackson PD 627 258 41.15% 0.140 9 3.49% Jackson PD 15 12 80.00% 0.125 8 53.33%Other 8 4 50.00% 0.149 OtherPark Service PD 26 14 53.85% 0.149 2 14.29% Park Service PD 1 1 100.00% 0.270 1 100.00%Teton SO 282 128 45.39% 0.134 8 6.25% Teton SO 16 14 87.50% 0.136WHP 58 41 70.69% 0.139 3 7.32% WHP 11 8 72.73% 0.111 1 9.09%
Underage DUI ArrestsUnderage DUI ArrestsCounty DUI Underage % DUI Ave. Drugs % DUI Department Offenses Offenses Of Total BAC Involved Drugs Inv.Teton County 445 19 4.27% 0.131 0Jackson PD 258 17 6.59% 0.133Other 4Park Service PD 14Teton SO 128 4 3.13% 0.127Teton SO 128 4 3.13% 0.127WHP 41
Teton County 82

Total Offenses Domestic Violence
County TotalNumber Involving
PercentInvolving
NumberInvolving
PercentInvolving County
Domestic Violence
Number Involving
PercentInvolving
NumberInvolving
PercentInvolving
Department Offenses Alcohol Alcohol Drugs Drugs Department Offenses Alcohol Alcohol Drugs DrugsTeton County 1001 821 82.02% 69 6.89% Teton County 47 26 55.32% 2 4.26%Jackson PD 627 549 87.56% 37 5.90% Jackson PD 25 13 52.00% 1 4.00%Other 8 6 75.00% 1 12.50% OtherPark Service PD 26 26 100.00% 4 15.38% Park Service PDTeton SO 282 199 70.57% 22 7.80% Teton SO 21 12 57.14%WHP 58 41 70.69% 5 8.62% WHP 1 1 100.00% 1 100.00%
Felony Offenses Resisting Arrest
County FelonyNumber Involving
PercentInvolving
NumberInvolving
PercentInvolving County
Resisting Arrest
Number Involving
PercentInvolving
NumberInvolving
PercentInvolving
Department Offenses Alcohol Alcohol Drugs Drugs Department Offenses Alcohol Alcohol Drugs DrugsTeton County 28 11 39.29% 3 10.71% Teton County 4 4 100.00% 1 25.00%Jackson PD 16 7 43.75% 1 6.25% Jackson PD 2 2 100.00% 1 50.00%Other 1 OtherPark Service PD Park Service PDTeton SO 11 4 36.36% 2 18.18% Teton SO 2 2 100.00%WHP WHP
Misdemeanor Offenses Assault
CountyMisde-meanor
Number Involving
PercentInvolving
NumberInvolving
PercentInvolving County Assault
Number Involving
PercentInvolving
NumberInvolving
PercentInvolving
Department Offenses Alcohol Alcohol Drugs Drugs Department Offenses Alcohol Alcohol Drugs DrugsTeton County 860 719 83.60% 56 6.51% Teton County 12 11 91.67% 0Jackson PD 532 474 89.10% 32 6.02% Jackson PD 8 8 100.00%Other 4 3 75.00% 1 25.00% OtherPark Service PD 23 23 100.00% 3 13.04% Park Service PDTeton SO 249 181 72.69% 17 6.83% Teton SO 4 3 75.00%WHP 52 38 73.08% 3 5.77% WHP
Alcohol and Drug Involvement
Teton County 83

Alcohol No Drive Liquor No Department Involved Home Bar Party Car Other Response Home Bar Up Party Store ResponseJackson PD 549 76 273 37 10 63 93 33 260 1 41 82 94Other 6 1 1 1 2 1 2 2Park Service PD 26 3 5 4 5 6 4 1 10 6Teton SO 199 38 73 11 5 29 35 16 70 11 36 41WHP 41 10 13 4 5 6 2 7 13 3 7 4Teton County Totals 821 128 365 52 25 103 138 56 348 1 56 137 147
Location of Alcohol Consumption
Dept.Number of
Reports Dept.Number of
Reports
Jackson PD 43 North 30
Park Service PD Jackson Lake Lodge 2
49er 1 Million Dollar Bar 2Brew Pub 3 Teton SO 43 North 5Cadillac 3 Bistro 1Cowboy 28 Cadillac 1Cutty's 18 Calico 2Dornan's 1 Coach 12Eleanor's Covee 7 Cowboy 6Elk Lodge 2 Cutty's 2Grainery 1 Dave's Pub 1Gunbarrel 1 Dornan's 3Jackson Hole Tavern 2 Eleanor's Covee 3Koshu Wine Bar 1 Four Seasons 1Log Cabin 3 Knotty Pine 1Mangy Moose 6 Mangy Moose 10Million Dollar Bar 2 Merry Piglets 1Motel 8 1 Mezu 1Nanni's 1 Nick Wilson's 1Nick Wilson's 1 Pub Place 1Nora's 1 Sidewinders 3Pica's 1 Tavern on the Square 3Rancher 1 Togwater Bar 1Rodeo Saloon 1 Town Square Tavern 1Rusty Parrot 1 Virginian 9Shady Lady 1 Wort 1Sidewinders 1 WHP Blu 1Silver Dollar 5 Cadillac 1Snake River 5 Mangy Moose 1Snow King 3 Red Fox Saloon 1Tavern on the Square 8 Roadhouse 1Teton Village 1 Sidewinders 1Town Square Tavern 35 Silver Dollar 1Trio 1 Teton Village 1Virginian 71 Timberline 1Wort 8 Virginian 3
Other Town Square Tavern 1 Wort 1
* Total of percents in Location of Consumption and Point of Sale categories may exceed 100% due to single arrests involving more than on location or point of sale.
Location of Alcohol Consumption and Point of Sale by Department
Location of Consumption Point of Sale
Bar Name Bar Name
Teton County 84

Numbers by Department
CountyTotal
OffensesMisde-meanor Felony
Domestic Violence
Resist Arrest Assault
Public Intox
Alcohol Involved
DrugsInvolved
Traffic Crash Female Male
Unknown Gender
Average Age
Uinta County 545 488 22 48 15 37 105 390 57 27 127 409 9 31.39Evanston PD 386 350 7 35 9 31 102 300 25 16 92 291 3 30.80Lyman PD 16 14 1 5 2 1 2 13 1 5 11 27.23Mtn. View PD 5 5 1 1 5 2 1 4 24.75Other 2 2 1 1 1 30.00Uinta SO 47 37 5 5 1 4 1 34 6 5 10 35 2 33.71WHP 89 80 8 2 3 38 23 6 18 67 4 33.72
Percents by Department *
CountyTotal
OffensesMisde-meanor Felony
Domestic Violence
Resist Arrest Assault
Public Intox
Alcohol Involved
DrugsInvolved
Traffic Crash Female Male
Unkown Gender
Uinta County 545 89.54% 4.04% 8.81% 2.75% 6.79% 19.27% 71.56% 10.46% 4.95% 23.30% 75.05% 1.65%Evanston PD 386 90.67% 1.81% 9.07% 2.33% 8.03% 26.42% 77.72% 6.48% 4.15% 23.83% 75.39% 0.78%Lyman PD 16 87.50% 6.25% 31.25% 12.50% 6.25% 12.50% 81.25% 6.25% 31.25% 68.75%Mtn. View PD 5 100.00% 20.00% 20.00% 100.00% 40.00% 20.00% 80.00%Other 2 100.00% 50.00% 50.00% 50.00%Uinta SO 47 78.72% 10.64% 10.64% 2.13% 8.51% 2.13% 72.34% 12.77% 10.64% 21.28% 74.47% 4.26%WHP 89 89.89% 8.99% 2.25% 3.37% 42.70% 25.84% 6.74% 20.22% 75.28% 4.49%
* Total percents may not equal 100 due to lack of information, or a single arrest involving multiple crimes.
Uinta County ArrestsOctober 1, 2007 - September 30, 2008
Uinta County 85

MIP Arrests Meth, Drugs & Public Intoxication
County DUI MIP % MIP Average County Total Meth Drugs Public Pub. Intox. Department Offenses Arrests to DUI MIP BAC Department Offenses Involved Involved Intox. Ave. BACUinta County 168 9 5.36% 0.097 Uinta County 545 17 57 105 0.214Evanston PD 96 4 4.17% 0.208 Evanston PD 386 9 25 102 0.214Lyman PD 4 2 50.00% Lyman PD 16 1 1 2 0.204Mtn. View PD 3 Mtn. View PD 5 2Other Other 2Uinta SO 25 2 8.00% 0.160 Uinta SO 47 3 6 1WHP 40 1 2.50% 0.040 WHP 89 4 23
DUI Arrests Traffic Crashes
County Total DUI % DUI Ave.DUI
Involving% DUI
Involving County Traffic Alcohol % Alcohol Average Drugs % Drugs Department Offenses Offenses Of Total BAC Drugs Drugs Department Crashes Involved Involved BAC Involved InvolvedUinta County 545 168 30.83% 0.146 11 6.55% Uinta County 27 21 77.78% 0.159 4 14.81%Evanston PD 386 96 24.87% 0.153 Evanston PD 16 14 87.50% 0.177Lyman PD 16 4 25.00% 0.153 Lyman PDMtn. View PD 5 3 60.00% 0.095 Mtn. View PDOther 2 OtherUinta SO 47 25 53.19% 0.143 3 12.00% Uinta SO 5 5 100.00% 0.105 1 20.00%WHP 89 40 44.94% 0.131 8 20.00% WHP 6 2 33.33% 0.170 3 50.00%
Underage DUI ArrestsCounty DUI Underage % DUI Ave. Drugs % DUI Department Offenses Offenses Of Total BAC Involved Drugs Inv.Uinta County 168 0Evanston PD 96Lyman PD 4Mtn. View PD 3OtherUinta SO 25WHP 40
Uinta County 86

Total Offenses Domestic Violence
County TotalNumber Involving
PercentInvolving
NumberInvolving
PercentInvolving County
Domestic Violence
Number Involving
PercentInvolving
NumberInvolving
PercentInvolving
Department Offenses Alcohol Alcohol Drugs Drugs Department Offenses Alcohol Alcohol Drugs DrugsUinta County 545 390 71.56% 57 10.46% Uinta County 48 25 52.08% 2 4.17%Evanston PD 386 300 77.72% 25 6.48% Evanston PD 35 17 48.57% 1 2.86%Lyman PD 16 13 81.25% 1 6.25% Lyman PD 5 4 80.00%Mtn. View PD 5 5 100.00% 2 40.00% Mtn. View PDOther 2 Other 1Uinta SO 47 34 72.34% 6 12.77% Uinta SO 5 4 80.00% 1 20.00%WHP 89 38 42.70% 23 25.84% WHP 2
Felony Offenses Resisting Arrest
County FelonyNumber Involving
PercentInvolving
NumberInvolving
PercentInvolving County
Resisting Arrest
Number Involving
PercentInvolving
NumberInvolving
PercentInvolving
Department Offenses Alcohol Alcohol Drugs Drugs Department Offenses Alcohol Alcohol Drugs DrugsUinta County 22 7 31.82% 11 50.00% Uinta County 15 6 40.00% 5 33.33%Evanston PD 7 2 28.57% 2 28.57% Evanston PD 9 3 33.33% 2 22.22%Lyman PD 1 1 100.00% Lyman PD 2 2 100.00%Mtn. View PD 1 1 100.00% 1 100.00% Mtn. View PDOther OtherUinta SO 5 3 60.00% 1 20.00% Uinta SO 1 1 100.00% 1 100.00%WHP 8 7 87.50% WHP 3 2 66.67%
Misdemeanor Offenses Assault
CountyMisde-meanor
Number Involving
PercentInvolving
NumberInvolving
PercentInvolving County Assault
Number Involving
PercentInvolving
NumberInvolving
PercentInvolving
Department Offenses Alcohol Alcohol Drugs Drugs Department Offenses Alcohol Alcohol Drugs DrugsUinta County 488 354 72.54% 46 9.43% Uinta County 37 30 81.08% 4 10.81%Evanston PD 350 276 78.86% 20 5.71% Evanston PD 31 24 77.42% 2 6.45%Lyman PD 14 11 78.57% 1 7.14% Lyman PD 1 1 100.00%Mtn. View PD 5 5 100.00% 2 40.00% Mtn. View PD 1 1 100.00% 1 100.00%Other 2 OtherUinta SO 37 27 72.97% 5 13.51% Uinta SO 4 4 100.00% 1 25.00%WHP 80 35 43.75% 18 22.50% WHP
Alcohol and Drug Involvement
Uinta County 87

Alcohol No Drive Liquor No Department Involved Home Bar Party Car Other Response Home Bar Up Party Store ResponseEvanston PD 300 60 128 15 5 33 48 35 124 10 22 66Lyman PD 13 6 4 1 1 3 2 1 1 2Mtn. View PD 5 4 4OtherUinta SO 34 7 11 4 4 3 5 5 11 2 5 9WHP 38 8 10 1 4 4 10 5 11 1 8 12Uinta County Totals 390 81 157 20 14 40 64 48 152 1 13 36 89
Location of Alcohol Consumption
Dept.Number of
Reports Dept.Number of
ReportsEvanston PD Howard Johnson 1 Uinta SO Bowling Alley 1
Kate's 1 Cowboy 5Legal Tender 40 High County Inn 1Lotty's 59 Lotty's 2Off-Track Betting 2 Veranda 1Old Mill 2 WHP Applebee's 1Sud's Brothers 2 Cowboy 2TC Steak House 1 Grill in Rock Springs 1Veranda 6 John's Bar 1VFW 2 Lyman Bowling Alley 1
Lyman PD John's Bar 2 Raven's Nest 1Mtn. View PD Bridger Valley Lanes 3 Wagon Wheel 1
* Total of percents in Location of Consumption and Point of Sale categories may exceed 100% due to single arrests involving more than on location or point of sale.
Location of Alcohol Consumption and Point of Sale by Department
Location of Consumption Point of Sale
Bar Name Bar Name
Uinta County 88

Numbers by Department
CountyTotal
OffensesMisde-meanor Felony
Domestic Violence
Resist Arrest Assault
Public Intox
Alcohol Involved
DrugsInvolved
Traffic Crash Female Male
Unknown Gender
Average Age
Washakie County 211 174 15 21 7 9 37 171 23 8 44 163 4 31.97Other 1 1 1 1 1 26.00Washakie SO 64 55 5 4 3 3 7 53 9 4 16 46 2 31.42WHP 17 14 2 12 2 4 13 32.19Worland PD 129 105 7 17 4 6 30 105 11 4 24 103 2 32.25
Percents by Department *
CountyTotal
OffensesMisde-meanor Felony
Domestic Violence
Resist Arrest Assault
Public Intox
Alcohol Involved
DrugsInvolved
Traffic Crash Female Male
Unkown Gender
Washakie County 211 82.46% 7.11% 9.95% 3.32% 4.27% 17.54% 81.04% 10.90% 3.79% 20.85% 77.25% 1.90%Other 1 100.00% 100.00% 100.00% 100.00%Washakie SO 64 85.94% 7.81% 6.25% 4.69% 4.69% 10.94% 82.81% 14.06% 6.25% 25.00% 71.88% 3.13%WHP 17 82.35% 11.76% 70.59% 11.76% 23.53% 76.47%Worland PD 129 81.40% 5.43% 13.18% 3.10% 4.65% 23.26% 81.40% 8.53% 3.10% 18.60% 79.84% 1.55%
* Total percents may not equal 100 due to lack of information, or a single arrest involving multiple crimes.
Washakie County ArrestsOctober 1, 2007 - September 30, 2008
Washakie County 89

MIP Arrests Meth, Drugs & Public Intoxication
County DUI MIP % MIP Average County Total Meth Drugs Public Pub. Intox. Department Offenses Arrests to DUI MIP BAC Department Offenses Involved Involved Intox. Ave. BACWashakie County 90 8 8.89% 0.112 Washakie County 211 6 23 37 0.185Other 1 Other 1 1Washakie SO 31 2 6.45% 0.072 Washakie SO 64 3 9 7 0.050WHP 11 2 18.18% 0.046 WHP 17 1 2Worland PD 47 4 8.51% 0.166 Worland PD 129 2 11 30 0.206
DUI Arrests Traffic Crashes
County Total DUI % DUI Ave.DUI
Involving% DUI
Involving County Traffic Alcohol % Alcohol Average Drugs % Drugs Department Offenses Offenses Of Total BAC Drugs Drugs Department Crashes Involved Involved BAC Involved InvolvedWashakie County 211 90 42.65% 0.141 10 11.11% Washakie County 8 8 100.00% 0.183 0Other 1 1 100.00% 1 100.00% OtherWashakie SO 64 31 48.44% 0.153 4 12.90% Washakie SO 4 4 100.00% 0.186WHP 17 11 64.71% 0.088 2 18.18% WHPWorland PD 129 47 36.43% 0.141 3 6.38% Worland PD 4 3 75.00% 0.179
Underage DUI ArrestsCounty DUI Underage % DUI Ave. Drugs % DUI Department Offenses Offenses Of Total BAC Involved Drugs Inv.Washakie County 90 9 10.00% 0.094 2 2.22%Other 1Washakie SO 31 1 3.23% 1 3.23%WHP 11 2 18.18% 0.046 1 9.09%Worland PD 47 6 12.77% 0.103
Washakie County 90

Total Offenses Domestic Violence
County TotalNumber Involving
PercentInvolving
NumberInvolving
PercentInvolving County
Domestic Violence
Number Involving
PercentInvolving
NumberInvolving
PercentInvolving
Department Offenses Alcohol Alcohol Drugs Drugs Department Offenses Alcohol Alcohol Drugs DrugsWashakie County 211 171 81.04% 23 10.90% Washakie County 21 16 76.19% 0Other 1 1 100.00% 1 100.00% OtherWashakie SO 64 53 82.81% 9 14.06% Washakie SO 4 4 100.00%WHP 17 12 70.59% 2 11.76% WHPWorland PD 129 105 81.40% 11 8.53% Worland PD 17 12 70.59%
Felony Offenses Resisting Arrest
County FelonyNumber Involving
PercentInvolving
NumberInvolving
PercentInvolving County
Resisting Arrest
Number Involving
PercentInvolving
NumberInvolving
PercentInvolving
Department Offenses Alcohol Alcohol Drugs Drugs Department Offenses Alcohol Alcohol Drugs DrugsWashakie County 15 6 40.00% 6 40.00% Washakie County 7 7 100.00% 0Other 1 1 100.00% 1 100.00% OtherWashakie SO 5 2 40.00% 2 40.00% Washakie SO 3 3 100.00%WHP 2 1 50.00% 1 50.00% WHPWorland PD 7 2 28.57% 2 28.57% Worland PD 4 4 100.00%
Misdemeanor Offenses Assault
CountyMisde-meanor
Number Involving
PercentInvolving
NumberInvolving
PercentInvolving County Assault
Number Involving
PercentInvolving
NumberInvolving
PercentInvolving
Department Offenses Alcohol Alcohol Drugs Drugs Department Offenses Alcohol Alcohol Drugs DrugsWashakie County 174 145 83.33% 12 6.90% Washakie County 9 4 44.44% 1 11.11%Other OtherWashakie SO 55 47 85.45% 2 3.64% Washakie SO 3 1 33.33%WHP 14 11 78.57% 1 7.14% WHPWorland PD 105 87 82.86% 9 8.57% Worland PD 6 4 66.67%
Alcohol and Drug Involvement
Washakie County 91

Alcohol No Drive Liquor No Department Involved Home Bar Party Car Other Response Home Bar Up Party Store ResponseOther 1 1 1Washakie SO 53 5 32 4 2 1 7 32 1 1 1 14WHP 12 1 2 2 3 1 3 5 2 3Worland PD 105 17 38 7 7 5 27 8 36 5 6 44Washakie County Totals 171 23 72 13 12 7 38 8 73 1 8 7 62
Location of Alcohol Consumption
Dept.Number of
ReportsWashakie SO Big Horn Bar 4
Cattleman 2Little Chief 1Rendezvous 2Rock Bottom 2Rumors 1Ten Sleep Saloon 16
WHP Rock Bottom 1Butch's 1
Worland PD Goose's 8Little Chief 3Rendezvous 10Rock Bottom 7Rumors 1
* Total of percents in Location of Consumption and Point of Sale categories may exceed 100% due to single arrests involving more than on location or point of sale.
Location of Alcohol Consumption and Point of Sale by Department
Location of Consumption Point of Sale
Bar Name
Washakie County 92

Numbers by Department
CountyTotal
OffensesMisde-meanor Felony
Domestic Violence
Resist Arrest Assault
Public Intox
Alcohol Involved
DrugsInvolved
Traffic Crash Female Male
Unknown Gender
Average Age
Weston County 74 51 2 6 2 3 3 66 3 6 18 55 1 36.64Manderson PD 1 1 1 31.00Newcastle PD 55 40 1 3 1 3 3 50 2 3 14 41 36.00Other 1 1 1Upton PD 1 1 1 1 1 53.00Weston SO 10 8 1 1 7 3 3 7 39.33WHP 6 2 1 1 5 1 1 5 36.33
Percents by Department *
CountyTotal
OffensesMisde-meanor Felony
Domestic Violence
Resist Arrest Assault
Public Intox
Alcohol Involved
DrugsInvolved
Traffic Crash Female Male
Unkown Gender
Weston County 74 68.92% 2.70% 8.11% 2.70% 4.05% 4.05% 89.19% 4.05% 8.11% 24.32% 74.32% 1.35%Manderson PD 1 100.00% 100.00%Newcastle PD 55 72.73% 1.82% 5.45% 1.82% 5.45% 5.45% 90.91% 3.64% 5.45% 25.45% 74.55%Other 1 100.00% 100.00%Upton PD 1 100.00% 100.00% 100.00% 100.00%Weston SO 10 80.00% 10.00% 10.00% 70.00% 30.00% 30.00% 70.00%WHP 6 33.33% 16.67% 16.67% 83.33% 16.67% 16.67% 83.33%
* Total percents may not equal 100 due to lack of information, or a single arrest involving multiple crimes.
Weston County ArrestsOctober 1, 2007 - September 30, 2008
Weston County 93

MIP Arrests Meth, Drugs & Public Intoxication
County DUI MIP % MIP Average County Total Meth Drugs Public Pub. Intox. Department Offenses Arrests to DUI MIP BAC Department Offenses Involved Involved Intox. Ave. BACWeston County 50 0 Weston County 74 0 3 3 0.256Manderson PD 1 Manderson PD 1Newcastle PD 39 Newcastle PD 55 2 3 0.256Other Other 1Upton PD Upton PD 1Weston SO 6 Weston SO 10WHP 4 WHP 6 1
DUI Arrests Traffic Crashes
County Total DUI % DUI Ave.DUI
Involving% DUI
Involving County Traffic Alcohol % Alcohol Average Drugs % Drugs Department Offenses Offenses Of Total BAC Drugs Drugs Department Crashes Involved Involved BAC Involved InvolvedWeston County 74 50 67.57% 0.169 2 4.00% Weston County 6 6 100.00% 0.190 1 16.67%Manderson PD 1 1 100.00% Manderson PDNewcastle PD 55 38 69.09% 0.157 2 5.26% Newcastle PD 3 3 100.00% 0.050 1 33.33%Other 1 OtherUpton PD 1 Upton PDWeston SO 10 6 60.00% 0.237 Weston SO 3 3 100.00% 0.237WHP 6 4 66.67% 0.200 WHP
Underage DUI ArrestsCounty DUI Underage % DUI Ave. Drugs % DUI Department Offenses Offenses Of Total BAC Involved Drugs Inv.Weston County 50 1 2.00% 0Manderson PD 1Newcastle PD 39 1 2.56%OtherUpton PDWeston SO 6WHP 4
Weston County 94

Total Offenses Domestic Violence
County TotalNumber Involving
PercentInvolving
NumberInvolving
PercentInvolving County
Domestic Violence
Number Involving
PercentInvolving
NumberInvolving
PercentInvolving
Department Offenses Alcohol Alcohol Drugs Drugs Department Offenses Alcohol Alcohol Drugs DrugsWeston County 74 66 89.19% 3 4.05% Weston County 6 5 83.33% 1 16.67%Manderson PD 1 1 100.00% Manderson PDNewcastle PD 55 50 90.91% 2 3.64% Newcastle PD 3 3 100.00%Other 1 1 100.00% OtherUpton PD 1 1 100.00% Upton PD 1 1 100.00%Weston SO 10 7 70.00% Weston SO 1 1 100.00%WHP 6 5 83.33% 1 16.67% WHP 1 1 100.00%
Felony Offenses Resisting Arrest
County FelonyNumber Involving
PercentInvolving
NumberInvolving
PercentInvolving County
Resisting Arrest
Number Involving
PercentInvolving
NumberInvolving
PercentInvolving
Department Offenses Alcohol Alcohol Drugs Drugs Department Offenses Alcohol Alcohol Drugs DrugsWeston County 2 0 1 50.00% Weston County 2 1 50.00% 0Manderson PD Manderson PDNewcastle PD 1 Newcastle PD 1 1 100.00%Other OtherUpton PD Upton PDWeston SO Weston SO 1WHP 1 1 100.00% WHP
Misdemeanor Offenses Assault
CountyMisde-meanor
Number Involving
PercentInvolving
NumberInvolving
PercentInvolving County Assault
Number Involving
PercentInvolving
NumberInvolving
PercentInvolving
Department Offenses Alcohol Alcohol Drugs Drugs Department Offenses Alcohol Alcohol Drugs DrugsWeston County 51 46 90.20% 1 1.96% Weston County 3 2 66.00% 0Manderson PD Manderson PDNewcastle PD 40 37 92.50% 1 2.50% Newcastle PD 3 2 66.00%Other OtherUpton PD 1 1 100.00% Upton PDWeston SO 8 6 75.00% Weston SOWHP 2 2 100.00% WHP
Alcohol and Drug Involvement
Weston County 95

Alcohol No Drive Liquor No Department Involved Home Bar Party Car Other Response Home Bar Up Party Store ResponseManderson PD 1 1 1Newcastle PD 50 5 16 3 8 17 4 20 1 4 18Other 1Upton PD 1 1 1Weston SO 7 2 1 4 1 1 1 4WHP 5 1 2 2 2 1 2Weston County Totals 66 9 20 3 8 0 23 5 24 0 1 7 24
Location of Alcohol Consumption
Dept.Number of
ReportsNewcastle PD Bronco 11
Old Mill 1Smoke Shop 1
Weston SO Sagebrush Bar 1WHP Buckhorn 1
Polly's Bar 1
* Total of percents in Location of Consumption and Point of Sale categories may exceed 100% due to single arrests involving more than on location or point of sale.
Location of Alcohol Consumption and Point of Sale by Department
Location of Consumption Point of Sale
Bar Name
Weston County 96

Evaluation of Alcohol Factors in Wyoming Custodial Arrests
Wyoming Association of Sheriffs and Chiefs of Police
PROJECT MANAGER VITA
CONTACT INFORMATION: Ernest L. Johnson, Director of Services Johnson & Associates 1036 Durango Douglas, WY 82633 Phone: (307) 351-8614 Fax: (307) 358-4315 E-mail: [email protected] RELATED EDUCATION & EXPERIENCE:
Twenty-four years experience as an administrator of a state agency with direct responsibility for budget development and administration, planning, organizing, directing, staffing, and program services delivery.
Masters degree in Public Administration; over twenty years experience in training
executives to achieve excellence in government, manage and implement change, increase organizational effectiveness, and maximize program efficiency.
Conducted in-depth management studies for criminal justice agencies for the
states of Massachusetts and New Hampshire. These studies assessed the delivery of program services by agencies with statewide responsibilities and provided recommendations for increasing organizational efficiency and agency credibility.
Over twenty-five years of experience in researching, writing, and administering a
wide variety of federal and state grants. Grants involved in excess of several million dollars for a wide variety of purposes: personnel, equipment, training, research, and providing services with targeted priorities.
Extensive experience in researching, evaluating, and implementing a wide variety
of projects. These projects varied in scope and duration, and many required the involvement and partnership of multiple agencies and personnel throughout the state, as well as the enactment of state legislation.
o Evaluation performed for the Substance Abuse Division - WDH – “Responsible Server Training Program” – October 2002
o Managed the Wyoming First Lady’s Initiative to Reduce Underage Drinking – November 2004 to September 2006
o Currently serving as the Facilitator for the Wyoming Seat Belt Coalition o Managed project and authored report: A Comprehensive Review of
Alcohol State Statutes: Findings and Recommendations for Reducing Underage and Binge Drinking in Wyoming - 2008
ATTACHMENT “D”
97

Evaluation of Alcohol Factors in Wyoming Custodial Arrests
Wyoming Association of Sheriffs and Chiefs of Police
Project Manager Vita (continued)
Twenty years of experience in conducting a variety of feasibility studies o Conducted numerous feasibility studies for the Wyoming Legislature o Most recent feasibility study conducted for the Town of Wright: “Should
the Town of Wright create its own Police Department?” May 2004
Conducted executive level training for the US Department of Justice/ State Department:
o Instructed a 40-hour training course entitled “The Office of Professional Responsibility” for the Lithuania National Police command staff - 2001
o Instructed an 80-hour training course entitled “Sex Crimes Investigations” for Investigators and Prosecutors in Lithuania - 2001
Faculty - Criminal Justice Department - University of Wyoming (September 2000
to present) o Currently teaching the following courses: Criminal Justice Management,
Concepts of Modern Policing, Ethics in the Administration of Justice, Criminal Justice Civil Liability, Politics and the Judicial Process, Criminal Courts and Processes, and Police Deviance.
Management consultant for the Wyoming Association of Sheriffs and Chiefs of
Police - Projects completed or currently in progress: o Evaluation of Alcohol Factors in Custodial Arrest in Wyoming – May
2005 o Statewide Public Opinion Survey: Alcohol Issues and Policies (phone
survey of 4,600 residents of Wyoming – Report released November 2006 o Evaluation of Alcohol Factors in Custodial Arrests in Wyoming - 2006:
Phase I (data collection), Phase II (Analysis, Findings and Strategies) o Evaluation of Alcohol Factors in Custodial Arrests in Wyoming - 2007 o Project Manager for the Enforcing Underage Drinking Laws Program –
September 2007 to present o Project Manager for WY-CIA Wyoming Communities in Action – Phase
I, Phase II – September 2007 to present o Project Manager for Reducing Underage Drinking and Driving – October
2007 to present o Project Coordinator for Project Safe Neighborhoods in Wyoming: A
national initiative directed by the US Department of Justice aimed at reducing gun crimes and violence in this country. Initiative is currently in its fifth year of operation in Wyoming.
98