aledo demographic independent update school spring 2018
TRANSCRIPT

Learn from Yesterday…Understand Today…Plan for Tomorrow
AledoIndependentSchoolDistrict
Demographic Update
Spring 2018

Templeton Demographics
2

Templeton Demographics
3
TD has provided student geocodes, housing data,
enrollment projections and facility planning to many of
the fastest growing districts in North Texas
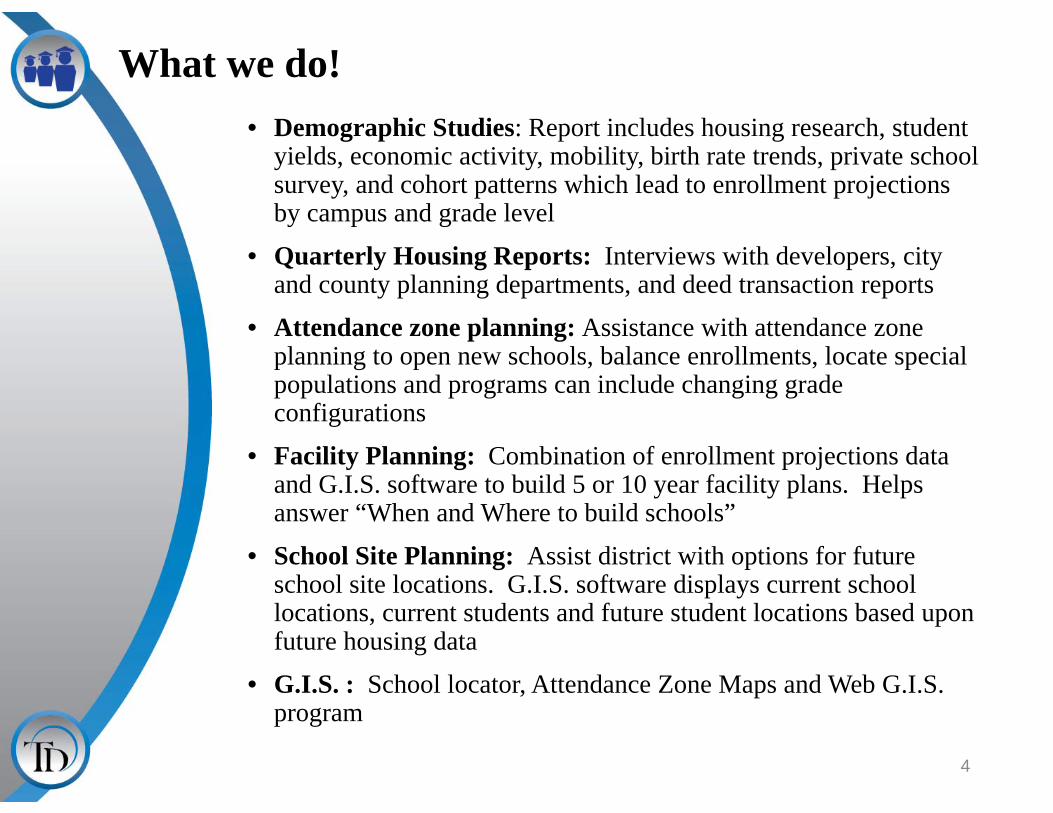
What we do!• Demographic Studies: Report includes housing research, student
yields, economic activity, mobility, birth rate trends, private school survey, and cohort patterns which lead to enrollment projections by campus and grade level
• Quarterly Housing Reports: Interviews with developers, city and county planning departments, and deed transaction reports
• Attendance zone planning: Assistance with attendance zone planning to open new schools, balance enrollments, locate special populations and programs can include changing grade configurations
• Facility Planning: Combination of enrollment projections data and G.I.S. software to build 5 or 10 year facility plans. Helps answer “When and Where to build schools”
• School Site Planning: Assist district with options for future school site locations. G.I.S. software displays current school locations, current students and future student locations based upon future housing data
• G.I.S. : School locator, Attendance Zone Maps and Web G.I.S. program
4
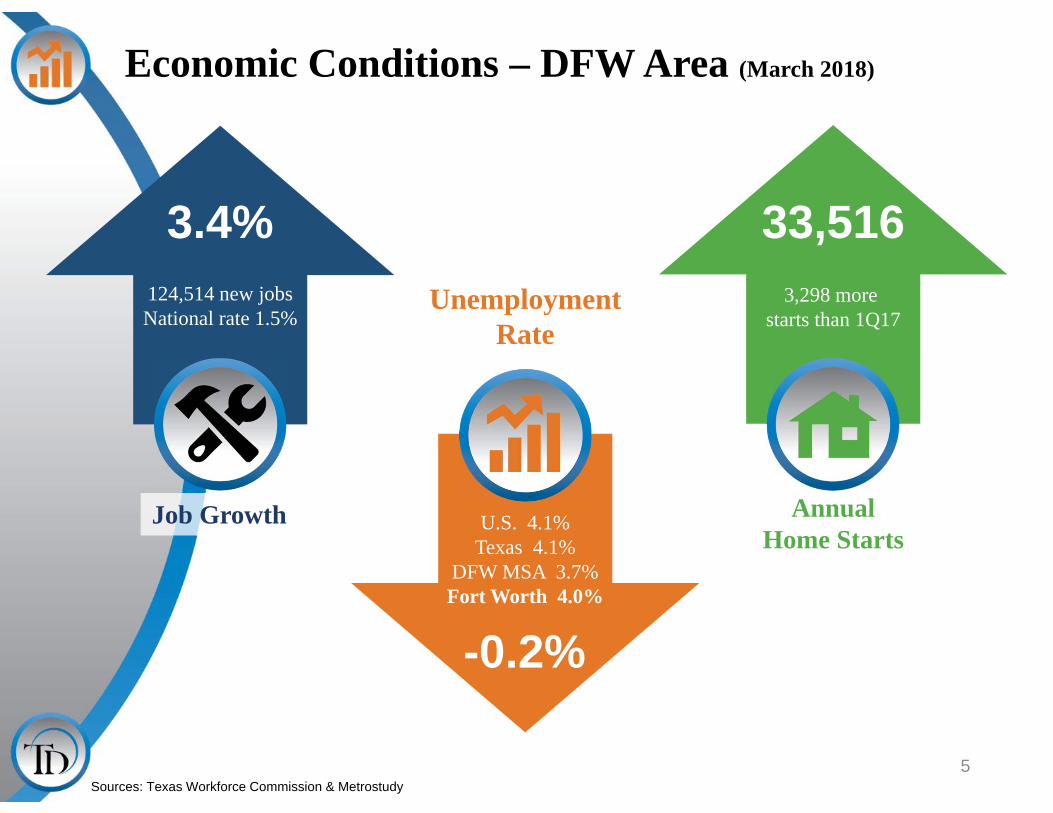
Economic Conditions – DFW Area (March 2018)
5
UnemploymentRate
-0.2%
124,514 new jobsNational rate 1.5%
Job Growth
3.4%3,298 more
starts than 1Q17
AnnualHome Starts
33,516
Sources: Texas Workforce Commission & Metrostudy
U.S. 4.1%Texas 4.1%
DFW MSA 3.7%Fort Worth 4.0%

Texas Enrollment Trends
6
2017/18 State EnrollmentTotal Enrollment 5,399,682Total Growth 40,555
78,644
78,078
98,273
85,773
64,962
77,261
76,085
80,140
67,52259,540
40,555
0
20,000
40,000
60,000
80,000
100,000
120,000
2007/08 2009/10 2011/12 2013/14 2015/16 2017/18
Annual Enrollment Change

Region 10 & 11 Enrollment Trends
7

Region 10 & 11 Enrollment Trends
8
Rank DISTRICT2012/13
Enrollment2017/18
Enrollment
5‐YEAR CHANGE
(12/13‐17/18)5‐YEAR PCT Growth
1 Northwest ISD 17,813 23,141 5,328 29.9%2 Denton ISD 25,782 29,420 3,638 14.1%3 Fort Worth ISD 83,491 86,234 2,743 3.3%4 Mansfield ISD 32,883 35,054 2,171 6.6%5 Burleson ISD 10,581 12,221 1,640 15.5%6 Hurst‐Euless‐Bedford ISD 21,819 23,429 1,610 7.4%7 Eagle Mt‐Saginaw ISD 17,731 19,317 1,586 8.9%8 Keller ISD 33,365 34,937 1,572 4.7%9 Little Elm ISD 6,399 7,526 1,127 17.6%10 Aledo ISD 4,729 5,718 989 20.9%11 Argyle ISD 1,907 2,716 809 42.4%12 Carroll ISD 7,711 8,360 649 8.4%13 Joshua ISD 4,906 5,528 622 12.7%14 Granbury ISD 6,536 7,143 607 9.3%15 Grapevine‐Colleyville ISD 13,386 13,975 589 4.4%16 Azle ISD 5,930 6,496 566 9.5%17 Aubrey ISD 2,006 2,495 489 24.4%18 Weatherford ISD 7,635 8,116 481 6.3%19 Everman ISD 5,401 5,838 437 8.1%20 Brock ISD 1,002 1,373 371 37.0%
Region 10 Region 11
Rank District2012/13
Enrollment2017/18
Enrollment
5‐YEAR Change
(12/13‐17/18)5‐YEAR PCT Growth
1 Frisco ISD 42,703 58,450 15,747 36.9%2 Prosper ISD 5,502 12,133 6,631 120.5%3 Grand Prairie ISD 26,928 29,362 2,434 9.0%4 Wylie ISD (Collin) 13,425 15,769 2,344 17.5%5 Mesquite ISD 39,128 41,022 1,894 4.8%6 Rockwall ISD 14,483 16,295 1,812 12.5%7 Coppell ISD 10,997 12,625 1,628 14.8%8 Forney ISD 8,571 10,196 1,625 19.0%9 Midlothian ISD 7,560 8,872 1,312 17.4%10 Allen ISD 19,891 21,159 1,268 6.4%11 Richardson ISD 38,046 39,314 1,268 3.3%12 Melissa ISD 1,695 2,792 1,097 64.7%13 Crandall ISD 3,030 4,056 1,026 33.9%14 Princeton ISD 3,435 4,381 946 27.5%15 Anna ISD 2,526 3,459 933 36.9%16 Waxahachie ISD 7,652 8,517 865 11.3%17 Royse City ISD 4,905 5,739 834 17.0%18 Lancaster ISD 6,538 7,371 833 12.7%19 De Soto ISD 8,900 9,657 757 8.5%20 Community ISD 1,635 2,262 627 38.3%

District Demographic Snap Shot
9
2018 Total District Population Estimate
26,170
20,6122010 Census
District Population
27%
Total District PopulationBelow Age 19
7,005
2010 Census District Population Below Age 19
6,495
7.9%
2018 Total DistrictMedian Household Income
$106,876
20.3%
2010 Census Total District Median Household Income
$88,843
2018 District Households9,015
27.2%
2010 District Households7,090

Aledo ISD Housing ActivityAnnual Home Sales by Transaction Type, 2010 - 2017
10
Total home sales have risen as fewer distressed property sales are recorded and new home sales rise
Source: Metrostudy and Tarrant County Deed Transactions
72 59 84155
243 231 250354
358 367418
591
634 635 629
682
13174
53
87
4122 22
19
90 172 58
67
83 39 26
29
0
200
400
600
800
1000
1200
2010 2011 2012 2013 2014 2015 2016 2017
Aledo ISD Home Sales by Type, 2010 ‐ 2017
New Home Sales Existing Home Sales Foreclosures REO Sales

Aledo ISD Housing Activity
11
2017 Home Sales by Transaction Type
• Aledo ISD had 1,075 home sales in 2017, and roughly one out of every three sales was a new home
• In 2017, the average sale price for a new home within Aledo ISD was $363,628• The average sale price for an existing home within Aledo ISD in 2017 was $355,124
Existing Home Sales62.73%
New Home Sales32.90%
REO Sales2.60%
Foreclosures1.77%
2017 DistrictHome Salesby Type

Aledo ISD Historical Home Price Analysis
12
• The average new home price has risen 24.5% since 2010, a price difference of $71,460
• The average existing home price within Aledo ISD has risen 34.3% since 2010, a price change of $90,740
$0
$50,000
$100,000
$150,000
$200,000
$250,000
$300,000
$350,000
$400,000
2010 2011 2012 2013 2014 2015 2016 2017
NEW VS EXISTING HOME SALE PRICE, 2010 ‐ 2017
New Homes Existing Homes
New Homes Existing Homes2010 $292,166 $264,386 2011 $286,975 $282,154 2012 $304,072 $269,783 2013 $325,057 $284,486 2014 $352,282 $321,527 2015 $355,183 $324,707 2016 $369,768 $355,546 2017 $363,628 $355,124

Aledo ISD Housing Market
13
Quarterly New Home Activity within Aledo ISD by Subdivision
8560
80 66 6952 64 51 52
4763
3846
50 55
11
163
79 62
0
20
40
60
80
100
120
140
160
180
200
1Q16 2Q16 3Q16 4Q16 1Q17 2Q17 3Q17 4Q17 1Q18
Quarterly New Home Starts within Aledo ISD
District Starts Excluding Walsh, Morningstar Morningstar Starts Walsh Starts
1Q16 2Q16 3Q16 4Q16 1Q17 2Q17 3Q17 4Q17 1Q18District excluding
Morningstar, WalshStarts 85 60 80 66 69 52 64 51 52Closings 73 66 92 67 78 64 72 54 53
MorningstarStarts 0 0 0 47 63 38 46 50 55Closings 0 0 0 0 1 46 46 45 29
WalshStarts 0 0 0 0 11 16 3 79 62Closings 0 0 0 0 0 0 5 3 17
District TotalStarts 85 60 80 113 143 106 113 180 169Closings 73 66 92 67 79 110 123 102 99
• Excluding Morningstar and Walsh, Aledo ISD averaged 73 home starts a quarter in 2016, in 2017 that quarterly average dropped to 59 homes
• New home activity within Morningstar and Walsh has caused a slight decline in activity in other parts of the district

DFW New Home Ranking Report ISD Ranked by Annual Closings – 1Q18
*Adjusted total subtracting portions of Walsh Ranch, Bella Ranch and Crown Valley not in AISD
14
Rank District Name Annual Starts Annual Closings VDL Future1 Prosper ISD 2,864 2,716 6,166 24,1162 Frisco ISD 2,455 2,620 4,894 4,9383 Denton ISD 2,156 2,045 3,130 19,4584 Northwest ISD 1,878 1,924 1,776 25,3075 Dallas ISD 1,895 1,744 1,850 7,3746 Little Elm ISD 1,568 1,413 1,790 2,5817 Eagle Mt.‐Saginaw ISD 1,390 1,064 1,539 19,0798 Lewisville ISD 1,107 1,039 2,329 3,9829 Forney ISD 1,234 948 1,678 14,20710 Rockwall ISD 903 914 1,820 8,40611 Wylie ISD 922 809 1,006 4,15012 Keller ISD 580 737 759 1,68613 McKinney ISD 636 718 1,609 6,42514 Allen ISD 703 703 1,371 1,21915 Mansfield ISD 676 658 1,086 6,68916 Midlothian ISD 717 635 1,280 19,66617 Fort Worth ISD 582 612 833 4,96618 Crowley ISD 825 595 911 12,43019 Garland ISD 348 538 319 4,08020 Waxahachie ISD 553 514 845 9,82321 Plano ISD 633 478 1,131 2,07822 Princeton ISD 589 478 683 4,76123 Coppell ISD 355 468 493 39924 Royse City ISD 563 464 1,236 9,56425 Anna ISD 455 437 393 4,54426 HEB ISD 474 437 658 4,46127 Aledo ISD* 560 423 1,047 11,43328 Melissa ISD 477 394 1,097 4,30029 Argyle ISD 370 355 952 4,98630 Crandall ISD 398 352 292 7,762

0
20
40
60
80
100
120
140
160
180
200
Starts Closings
New Housing Activity
• Aledo ISD had 169 new home starts in 1Q18, the most first quarter new home starts in more than 10 years
• The district had more than 400 new home closings in 2017, a rise of nearly 40% over 2016• New home inventory is high due to the large number of homes under construction
Aledo ISD
15
Starts 2012 2013 2014 2015 2016 2017 2018 Closings 2012 2013 2014 2015 2016 2017 20181Q 15 44 69 75 85 143 169 1Q 16 38 63 70 73 79 992Q 32 92 108 60 60 106 2Q 45 51 85 76 66 1103Q 39 85 89 109 80 113 3Q 45 59 77 91 92 1234Q 48 87 87 73 113 180 4Q 56 95 76 80 67 102
Total 134 308 353 317 338 542 169 Total 162 243 301 317 298 414 99

Annual Closing Distribution
16
Top 10 Subdivisions ‐ 1Q18 (Ranked by Annual Closings)
Rank SubdivisionAnnual Closings
Quarter Closings VDL Future
1 Morningstar 166 29 176 1,7252 Parks of Aledo 54 7 31 03 Brookhollow 45 8 10 04 Bella Ranch (Aledo ISD) 30 5 74 445 Walsh (AISD) 25 17 373 8,6366 Meadow Place Estates 14 7 74 07 Bella Flora 13 4 30 08 Claire Vista 13 3 5 09 Sanctuary Oaks 13 2 3 010 Vista Point 7 6 45 196
Totals 380 88 821 10,601

Vacant Developed Lots Distribution
17
Top 10 Subdivisions ‐ 1Q18 (Ranked by remaining VDL)
Rank SubdivisionAnnual Closings VDL Future
1 Walsh (AISD) 25 373 8,6362 Morningstar 166 176 1,7253 Bella Ranch (Aledo ISD) 30 74 444 Meadow Place Estates 14 74 05 Maravilla Vistas 6 57 06 Vista Point 7 45 1967 La Madera 2 43 08 Parks of Aledo 54 31 09 Bella Flora 13 30 010 Aledo Ridge 0 24 0
Totals 317 927 10,601
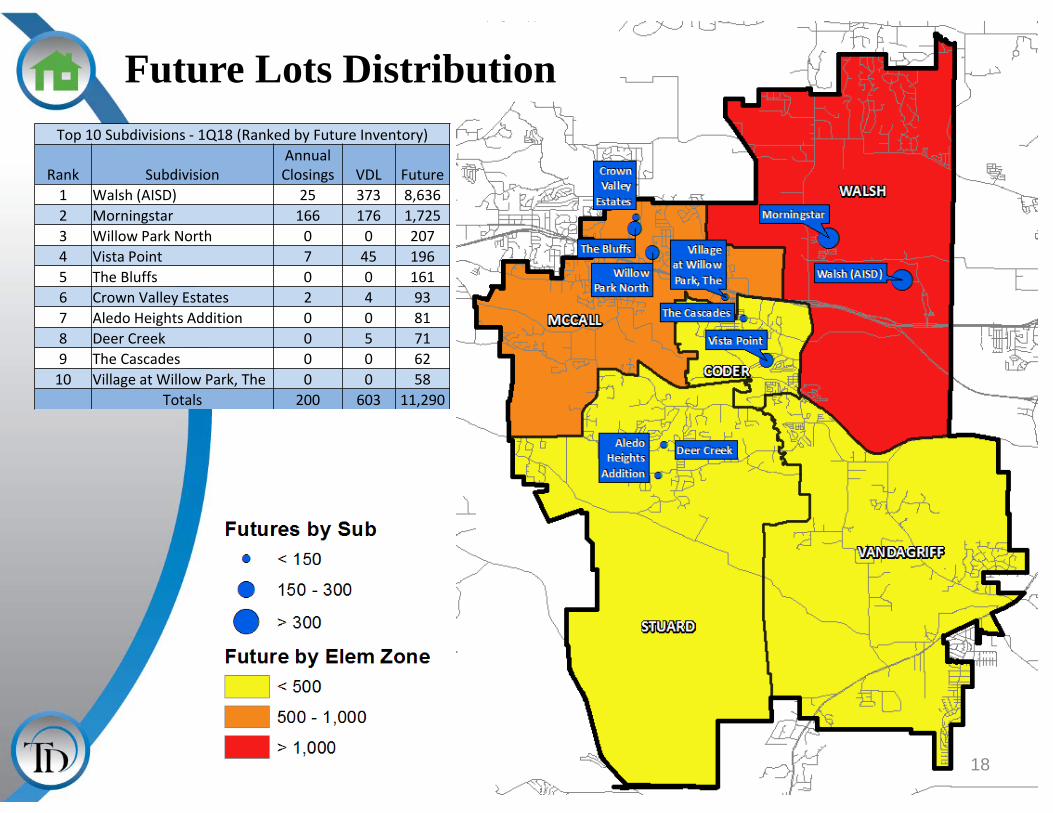
Future Lots Distribution
18
Top 10 Subdivisions ‐ 1Q18 (Ranked by Future Inventory)
Rank SubdivisionAnnual Closings VDL Future
1 Walsh (AISD) 25 373 8,6362 Morningstar 166 176 1,7253 Willow Park North 0 0 2074 Vista Point 7 45 1965 The Bluffs 0 0 1616 Crown Valley Estates 2 4 937 Aledo Heights Addition 0 0 818 Deer Creek 0 5 719 The Cascades 0 0 6210 Village at Willow Park, The 0 0 58
Totals 200 603 11,290
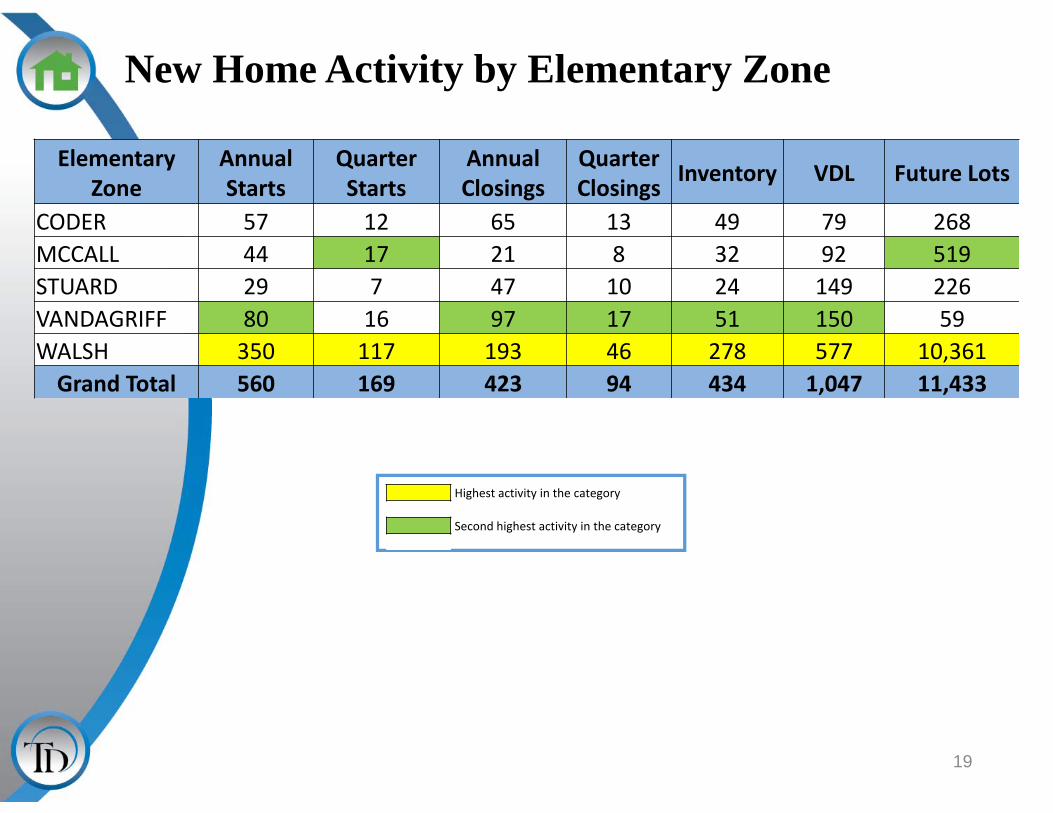
New Home Activity by Elementary Zone
19
Highest activity in the category
Second highest activity in the category
Elementary Zone
Annual Starts
Quarter Starts
Annual Closings
Quarter Closings Inventory VDL Future Lots
CODER 57 12 65 13 49 79 268MCCALL 44 17 21 8 32 92 519STUARD 29 7 47 10 24 149 226VANDAGRIFF 80 16 97 17 51 150 59WALSH 350 117 193 46 278 577 10,361Grand Total 560 169 423 94 434 1,047 11,433

District Overview
20
• Aledo ISD has more than 1,000 lots available to build on
• The district has more than 11,400 planned future lots
• Of those futures, groundwork is underway on 740 lots within AISD
Residential Activity
21
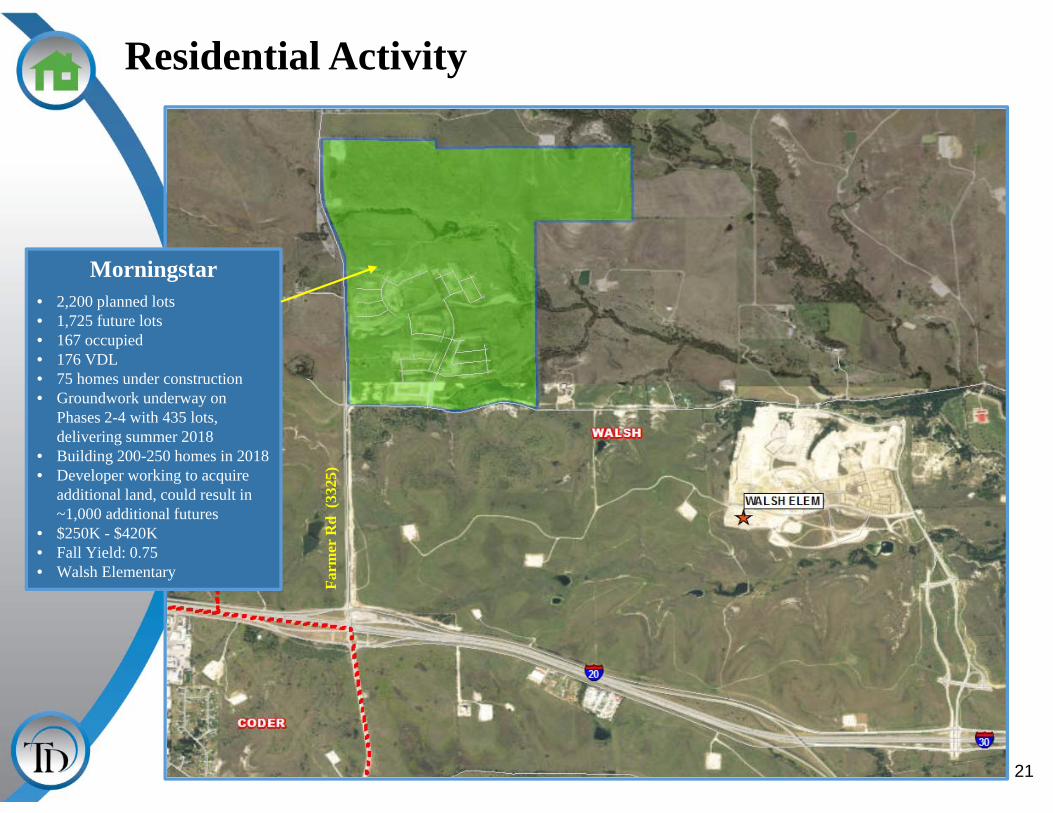
Morningstar• 2,200 planned lots• 1,725 future lots• 167 occupied• 176 VDL• 75 homes under construction• Groundwork underway on
Phases 2-4 with 435 lots, delivering summer 2018
• Building 200-250 homes in 2018• Developer working to acquire
additional land, could result in ~1,000 additional futures
• $250K - $420K • Fall Yield: 0.75• Walsh Elementary
Farm
er R
d (3
325)
Residential Activity
22
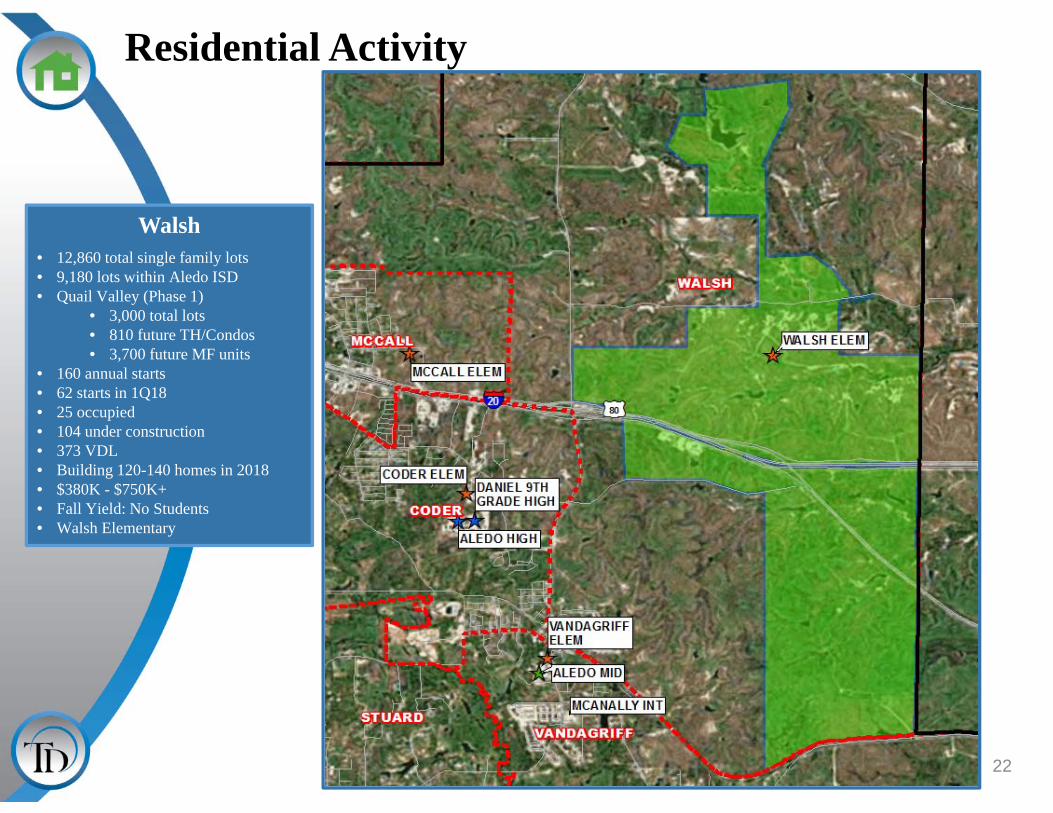
Walsh• 12,860 total single family lots• 9,180 lots within Aledo ISD• Quail Valley (Phase 1)
• 3,000 total lots• 810 future TH/Condos• 3,700 future MF units
• 160 annual starts• 62 starts in 1Q18• 25 occupied• 104 under construction• 373 VDL• Building 120-140 homes in 2018• $380K - $750K+• Fall Yield: No Students• Walsh Elementary

Residential Activity
23
Willow Park North • Future mixed-use development• Approx. 97 future single family lots• Approx. 110 future townhomes• Approx. 200 future Multi-family units• Development still in planning stages and
no plats submitted at this time• Planned commercial and riverfront retail• Homes starting at $350K+• McCall Elementary
Meadow Place Estates• 114 total lots• 14 occupied• 74 VDL• 18 homes U/C• Building ~40 homes a year• $275K - $315K• Fall Yield: 6 Students• McCall Elementary
Village at Willow Park• Future mixed-use development • 14 acres for commercial/retail
development• 58 future townhomes on
additional 10 acres• Town square with a public park • Rezoning approved November
2017, preliminary plat approved in April 2018
• Phase 1 will include 24 TH lots
Future commercial/retail development and town square
Residential Activity
24
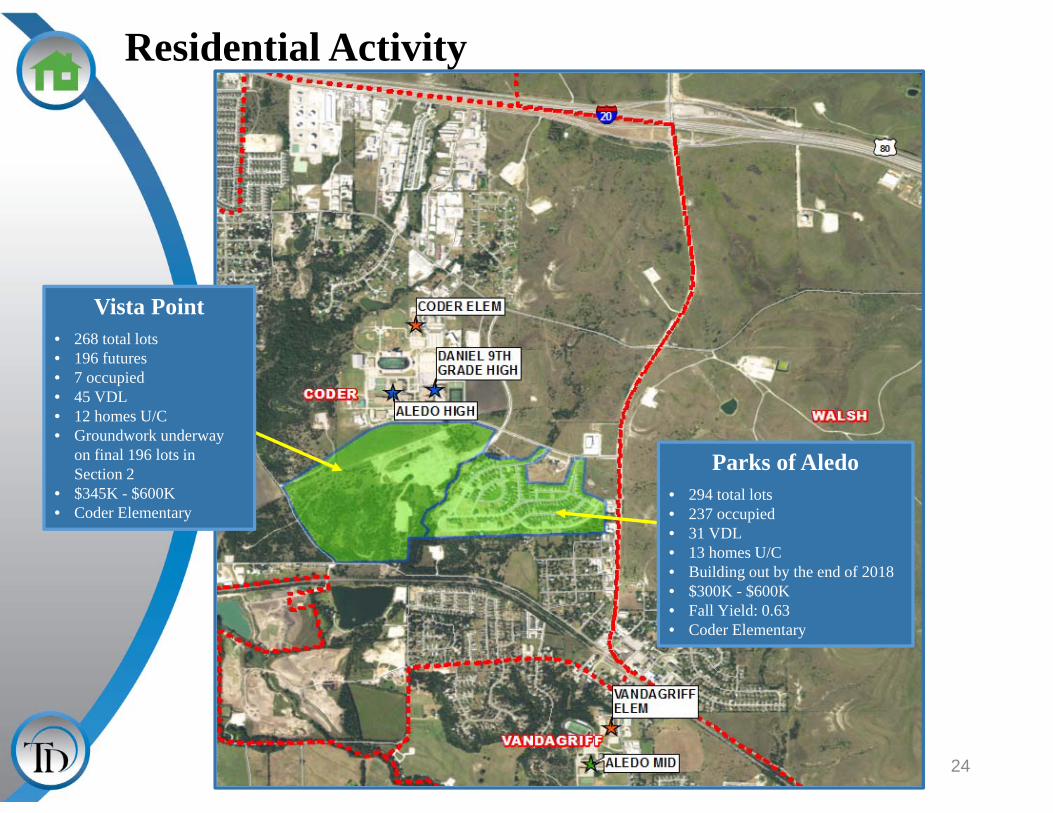
Vista Point• 268 total lots• 196 futures• 7 occupied• 45 VDL• 12 homes U/C• Groundwork underway
on final 196 lots in Section 2
• $345K - $600K• Coder Elementary
Parks of Aledo• 294 total lots• 237 occupied• 31 VDL• 13 homes U/C• Building out by the end of 2018• $300K - $600K• Fall Yield: 0.63• Coder Elementary
Residential Activity
25
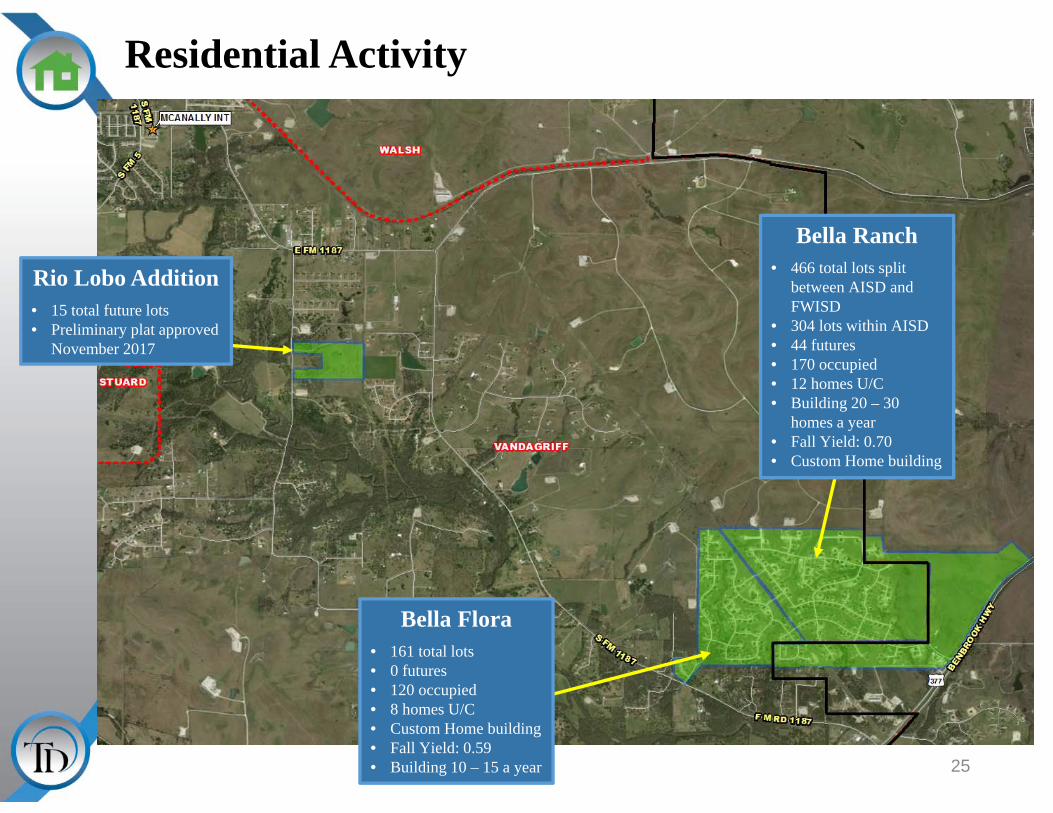
Rio Lobo Addition• 15 total future lots• Preliminary plat approved
November 2017
Bella Flora• 161 total lots• 0 futures• 120 occupied• 8 homes U/C• Custom Home building• Fall Yield: 0.59• Building 10 – 15 a year
Bella Ranch• 466 total lots split
between AISD and FWISD
• 304 lots within AISD• 44 futures• 170 occupied• 12 homes U/C• Building 20 – 30
homes a year• Fall Yield: 0.70• Custom Home building

Residential Yield Analysis
26
2014‐15 2015‐16 2016‐17 2017‐18 3 Year Difference
Total Students 5,054 5,272 5,443 5,698 644Out of District 284 231 253 223 ‐61Unmatched 28 40 18 54 26Total Students (Geocoded Inside District) 4,742 5,001 5,172 5,421 679Multi‐Family*
Students in MF 275 266 293 251 ‐24MF Units 533 533 533 533 0% Students in MF 5.8% 5.3% 5.7% 4.6% ‐1.2%MF Yield 0.516 0.499 0.549 0.471 ‐0.045
Single FamilyStudents in SF 4,467 4,735 4,879 5,170 703SF Parcels 6,427 6,726 7,036 7,384 957% Students in SF 94.2% 94.7% 94.3% 95.4% 1.2%SF Yield 0.695 0.704 0.693 0.700 0.005
*Multi-Family totals include manufactured home communities

TEA Transfer Report
27
Transfers Out To 2012/13 2013/14 2014/15 2015/16 2016/17 2017/18 5 Year ChangeFort Worth Academy of Fine Arts 11 12 18 18 21 21 10Fort Worth ISD 3 5 5 7 6 3 0High Point Academy 0 0 0 3 8 15 15Weatherford ISD 12 15 18 21 26 32 20White Settlement ISD 6 10 9 7 8 21 15
Total Transfers Out* 70 76 78 78 92 141 71
Transfers In From 2012/13 2013/14 2014/15 2015/16 2016/17 2017/18 5 Year ChangeAzle ISD 17 13 14 13 16 14 ‐3Brock ISD 7 7 7 6 7 3 ‐4Crowley ISD 9 15 12 13 14 3 ‐6Fort Worth ISD 43 31 31 30 22 23 ‐20Weatherford ISD 21 30 27 36 40 40 19White Settlement 13 16 10 14 13 3 ‐10Total Transfers In* 121 131 127 131 135 132 11
*Totals include additional districts per TEA rounding rules
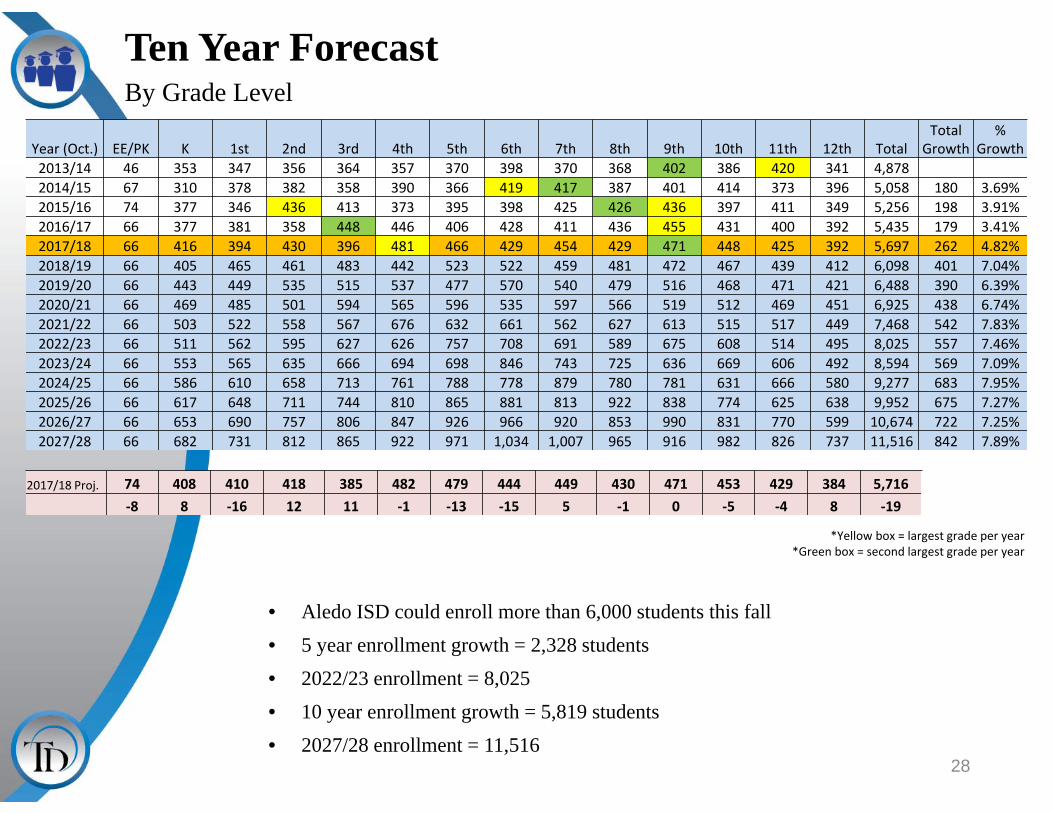
Ten Year ForecastBy Grade Level
*Yellow box = largest grade per year*Green box = second largest grade per year
• Aledo ISD could enroll more than 6,000 students this fall• 5 year enrollment growth = 2,328 students• 2022/23 enrollment = 8,025• 10 year enrollment growth = 5,819 students• 2027/28 enrollment = 11,516
28
Year (Oct.) EE/PK K 1st 2nd 3rd 4th 5th 6th 7th 8th 9th 10th 11th 12th TotalTotal
Growth%
Growth2013/14 46 353 347 356 364 357 370 398 370 368 402 386 420 341 4,8782014/15 67 310 378 382 358 390 366 419 417 387 401 414 373 396 5,058 180 3.69%2015/16 74 377 346 436 413 373 395 398 425 426 436 397 411 349 5,256 198 3.91%2016/17 66 377 381 358 448 446 406 428 411 436 455 431 400 392 5,435 179 3.41%2017/18 66 416 394 430 396 481 466 429 454 429 471 448 425 392 5,697 262 4.82%2018/19 66 405 465 461 483 442 523 522 459 481 472 467 439 412 6,098 401 7.04%2019/20 66 443 449 535 515 537 477 570 540 479 516 468 471 421 6,488 390 6.39%2020/21 66 469 485 501 594 565 596 535 597 566 519 512 469 451 6,925 438 6.74%2021/22 66 503 522 558 567 676 632 661 562 627 613 515 517 449 7,468 542 7.83%2022/23 66 511 562 595 627 626 757 708 691 589 675 608 514 495 8,025 557 7.46%2023/24 66 553 565 635 666 694 698 846 743 725 636 669 606 492 8,594 569 7.09%2024/25 66 586 610 658 713 761 788 778 879 780 781 631 666 580 9,277 683 7.95%2025/26 66 617 648 711 744 810 865 881 813 922 838 774 625 638 9,952 675 7.27%2026/27 66 653 690 757 806 847 926 966 920 853 990 831 770 599 10,674 722 7.25%2027/28 66 682 731 812 865 922 971 1,034 1,007 965 916 982 826 737 11,516 842 7.89%
2017/18 Proj. 74 408 410 418 385 482 479 444 449 430 471 453 429 384 5,716‐8 8 ‐16 12 11 ‐1 ‐13 ‐15 5 ‐1 0 ‐5 ‐4 8 ‐19

Ten Year Forecast
29
By Elementary Campus
*Yellow box = enrollment exceeds stated maximum capacity
Maximum Capacity
Functional Capacity
HISTORY ENROLLMENT PROJECTIONSCAMPUS 2016/17 2017/18 2018/19 2019/20 2020/21 2021/22 2022/23 2023/24 2024/25 2025/26 2026/27 2027/28
Coder Elementary 675 607 541 470 507 534 567 613 598 607 637 649 675 700Coder Campus Utilization 80.1% 69.6% 75.1% 79.0% 84.0% 90.9% 88.6% 90.0% 94.3% 96.2% 100.0% 103.6%McCall Elementary 744 669 423 649 652 639 648 670 666 667 692 720 763 807McCall Campus Utilization 56.9% 87.2% 87.6% 85.9% 87.1% 90.0% 89.5% 89.6% 93.0% 96.8% 102.6% 108.4%Stuard Elementary 675 607 579 609 611 625 632 653 665 684 725 769 815 862Stuard Campus Utilization 85.8% 90.2% 90.6% 92.6% 93.6% 96.7% 98.5% 101.3% 107.3% 113.9% 120.7% 127.8%Vandagriff Elementary 697 626 541 587 623 647 693 698 704 691 712 726 745 755Vandagriff Campus Utilization 77.6% 84.2% 89.4% 92.9% 99.4% 100.2% 101.0% 99.1% 102.1% 104.2% 106.8% 108.4%Walsh Elementary 675 607 334 453 578 737 890 1,113 1,228 1,417 1,597 1,747 1,925Walsh Campus Utilization 0.0% 49.5% 67.1% 85.6% 109.2% 131.9% 164.9% 181.9% 209.9% 236.6% 258.8% 285.2%ELEMENTARY TOTALS 3,466 3,116 2,084 2,649 2,846 3,023 3,276 3,524 3,745 3,877 4,182 4,461 4,745 5,049Elementary Utilization 60.1% 76.4% 82.1% 87.2% 94.5% 101.7% 108.1% 111.9% 120.7% 128.7% 136.9% 145.7%Elementary Absolute Change 72 565 197 177 254 248 221 132 305 279 284 304Elementary Percent Change 3.58% 27.11% 7.43% 6.22% 8.39% 7.56% 6.27% 3.52% 7.88% 6.67% 6.36% 6.41%

Ten Year Forecast
30
By Secondary CampusMaximum Capacity
Functional Capacity
HISTORY ENROLLMENT PROJECTIONSCAMPUS 2016/17 2017/18 2018/19 2019/20 2020/21 2021/22 2022/23 2023/24 2024/25 2025/26 2026/27 2027/28
McAnally Intermediate (6th) 893 765 834 429 522 570 535 661 708 846 778 881 966 1,034McAnally Campus Utilization 93.4% 48.0% 58.5% 63.8% 59.9% 74.0% 79.3% 94.7% 87.1% 98.7% 108.2% 115.8%Aledo Middle School 1,119 958 847 883 940 1,019 1,163 1,189 1,280 1,468 1,659 1,735 1,773 1,972Aledo MS Campus Utilization 75.7% 78.9% 84.0% 91.1% 103.9% 106.3% 114.4% 131.2% 148.3% 155.0% 158.4% 176.2%Intermediate/Middle Total 2,012 1,723 1,681 1,312 1,462 1,589 1,698 1,850 1,988 2,314 2,438 2,617 2,740 3,007Intermediate/Middle Utilization 83.5% 65.2% 72.7% 79.0% 84.4% 91.9% 98.8% 115.0% 121.2% 130.1% 136.2% 149.5%Intermed/Mid Absolute Change 37 ‐369 150 127 109 152 138 326 124 179 123 267Intermed/Mid Percent Change 2.25% ‐21.95% 11.43% 8.69% 6.86% 8.95% 7.46% 16.40% 5.35% 7.35% 4.70% 9.75%Daniel 9th Grade Campus 1,054 899 440 464 461 507 509 603 665 626 771 828 980 906Daniel 9th Campus Utilization 41.7% 44.0% 43.7% 48.1% 48.3% 57.2% 63.1% 59.4% 73.1% 78.6% 93.0% 86.0%Aledo High School 2,081 1,775 1,238 1,272 1,329 1,369 1,442 1,491 1,627 1,777 1,887 2,047 2,210 2,555Aledo HS Campus Utilization 59.5% 61.1% 63.9% 65.8% 69.3% 71.6% 78.2% 85.4% 90.7% 98.3% 106.2% 122.8%HIGH SCHOOL TOTALS 3,135 2,674 1,678 1,736 1,790 1,876 1,951 2,094 2,292 2,403 2,658 2,875 3,190 3,461HIGH SCHOOL UTILIZATION 53.5% 55.4% 57.1% 59.8% 62.2% 66.8% 73.1% 76.6% 84.8% 91.7% 101.7% 110.4%High School Absolute Change 85 58 54 86 75 143 198 111 255 217 315 271High School Percent Change 5.34% 3.46% 3.11% 4.80% 4.00% 7.30% 9.47% 4.84% 10.62% 8.16% 10.96% 8.50%DISTRICT TOTALS 5,443 5,697 6,098 6,488 6,925 7,468 8,025 8,594 9,278 9,953 10,675 11,517District Absolute Change 194 254 401 390 438 542 557 569 684 675 722 842District Percent Change 3.7% 4.7% 7.0% 6.4% 6.7% 7.8% 7.5% 7.1% 8.0% 7.3% 7.3% 7.9%
*Yellow box = enrollment exceeds stated maximum capacity

31
Current Elementary UtilizationWith 3, 5 and 10 year utilization
20/2187%
22/2390%
27/28108%
20/21109%
22/23165%
27/28285%
20/2194%
22/2399%
27/28128%
20/2199%
22/23101%
27/28108%
20/2184%
22/2389%
27/28104%

32
2020/21 Elementary Utilization

33
2022/23 Elementary Utilization

Summary
• Fort Worth’s unemployment rate is currently 4%.
• Aledo ISD had the most first quarter new home starts in more than 10 years.
• Walsh has started 160 new homes.
• Aledo ISD could near 500 new home closings in 2018.
• Aledo ISD can expect an increase of approximately 2,300 students during the next 5 years.
• 2022/23 enrollment projection: 8,025 students.
• AISD is projected to enroll more than 11,500 students for the 2027/28 school year.
www.tdemographics.com 34

Ten Year Campus Enrollment Projection
35
Coder Elementary
0
100
200
300
400
500
600
700
800
2017/18 2018/19 2019/20 2020/21 2021/22 2022/23 2023/24 2024/25 2025/26 2026/27 2027/28
Coder Elementary
Enrollment Below Functional Capacity
Enrollment Exceeds Functional Capacity
Enrollment Exceeds Maximum Capacity
Functional Capacity
Maximum Capacity
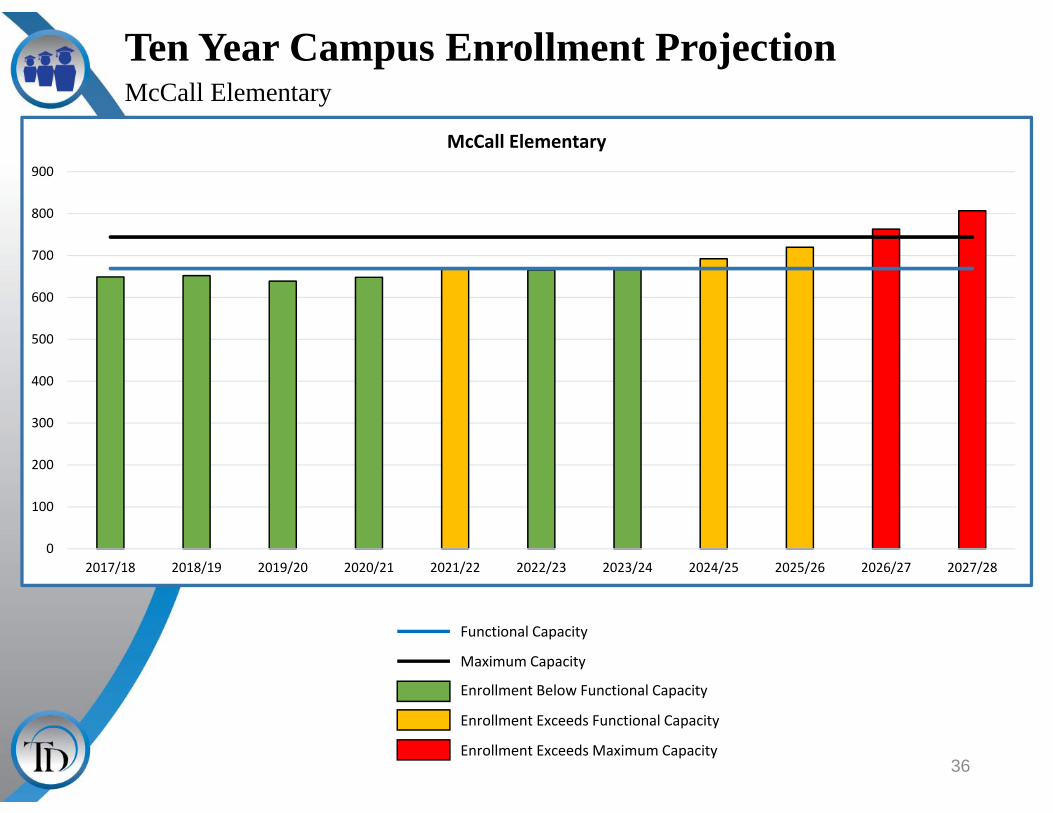
Ten Year Campus Enrollment Projection
36
McCall Elementary
0
100
200
300
400
500
600
700
800
900
2017/18 2018/19 2019/20 2020/21 2021/22 2022/23 2023/24 2024/25 2025/26 2026/27 2027/28
McCall Elementary
Enrollment Below Functional Capacity
Enrollment Exceeds Functional Capacity
Enrollment Exceeds Maximum Capacity
Functional Capacity
Maximum Capacity
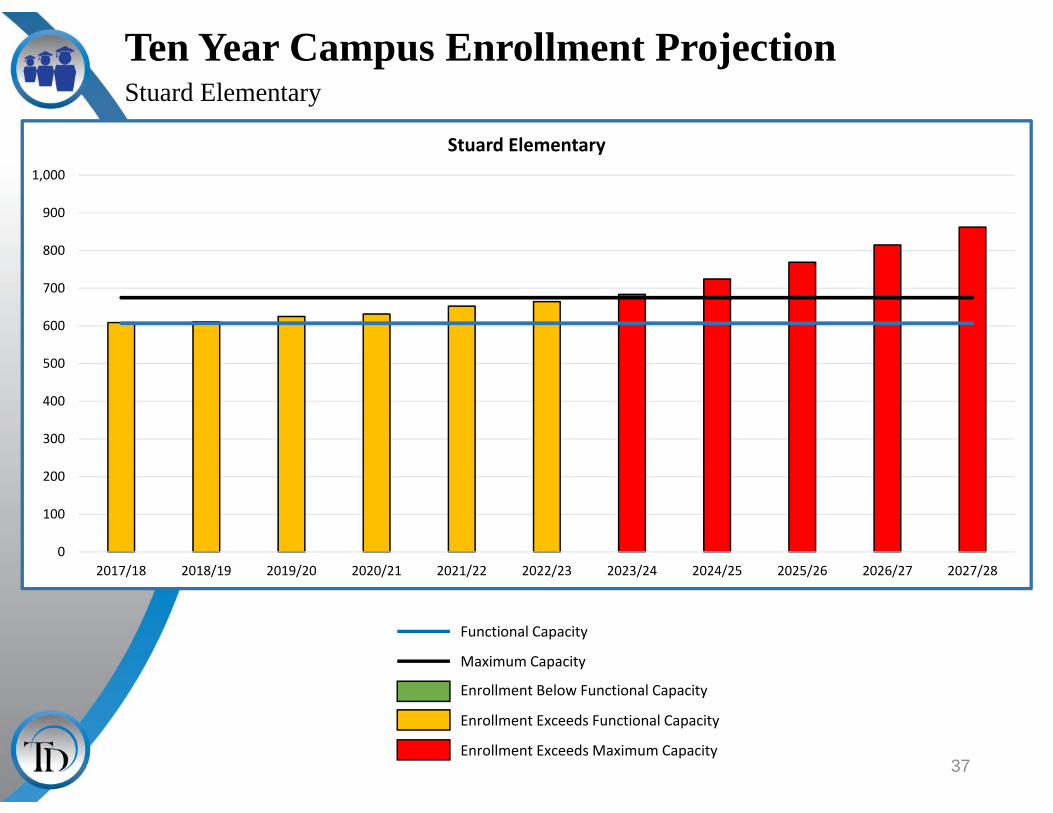
Ten Year Campus Enrollment Projection
37
Stuard Elementary
0
100
200
300
400
500
600
700
800
900
1,000
2017/18 2018/19 2019/20 2020/21 2021/22 2022/23 2023/24 2024/25 2025/26 2026/27 2027/28
Stuard Elementary
Enrollment Below Functional Capacity
Enrollment Exceeds Functional Capacity
Enrollment Exceeds Maximum Capacity
Functional Capacity
Maximum Capacity
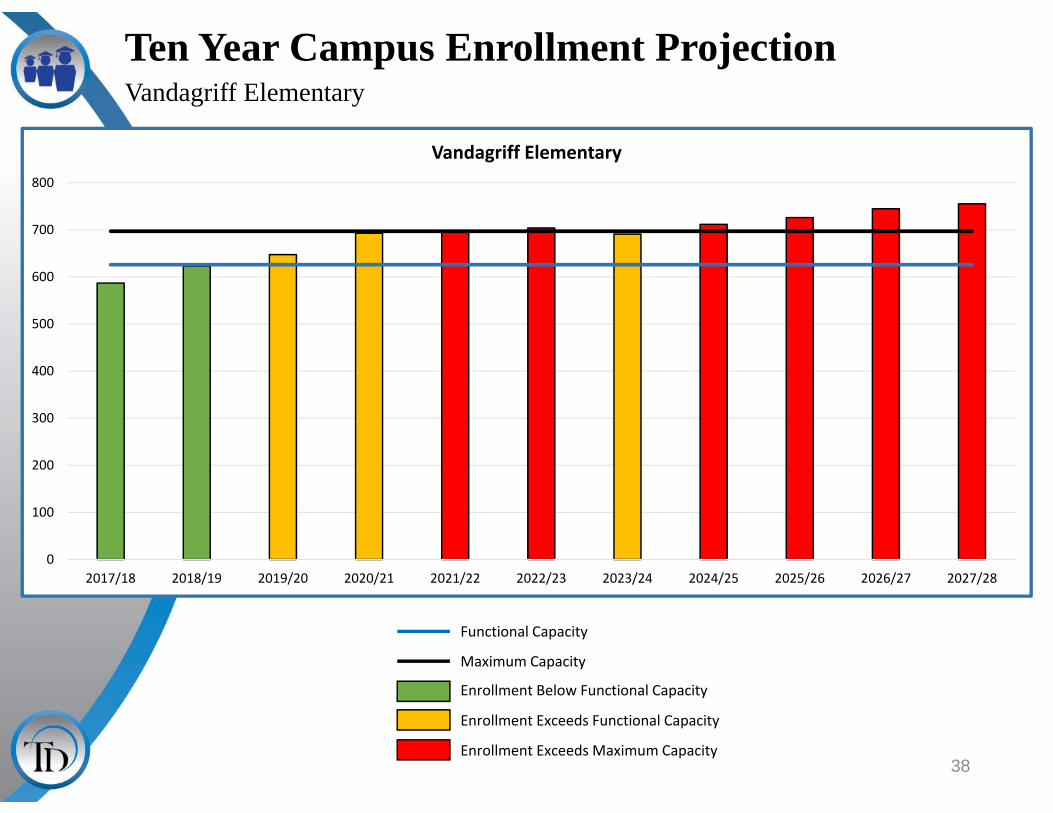
Ten Year Campus Enrollment Projection
38
Vandagriff Elementary
0
100
200
300
400
500
600
700
800
2017/18 2018/19 2019/20 2020/21 2021/22 2022/23 2023/24 2024/25 2025/26 2026/27 2027/28
Vandagriff Elementary
Enrollment Below Functional Capacity
Enrollment Exceeds Functional Capacity
Enrollment Exceeds Maximum Capacity
Functional Capacity
Maximum Capacity

Ten Year Campus Enrollment Projection
39
Walsh Elementary
0
200
400
600
800
1,000
1,200
1,400
1,600
1,800
2,000
2017/18 2018/19 2019/20 2020/21 2021/22 2022/23 2023/24 2024/25 2025/26 2026/27 2027/28
Walsh Elementary
Enrollment Below Functional Capacity
Enrollment Exceeds Functional Capacity
Enrollment Exceeds Maximum Capacity
Functional Capacity
Maximum Capacity