alexander dymo - rubyconf 2014 - ruby performance secrets and how to uncover them
TRANSCRIPT

Ruby Performance Secrets andHow to Uncover Them
http://www.slideshare.net/adymo/adymo-rubyconf-performance

Who am I?
Alexander Dymo
C/C++ since 2000Ruby/Rails since 2006
Started to optimize back in 2007
Never stopped since then

Rails Performance: What You Need to Knowhttps://www.airpair.com/ruby-on-rails/performance
Make Your Ruby/Rails App Fast: Performance And MemoryProfiling Using ruby-prof and Kcachegrindhttp://www.acunote.com/blog/2008/02/make-your-ruby-rails-applications-fast-performance-and-memory-profiling.html
Ruby Performance Tuninghttp://theprosegarden.com/contents-of-recent-issues/#10-14

Ruby Performance
The first comprehensive bookon Ruby Performance
I'm 50% done. Beta soon.
ruby-performance-book.com

Big thanks to:

What do we talk about today?
Performance tips
Performance best practices

What do we talk about today?
Performance tips
Performance best practices
How to understand what's wrong
How to find your own performance tips/best practices

In examples

Example 1

What can go wrong with this code?

What can go wrong with this code?

This was faster


100-200ms fasterSometimes
…

Smells like...

https://www.flickr.com/photos/timquijano/5720765523/

Let's check what happens:

Let's profile memory allocations
Need patched rubyrvm reinstall 1.9.3 --patch railsexpressrvm reinstall 2.0.0 --patch railsexpressrvm reinstall 2.1.4 --patch railsexpress

Let's profile memory allocations
Need profilergem install ruby-prof
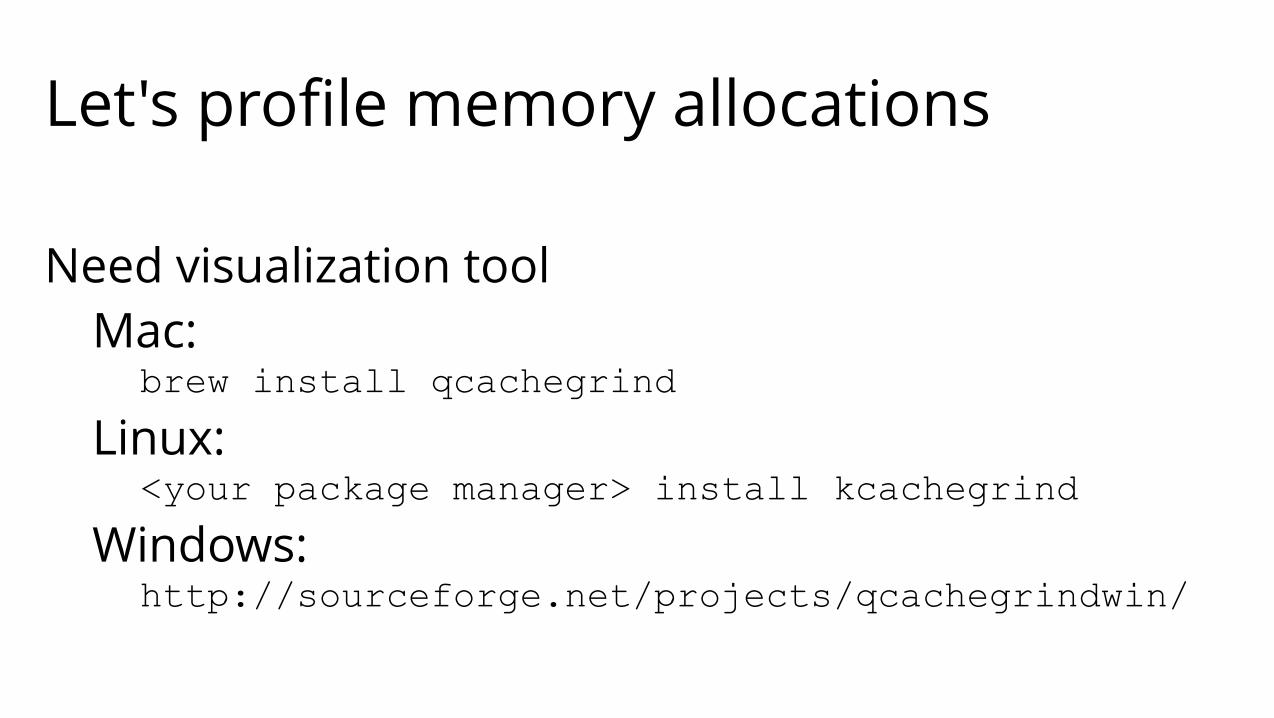
Let's profile memory allocations
Need visualization toolMac:
brew install qcachegrind
Linux:<your package manager> install kcachegrind
Windows:http://sourceforge.net/projects/qcachegrindwin/
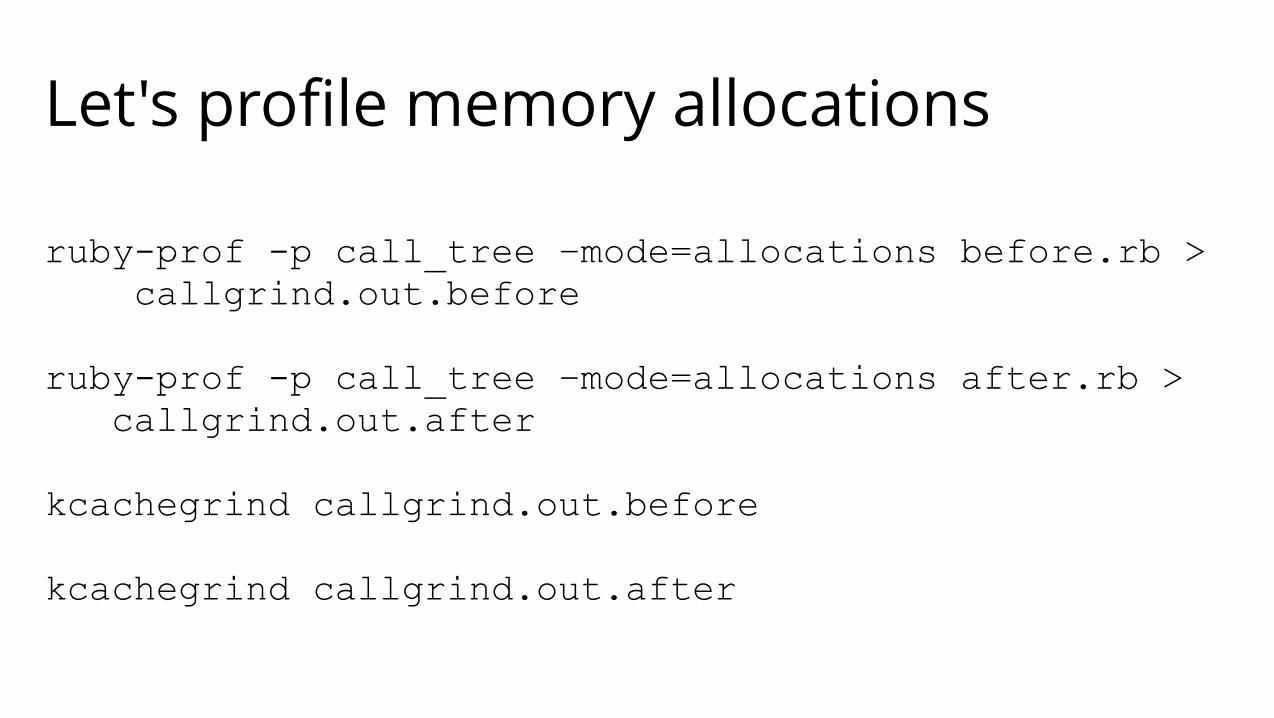
Let's profile memory allocations
ruby-prof -p call_tree –mode=allocations before.rb > callgrind.out.before
ruby-prof -p call_tree –mode=allocations after.rb > callgrind.out.after
kcachegrind callgrind.out.before
kcachegrind callgrind.out.after


static VALUE enum_inject(int argc, VALUE *argv, VALUE obj){ NODE *memo; VALUE init, op; rb_block_call_func *iter = inject_i; … memo = NEW_MEMO(init, argc, op); rb_block_call(obj, id_each, 0, 0, iter, (VALUE)memo); return memo->u1.value;}
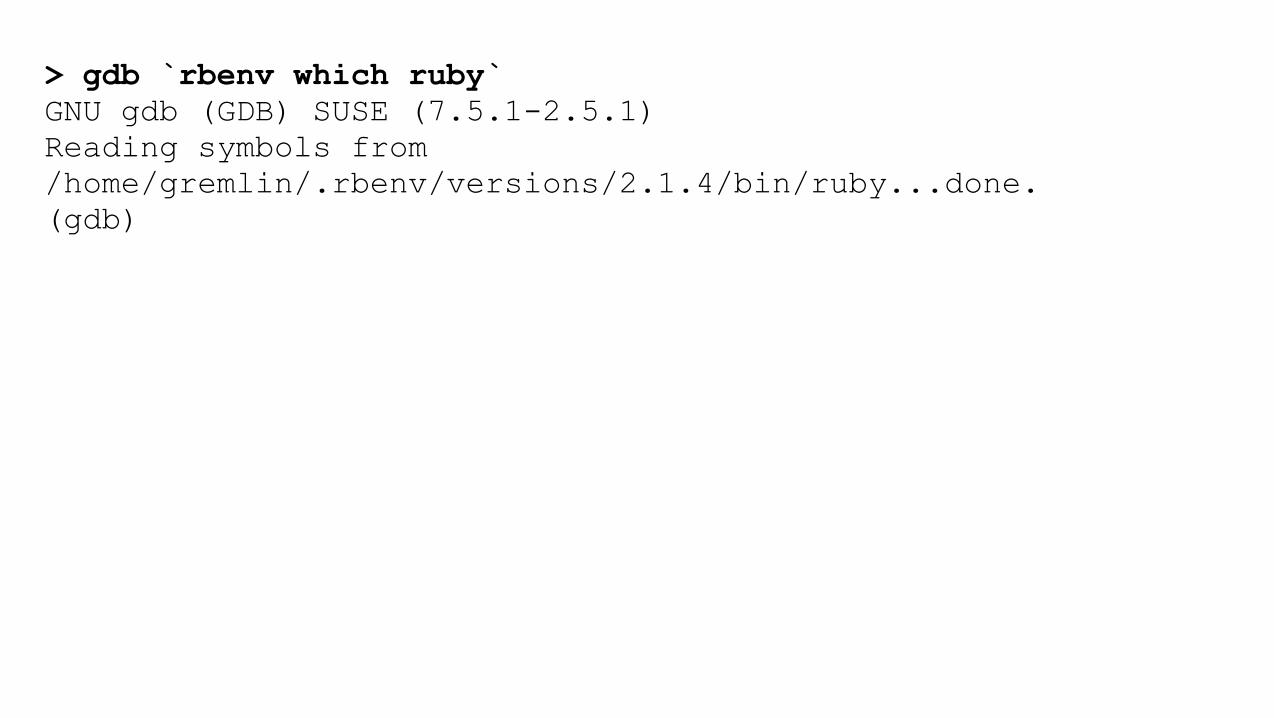
> gdb `rbenv which ruby`GNU gdb (GDB) SUSE (7.5.1-2.5.1)Reading symbols from/home/gremlin/.rbenv/versions/2.1.4/bin/ruby...done.(gdb)

(gdb) l enum_inject632 * longest #=> "sheep"633 *634 */635 static VALUE636 enum_inject(int argc, VALUE *argv, VALUE obj)637 {638 NODE *memo;639 VALUE init, op;640 rb_block_call_func *iter = inject_i;641 ID id;(gdb)

636 enum_inject(int argc, VALUE *argv, VALUE obj)637 {638 NODE *memo;639 VALUE init, op;640 rb_block_call_func *iter = inject_i;641 ID id;(gdb) b 638Breakpoint 1 at 0x1cbc0a: file enum.c, line 638.(gdb)

(gdb) r -e '[1,2,3].inject {}'Starting program:/home/gremlin/.rbenv/versions/2.1.4/bin/ruby -e'[1,2,3].inject {}'[Thread debugging using libthread_db enabled]Using host libthread_db library "/lib64/libthread_db.so.1".[New Thread 0x7ffff7ff2700 (LWP 3893)]
Breakpoint 1, enum_inject (argc=0, argv=<optimized out>,obj=93825001586240) at enum.c:640640 rb_block_call_func *iter = inject_i;(gdb)

640 rb_block_call_func *iter = inject_i;(gdb) n665 memo = NEW_MEMO(init, argc, op);(gdb)

640 rb_block_call_func *iter = inject_i;(gdb) n665 memo = NEW_MEMO(init, argc, op);(gdb) n666 rb_block_call(obj, id_each, 0, 0, iter,(VALUE)memo);(gdb)

640 rb_block_call_func *iter = inject_i;(gdb) n665 memo = NEW_MEMO(init, argc, op);(gdb) n666 rb_block_call(obj, id_each, 0, 0, iter,(VALUE)memo);(gdb) srb_block_call (obj=93825001586240, mid=1456, argc=0,argv=0x0, bl_proc=0x555555722460 <inject_i>, data2=93825001586200) at vm_eval.c:11421142 {(gdb)

640 rb_block_call_func *iter = inject_i;(gdb) n665 memo = NEW_MEMO(init, argc, op);(gdb) n666 rb_block_call(obj, id_each, 0, 0, iter,(VALUE)memo);(gdb) srb_block_call (obj=93825001586240, mid=1456, argc=0,argv=0x0, bl_proc=0x555555722460 <inject_i>, data2=93825001586200) at vm_eval.c:11421142 {(gdb) s1145 arg.obj = obj;(gdb)

640 rb_block_call_func *iter = inject_i;(gdb) n665 memo = NEW_MEMO(init, argc, op);(gdb) n666 rb_block_call(obj, id_each, 0, 0, iter,(VALUE)memo);(gdb) srb_block_call (obj=93825001586240, mid=1456, argc=0,argv=0x0, bl_proc=0x555555722460 <inject_i>, data2=93825001586200) at vm_eval.c:11421142 {(gdb) s1145 arg.obj = obj;(gdb) s1146 arg.mid = mid;(gdb)

640 rb_block_call_func *iter = inject_i;(gdb) n665 memo = NEW_MEMO(init, argc, op);(gdb) n666 rb_block_call(obj, id_each, 0, 0, iter,(VALUE)memo);(gdb) srb_block_call (obj=93825001586240, mid=1456, argc=0,argv=0x0, bl_proc=0x555555722460 <inject_i>, data2=93825001586200) at vm_eval.c:11421142 {(gdb) s1145 arg.obj = obj;(gdb) s1146 arg.mid = mid;(gdb) s1147 arg.argc = argc;(gdb)

(gdb) s1147 arg.argc = argc;(gdb) s1148 arg.argv = argv;(gdb)

(gdb) s1147 arg.argc = argc;(gdb) s1148 arg.argv = argv;(gdb) s1149 return rb_iterate(iterate_method, (VALUE)&arg,bl_proc, data2);(gdb)

(gdb) s1147 arg.argc = argc;(gdb) s1148 arg.argv = argv;(gdb) s1149 return rb_iterate(iterate_method, (VALUE)&arg,bl_proc, data2);(gdb) srb_iterate (it_proc=it_proc@entry=0x5555556c0790<iterate_method>, data1=data1@entry=140737488340304, bl_proc=0x555555722460 <inject_i>, data2=93825001586200)at vm_eval.c:10541054 {(gdb)

(gdb) s1147 arg.argc = argc;(gdb) s1148 arg.argv = argv;(gdb) s1149 return rb_iterate(iterate_method, (VALUE)&arg,bl_proc, data2);(gdb) srb_iterate (it_proc=it_proc@entry=0x5555556c0790<iterate_method>, data1=data1@entry=140737488340304, bl_proc=0x555555722460 <inject_i>, data2=93825001586200)at vm_eval.c:10541054 {(gdb) s1057 NODE *node = NEW_IFUNC(bl_proc, data2);(gdb)

(gdb) s1147 arg.argc = argc;(gdb) s1148 arg.argv = argv;(gdb) s1149 return rb_iterate(iterate_method, (VALUE)&arg,bl_proc, data2);(gdb) srb_iterate (it_proc=it_proc@entry=0x5555556c0790<iterate_method>, data1=data1@entry=140737488340304, bl_proc=0x555555722460 <inject_i>, data2=93825001586200)at vm_eval.c:10541054 {(gdb) s1057 NODE *node = NEW_IFUNC(bl_proc, data2);(gdb)

static VALUE enum_inject(int argc, VALUE *argv, VALUE obj){ NODE *memo; VALUE init, op; rb_block_call_func *iter = inject_i; … memo = NEW_MEMO(init, argc, op); rb_block_call(obj, id_each, 0, 0, iter, (VALUE)memo); return memo->u1.value;}

VALUE rb_block_call(…){ … return rb_iterate(iterate_method, (VALUE)&arg, bl_proc, data2);}
VALUE rb_iterate(…){ int state; volatile VALUE retval = Qnil; NODE *node = NEW_IFUNC(bl_proc, data2); …}

2 T_NODE's per inject() call

10000.times { [].inject }
20000 extra T_NODE objects
some work for GC


Ruby Performance
More in my book
ruby-performance-book.com

Lessons learned:
1. use profiler to understand why your code is slow
2. use C debugger to understand Ruby behavior

Example 2
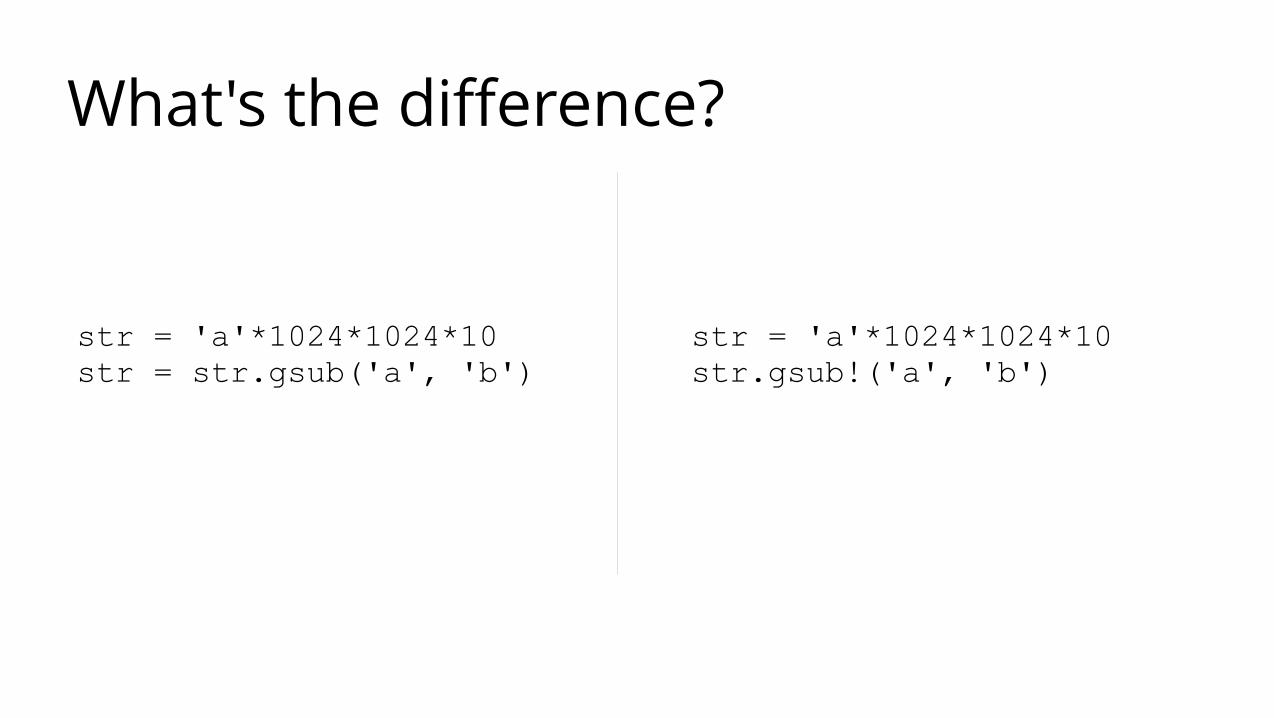
What's the difference?
str = 'a'*1024*1024*10str = str.gsub('a', 'b')
str = 'a'*1024*1024*10str.gsub!('a', 'b')

str = 'a'*1024*1024*10str = str.gsub('a', 'b')
str = 'a'*1024*1024*10str.gsub!('a', 'b')
replaces 'a' with 'b'creates a new objectreuses "str" name
replaces 'a' with 'b'changes the original

Supposedly

Let's profile memory usage
ruby-prof -p call_tree –mode=memory after.rb >callgrind.out.after
kcachegrind callgrind.out.after


So, gsub! doesn't save any memory

So, gsub! doesn't save any memory… except one slot on Ruby heap

So, gsub! doesn't save any memoryexcept one slot on Ruby heap
… which is 40 bytes

Not all bang! functions are the same
str = 'a'*1024*1024*10str.downcase!
ruby-prof -p call_tree –mode=memory downcase.rb > callgrind.out.downcase
kcachegrind callgrind.out.downcase


Lessons learned:
1. profile memory
2. challenge all tips/tricks/best practices

Conclusions1. Don't guess. Profile.
2. Guess. Profile.
3. Profile not only CPU, but Memory.
4. Look at the source, use GDB if not enlightened.
5. Challenge all tips/tricks. Understand instead.

Big thanks to:
Ruby Performance
ruby-performance-book.com
airpair.me/adymo
@alexander_dymo