alexander kuo neil malhotra cecilia hyunjung mo
TRANSCRIPT

Why Do Asian Americans Identify as Democrats? Testing Theories of Social Exclusion and Intergroup Commonality
Alexander Kuo Neil Malhotra
Cecilia Hyunjung Mo
ABSTRACT
Working Paper: 1-2014 Research Concentration: Elections and Electoral Rules
Why are Asian Americans overwhelmingly likely to identify as Democrats? Addressing thisquestion is important given the increasing presence of Asians in the American electorate. Wefocus on two explanations: social exclusion and intergroup commonality. According to the firsthypothesis, social exclusion arises from Asian Americans’ perceptions that they are viewed asless “American,” and associate these feelings with the Republican Party. The second hypothesisis that Asian Americans exhibit intergroup commonality; they believe they have shared interestswith other ethnic minorities that already support the Democratic Party. As a result, AsianAmericans align themselves politically with these minority groups rather than with whites. Usinga mixed-method approach (a large-scale representative survey, a laboratory experiment, anda survey experiment), we find empirical support for both hypotheses.

Why Do Asian Americans Identify as Democrats? Testing Theories
of Social Exclusion and Intergroup Commonality
June 26, 2015
Abstract
Why are Asian Americans overwhelmingly likely to identify as Democrats? Addressing thisquestion is important given the increasing presence of Asians in the American electorate. Wefocus on two explanations: social exclusion and intergroup commonality. According to the firsthypothesis, social exclusion arises from Asian Americans’ perceptions that they are viewed asless “American,” and associate these feelings with the Republican Party. The second hypothesisis that Asian Americans exhibit intergroup commonality ; they believe they have shared inter-ests with other ethnic minorities that already support the Democratic Party. As a result, AsianAmericans align themselves politically with these minority groups rather than with whites. Us-ing a mixed-method approach (a large-scale representative survey, a laboratory experiment, anda survey experiment), we find empirical support for both hypotheses.

In the 2012 U.S. presidential election, Barack Obama garnered 73% of the Asian American
vote, exceeding his support among Hispanics (71%) and women (55%) (Wilkinson 2012). Survey
data also suggests that Asians are much more likely to identify as Democrats than Republicans
(e.g., Hajnal and Lee 2011; Wong et al. 2011). Why? Despite the growth of subfields of American
political behavior that study the political views of minority groups such as African Americans,
Hispanics/Latinos, and women, there are few systematic studies of the partisan identification of
Asian Americans.1
This omission is unfortunate because Asian Americans are the nation’s fastest-growing racial/
ethnic group (U.S. Census Bureau 2013). Among places of origin, Asia recently surpassed Latin
America as the main source of documented immigration to the U.S.; according to the latest Census
data, about 36% of all new immigrants in 2010 were Asian compared to 31% who were Hispanic
(Barrera 2013). People of Asian descent constitute 5% of the U.S. population and are projected to
comprise approximately 9% by 2050 (File 2013). Of 16 million Asian Americans, 3.9 million voted
in the 2012 elections, accounting for nearly 4% of all voters (a 500,000-person increase from 2008).
In some states, they make up a considerably higher proportion of the electorate; for instance, 11%
of California voters are Asian American (Baldassare et al. 2013). Since 1996, the number of Asian
American voters has increased by 105%, in contrast to a 13% increase of white voters (File 2013).
This increasingly politically relevant demographic group disproportionately votes for Demo-
cratic candidates and self-identifies as Democrats. In the 2008 and 2012 presidential elections,
Obama received 64% and 73% of the Asian American vote share, respectively. This general Demo-
cratic orientation is confirmed in other large surveys. The 2012 Pew Research Center Study of
Asian Americans found that 51% identify with the Democratic Party versus 27% with the Repub-
lican Party. According to the 2008 and 2012 Cooperative Congressional Election Studies (CCES),
which have national samples of U.S. adults with large numbers of Asian Americans interviewed,
Asians are significantly more likely than whites to exhibit liberal responses to survey items on
party identification, ideology, and vote choice. Their responses are much more similar to Blacks
1This article describes Asian Americans as those persons living (permanently) in the United States and whose
ancestry can be traced to East Asia (e.g., China, Japan, and Korea), Southeast Asia (e.g., Cambodia, Indonesia,
Laos, Malaysia, the Philippines, Singapore, Thailand, and Vietnam), and South Asia (e.g., Bangladesh, Bhutan,
India, Maldives, Nepal, Pakistan, and Sri Lanka).
1

and Hispanics than whites with respect to these variables (see Figure A.1 in Online Appendix A).
Such demographic and political patterns underscore the need to better understand the bases of
Asian American partisanship and political behavior. Relative to the voluminous and well-developed
literatures on the partisan orientation and voting patterns of other minorities such as African-
Americans and Hispanics, the theoretical and empirical literature on Asians remains relatively
limited. The paucity of research on Asian American partisanship and voting behavior is unfortunate
as this minority group is rapidly increasing in political, cultural, and economic influence. Besides
the obvious substantive interest of the question, exploring Asian American political identity also
contributes insights relevant to theories of political parties and partisan identification.
We address this question of why Asian Americans are more likely to vote Democratic by propos-
ing two related explanations: social exclusion and beliefs about common intergroup interests.2 Ac-
cording to the first explanation, Asian Americans view the contemporary Republican Party as
excluding them from society and perceiving them as foreign. This social exclusion arises from a
perception that they are di↵erent and distinct from the majority white racial group and not part
of the “natural” U.S. social fabric. Awareness of exclusion makes Asian Americans feel that the
Republican Party does not represent their interests. The second explanation, which is not mutually
exclusive, is that Asian Americans believe they have common interests with other ethnic minority
groups that have been longstanding constituencies within the Democratic Party, and thus align
themselves with these groups rather than with whites.
These accounts are not inconsistent with other explanations for why Asian Americans identify as
Democrats. For instance, Asian Americans might be more Democratic because they are less likely
to be evangelical Christians (Pew Research Center 2012). Additionally, as Asians are more likely
to live in Democratic-leaning states and urban areas, they might be influenced by the surrounding
political environment (Junn, Lee, Ramakrishnan, and Wong 2011). Finally, they may base their
party identification on agreement with the Democratic Party on policy issues. However, recent
evidence suggests that issue positions are more likely to be derived from party identification rather
than vice versa (e.g., Lenz 2012). We do not view understanding Asian American political identity
as a horse race among myriad explanations. Rather, we focus on those explanations that have
2For expositional simplicity, we refer to “beliefs about common intergroup interests” as “intergroup commonality”
throughout the paper.
2

yet to be systematically tested, and that can be experimentally manipulated so that we can assess
their causal e↵ects on political attitudes and identification. In the discussion section, we lay out
pathways for future investigation of these additional explanations.
We test the two explanations using various sources of data. We begin by analyzing observa-
tional data from the highest quality nationally representative survey of Asian Americans to date
(Ramakrishnan et al. 2008). We document consistent, positive correlations between Democratic
partisanship and (1) reported racial victimization, which proxies for feelings of social exclusion, and
(2) feelings of commonality with other ethnic minorities as opposed to whites. Our main studies
use two experiments to test causal hypotheses validating the correlations in the observational data.
The experimental treatments exogenously manipulate our two independent variables of interest and
assess downstream e↵ects on identification with and support for the Democratic Party. We leverage
a mixed-method approach, using diverse sources of evidence with unique strengths and limitations.
While large-scale surveys are highly representative, laboratory studies allow for precise control,
randomized intervention, and personal interaction; survey experiments draw upon the advantages
of both approaches. Reassuringly,our hypotheses are supported by di↵erent methodological ap-
proaches.
The first study is a laboratory experiment that captures the exogenous impact of exclusion-
based racial microaggressions; we find that Asians who are randomly subjected to a seemingly
innocuous exclusionary cue are more likely to believe that Republicans do not represent their
interests and identify with the Democratic Party. If social exclusion causes Asian Americans to
support the Democratic Party (and if they believe that the Republican Party makes them feel less
“American”), then priming such exclusion in an experimental setting should cause Asian Americans
to adopt more pro-Democratic positions.
The second study is a survey experiment of a large, diverse, national sample of Asians living
in the U.S., where we manipulate feelings of intergroup commonality by framing immigration as a
policy where Asians have shared versus competing interests with Hispanics. We find that increasing
intergroup conflict with a minority group that is traditionally a Democratic Party constituency
makes Asians more sympathetic to Republicans, while increasing feelings of shared interests with
Hispanics generates opposition to Republicans.
Our results also have implications for understanding the contemporary nature of American elec-
3

toral politics. A prominent theory of political parties forwarded by Bawn et al. (2012) conceptualizes
them as coalitions of policy-demanding groups (e.g., business, labor, religious denominations). In
the American context, other relevant groups could be those based upon ascriptive characteristics
such as race and ethnicity. Zaller (2012) suggests that voters may attach themselves to parties
on the basis of ethnicity (or attachments to ethnic groups), but notes that there is not strong
empirical evidence supporting this conjecture. Our results are consistent with Zaller’s theoretical
account. We find that feelings of social exclusion due to race and ethnicity, as well as beliefs about
shared interests with other minority groups, lead Asian Americans to prefer the Democratic Party.
As such, Democrats may have an advantage retaining this group going forward. The Democratic
Party has attracted a fast-growing, increasingly politically engaged constituency, and we argue that
this is based partly on not being tied to exclusionary policies and rhetoric. Further, as we note in
the conclusion, the Republican Party may have limited ability to emphasize and frame issues in a
manner such that they create cleavages between Asians and other ethnic minority groups.
An important caveat is in order. Due to constraints on sample size in the experiments, we did
not have the statistical power to run analyses separately for di↵erent subgroups of Asian Americans.
However, this is less important for our specific research questions, given that we theoretically expect
social exclusion and intergroup commonality to a↵ect Asian Americans as a whole. This is not to
say that the e↵ects are equivalent across all ethnic subgroups. Future research should delve into
the obvious diversity of the Asian American community.
The paper is organized as follows. We first review the literature on Asian American political
behavior and provide a theoretical overview of our main hypotheses. We then describe observa-
tional data motivating our experimental research. Next, we discuss the methodology and findings
of two experimental studies that illustrate the importance of social exclusion and beliefs about
intergroup interests as causal explanations of Asian American party identification. We conclude
with a discussion of the implications of these findings and pathways for future research.
Existing Literature and Theoretical Overview
The study of Asian American political identity does not fit neatly within existing paradigms
of American political behavior and potentially challenges them. For instance, immigrant political
integration is not well explained by theories that conceive of party identification as largely a product
4

of early socialization or parental attitudes (e.g., Campbell et al. 1960; Green, Palmquist, and
Shickler 2002; Jennings and Niemi 1968). Nor is it well informed by the school of research that
views party identification as the result of individuals assessing competing party platforms and
electoral performance over long periods of time (e.g., Bartels 2000; Fiorina 1981). Consequently,
we provide alternative explanations of the sources of party attachments.
The literature on the partisan identification of Asian Americans is scant; few studies since the
establishment of Asians as a distinct minority or clear Democratic constituency theoretically focus
on the partisan identity of Asians alone. This scarcity contrasts with the substantially larger litera-
ture on the political integration and partisan identification of other immigrant minorities, primarily
Hispanics/Latinos (e.g., De la Garza 2004; Fraga et al. 2006; Nicholson and Segura 2005; Uhlaner
and Garcia 2005). A few studies use theoretical constructs to jointly explain political participation
and attitudes of both Hispanic/Latino and Asian immigrants (e.g., Wong 2008), but this research
does not theorize about the political orientation of Asians as a distinct immigrant/ethnic group in
the U.S. Moreover, the existing scholarship that focuses solely on the political behavior of Asian
Americans mainly examines questions related to political participation, as opposed to identification
with the Democratic Party (e.g., Lien 2001; Lien et al. 2001; Wong 2008; Wong et al. 2011).
A smaller, recent literature has begun to explore Asian American partisan a�liation; however,
this body of work addresses the question of what explains whether Asians have any type of partisan
identification at all rather than focusing on Asians’ selection of a particular political party. This
agenda is a variant of previous research on political engagement. Hajnal and Lee (2011) provide
a general account of why ethnic minorities and white Independents select a political party. Wong
(2000), studying Asian American and Latino immigrants, finds that length of time in the U.S.,
citizenship status, and English proficiency—which allow for greater assimilation—are correlated
with developing a partisan identification. This work builds on much older surveys using more
localized samples (e.g., Southern or Northern California only), such as by Cain, Kiewiet, and
Uhlaner (1991), which found that Asian Americans were more likely to be Republics than Latinos,
and that foreign policy concerns drove such dispositions.
When examining Asian American political behavior, two trends emerge. First, Asians are less
likely to participate in politics than other ethnic groups. Second, even if they participate, Asians
are less likely to align with a political party. Consequently, it is unsurprising that much research on
5
Asian Americans has focused on these two empirical patterns. However, given that Asian American
political participation has been increasing and an overwhelming majority of today’s Asian American
voters are rejecting candidates from the Republican Party, we build upon the extant literature to
focus on the less-explored question of why Asian Americans align more with the Democratic Party.
Other empirical work that uses larger, nationally representative or diverse samples of Asian
Americans and that examines partisan orientation more directly does confirm that Asian Americans
are currently more likely to identify with the Democratic Party (Hajnal and Lee 2011; Wong et al.
2011). Extant studies draw upon previous assimilation models to argue that Asians who have lived
in the U.S. longer, are wealthier, and are more educated should be more likely to be Republican,
without explaining the current pattern of Asian American party identification. Moreover, the
few studies that do discuss the role of ethnicity or group-related variables in explaining political
behavior do not specify the importance of social exclusion and intergroup commonality, which we
elaborate on below. Further, these studies are generally less attentive to testing causal relationships
between these variables and partisan a�liation.
We build on these accounts and draw on theories relevant to partisan identification for other mi-
nority groups to test a set of underexplored explanations for why Asian Americans today are more
likely to be Democrats. One should cautiously apply theories relevant to other ethnic minorities
to explain Asian American party identification for several reasons. As Lien (2001) argues, Asian
immigrants have naturalized earlier and at faster rates than other immigrants, but have lower voter
registration rates than any other immigrant group. Further, as many scholars of minority political
behavior emphasize, social context shapes the impact of individual-level variables on political iden-
tification, and this context may be unique for Asians. A key aspect of this context is that Asians
as a group are perceived di↵erently from other minority groups, and this perception shapes group
consciousness and interactions (Kim 2000; Lien 2000; Wong 2000). For instance, while viewed as
a “model minority” with desirable traits (Chou and Feagin 2008), Asians are also perceived as
less “American” and therefore perhaps unequal citizens, whether due to stereotypes based on their
physical appearance (as they have great di�culty “passing” as stereotypical white Americans), or
due to other visible or cultural characteristics such as accent, dress, food, language, religion, and
the like (e.g., Devos and Banaji 2005; Sidanius et al. 1997). This is in contrast to African Americans
and Hispanics/Latinos, who have longer histories of residence in the U.S., and with respect to the
6

latter group, more geographic proximity to the U.S.
We first outline our argument for why social exclusion a↵ects partisan a�liation. Individuals
who perceive exclusion based on their ethnic background may link such behavior to exclusion of
their ethnic group as a whole. Such feelings of social exclusion can be unrelated to public policies
and may be individualistic. Nonetheless, individuals who feel that one party excludes them from
the social fabric are less likely to perceive the party as serving their group’s interests, and therefore
should be less likely to support or a�liate with the party. Because the Democratic Party is largely
viewed to be the party with a policy agenda more beneficial for ethnic minority groups (Carmines
and Stimson 1989; Lee 2002), individual-level feelings of social exclusion should be linked to greater
support for Democrats.
Our hypothesis that social exclusion plays a role in Asian American party identification also
builds upon the social psychological literature that notes the importance of “everyday” discrim-
ination for feelings of social exclusion among minority groups. This literature documents how
commonplace the sense of social exclusion may be for people of color. Asians in the U.S. are more
likely than whites to be victims of racial microaggressions, which are defined as brief and common-
place verbal, behavioral, or environmental indignities. Such aggression can communicate negative
racial slights, leading to perceptions of exclusion (e.g., Sue et al. 2007).
The premise that social exclusion matters strongly for Asians is consistent with qualitative
work in political science. Chang (2004) shows how the reaction of the U.S. public to the 1996
“Asian Donorgate” campaign finance controversy—where Asian Americans were depicted as out-
siders attempting to buy influence with U.S. politicians on behalf of foreign governments—conveys
its perception of Asian Americans as perpetually foreign. Kim (2000, 16) finds that Asians are often
viewed more positively by white Americans than other minority groups, and yet are “...permanently
foreign and unassimilable.” This attitude toward Asians acts as a barrier to political participation
(Kim 2007) and leads to the exclusion of Asians from civic membership (Kim 2000).
The significance of social exclusion as a determinant of Asian political behavior is also motivated
by findings in psychological research that document white citizens’ conflation of “American” with
“whiteness,” and their perception that Asian Americans are less American. This research finds that
whites are more likely to be viewed as Americans than Asians (Devos and Banaji 2005; Sidanius
7

et al. 1997; Smith and Zarate 1992; Stroessner 1996).3 Other studies using an array of method-
ological approaches similarly observe that Asians face among the strongest social barriers to social
assimilation (Devos and Ma 2008; Devos and Heng 2009; Liang, Li, and Kim 2004; Yogeeswaran and
Dasgupta 2010). This di�culty persists in spite of the “model minority” stereotype and successful
economic assimilation (Chou and Feagin 2008). Although Asian Americans are perceived as less
American, Asian Americans themselves are just as likely as white Americans to identify themselves
as American and have explicit and implicit patriotic attitudes (Cheryan and Monin 2005; LaFrom-
broise, Coleman, and Gerton 1993; Sidanius et al. 1997). The impact of such microaggression on
exclusionary feelings can be magnified in other political contexts, such as advertisements, political
rhetoric, and policy positions on issues related to Asians. To the extent that the Democratic Party
is seen as less exclusionary, we theorize that greater feelings of exclusion from the U.S. make Asian
identification with the Democratic Party more likely. This can be due to perceptions of exclusionary
behaviors by Republican political elites as well as Republican identifiers in the mass public.
We posit a complementary theory of why Asians are predominantly Democrats that focuses
on intergroup commonality (i.e., perceptions of shared interests among groups). As Bawn et al.
(2012) argue, political parties can be viewed as coalitions of di↵erent interest groups, including
groups based on shared ethnicity or nationality. If the dimensions of politics that are salient
to Asian Americans place them in political coalitions with Blacks and Hispanics, then they are
also likely to perceive themselves as being in alliance with political parties within that coalition.
Individuals in a minority group with more perceived common interests with ethnic groups that are
already traditional constituencies of a party should be more likely to a�liate with that party. This
theoretical expectation also follows from the argument of Blumer (1958), who argues that racial
and ethnic conflict can be a manifestation of group conflict over scarce resources. Di↵erent ethnic or
racial minority groups may align with the political party that better serves general minority interests
and against the party perceived to serve the majority group interests, as political competition can
be viewed as a zero-sum game for resources in “group” terms.4
3See also Junn and Masuoka (2013) for a discussion of the importance of racial hierarchy in the U.S. in explaining
attitudes toward immigrant groups.
4For this theoretical expectation, strong within-group commonality is not a necessary condition. All that is
required is the belief that one’s groups’ interests are aligned with another group(s)’ interests.
8

Recent work on immigrant political behavior does examine the role of discrimination and group-
oriented explanations for party identification. However, few studies specifically isolate the variables
of social exclusion and beliefs about intergroup interests, and none have done so with Asian Amer-
icans. Further, we propose research designs that allow us to better estimate causal e↵ects of such
studied variables. Existing observational approaches that use diverse samples of Asians do show
some correlations between perceptions of social exclusion and intergroup commonality and Demo-
cratic partisan identification, giving us some prima facie evidence for our suppositions. But such
studies remain vulnerable to concerns about omitted variable bias and reverse causation, raising
the possibility that such correlations might be spurious. For instance, political orientation itself
may predict whether people are sensitive to social exclusion or believe they have shared interests
with other minority groups. Additionally, variables such as education or cosmopolitanism could
be related to both party identification and exclusion/belief in shared interests. Our experimental
research designs build upon observational findings by isolating exclusion and beliefs about com-
mon minority interests and showing the impact of exogenous changes in such variables on party
identification.
Observational Evidence
Before presenting the causal tests of our hypotheses from experimental data, we first assess
whether there is correlational evidence in a high-quality, probability sample. We analyze the 2008
National Asian American Survey (NAAS), which interviewed a nationally representative sample
of Asians (Ramakrishnan et al. 2008).5 This is among the most detailed data on Asian American
political preferences to date, consisting of a telephone sample of 5,159 Asians. The majority of
the sample were U.S. citizens (76%), and 11% were born in the U.S. The average household in the
study reported an income in the $50,000-$75,000 range. The two largest groups were of Chinese or
Taiwanese descent (26%) and of South Asian descent (22%).
The dependent variable of interest for these analyses is party identification.6 Approximately
5This observational analysis partially replicates similar analyses reported in Chapter 6 of Hajnal and Lee (2011),
although we focus explicitly on the choice of Asians to identify with the Democratic Party. See Lee (2008) for a
discussion of data collection and for further details on the demographic composition of the NAAS sample.
6Respondents were asked: “Generally speaking, do you think of yourself as a Republican, Democrat, Independent,
some other party, or do you not think in these terms?” where the order of Republican and Democrat in this question
9

39% of the sample identified with the Democratic Party; 19% identified with the Republican Party
(these figures include self-reported Independents who lean toward a party). A third of the sample
reported “not thinking in these [partisan] terms,” and 9% reported “don’t know” or refused to
answer the party identification question. A striking feature of this distribution is the plurality of
respondents who do not select one of the two major political parties. Other research has explored
this empirical pattern; we extend this literature by examining determinants of choice among identi-
fiers. Party identification is measured on a six-point scale (strong Democrat, not strong Democrat,
lean Democrat, lean Republican, not strong Republican, strong Republican). We rescaled the
party identification measure to lie between 0 and 1, with higher values representing Democratic
identifiers. We describe below how we handle missing values on the dependent variable.
To proxy for feelings of social exclusion, we construct a binary measure indicating whether a re-
spondent reported that he or she has been a victim of racial discrimination.7 Respondents reported
whether they had ever been racially discriminated against in each of the following situations: (1)
unfairly denied a job or fired; (2) unfairly denied a promotion at work; (3) unfairly treated by the
police; (4) unfairly prevented from renting or buying a home; (5) unfairly treated at a restaurant
or other place of service; or (6) been a victim of a hate crime. Nearly 40% of the sample reported
being a victim in at least one of these situations.8 The racial incidents in these categories can be
plausibly argued to temporally precede the dependent variable and therefore the social exclusion
variable can be considered exogenous. In other words, the variable does not represent self-reported
was randomized (response options: “Republican,” “Democrat,” “Independent,” “Other party (Specify),” “Do not
think in these terms”). Those who answered “Republican” or “Democrat” were then asked “Would you call yourself
a strong Republican/Democrat or not a strong Republican/Democrat.” Those who answered “Independent” were
asked the follow-up question: “Do you think of yourself as closer to the Republicans or the Democrats?”
7The text of the preamble to the questions reads: “We are interested in the way you have been treated in the
U.S., and whether you have ever been treated unfairly because of your race, ancestry, being an immigrant, or having
an accent.” Respondents were then asked: “Have you ever been unfairly denied a job or fired?” (response options:
“Yes” or “No”). A similar wording followed for the remaining five discrimination questions.
8About 18% report being a victim in one of these categories; 10% report having been a victim in two of these
categories; 7% report having been a victims in three or more categories. We also included these levels as dummy
variables and did not observe any significant di↵erences between those coe�cients, leading us to collapse responses
in a binary fashion.
10

attitudes on feelings of discrimination but rather recollections of specific incidents. Of course, peo-
ple may misremember or misreport experiences based on their political attitudes, but the survey
item likely obviates the inferential problems involved with correlating two attitudes measured in
the same survey with each another. Nevertheless, we address potential issues of causal inference
below via an experiment in which we exogenously increase feelings of social exclusion.
To proxy for beliefs about shared interests with other minority groups, we use responses to
questions on how much the respondent feels that Asian Americans have in common with African
Americans/Blacks, Hispanics/Latinos, and whites regarding issues of political power and repre-
sentation. This question was coded on a four-point scale (response options: “a lot in common,”
“some,” “little,” “nothing at all in common”).9 Responses were recoded to lie between 0 and 1,
with 0 indicating nothing in common and 1 indicating a lot in common. We then calculated the
di↵erence in reported commonality with whites from the following three measures: (1) reported
commonality with African Americans/Blacks; (2) reported commonality with Hispanics/Latinos;
and (3) the average of the respondent’s scores for feelings of commonality with African Ameri-
cans/Blacks and Hispanics/Latinos to create a proxy for feelings of commonality with minorities
overall (each of the the resulting commonality scores are rescaled to lie between 0 and 1).10
We control for standard demographic and political variables that are associated with partisan
identification, as well as additional variables possibly relevant for Asians: gender, income, edu-
cation, age, percentage of time spent living in the U.S., religiosity, citizenship status, and liberal-
conservative ideology.11 Gender, religiosity, and citizenship status are all binary indicators; all other
9The text of the question is, “Thinking about government services, political power and representation, would
you say Asian Americans have a lot in common, some, little in common, or nothing at all in common with [ethnic
category]?”
10Feelings of commonality with African American/Blacks and Hispanic/Latino are highly correlated (r = 0.63,
p < 0.001). Consequently, there is a multicollinearity problem with including both measures in one specification as
it interferes with our ability to accurately compare the e↵ects of commonality with African Americans/Blacks and
Hispanics/Latinos separately. We therefore do not include these two variables together in the same regression model.
11Due to missing data in the independent variables, we present models that include binary indicators of missing
data and recode individuals missing on each of the control variables as 0 on those variables. This allows us to not
list-wise delete any data, while allowing for an intercept shift for respondents who did not answer various questions.
11

demographic variables are linear transformations coded to lie between 0 and 1.12 By recoding both
the dependent and independent variables in this manner, we can interpret a regression coe�cient as
representing a 100*� percentage-point increase in the dependent variable associated with moving
from the lowest to highest possible value of the independent variable. Summary statistics for the
variables of interest can be found in Online Appendix B (see Table B.1).
[Table 1 about here]
Table 1 reports results of OLS regressions where the dependent variable is the six-point measure
of party identification. Many respondents did not respond to the party identification question
that constitutes the dependent variable. We conducted the analysis in various ways to address
missing data on party identification. Models (1)-(3) display the results from list-wise deleting
respondents who did not answer the question; this approach eliminates approximately 42% of the
sample. Models (4)-(6) display results of the same OLS estimations by coding respondents who
did not identify with a party as the midpoint of the scale (0.5). Both of these approaches make
di↵erent assumptions about non-respondents, and the fact that the results are similar across model
specifications increases confidence in our results. Further, we estimated multinomial logit models
where refusal to answer the question is treated as a unique response category (see Table B.2 in
Online Appendix B). We also imputed missing values for party identification (see Table B.3 in
Online Appendix B). These alternative analytical approaches yielded similar results.
Both reported racial victimization (a measure of social exclusion) and perceived commonal-
ity with other ethnic minorities (as opposed to whites) are positively correlated with Democratic
Party identification.13 Across all models, racial victimization (our proxy for social exclusion) is
positively correlated with greater identification with the Democratic Party by 3 to 4 percentage
points depending on specification (see Table 1). We also find substantively large e↵ects for our mea-
sure of intergroup commonality with other minorities. A unit increase in intergroup commonality
12Education is coded on a five-point scale: did not graduate from high school, high school graduate, some college,
college degree, postgraduate degree. Income is coded on an eight-point scale representing increasing income categories
(see Table B.1 in Online Appendix B for the income categories). Religious is coded as 1 if a respondent chooses a
religion, and 0 otherwise. Political ideology is coded on a six-point scale with higher values corresponding to being
liberal. Percentage of time spent living in the U.S. is coded as the fraction of a person’s age spent in the U.S.
13Given that our hypotheses are directional, we employ one-tailed hypothesis tests throughout.
12

with African Americans/Blacks, Hispanics/Latinos, and both minority groups increases Democratic
identification by 4 to 7, 4 to 5, and 10 to 15 percentage points, respectively.
We also estimated an alternate specification where the dependent variable is identification with
the Democratic Party in binary terms (coded as 1 if the respondent leans towards the Democratic
Party, is a not-strong Democrat, or a strong Democrat, and 0 otherwise). The results of the logistic
regressions can be found in Online Appendix Table B.5. Whereas the previous analyses took into
account the extremity of association with a party, this analysis solely predicts an individual crossing
the cut point from being a Republican to being a Democrat. This represents a strong test as we
are predicting switching from one party to another, not simply being more attached to a particular
party. The coe�cients on social exclusion and commonality with other minorities remain positive
and significant. The estimated marginal e↵ect of being a victim on the probability of identifying
as a Democrat is about 7 percentage points. The estimated marginal e↵ect of a unit change
in perceived shared interest with African Americans/Blacks, Hispanics/Latinos, and both ethnic
minority groups is 6, 6, and 12 percentage points, respectively.
We find that these e↵ects of exclusion and commonality do not vary across income within
the Asian population; we find no interaction e↵ect between income and our victimization and
intergroup commonality measures (see Table B.6 in Online Appendix B). Also, we did not observe
heterogeneity with respect to country of origin, consistent with our theoretical expectation that the
e↵ects of social exclusion and intergroup commonality a↵ects Asian Americans broadly speaking.
This suggests it is appropriate to pool across di↵erent ethnic groups given our theoretical focus.
In sum, we have presented initial evidence in support of the hypotheses that feelings of social
exclusion and intergroup commonality with other minorities can partially account for why Asian
Americans are more likely to support the Democratic Party. Studies 1 and 2 causally test the two
hypotheses using experiments where we manipulate the two independent variables of interest.14
14Given the large share of respondents who identify with neither party, we also conducted an analysis predicting
party non-identification. We find that our measure for social exclusion is not associated with non-party identification
(p = 0.47 to 0.50), regardless of specification. We also find that our intergroup commonality measures are uncorrelated
with non-party identification (p = 0.15 to 0.45). Results are available in Online Appendix B (see Table B.7).
13

Study 1: Impact of Social Exclusion
In this study we exogenously manipulated feelings of social exclusion by randomly exposing
individuals to a “real world” cue designed to make them feel as if they are not welcome in the U.S.
We tested whether making Asians feel this way made them less likely to support Republicans as
they might associate the party with these negative feelings. If social exclusion is a causal factor that
can explain party a�liation, then manipulating it should increase positive views of the Democratic
Party and identification with it.
Below, we demonstrate through various outcome measures that the experiment captures this
theoretical pathway. Asian respondents who were exogenously made to feel socially excluded based
on their Asian background were more likely to view the Republican Party as exclusionary (as their
feelings of exclusion were linked to their views of the party), and consequently less likely to ex-
hibit positive feelings for the Republican Party. Our study builds upon a voluminous literature in
political and social psychology on priming (Bargh 1982). In a plethora of laboratory and survey
contexts, a range of subtle, external interventions have been shown to activate hypothesized be-
havioral outcomes and attitude changes. We draw on previous findings that show how primes can
unconsciously activate specific personality traits, change task performance (physical and cognitive),
a↵ect stereotypes and attitudes towards out-groups, and change political attitudes (e.g., Berger,
Meredith, and Wheeler 2008; DeMarree, Wheeler, and Petty 2005; Lodge and Taber 2005). The
mechanisms linking primes to specific outcomes depend on the outcome of interest, but we focus
on testing the specific prime of a racial microaggression on social exclusion, which has been shown
to occur in other laboratory contexts.
Procedures and Design
We executed a laboratory experiment where the measured political outcomes were both survey-
based and behavioral. The study was conducted in the behavioral lab of a major research university;
subjects were paid $10 for participating. This study had to be conducted in-person in the laboratory
(as opposed to with a more general sample over the Internet) because the experimental manipulation
requires interpersonal contact. We opened the study to Asians and whites based on demographic
background data of the respondents collected well before the experiment took place. Subjects were
told that they were participating in a study about current events. The study was conducted between
14

November 26-December 7, 2012. 114 subjects participated; 61 were of self-reported Asian descent
and 53 described themselves as white. Upon entering the facility, a white female research assistant
welcomed the subject and was instructed to privately assess and document whether the subject was
of Asian descent.15 The subject was then guided to a computer by the assistant. The experimental
protocol proceeded as follows: (1) the assistant was provided with a list of which subjects were
randomly assigned to be in the treatment condition and receive a racial microaggression; and (2)
the assistant was instructed to say the following to each subject assigned to the treatment condition
before he or she began the survey, “I’m sorry; I forgot that this study is only for U.S. citizens. Are
you a U.S. citizen? I cannot tell.” If the subject was a U.S. citizen, the assistant was instructed to
say “OK, go ahead” and have the respondent start the survey; if the subject was not a U.S. citizen,
the assistant was instructed to pause and then say, “It’s OK, go ahead.” This procedure was also
applied to white respondents so that we could assess any baseline e↵ect of the treatment unrelated
to racial microaggression (e.g., simple rudeness).
The racial microaggression employed in the study was a microinvalidation—verbal comments
or behaviors that exclude, negate, or nullify the psychological thoughts, feelings, or experiential
reality of a person of color” (Sue et al. 2007, 278). The invalidating question asked by the assistant
to treated subjects is similar to commonplace questions such as: “Where are you really from?”;
“Where were you born?”; “You speak good English.” In other words, Asian participants assigned to
the treatment condition were made to feel like foreigners in their own country. White participants
should not have had a similar reaction, making them an important benchmark for comparison.16
This intervention builds on and is a modification of social exclusion or racial microaggression
interventions in other laboratory contexts (e.g., Cheryan and Monin 2005). It also accurately
captures a common interaction in daily life among some Asians when they interact with other
individuals who do not assume Asians are either citizens or “American” (Sue et al. 2007).17
15The research assistant’s assessment of respondents’ ethnicity matched respondents’ self-reports in all cases.
16We also expect non-citizens to feel excluded by the treatment. Even though they are not citizens, they may
feel singled out given the presumption of their citizenship status based on their physical appearance. We found no
significant di↵erence in treatment e↵ects between citizens and non-citizens; the di↵erences in the treatment e↵ects
between citizens and non-citizens were substantively small and did not achieve standard levels of statistical significance
(p = 0.16 to p = 0.44).
17Subjects were debriefed afterwards that the interaction with the research assistant was part of the study design.
15
Outcome Measures
Subjects then completed an online survey that measured political attitudes. All measures
were coded such that higher values reflect negative views of the Republican Party relative to the
Democratic Party. Descriptive statistics of our outcome measures can be found in Table C.1 of
Online Appendix C.18
Closed-minded. Study participants were asked: “How well does the term ‘closed-minded’ de-
scribe [Republicans/Democrats]?” (response options: “very well,” “somewhat well,” “slightly well,”
and “not well at all”). To develop a measure of how much more closed-minded the respondents
felt Republicans were relative to Democrats, the response to the Democratic item was subtracted
from the response to the Republican item. This resulting di↵erence measure is a seven-point scale,
recoded to range from 0 (meaning that Democrats are viewed to be maximally—with respect to
the measure’s range—more closed-minded than Republicans) to 1 (meaning that Republicans are
viewed to be maximally more closed-minded than Democrats).
Ignorant. Respondents were asked: “How well does the term ‘ignorant’ describe [Republi-
cans/Democrats]?” (response options: “very well,” “somewhat well,” “slightly well,” and “not well
at all”). As with the closed-mindedness question, we create a measure of how much more ignorant
a given participant felt Republicans were relative to Democrats by di↵erencing out a participant’s
response to the question on Democrats from the response to the question on Republicans. This
measure is again a seven-point scale, recoded to range from 0 (meaning that Democrats are viewed
to be maximally more ignorant than Republicans) to 1 (meaning that Republicans are viewed to
be maximally more ignorant than Democrats).
Represent Interests. Study participants were asked: “How well do you think the [Democratic/Re-
publican] Party is likely to represent the interests of people like yourself?” (response options: “very
well,” “somewhat well,” “slightly well,” and “not well at all”). Again, we subtract a participant’s
response to the question when asked about the Republican Party from the response to the same
The study was approved by a university institutional review board (IRB). Given that the treatment is language we
expect subjects to encounter in the real world, we viewed the study as posing little to no risk and the IRB agreed.
18In Table C.1, we also report demographic characteristics of respondents. As shown in the appendix, while most
respondents were college students, the sample was diverse with respect to gender and religiosity. 88% of respondents
were U.S. citizens.
16

question asked about the Democratic Party. This di↵erence measure is a seven-point scale, ranging
from 0 (meaning that the Republican Party is viewed to be maximally more representative of people
like them than the Democratic Party) to 1 (meaning that the Democratic Party is viewed to be
maximally more representative of people like them than the Republican Party).
Net Likes. The net likes measure is a combination of the following task questions: (1) “Is
there anything in particular you like about the [Democratic/Republican] Party?”; and (2)“Is there
anything in particular you dislike about the [Democratic/Republican] Party?” Each of the four
questions was followed by the following directive: “Please list as many responses as you like, listing
each response in a separate field. If there is nothing that you like about the [Democratic/Republican]
Party, just skip ahead.” Respondents were given up to ten fields to enter likes/dislikes. The net
likes measure is a di↵erence-in-di↵erence measure. For each party, we compute a net likes measure
by assessing how many more positive traits are listed as opposed to negative traits. We then take
the di↵erence between the net likes listed by a participant for the Democratic Party and that of
the Republican Party. This measure is rescaled to be between 0 and 1, such that a higher number
means that, compared to when thinking about the Democratic Party, the respondent listed fewer
things they “liked” about the Republicans relative to “disliked” about the Republicans. This task
required a great deal of e↵ort on the part of respondents, and therefore can be interpreted as a
behavioral manifestation of liking or aversion toward a political party.
Feeling Thermometer. We asked respondents to report their warmth to the parties on feeling
thermometers: “On a scale of 0 to 100, where 0 represents a completely negative opinion and
100 represents a completely positive opinion, how would you rate the [Republican/Democratic]
Party?” We assess how much more negative a participant views the Republican Party relative
to the Democratic Party by di↵erencing out a participant’s response to the feeling thermometer
question about Republicans from the response to the identical question about Democrats. This
new measure is rescaled to lie between 0 and 1, ranging from 0 (meaning that the respondent
has a maximally positive opinion of Republicans relative to Democrats) to 1 (meaning that the
respondent has a maximally positive opinion of Democrats relative to Republicans).
Party Identification. Participants’ party identification was measured through a sequence of
questions, where participants were first asked: “Generally speaking, do you think of yourself as a
Republican, a Democrat, an Independent, or what?” (response options: “Republican,” “Democrat,”
17

“Independent,” and “Other”). Those who answered “Republican” or “Democrat” were then asked
the follow-up question: “Would you call yourself a strong [Democrat/Republican] or a not very
strong [Democrat/Republican]?” (response options: “strong” and “not very strong”). Participants
who answered the first question with either “Independent” or “Other” were subsequently asked:
“Do you think of yourself as CLOSER to the Republican Party or to the Democratic Party?”
(response options: “Republican Party” and “Democratic Party”). Responses were combined to
create a six-point scale, which is recoded to lie between 0 and 1, where higher values reflect stronger
identification with the Democratic Party.
Pro-Democratic Party (PDP) Index. We averaged the six outcome variables into a single addi-
tive index reflecting a latent variable of pro-Democratic attitudes. The advantage of this averaged
measure is that it nets out measurement error associated with any one of the index components.
Manipulation Check. As a manipulation check, subjects also completed a behavioral task where
they listed as many U.S. politicians they could think of. The logic of the measure is that if
the racial microaggression o↵ends Asians, they may desire to compensate by showing how much
they know about American politics in an attempt to feel less excluded and prove themselves as
more “American.” Consequently, they should also spend more time answering this question. This
procedure follows from what was found in similar microaggression interventions in other laboratory
contexts (e.g., Cheryan and Monin 2005). The goal of the manipulation check is to ensure that the
treatment is properly manipulating the theoretical construct of interest (i.e., feelings of exclusion).19
Results
We present regression results predicting the outcome variables with a dummy for the microag-
gression treatment, a dummy for whether a respondent is Asian, and the interaction between these
two dummy variables (see Table C.2 in Online Appendix C).20 We use the white respondents as
a baseline group to observe the e↵ect of the microaggression per se. The quantity of interest,
which is captured in the interaction term and plotted in Figure 1, is the di↵erence between Asians
and whites in their response to the microaggression treatment on the various outcome variables.
19We did not ask an explicit post-treatment question about feelings of victimization or racial identity because this
would prime respondents and inflate treatment e↵ects.
20Due to space constraints, full regression results are reported in the Online Appendix. However, because this is
a randomized experiment, the results can be easily summarized with figures and with verbal description.
18

The treatment e↵ect among whites allows us to determine the causal e↵ect of the experimental
manipulation, netting out any direct e↵ect of the treatment unrelated to social exclusion based on
ethnicity (e.g., perceived rudeness or awkwardness of the research assistant’s statement). More
formally, the estimand of interest is (Yta� Yca)� (Ytw � Ycw) where Y represents the average of the
outcome variable, and the subscript denotes whether respondents were assigned to the treatment
(t) or control (c) groups, and whether the respondent was Asian (a) or white (w). We also report
the experimental results separately for Asian and white subjects (see Table C.3).
[Figure 1 about here]
Before delving into the main results, we note that the manipulation check was successful. Com-
pared to white respondents, Asians responded to the racial microaggression treatment by listing
5.78 more U.S. politicians vis-a-vis the control group. This di↵erence is statistically significant
(p = 0.02). Further, the e↵ect of the treatment on the time Asians took to complete the survey
was 88 seconds more than the treatment e↵ect among whites (p = 0.02).21
The treatment a↵ected Asian respondents’ views of the Republican Party compared to whites,
generally increasing their negative views of the party (see the third row of Table C.2). The simple
intervention of making an Asian subject feel excluded with respect to “Americanness” and being
suspected of not being a U.S. citizen increased negative dispositions towards the Republican Party
and increased positive views of the Democratic Party compared to the baseline treatment e↵ects
among white respondents. The microaggression treatment reduced a�nity toward the Republican
Party as measured by the Pro-Democratic Party (PDP) Index (13 percentage points, p = 0.02).
The results indicate a clear association between a sense of exclusion and positive feelings toward
the Democratic Party at the expense of the Republican Party.22
When examining the components of the index separately, we again see consistent, positive ef-
fects on pro-Democratic attitudes as a result of the treatment, although some are larger than others.
Compared to their view of Democrats, Asians in the treatment group viewed Republicans to be
21To reduce skewness in the completion time variable, we took its natural log. The p-value from the test examining
the di↵erence-in-di↵erence in the non-normalized measure was p = 0.02.
22The di↵erence-in-di↵erence, as hypothesized, is driven by the e↵ect of the treatment on Asian respondents. We
find that the treatment generally increased negative a↵ect toward Republicans among Asians and consistently had
no e↵ect among whites (see Table C.3 in Online Appendix C).
19

more closed-minded (13 percentage points) and more ignorant (14 percentage points). This suggests
that priming social exclusion activates latent associations respondents had between the Republican
Party and negative traits associated with racial discrimination. Accordingly, Asians in the treat-
ment condition are 18 percentage points less likely to believe that the Republican Party represents
their interests. Also in response to the treatment, Asians listed fewer things they “liked” about
Republicans (10 percentage points) and rated Republicans 11 percentage points less favorably than
Democrats on the feeling thermometer. These negative associations led Asian respondents to have
more negative feelings toward the Republican Party. All of these e↵ects produced lower Republican
identification among Asian respondents in the treatment condition. Asian respondents in the treat-
ment group are 10 percentage points more Democratic on the six-point partisan identification scale,
more than half a response category. The treatment e↵ects on the feeling thermometer and party
identification outcomes do not quite achieve standard levels of statistical significance given that
these are fairly rigid and enduring political dispositions. Nonetheless, the other, stronger results
demonstrate that the perceptions of the parties (i.e., the ingredients of party identification) were
a↵ected by making respondents feel socially excluded.23 Overall, this study provides evidence of a
causal link between social exclusion and orientation towards the Democratic party.24
Study 2: Impact of Intergroup Commonality
We next assess the causal e↵ect of beliefs about shared intergroup interests on Asian American
party identification. We examine the e↵ect of framing an issue such that it emphasizes that Asians
and Hispanics have common interests versus a framing that divides Asians from Hispanics. We
conducted a second study between May 23–30, 2013 using a nationally diverse sample of Asians.
The sample of 689 Asian respondents was provided by Survey Sampling International (SSI) and
consisted of 82% citizens and 50% U.S.-born individuals.25 This dataset is unique given the di�culty
23The variables closed-minded, ignorant, represents interests, and net likes are all strongly and significantly (p <
0.001) positively correlated with the feeling thermometer and party identification measures.
24There was no treatment e↵ect of social exclusion on partisan non-identification when estimating a linear proba-
bility model (p = 0.27) or logit model (p = 0.25). Results are available in Online Appendix C (see Table C.4).
25Online Appendix D reports demographic characteristics of respondents. The sample is diverse with respect to
education, age, gender, and religiosity (see Table D.1).
20
of recruiting the Asian American population for survey research.
Procedures and Outcome Measures
We embedded an experiment in the survey to measure whether exogenously manipulating par-
tisan endorsement of policies that have obvious intergroup commonality-inducing or intergroup
conflict-inducing consequences for Asians vis-a-vis other U.S. minorities a↵ects Asian support for
the Democratic versus Republican Party. We chose the policy area of immigration, as it has been
a salient political issue that citizens and minority immigrants (including Asians) care about. Fur-
ther, it is an issue where intergroup commonality as well as intergroup conflict (between Asians
and other minority immigrant groups) is plausible, depending on what aspects of reform or specific
immigration policies are emphasized. Each of the two main political parties is also associated with
di↵erent aspects of immigration reform.
Accordingly, respondents were randomly assigned to one of three groups: a control group where
an article about a popular TV show was read prior to the questions of interest; and one of two
treatment groups, each of which consisted of a short fictional USA Today newspaper article.26 The
news articles on immigration were designed to explicitly cue commonality or conflict with Hispanics.
In Treatment Group 1, the article describes Arizona SB 1070, the law that was invalidated by the
U.S. Supreme Court requiring police o�cers to ascertain people’s immigration status. The article
indicates that such laws target both Asians and Hispanics (due to their foreign appearance), and
that Democrats oppose such policies while Republicans support them. The article in Treatment
Group 2 cues intergroup conflict and Republican endorsement of Asian interests by summarizing
how immigration reform proposals could hurt Asians and benefit Hispanics, as Asians constitute
much of the high-skilled immigrant population and Hispanics much of the low-skilled immigrant
population. The article emphasizes that Republicans tend to support high-skilled immigration while
Democrats support low-skilled immigration. In the popular media reporting of the possibility of
immigration reform, the Republican and Democratic parties are associated with these positions
(Beadle 2012; Schultheis 2012).27
26The full text (screenshots) of the treatments are available in Online Appendix D. Respondents were debriefed
after the survey that the article they read was not actually from USA Today, but was similar to articles that had
appeared in the publication.
27Senator Chuck Schumer of New York, when speaking to high technology industry advocates pushing for immi-
21

We purposely included the party positions on the issues in each condition for two reasons. The
first reason was theoretical. Our goal was to observe how shifting the salience of the immigration
issue from the economic to the social dimension (and therefore changing the coalition cleavage from
whites/Asians/Republicans against Hispanics/Democrats to whites/Republicans against Hispan-
ics/Asians/Democrats) a↵ected respondents’ political attitudes and partisan dispositions. Because
the nature of political conflict involved the parties aligning themselves on one side of the cleavage
for one dimension of the issue, and parties aligning themselves on the other side of the cleavage
for the other dimension, we provided this information to respondents. The second reason was to
enhance ecological validity. We based our experimental stimuli on real-world articles on immigra-
tion, and nearly all of them explained party positions on the issue in addition to racial impact
(e.g., Gomez 2013). In future work, it would be interesting to vary whether respondents receive
party cues to assess the impact of such political information.28 In sum, we employ a compound
treatment varying both the coalitional structure and the issue dimension (social versus economic)
because these features are necessarily linked in the real world.
We then measure the same post-treatment attitudes and behaviors asked in Study 1, and code
di↵erences in party evaluations in the same way, such that higher values represent more negative
views of the Republican Party versus the Democratic Party. Descriptive statistics for all outcome
measures of interest can be found in Online Appendix D (see Table D.1). As a manipulation check,
respondents were asked: “Thinking about government services, political power, and representation,
would you say Asian Americans have a lot in common, some, little in common, or nothing at all
in common with Hispanics or Latinos?” (response options: “a lot in common,” “some,” “little,”
“nothing at all in common”). The question wording was taken from the 2008 NAAS. Again, the
purpose of this manipulation check was to ensure that the treatment information in the article was
gration reform that lifts the cap on the number of H-1B visas the U.S. gives to high-skilled foreigners, noted the
following: “If there’s an attempt to just try and pass high-end, high-tech immigration, guess who will be furious?
The Hispanic community” (Sasso 2013). H-1B reform would disproportionately help Asian immigrants; in 2011, over
75% of H-1B visas were granted to individuals from Asian countries (USCIS 2012).
28Given the immense expense of gathering a su�ciently large Asian American survey sample, we did not have
the statistical power to layer this additional randomization into the design as it could have substantially decreased
statistical e�ciency.
22

shifting the theoretically relevant construct of interest (i.e., commonality/conflict with Hispanics).
Results
The results of Study 2 are presented in Table D.2 in Online Appendix D, where we predict the
outcome variables with dummy variables representing the intergroup commonality condition and
the control group. Our estimate of interest (represented by the coe�cient estimate on “Intergroup
Commonality Treatment” and plotted in Figure 2) is the di↵erence between the two treatment
groups, as this recovers the di↵erence in the political cleavage structures described above. As
such, our omitted category is the intergroup conflict treatment where Asians are in conflict with
Hispanics. The di↵erence between the treatment groups represents the shift from the commonality
coalitional structure to the conflicting one. The control group is useful as a baseline, but it does
not actually present a coalitional structure to respondents. Therefore, only comparing the conflict
and cooperation treatments to the control group does not allow us to infer the impact of framing
issues as cooperative versus conflictual.
[Figure 2 about here]
We first note that the manipulation check was successful, which supports the theorized rela-
tionship between issue framing and belief about common interests. Compared to the article which
highlighted conflict between Hispanics and Asians over the issue of immigration, the article stress-
ing common interests between the two ethnic groups increased respondents’ reported closeness with
Hispanics by 0.17 units on the four-point scale, a statistically significant e↵ect (p = 0.02). The
e↵ect size represents about one-fifth of a standard deviation in the dependent variable. The suc-
cessful manipulation check demonstrates that the treatment properly manipulated the theoretical
construct of interest (commonality with Hispanics) that is linked to changes in political attitudes.
Framing the immigration issue to make Asians feel as if they have common interests with His-
panics (as opposed to competing interests) increased negative dispositions towards the Republican
Party and increased positive views of the Democratic Party. The Hispanic commonality treatment
decreased a�nity toward the Republican Party as measured by the PDP Index (5 percentage points,
p = 0.003; see Figure 2). This experimental result indicates that increasing perceptions of shared
interests with another minority group that is a traditional Democratic constituency (Hispanics)
can increase support for the Democratic Party.
23

When we examine each component of the PDP Index separately, we observe consistent, pos-
itively signed e↵ects. The intergroup commonality treatment caused Asians to view Republicans
(relative to Democrats) as more closed-minded (6 percentage points) and more ignorant (3 percent-
age points). Consistent with these negative traits, Asians in the commonality treatment condition
are 7 percentage points less likely to believe that the Republican Party represents their interests.
These negative associations led Asian respondents to exhibit negative feelings toward the Repub-
lican Party. In response to the commonality treatment, Asians listed fewer things they liked (and
more things they disliked) about Republicans relative to the Democrats (1 percentage point) and
rated Republicans 5 percentage points less favorably than Democrats on the feeling thermometer.
All of these e↵ects yielded lower Republican identification among Asian respondents in the inter-
group commonality condition. Overall, Asian respondents in the commonality treatment group are
5 percentage points more Democratic on the six-point partisan identification scale.29 The results of
this study provide evidence that feelings of shared interests with other minorities can a↵ect partisan
dispositions among Asians.30
It is also informative to compare the treatment conditions to the control group since this in-
dicates whether commonality or competition is the more important factor. In Table D.2, the
di↵erence between the control group and the conflict condition is represented by �2 while the dif-
ference between the control group and the commonality condition is represented by �1 � �2. First,
Democratic support in the control condition is in between support in the conflict and commonality
conditions, which is exactly what we expect theoretically and suggests that the design is working
as intended. However, the largest di↵erence is between the commonality treatment and the control
group. The di↵erence in the PDP Index score between those who receive the commonality treat-
ment and those who receive the control group message was 3 percentage points (p = 0.05), whereas
the di↵erence in the PDP Index score between those who received the competition treatment and
the control message was -2 percentage points (p = 0.12). The di↵erence in these e↵ects yields the 5
29The treatment e↵ect for all outcome variables achieved standard levels of statistical significance except the
ignorant and net likes measures.
30We find that our intergroup commonality treatment is not correlated with partisan non-identification when
considering a linear probability model (p = 0.41) or a logit model (p = 0.41). Results are available in Online
Appendix D (see Table D.3).
24

percentage point e↵ect referenced above. The commonality treatment having a stronger e↵ect than
the competition treatment may be due to the fact that it is harder to convince Asian Americans
that their interests are not aligned with Hispanics on immigration. Another plausible reason why
the commonality treatment has a larger relative e↵ect is because the treatment is about common
interests regarding the social issue of racial discrimination (as opposed to the economic issue of la-
bor market skills), an issue that may be particularly sensitive to Asians, and an issue about which
Asians likely feel greater shared interests with other racial minorities. It is not clear whether this
asymmetry would arise in other policy domains and is worth further exploration in future research.
Discussion
As Wilkinson (2012) writes, “If you were a black-haired Buddhist from Taipei or a brown-
skinned Hindu from Bangalore, which party would instinctively seem more comfortable?” This glib
statement in our view does capture some aspects of Asian American party identification. The role
of social exclusion and intergroup commonality have been suggested in previous literature on the
political identities of U.S. minorities; however, they have not been systematically tested on specific
Asian-only samples in a way that allows for identifying causal e↵ects. Using laboratory and survey
experiments, we find evidence for both propositions.
There are several opportunities for research building. We focused on social exclusion in a labo-
ratory context to mimic a racial microaggression or exclusionary interactions that Asian Americans
might receive from the daily political environment. Other studies might simulate other types of
microaggressions, or more overt aggression in an explicit political context (such as campaign ad-
vertising), and do so in a broader survey context. Another possible extension is to highlight other
issues that would alter intergroup commonality and competition. Additionally, we have focused
less on the issue of “linked fate” concerns within the Asian ethnicity, though there is a rich body
of literature that hypothesizes that Asians who identify more with their own ethnicity (whether
it be a “pan-Asian” or specific Asian ethnicity) are more likely to be politically active. However,
such theoretical work remains ambiguous about the proposed partisan direction of such attitudes
(Lee 2008). Studies that manipulate the level of in-group solidarity or heighten “Asian” identity
salience (as opposed to negative social exclusion regarding American belonging as we have done)
might be instructive about the degree and impact of “linked fate” within the Asian community.
25

In Study 2 we illustrated the e↵ects of intergroup commonality via the issue of immigration,
but traditional economic issues related to redistribution could also be reframed as policies that
benefit other minorities at the expense of higher-income Asian Americans. The fluidity of support
of certain ethnic groups for the two major U.S. parties based on the structure of policy issues
represents potential support for theories of parties as coalitions of social groups (Bawn et al. 2012).
The ease of framing other policies in a way such that Asians would be more supportive of Democrats
(due to common interests with other minorities) would be an intriguing topic for future research.
Our experiment suggests that it might be di�cult for Republicans to frame issues such that they
divide ethnic minorities, but more evidence is needed to assess the generalizability of this result.
Also, because our two theoretical mechanisms of interest were predicted to apply to Asian
Americans broadly, we have collapsed all “Asians” into a single ethnic category. Nonetheless,
this is obviously an oversimplification given the immense diversity within the Asian American
population. However, considering the di�culty of obtaining such targeted samples, this research
o↵ers a starting point. Future studies can explore whether and why the e↵ects are stronger or
weaker within various subpopulations of interest. Finally, subsequent scholarship can investigate
the e↵ects of social exclusion and intergroup commonality on policy attitudes, which may mediate
the influence of the treatments on party identification.
26

References
Baldassare, Mark, Dean Bonner, Sonja Petek, and Jui Shrestha. 2013. “Just the
Facts: California Voter and Party Profiles.” Public Policy Institute of California.
http://www.ppic.org/main/publication show.asp?i=526 (accessed February 20, 2014).
Bargh, John A. 1982. “Attention and Automaticity in the Processing of Self-Relevant Information.”
Journal of Personality and Social Psychology 43 (3): 425–436.
Barrera, Juliana. 2013. “Asian Immigrants Surpass Hispanics as Biggest Immigrant Wave to U.S.”
The Hu�ngton Post, June 15. http://www.hu�ngtonpost.com/2013/06/15/asian-immigrants-
surpass-hispanics n 3446441.html (accessed February 20, 2014).
Bartels, Larry M. 2000. “Partisanship and Voting Behavior, 1952-1996.” American Journal of
Political Science 44 (1): 35–50.
Bawn, Kathleen, Martin Cohen, David Karol, Seth Masket, Hans Noel, and John Zaller. 2012. “A
Theory of Political Parties: Groups, Policy Demands and Nominations in American Politics.”
Perspectives on Politics 10 (3): 571–597.
Beadle, Amanda P. 2012. “How the GOP Proposal To Add Visas For Highly
Skilled Workers Would Reduce Legal Immigration.” Think Progress, September 18.
http://thinkprogress.org/justice/2012/09/18/861341/how-the-gop-proposal-to-add-visas-for-
highly-skilled-workers-would-reduce-legal-immigration/# (accessed February 20, 2014).
Berger, Jonah, Marc Meredith, and S. Christian Wheeler. 2008. “Contextual Priming: Where
People Vote A↵ects How They Vote.” Proceedings of the National Academy of Sciences 105 (26):
8846–8849.
Blumer, Herbert. 1958. “Race Prejudice as a Sense of Group Position.” Pacific Sociological Review
1 (1): 3–7.
Cain, Bruce E., D. Roderick Kiewiet, and Carole J. Uhlaner. 1991. “The Acquisition of Partisanship
by Latinos and Asian Americans.” American Journal of Political Science 35 (2): 390–422.
Campbell, Angus, Philip E. Converse, Warren E. Miller, and Donald E. Stokes. 1960. The American
Voter. New York: John Wiley & Sons, Inc.
Carmines, Edward G., and James A. Stimson. 1989. Issue Evolution. Princeton: Princeton Uni-
27

versity Press.
Chang, Michael. 2004. Racial Politics in an Era of Transnational Citizenship: The 1996 ‘Asian
Donorgate’ Controversy in Perspective. Oxford, UK: Lexington Books.
Cheryan, Sapna, and Benoit Monin. 2005. “Where Are You Really From?: Asian Americans and
Identity Denial.” Interpersonal Relations and Group Processes 89 (5): 717–730.
Chou, Rosalind S., and Joe R. Feagin. 2008. The Myth of the Model Minority: Asian Americans
Facing Racism. Boulder: Paradigm Publishers.
De la Garza, Rodolfo O. 2004. “Latino Politics.” Annual Review of Political Science 7 (1): 91–123.
DeMarree, Kenneth G., S. Christian Wheeler, and Richard E. Petty. 2005. “Priming a New Iden-
tity: Self-Monitoring Moderates the E↵ects of Nonself Primes on Self-Judgments and Behavior.”
Journal of Personality and Social Psychology 89 (5): 657–671.
Devos, Thierry, and Debbie S. Ma. 2008. “Is Kate Winslet More American than Lucy Liu? The
Impact of Construal Processes on the Implicit Ascription of a National identity.” British Journal
of Social Psychology 47 (2): 191–215.
Devos, Thierry, and Leakhena Heng. 2009. “Whites Are Granted the American Identity More
Swiftly than Asians: Disentangling the Role of Automatic and Controlled Processes.” Social
Psychology 40 (4): 192–201.
Devos, Thierry, and Mahzarin R. Banaji. 2005. “American = White?” Journal of Personality and
Social Psychology 88 (3): 447–466.
File, Thom. 2013. “The Diversifying Electorate – Voting Rates by Race and Hispanic Origin in
2012 (and Other Recent Elections).” Current Population Reports, P60-238. U.S. Census Bureau.
Fiorina, Morris. 1981. Retrospective Voting in American National Elections. Hanover: Yale Uni-
versity Press.
Fraga, Luis R., John A. Garcia, Rodney E. Hero, Michael Jones-Correa, Valerie Martinez-Ebers,
and Gary M. Segura. 2006. “Su Casa es Nuestra Casa: Latino Politics Research and the Devel-
opment of American Political Science.” American Political Science Review 100 (4): 515–521.
Gomez, Alan. 2013. “House Democrats File Immigration Bill, Urge GOP to Act.” USA Today,
October 2. http://www.usatoday.com/story/news/politics/2013/10/02/immigration-democrats-
28

file-bill/2907677/ (accessed February 20, 2014).
Green, Donald P., Bradley Palmquist, and Eric Shickler. 2002. Partisan Hearts and Minds. New
Haven: Yale University Press.
Hajnal, Zoltan L., and Taeku Lee. 2011. Why Americans Don’t Join the Party: Race, Immigration,
and the Failure (of Political Parties) to Engage the Electorate. Princeton: Princeton University
Press.
Jennings, M. Kent, and Richard G. Niemi. 1968. “The Transmission of Political Values from Parent
to Child.” American Political Science Review 62 (1): 169–184.
Junn, Jane, Taeku Lee, S. Karthick Ramakrishnan, and Janelle Wong. 2011. “Asian American
Public Opinion.” In The Oxford Handbook of American Public Opinion and the Media, eds.
Robert Shapiro, and Lawrence Jacobs. New York: Oxford University Press, 520–534.
Kim, Clair Jean. 2000. Bitter Fruit: The Politics of Black Korean Conflict in New York City. New
Haven: Yale University Press.
Kim, Thomas P. 2007. The Racial Logic of Politics: Asian Americans and Party Competition.
Philadelphia: Temple University Press.
LaFrombroise, Teresa, Hardin L.K. Coleman, and Jennifer Gerton. 1993. “Psychological Impact of
Biculturalism: Evidence and Theory.” Psychological Bulletin 114 (3): 395–412.
Lee, Taeku. 2002. Mobilizing Public Opinion. Chicago: University of Chicago Press.
Lee, Taeku. 2008. “Race, Immigration, and the Identity-to-Politics Link.” Annual Review of Polit-
ical Science 11: 457–478.
Lenz, Gabriel S. 2012. Follow the Leader? How Voters Respond to Politician’s Policies and Per-
formance. Chicago: University of Chicago Press.
Liang, Christopher T. H., Lisa C. Li, and Bryan S. K. Kim. 2004. “The Asian American Racism-
Related Stress Inventory: Development, Factor Analysis, Reliability, and Validity.” Journal of
Counseling Psychology 51 (1): 103–114.
Lien, Pei-Te. 2000. Who Votes in Multiracial America? An Analysis of Voting and Registration by
Race and Ethnicity, 1990-96. New York: New York University Press.
Lien, Pei-Te. 2001. The Making of Asian American Through Political Participation. Philadelphia:
29

Temple University Press.
Lien, Pei-Te, Christian Collet, Janelle Wong, and Karthick Ramakrishnan. 2001. “Asian Pacific
American Public Opinion and Political Participation.” P.S. Political Science and Politics 34 (3):
625–630.
Lodge, Milton, and Charles S. Taber. 2005. “The Automaticity of A↵ect for Political Leaders,
Groups, and Issues: An Experimental Test of the Hot Cognition Hypothesis.” Political Psychology
26 (3): 8846–8849.
Nicholson, Stephen P., and Gary M. Segura. 2005. “Issue Agendas and the Politics of Latino Par-
tisan Identification.” In Diversity in Democracy: Minority Representation in the United States,
eds. Gary M. Segura, and Shaun Bowler. Charlottesville: University of Virginia Press, 51–71.
Pew Research Center. 2012. “Asian Americans: A Mosaic of Faith.” Pew Research Center’s Religion
and Public Life Project, July 19. http://www.pewforum.org/files/2012/07/Asian-Americans-
religion-full-report.pdf (accessed March 28, 2015).
Ramakrishnan, Karthick, Jane Junn, Taeku Lee, and Janelle Wong. 2008. National Asian Amer-
ican Survey [Computer file]. Vol. ICPSR31481-v2 Ann Arbor: Inter-University Consortium for
Political and Social Research.
Sasso, Brendan. 2013. “Sen. Schumer: Congress Won’t Pass Stand-Alone High-Skill Immigra-
tion Bill.” The Hill, March 5. http://thehill.com/blogs/hillicon-valley/technology/286231-sen-
schumer-no-standalone-high-skill-immigration-bill (accessed February 20, 2014).
Schultheis, Emily. 2012. “New Ad Stresses GOP Consensus on High-Skilled Immigration.”
Politico, January 16. http://www.politico.com/blogs/burns-haberman/2012/01/new-ad-stresses-
gop-consensus-on-highskilled-immigration-111014.html (accessed February 20, 2014).
Sidanius, James, Seymour Feshbach, Shana Levin, and Felicia Pratto. 1997. “The Interface Between
Ethnic and National Attachment: Ethnic Pluralism or Ethnic Dominance?” Public Opinion
Quarterly 61 (1): 103–133.
Smith, Eliot R., and Michael Zarate. 1992. “Exemplar-Based Model of Social Judgment.” Psycho-
logical Review 99 (1): 3–21.
Stroessner, Steven J. 1996. “Social Categorization by Race or Sex: E↵ects of Perceived Non-
30
Normalcy on Response Times.” Social Cognition 14 (3): 247–276.
Sue, Derald Wing, Christina M. Capodilupo, Gina C. Torino, Jennifer M. Bucceri, Aisha M. B.
Holder, Kevin L. Nadal, and Marta Esquilin. 2007. “Racial Microaggressions in Everyday Life.”
American Psychologist 62 (4): 271–286.
Uhlaner, Carole J., and F. Chris Garcia. 2005. “Learning Which Party Fits: Experience, Eth-
nic Identity, and the Demographic Foundations of Latino Party Identification.” In Diversity in
Democracy: Minority Representation in the United States, eds. Gary M. Segura, and Shaun
Bowler. Charlottesville: University of Virginia Press, 72–101.
U.S. Census Bureau. 2013. “Asians Fastest-Growing Race or Ethnic Group in 2012.” Census
Bureau Reports, June 13. http://www.census.gov/newsroom/releases/archives/population/cb13-
112.html (accessed February 20, 2014).
USCIS. 2012. Characteristics of Specialty Occupation Workers (H-1B): Fiscal Year 2011 Annual
Report to Congress. Washington, DC: Department of Homeland Security.
Wilkinson, Francis. 2012. “Asian Voters Send a Message to Republicans.” Bloomberg, November 8.
http://www.bloomberg.com/news/2012-11-08/asian-voters-send-a-message-to-republicans.html
(accessed February 20, 2014).
Wong, Janelle. 2000. “The E↵ects of Age and Political Exposure on the Development of Party
Identification among Asian American and Latino Immigrants in the United States.” Political
Behavior 22 (4): 341–371.
Wong, Janelle. 2008. Democracy’s Promise: Immigrants and American Civic Institutions. Ann
Arbor, MI: University of Michigan Press.
Wong, Janelle, S. Karthick Ramakrishnan, Taeku Lee, and Jane Junn. 2011. Asian American
Political Participation: Emerging Constituents and Their Political Identities. New York: Russell
Sage Foundation.
Yogeeswaran, Kumar, and Nilanjana Dasgupta. 2010. “Will the “Real” American Please Stand
Up? The E↵ect of Implicit National Prototypes on Discriminatory Behavior and Judgments.”
Personality and Social Psychology Bulletin 36 (10): 1332–1345.
Zaller, John. 2012. “What Nature and Origins Leaves Out.” Critical Review 24 (4): 569–642.
31

Table 1: OLS Regressions Predicting Asian American Partisan Identification
(1) (2) (3) (4) (5) (6)
Social Exclusion 0.04** 0.04** 0.04** 0.03*** 0.03*** 0.03***(0.01) (0.01) (0.01) (0.01) (0.01) (0.01)
Intergroup Commonality with Blacks 0.07*** — — 0.04*** — —(0.02) (0.01)
Intergroup Commonality with Hispanics — 0.05** — — 0.04** —(0.02) (0.01)
Intergroup Commonality with Minority Groups — — 0.15*** — — 0.10***(0.05) (0.03)
Female 0.04*** 0.04*** 0.04*** 0.03*** 0.02*** 0.02***(0.01) (0.01) (0.01) (0.01) (0.01) (0.01)
Income -0.02 -0.02 -0.02 0.00 0.00 0.00(0.03) (0.03) (0.03) (0.02) (0.02) (0.02)
Education 0.11*** 0.12*** 0.12*** 0.07*** 0.07*** 0.07***(0.02) (0.02) (0.02) (0.01) (0.01) (0.01)
Age -0.11 -0.11 -0.11 -0.12 -0.12 -0.11(0.13) (0.13) (0.13) (0.08) (0.08) (0.08)
Age2 0.05 0.04 0.04 0.10 0.09 0.09(0.15) (0.15) (0.15) (0.09) (0.09) (0.09)
Percentage of Life Spent in US 0.13*** 0.13*** 0.14*** 0.10*** 0.10*** 0.11***(0.03) (0.03) (0.03) (0.02) (0.02) (0.02)
Religious -0.06*** -0.06*** -0.06*** -0.02** -0.02** -0.02**(0.01) (0.01) (0.01) (0.01) (0.01) (0.01)
US Citizen -0.06*** -0.06*** -0.06*** -0.02* -0.02* -0.02*(0.02) (0.02) (0.02) (0.01) (0.01) (0.01)
Ideology 0.36*** 0.36*** 0.36*** 0.28*** 0.28*** 0.28***(0.02) (0.02) (0.02) (0.01) (0.01) (0.01)
Constant 0.33*** 0.32*** 0.27*** 0.34*** 0.34*** 0.31***(0.04) (0.04) (0.05) (0.03) (0.03) (0.03)
Observations 2,993 2,993 2,993 5,159 5,159 5,159Adjusted R2 0.13 0.13 0.13 0.10 0.09 0.09
Notes: Dependent variable is partisan identification (0 (Strong Republican) ! 1 (Strong Democrat)). Regression
standard errors are in parentheses. *p < 0.05, **p < 0.01, ***p < 0.001 (one-tailed). Columns (1)-(3) report
models excluding respondents who did not report a party identification. Columns (4)-(6) report models recoding
missing values on party identification as the midpoint.
32

Party ID
Feeling Thermometer
Net Likes
Represents Interests
Ignorant
Closed-Minded
Pro-Democratic Party Index
0.0 0.1 0.2 0.3 Treatment Effect
Dep
ende
nt V
aria
ble
Notes: The figure displays e↵ect sizes with 95% confidence intervals.
Figure 1: Study 1 Results
33

Party ID
Feeling Thermometer
Net Likes
Represents Interests
Ignorant
Closed-Minded
Pro-Democratic Party Index
0.000 0.025 0.050 0.075 0.100 Treatment Effect
Dep
ende
nt V
aria
ble
Notes: The figure displays e↵ect sizes with 95% confidence intervals.
Figure 2: Study 2 Results
34

Online Appendix
Why Do Asian Americans Identify as
Democrats? Testing Theories of Social
Exclusion and Intergroup Commonality

A 2008 and 2012 Cooperative Congressional Election Study
Vote Choice (2012)
Ideology (2012)
Party ID (2012)
Vote Choice (2008)
Ideology (2008)
Party ID (2008)
0.5 0.6 0.7 0.8 0.9 Liberalism
Race
White
Black
Hispanic
Asian
Source: 2008 and 2012 Cooperative Congressional Election Study (CCES)
Figure A.1: Party Identification, Ideology, and Vote Choice by Race, 2008 and 2012 (with 95%confidence intervals)
i

B Observational Study
Table B.1: Summary Statistics of Observational Study
Variable Observations Mean Standard Min MaxDeviation
Party Identification 2993 4.01 1.74 1 6Identification with the Democratic Party 5159 0.39 0.49 0 1Social Exclusion 5159 0.39 0.49 0 1Intergroup Commonality with Blacks 5159 0.33 0.32 0 1Intergroup Commonality with Hispanics 5159 0.35 0.33 0 1Intergroup Commonality with Minority Groups 5159 0.34 0.24 0 1Female 5159 0.46 0.50 0 1Income: Up to $20,000 3235 0.13 0.34 0 1Income: $20,000 to $35,000 3235 0.12 0.32 0 1Income: $35,000 to $50,000 3235 0.12 0.32 0 1Income: $50,000 to $75,000 3235 0.17 0.38 0 1Income: $75,000 to $100,000 3235 0.14 0.34 0 1Income: $100,000 to $125,000 3235 0.12 0.32 0 1Income: $125,000 to $150,000 3235 0.06 0.24 0 1Income: $150,000 and over 3235 0.14 0.35 0 1Did Not Graduate from High School 4917 0.09 0.29 0 1High School Graduate 4917 0.17 0.37 0 1Some College, but No Degree (Yet) 4917 0.11 0.32 0 14-year College Degree 4917 0.35 0.48 0 1Postgraduate Degree 4917 0.28 0.45 0 1Age 4223 56.61 15.61 22 100Percentage of Life Spent in the U.S. 5159 0.42 0.31 0 1Religious 5159 0.74 0.44 0 1US Citizen 5159 0.76 0.43 0 1Ideology 3821 3.28 1.43 1 6
ii

Table B.2: Multinomial Logit Explaining Asian American Partisan Identification
(1) (2) (3) (4) (5)
0 (Missing)
Social Exclusion -0.08 — — — 0.04(0.08) (0.09)
Intergroup Commonality with Blacks — 0.08 — — —(0.14)
Intergroup Commonality with Hispanics — — -0.10 — —(0.14)
Intergroup Commonality with Minority Groups — — — 1.14*** 0.99**(0.31) (0.34)
Constant 0.72*** 0.59*** 0.65*** 0.06 0.48(0.05) (0.07) (0.07) (0.15) (0.35)
2 (Democrat)
Social Exclusion 0.40*** — — — 0.31***(0.08) (0.09)
Intergroup Commonality with Blacks — 0.48*** — — —(0.13)
Intergroup Commonality with Hispanics — — 0.36** — —(0.14)
Intergroup Commonality with Minority Groups — — — 1.33*** 1.11***(0.31) (0.32)
Constant 0.51*** 0.53*** 0.56*** 0.12 -1.12***(0.05) (0.07) (0.07) (0.14) (0.35)
Observations 5159 5159 5159 5159 5159Pseudo R2 0.01 0.02 0.02 0.02 0.13Controls No No No No Yes
Notes: Dependent variable is partisan identification (Baseline category: 1 = Republican). Regression
standard errors are in parentheses. *p < 0.05, **p < 0.01, ***p < 0.001 (one-tailed). Controls for
gender, income, education, age, percentage of life spent in the U.S., religiousness, citizenship status and
ideology are included in specification (5).
iii

Table B.3: OLS Regression Explaining Asian American Partisan Identification (Multiple Imputa-tion Using Chained Equations Approach)
(1)
Social Exclusion 0.03**(0.01)
Intergroup Commonality with 0.16***Minority Groups (0.04)
Female 0.04***(0.01)
Income -0.02(0.03)
Education 0.12***(0.02)
Age -0.07(0.13)
Age2 -0.01(0.15)
Percentage of Life Spent in the U.S. 0.14***(0.03)
Religious -0.05***(0.01)
US Citizen -0.05***(0.02)
Ideology 0.36***(0.02)
Constant 0.2***(0.05)
Observations 5159
Notes: Dependent variable is partisan identification (0
(Strong Republican) ! 1 (Strong Democrat)). Missing
values for party identification are imputed. Regression
standard errors are in parentheses *p < 0.05, **p < 0.01,
***p < 0.001 (one-tailed).
iv

Table B.4: OLS Regression with In-Group Commonality Control
(1) (2)
Social Exclusion 0.04** 0.03***(0.01) (0.01)
Intergroup Commonality with 0.15*** 0.10***Minority Groups (0.05) (0.03)
In-Group Commonality 0.00 0.00(0.01) (0.00)
Female 0.04*** 0.03***(0.01) (0.01)
Income -0.02 0.00(0.03) (0.02)
Education 0.12*** 0.07***(0.02) (0.01)
Age -0.10 -0.11(0.13) (0.08)
Age2 0.04 0.09(0.15) (0.09)
Percentage of Life Spent in US 0.14*** 0.11***(0.03) (0.02)
Religious -0.06*** -0.02**(0.01) (0.01)
US Citizen -0.06*** -0.02*(0.02) (0.01)
Ideology 0.36*** 0.28***(0.02) (0.01)
Constant 0.27*** 0.30***(0.05) (0.03)
Observations 2993 5159Adjusted R2 0.13 0.09
Notes: Dependent variable is partisan identification (0
(Strong Republican) ! 1 (Strong Democrat)). Missing
values for party identification are recoded as the midpoint in
column (2). Regression standard errors are in parentheses
*p < 0.05, **p < 0.01, ***p < 0.001 (one-tailed).
v

Table B.5: Logistic Regression Explaining Asian American Identification with the Democratic Party
(1) (2) (3)
Social Exclusion 0.29*** 0.29*** 0.29***(0.06) (0.06) (0.06)
Intergroup Commonality with Blacks 0.24* — —(0.11)
Intergroup Commonality with Hispanics — 0.27** —(0.11)
Intergroup Commonality with Minority Groups — — 0.53*(0.25)
Female 0.11* 0.10* 0.11*(0.06) (0.06) (0.06)
Income 0.17 0.17 0.17(0.14) (0.14) (0.14)
Education 0.60*** 0.60*** 0.62***(0.11) (0.11) (0.11)
Age -1.08 -1.08 -1.05(0.69) (0.69) (0.69)
Percentage of Life Spent in US 0.88*** 0.88*** 0.91***(0.15) (0.15) (0.15)
Religious -0.02 -0.03 -0.02(0.07) (0.07) (0.07)
US Citizen 0.02 0.04 0.03(0.08) (0.08) (0.08)
Ideology 1.90*** 1.92*** 1.90***(0.13) (0.13) (0.13)
Constant -2.13*** -2.16*** -2.31***(0.23) (0.23) (0.25)
Observations 5159 5159 5159Pseudo R2 0.10 0.10 0.10
Notes: Dependent variable is a binary indicator of partisan identification with the
Democratic Party. Logistic regression standard errors are in parentheses. *p < 0.05,
**p < 0.01, ***p < 0.001 (one-tailed).
vi

Table B.6: OLS Regression Explaining Asian American Partisan Identification with Income Inter-actions
(1) (2) (3) (4) (5) (6) (7) (8)
Social Exclusion 0.07*** — 0.05** 0.05** 0.04*** — 0.03*** 0.03***(0.02) (0.02) (0.02) (0.01) (0.01) (0.01)
Social Exclusion X Income -0.05 — -0.02 -0.03 -0.01 — -0.00 -0.01(0.04) (0.04) (0.03) (0.02) (0.02) (0.02)
Intergroup Commonality with — 0.17** 0.16** 0.14** — 0.10** 0.10** 0.07*Minority Groups (0.06) (0.06) (0.06) (0.04) (0.04) (0.03)
Intergroup Commonality with — 0.06 0.07 0.01 — 0.07 0.09* 0.07Minority Groups X Income (0.09) (0.09) (0.08) (0.05) (0.05) (0.05)
Income 0.04* 0.00 -0.03 -0.01 0.04** 0.01 -0.03 -0.02(0.02) (0.04) (0.05) (0.04) (0.01) (0.02) (0.03) (0.03)
Female — — 0.05*** 0.04*** — — 0.03*** 0.02***(0.01) (0.01) (0.01) (0.01)
Education — — 0.11*** 0.12*** — — 0.07*** 0.07***(0.02) (0.02) (0.01) (0.01)
Age — — -0.29* -0.11 — — -0.22** -0.11(0.14) (0.13) (0.08) (0.08)
Age2 — — 0.18 0.04 — — 0.17* 0.09(0.15) (0.15) (0.09) (0.09)
Percentage of Life Spent in the U.S. — — 0.13*** 0.14*** — — 0.10*** 0.11***(0.03) (0.03) (0.02) (0.02)
Religious — — -0.08*** -0.06*** — — -0.03*** -0.02**(0.02) (0.01) (0.01) (0.01)
US Citizen — — -0.05*** -0.06*** — — -0.02* -0.02*(0.02) (0.02) (0.01) (0.01)
Ideology — — — 0.36*** — — — 0.28***(0.02) (0.01)
Constant 0.56*** 0.52*** 0.54*** 0.27*** 0.53*** 0.51*** 0.50*** 0.31***(0.01) (0.03) (0.05) (0.05) (0.01) (0.02) (0.03) (0.03)
Observations 2993 2993 2993 2993 5159 5159 5159 5159Adjusted R2 0.01 0.01 0.05 0.13 0.01 0.01 0.03 0.09
Notes: Dependent variable is partisan identification (0 (Strong Republican) ! 1 (Strong Democrat)).Regression standard errors are in parentheses. *p < 0.05, **p < 0.01, ***p < 0.001 (one-tailed). Columns(1)-(4) report models excluding respondents who did not report a party identification. Columns (5)-(8)report models recoding missing values on party identification as the midpoint.
vii

Table B.7: OLS and Logistic Regressions Predicting Lack of Partisan Identification
LPM Logit
(1) (2) (3) (4) (5) (6)
Social Exclusion -0.00 0.00 -0.00 -0.00 -0.00 -0.00(0.01) (0.01) (0.01) (0.06) (0.06) (0.06)
Intergroup Commonality with Blacks 0.01 — — 0.03 — —(0.02) (0.10)
Intergroup Commonality with Hispanics — -0.03 — — -0.11 —(0.02) (0.10)
Intergroup Commonality with Minority Groups — — 0.01 — — 0.03(0.06) (0.24)
Female -0.00 -0.00 -0.00 -0.02 -0.02 -0.02(0.01) (0.01) (0.01) (0.06) (0.06) (0.06)
Income -0.01 -0.01 -0.01 -0.03 -0.03 -0.02(0.03) (0.03) (0.03) (0.13) (0.13) (0.13)
Education -0.01 -0.01 -0.01 -0.05 -0.05 -0.06(0.02) (0.02) (0.02) (0.11) (0.11) (0.11)
Age 0.01 0.01 0.01 0.04 0.04 0.04(0.15) (0.15) (0.15) (0.67) (0.67) (0.67)
Age2 -0.20 -0.20 -0.20 -0.86 -0.88 -0.87(0.17) (0.17) (0.17) (0.73) (0.73) (0.73)
Percentage of Life Spent in US -0.23*** -0.23*** -0.24*** -1.01*** -1.01*** -1.02***(0.03) (0.03) (0.03) (0.15) (0.15) (0.15)
Religious -0.11*** -0.10*** -0.11*** -0.47*** -0.46*** -0.47***(0.02) (0.02) (0.02) (0.07) (0.07) (0.07)
US Citizen -0.05** -0.05*** -0.05** -0.23** -0.23*** -0.23***(0.02) (0.02) (0.02) (0.07) (0.07) (0.07)
Ideology -0.09*** -0.09*** -0.09*** -0.38*** -0.38*** -0.38***(0.03) (0.03) (0.03) (0.12) (0.12) (0.12)
Constant 0.79*** 0.81*** 0.80*** 1.28*** 1.34*** 1.29***(0.05) (0.05) (0.06) (0.21) (0.22) (0.24)
Observations 5159 5159 5159 5158 5158 5158Adjusted or Pseudo R2 0.07 0.07 0.07 0.06 0.06 0.05
Notes: Dependent variable is a binary measure of lack of party identification. Linear Probability Model (LPM)
(see columns (1)-(3)) and logistic regression (see columns (4)-(6)) standard errors are in parentheses. *p < 0.05,
**p < 0.01, ***p < 0.001 (one-tailed).
viii

C Study 1
Table C.1: Summary Statistics of Study 1 Outcome Measures
Variable Observations Mean Standard Deviation Min Max
Dependent Variables
Pro-Democratic Party Index 114 0.65 0.16 0.11 0.93Closed-Minded 114 0.60 0.24 0 1Ignorant 114 0.56 0.24 0 1Represent Interests 114 0.69 0.21 0 1Net Likes 114 0.55 0.17 0 1Feeling Thermometer 114 0.69 0.21 0 1Party ID 114 0.71 0.25 0 1Time Taken (logged millisecond) 114 4.56 0.87 2.78 6.49Names Listed 114 6.25 7.30 0 50
Demographic Variables
White 114 0.46 0.50 0 1Asian 114 0.54 0.50 0 1Female 114 0.59 0.49 0 1Some College, but No Degree (Yet) 114 0.55 0.50 0 14-Year College Degree 114 0.30 0.47 0 1Postgraduate Degree 114 0.11 0.32 0 1Age 114 20.93 4.44 17 52Religious 114 0.54 0.50 0 1US Citizen 114 0.88 0.33 0 1Ideology 114 5.22 1.28 2 7
ix
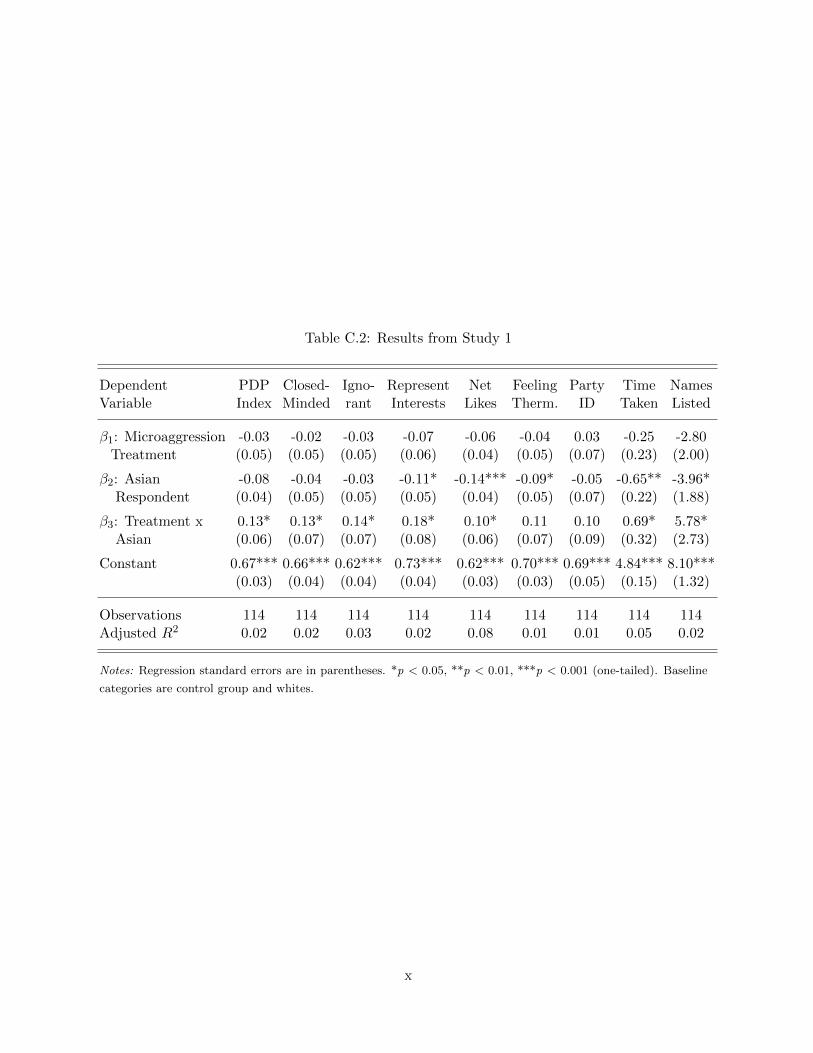
Table C.2: Results from Study 1
Dependent PDP Closed- Igno- Represent Net Feeling Party Time NamesVariable Index Minded rant Interests Likes Therm. ID Taken Listed
�1: Microaggression -0.03 -0.02 -0.03 -0.07 -0.06 -0.04 0.03 -0.25 -2.80Treatment (0.05) (0.05) (0.05) (0.06) (0.04) (0.05) (0.07) (0.23) (2.00)
�2: Asian -0.08 -0.04 -0.03 -0.11* -0.14*** -0.09* -0.05 -0.65** -3.96*Respondent (0.04) (0.05) (0.05) (0.05) (0.04) (0.05) (0.07) (0.22) (1.88)
�3: Treatment x 0.13* 0.13* 0.14* 0.18* 0.10* 0.11 0.10 0.69* 5.78*Asian (0.06) (0.07) (0.07) (0.08) (0.06) (0.07) (0.09) (0.32) (2.73)
Constant 0.67*** 0.66*** 0.62*** 0.73*** 0.62*** 0.70*** 0.69*** 4.84*** 8.10***(0.03) (0.04) (0.04) (0.04) (0.03) (0.03) (0.05) (0.15) (1.32)
Observations 114 114 114 114 114 114 114 114 114Adjusted R2 0.02 0.02 0.03 0.02 0.08 0.01 0.01 0.05 0.02
Notes: Regression standard errors are in parentheses. *p < 0.05, **p < 0.01, ***p < 0.001 (one-tailed). Baseline
categories are control group and whites.
x

Table C.3: Results from Study 1: Asian Respondents vs. White Respondents
Asian Respondents
Dependent PDP Closed- Igno- Represent Net Feeling Party Time NamesVariable Index Minded rant Interests Likes Therm. ID Taken Listed
�1: Microaggression 0.09* 0.10* 0.11* 0.10* 0.05 0.07 0.13* 0.44* 2.99Treatment (0.04) (0.05) (0.05) (0.05) (0.04) (0.05) (0.06) (0.22) (2.01)
Constant 0.60*** 0.62*** 0.59*** 0.62*** 0.48*** 0.61*** 0.65*** 4.19*** 4.14**(0.03) (0.04) (0.04) (0.04) (0.03) (0.03) (0.05) (0.16) (1.46)
Observations 61 61 61 61 61 61 61 61 61Adjusted R2 0.06 0.05 0.05 0.05 0.01 0.02 0.05 0.05 0.02
White Respondents
Dependent PDP Closed- Igno- Represent Net Feeling Party Time NamesVariable Index Minded rant Interests Likes Therm. ID Taken Listed
�1: Microaggression -0.03 -0.02 -0.03 -0.07 -0.06 -0.04 0.03 -0.25 -2.80Treatment (0.05) (0.06) (0.05) (0.06) (0.05) (0.05) (0.07) (0.23) (1.78)
Constant 0.67*** 0.66*** 0.62*** 0.73*** 0.62*** 0.70*** 0.69*** 4.84*** 8.10***(0.03) (0.04) (0.03) (0.04) (0.03) (0.03) (0.05) (0.15) (1.17)
Observations 53 53 53 53 53 53 53 53 53Adjusted R2 -0.01 -0.02 -0.01 0.01 0.00 -0.01 -0.02 0.00 0.03
Notes: Regression standard errors are in parentheses. *p < 0.05, **p < 0.01, ***p < 0.001 (one-tailed). The
baseline category is the control group.
xi

Table C.4: Study 2: Predicting Lack of Party Identification
LPM Logit
�1: Microaggression Treatment -0.05 -0.22(0.13) (0.57)
�2: Asian Respondent 0.01 0.06(0.13) (0.53)
�3: Treatment X Asian -0.11 -0.53(0.18) (0.80)
Constant 0.40 -0.41(0.09) (0.37)
Observations 114 114Adjusted or Pseudo R2 0.00 0.02
Notes: Dependent variable is a binary indicator of partisan
non-identification. Linear probability model (LPM) and logistic
regression standard errors are in parentheses. *p < 0.05,
**p < 0.01, ***p < 0.001 (one-tailed).
xii
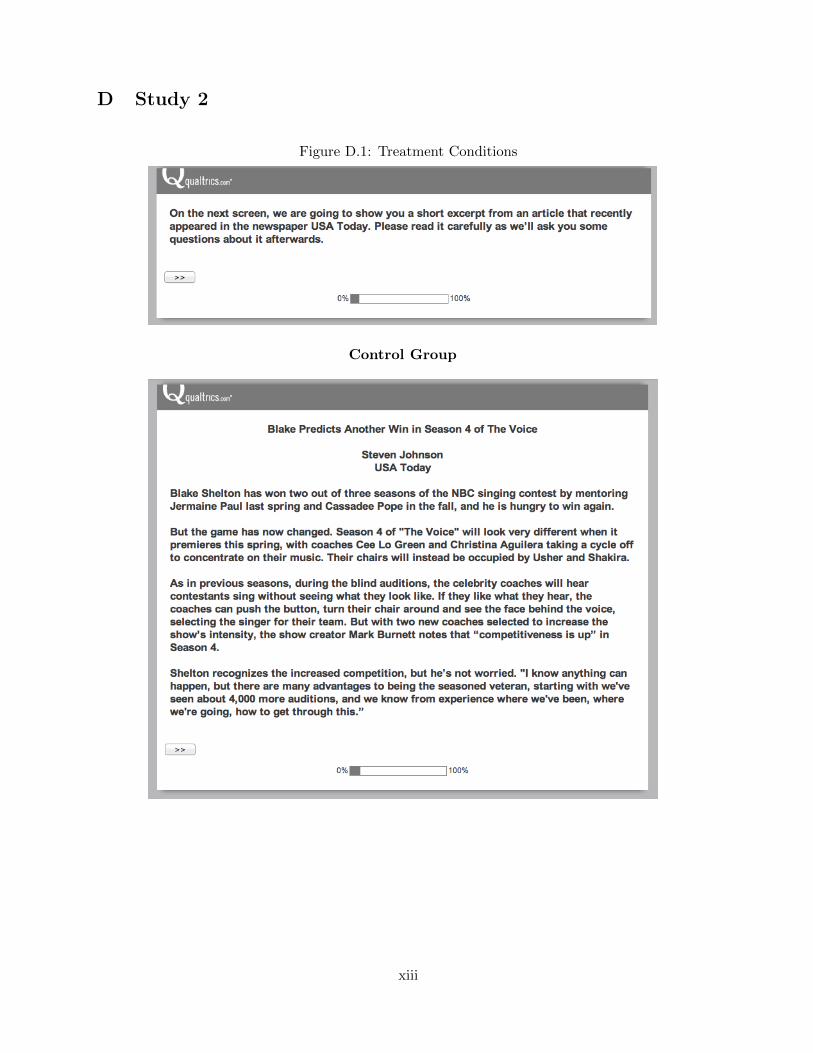
D Study 2
Figure D.1: Treatment Conditions
Control Group
xiii
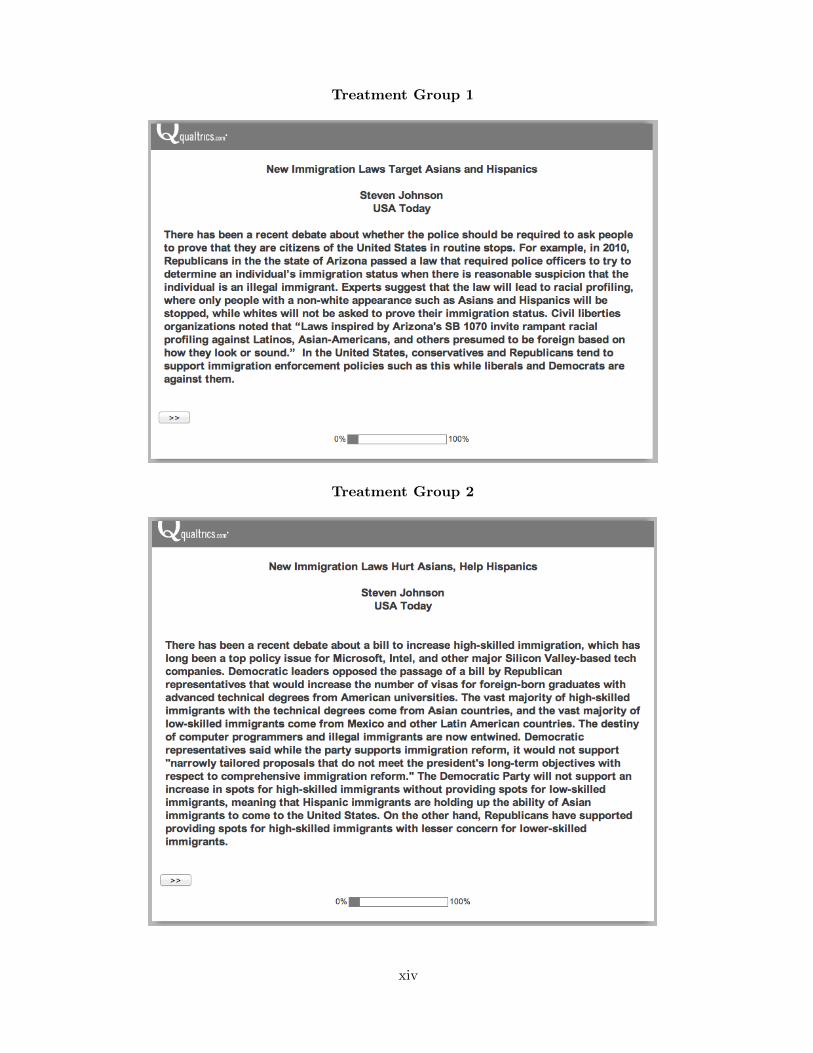
Treatment Group 1
Treatment Group 2
xiv

Table D.1: Summary Statistics of Study 2 Outcome Measures
Variable Observations Mean Standard Deviation Min Max
Dependent Variables
Pro-Democratic Party Index 656 0.57 0.17 0 0.97Closed-Minded 680 0.57 0.23 0 1Ignorant 679 0.56 0.23 0 1Represent Interests 684 0.57 0.23 0 1Net Likes 689 0.54 0.08 0 1Feeling Thermometer 673 0.56 0.20 0 1Party ID 667 0.60 0.29 0 1Close to Hispanics 670 2.73 0.88 1 4
Demographic Variables
Female 687 0.49 0.50 0 1Did Not Graduate from High School 689 0.02 0.15 0 1High School Graduate 689 0.11 0.32 0 1Some College, but No Degree (Yet) 689 0.24 0.43 0 12-year College Degree 689 0.07 0.25 0 14-year College Degree 689 0.35 0.48 0 1Postgraduate Degree 689 0.20 0.40 0 1Age 684 35.40 15.16 16 95Religious 674 0.74 0.44 0 1US Citizen 674 0.81 0.39 0 1Ideology 675 4.41 1.45 1 7
xv

Table D.2: Results from Study 2
Dependent PDP Closed- Igno- Represent Net Feeling Party Close toVariable Index Minded rant Interests Likes Therm. ID Hispanics
�1: Intergroup Common- 0.05** 0.06** 0.03 0.07** 0.01 0.05** 0.05* 0.17*ality Treatment (0.02) (0.02) (0.02) (0.02) (0.01) (0.02) (0.03) (0.08)
�2: Control Condition 0.02 0.03 0.00 0.03 0.00 0.02 0.02 0.07(0.02) (0.02) (0.02) (0.02) (0.01) (0.02) (0.03) (0.08)
Constant 0.55*** 0.54*** 0.55*** 0.53*** 0.53*** 0.54*** 0.58*** 2.64***(0.01) (0.02) (0.02) (0.02) (0.01) (0.01) (0.02) (0.06)
Observations 656 680 679 684 689 673 667 670Adjusted R2 0.01 0.01 0.00 0.01 -0.00 0.01 0.00 0.00
Notes: Regression standard errors are in parentheses. *p < 0.05, **p < 0.01, ***p < 0.001 (one-tailed). Baseline
category is the Intergroup Conflict Treatment.
xvi

Table D.3: Study 2: Predicting Lack of Party Identification
LPM Logit
�1: Intergroup Commonality Treatment -0.01 -0.04(0.05) (0.19)
�2: Control Condition 0.01 0.04(0.05) (0.19)
Constant 0.46 -0.17(0.03) (0.13)
Observations 689 689Adjusted or Pseudo R2 0.00 0.00
Notes: Dependent variable is a binary indicator of partisan
non-identification. Linear probability model (LPM) and logistic
regression standard errors are in parentheses. *p < 0.05,
**p < 0.01, ***p < 0.001 (one-tailed).
xvii