algebra 1 ~ chapter 13 notes (statistics) -...
TRANSCRIPT
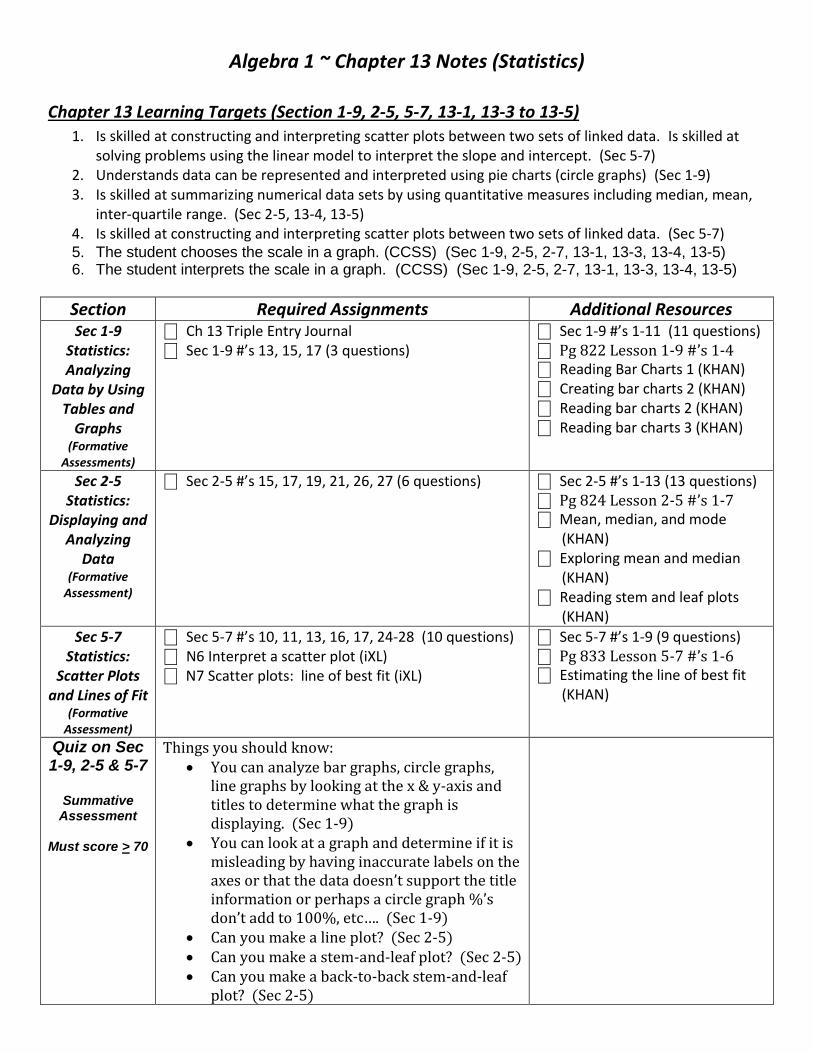
Algebra 1 ~ Chapter 13 Notes (Statistics)
Chapter 13 Learning Targets (Section 1-9, 2-5, 5-7, 13-1, 13-3 to 13-5)
1. Is skilled at constructing and interpreting scatter plots between two sets of linked data. Is skilled at solving problems using the linear model to interpret the slope and intercept. (Sec 5-7)
2. Understands data can be represented and interpreted using pie charts (circle graphs) (Sec 1-9) 3. Is skilled at summarizing numerical data sets by using quantitative measures including median, mean,
inter-quartile range. (Sec 2-5, 13-4, 13-5) 4. Is skilled at constructing and interpreting scatter plots between two sets of linked data. (Sec 5-7) 5. The student chooses the scale in a graph. (CCSS) (Sec 1-9, 2-5, 2-7, 13-1, 13-3, 13-4, 13-5) 6. The student interprets the scale in a graph. (CCSS) (Sec 1-9, 2-5, 2-7, 13-1, 13-3, 13-4, 13-5)
Section Required Assignments Additional Resources Sec 1-9
Statistics: Analyzing
Data by Using Tables and
Graphs (Formative
Assessments)
⎕ Ch 13 Triple Entry Journal ⎕ Sec 1-9 #’s 13, 15, 17 (3 questions)
⎕ Sec 1-9 #’s 1-11 (11 questions) ⎕ Pg 822 Lesson 1-9 #’s 1-4 ⎕ Reading Bar Charts 1 (KHAN) ⎕ Creating bar charts 2 (KHAN) ⎕ Reading bar charts 2 (KHAN) ⎕ Reading bar charts 3 (KHAN)
Sec 2-5 Statistics:
Displaying and Analyzing
Data (Formative
Assessment)
⎕ Sec 2-5 #’s 15, 17, 19, 21, 26, 27 (6 questions)
⎕ Sec 2-5 #’s 1-13 (13 questions) ⎕ Pg 824 Lesson 2-5 #’s 1-7 ⎕ Mean, median, and mode (KHAN) ⎕ Exploring mean and median (KHAN) ⎕ Reading stem and leaf plots (KHAN)
Sec 5-7 Statistics:
Scatter Plots and Lines of Fit
(Formative Assessment)
⎕ Sec 5-7 #’s 10, 11, 13, 16, 17, 24-28 (10 questions) ⎕ N6 Interpret a scatter plot (iXL) ⎕ N7 Scatter plots: line of best fit (iXL)
⎕ Sec 5-7 #’s 1-9 (9 questions) ⎕ Pg 833 Lesson 5-7 #’s 1-6 ⎕ Estimating the line of best fit (KHAN)
Quiz on Sec 1-9, 2-5 & 5-7
Summative
Assessment
Must score > 70
Things you should know: You can analyze bar graphs, circle graphs,
line graphs by looking at the x & y-axis and titles to determine what the graph is displaying. (Sec 1-9)
You can look at a graph and determine if it is misleading by having inaccurate labels on the axes or that the data doesn’t support the title information or perhaps a circle graph %’s don’t add to 100%, etc…. (Sec 1-9)
Can you make a line plot? (Sec 2-5) Can you make a stem-and-leaf plot? (Sec 2-5) Can you make a back-to-back stem-and-leaf
plot? (Sec 2-5)

What are the measures of central tendency? (Sec 2-5)
Can you make a scatter plot? (Sec 5-7) Can you determine if a scatter plot displays a
positive, negative or no correlation? (Sec 5-7)
Can you draw a line of best fit through a set of data? (Sec 5-7)
Using your drawn line of best fit, can you write an equation using two points that you went through? (Sec 5-7)
Can you use your equation to predict a future amount? (Sec 5-7)
When using your linear equation of best fit, can you determine if you are determining interpolation or extrapolation? (Sec 5-7)
Sec 13-1 Sampling and
Bias (Formative
Assessments)
⎕ Sec 13-1 #’s 9, 11, 13, 15, 17, 19 (6 questions) ⎕ KK3 Identify biased samples (iXL)
⎕ Sec 13-1 #’s 1-7 (7 questions) ⎕ Pg 849 Lesson 13-1 #’s 1-8
Sec 13-3 Histograms
(Formative Assessments)
⎕ Sec 13-3 #’s 11, 13, 15, 16, 17 (5 questions) ⎕ N1 Interpret bar graphs, line graphs, and histogram (iXL) ⎕ N2 Create bar graphs, line graphs, and histograms (iXL)
⎕ Sec 13-3 #’s 1-9 (9 questions) ⎕ Pg 850 Lesson 13-3 #’s 1-5
Quiz on Sec 13-1 & 13-3
Summative
Assessment
Must score > 70
Things you should know: What are the 3 types of Unbiased Samples?
(Sec 13-1) What are the 2 types of Biased Samples? (Sec
13-1) Can you give examples of Simple Random
Samples? (Sec 13-1) Can you give examples of Stratified Random
Samples? (Sec 13-1) Can you give examples of Systematic Random
Samples? (Sec 13-1) Can you give examples of Convenience
Samples? (Sec 13-1) Can you give examples of Voluntary
Response Samples? (Sec 13-1) Can you make a frequency table? (Sec 13-3) Can you make and label a histogram? (Sec
13-3) What are the differences between a bar graph
and a histogram? (Sec 13-3)
Sec 13-4 Measures of
Variation (Formative
⎕ Sec 13-4 #’s 11, 15, 17, 24-28 (8 questions) ⎕ N4 Interpret stem-and-leaf plots (iXL) ⎕ KK1 Mean, median, mode, and range (iXL)
⎕ Sec 13-4 #’s 1-10 (10 questions) ⎕ Pg 850 Lesson 13-4 #’s 1-6 ⎕ Exploring standard deviation 1 (KHAN)

Assessments)
Sec 13-5 Box-and-
Whisker Plots (Formative
Assessments)
⎕ #’s 10, 11, 15, 17, 19-23 (9 questions) ⎕ N5 Interpret box-and-whisker plots (iXL) ⎕ KK2 Quartiles (iXL)
⎕ #’s 1, 4, 6, 8, 9 (5 questions) ⎕ Pg 850 Lesson 13-5 #’s 1-8 ⎕ Creating box and whisker plots (KHAN)
Quiz on Sec 13-4 & 13-5
Summative
Assessment
Must score > 70
Things you should know:
What are the measures of variation? (Sec 13-4)
How do you find the range? (Sec 13-4)
How do you find the upper quartile? (Sec 13-4)
How do you find the lower quartile? (Sec 13-4)
How do you find the Interquartile Range (IQR)? (Sec 13-4)
How do you find the upper outliers? (Sec 13-4)
How do you find the lower outliers? (Sec 13-4)
What is the 5 Number Summary of a box-and-whisker plot? (Sec 13-5)
How do you draw a box-and-whisker plot? (Sec 13-5)
Can you draw a parallel box-and-whisker plot? (Sec 13-5)
Chapter 13 Review
⎕ Chapter 1 Study Guide & Review pg 62 #’s 84-85
⎕ Chapter 5 Study Guide & Review pg 312 #’s 66-70
⎕ Chapter 13 Study Guide & Review pg 745-748 #’s 1-12, 23-31
⎕ Chapter 1 Practice Test pg 63 #’s 23-24
⎕ Chapter 5 Practice Test pg 313 #’s 21-24
⎕ Chapter 13 Practice Test pg 749 #’s 1-7, 14-20
Chapter 13 Project
⎕ Chapter 13 Project (NONE – It will be combined with Chapter 14 Project) (Summative Assessment Must score > 70.)
Chapter 13 Test
⎕ Chapter 13 Test (Summative Assessment Must score > 70.)
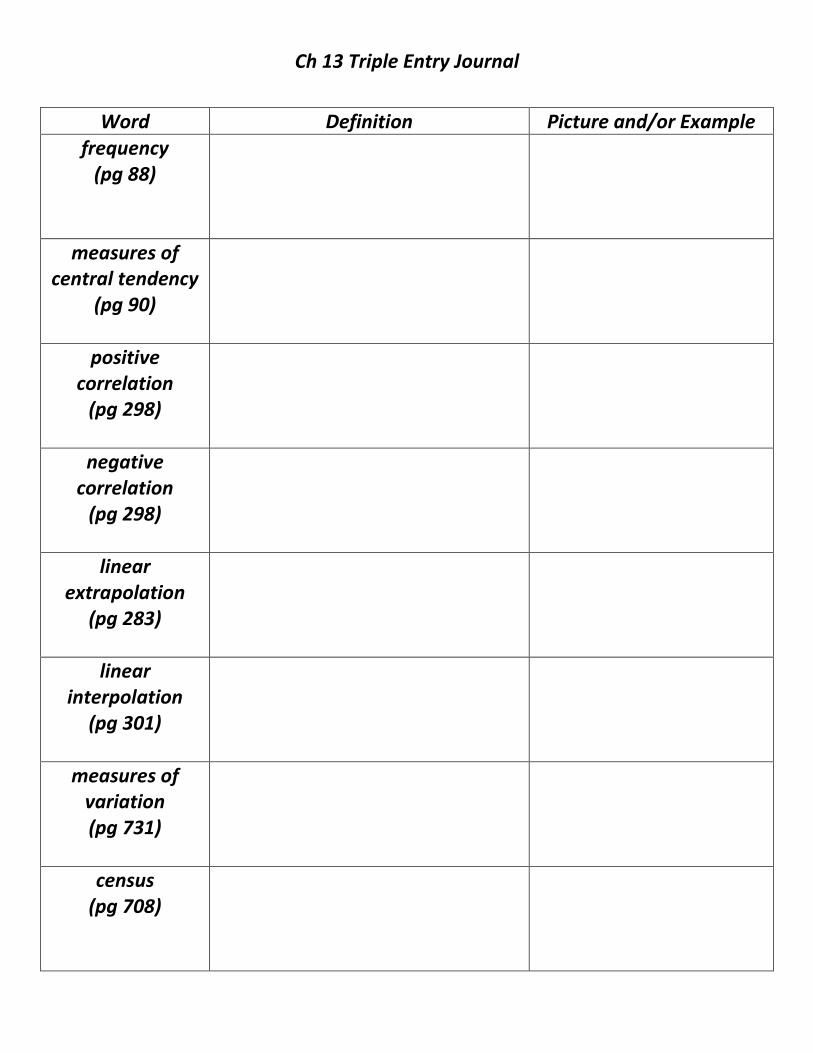
Ch 13 Triple Entry Journal
Word Definition Picture and/or Example frequency
(pg 88)
measures of central tendency
(pg 90)
positive correlation
(pg 298)
negative correlation
(pg 298)
linear extrapolation
(pg 283)
linear interpolation
(pg 301)
measures of variation (pg 731)
census (pg 708)

Section 1-9 Statistics: Analyzing Data by Using Tables and Graphs
Topic Notes
Sample of a Bar Graph
Sample of a Circle Graph
Sample of a Line Graph
Type of Graph
bar graph circle graph line graph
When to Use

Section 1-9 Statistics: Analyzing Data by Using Tables and Graphs (continued…)
Topic Notes
Why are these Misleading Graphs?
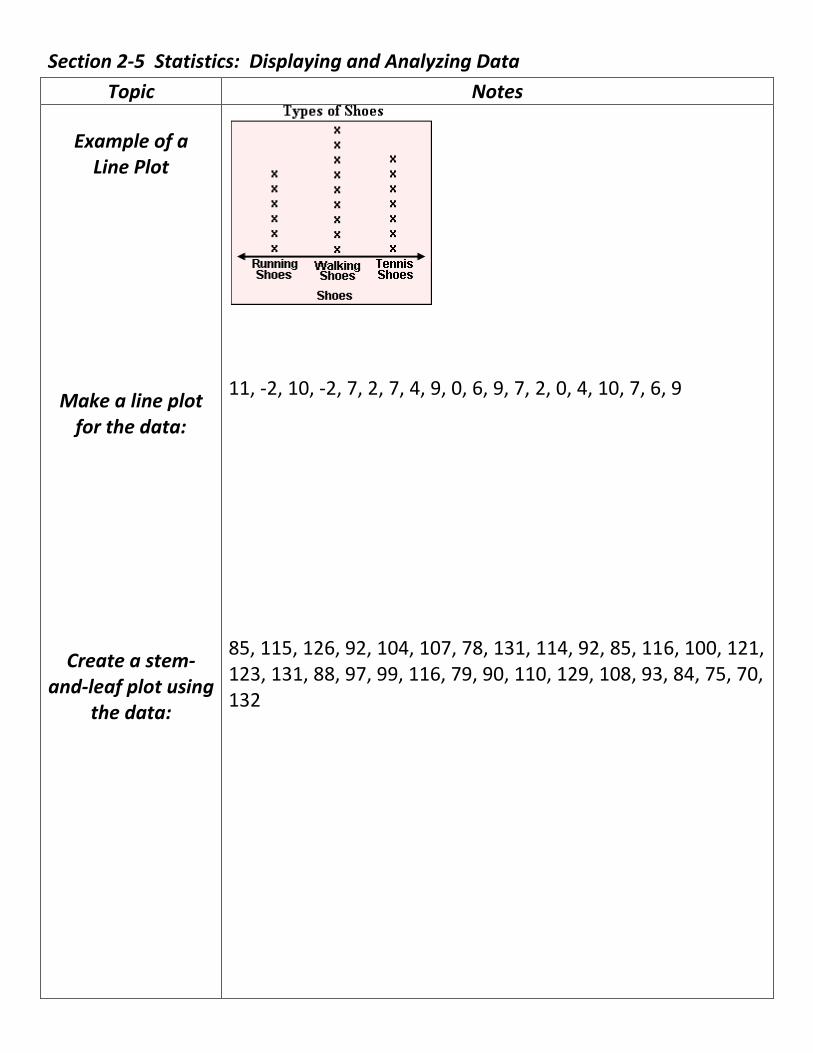
Section 2-5 Statistics: Displaying and Analyzing Data
Topic Notes
Example of a Line Plot
Make a line plot for the data:
Create a stem-and-leaf plot using
the data:
11, -2, 10, -2, 7, 2, 7, 4, 9, 0, 6, 9, 7, 2, 0, 4, 10, 7, 6, 9 85, 115, 126, 92, 104, 107, 78, 131, 114, 92, 85, 116, 100, 121, 123, 131, 88, 97, 99, 116, 79, 90, 110, 129, 108, 93, 84, 75, 70, 132

Section 2-5 Statistics: Displaying and Analyzing Data (continued……..)
Topic Notes
What are measures of
central tendency?
Find the measures of central tendency
1) 2) 3) The number of electoral votes for the 12 most populous states in the 2000 Presidential election are listed below. Which measure of central tendency best represents the data? 21, 22, 18, 23, 15, 25, 14, 32, 13, 33, 13, 54

Section 5-7 Statistics: Scatter Plots and Lines of Fit
Topic Notes What is correlation?
Samples of Correlation
Using the graph to the right to make a
‘prediction equation’ and predict the
stopping distance if you were going
80 mph?
1) Draw a line through the center of the dots keeping the amount of dots as equal on each side. Be sure to go through at LEAST 2 dots.
2) Using 2 of the dots you went through, find the slope.
3) Using your slope and 1 of the dots you used for slope, plug into point-slope form ( ) and simplify into slope-intercept form (y=mx+b). 4) Since ‘x’ represents ‘speed’ and ‘y’ represents ‘stopping distance’, predict your stopping distance if you were going 80 mph.
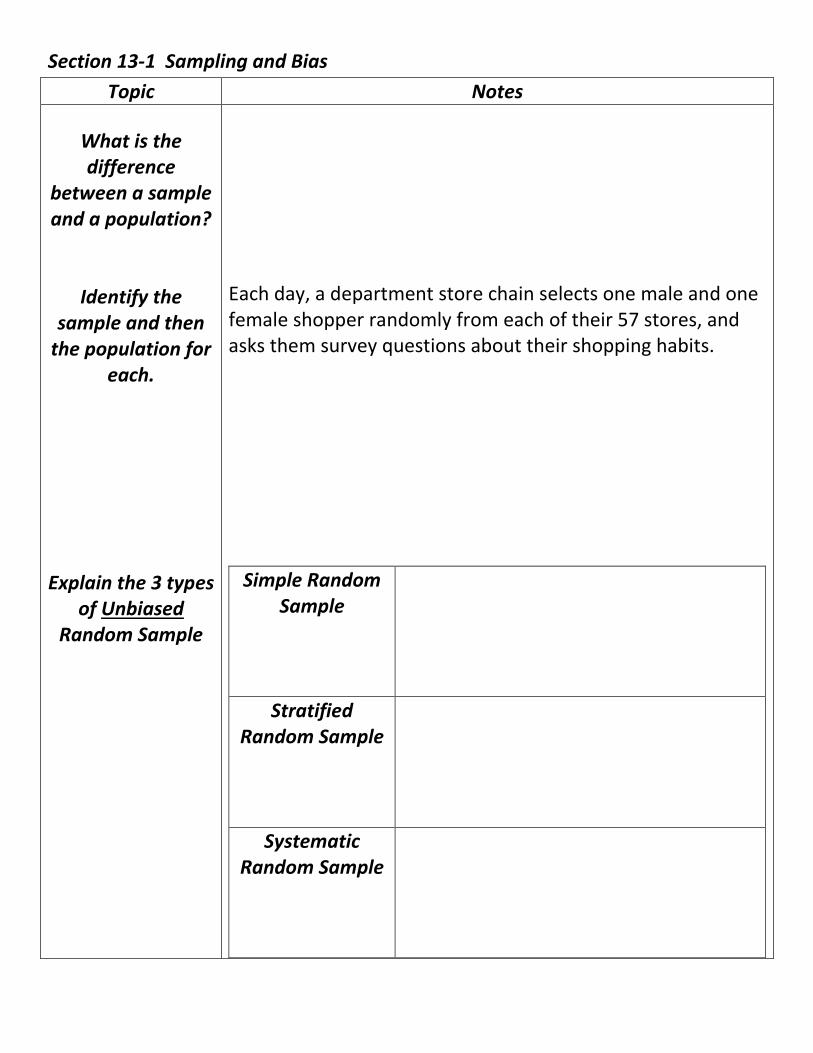
Section 13-1 Sampling and Bias
Topic Notes
What is the difference
between a sample and a population?
Identify the sample and then
the population for each.
Explain the 3 types of Unbiased
Random Sample
Each day, a department store chain selects one male and one female shopper randomly from each of their 57 stores, and asks them survey questions about their shopping habits.
Simple Random Sample
Stratified Random Sample
Systematic Random Sample
Section 13-1 Sampling and Bias (continued……..)
Topic Notes
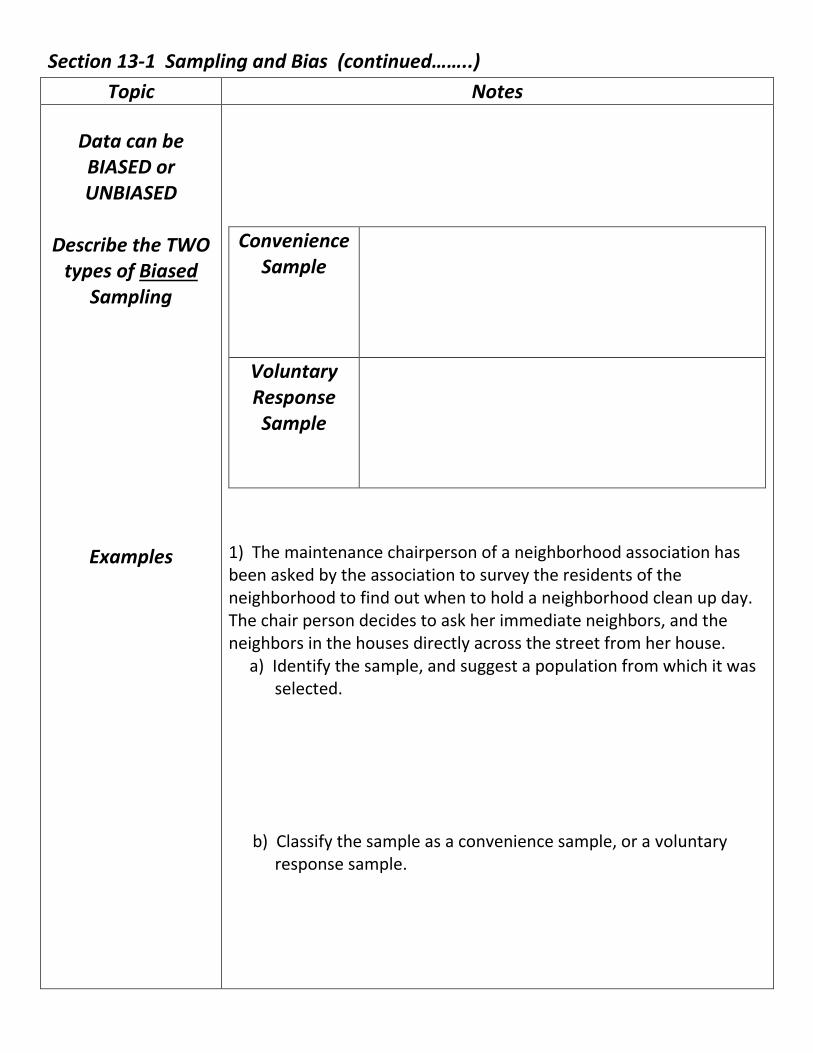
Data can be BIASED or UNBIASED
Describe the TWO
types of Biased Sampling
Examples
Convenience Sample
Voluntary Response Sample
1) The maintenance chairperson of a neighborhood association has been asked by the association to survey the residents of the neighborhood to find out when to hold a neighborhood clean up day. The chair person decides to ask her immediate neighbors, and the neighbors in the houses directly across the street from her house. a) Identify the sample, and suggest a population from which it was selected.
b) Classify the sample as a convenience sample, or a voluntary response sample.
Section 13-1 Sampling and Bias (continued……..)
Topic Notes
Examples
2) The high school Parent Association sent a letter to the parents of all graduating seniors asking them to return the enclosed ballot if they had a preference on where the graduation party was to be held. a) Identify the sample. b) Suggest a population from which the sample was selected. c) State whether the sample is unbiased (random) or biased. If unbiased, classify it as simple, stratified, or systematic. If biased, classify it as convenience or voluntary response.

Section 13-3 Histogram
Topic Notes
Sample of a histogram
Create a histogram to represent the
following scores of top 25 winning college football
teams during one week of the 2001
season.
Notice how the bars touch and hold a RANGE of numbers. For example, the 1st bar houses numbers 20 < x < 30.
The measurement class is what each bar is broken up into.
The y-axis represents the frequency.
43, 52, 38, 36, 42, 46, 26, 38, 38, 31, 38, 37, 38, 48, 45, 27, 47, 35, 35, 26, 47, 24, 41, 21, 32

Section 13-4 Measures of Variation
Topic Notes
What are measures of variation?
How do you find
the range of a set of data?
Find the range of the given data.
How to find the lower quartile, upper quartile,
and interquartile range (IQR).
Ex. 2, 1, 5, 8, 3, 4, 10, 1 1 1 2 4 6 7 7 8 9 10 12 13 17 17 18 1st: Put all numbers in ORDER 2nd: Find the median (Cross off smallest, biggest and continue until you get to the middle number. If you end with 2 numbers in the middle, average them.) 3rd: Take the numbers BEFORE the median and cross off the smallest and then the biggest until you get to the middle number. If you end with 2 numbers in the middle, average them) This is known as your LOWER QUARTILE. 4th: Take the numbers AFTER the median and cross off the smallest and then the biggest until you get to the middle number. If you end with 2 numbers in the middle, average them) This is known as your UPPER QUARTILE. 5th: Take the upper quartile and subtract the lower quartile and that gives you your INTERQUARTILE RANGE (IQR).
Section 13-4 Measures of Variation (continued……..)
Topic Notes
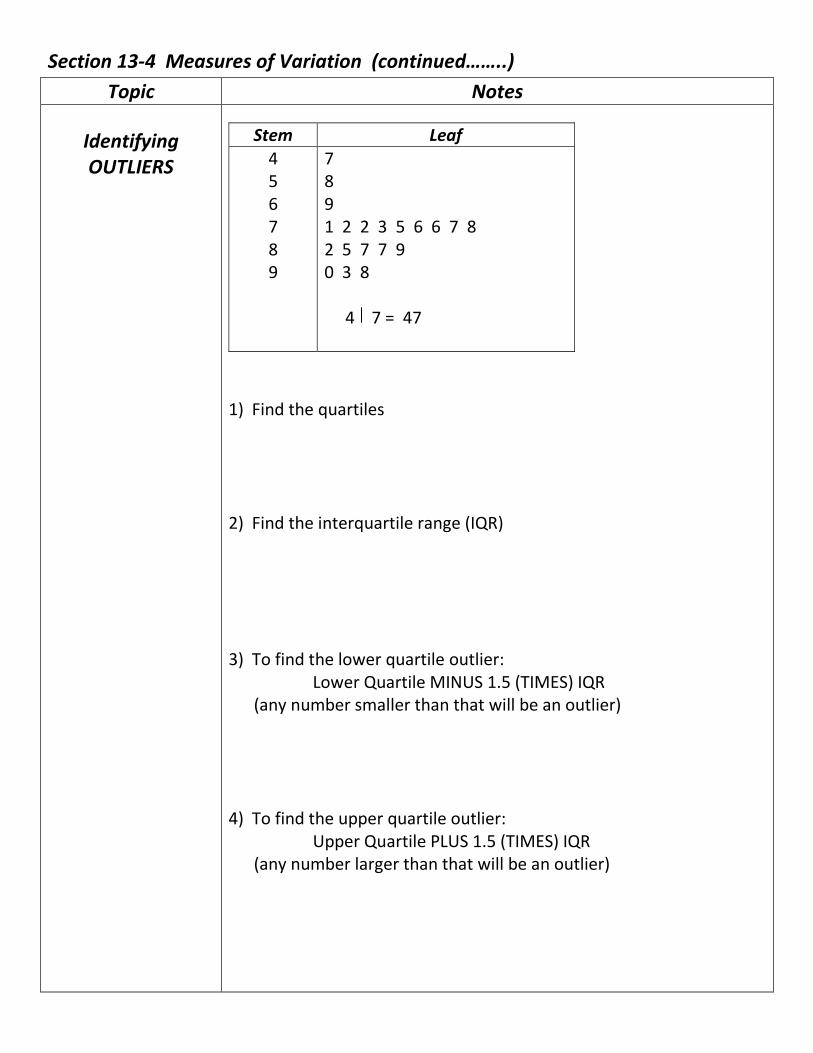
Identifying OUTLIERS
Stem Leaf
4 5 6 7 8 9
7 8 9 1 2 2 3 5 6 6 7 8 2 5 7 7 9 0 3 8 4 7 = 47
1) Find the quartiles 2) Find the interquartile range (IQR) 3) To find the lower quartile outlier: Lower Quartile MINUS 1.5 (TIMES) IQR (any number smaller than that will be an outlier) 4) To find the upper quartile outlier: Upper Quartile PLUS 1.5 (TIMES) IQR (any number larger than that will be an outlier)

Section 13-5 Box-and-Whisker Plots
Topic Notes
Example of a Box-and-Whisker Plot
How to make a
Box-and-Whisker Plot
Ex. 64, 69, 65, 71, 66, 66, 74, 67, 68, 67 Determine the 5 number summary (minimum, Q1, Median (Q2), Q3, maximum) 1) Order the numbers 2) Find the median (middle number) 3) Using the 1st half of the data (the numbers BEFORE the median), find the middle number which is the Q1 (if you have 2 numbers, average them) 4) Using the 2nd half of the data (the numbers AFTER the median), find the middle number which is the Q3 (if you have 2 numbers, average them) 5) Make a number line that includes the smallest and largest numbers of the set of data. (Be sure to jump by EVEN incriments) 6) Calculate the outliers (if any) Lower: Q1 – 1.5(IQR) Upper: Q3 + 1.5(IQR) 7) Put a dot on the smallest and largest number and any outlier 8) Make 2 connected boxes with the Q1, Median (Q2) and the Q3.

Chapter 1-9, 2-5, 5-7, 13-1, 13-3 to 13-5 Study Guide
Section 1-9
⎕ I can analyze data given in tables and graphs (bar, line, and circle).
⎕ I can determine whether graphs are misleading.
Section 2-5
⎕ I can interpret and create line plots and stem-and-leaf plots.
⎕ I can analyze data using mean, median, and mode. (*Know formulas and differences)
Section 5-7
⎕ I can interpret points on a scatter plot.
⎕ I can write equations for lines of fit. (y = mx + b)
Section 13-1
⎕ I can identify various sampling techniques.
⎕ I can recognize a biased sample.
Section 13-3
⎕ I can interpret data displayed in histograms.
⎕ I can display data in histograms.
Section 13-4
⎕ I can find the range of a set of data.
⎕ I can find the quartiles and interquartile range of a set of data.
Section 13-5
⎕ I can organize and use data in box-and-whisker plots.
⎕ I can organize and use data in parallel box-and-whisker plots.