algebra 2 graphing linear inequalities in two variables
TRANSCRIPT

Algebra 2
Graphing Linear Inequalities in Two Variables

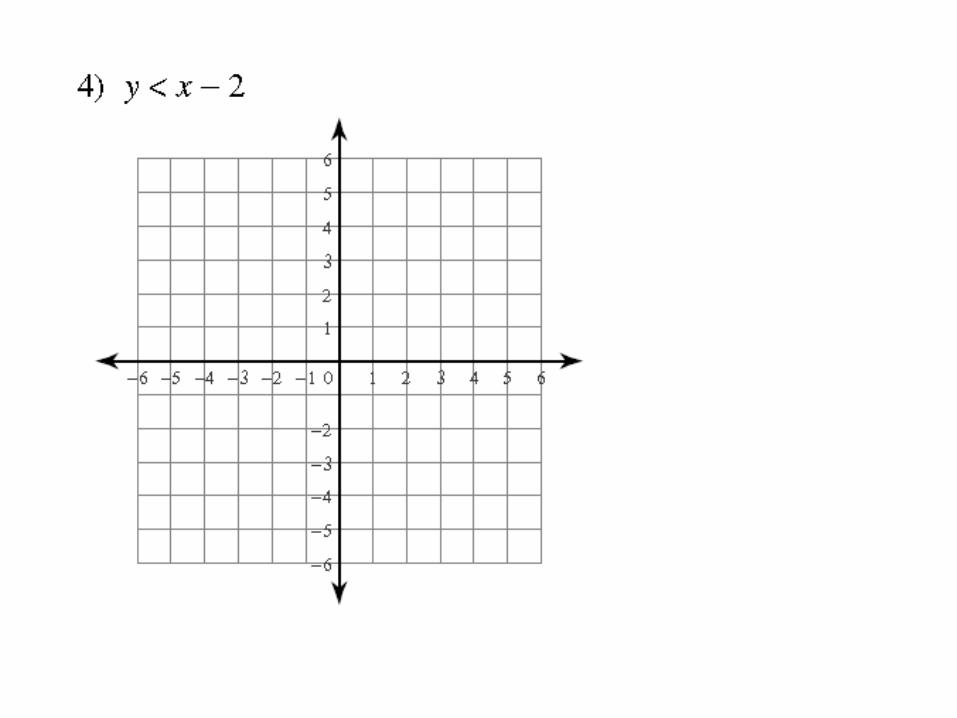
Types of Graphs of Linear Inequalities in Two Variables
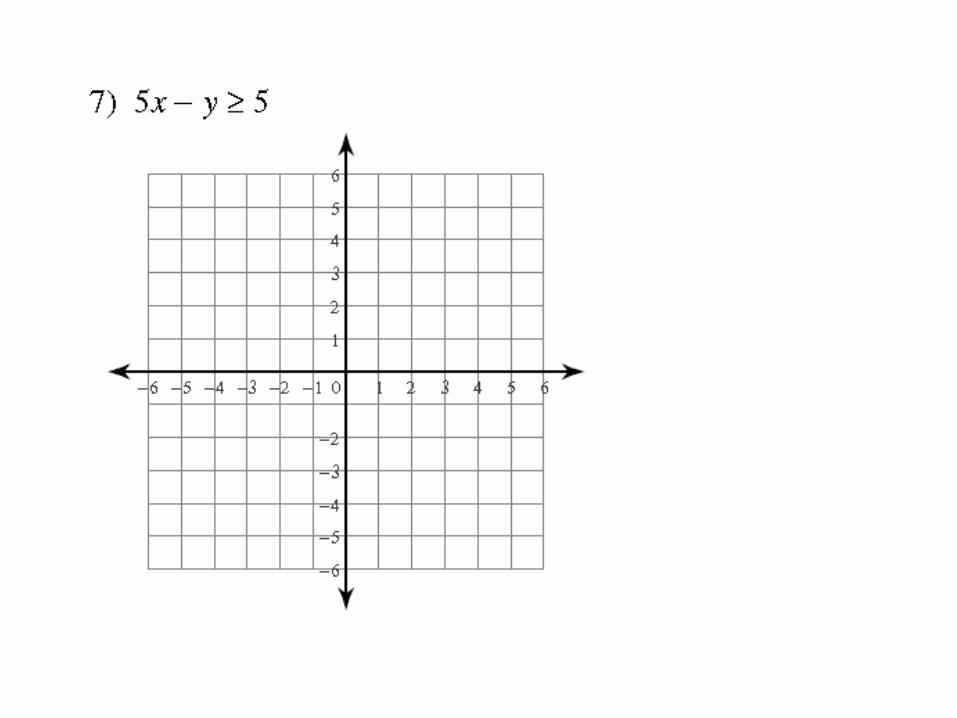
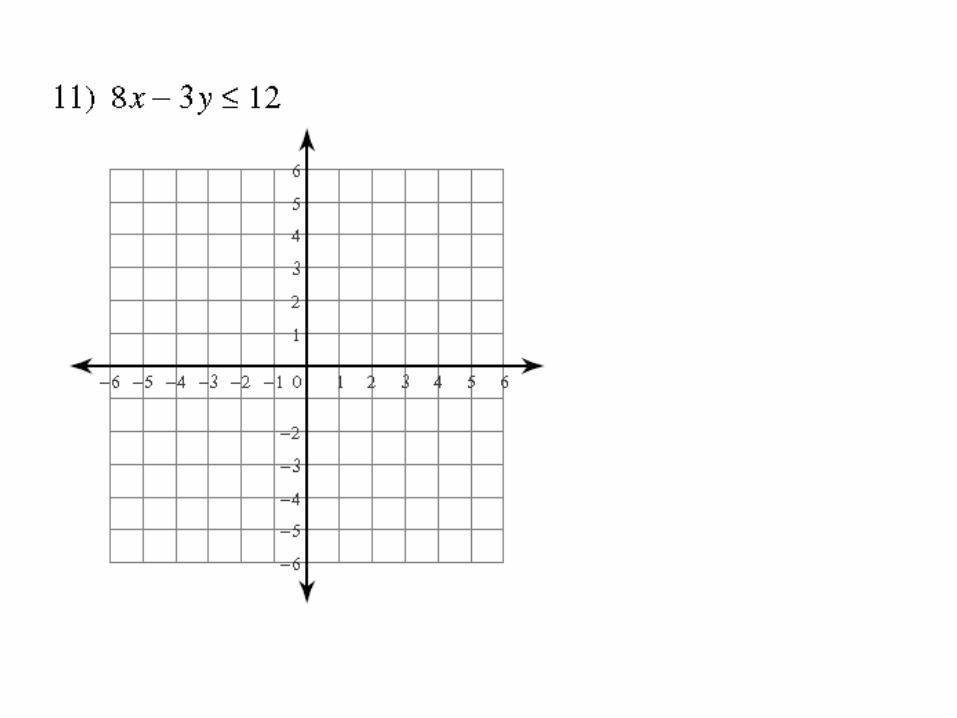
The lines that are graphed will be either solid or dashed based on the inequality symbol:
• < or > will be dashed lines• ≤ or ≥ will be solid lines
One side of the line will be shaded.
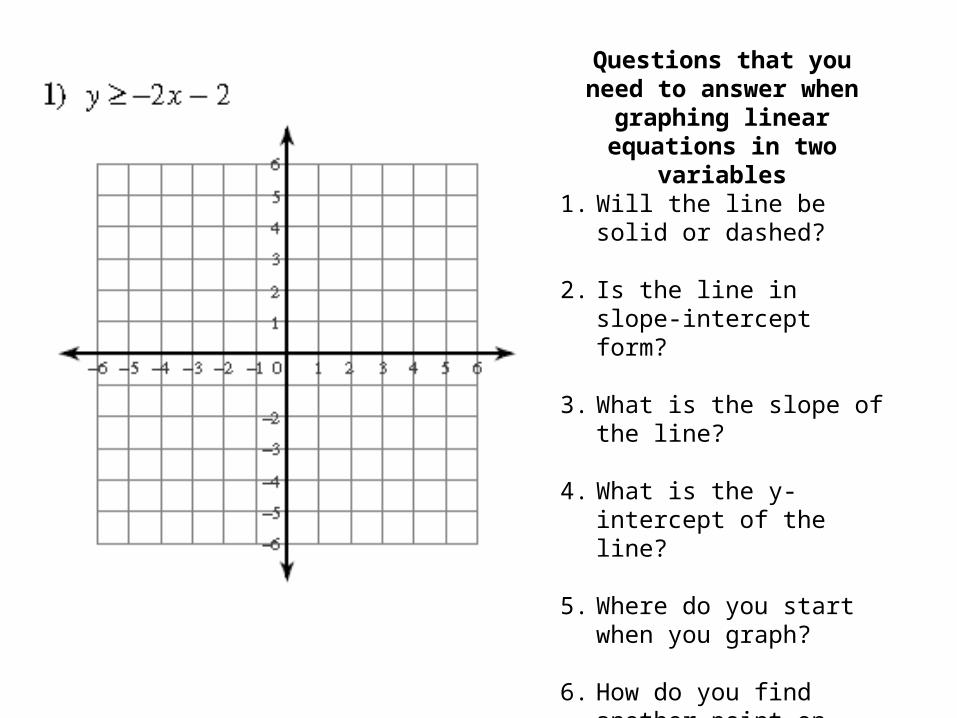
Questions that you need to answer when graphing linear
equations in two variables1. Will the line be solid or
dashed?
2. Is the line in slope-intercept form?
3. What is the slope of the line?
4. What is the y-intercept of the line?
5. Where do you start when you graph?
6. How do you find another point on your line?
7. Which side do you shade on?
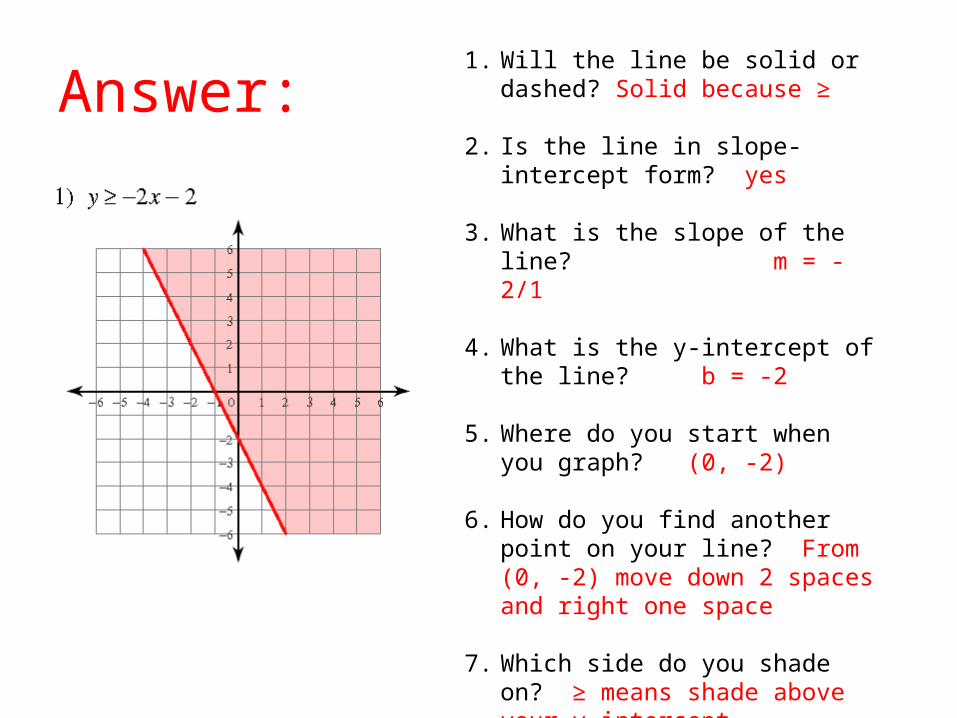
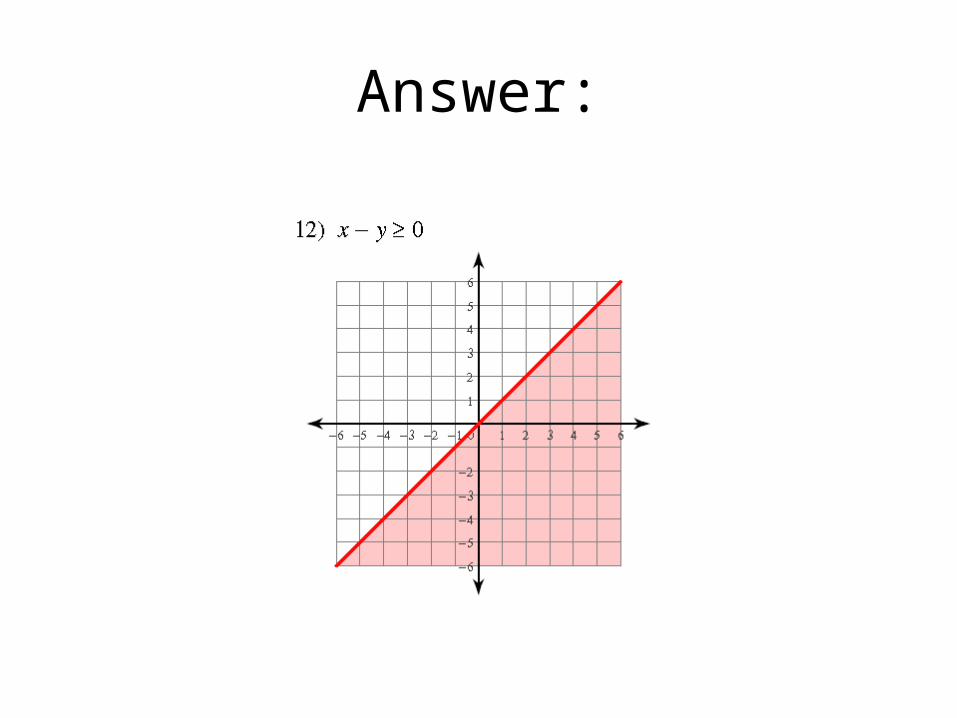
Answer:1. Will the line be solid or dashed? Solid
because ≥
2. Is the line in slope-intercept form? yes
3. What is the slope of the line? m = -2/1
4. What is the y-intercept of the line? b = -2
5. Where do you start when you graph? (0, -2)
6. How do you find another point on your line? From (0, -2) move down 2 spaces and right one space
7. Which side do you shade on? ≥ means shade above your y-intercept

Answer:

Answer:

Answer:


Answer:


Answer:

Answer:


Answer:


Answer:


Answer:

Answer:

Answer: