algonquin college - janet ladas1 community dental health
TRANSCRIPT
Algonquin College - Janet Ladas 1
COMMUNITY DENTAL HEALTHCOMMUNITY DENTAL HEALTH
Algonquin College - Janet Ladas 2
STATISTICSSTATISTICS
Statistics is the field of study which concerns itself with the art and science of data analysis:
• Planning, collecting, organizing, analyzing, interpreting, summarizing and presenting the data
Statistics, when used in the plural form, refers to the specific bits of data which either have been or are about to be gathered.
Algonquin College - Janet Ladas 3
STATISTICSSTATISTICS
Foreign Language:• Special meaning for words like mean, regression,
normal, confidence, correlation, population, discrete, conditional, union, posterior, hypothesis etc., etc., etc.
Logic related to statistics more than math. (H.S. Algebra) – computers
* Complex and demanding subject area
Algonquin College - Janet Ladas 4
INTRODUCTION TO INTRODUCTION TO BIOSTATISTICSBIOSTATISTICS
Biostatistics:The mathematics of collection, organization
and interpretation of numeric data having to do with living organisms.
Techniques to manage data:• Descriptive• Inferential
Algonquin College - Janet Ladas 5
INTRODUCTION TO INTRODUCTION TO BIOSTATISTICSBIOSTATISTICS
Uses for data: (To name a few)
• Designing a health care program or facility
• Evaluating the effectiveness of an ongoing program
• Determining needs of a specific population
• Evaluating the accuracy of a journal article
Algonquin College - Janet Ladas 6
EPIDEMIOLOGYEPIDEMIOLOGY
The scientific study of factors that influence the frequency and distribution of disease in a population.
Algonquin College - Janet Ladas 7
METHODS OF MEASURING METHODS OF MEASURING ORAL DISEASEORAL DISEASE
Counts:• A simple number of cases of occurrence• Useful when there is a low prevalence
e.g. 12 cases of oral cancer
Proportions:• A count can be turned into a proportion by adding a
denominator thus determining prevalencee.g. 12 cases in a population of 1,500 students
• Does not include a time dimension thus includes new cases as well as longstanding ones
Algonquin College - Janet Ladas 8
METHODS OF MEASURING METHODS OF MEASURING ORAL DISEASEORAL DISEASE
Rates:• A proportion that uses a standardized denominator
and includes a time dimension
Types of Rates: (As applied to Biostatistics)
Morbidity Rate:• The proportion of people ill with the disease over a
specified time span
formula: # of new cases /100,000 people / year
e.g.: 12 / 1,500 / 2000
Algonquin College - Janet Ladas 9
METHODS OF MEASURING METHODS OF MEASURING ORAL DISEASEORAL DISEASE
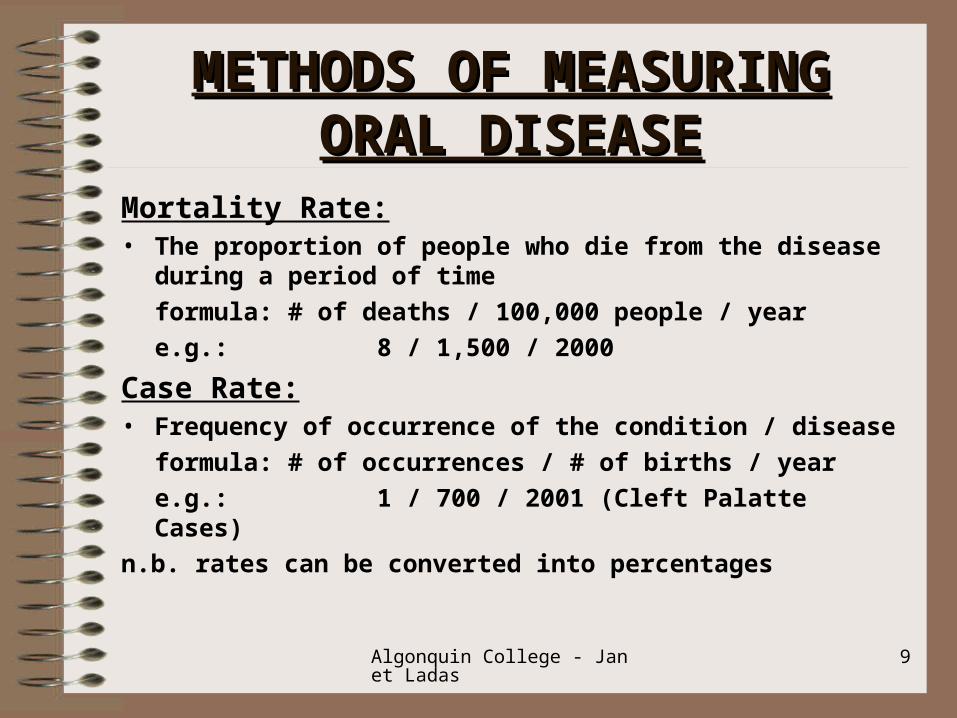
Mortality Rate:• The proportion of people who die from the disease during a
period of time
formula: # of deaths / 100,000 people / year
e.g.: 8 / 1,500 / 2000
Case Rate:• Frequency of occurrence of the condition / disease
formula: # of occurrences / # of births / year
e.g.: 1 / 700 / 2001 (Cleft Palatte Cases)
n.b. rates can be converted into percentages
Algonquin College - Janet Ladas 10
INDEXES (INDICES)INDEXES (INDICES)
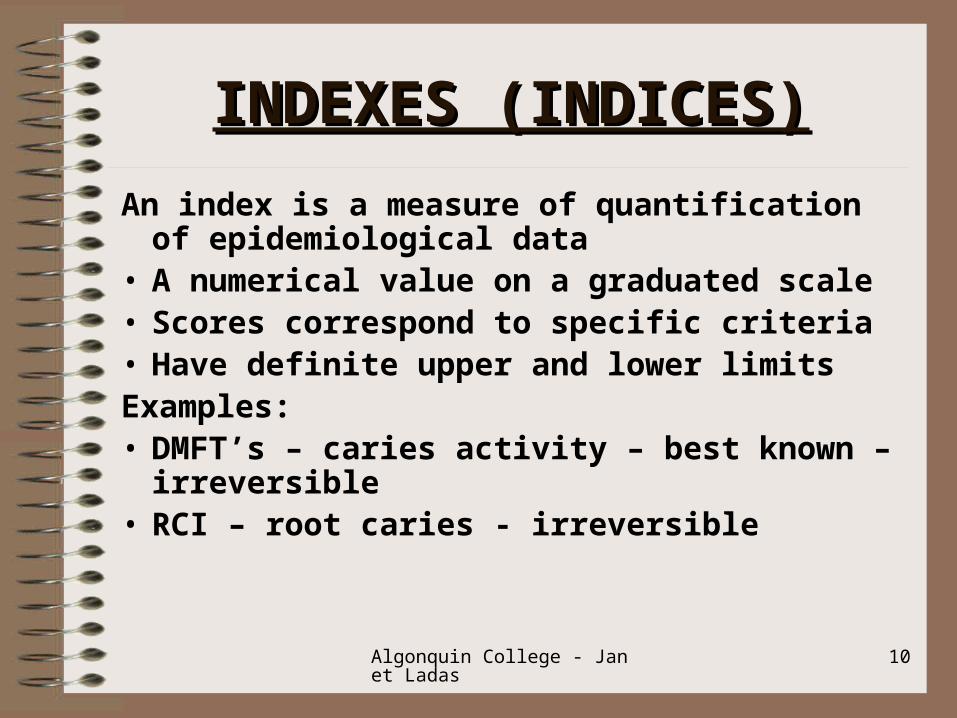
An index is a measure of quantification of epidemiological data
• A numerical value on a graduated scale• Scores correspond to specific criteria• Have definite upper and lower limitsExamples:• DMFT’s – caries activity – best known –
irreversible• RCI – root caries - irreversible
Algonquin College - Janet Ladas 11
INDEXES (INDICES)INDEXES (INDICES)
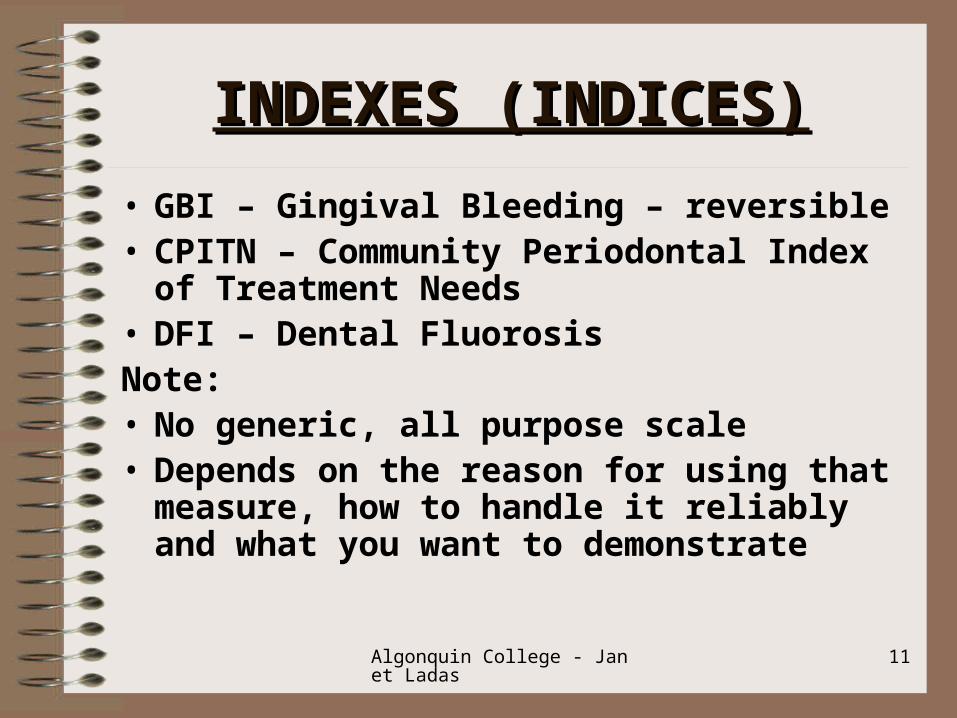
• GBI – Gingival Bleeding – reversible• CPITN – Community Periodontal Index of
Treatment Needs• DFI – Dental FluorosisNote:• No generic, all purpose scale• Depends on the reason for using that measure,
how to handle it reliably and what you want to demonstrate
Algonquin College - Janet Ladas 12
DENTAL HEALTH INDICESDENTAL HEALTH INDICES
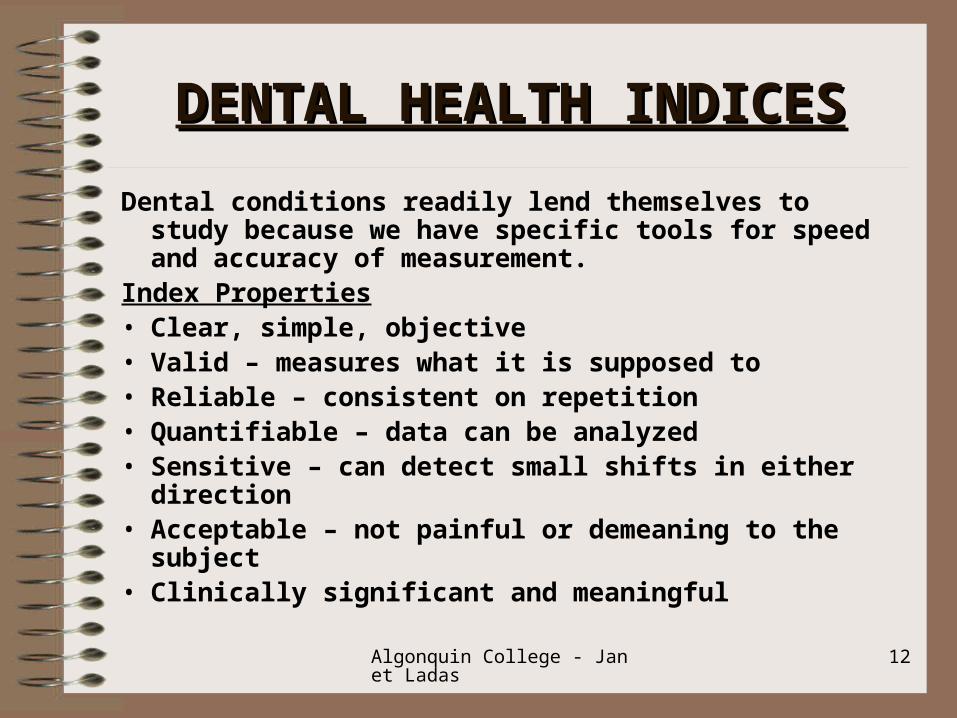
Dental conditions readily lend themselves to study because we have specific tools for speed and accuracy of measurement.
Index Properties• Clear, simple, objective• Valid – measures what it is supposed to• Reliable – consistent on repetition• Quantifiable – data can be analyzed• Sensitive – can detect small shifts in either direction• Acceptable – not painful or demeaning to the subject• Clinically significant and meaningful
Algonquin College - Janet Ladas 13
CARIES ACTIVITIES INDICESCARIES ACTIVITIES INDICES
DMFT : decayed, missing, filled permanent teethdeft : primary teeth• Each tooth must have a score but only one (DMF or sound)• Recurrent caries = decayed (D)• Missing teeth = extracted or due to be extracted due to caries• Teeth not deemed as missing = unerupted, congenitally absent,
accidentally lost or extracted for ortho. Purpose• Third molars not scored
DMFT and deft scores are objective thus require high agreement between examiners.
DMFS and defs (surfaces) are more subjective thus less reliable.
Algonquin College - Janet Ladas 14
FACTS ABOUT DATAFACTS ABOUT DATATwo types of data:Qualitative: labels used to identify an item when it cannot
be numerically identified.e.g.: marital status, car colour, occupation
(attributes)n.b.: has absolutely nothing to do with the quality of the data
Quantitative: characteristics that can be expressed numerically. Any mathematical manipulation that is carried out on them will have meaning.e.g.: height, length, volume, number of DMFT’s
(variates)
Algonquin College - Janet Ladas 15
FACTS ABOUT DATAFACTS ABOUT DATA
Data Set:
• Relates to a given group of data
• Generally denoted with brackets
e.g.: Q = {17, 15, 18, 13, 12}
Data Point:
• A single observation in a data set
e.g.: 15 is the second data point in the above data set
Data is Plural:
• Datum is singular
Algonquin College - Janet Ladas 16
FACTS ABOUT DATAFACTS ABOUT DATA
Raw Data:• Data still in the form that it was when
originally gathered.
e.g.: A = {14, 11, 17, 9, 12}
Rank Ordering:• Rearranging data in order – usually ascending
e.g.: A = {9, 11, 12, 14, 17}
Algonquin College - Janet Ladas 17
DATA MANAGEMENTDATA MANAGEMENT
Grouping data to make it easier to understand.
Descriptive Technique:• Used to describe and summarize a set of
numerical data• Tabular and graphical methods• Apply to generalizations made about the
group studied
Algonquin College - Janet Ladas 18
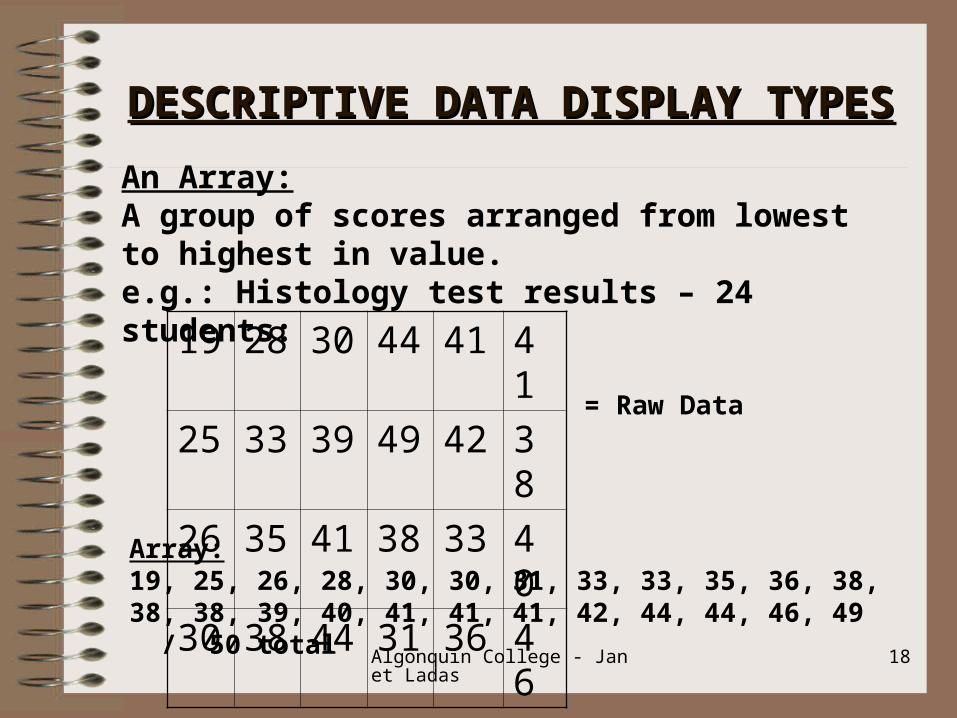
DESCRIPTIVE DATA DISPLAY TYPESDESCRIPTIVE DATA DISPLAY TYPES
19 28 30 44 41 41
25 33 39 49 42 38
26 35 41 38 33 40
30 38 44 31 36 46
An Array:A group of scores arranged from lowest to highest in value.e.g.: Histology test results – 24 students:
= Raw Data
Array:19, 25, 26, 28, 30, 30, 31, 33, 33, 35, 36, 38, 38, 38, 39, 40, 41, 41, 41, 42, 44, 44, 46, 49 / 50 total
Algonquin College - Janet Ladas 19
DESCRIPTIVE DATA DISPLAY TYPESDESCRIPTIVE DATA DISPLAY TYPES
Arrays are bulky and hard to read, thus an alternative is:
Frequency Distribution:
• An organization of scores from lowest to highest which includes the number of times each score value occurs in the data set.
Algonquin College - Janet Ladas 20
DESCRIPTIVE DATA DISPLAY TYPESDESCRIPTIVE DATA DISPLAY TYPES
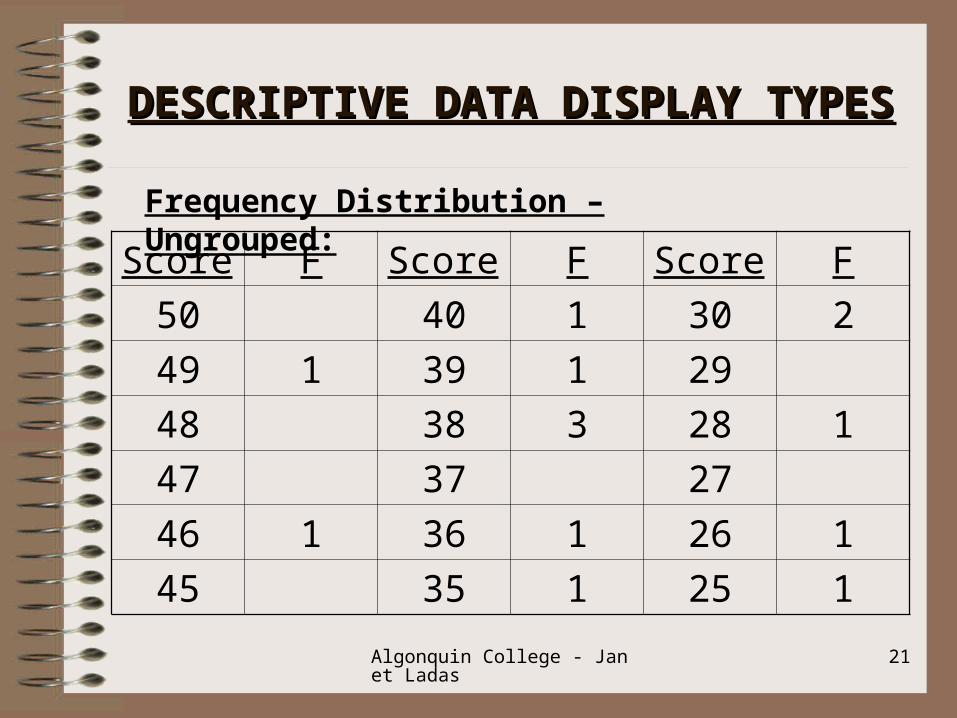
Frequency Distribution – 3 Types:1. Ungrouped• Each possible score value of the
variable being measured is represented in the display and the frequency of occurrence of the value is recorded. Sample:
Algonquin College - Janet Ladas 21
DESCRIPTIVE DATA DISPLAY TYPESDESCRIPTIVE DATA DISPLAY TYPES
Score F Score F Score F
50 40 1 30 2
49 1 39 1 29
48 38 3 28 1
47 37 27
46 1 36 1 26 1
45 35 1 25 1
Frequency Distribution – Ungrouped:
Algonquin College - Janet Ladas 22
DESCRIPTIVE DATA DISPLAY TYPESDESCRIPTIVE DATA DISPLAY TYPES
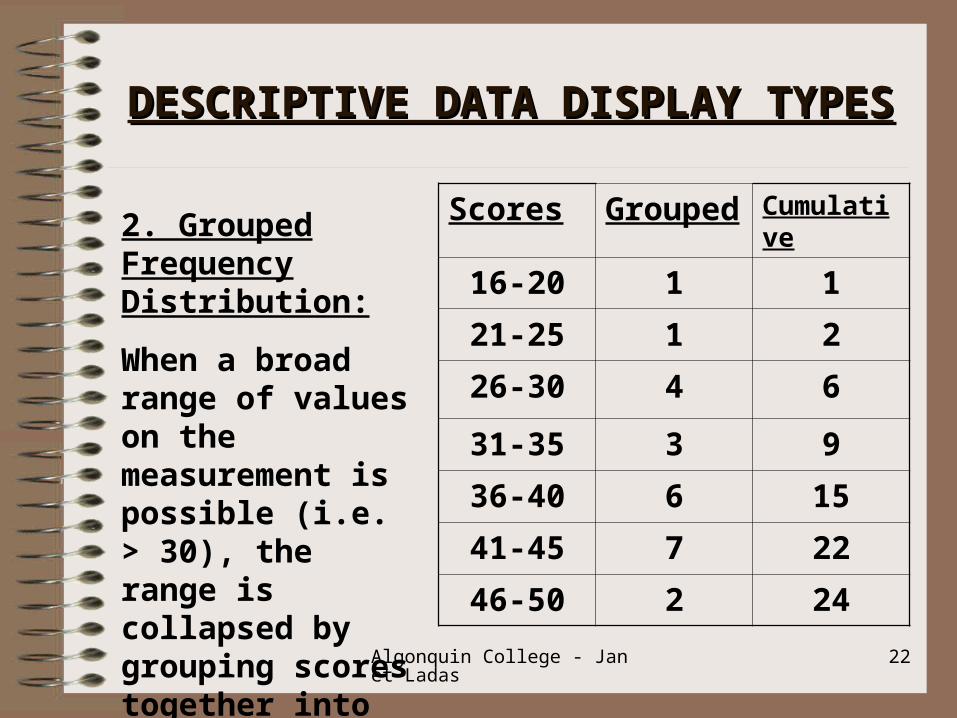
Scores Grouped Cumulative
16-20 1 1
21-25 1 2
26-30 4 6
31-35 3 9
36-40 6 15
41-45 7 22
46-50 2 24
2. Grouped Frequency Distribution:
When a broad range of values on the measurement is possible (i.e. > 30), the range is collapsed by grouping scores together into smaller value ranges.
Algonquin College - Janet Ladas 23
DESCRIPTIVE DATA DISPLAY TYPESDESCRIPTIVE DATA DISPLAY TYPES
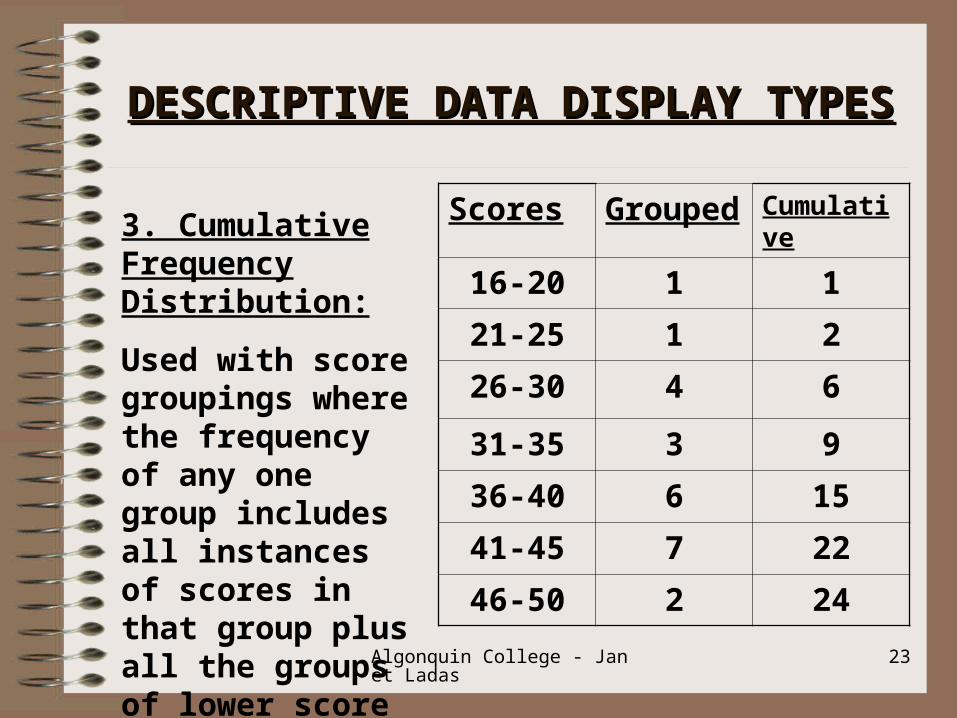
Scores Grouped Cumulative
16-20 1 1
21-25 1 2
26-30 4 6
31-35 3 9
36-40 6 15
41-45 7 22
46-50 2 24
3. Cumulative Frequency Distribution:
Used with score groupings where the frequency of any one group includes all instances of scores in that group plus all the groups of lower score values.
Algonquin College - Janet Ladas 24
GRAPHS AND TABLESGRAPHS AND TABLES
• Histograms
• Polygons – most frequently used
• Bar graphs
• Pie charts
Algonquin College - Janet Ladas 25
PRINCIPLES FOR CONSTRUCTING PRINCIPLES FOR CONSTRUCTING GRAPHS AND TABLESGRAPHS AND TABLES
(Course supplement Pages 6, 7, 8)1. Items in separate columns should be clearly
defined and the units of measure of the observation included
2. A suitable descriptive title should define the contents as a whole
3. Rate statistics clearly stated (per 100 or per 1,000)
4. When possible and practical, frequency distribution should be in full
Algonquin College - Janet Ladas 26
PRINCIPLES FOR CONSTRUCTING PRINCIPLES FOR CONSTRUCTING GRAPHS AND TABLESGRAPHS AND TABLES
5. When using rates or proportions, include numbers of observations
6. Clearly state when using percentage
7. Do not include too much on the same table
8. If observations are excluded, give reason and criteria
Algonquin College - Janet Ladas 27
GRAPHING TECHNIQUESGRAPHING TECHNIQUES
• Descriptive data in pictorial fashion as a graph
Y Axis (Ordinate) = vertical axis• Represents frequency of occurrence• Represents score valueX Axis (Abscissa) = horizontal axis• Represents scale of measurement of the
characteristic of the sample• Indicates the variable or group studied
Algonquin College - Janet Ladas 28
FREQUENCY HISTOGRAMFREQUENCY HISTOGRAM
See course supplement page 8.
• A histogram is a graphical method for variate (quantitative characteristic) data. Note that there is no space between the vertical bars.
Algonquin College - Janet Ladas 29
FREQUENCY POLYGONFREQUENCY POLYGON
See course supplement page 9.
• A line graph created by joining the frequency / scale value coordinate points for each value in the scale represented. Used for variate data.
Algonquin College - Janet Ladas 30
BAR GRAPHBAR GRAPH
See course supplement page 10.
2-dimensional pictorial display of attribute data that are discrete in nature
• Bars do not touch
Algonquin College - Janet Ladas 31
CENTRAL TENDENCYCENTRAL TENDENCY
Term in statistics that describes where the data set is located.
Measures of Central TendencyUsed to describe what is typical in the sample
group based on the data gathered.Three Main Indicators:- Mean
- Median- Mode
Algonquin College - Janet Ladas 32
CENTRAL TENDENCYCENTRAL TENDENCY
Mean = arithmetic average of scores
• Mean symbol is ( x )
• Scores are all added then divided by the number of scores.
• The most common measure:
Data set {3, 7, 9, 4, 9, 16} = 48 / 6 = 8
Algonquin College - Janet Ladas 33
CENTRAL TENDENCYCENTRAL TENDENCY
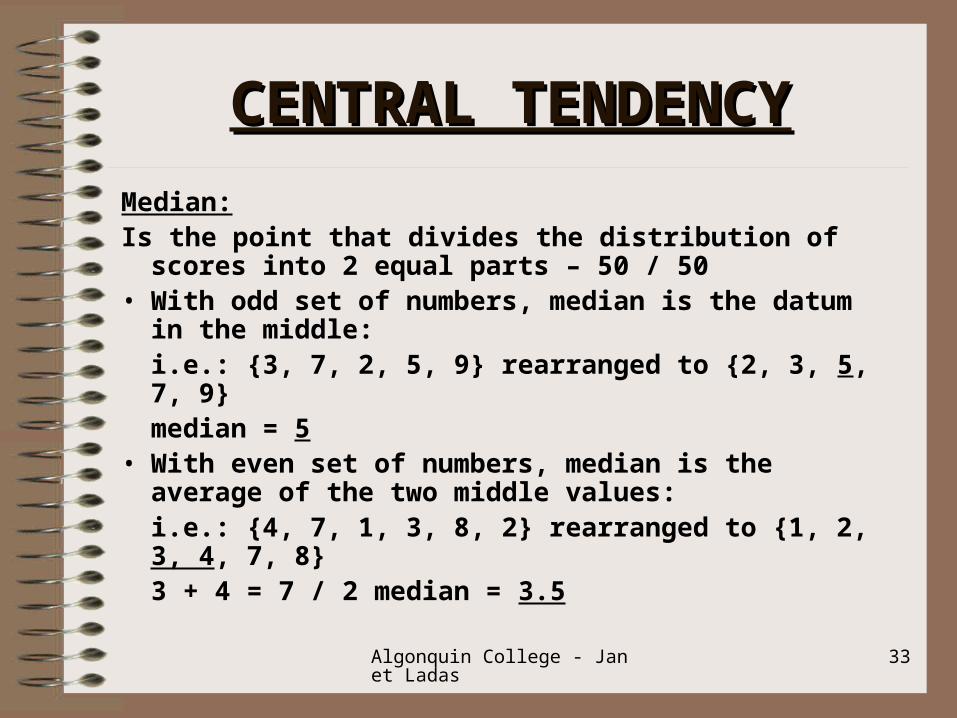
Median:Is the point that divides the distribution of scores into 2
equal parts – 50 / 50• With odd set of numbers, median is the datum in the
middle:i.e.: {3, 7, 2, 5, 9} rearranged to {2, 3, 5, 7, 9}median = 5
• With even set of numbers, median is the average of the two middle values:i.e.: {4, 7, 1, 3, 8, 2} rearranged to {1, 2, 3, 4, 7, 8}
3 + 4 = 7 / 2 median = 3.5
Algonquin College - Janet Ladas 34
CENTRAL TENDENCYCENTRAL TENDENCY
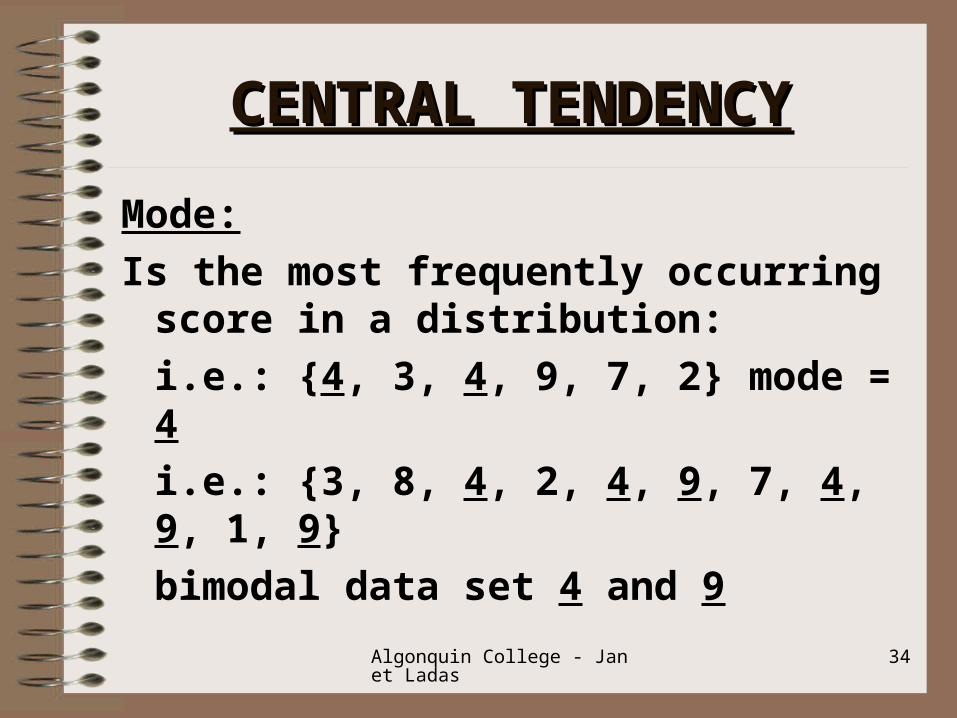
Mode:
Is the most frequently occurring score in a distribution:
i.e.: {4, 3, 4, 9, 7, 2} mode = 4
i.e.: {3, 8, 4, 2, 4, 9, 7, 4, 9, 1, 9}
bimodal data set 4 and 9
Algonquin College - Janet Ladas 35
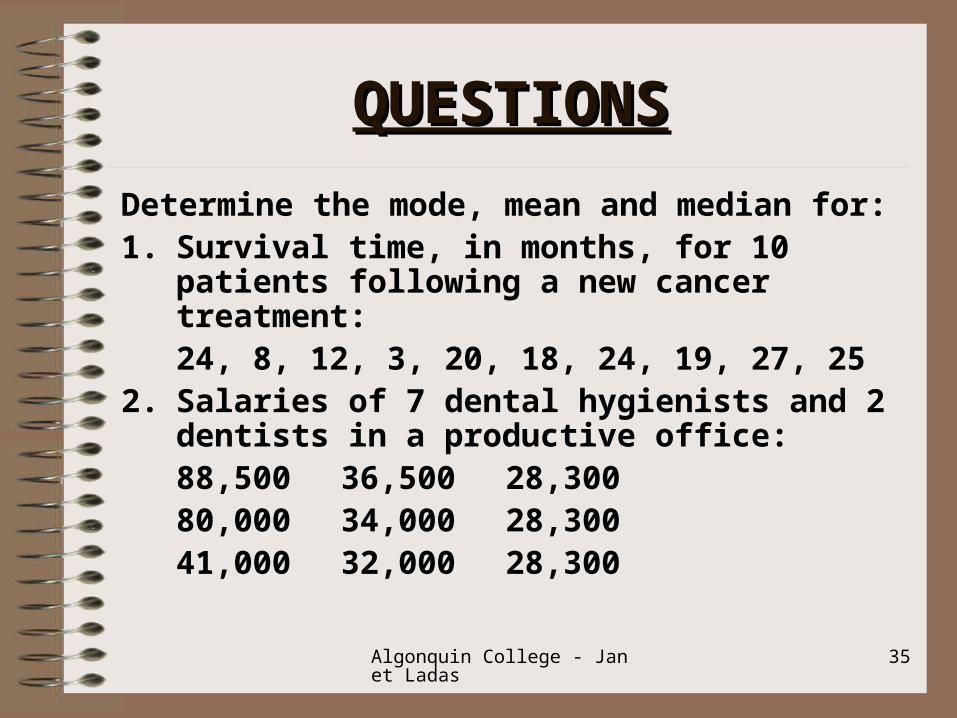
QUESTIONSQUESTIONS
Determine the mode, mean and median for:1. Survival time, in months, for 10 patients
following a new cancer treatment:24, 8, 12, 3, 20, 18, 24, 19, 27, 25
2. Salaries of 7 dental hygienists and 2 dentists in a productive office:88,500 36,500 28,30080,000 34,000 28,30041,000 32,000 28,300
Algonquin College - Janet Ladas 36
“If a statistician had her hair on fire and her feet in a block of ice, she would say that “on the average, she felt good.””
What is she referring to?
What is she ignoring?