algorithmaversioninscenarioswithacquisition and forfeiture
TRANSCRIPT

Linkoping University | Department of Computer and Information Science (IDA)
Bachelor’s thesis, 18 ECTS | Cognitive Science
Spring term 2021 | LIU-IDA/KOGVET-G–21/020–SE
Algorithm aversion in scenarios with acquisitionand forfeiture framing
Bjorn Stromstedt
Tutor: Daniel Vastfjall
Examiner: Rachel Ellis

Copyright
The publishers will keep this document online on the Internet –or its possible
replacement –for a period of 25 years starting from the date of publication barring
exceptional circumstances. The online availability of the document implies permanent
permission for anyone to read, to download, or to print out single copies for his/her
own use and to use it unchanged for noncommercial research and educational purpose.
Subsequent transfers of copyright cannot revoke this permission. All other uses of the
document are conditional upon the consent of the copyright owner. The publisher
has taken technical and administrative measures to assure authenticity, security and
accessibility. According to intellectual property law the author has the right to be
mentioned when his/her work is accessed as described above and to be protected against
infringement. For additional information about the Linkoping University Electronic
Press and its procedures for publication and for assurance of document integrity, please
refer to its www home page: http://www.ep.liu.se/.
© Bjorn Stromstedt

Abstract
Humankind is becoming increasingly dependent on algorithms in their everyday life.
Algorithmic decision support has existed since the entrance of computers but are
becoming more sophisticated with elements of Artificial Intelligence (AI). Though many
decision support systems outperform humans in many areas, e.g. in forecasting task, the
willingness to trust and use algorithmic decision support is lower than in a corresponding
human. Many factors have been investigated to why this algorithm aversion exists but
there is a gap in research about the effects of scenario characteristics. Results provided
by this study showed that people prefer recommendations from a human expert over
algorithmic decision support. This was also reflected in the self-perceived likelihood of
keeping a choice when the decision support recommended the other option, where the
likelihood was lower for the group with human expert as the decision support. The
results also showed that the decision supports, regardless of type, are more trusted by
the user in an acquisition framed scenario than in a forfeiture framed. However, very
limited support was found for the hypothesized interaction between decision support
and scenario type, where it was expected that algorithm aversion would be stronger for
forfeiture than acquisition scenarios. Moreover, the results showed that, independent of
the experimental manipulations, participants with a positive general attitude towards AI
had higher trust in algorithmic decision support. Together, these new results may be
valuable for future research into algorithm aversion but must also to be extended and
replicated using different scenarios and situations.

Contents
1 Introduction 1
1.1 Expectation and expertise . . . . . . . . . . . . . . . . . . . . . . . . . . 2
1.2 Decision autonomy . . . . . . . . . . . . . . . . . . . . . . . . . . . . . . 3
1.3 Cognitive compatibility . . . . . . . . . . . . . . . . . . . . . . . . . . . . 4
1.4 Task-dependent algorithm aversion . . . . . . . . . . . . . . . . . . . . . 4
1.5 Hedonic vs Utilitarian and Acquisition vs Forfeiture . . . . . . . . . . . . 5
1.6 Problem formulation . . . . . . . . . . . . . . . . . . . . . . . . . . . . . 6
2 Method 7
2.1 Design . . . . . . . . . . . . . . . . . . . . . . . . . . . . . . . . . . . . . 7
2.2 Procedure . . . . . . . . . . . . . . . . . . . . . . . . . . . . . . . . . . . 8
2.3 Participants . . . . . . . . . . . . . . . . . . . . . . . . . . . . . . . . . . 10
2.4 Materials . . . . . . . . . . . . . . . . . . . . . . . . . . . . . . . . . . . 11
2.5 Ethics . . . . . . . . . . . . . . . . . . . . . . . . . . . . . . . . . . . . . 11
2.6 Data Analysis . . . . . . . . . . . . . . . . . . . . . . . . . . . . . . . . . 12
3 Results 13
3.1 Scenarios . . . . . . . . . . . . . . . . . . . . . . . . . . . . . . . . . . . . 13
3.1.1 Trust . . . . . . . . . . . . . . . . . . . . . . . . . . . . . . . . . . 13
3.1.2 Keep the option . . . . . . . . . . . . . . . . . . . . . . . . . . . . 14
3.1.3 Change the option . . . . . . . . . . . . . . . . . . . . . . . . . . 14
3.1.4 Reasoning . . . . . . . . . . . . . . . . . . . . . . . . . . . . . . . 15
3.1.5 Chosen option . . . . . . . . . . . . . . . . . . . . . . . . . . . . . 16
3.2 General Attitude towards Artificial Intelligence . . . . . . . . . . . . . . 17
4 Discussion 17
4.1 Results . . . . . . . . . . . . . . . . . . . . . . . . . . . . . . . . . . . . . 17
4.1.1 Trust in decision support . . . . . . . . . . . . . . . . . . . . . . . 17
4.1.2 Attitude towards AI and trust . . . . . . . . . . . . . . . . . . . . 19
4.1.3 Decision support recommendation effect . . . . . . . . . . . . . . 19
4.1.4 Reasoning . . . . . . . . . . . . . . . . . . . . . . . . . . . . . . . 21
4.2 Method . . . . . . . . . . . . . . . . . . . . . . . . . . . . . . . . . . . . 22
4.3 Future Research . . . . . . . . . . . . . . . . . . . . . . . . . . . . . . . . 23
5 Conclusion 24
6 References 25
1 Introduction
Since the computer’s entry into modern society, efforts have been made to use the
computer as an aid in making decisions. When making qualified decisions in uncertain
environments, specific area of knowledge and analytical skills as well as expert
assessments are all required to make well-motivated decisions (Ireland & Dempster,
1988). Parts of this decision-making process makes use of digital decision support
systems that can provide automated calculations and data analysis. However, these
decision support systems rely on knowledgeable users to control system operations to
interpret the results produced in the process. According to several IT-managers and
practitioners in the relevant fields, the pile of technological tools has become increasingly
higher over time, which makes it exponentially more complex and challenging to handle
(Araujo, 2019).
This challenge may find its solution with the help of new technologies, there
amongst Artificial Intelligence (AI). These new technologies involve, for example,
expert system technology which, by modeling knowledge and reasoning from human
experts, incorporates model management and interpretive knowledge into the decision
support systems. This example would mean that complex modeling techniques would
be more accessible to the user and reduce the requirement for expert knowledge (Ireland
& Dempster, 1988). These kinds of systems are called Intelligent Decision Support
Systems and can be used for such areas as medical diagnosis and marketing to increase
accuracy and reliability in tasks which require more human abilities. The shortcomings
of the earlier systems are their inability to respond uncertainty and novelty. In an ever
changing world where the contextual environment continuously evolve, the decision
support system can quickly become obsolete to the new setting. To counter this problem,
the decision support systems have increasingly used new techniques such as knowledge
sharing, machine learning, data mining to achieve a more flexible system which adapts
itself to a dynamic world.
The increasing availability of digital tools such as smartphones and personal computers
have made decision support systems more accessible in commonplace contexts. Deciding
on which route to take during the morning rush hour with the help of an intelligent
GPS-guide to reduce travel time or deciding on what movie to watch by searching
through your ”recommended-list” are frequently used decision support systems which
has come to influence everyday decisions. Since intelligent decision support systems
are becoming increasingly sophisticated at the same time as availability, more decisions
support systems may be created for new everyday areas.
1

However, there is some resistance to implementing evidence-based algorithms which can
considered to be built on AI. The basis for the reluctance for the implementation of such
systems can partly be due to the users’ attitude towards AI and algorithms, which have
been researched as AI- or algorithm aversion - the reluctance of human decision makers
to use superior but imperfect algorithms. There are a number of studies that have shown
that the attitude towards AI-based forecasts versus forecasts made by human expert is
disparate (Dietvorst, Simmons & Massey, 2015; Yeomans et al., 2019; Logg, Minson &
Moore, 2019). Although AI may perform better forecasts, we usually rely more in favor
of the human expert. Why and when this happens, however, is not yet fully understood.
In recent years research have started go give answers to this field of research.
1.1 Expectation and expertise
A theme of research in algorithm aversion attend to the expectation and expertise aspect
to algorithm aversion. This concerns the human decision makers expected performance
and capabilities of the decision support system. When in a situation that someone may
use an algorithmic decision support system, the human decision maker ought to have built
up expectations to what capabilities the system may possess. The human decision maker
must also have some kind of mental model or knowledge to how the algorithm works
(Prahl & Van Swol, 2017). The construction of the expectations may be the consequence
from earlier experience in the domain or knowledge gained from coworkers, friends, or
media. These preexisting expectations is ultimately the paradigm in which decision
makers will perceive and act to recommendations given by the algorithmic decision
support. Research has shown that humans seek a social relationship with the source of
the advice, which is problematic when shaping relationships with computer algorithms
do not have the same prerequisites to be established, which is an underlying cause why
recommendations given by human experts will be perceived differently even though the
same recommendation is generated (Alexander, Blinder, & Zak, 2018; Onkal et al., 2009).
The expectations of an algorithmic decision support have a lower threshold for
losing trust than a human decision support, research has shown (Dietvorst, Simmons, &
Massey, 2018). Even though some evidence-based algorithms may predict the incoming
future better than human forecasters, humans tend to trust a human forecaster more
than the algorithm after having seen them perform (Dietvorst et al., 2015). If the
algorithm makes an error, even if the error is the same performed by a human, the
confidence for the algorithm decreases more. This was true in Dietvorst study from
2015 even in the group where the participants saw the algorithm outperform the human
forecaster. In conclusion, the expectations of the human user have a large influence in
the interaction with algorithmic decision support on how the algorithm will be utilized
2

when practicing the field of work.
The level of expertise is also an independent variable to the utilization of algorithmic
decision support. Jane Mackay and Joyce Elam (1992) made a comparative study
about how experts and novices makes use of decision aid to solve problems in complex
knowledge domains in a business-oriented task. The results from the study showed that
a lack of expertise in the decision support system usage inhibited the application of
functional area knowledge. The conclusion made from the results captured in the study
indicates that individuals benefit from gaining expertise in using a decision support
before they can apply their functional area knowledge to the domain which the problem
pertain to. Even though the human decision maker may have the necessary knowledge
to make a qualified recommendation or choice, expertise on how to use the decision
support depends on the level of expertise in the system. The problem with expectations
may also be linked to individual differences in other skills associated with technological
expertise such as computing experience, demographics etc.
Moreover, to increase the use of superior algorithmic decision support, the decision
maker requires extra motivation to make use of the support. Since using a decision
support involves combining multiple judgments, incentivization is needed (Brown,
2015). By increasing the knowledge of the user by sharing previous use information and
performance of decision aid usage causes a higher adaptation of algorithmic decision
support usage (Alexander et al., 2018).
1.2 Decision autonomy
Another contributing factor to algorithmic aversion can be found in the experience
of decision autonomy. In order for a human decision maker to execute or act on a
recommendation given by an algorithmic decision support, the decision maker must be
incentivized to a feeling of confidence in the recommendation (Colarelli & Thompson,
2008). This could be a product of the level of experience and expertise in the decision
support system, but also having the freedom to adjust the algorithmic decision-making
process (Sherer et al., 2015). This is true even if the actual functioning of the algorithm is
not affected by the adjustment. These adjustments may involve, e.g. how the presentation
of information is carried out (Carey & Kacmar, 2003). The decision support system
may be calibrated according to factors such as dependability, reciprocity, predictability,
technical competence, and morality to give the human decision maker a feeling of support
rather than a possibility of diverging volition or malicious intent from the algorithm (Muir,
1987). Human decision makers also assumes that the used decision support should make
slow and effortful considerations when making recommendations in high-stakes scenarios,
3
even though this is not necessary for good decision making (Scherer et al., 2015). Thus,
artificially adding human attributes to algorithmic decision-making processes may have
a positive effect on the trust for the decision support. As Stephen Colarelli and Matthew
Thompson argued (2008), that stubborn reliance on human nature of decision support
is evolutionarily novel, in an employee selection context together with statistical decision
aid. The same context was researched by Highhouse (2008) where he concluded that
human have a stubborn reliance on intuition and subjectivity during employee selection.
1.3 Cognitive compatibility
The adoption of algorithmic decision support involves combining multiple judgements
which may increase complexity to a novice user. This means that an integration of two
decision processes is inevitable and must be accounted for when researching algorithm
aversion. To make decisions together with an algorithmic decision support optimal, an
alignment of the decision processes is crucial. The latest in research about cognitive
compatibility with augmented decision support have focused on identifying the heuristics
and biases associated with algorithmic decision support usage and how these may prevent
decision makers from using theses in an efficient manner (Burton, Stein & Jensen, 2020;
Brown, 2015). For the decision support the effectively make usable recommendation for
the decision maker, the decision support must be adapted to the decision makers mental
processes and understand the intuition behind the decision makers choices. This can
be difficult since the heuristics and biases used by humans may seem like a black box
and difficult to be made descriptive. Even though, a mapping of relevant heuristics and
biases may aid in the edification of decision support systems may benefit the cognitive
compatibility in decision making processes to increase trust and decision autonomy.
1.4 Task-dependent algorithm aversion
Given the above mentioned factors contributing for algorithmic aversion, these could
work in tandem with external factors such as task or scenario characteristics. This
research is interested in these characteristics with the mentioned empirical evidence
as a foundation. Research have shown that algorithmic decision support is trusted
differently depending on the characteristics of the task (Castelo et al., 2019). Castelo
and his co-writers investigated if there were any difference in willingness to trust and
use algorithmic decision support in two different scenario framings, subjective versus
objective. The difference between the two framings is that objective tasks are defined as
involving facts that are quantifiable and measurable while the subjective task is defined
as being open to interpretation and based on personal opinion or intuition (Inbar, Cone
& Gilovich 2010). Since affect influence human decision making depending on the nature
of the task, may the supporting algorithm be perceived as more or less suitable and
4
reliable as decision support. The study found that algorithms are trusted and relied on
less for tasks that seem subjective in nature. However, they show that perceived task
objectivity is malleable and that increasing tasks perceived objectivity increases trust
in and use of algorithms for a certain task. The research showed that the consumers
mistakenly believe that algorithms lack the abilities required to perform subjective tasks,
which lead to a decreased sense of reliability towards the algorithm. This goes in line
with similar research, which concluded that humans rely more on algorithmic decision
support more than humans in numerical tasks with an objective answer (Logg, Minson
& Moore, 2019) but rely on humans more when subjected to the task of predicting a
joke’s funniness (Yeomans et al., 2019).
As earlier mentioned, subjective task can be associated with ”gut feeling”. We
humans makes use of gut feeling when making certain difficult decisions (Kahneman,
Slovic & Tversky 1982). The gut feeling is described by Kahneman as a heuristic,
which is a simple mental process that humans use to make and base their decisions on.
Rationality may not always be the effective or even right way to go when facing difficult
decision, which would require enormous amounts of computing and information retrieval.
Affect plays a major role when it comes to decision making and has proven to be induced
when limiting the decision makers time to decide (Finucane et al., 2000). The study,
which investigates the affect heuristic in judgements of risks and benefits, suggests that
” ...people are prone to using an ’affect heuristic’ which improves judgmental efficiency
by deriving both risk and benefit evaluations from a common source - affective reactions
to the stimulus item.”. Affective reactions towards AI are inescapable and have been a
topic for discussion at many levels with divided attitudes. As been suggested by previous
studies, the inability to attribute algorithmic decision support with capabilities which
can be associated as prerequisites for decision making in subjective tasks influences on
trust towards the decision support. But the nature of a subjective task can take many
shapes and forms by which this study aims to elaborate further on. Intrapersonal trust
has shown to have cognitive and affective dimension in consumer-level services (Johnson
& Grayson, 2005), whereas the cognitive trust involves confidence in another agent’s
reliability along with performance, and affective trust is based on one’s feeling towards
the agent. This theory of trust can be important to keep in mind whereas proof have
been presented that trust in algorithms may be inferior in both dimensions compared to
humans, in certain tasks.
1.5 Hedonic vs Utilitarian and Acquisition vs Forfeiture
With knowledge about different factors affecting algorithm aversion, there is still a
knowledge gap in how different attributes and features of a scenario may contribute to
5

algorithm aversion. To build upon these recent findings this study aims to incorporate
research which further elaborate on subjective and objective attributes. A study made
in 2000 by Ravi Dahr and Klaus Wertenbroch examined how consumer choices between
hedonic and utilitarian goods is influenced by the nature of the decision task. When it
comes to consumer choices, they are driven by a magnitude of factors, just as algorithm
aversion, and the research suggest that these different considerations affect independent
components of product evaluations and attitudes. Consumers choosing between new
cars may care about utilitarian features as well as hedonic attributes but may put
different emphasis on these features and attributes in different situations (Batra &
Ahtola, 1991; Mano & Oliver 1993). As per definition, the utilitarian features and goods
are primarily functional and instrumental which fulfills a useful purpose, whereas the
hedonic attributes and goods are consumed as a experiential purpose. What Dahr and
Wertenbroch contributed to this field of research was that they compared preferences
for these goods in an acquisition and forfeiture framing, where the consumer had to
choose to acquire either a hedonic attribute or utilitarian feature. In the forfeiture
framing, the consumer must choose to give up either the attribute or the feature. In the
acquisition framing, the consumer must choose to acquire either the hedonic attribute
or utilitarian feature. What they showed through their experiments was that it exists
an asymmetry in how consumers trade off these dimensions in forfeiture and acquisition
choices. The forfeiture choices showed an increase in the ”importance” of the hedonic
aspects compared to the utilitarian feature. The asymmetry was less apparent when
during the acquisition scenario.
The researchers of this study relied on the theory formulated by Tversky and
Kahneman in 1991 called loss aversion. This theory has been well used withing
economics and decision theory, which refers to peoples strong tendency to avoid losses
rather than making profit. This can be associated with risk aversion, when people value
outcomes that have similar gains and losses, as people prefer to minimize losses rather
than maximize profits (Kahneman & Tversky, 1979). The conclusion from these findings
by Tversky and Kahneman is that an item that is to be traded is generally valued more
when it is already acquired (in your possession) than when it is not. That question still
remains and have not yet been answered if these findings apply when making use of
some kind of decision support. Can we frame situations where decision must be made in
cooperation with a decision support and see the same effect of loss aversion?
1.6 Problem formulation
These empirical evidences about algorithm aversion and how different factors and
scenario framings affect consumer choices have not yet been explored in a joined context.
6
As previously noted, this study aims to elaborate further on the trust aspect of using
algorithmic decision support systems in various scenarios. By using the validated
paradigms from Castelo and Dhar and fusing these together, this research may answer
the question how trust in algorithms may differ in acquisition and forfeiture scenarios
in relation to a human decision support. The previous research shows that algorithmic
decision support is less trusted than a human expert in subjective scenarios (affected
by affection), together with the knowledge that feelings are more present at a forfeiture
scenario, should then there be a reason to believe that trust in algorithmic decision
support will be affected differently compared to a human expert. The same goes for
acting upon the recommendations the decision support outputs, given the same factors.
Hypotheses:
• There is an interaction in the amount of trust between type of decision support
and scenario framing. There will be a larger difference in trust between algorithmic
decision support (lower trust) and a human experts (higher trust) in a forfeiture
framed scenario than in a acquisition frame scenario.
• A interaction will exist in how much the decision support recommendation affect
the decision making depending on type of decision support and scenario framing.
The likelihood of keeping the chosen option when receiving a recommendation to
chose the other option will increase more for someone with an algorithmic decision
support recommendation than a human expert in a forfeiture frame scenario.
2 Method
In the first part of this section, a thorough presentation of design choices, participants and
the sample recruitment process will set the foundation for further explanation of materials
and procedure which constitute this study. The ethical evaluations and considerations
concerning the design and data collection are conferred to justify certain design choices
and the nature of the research in co-ordinance with scientific principles and guidelines.
Lastly a depiction of the collected data and analytical instruments are given for the reader
to ensure correct analysis have been implemented.
2.1 Design
To answer the earlier mentioned research questions, the research design was created by
fusing two already proven paradigms from Dhars’ and Castelos’ studies. Both studies,
and this study, uses a quantitative method with between group design in order to see
mean and frequency differences between the groups.
7

Dhar and Wertenbroch did several different experiments in their study which all
served different purposes, but experiment three (”Reference effects in choices between
hedonic and utilitarian goods”, page 65-67 in the paper) is most relevant for this study.
Similar to their study, this study is based on different scenarios with two different kinds
of framing - acquisition and forfeiture. The scenarios with acquisition framing have the
trait that the participant is facing a dilemma where a decision must be made to either
lose a hedonic attribute or utilitarian feature. The scenarios with forfeiture framing
have the trait that the participant is facing a dilemma where a decision must be made
to lose either a hedonic attribute or utilitarian feature. An overview of all scenarios in
respective framing is available in the Appendix. Four out of the six scenarios were taken
from Dhar and Wertenbrochs’ study and two were created with inspiration from the
originals in order to get more reliable data and validate the responses by the participants.
The scenarios were given short names for identification: Event, Car, Shampoo, Lunch,
Coworker, Apartment.
To measure trust towards the assigned decision support, inspiration from Castelos’
research article was taken by asking the participant on a scale from 0-100 how much they
would trust their assigned decision support. Just as Castelo, this study makes use of the
self-perceived type of reasoning when making a decision. This study modified this 0-100
scale to represent how much the participant used emotional versus analytical reasoning.
This enables for the data analysis to investigate if type of reasoning if different when
making a decision if a scenario with different framing and decision support.
2.2 Procedure
As a first step, the participants were presented a page containing an informed consent
form, explaining the purpose of the study, how the collected information and data will
be handled, estimated time to complete the questionnaire and that participating is
voluntary. In order to continue, the participant had to give consent by selecting the
”yes” alternative when asked if they read the information and accept the prerequisites.
The following page collected information about age and preferred sex.
Depending on which group the participant was randomly appointed to, a definition of
”AI decision support” or ”Very qualified person” was presented in order to set a common
understanding between the participants about the concepts. ”A decision support system
is often a computerized program used to support determinations, judgements and courses
of action in an organization or business. A decision support system sifts through and
analyses massive amounts of data, compiling comprehensive information that can be
8

used to solve problems and in decision-making. Since the decision support systems are
becoming more sophisticated it have become synonymous with using Artificial Intelligence
(AI) as decision support. When encountering the word AI in this survey, this is what
it is refers to.” was used for the AI-groups and ”A very qualified person can be a
practitioner/professional within a specific field which you may seek advice from when you
have to make a difficult decision. When encountering the word ”very qualified person”
in this survey, this is what it is refers to.” for the other group.
The participant was then presented the scenarios, one at a time, in a randomized
order. Four question associated with each scenario were presented, each one of them
required a response in order to continue to the next scenario. The questions were ”For
this task, how much would you trust an AI to assist you in the decision making?”,
”Which option would you have chosen?”, ”How likely would you change your decision if
the AI/a very qualified person recommended the other option?”, ”How likely would it be
for you to keep your decision if the AI/very qualified person recommended your option?”.
The first, third and fourth question was answered by the participant by moving a slider
to the desired locus on an interval between 0 and 100. The interval was also labeled with
five corresponding labels for reference to the numeric interval. The second question, the
participant had to choose one of the two alternatives given in the scenario.
After all scenarios were completed, the participants were to rate their reasoning
on a 0-100 scale where 0 is ”Only feelings” and 100 ”Only analytical reasoning” for each
scenario. This was used as a manipulation control to see if the framing of the scenarios
affected the participants reasoning which should affect the trust towards the decision
support.
To measure the participants attitude towards Artificial Intelligence, the validated
(Schepman & Rodway, 2020) General Attitudes towards Artificial Intelligence Scale
(GAAIS) was used. This scale makes use of 20 items composed as statements the
participant must take a stand towards on a 5-point Likert scale range between ”Strongly
agree” and ”Strongly disagree”. 12 out of the 20 questions have a positive framing
towards AI, e.g. ”Artificial Intelligence is exciting”, and the remaining 8 have a negative
framing, e.g. ”I think Artificial Intelligence is dangerous”. This scale is considered as
well suitable since it captures both the cognitive and affective dimensions of attitude
towards AI.
Randomly during the questionnaire, all participants faced an attention check-question.
This was to make sure that the participants were paying attention to the survey
questions. The instructions were as follows; To make sure you are attentive to the survey
9

questions, choose the option with the numerical value ”4”. If the participant fails to do
what the instruction tell them, their data are excluded from the data analysis.
2.3 Participants
The survey participants were recruited through the participant recruitment website
Prolific with a sample consisting of United States citizens living in the U.S and who are
fluent English speakers . 620 participants opened the survey whereas 610 finished it and
gave their informed consent.
To sift out participants which have followed out the survey answering the questions
without consideration, also known as ”click-throughers”, the duration of survey
completion was given fixed thresholds which the participant has to finish within. The
minimum time the participant could have finished this survey was set to 120 seconds.
Pre-test were made to investigate reasonable time-completion and found that no
participant were to be able to read all instructions and answer the survey questions
in under 120 seconds. The maximum duration for completing the survey was set to
1000 seconds. This was due to the survey questions which asked the participant to
reflect on how much ”feelings” or ”analytical reasoning” the participant had used during
the decision making in each scenario. If too much time have elapsed, the participant
might have forgot the reasoning for the decision, the scenario itself or something similar.
After this exclusion, 569 participants were left with duration to completion M = 431
seconds. The age of the participants ranged from 18 to 79 years old (M = 35.9, SD = 12.3)
The participants were randomly assigned into one of the four groups. The groups’
specifications are described in Table 1 below.
Group specifications
Variable Group 1 Group 2 Group 3 Group 4
Decision
Support
AI AI Qualified
Person
Qualified
Person
Framing Acquisition Forfeiture Acquisition Forfeiture
Table 1. An over-view of which factors each group pertain.
10
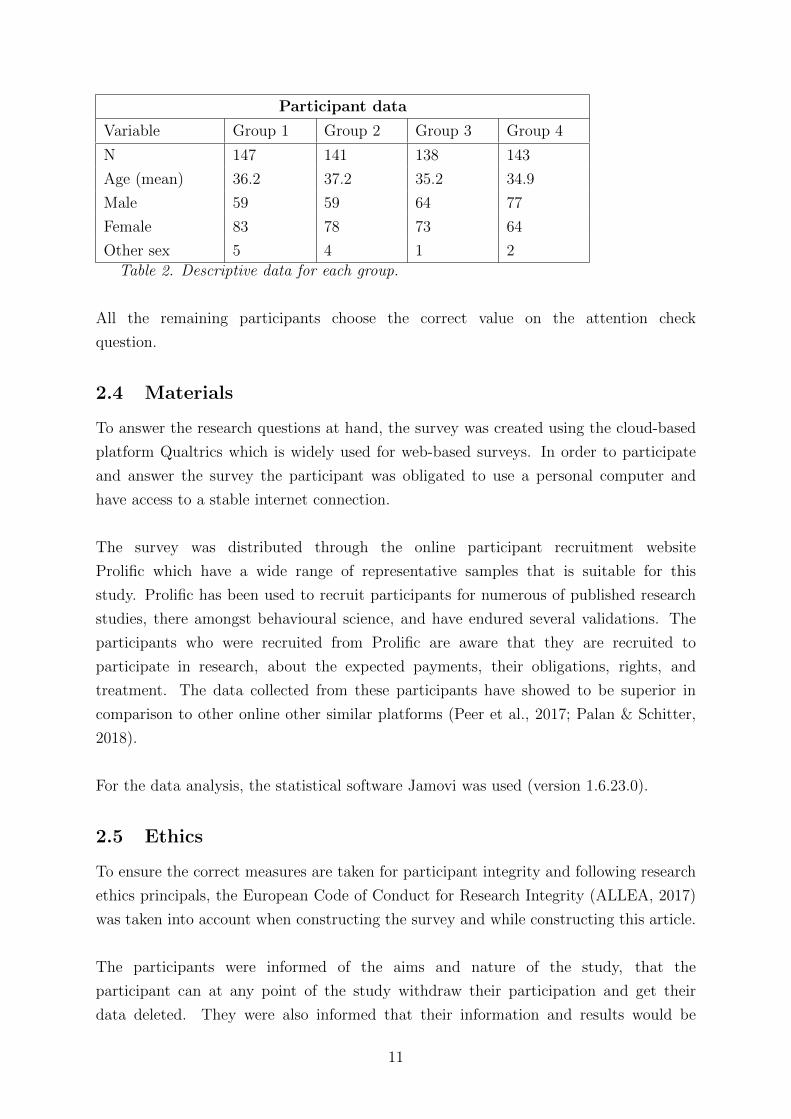
Participant data
Variable Group 1 Group 2 Group 3 Group 4
N 147 141 138 143
Age (mean) 36.2 37.2 35.2 34.9
Male 59 59 64 77
Female 83 78 73 64
Other sex 5 4 1 2
Table 2. Descriptive data for each group.
All the remaining participants choose the correct value on the attention check
question.
2.4 Materials
To answer the research questions at hand, the survey was created using the cloud-based
platform Qualtrics which is widely used for web-based surveys. In order to participate
and answer the survey the participant was obligated to use a personal computer and
have access to a stable internet connection.
The survey was distributed through the online participant recruitment website
Prolific which have a wide range of representative samples that is suitable for this
study. Prolific has been used to recruit participants for numerous of published research
studies, there amongst behavioural science, and have endured several validations. The
participants who were recruited from Prolific are aware that they are recruited to
participate in research, about the expected payments, their obligations, rights, and
treatment. The data collected from these participants have showed to be superior in
comparison to other online other similar platforms (Peer et al., 2017; Palan & Schitter,
2018).
For the data analysis, the statistical software Jamovi was used (version 1.6.23.0).
2.5 Ethics
To ensure the correct measures are taken for participant integrity and following research
ethics principals, the European Code of Conduct for Research Integrity (ALLEA, 2017)
was taken into account when constructing the survey and while constructing this article.
The participants were informed of the aims and nature of the study, that the
participant can at any point of the study withdraw their participation and get their
data deleted. They were also informed that their information and results would be
11

treated in accordance with GDPR-regulations. An explanation of how the survey would
be conducted was given. The contact information to the survey originator was given in
case the participant desired to ask additional questions etc. This study also follows the
Ethics Review Act (2003: 460).
2.6 Data Analysis
The data was collected as numerical data where all alternatives, scales etc., were
converted into integers. Variables such as group designation (group 1 = 1, group 2 = 2,
group 3 = 3, group 4 = 4), framing (acquisition = 1, forfeiture = 2), decision support
type (AI = AI, human expert = H.E) were given dummy variables.
To investigate the difference in trust between the four experimental groups, analysis of
variance (ANOVA) was conducted on the survey questions regarding trust in assigned
decision support, likelihood of changing and keeping decision depending on decision
support recommendation. The ANOVAs were conducted on each scenario to see if there
were any significant differences between scenarios due to the design of the scenarios.
Even tough normality tests (Shapiro-Wilks) showed that the data deviated from the
normality, the ANOVAs were all parametric. Ocular inspection of the distributions
indicated this deviation but had an overall bell-shaped curve. It was a conscious decision
to depart from the established assumptions regarding ANOVA with justified reasons.
The parametric tests can perform well with non-normal and skewed distributions where
sample sizes are large (>20) (Fargerland & Sandvik, 2009). Since the analysis are
conducted on continues data and large sample size, the parametric testing is better
equipped to detect significant effects when they truly exist. The tests for homogeneity
of variance (Levene’s) all showed p-values greater than .05 which fulfills the assumption
regarding variance.
For the analysis of the General Attitude towards Artificial Intelligence Scale (GAAIS)
score, only the positive framed questions were used in order to achieve a score which
would be apply-able to a correlation with trust since all GAAIS questions, positive and
negative, are answered on the same scale (Strongly disagree (1) - Strongly agree (5)).
The mean of all answers was calculated for each participant which then was put in the
Pearson correlation tests. Pearson correlation is a measure of the linear relationship
between two continuous random variables.
Chi-square tests is used to determine if there is a statistically significant difference
between choices in the acquisition and forfeiture groups.
12
Independent T-test is used to investigate if there is a difference in the means in
reasoning scoring between the two framing groups. A parametric test is used, though
the data departs from normality, since the sample size is large enough for a parametric
test to be regarded as robust (Fargerland & Sandvik, 2009).
3 Results
3.1 Scenarios
As mentioned earlier, the six scenarios were all analyzed individually. The results from
the data analysis have been divided into subsections in this section.
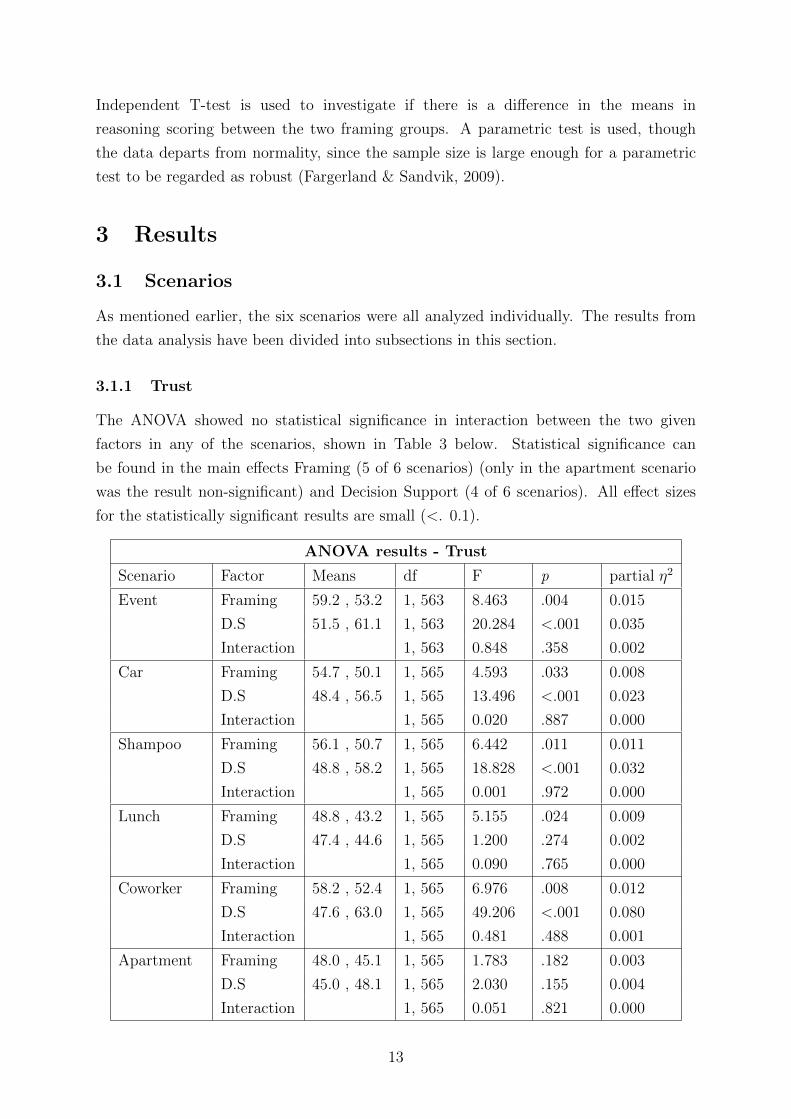
3.1.1 Trust
The ANOVA showed no statistical significance in interaction between the two given
factors in any of the scenarios, shown in Table 3 below. Statistical significance can
be found in the main effects Framing (5 of 6 scenarios) (only in the apartment scenario
was the result non-significant) and Decision Support (4 of 6 scenarios). All effect sizes
for the statistically significant results are small (<. 0.1).
ANOVA results - Trust
Scenario Factor Means df F p partial η2
Event Framing 59.2 , 53.2 1, 563 8.463 .004 0.015
D.S 51.5 , 61.1 1, 563 20.284 <.001 0.035
Interaction 1, 563 0.848 .358 0.002
Car Framing 54.7 , 50.1 1, 565 4.593 .033 0.008
D.S 48.4 , 56.5 1, 565 13.496 <.001 0.023
Interaction 1, 565 0.020 .887 0.000
Shampoo Framing 56.1 , 50.7 1, 565 6.442 .011 0.011
D.S 48.8 , 58.2 1, 565 18.828 <.001 0.032
Interaction 1, 565 0.001 .972 0.000
Lunch Framing 48.8 , 43.2 1, 565 5.155 .024 0.009
D.S 47.4 , 44.6 1, 565 1.200 .274 0.002
Interaction 1, 565 0.090 .765 0.000
Coworker Framing 58.2 , 52.4 1, 565 6.976 .008 0.012
D.S 47.6 , 63.0 1, 565 49.206 <.001 0.080
Interaction 1, 565 0.481 .488 0.001
Apartment Framing 48.0 , 45.1 1, 565 1.783 .182 0.003
D.S 45.0 , 48.1 1, 565 2.030 .155 0.004
Interaction 1, 565 0.051 .821 0.000
13
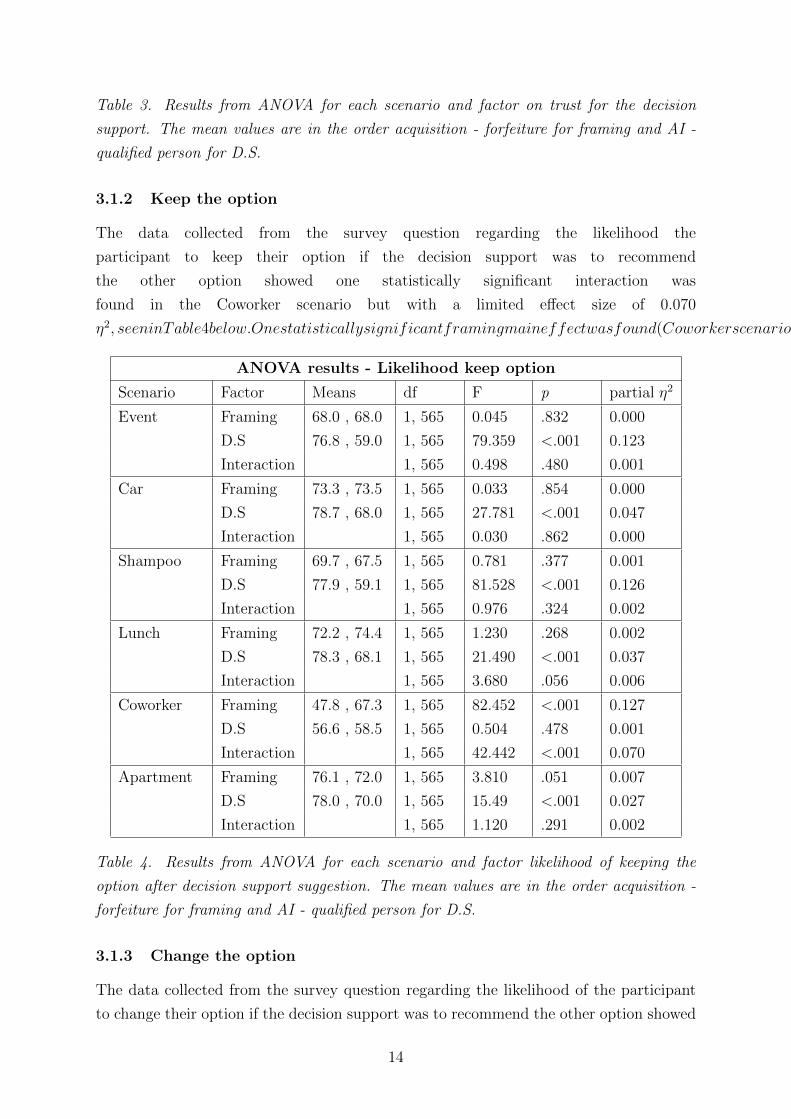
Table 3. Results from ANOVA for each scenario and factor on trust for the decision
support. The mean values are in the order acquisition - forfeiture for framing and AI -
qualified person for D.S.
3.1.2 Keep the option
The data collected from the survey question regarding the likelihood the
participant to keep their option if the decision support was to recommend
the other option showed one statistically significant interaction was
found in the Coworker scenario but with a limited effect size of 0.070
η2, seeninTable4below.Onestatisticallysignificantframingmaineffectwasfound(Coworkerscenario)withaneffectsizeof0.127η2.ThemaineffectDecisionSupportontheotherhandshow5of6statisticallysignificantresults(allbuttheCoworkerscenario).Threeeffectsizesaretobeconsideredsmall(0.01to0.06)andthreemedium(0.06to0.14).
ANOVA results - Likelihood keep option
Scenario Factor Means df F p partial η2
Event Framing 68.0 , 68.0 1, 565 0.045 .832 0.000
D.S 76.8 , 59.0 1, 565 79.359 <.001 0.123
Interaction 1, 565 0.498 .480 0.001
Car Framing 73.3 , 73.5 1, 565 0.033 .854 0.000
D.S 78.7 , 68.0 1, 565 27.781 <.001 0.047
Interaction 1, 565 0.030 .862 0.000
Shampoo Framing 69.7 , 67.5 1, 565 0.781 .377 0.001
D.S 77.9 , 59.1 1, 565 81.528 <.001 0.126
Interaction 1, 565 0.976 .324 0.002
Lunch Framing 72.2 , 74.4 1, 565 1.230 .268 0.002
D.S 78.3 , 68.1 1, 565 21.490 <.001 0.037
Interaction 1, 565 3.680 .056 0.006
Coworker Framing 47.8 , 67.3 1, 565 82.452 <.001 0.127
D.S 56.6 , 58.5 1, 565 0.504 .478 0.001
Interaction 1, 565 42.442 <.001 0.070
Apartment Framing 76.1 , 72.0 1, 565 3.810 .051 0.007
D.S 78.0 , 70.0 1, 565 15.49 <.001 0.027
Interaction 1, 565 1.120 .291 0.002
Table 4. Results from ANOVA for each scenario and factor likelihood of keeping the
option after decision support suggestion. The mean values are in the order acquisition -
forfeiture for framing and AI - qualified person for D.S.
3.1.3 Change the option
The data collected from the survey question regarding the likelihood of the participant
to change their option if the decision support was to recommend the other option showed
14
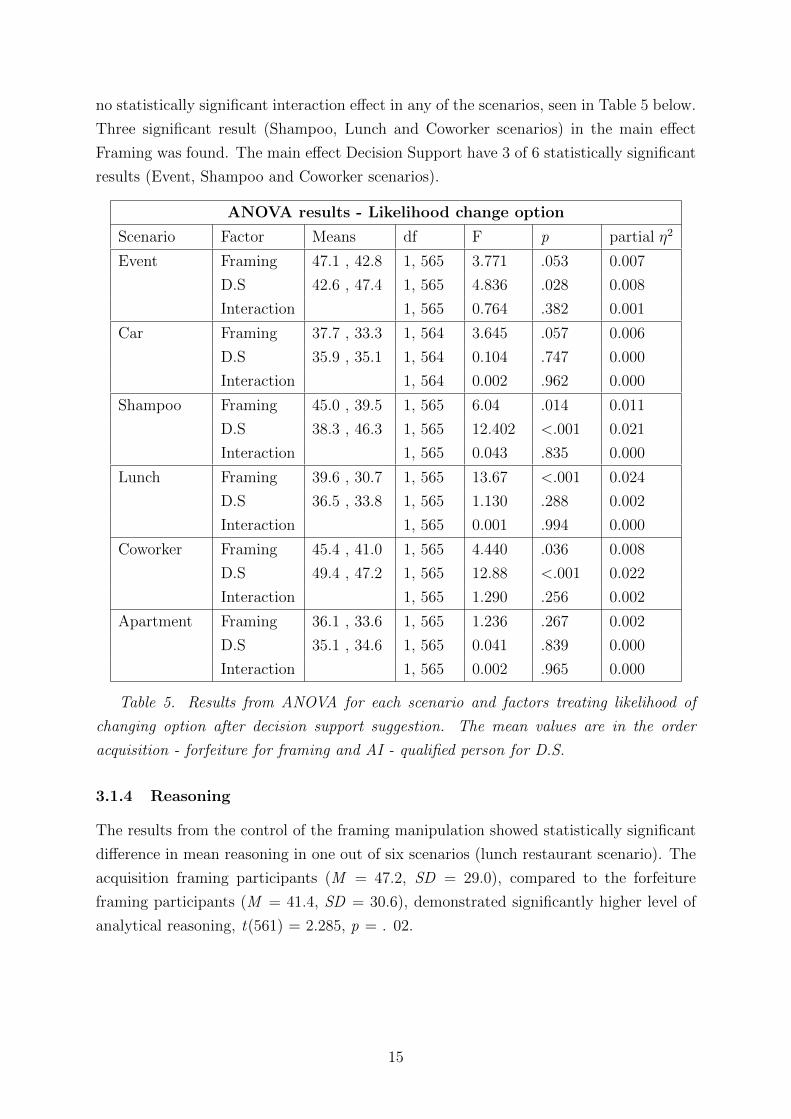
no statistically significant interaction effect in any of the scenarios, seen in Table 5 below.
Three significant result (Shampoo, Lunch and Coworker scenarios) in the main effect
Framing was found. The main effect Decision Support have 3 of 6 statistically significant
results (Event, Shampoo and Coworker scenarios).
ANOVA results - Likelihood change option
Scenario Factor Means df F p partial η2
Event Framing 47.1 , 42.8 1, 565 3.771 .053 0.007
D.S 42.6 , 47.4 1, 565 4.836 .028 0.008
Interaction 1, 565 0.764 .382 0.001
Car Framing 37.7 , 33.3 1, 564 3.645 .057 0.006
D.S 35.9 , 35.1 1, 564 0.104 .747 0.000
Interaction 1, 564 0.002 .962 0.000
Shampoo Framing 45.0 , 39.5 1, 565 6.04 .014 0.011
D.S 38.3 , 46.3 1, 565 12.402 <.001 0.021
Interaction 1, 565 0.043 .835 0.000
Lunch Framing 39.6 , 30.7 1, 565 13.67 <.001 0.024
D.S 36.5 , 33.8 1, 565 1.130 .288 0.002
Interaction 1, 565 0.001 .994 0.000
Coworker Framing 45.4 , 41.0 1, 565 4.440 .036 0.008
D.S 49.4 , 47.2 1, 565 12.88 <.001 0.022
Interaction 1, 565 1.290 .256 0.002
Apartment Framing 36.1 , 33.6 1, 565 1.236 .267 0.002
D.S 35.1 , 34.6 1, 565 0.041 .839 0.000
Interaction 1, 565 0.002 .965 0.000
Table 5. Results from ANOVA for each scenario and factors treating likelihood of
changing option after decision support suggestion. The mean values are in the order
acquisition - forfeiture for framing and AI - qualified person for D.S.
3.1.4 Reasoning
The results from the control of the framing manipulation showed statistically significant
difference in mean reasoning in one out of six scenarios (lunch restaurant scenario). The
acquisition framing participants (M = 47.2, SD = 29.0), compared to the forfeiture
framing participants (M = 41.4, SD = 30.6), demonstrated significantly higher level of
analytical reasoning, t(561) = 2.285, p = . 02.
15
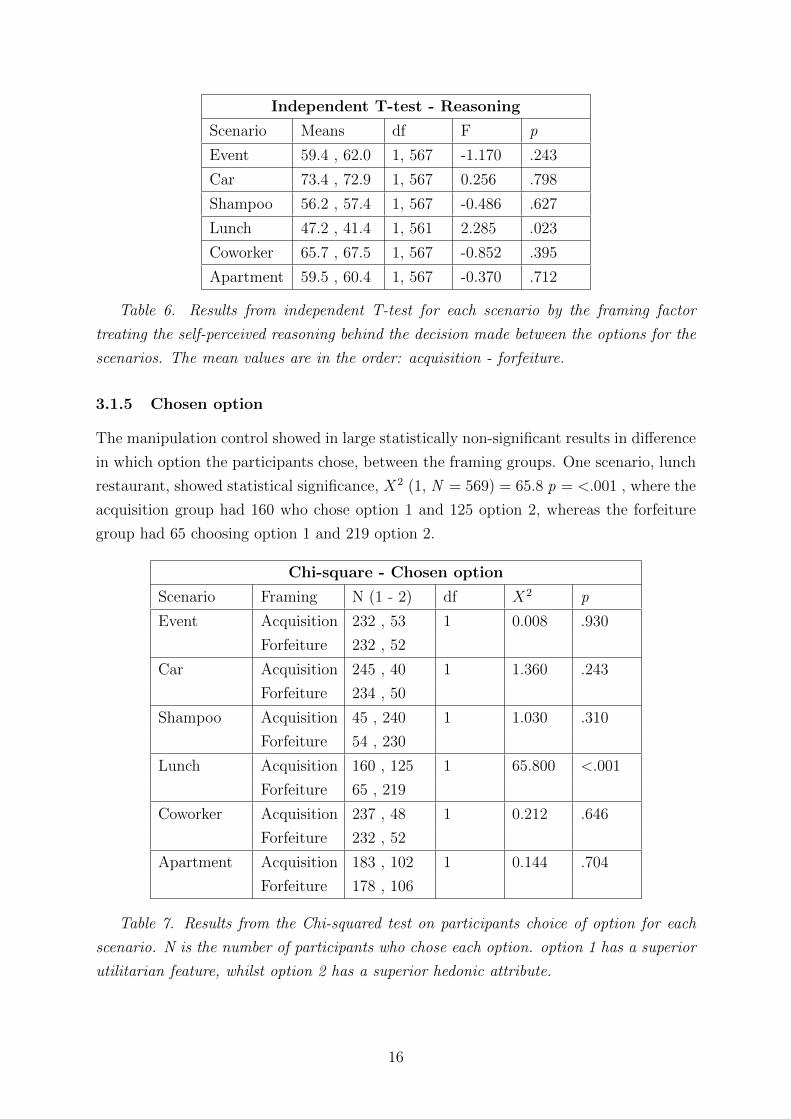
Independent T-test - Reasoning
Scenario Means df F p
Event 59.4 , 62.0 1, 567 -1.170 .243
Car 73.4 , 72.9 1, 567 0.256 .798
Shampoo 56.2 , 57.4 1, 567 -0.486 .627
Lunch 47.2 , 41.4 1, 561 2.285 .023
Coworker 65.7 , 67.5 1, 567 -0.852 .395
Apartment 59.5 , 60.4 1, 567 -0.370 .712
Table 6. Results from independent T-test for each scenario by the framing factor
treating the self-perceived reasoning behind the decision made between the options for the
scenarios. The mean values are in the order: acquisition - forfeiture.
3.1.5 Chosen option
The manipulation control showed in large statistically non-significant results in difference
in which option the participants chose, between the framing groups. One scenario, lunch
restaurant, showed statistical significance, X2 (1, N = 569) = 65.8 p = <.001 , where the
acquisition group had 160 who chose option 1 and 125 option 2, whereas the forfeiture
group had 65 choosing option 1 and 219 option 2.
Chi-square - Chosen option
Scenario Framing N (1 - 2) df X2 p
Event Acquisition 232 , 53 1 0.008 .930
Forfeiture 232 , 52
Car Acquisition 245 , 40 1 1.360 .243
Forfeiture 234 , 50
Shampoo Acquisition 45 , 240 1 1.030 .310
Forfeiture 54 , 230
Lunch Acquisition 160 , 125 1 65.800 <.001
Forfeiture 65 , 219
Coworker Acquisition 237 , 48 1 0.212 .646
Forfeiture 232 , 52
Apartment Acquisition 183 , 102 1 0.144 .704
Forfeiture 178 , 106
Table 7. Results from the Chi-squared test on participants choice of option for each
scenario. N is the number of participants who chose each option. option 1 has a superior
utilitarian feature, whilst option 2 has a superior hedonic attribute.
16

3.2 General Attitude towards Artificial Intelligence
No statistically significant difference in general attitude towards AI could be found
between the four groups in the data after running an ANOVA Tukey post-hoc (see
Appendix).
The Person correlation test revealed that there is a statistically significant positive
relationship between trust in the AI decision support and the general attitude towards
AI scale score in all six scenarios, as seen in Table 8 below.
Pearson correlations - GAAIS and trust in AI
Scenario Framing df r p
Event Acquisition 147 0.307 <.001
Forfeiture 141 0.284 <.001
Car Acquisition 147 0.272 <.001
Forfeiture 141 0.366 <.001
Shampoo Acquisition 147 0.439 <.001
Forfeiture 141 0.262 <.001
Lunch Acquisition 147 0.398 <.001
Forfeiture 141 0.297 <.001
Coworker Acquisition 147 0.473 <.001
Forfeiture 141 0.293 <.001
Apartment Acquisition 147 0.442 <.001
Forfeiture 141 0.339 <.001
Table 8. Results from the Pearson correlations test on group 1 (acquisition) and group
2 (forfeiture). Both groups have AI as decision support factor.
4 Discussion
4.1 Results
4.1.1 Trust in decision support
This paper addressed algorithm aversion by combining two different paradigms to test
the novel hypotheses about difference in trust towards algorithmic decision support in
two different scenario framings. The paper has hypothesized that the trust in algorithmic
decision support and human expert will change differently depending on which kind of
framing the scenario possess. To study if there exists such an effect, an ANOVA was
made to statistically identify interactions between the two factors - framing and type
of decision support. No such interactions exist in any of the six scenarios (alpha =
17
<.05). A discussion about the methodological implications will be presented in following
section of the paper, but the results show that H0 cannot be rejected as of this data.
The p-values shows a high chance that the given result most likely was generated by
chance. Even though no interaction were to be found, there were several statistically
significant main effects in many of the scenarios. The main effect in the decision support
factor shows that this study sees the same effect as previous research which have shown
that the trust towards algorithmic decision support systems is lower than if a human
expert were to give the same advice in more subjective tasks (Castelo et al., 2019). The
scenarios in this study do not have a quantitatively defined measure of subjectivity or
objectivity but can be intuitively perceived as subjective in their nature. The scenarios
do not involve much quantifiable features in essence which increases the task subjectivity.
The main effect results for the framing factor, the mean trust for the decision
support is higher in the acquisition framing than the forfeiture framings for each
significant scenario and independent on decision support type. What is new here and
what previous research have not investigated is that the trust for decision support (not
dependent on type) is also affected by the framing of the scenario. When people are
faced with a decision where you must give up a certain feature or attribute (forfeiture
framing), they are more likely to apply loss aversion which will favor the item with the
hedonic feature (Dahr & Wertenbroch, 2000; Tversky & Kahneman, 1991). However,
this was not replicated in the choice frequencies. The Chi-squared test did not for any
statistically difference in choices between the framings. Further elaboration on this will
presented later in this paper. This kind of decision is more driven by affect which may
then be the cause why we can see a statistically significant difference in trust in both
types of decision support in two different framings. This new finding goes in line with
the hypothesis that affect driven decision making affect the trust in decision support
systems, but there is no difference in the change between the two decision support types
used in this research. Even though many of the main effects are statistically significant,
the effect sizes for each are to be considered small. The largest effect size to be found in
these results is 0.032 which translates to that 3.2 percent of the change in trust can be
accounted for by the framing. The small effect sizes indicates that the change in trust
depending on framing is considerably small, albeit significant, when applied to reality.
This is to be expected due to the complexity and the multitude of factors affecting trust
in any kind of decision support.
The trust may have been affected negatively by the lack of decision autonomy
perceived by the participants (Sherer et al., 2015). The recommendation produced by
the decision support shows no evidence for its decision nor how it works. The feeling of
a black box working in a mysterious way adds up to the aversion of algorithms as stated
18

earlier (Dietvorst et al., 2015; Muir, 1987)). Having a more comprehensive definition
and presentation about the decision support, making it less alienated to the user, would
supposedly increase the trust but may also the ecological validity of this study. Giving
the decision support the same prerequisites for this study as real ones.
4.1.2 Attitude towards AI and trust
The General Attitude Towards Artificial Intelligence Scale (GAAIS) was used as a
manipulation control for the trust measurement. Since the trust main effects follows
previous studies, the GAAIS results should then be correlated with amount of trust
towards an algorithmic decision support. The Pearson correlation test showed statistically
significant correlation in all six scenarios. This positive correlation, which translates to
that there is an association between the trusting the algorithmic decision support in the
scenarios and having a more positive attitude towards AI. Seven out of twelve of the
correlation coefficients have a medium strength of association (r = .3 to .5) whilst the
rest are considered small (r = .1 to .3). Correlation test was conducted the same way for
the group with a human expert as decision support but did not output any statistically
significant results (these result can be found in the Appendix). Since the GAAIS only asks
questions about attitude towards AI and not humans, these results were to be expected.
What can be said from the different results of correlation is that the attitude towards AI
is not associated with trusting a human expert decision support.
4.1.3 Decision support recommendation effect
Even though we cannot reject H0 for the trust interaction between the decision support
type and framing type, there is still interest in investigating the self-perceived likelihood
that the participant was to change or keep their choice if the decision support was to
recommend the other option. Previous studies have not revealed if there is any kind of
connection between trusting a decision support and acting upon its recommendation,
only trusting, and using. The results have indicated that there is a difference in trust
between the decision supports and between the two framings, but the ANOVA do not
show as many statistically significant results treating likelihood of keeping the chosen
option. Only one out of six scenarios in the framing main effect showed a statistically
significance, in the coworker scenario. The likelihood of keeping the chosen option is
higher in the forfeiture framing compared to the acquisition framing, together with a
medium effect size (>0.06). The same can be identified in the results for likelihood
of changing option where there is a statistically significant difference in likelihood of
changing the chosen option if the decision support was to recommend the other option,
in the same scenario.
19
Why the same effect cannot be seen in the other five scenarios can be due to
that each scenario may differ in other qualities. The apartment scenario is close to
the set alpha-level, but this cannot be generalized to the rest of the scenarios, where
significance levels are far from it. Nonetheless, the decision support main effects are
statistically significant in five scenarios showing effect sizes ranging from 0.027 to
0.126. There is clear evidence that people tend to listen to the recommendations more
if it is a human expert or very qualified person giving a recommendation than if it
is an algorithmic decision support, which goes in line with previous studies about
trust (Alexander, Blinder, & Zak, 2018; Onkal et al., 2009). The interaction which
can be found in the coworker scenario, which was only statistically significant in the
framing main effect, is asymmetrical in a way that likelihood of keeping the option
when recommended by an algorithmic decision support is much higher in a forfeiture
framing scenario than in an acquisition framing, whereas for the human decision support
the likelihood is about the same. This interesting finding is hard to generalize since it
cannot be found in the likelihood to keep option or in any of the other scenarios. An
explanation for why the difference is so large for algorithmic decision support whilst it is
not for the human expert decision may be that in this kind of scenario, the affect have
a larger effect on the decision making since there might be a conception that AI cannot
account for human feature or know human priorities, as demonstrated in the introduction.
The human expectation and expertise on AI and technology has shown to be a
causing factor for algorithmic aversion and may be an applicable explanation for this
result . This goes to show that the type of scenarios is of our most concern when
studying algorithmic aversion. What is also interesting is that the mean likelihood to
change option is always lower than to keep, independent of the factors. These consistent
results would suggest that the willingness to adjust one’s choice to the recommendation
of the decision support is smaller than the intuition of the decision maker. This could
be due to the presentation of the decision supports (Carey & Kacmar, 2003). A relative
low trust towards the algorithms have been associated with expectations and expertise,
as mentioned earlier, and since the presentation of the decision supports was meager, the
level of expectation and expertise will not be affected by the presentation. Although,
an alternative approach to the meager presentation would be that it may have lowered
the expertise level of the assigned decision support, which in turn might lower the
expectations and finally the trust as a whole.
As Brown (2015) presented from his research about algorithm aversion and cognitive
compatibility, in order for the decision maker to apply the recommendation given by the
decision support, a gap of divergent rationalities have to be decreased in order for the
trust to increase. This study did little to close this gap or bring the rationalities together
20

but may have been useful to get a more realistic perspective of the specific decision
support assigned in the study. No incentives were given for the participants, positive nor
negative, in the presentation of the decision support which may have been able fill in
eventual voids in the presentations. This was considered as an option but was abandoned
since it would have been an additional dependent variable to trust. Important to state
is that these findings are only to be generalized to these specific scenarios and sample,
not to be taken as results that state that decision support have low impact on decision
makers.
4.1.4 Reasoning
As a manipulation control, the survey asked participants to estimate their type of
reasoning when making their decision on which option to choose in the scenarios, ranging
from ”only feelings” to ”only analytical reasoning”. Previous research would suggest
that the mean difference in reasoning between the acquisition and forfeiture framing
should be statistically significant in a way that analytical reasoning have a larger role
in the acquisition framing than in the forfeiture (Castelo, 2019; Tversky & Kahneman,
1991). The loss aversion, which is in play during the forfeiture framing, should lower the
analytical reasoning in favor for affect driven decision making. The result produced from
this study shows statistically significant in the means of reasoning in one scenario, lunch
restaurant, where the means follow the direction of the hypothesis. This could be due to
the clear utilitarian feature and hedonic attribute which the scenario options offer.
As the results from the Chi-square, where difference in choices between the framings is
presented, one can see that the lunch restaurant scenario sees a shift in which option
is chosen most often. This could clearly be the effect of where the utilitarian feature
is more attractive in an acquisition scenario, whilst the forfeiture framing of a scenario
favor the hedonic attribute. In the lunch restaurant scenario, one must choose either a
shorter walking distance (utilitarian) or dessert (hedonic). There is a clear differentiation
between the utilitarian and hedonic characteristics in the options and may have given
this distinct effect. Neither of Table 6 nor 7 show any other statistically significance
which can be seen as reliable result that the rest of the scenarios did not induce the
effect. This study may have benefited from using an alternative way of measuring the
reasoning behind the decision making since a it can be a difficult task to introspectively
classify one’s own reasoning. The human tends to perceive oneself as more analytical
than what reality reflects (Mercier, 2016). The using of heuristics happens unconsciously
and may be perceived by the practitioner as analytical decision making. The design of
this research limits the possibilities of measuring reasoning a reliable way since there is
no actual contact with the participant which would make it possible to ask the mindset
21

and train of thought behind the decision in an easier and reliable way.
4.2 Method
This study may have benefited from recruiting participants through a different medium,
such a real-life participation. The limitations of such recruitment were considered not to
outweigh the limitations of an online recruitment and online survey. The data collected
from the online survey was largely non normal distribution which may be a product of
either poorly formulated and/or ambiguous question formulations. This could have led
to confusion when answering the questions or participants who did not interpret the
questions as intended. The survey questions were subjected to review by an external
part where edits were made to decrease potential ambiguity etc. The best prevention
against foul participants who participate for solely monetary profits who give completely
random answers is to have the participants do the survey at an institution or similar.
This would probably lead to a more reliable data collection and potentially different
results.
The exclusion processes were limited to the duration of finishing the survey and
completion of the survey. The time limits, >120 - <1000 seconds,was determined by the
authors perception of reasonable finishing times to be able to give honest survey answers.
The limits, especially the lower time limit, may be adjusted with a more reliable method
to pick up more eventual ”click-throughers” .
This exclusion process did not include going through survey results in order to
sift out click-throughers. This was a conscious choice backed up by the notion that a
large sample size would make eventual click-throughers a non-significant noise in the
data. After the analysis of the data, this might have been an overestimation of such
claim. This is based in no evidence that this study has been affected by this, but to
increase the validity and reliability of the data a well though through method to identify
obvious click-throughers would be necessary, especially if using the same recruitment
and experimental method. There is always a problem of being certain that a participant
has given random answers or just clicked through, which is a daunting task not taken
upon by this study due to earlier mentioned vindications.
The scenarios used in this research were mainly taken from Dhar and Wertenbroch’s
study (2000), but as mentioned, two new scenarios were created. The recreation of
Dahr’s scenarios were all made to be identical in as many aspects as possible to minimize
other factors affecting the outcome of the data. The same applies to the two scenario
which were created in purpose of this research, the car lease and event scenario. A cause
22
for concern may be the hedonic attribute and utilitarian features in some of the scenarios
may be too similar that the hedonic and utilitarian features cannot be distinguishable.
For example, the event scenario may suffer from such flaw, where option one has a
superior location (utilitarian feature) and option 2 have superior weather (hedonic
attribute). The definition of utilitarian and hedonic may be subjective in some sense,
but is measurable, and should have been tested in a pre-test to this study to make sure
each scenario is constructed in an intended way. This could cause a lack in the effects
which this study is interested in.
The options which the participants must choose from may also be unequal in
their factor superiority. Indubitably, personal references are major deciding factors,
e.g. a nice view is more important than having very close to work for some. But if
the framing of the feature or attribute are asymmetrical in their utilitarian benefit or
affective impact, this may result in that the participants take notice of the objective
overall superiority in an option and would skew the data in favor for the superior option.
The sought-after effect would then disappear due to this imbalance in superiority. As for
the shampoo scenario, where option 1 has a ”very effective cleansing agent” (utilitarian
feature) and ”hair feels dry and after shampooing” (hedonic attribute) whereas option
2 has ”a moderately effective cleansing agent” (utilitarian feature) and ”hair feels soft
and silky” (hedonic attribute), we might see this imbalance in superiority. The framing
of option 2, which is superior in the hedonic attribute, have a quite strong inferior
utilitarian attribute. This could be the underlying to why option 2 is heavily favored.
This cannot be seen in the other scenarios, where the frequencies for choosing option 1
are higher than option 2.
4.3 Future Research
Even though these results were to a large extent statistically non-significant, there are
further work to be done in the field of algorithm aversion linked to scenario characteristics.
This study built upon two different paradigms and combining characteristics from each in
order to answer new research questions. Future research may build upon this arrangement
together with the suggestions for improvement given in the method discussion above.
Future research should also investigate how to minimize algorithm aversion in everyday
use of algorithmic decision support. This could lead to an improvement in human decision
making for the broader general. The implementations of decision support with AI are in
no way going to slow down which puts this research high up on the priority list if we the
technology to be used by the common man.
23

5 Conclusion
This study showed that often time, people trust human experts more than algorithmic
decision support. This was also found in the self-perceived likelihood of keeping a choice
after the decision support recommending the other option, where the likelihood was higher
for the group with an algorithmic decision support than a human expert. The results
also showed that the decision support, independent of which type, is more trusted in an
acquisition framed scenario than in a forfeiture framed scenario. However, very limited
support was found for the hypothesized interaction between decision support and scenario
type, where it was expected that algorithm aversion would be stronger for forfeiture than
acquisition scenarios. Future research could test this potential interaction using materials
more strongly inducing utilitarian and hedonic thinking. Moreover, the results showed
that, independent of the experimental manipulations, participants with a positive general
attitude towards AI had higher trust in algorithmic decision support. Together, these
new results may be valuable for future research into algorithm aversion but must also to
be extended and replicated using different scenarios and situations.
24

6 References
Alexander, V., Blinder, C., & Zak, P. J. (2018). Why trust an algorithm? Performance,
cognition, and neurophysiology. Computers in Human Behavior. 89, 279–288. DOI:
https://doi.org/10.1016/j.chb.2018.07.026
ALLEA. (2017). The European Code of Conduct for Research Integrity - Revised Edition.
All European Academier, Berlin. Retrieved from: https://www.allea.org/wp-
content/uploads/2017/05/ALLEA-European-Code-of-Conduct-for-Research-
Integrity-2017.pdf
Araujo, C.(9th November 2019). Why overcoming algorithm aversion is the key
to unleashing the disruptive force of AI. Inside Bigdata. Retrieved from:
https://insidebigdata.com/2019/11/09/why-overcoming-algorithm-aversion-is-
the-key-to-unleashing-the-disruptive-force-of-ai/
Batra, R., & Ahtola, O. T. (1991). Measuring the hedonic and utilitarian sources
of consumer attitudes. Marketing Letters, 2 (2), 159-170; DOI: https://doi-
org.e.bibl.liu.se/10.1007/bf00436035
Brown, R. V. (2015). Decision science as a by-product of decision-aiding: A practitioner’s
perspective. Journal of Applied Research in Memory and Cognition, 4 (3), 212–220.
DOI: https://doi.org/10.1016/j.jarmac.2015.07.005
Burton, J. W., Stein, M.-K., & Jensen, T. B. (2020). A systematic review of algorithm
aversion in augmented decision making. Journal of Behavioral Decision Making,
33 (2), 220–239. DOI: https://doi-org.e.bibl.liu.se/10.1002/bdm.2155
Carey, J. M., & Kacmar, C. J. (2003). Toward a general theoretical model
of computerbased factors that affect managerial decision making. Journal
of Managerial Issues, 15 (4), 430–449. Retrieved from: https://www-jstor-
org.e.bibl.liu.se/stable/40604444
Castelo, N., Bos, M. W., & Lehmann, D. R. (2019). Task-Dependent Algorithm
Aversion. Journal of Marketing Research, 56 (5), 809–825. DOI: https://doi-
org.e.bibl.liu.se/10.1177/0022243719851788
Colarelli, S. M., Thompson, M. (2008). Stubborn reliance on human nature in
employee selection: statistically decision aids are evolutionarily novel. Industrial
25
and Organizational Psychology, 1 (3), 374–351. DOI: https://doi.org/10.1111/j.1754-
9434.2008.00060.x
Dhar, R. & Wertenbroch, K. (2000). Consumer Choice between Hedonic and Utilitarian
Goods. Journal of Marketing Research, 37 (1), 60–71. Retrieved from: https://www-
jstor-org.e.bibl.liu.se/stable/1558541
Dietvorst, B. J., Simmons, J. P., & Massey, C. (2015). Algorithm aversion: People
erroneously avoid algorithms after seeing them err. Journal of Experimental
Psychology: General, 144 (1), 114–126. DOI: https://doi.org/10.1037/xge0000033
Dietvorst, B. J., Simmons, J. P., & Massey, C. (2018). Overcoming
algorithm aversion: People will use imperfect algorithms if they can (even
slightly) modify them. Management Science, 64 (3), 1155–1170. DOI:
https://doi.org/10.1287/mnsc.2016.2643
Fagerland, M. W., & Sandvik, L. (n.d.). Performance of five two-sample location tests
for skewed distributions with unequal variances. Contemporary Clinical Trials,
30 (5), 490–496. DOI: https://doi-org.e.bibl.liu.se/10.1016/j.cct.2009.06.007
Finucane, M. L., Alhakami, A., Slovic, P., & Johnson, S. M. (2000). The Affect
Heuristic in Judgments of Risks and Benefits. Journal of Behavioral Decision
Making, 13 (1), 1–17. DOI: https://doi-org.e.bibl.liu.se/10.1002/(SICI)1099-
0771(200001/03)13:1<1::AID-BDM333>3.0.CO;2-S
Highhouse, S. (2008). Stubborn reliance on intuition and subjectivity in employee
selection. Industrial and Organizational Psychology, 1 (3), 333–342. DOI:
https://doi.org/10.1111/j.1754-9434.2008.00058.x
Inbar, Y., Cone, J., & Gilovich, T. (2010). People’s intuitions about intuitive insight
and intuitive choice. Journal of Personality and Social Psychology, 99 (2), 232–247.
DOI: https://doi-org.e.bibl.liu.se/10.1037/a0020215
Ireland, A.M. & Dempster, M. A. H.,(1988). A Financial Expert Decision Support
System (48). Springer. DOI: https://doi.org/10.1007/978-3-642-83555-1 25
Johnson, D., & Grayson, K. (2005). Cognitive and affective trust in service
relationships. Journal of Business Research, 58 (4), 500–507. DOI: https://doi-
org.e.bibl.liu.se/10.1016/S0148-2963(03)00140-1
26

Kahneman, D., Tversky, A., (1979). Prospect Theory: An Analysis of
Decision under Risk. Econometrica, 47 (2), 263–291. DOI: https://doi-
org.e.bibl.liu.se/10.2307/1914185
Kahneman, D., Slovic, P., & Tversky, A. (1982). Judgment under uncertainty:
Heuristics and biases. Cambridge, England: Cambridge University Press. DOI:
https://doi.org/10.1017/CBO9780511809477
Logg, J. M., Minson, J. A., & Moore, D. A. (2019). Algorithm appreciation:
People prefer algorithmic to human judgment. Organizational Behavior
and Human Decision Processes, 151, 90–103. DOI: https://doi-
org.e.bibl.liu.se/10.1016/j.obhdp.2018.12.005
Mackay, J. M., & Elam, J. J. (1992). A comparative study of how experts and novices
use a decision aid to solve problems in complex knowledge domains. Information
Systems Research, 3 (2), 150–172. DOI: https://doi.org/10.1287/isre.3.2.150
Mano, H., & Oliver R.L., (1993). Assessing the Dimensionality and Structure of
the Consumption Experience: Evaluation, Feeling, and Satisfaction. Journal
of Consumer Research, 20 (3), 451–466. Retrieved from: https://www-jstor-
org.e.bibl.liu.se/stable/2489359
Mercier, H. (2016). The Argumentative Theory: Predictions and Empirical
Evidence. Trends in Cognitive Sciences, 20 (9), 689–700. DOI: https://doi-
org.e.bibl.liu.se/10.1016/j.tics.2016.07.001
Palan, S., & Schitter, (2018). Prolific.ac—A subject pool for online experiments.
Journal of Behavioral and Experimental Finance, 17, 22–27. DOI: https://doi-
org.e.bibl.liu.se/10.1016/j.jbef.2017.12.004
Peer, E., Brandimarte, L., Samat, S., & Acquisti, A. (2017). Beyond
the Turk: Alternative platforms for crowd sourcing behavioral research.
Journal of Experimental Social Psychology, 70, 153–163. DOI: https://doi-
org.e.bibl.liu.se/10.1016/j.jesp.2017.01.006
Prahl, A., & Van Swol, L. (2017). Understanding algorithm aversion: When is
advice from automation discounted? Journal of Forecasting, 36 (6), 691–702. DOI:
https://doi.org/10.1002/for.2464
27
Schepman, A., & Rodway, P. (2020). Initial validation of the general attitudes towards
Artificial Intelligence Scale. Computers in Human Behavior Reports, 1. DOI:
https://doi-org.e.bibl.liu.se/10.1016/j.chbr.2020.100014
Scherer, L. D., Zikmund-Fisher, B. J., Witteman, H. O., & Fagerlin, A. (2015). Trust in
deliberation: the consequences of deliberative decision strategies for medical decisions.
Health Psychology, 34 (11), 1090–1099. DOI: https://doi.org/10.1037/hea0000203
Tversky, A., & Kahneman, D. (1991). Loss Aversion in Riskless Choice: A Reference-
Dependent Model. The Quarterly Journal of Economics, 106 (4), 1039–1061.
Retrieved from: https://www-jstor-org.e.bibl.liu.se/stable/2937956
Yeomans, M., Shah, A., Mullainathan, S., & Kleinberg, J. (2019). Making sense of
recommendations. Journal of Behavioral Decision Making, 32 (4), 403-414. DOI:
https://doi.org/10.1002/bdm.2118
Onkal, D., Goodwin, P., Thomson, M., Gonul, S., & Pollock, A. (2009). The
Relative Influence of Advice From Human Experts and statistically Methods on
Forecast Adjustments. Journal of Behavioral Decision Making, 22, 390–409. DOI:
https://doi.org/10.1002/bdm.637
28
Appendix
Perceived knowledge
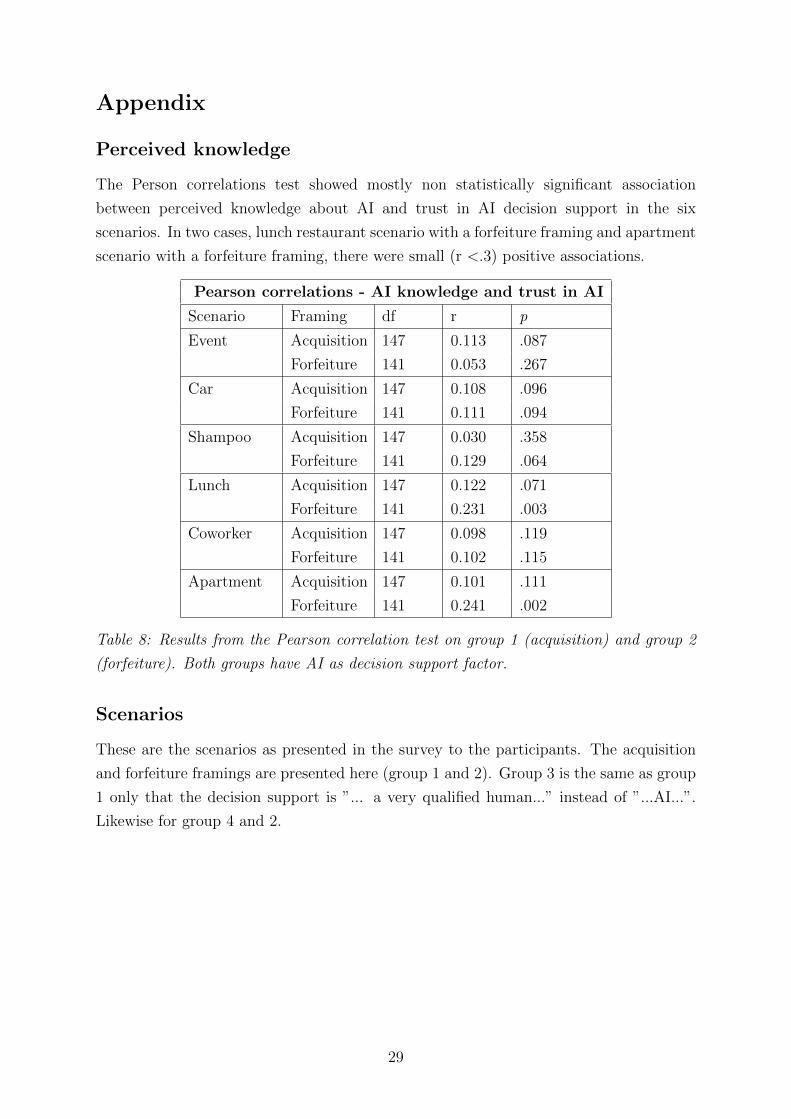
The Person correlations test showed mostly non statistically significant association
between perceived knowledge about AI and trust in AI decision support in the six
scenarios. In two cases, lunch restaurant scenario with a forfeiture framing and apartment
scenario with a forfeiture framing, there were small (r <.3) positive associations.
Pearson correlations - AI knowledge and trust in AI
Scenario Framing df r p
Event Acquisition 147 0.113 .087
Forfeiture 141 0.053 .267
Car Acquisition 147 0.108 .096
Forfeiture 141 0.111 .094
Shampoo Acquisition 147 0.030 .358
Forfeiture 141 0.129 .064
Lunch Acquisition 147 0.122 .071
Forfeiture 141 0.231 .003
Coworker Acquisition 147 0.098 .119
Forfeiture 141 0.102 .115
Apartment Acquisition 147 0.101 .111
Forfeiture 141 0.241 .002
Table 8: Results from the Pearson correlation test on group 1 (acquisition) and group 2
(forfeiture). Both groups have AI as decision support factor.
Scenarios
These are the scenarios as presented in the survey to the participants. The acquisition
and forfeiture framings are presented here (group 1 and 2). Group 3 is the same as group
1 only that the decision support is ”... a very qualified human...” instead of ”...AI...”.
Likewise for group 4 and 2.
29
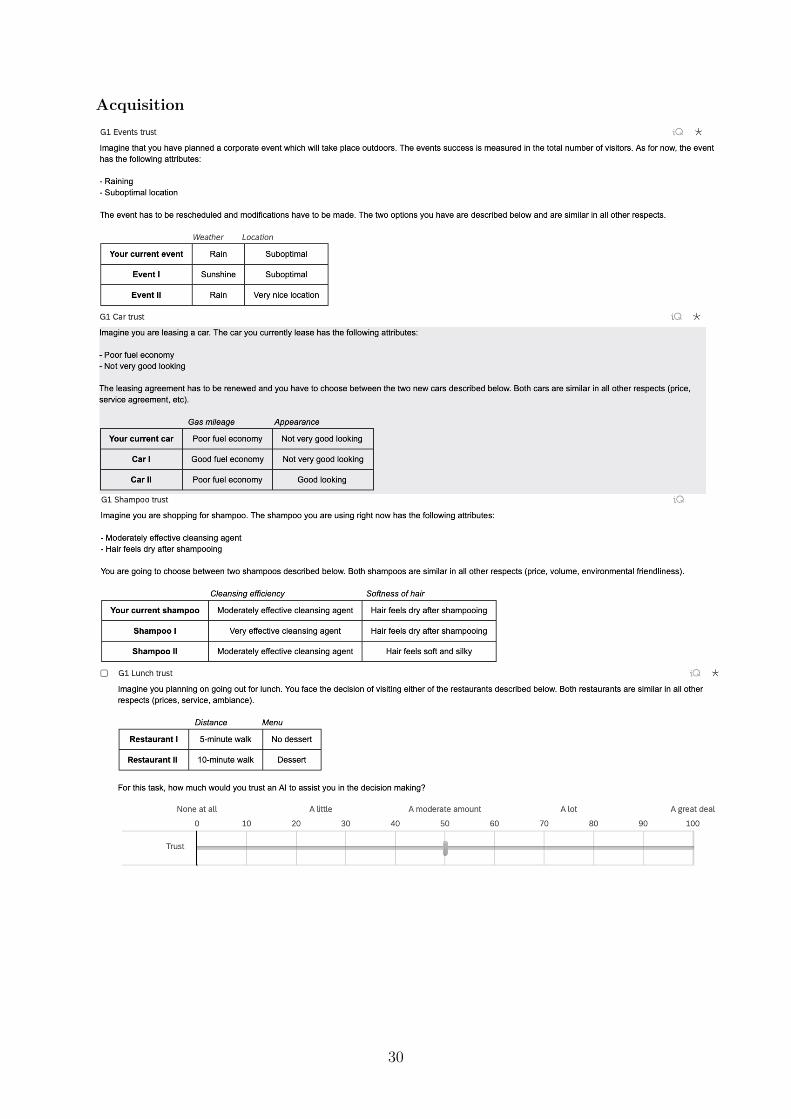
Acquisition
30
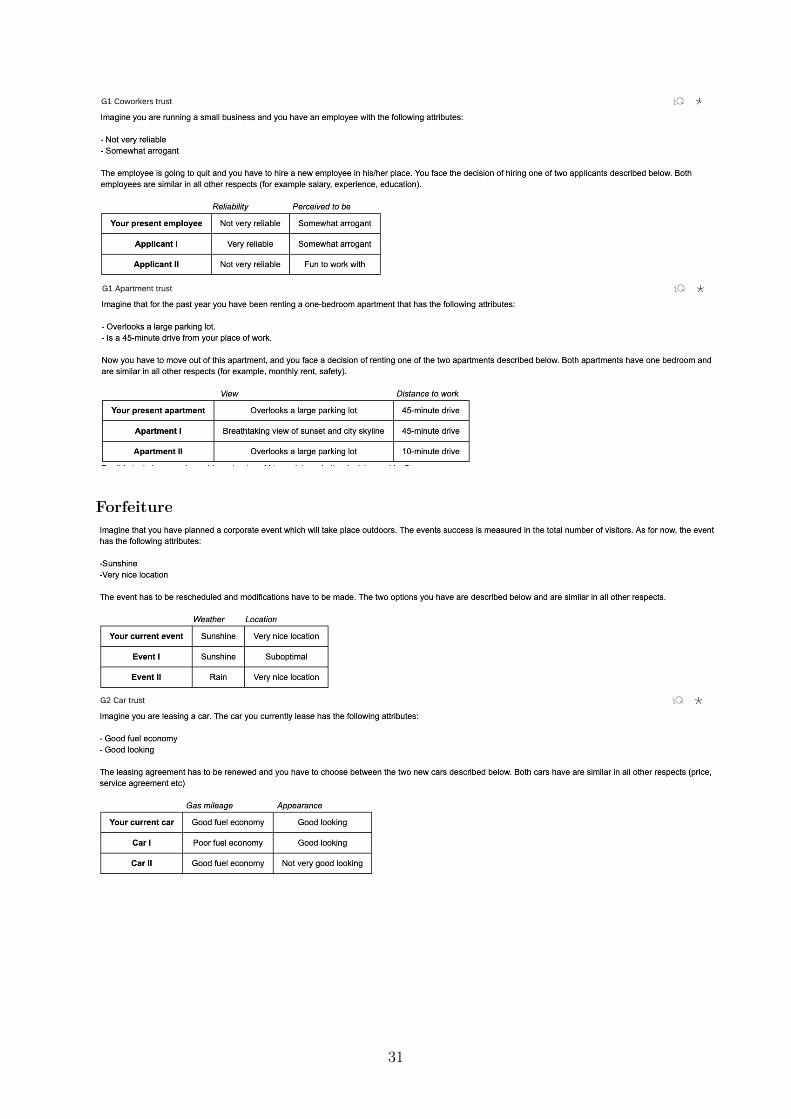
Forfeiture
31

Post-hoc for GAAIS ANOVA
Tukey post-hoc test to see if there is a difference between the groups
in attitude towards AI. No statistically significant differences were found.
32
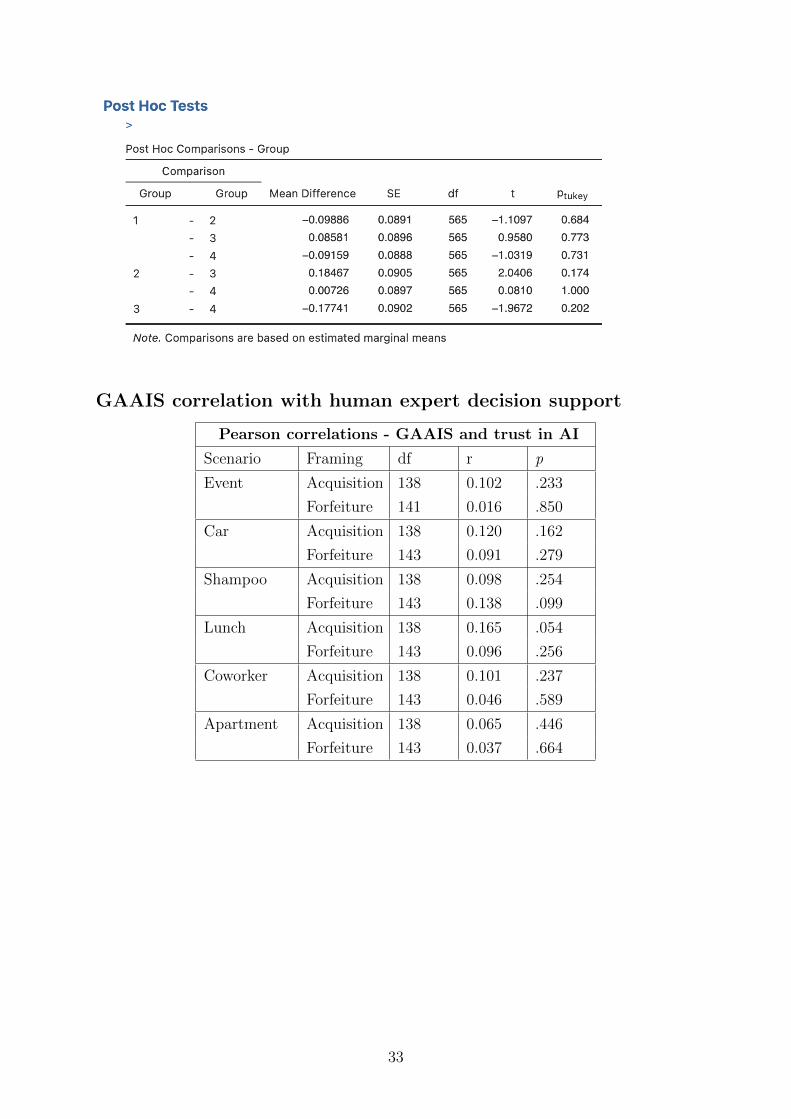
GAAIS correlation with human expert decision support
Pearson correlations - GAAIS and trust in AI
Scenario Framing df r p
Event Acquisition 138 0.102 .233
Forfeiture 141 0.016 .850
Car Acquisition 138 0.120 .162
Forfeiture 143 0.091 .279
Shampoo Acquisition 138 0.098 .254
Forfeiture 143 0.138 .099
Lunch Acquisition 138 0.165 .054
Forfeiture 143 0.096 .256
Coworker Acquisition 138 0.101 .237
Forfeiture 143 0.046 .589
Apartment Acquisition 138 0.065 .446
Forfeiture 143 0.037 .664
33