algorithmic trading - washington university in st. louis ...roger/361s.f11/mco2011110061.pdf · as...
TRANSCRIPT
61NOVEMBER 2011Published by the IEEE Computer Society0018-9162/11/$26.00 © 2011 IEEE
However, algorithmic trading is also of major concern to regulators, as the 6 May 2010 Flash Crash clearly illus-trated.3 In this instance, the Dow Jones Industrial Average plunged about 600 points in 5 minutes, causing a loss of $600 billion in the market value of US corporate stocks. This event revealed the lack of knowledge about high-frequency algorithmic trading and exposed its potential vulnerability. Protecting against such events requires an in-depth understanding of the trading process.
MARKET MICROSTRUCTURETo understand algorithmic trading, it is useful to con-
sider the different types of trading, explore how a trade is executed in an exchange, and review the objectives and challenges.
Trade executionDealers generally execute their orders through a shared
centralized order book that lists the buy and sell orders for a specific security ranked by price and order arrival time (generally on a first-in, first-out basis). This centralized order-driven trading system continuously tries to match buy and sell orders.
A dvances in telecommunications and computer technologies during the past decade have cre-ated increasingly global, dynamic, and complex financial markets, which in turn have stimulated
trading by computer programs and the rise of systems for algorithmic trading—also known as AT, algo, or black-box—to automate one or more stages of the trading process.
These systems seek to capture fleeting anomalies in market prices, profit from statistical patterns within or across financial markets, optimally execute orders, dis-guise a trader’s intentions, or detect and exploit rivals’ strategies.1 Ultimately, profits drive any algorithmic trad-ing system—whether in the form of cost savings, client commissions, or proprietary trading.
As the “Electronic Trading” sidebar describes, insti-tutional traders and managers of pension funds, mutual funds, and hedge funds increasingly deploy algorithmic trading systems. These systems currently handle approxi-mately 50 to 60 percent of all stocks traded in the US and EU.2 High-frequency algorithmic trading accounted for 60 percent of US equity volumes in 2009, and it is a major driver for computing and analytics innovation,3 especially machine learning and grid/GPU computing.
Traders increasingly use automated systems for one or more stages of the trading process, yet the secrecy and complexity of the algorithms prompt providing an overview of how these systems work.
Giuseppe Nuti, Mahnoosh Mirghaemi, Philip Treleaven, and Chaiyakorn YingsaereeUK Centre in Financial Computing, London
Algorithmic Trading
RESE ARCH FE ATURE

RESE ARCH FE ATURE
COMPUTER 62
Figure 1. An example trade order book (a) before matching a trade and (b) after matching a trade. Buy orders, which are generally listed by price and time priority, are ranked with the highest price at the top, while sell orders are ranked with the lowest price at the top.
Order Book – ABC Inc. Order Book – ABC Inc. Buy Sell Buy Sell
Quantity Price Price Quantity Quantity Price Price Quantity 5,000 99 99 4,000 1,000 99 100 10,000 8,000 98 100 10,000 8,000 98 101 1,000
10,000 97 101 1,000 10,000 97 103 15,000 15,000 95 103 15,000 15,000 95 104 3,000
(a) (b)
As Figure 1 shows, the order book is divided into two parts: buy orders on the left ranked with the highest price at the top, and sell orders on the right ranked with the lowest price at the top. Orders are generally listed by price and time priority, which means most exchanges prioritize orders based on the best price, and, if two or more orders are inserted at the same price, priority is given to the first order to be inserted. Notable exceptions include the UK three-month interest rates contracts (known as Short Ster-ling) on the London International Financial Futures and
Options Exchange (LIFFE). These contracts prioritize both the arrival time and order size, such that a large order can have priority over a smaller trade, even if the larger order was inserted after the smaller one.
Buy orders that a sell order can fully or partially match are automatically traded. Many variants to the order book model exist. Different exchanges will accept different order types, including limit orders, as per our example, market orders, stop-loss orders, and so on. In developing an algorithmic trading system, knowledge of the market microstructure—the detailed process governing how trades occur and orders interact in a specific market—is of para-mount importance.
Recently, both media and financial regulators have focused their attention on algorithmic trading in a bid to explain some unusual phenomena in the market. The ab-normal drop in US equity markets in the Flash Crash, and subsequent reversal of the move, is a good example of how market microstructure can have a drastic effect—and pos-sibly an undesirable one from a regulator’s viewpoint—on price dynamics.4 In this case, interconnected exchanges had different market microstructures for the securities in ques-tion, and the main exchange (by volume) had specific rules designed to interrupt trading during periods of high volatility and volume. Smaller satellite exchanges did not have the same safety features. Automated order-routing programs directed trades to the smaller exchanges which, because of a lack of liquidity, caused several share prices to plummet.
However, there is still uncertainty about the underlying causes of the Flash Crash, especially as one of the theories explored by the US Securities and Exchange Commission’s investigation attributed the cause of the crash to an abnor-mally large order erroneously inserted by a human trader. Although the jury is still out on the crash’s ultimate cause, algorithmic trading systems had an amplifying effect on the severity and breadth of that day’s equity markets’ decline.
Trading objectivesBanks are usually thought of as intermediaries, acting
as brokers or market makers or servicing clients by buying
ELECTRONIC TRADING
W ithin algorithmic trading, several closely related terms are used that are often confused. These include elec-
tronic trading, order-management systems, automated trading, systematic trading, and algorithmic trading.
Broadly, electronic trading is any method of exchanging securi-ties, stocks, bonds, foreign exchange (currency, Forex— or FX) and derivatives (options, futures, and so on). Within electronic trading, specialized programs bring together buyers and sellers through electronic media to create an exchange (such as Nasdaq). Order-management systems facilitate and manage order execution, generally connecting to one or more electronic exchanges. Auto-mated trading systems usually refer to trade execution programs that automatically submit trades to an exchange.
The distinguishing feature of algorithmic (referred to by some people as systematic) trading systems is the sophistication of their analysis and decision making. Broadly, these systems are deployed for highly liquid markets and high-frequency trading, such as equi-ties, futures, derivatives, bonds (US Treasuries), and foreign exchange (currencies). The essential characteristic of a highly liquid market is that there are ready and willing buyers and sellers at all times.
Central to these systems’ operation are financial protocols, such as the Financial Information Exchange (FIX) protocol, a series of messaging specifications for the electronic communication of trade-related messages. FIX messages are formed from several fields, and each field is a tag-value pairing, separated from the next field by a delimiter (similar to XML). The TAG is a string representa-tion of an integer that indicates the field’s meaning. The value is an array of bytes holding a specific value for that TAG. The FIX protocol also defines sets of fields comprising a particular message; within the sets of fields; some sets will be mandatory and others optional. There are various extensions to FIX, including FIXatdl, the FIX algo-rithmic trading definition language.
63NOVEMBER 2011
various purposes, including market making, spread trading (also known as relative value or basis trading), arbitrage, and macrotrading. Algorithmic trading therefore covers a wide variety of systems. In trade-execution programs, for example, the algorithm might decide aspects such as timing, price, and the order’s quantity splits. Other systems might automate the complete trading process.
As the “Algorithmic Trading System Components” side-bar describes, the trading process can be split into four stylized steps: pretrade analysis, trading signal generation, trade execution, and post-trade analysis.
or selling stocks or bonds. However, most banks and funds also engage in proprietary trading on their own accounts. Proprietary trading occurs when an institution actively trades stocks, bonds, options, commodities, derivatives, or other financial instruments with its own money as opposed to its customers’ money.
The type of trading—broker or proprietary—will shape the algorithmic trading strategy’s design; typically, broker algorithmic trading systems seek to minimize the cost of trading by optimizing the execution strategy—that is, minimize market impact cost or time to execution, optimize the price, and so on—whereas proprietary algo-rithmic trading systems seek to maximize profits against some measure of financial risk. In practice, all algorithms target profits, either in the form of cost savings or trading profit and loss; the difference is in who participates in the profits—the clients versus the trading firm—and who takes on the trading risk. Generally, the institution that is taking the risk also takes the lion’s share of the profits, whereas an institution acting only as intermediary col-lects a brokerage fee.
Current proprietary trading strategies include index ar-bitrage, statistical arbitrage, merger arbitrage, fundamental analysis, volatility arbitrage, and macrotrading.
Trading processAn intuitive way to classify algorithmic trading is
through the separate processes being automated within a trade’s life cycle. As Figure 2 illustrates, algorithmic trad-ing can be used at any stage of the trading process and for
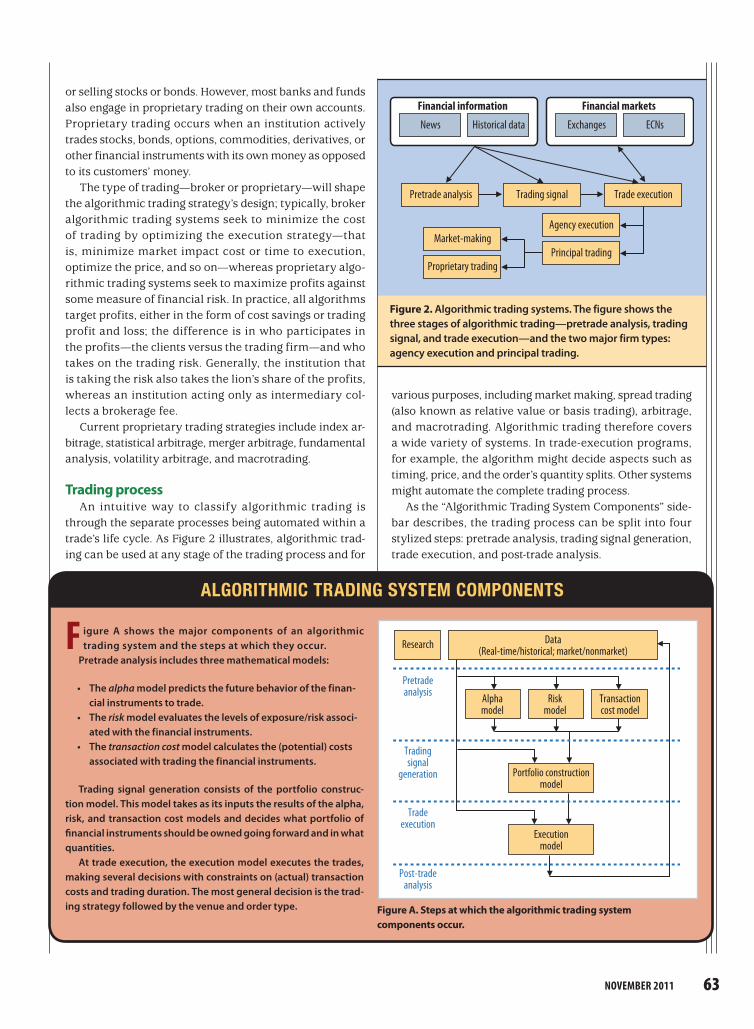
Figure 2. Algorithmic trading systems. The figure shows the three stages of algorithmic trading—pretrade analysis, trading signal, and trade execution—and the two major firm types: agency execution and principal trading.
Agency execution
Principal trading
Trade executionTrading signalPretrade analysis
Market-making
Proprietary trading
Historical dataNews
Financial information
ECNsExchanges
Financial markets
ALGORITHMIC TRADING SYSTEM COMPONENTS
F igure A shows the major components of an algorithmic trading system and the steps at which they occur.
Pretrade analysis includes three mathematical models:
• The alpha model predicts the future behavior of the finan-cial instruments to trade.
• The risk model evaluates the levels of exposure/risk associ-ated with the financial instruments.
• The transaction cost model calculates the (potential) costs associated with trading the financial instruments.
Trading signal generation consists of the portfolio construc-tion model. This model takes as its inputs the results of the alpha, risk, and transaction cost models and decides what portfolio of financial instruments should be owned going forward and in what quantities.
At trade execution, the execution model executes the trades, making several decisions with constraints on (actual) transaction costs and trading duration. The most general decision is the trad-ing strategy followed by the venue and order type.
Transactioncost model
Portfolio constructionmodel
Executionmodel
Alphamodel
Riskmodel
Research
Pretradeanalysis
Tradingsignal
generation
Tradeexecution
Post-tradeanalysis
Data(Real-time/historical; market/nonmarket)
Figure A. Steps at which the algorithmic trading system components occur.
RESE ARCH FE ATURE
COMPUTER 64
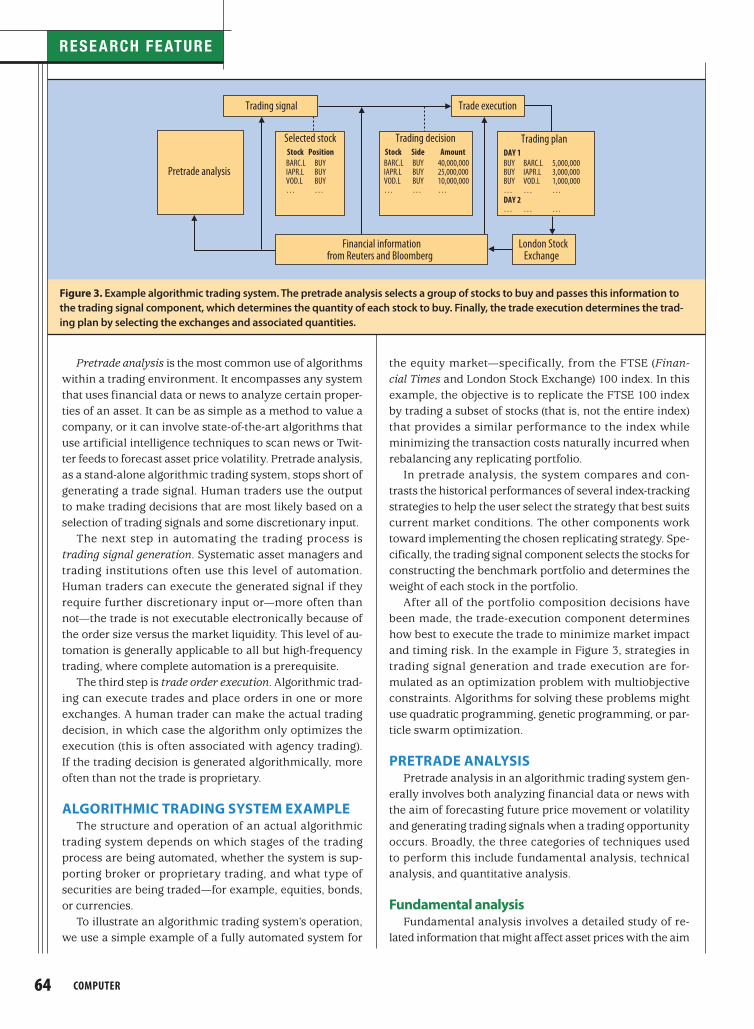
the equity market—specifically, from the FTSE (Finan-cial Times and London Stock Exchange) 100 index. In this example, the objective is to replicate the FTSE 100 index by trading a subset of stocks (that is, not the entire index) that provides a similar performance to the index while minimizing the transaction costs naturally incurred when rebalancing any replicating portfolio.
In pretrade analysis, the system compares and con-trasts the historical performances of several index-tracking strategies to help the user select the strategy that best suits current market conditions. The other components work toward implementing the chosen replicating strategy. Spe-cifically, the trading signal component selects the stocks for constructing the benchmark portfolio and determines the weight of each stock in the portfolio.
After all of the portfolio composition decisions have been made, the trade-execution component determines how best to execute the trade to minimize market impact and timing risk. In the example in Figure 3, strategies in trading signal generation and trade execution are for-mulated as an optimization problem with multiobjective constraints. Algorithms for solving these problems might use quadratic programming, genetic programming, or par-ticle swarm optimization.
PRETRADE ANALYSISPretrade analysis in an algorithmic trading system gen-
erally involves both analyzing financial data or news with the aim of forecasting future price movement or volatility and generating trading signals when a trading opportunity occurs. Broadly, the three categories of techniques used to perform this include fundamental analysis, technical analysis, and quantitative analysis.
Fundamental analysisFundamental analysis involves a detailed study of re-
lated information that might affect asset prices with the aim
Pretrade analysis is the most common use of algorithms within a trading environment. It encompasses any system that uses financial data or news to analyze certain proper-ties of an asset. It can be as simple as a method to value a company, or it can involve state-of-the-art algorithms that use artificial intelligence techniques to scan news or Twit-ter feeds to forecast asset price volatility. Pretrade analysis, as a stand-alone algorithmic trading system, stops short of generating a trade signal. Human traders use the output to make trading decisions that are most likely based on a selection of trading signals and some discretionary input.
The next step in automating the trading process is trading signal generation. Systematic asset managers and trading institutions often use this level of automation. Human traders can execute the generated signal if they require further discretionary input or—more often than not—the trade is not executable electronically because of the order size versus the market liquidity. This level of au-tomation is generally applicable to all but high-frequency trading, where complete automation is a prerequisite.
The third step is trade order execution. Algorithmic trad-ing can execute trades and place orders in one or more exchanges. A human trader can make the actual trading decision, in which case the algorithm only optimizes the execution (this is often associated with agency trading). If the trading decision is generated algorithmically, more often than not the trade is proprietary.
ALGORITHMIC TRADING SYSTEM EXAMPLEThe structure and operation of an actual algorithmic
trading system depends on which stages of the trading process are being automated, whether the system is sup-porting broker or proprietary trading, and what type of securities are being traded—for example, equities, bonds, or currencies.
To illustrate an algorithmic trading system’s operation, we use a simple example of a fully automated system for
Figure 3. Example algorithmic trading system. The pretrade analysis selects a group of stocks to buy and passes this information to the trading signal component, which determines the quantity of each stock to buy. Finally, the trade execution determines the trad-ing plan by selecting the exchanges and associated quantities.
Selected stock Trading decision
Trade execution
Trading plan DAY 1 BUY BARC.L 5,000,000BUY IAPR.L 3,000,000BUY VOD.L 1,000,000 … … …DAY 2… … …
Pretrade analysis
Trading signal
Financial informationfrom Reuters and Bloomberg
London StockExchange
Stock Side Amount
BARC.L BUY 40,000,000IAPR.L BUY 25,000,000VOD.L BUY 10,000,000… … …
Stock PositionBARC.L BUYIAPR.L BUYVOD.L BUY… …

65NOVEMBER 2011
Although fundamental analysis and technical analysis also use mathematical and statistical methods, they are primarily concerned with the deterministic relationship be-tween the asset price and related information. In contrast, quantitative analysis focuses on an asset price’s stochastic behavior. Consequently, quantitative analysis is generally related to the pricing of derivative products, such as options and swaps, whose fair value relies on the underlying asset’s stochastic property as well as the analysis of the temporal convergence and divergence of price movements of pairs and baskets of assets.
When used within an algorithmic trading system, quan-titative analysis typically generates trading signals when the current asset price differs from the asset’s fair value, such as in statistical arbitrage, which attempts to profit from pricing inefficiencies. The most commonly used and simplest case of statistical arbitrage is pairs trading, which tries to identify divergence of the correlated prices of two stocks.
Pretrade analysis exampleThis example uses genetic programming to identify
profit-making opportunities.6 Traders use genetic program-ming to find technical trading rules for a composite stock index. The algorithm aims to find decision rules that divide days into two disjoint categories: in the market (earning the market rate of return) or out of the market (earning the risk-free rate of return).
Each genetic structure represents a particular techni-cal trading rule. A trading rule returns either a buy or a sell signal for any given price history. Building blocks for trading rules include a simple function of past price data, numerical and logical constants, and logical functions that allow the combination of low-level building blocks to more complicated expressions.
The root node of each genetic structure corresponds to a Boolean function to ensure that the trading strategy is well-defined. Assessing the complexity of the trading rules is useful because it highlights the predictability of future returns using only historical prices. If the algorithm reveals complicated rules, the results would be consistent with a view that there is some kind of hidden structure that could be discovered from past prices. If it finds only relatively simple rules, the results would be more consistent with a view that past prices have limited value in predicting future returns.
of determining the asset’s fair value (or its potential future price movements). Relevant information might include the overall state of two countries’ economies (such as unem-ployment figures), interest rates, gross domestic product, or national policies. The idea that the current market price for an asset is not equivalent to its fair value contradicts the somewhat controversial efficient-market hypothesis, which suggests that the current price is a reflection of all the available information.5
Fundamental analysis typically generates trading sig-nals when the current asset price differs from the fair value obtained using discount models for the analysis; ratios, such as the price-to-earnings ratio; or certain fundamental properties, such as earnings yielding more than twice the AAA-rated bond yield. In the past few decades, analysts and traders have used advanced mathematical and statis-tical models from machine learning and computational statistics to determine the relationship between the stock price’s future value and its fundamental quantities with the aim of identifying stocks with a potential to appreciate (or depreciate) significantly.
Technical analysisTechnical analysis aims to predict future price move-
ments based on asset price history and, sometimes, related trading information such as trade volume. By assuming that the market’s price reflects all relevant information, technical analysis seeks to identify and exploit price move-ment patterns rather than examine the underlying factors affecting asset prices.
Many popular technical analysis techniques are based on the premise that asset prices move in trends, hence technical trading systems typically generate entry sig-nals when a new trend is identified and generate exit signals when a trend ends. Traditionally, they determine trends by analyzing the continuation patterns (such as the ascending symmetrical triangle pattern) and reversal patterns in a chart, as well as trend lines, support, and re-sistance areas. Technical traders also use indicators such as moving averages, advance-decline lines and ratios, the relative strength index, and the stochastic oscillator, which indicates market momentum. Recently, more complex modeling techniques have included trading rules formu-lated using genetic programming, or statistical time series forecasting methods such as autoregressive fractionally integrated moving-average models and neural networks.
Quantitative analysisQuantitative analysis treats asset prices as random and
uses mathematical and statistical analysis to find a suitable model for describing this randomness. This type of analysis has dominated the financial industry in recent decades, forming a solid foundation for portfolio theory, derivatives pricing, and risk management.
Assessing the complexity of the trading rules is useful because it highlights the predictability of future returns using only historical prices.

RESE ARCH FE ATURE
COMPUTER 66
The difference between pretrade analysis and trading signal generation is often blurred because there is generally substantial overlap between the two.
TRADING SIGNAL GENERATIONThe difference between pretrade analysis and trading
signal generation is often blurred because there is gen-erally substantial overlap between the two. The major difference between them is that an actual trading signal generated by an algorithm will come with a specific price (and possibly a quantity) and might even include risk man-agement recommendations, such as specific stop-loss values.
The distinguishing features are that pretrade analysis only offers recommendations to buy or sell, which are purposely left vague (at what price, with what trading horizon, and so on), whereas trading signal generation is augmented with specific values that can be translated into actual trades. In other words, a pretrade analysis recommendation ought to be seen as being only part of a possibly complex decision process that might ulti-mately be translated into a trading strategy. Conversely, a trading signal can be directly translated into a trad-ing strategy and—most importantly—can therefore be
replayed against historical market data to simulate its performance. The ability to simulate the performance of a trading signal is useful in assessing its value, yet it adds a great deal of complexity in that the trading signal must be able to correctly analyze diverse trading environments, such as the volatile few minutes following an important economic data release or quiet and illiquid market times during Asian trading hours.
Pretrade analysis overlaps trading signal generation in providing a recommendation on when (if not at what price) to enter into a trade; a trading signal must also pro-vide a strategy to close out the trade. Exit strategies, risk management, and cash management are popular strate-gies to complete the round-trip of a trade.
Entry strategiesTo generate a signal, an algorithmic trading system
must generate an entry strategy. This can be as simple as a fixed expected profit, such as a predetermined differ-ence between the current price and the fair value, if using a fundamental analysis system. Conversely, a technical analyst might define the start of a trend as a simple entry point for a trade.
Unfortunately, simple rules often have two main deficiencies:
• The trading signal might oscillate (from buy to sell) for prolonged periods, thus incurring large transactional costs.
• The rule might be unable to detect a regime shift that would invalidate the model’s assumptions and thus the trading signal.
Clearly, to improve an entry strategy we might need to add further complexity to the trading rules. For example, we might want to impose a minimum number of consecu-tive identical trade recommendations to improve a trading signal that oscillates between opposing trades. The set of possible additional rules is large and varied; furthermore, the effect of combining more than one rule can be complex. Although undeniably a requirement, forming complex and profitable entry strategies is still somewhat of an art, at least in the selection of homogeneous rules and rule pa-rameters to search through.
Exit strategiesDeveloping an exit strategy requires specifying when to
take profits and when to exit a trade at a loss. For example, we might want to stay in the trade as long as our assump-tion about the market remains valid to maximize profits, and exit the trade as soon as our assumption is proven wrong.
In practice, this determination largely depends on the system’s trading strategy. For example, a fundamental trading strategy that opens a buy position when an asset’s value is less than its fundamental value might keep the position open until the asset price moves closer to its fair value, while exiting the position (possibly with a loss) when changes in the underlying factors reduce the asset’s funda-mental value.
A technical trading strategy might keep the position open until it reaches a desired target, but will exit with a loss if the pattern or the trend used to enter the trade is proved wrong. For example, a strategy that trades a resistance level (a specific price level that we expect not to be surpassed in the near future) might close the posi-tion if the price moves decidedly above this level. These exit strategies are generally implemented by a stop-loss order—that is, an order to buy (or sell) an asset once its price has climbed above (or fallen below) a specified price.
Risk managementFor each trading opportunity, a trading system must cal-
culate how to manage its market exposure. This is perhaps more important than making entry and exit decisions as poor risk management can easily turn a profitable trading system into a loss-making one. This is, in its basic form, a method to decide how much (that is, what quantity) to trade for each signal.

67NOVEMBER 2011
patiently to get a better price by submitting limit orders. As a result, selecting an appropriate execution strategy for a particular trade is not a trivial task; rather, it involves several decisions, each a challenge in itself.
Trading venuesMany financial instruments can be traded in more than
one financial market. Thus, trading systems must deter-mine which market to submit the order to. Some of the most important characteristics the trader considers are liquidity, trading mechanism, degree of trader anonymity, and differential execution costs.
Trading systems generally choose to submit orders to the market with the most liquidity because a highly liquid market is usually associated with fast trade execution and low transaction costs. For example, when immediacy is required, a system will typically trade in a continuous double-auction market; otherwise, it will likely trade in a periodic auction, which has lower price volatility.
Trading schedulesA system might break a large order into several smaller
orders to minimize the trade’s impact on the market, be-cause a small order is more likely to flow under the market’s radar than a large order. However, delayed execution of smaller orders can expose a trader to potential adverse price movements as well as to an opportunity cost. Generat-ing an optimal trade schedule involves achieving a desired balance between price impact and opportunity cost.
In the past decade, interest in optimal trade schedule models has increased. Typically, there are two main steps in specifying the trading objective:
1. Determine execution cost by defining the specifica-tion of transactional cost and choosing the desired benchmark price (for example, previous close, open-ing price, arrival price, volume-weighted average price [VWAP], time-weighted average price [TWAP], and future close).
2. Specify the degree of risk aversion (that is, how much to penalize variance relative to expected cost), which indicates the level of trading aggressiveness or passiveness.
Aggressive trading is associated with higher cost and less risk, whereas passive trading is associated with lower market impact and higher risk. An arithmetic random walk
Several approaches address this problem. The simplest and most traditional method is a fixed-amount system, which places an arbitrary fixed amount in every trade. The problem with this method is that it does not distinguish between periods of high and low volatility. Intuitively, we might want to trade larger quantities during low volatile periods and smaller ones during volatile periods. In other words, we might look to target a constant risk-adjusted return, though we must ultimately accept that our view of future volatility is but an estimation of what will be the realized market volatility. A further option is to use a fixed fractional system that simply risks f percent of the capital on every trade. The optimal fixed fractional system (some-times referred to as optimal-f strategy) can maximize the geometric growth rate for a series of trades.
Trading signal exampleTo illustrate trading signal generation, we use a trading
signal technique based on alpha generation7 for an ex- change traded fund (ETF), a fund that can be traded on exchange like regular stock. For a trading signal technique based on alpha generation, alpha is defined as excess risk-adjusted returns measured above a benchmark. In this case, the alpha generator—the trading signal—will determine if a security can generate excess returns or returns higher than a preselected benchmark with a controlled risk, when added to an existing portfolio of assets. Analysts use these signals to develop mathematical and statistical models that help de-termine whether a specific investment might be profitable.
A mean-reverting ETF strategy example assumes that the returns of each asset within the ETF will, in the long run, converge to the overall ETF’s return. Therefore, an asset that underperforms its peers will be expected to catch up, and vice versa. Given a specific level of under- or overperfor-mance, and satisfying a predetermined entry strategy rule set, we systematically buy underperforming assets and sell outperforming ones in the hope that our mean-reverting assumptions are correct.
TRADE EXECUTIONAfter generating the trading signal, an algorithmic trading
system must make several decisions regarding constraints on transaction costs and trading duration. To execute a trade, an order must be submitted to a trading venue, with the choice depending on several factors including order size, trading mechanism, and degree of trader’s anonymity. If the trade is too large to execute in a single order in an open market, the system must either break it down into several smaller orders, which it submits to the market over a period of time to minimize market impact, or execute it in alterna-tive markets such as crossing networks or dark pools that do not publicly reveal the current order book.
The system must also determine whether to execute the trade immediately by submitting market orders, or trade
Generating an optimal trade schedule involves achieving a desired balance between price impact and opportunity cost.
RESE ARCH FE ATURE
COMPUTER 68
FUTURE INFLUENCESThree areas are influencing the future of algorithmic
trading systems.Dark pools are a type of platform that allows the trad-
ing of large blocks of shares without revealing quantities or prices publicly (to other traders) until after trades are completed. Dark pools are similar to standard markets (with similar order types, pricing rules, and prioritization rules), but they do not publicly display the order book. These dark liquidity pools offer institutional investors many of the efficiencies associated with trading on the exchanges’ public limit order books but without showing their hands to others. However, they are criticized for their lack of transparency and because they could lead to less efficient pricing than traditional open exchanges.
Ultrahigh-frequency trading refers to the buying and selling of stocks at extremely fast speeds with the help of powerful computers. Using algorithms, these computers can scan dozens of public and private markets simulta-neously, execute thousands of orders a second, and alter strategies in a matter of milliseconds. In the US, ultra-high-frequency trading firms represent 2 percent of the approximately 20,000 firms operating today, but they account for 73 percent of all equity trading volume. In ultrahigh-frequency trading, a trader or algorithmic trading system measures its holding period in seconds, sometimes even in hundreds of milliseconds.
Exchange traded funds combine the valuation feature of a mutual fund or unit investment trust (which can be bought or sold at the end of each trading day for its net asset value) with the tradability feature of a closed-end fund (which trades throughout the trading day at prices that might be more or less than its net asset value). An ETF holds assets such as stocks or bonds and trades at approximately the same price as the net asset value of its underlying assets over the course of the trading day. ETFs provide fertile grounds for algorithmic trading systems because they are a new multiasset instrument that makes their trading more complex, hence they offer a greater technical challenge.
A lgorithmic trading might be described as an arms race drawing on the skills of top computing pro-fessionals. Traditionally, investment banks and
funds hired economists for trading positions and com-puting professionals for technology posts. Now, given the increasing importance of algorithmic trading in financial markets, firms are seeking trader-program-mers skilled in C-based languages and analytics (such as computational statistics and machine learning). For computing professionals interested in finance, it is a stimulating and certainly well-paid career.
is often the most popular model for specifying the dynam-ics of future market prices. Given specifications of all the factors, an optimal trading strategy for a specific trading objective might be obtained by solving the corresponding stochastic dynamic optimization problem.
Order typeThe two main types of trades are market orders and
limit orders. When market conditions permit (that is, there is enough liquidity), a market order provides immediate ex-ecution, but the execution price is uncertain. A limit order guarantees the execution price, but it can sometimes be executed only partially or not at all.
Traditionally, the decision whether to submit a market order or a limit order to execute the trade is examined in the context of the tradeoff between the payoff associated with limit orders and the risk of nonexecution. Placing an order far from the best bid or ask price will increase the payoff, but the larger the distance from the best price, the larger the chance that the order will not be executed. The key is finding the right tradeoff. Undoubtedly, one of the most important factors in valuing such tradeoffs is having a model of limit order execution times and the associated execution probability. This is because the expected profit of traders who decide to trade via limit orders is an increasing function of the execution probability.
Trade execution exampleA trade execution system’s main objective is to reduce
the hidden costs of trading by balancing the tradeoff be-tween market impact and timing risk over the trading horizon.8 The system provides the necessary transparency and flexibility to develop a customized algorithmic strategy to ensure that the algorithm’s parameters are consistent with the overall investment goal.
To use the system, investors must specify the bench-mark price—that is, the price they are trying to achieve (for example, previous close price, day’s closing price, VWAP, TWAP, or day closing price), trading style (for example, aggressive, normal, or patient), and preferred adaptation tactic. This tactic describes how they want the algorithm to adapt to changing market conditions, such as becom-ing more aggressive in times of favorable prices and more passive in times of adverse price movement. Combining these requirements with a model of market impact and the dynamics of future market prices, and solving the corresponding optimization problem, generates the op-timal trading strategy. Traders approximate the market impact model by fitting some parametric function with the historical data, while assuming that the dynamics of future market prices will follow an arithmetic random walk model (that is, the market randomly moves up or down with a given probability that is proportional to the asset’s expected volatility).

Donate today at www.ieeefoundation.org
Every innovative, life-changing idea comes from someone’s imagination.
The IEEE Foundation provides resources to advance education, innovation and preservation. Make a gift—and imagine the diff erence you can make.
Imagine a teenager excited about technology
09-FND-0209e-FndEducationAd-HPCompSoc-Final.indd 1 11/23/09 11:41:02 AM
69NOVEMBER 2011
References 1. A. Chaboud et al., “Rise of the Machines: Algorithmic
Trading in the Foreign Exchange Market,” Int’l Finance Discussion Papers, Board of Governors of the Federal Re-serve System, Oct. 2009; www.federalreserve.gov/pubs/ifdp/2009/980/ifdp980.pdf.
2. T. Hendershott, C.M. Jones, and A.J. Menkveld, “Does Algo-rithmic Trading Improve Liquidity?” J. Finance, Feb. 2011, pp. 1-33.
3. R.K. Narang, Inside the Black Box: The Simple Truth About Quantitative Trading, Wiley Finance, 2009.
4. Report of the Staffs of the CFTC and SEC to the Joint Advi-sory Committee on Emerging Regulatory Issues, “Findings Regarding the Market Events of May 6, 2010”; www.sec. gov/news/studies/2010/marketevents-report.pdf.
5. M.H. Pesaran, “Predictability of Asset Returns and the Ef-ficient Market Hypothesis,” A. Ullah and D.E. Giles, eds., Handbook of Empirical Economics and Finance, Taylor & Francis, 2010, pp. 281-312.
6. M.A. Kaboudan, “Genetic Programming Prediction of Stock Prices,” J. Computational Economics, Dec. 2000, pp. 207-236.
7. J.M. Hill, “Alpha as a Net Zero-Sum Game,” J. Portfolio Management, vol. 32, no. 4, 2006, pp. 24-32.
8. R. Kissell and R. Malamut, “Algorithm Decision Making Framework,” J. Trading, vol. 1, no. 1, 2006, p. 10.
Giuseppe Nuti is an honorary senior research fellow in the Department of Computer Science at University College London and has worked at both Deutsche Bank and Citadel Securi-ties developing trading algorithms within the fixed-income asset class. His research interests include nonparametric asset distribution estimation, optimal execution strategies, and multivariable Bayesian statistics. Nuti received a PhD in com-puter science from University College London. Contact him at [email protected].
Mahnoosh Mirghaemi is a PhD student in the Department of Computer Science at University College London. His re-search interests include the econometrics of high-frequency fixed-income data and its application in algorithmic trading. Mirghaemi received an MSc in financial mathematics from Kings College London. Contact him at [email protected].
Philip Treleaven is professor of computing at University College London and director of the UK Centre in Financial Computing, a partnership of University College London, the London School of Economics, and the London Business School. His research interests include computational finance and artificial intel-ligence. Treleaven received a PhD in computer science from the University of Manchester, UK. He is a member of IEEE and the IEEE Computer Society. Contact him at [email protected].
Chaiyakorn Yingsaeree is a PhD student in the Department of Computer Science at University College London, where his research is supported by a scholarship from the National Electronics and Computer Technology Center, Thailand. His research interests include the modeling of limit-order execution and its application in algorithmic trading. Yingsaeree received an MSc in engineering from Kasetsart University, Thailand. Contact him at [email protected].
Selected CS articles and columns are available for free at http://ComputingNow.computer.org.