algorithms in bioinformatics twokhuri/sigcse_2018/motifs/sigcse... · 2.5 february 2018 ©2018 sami...
TRANSCRIPT
2.1
February 2018
©2018 Sami Khuri
SIGCSE 2018Motifs
©2018 Sami Khuri©2018 Sami Khuri
Algorithms inBioinformatics
TWOMotifs
Sami KhuriDepartment of Computer Science
San José State University
©2018 Sami Khuri©2018 Sami Khuri
Discovering Genomics, Proteomics, and Bioinformaticsby A. Malcolm Campbell and Laurie J. Heyer
Chapter 2 Genome Sequence Acquisition and Analysis
ISBN 0-8053-8219-4Copyright © 2006 A. Malcolm Campbell
Chapter 2: Math Minute 2.2
©2018 Sami Khuri©2018 Sami Khuri
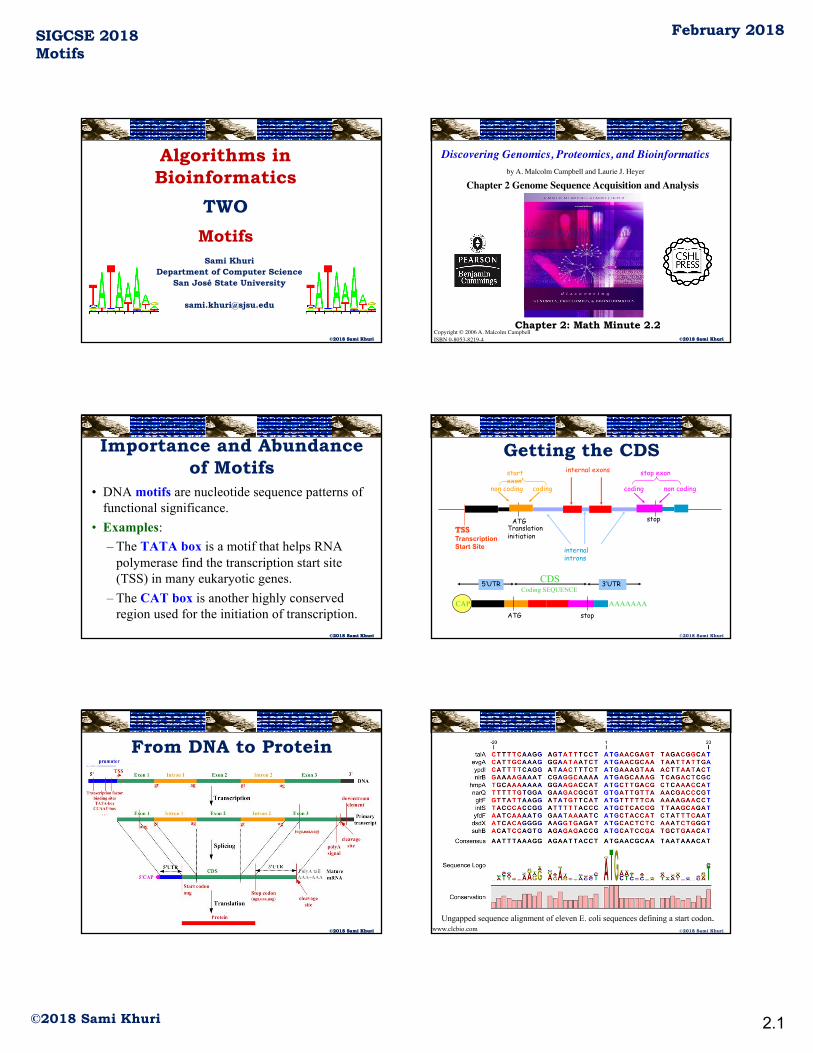
Importance and Abundance of Motifs
• DNA motifs are nucleotide sequence patterns of functional significance.
• Examples:– The TATA box is a motif that helps RNA
polymerase find the transcription start site (TSS) in many eukaryotic genes.
– The CAT box is another highly conserved region used for the initiation of transcription.
©2018 Sami Khuri
5’UTR 3’UTR
ATG stop
internal exonsstart exon
stop exon
non coding coding non codingcoding
ATG
stopTranslation initiation
AAAAAAACAP
ATG
Coding SEQUENCECDS
TSSTranscriptionStart Site
stop
internal introns
Getting the CDS
©2018 Sami Khuri©2018 Sami Khuri
From DNA to Protein
©2018 Sami Khuri
Ungapped sequence alignment of eleven E. coli sequences defining a start codon.www.clcbio.com

2.2
February 2018
©2018 Sami Khuri
SIGCSE 2018Motifs
©2018 Sami Khuri©2018 Sami Khuri
E.Coli Promoter Sequences
©2018 Sami Khuri©2018 Sami Khuri
Anatomy of an Intron
logo logologo
©2018 Sami Khuri©2018 Sami Khuri
Conserved Sequences in Introns
The conserved nucleotides in the transcript are recognized by small nuclear ribonucleoprotein particles (snRNPs), which are complexes of protein and small nuclear RNA. A functional splicing unit is composed of a team of snRNPs called a spliceosome.
©2018 Sami Khuri©2018 Sami Khuri
Sequence Motifs
©2018 Sami Khuri©2018 Sami Khuri
Detecting MotifsA motif is a sequence pattern of functional significance.Example: The TATA box is a motif that helps the polymerase find the transcription start site.
©2018 Sami Khuri©2018 Sami Khuri
Creating Tables of FrequenciesThe probability of having an A in the first position is: 61/389 = 0.1568The probability of a T in the second position is: 309/389 = 0.7943Similarly for all 4 bases at all 15 positions.We can thus create a table of frequencies.
2.3
February 2018
©2018 Sami Khuri
SIGCSE 2018Motifs
©2018 Sami Khuri©2018 Sami Khuri
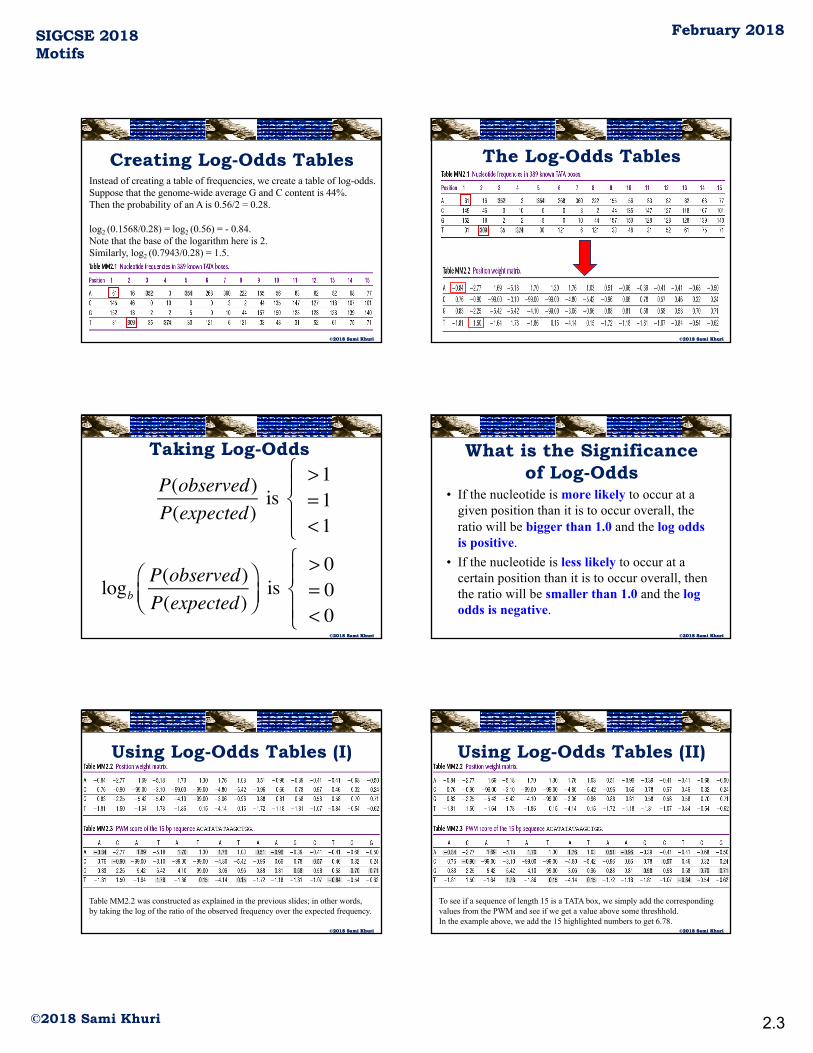
Creating Log-Odds TablesInstead of creating a table of frequencies, we create a table of log-odds.Suppose that the genome-wide average G and C content is 44%.Then the probability of an A is 0.56/2 = 0.28.
log2 (0.1568/0.28) = log2 (0.56) = - 0.84. Note that the base of the logarithm here is 2.Similarly, log2 (0.7943/0.28) = 1.5.
©2018 Sami Khuri©2018 Sami Khuri
The Log-Odds Tables
©2018 Sami Khuri©2018 Sami Khuri
Taking Log-Odds
P(observed)P(expected)
is >1= 1<1
⎧⎨⎪
⎩⎪
logbP(observed)P(expected)
⎛⎝⎜
⎞⎠⎟
is > 0= 0< 0
⎧⎨⎪
⎩⎪©2018 Sami Khuri©2018 Sami Khuri
What is the Significance of Log-Odds
• If the nucleotide is more likely to occur at a given position than it is to occur overall, the ratio will be bigger than 1.0 and the log odds is positive.
• If the nucleotide is less likely to occur at a certain position than it is to occur overall, then the ratio will be smaller than 1.0 and the log odds is negative.
©2018 Sami Khuri©2018 Sami Khuri
Using Log-Odds Tables (I)
Table MM2.2 was constructed as explained in the previous slides; in other words,by taking the log of the ratio of the observed frequency over the expected frequency.
©2018 Sami Khuri©2018 Sami Khuri
Using Log-Odds Tables (II)
To see if a sequence of length 15 is a TATA box, we simply add the corresponding values from the PWM and see if we get a value above some threshhold. In the example above, we add the 15 highlighted numbers to get 6.78.
2.4
February 2018
©2018 Sami Khuri
SIGCSE 2018Motifs
©2018 Sami Khuri©2018 Sami Khuri
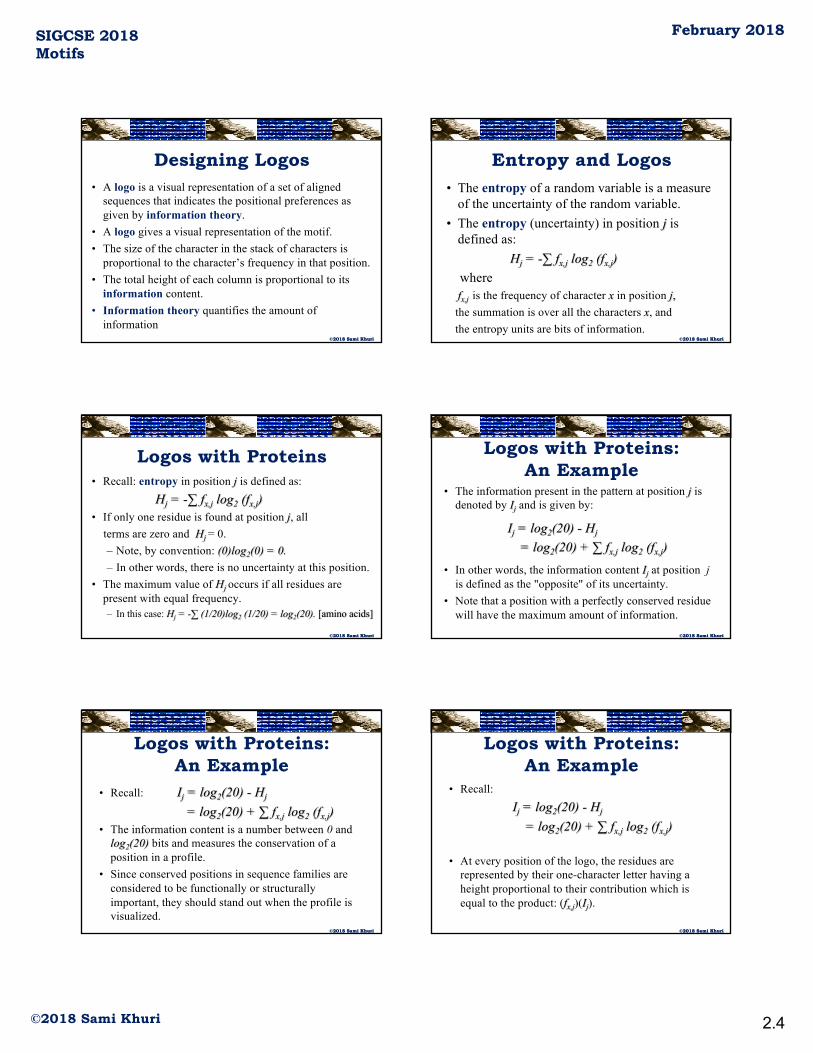
Designing Logos• A logo is a visual representation of a set of aligned
sequences that indicates the positional preferences as given by information theory.
• A logo gives a visual representation of the motif.• The size of the character in the stack of characters is
proportional to the character’s frequency in that position.• The total height of each column is proportional to its
information content.• Information theory quantifies the amount of
information©2018 Sami Khuri©2018 Sami Khuri
Entropy and Logos• The entropy of a random variable is a measure
of the uncertainty of the random variable.• The entropy (uncertainty) in position j is
defined as:Hj = -∑ fx,j log2 (fx,j)
where fx,j is the frequency of character x in position j,the summation is over all the characters x, andthe entropy units are bits of information.
©2018 Sami Khuri©2018 Sami Khuri
Logos with Proteins• Recall: entropy in position j is defined as:
Hj = -∑ fx,j log2 (fx,j) • If only one residue is found at position j, all
terms are zero and Hj = 0.– Note, by convention: (0)log2(0) = 0. – In other words, there is no uncertainty at this position.
• The maximum value of Hj occurs if all residues are present with equal frequency. – In this case: Hj = -∑ (1/20)log2 (1/20) = log2(20). [amino acids]
©2018 Sami Khuri©2018 Sami Khuri
Logos with Proteins: An Example
• The information present in the pattern at position j is denoted by Ij and is given by:
Ij = log2(20) - Hj
= log2(20) + ∑ fx,j log2 (fx,j)
• In other words, the information content Ij at position jis defined as the "opposite" of its uncertainty.
• Note that a position with a perfectly conserved residue will have the maximum amount of information.
©2018 Sami Khuri©2018 Sami Khuri
Logos with Proteins: An Example
• Recall: Ij = log2(20) - Hj
= log2(20) + ∑ fx,j log2 (fx,j) • The information content is a number between 0 and
log2(20) bits and measures the conservation of a position in a profile.
• Since conserved positions in sequence families are considered to be functionally or structurally important, they should stand out when the profile is visualized.
©2018 Sami Khuri©2018 Sami Khuri
Logos with Proteins: An Example
• Recall:Ij = log2(20) - Hj
= log2(20) + ∑ fx,j log2 (fx,j)
• At every position of the logo, the residues are represented by their one-character letter having a height proportional to their contribution which is equal to the product: (fx,j)(Ij).
2.5
February 2018
©2018 Sami Khuri
SIGCSE 2018Motifs
©2018 Sami Khuri©2018 Sami Khuri
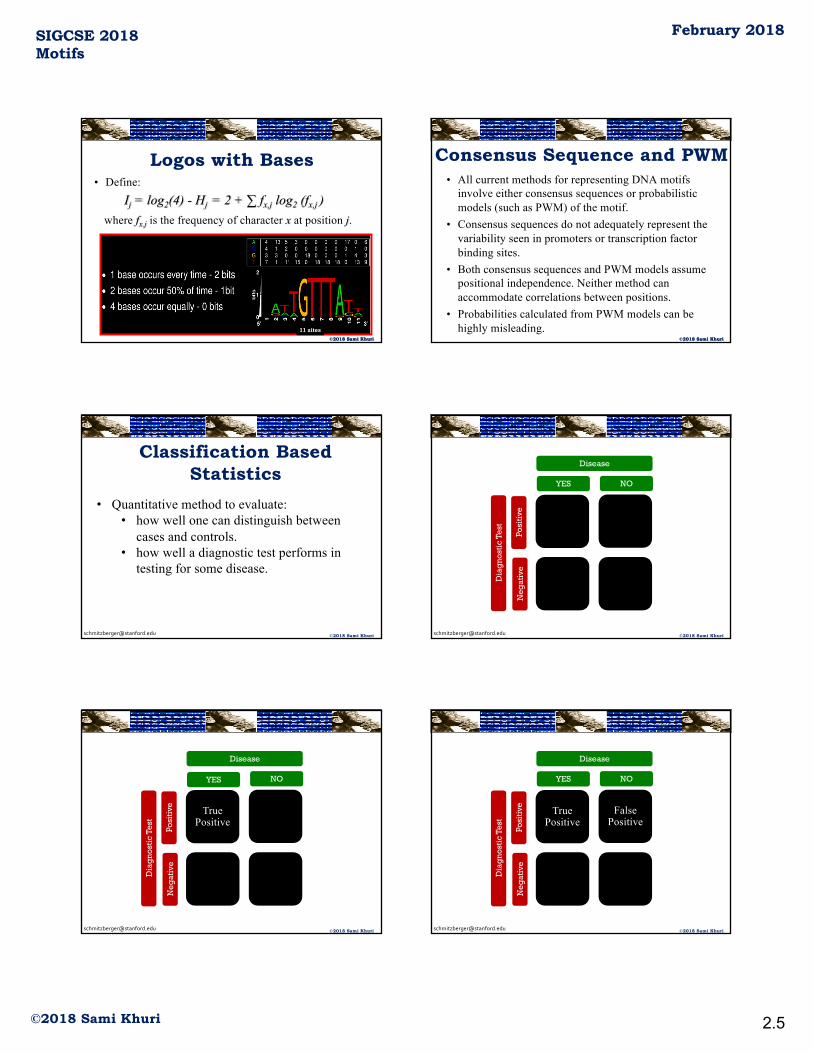
Logos with Bases• Define:
Ij = log2(4) - Hj = 2 + ∑ fx,j log2 (fx,j ) where fx.j is the frequency of character x at position j.
11 sites©2018 Sami Khuri©2018 Sami Khuri
Consensus Sequence and PWM• All current methods for representing DNA motifs
involve either consensus sequences or probabilistic models (such as PWM) of the motif.
• Consensus sequences do not adequately represent the variability seen in promoters or transcription factor binding sites.
• Both consensus sequences and PWM models assume positional independence. Neither method can accommodate correlations between positions.
• Probabilities calculated from PWM models can be highly misleading.
©2018 Sami Khuri
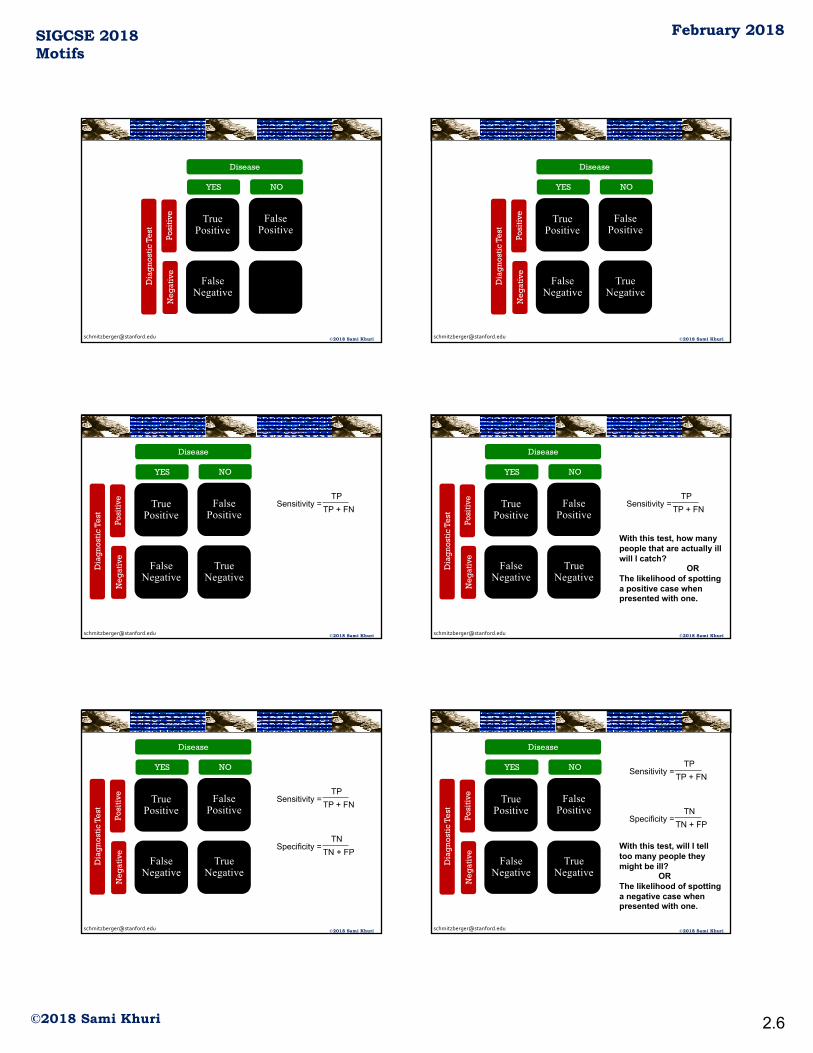
Classification Based Statistics
• Quantitative method to evaluate: • how well one can distinguish between
cases and controls.• how well a diagnostic test performs in
testing for some disease.
[email protected] ©2018 Sami Khuri
Disease
YES NO
Dia
gno
stic
Tes
t
Neg
ativ
ePo
sitiv
e
©2018 Sami Khuri
True Positive
Disease
YES NO
Dia
gno
stic
Tes
t
Neg
ativ
ePo
sitiv
e
[email protected] ©2018 Sami Khuri
True Positive
False Positive
Disease
YES NO
Dia
gno
stic
Tes
t
Neg
ativ
ePo
sitiv
e
2.6
February 2018
©2018 Sami Khuri
SIGCSE 2018Motifs
©2018 Sami Khuri
True Positive
False Positive
False Negative
Disease
YES NO
Dia
gno
stic
Tes
t
Neg
ativ
ePo
sitiv
e
[email protected] ©2018 Sami Khuri
True Positive
False Positive
False Negative
True Negative
Disease
YES NO
Dia
gno
stic
Tes
t
Neg
ativ
ePo
sitiv
e
©2018 Sami Khuri
True Positive
False Positive
False Negative
True Negative
Disease
YES NO
Dia
gno
stic
Tes
t
Neg
ativ
ePo
sitiv
e
Sensitivity = TP
TP + FN
[email protected] ©2018 Sami Khuri
True Positive
False Positive
False Negative
True Negative
Disease
YES NO
Dia
gno
stic
Tes
t
Neg
ativ
ePo
sitiv
e
Sensitivity = TP
TP + FN
With this test, how many people that are actually illwill I catch?
ORThe likelihood of spotting a positive case when presented with one.
©2018 Sami Khuri
True Positive
False Positive
False Negative
True Negative
Disease
YES NO
Dia
gno
stic
Tes
t
Neg
ativ
ePo
sitiv
e
Sensitivity = TP
TP + FN
Specificity = TN
TN + FP
[email protected] ©2018 Sami Khuri
True Positive
False Positive
False Negative
True Negative
Disease
YES NO
Dia
gno
stic
Tes
t
Neg
ativ
ePo
sitiv
e
Sensitivity = TP
TP + FN
Specificity = TN
TN + FP
With this test, will I telltoo many people they might be ill?
ORThe likelihood of spotting a negative case when presented with one.

2.7
February 2018
©2018 Sami Khuri
SIGCSE 2018Motifs
©2018 Sami Khuri©2018 Sami Khuri
Medical Test Evaluation
■ True Positives = Test states you have the disease when you do have the disease
■ True Negatives = Test states you do not have the disease when you do not have the disease
■ False Positives = Test states you have the disease when you do not have the disease
■ False Negatives = Test states you do not have the disease when you do
©2018 Sami Khuri©2018 Sami Khuri
Evaluating Medical Tests■ Sensitivity =The probability of having a positive test
result among those with a positive diagnosis for the disease– Sensitivity
= True Positives / True Positives + False Negatives
■ Specificity = The probability of having a negative test result among those with a negative diagnosis for the disease– Specificity
= True Negatives / True Negatives + False Positives