alice - micauw.org alice report... · andrew abrahamson helen mcginnis dan treglia, ph.d. alice...
TRANSCRIPT

STUDY OF FINANCIAL HARDSHIP
UnitedWayALICE.org/Michigan
Winter 2017
ALICE®
ASSET LIMITED, INCOME CONSTRAINED, EMPLOYED

Albion-Homer United Way
Allegan County United WayBarry County United WayBranch County United WayCapital Area United WayChar-Em United WayCheboygan County United WayChelsea United Way
Copper Country United Way
Crawford County United Way
Eaton County United Way
Gogebic Range United Way
Greater Huron County United Way
Greater Ottawa County United Way
Heart of West Michigan United WayLivingston County United WayMarshall United Way
Mecosta-Osceola United WayOgemaw County United Way
Oscoda Area United Way
Otsego County United WayPlymouth Community United Way
Roscommon County United WayShiawassee United WaySt. Joseph County United Way
Tri-City Area United WayUnited Way for Southeastern MichiganUnited Way of Bay County
United Way of Clare and Gladwin CountiesUnited Way of Delta CountyUnited Way of Dickinson County
United Way of Eastern Upper PeninsulaUnited Way of Genesee CountyUnited Way of Gratiot & Isabella CountiesUnited Way of Jackson CountyUnited Way of Lapeer CountyUnited Way of Manistee CountyUnited Way of Marquette County
United Way of Mason CountyUnited Way of Midland CountyUnited Way of Monroe/Lenawee CountiesUnited Way of Montcalm-Ionia CountiesUnited Way of Northeast MichiganUnited Way of Northwest MichiganUnited Way of Saginaw CountyUnited Way of Sanilac County
United Way of Southwest Michigan
United Way of St. Clair County
United Way of the Battle Creek and Kalamazoo RegionUnited Way of the LakeshoreUnited Way of Tuscola CountyUnited Way of Washtenaw CountyUnited Way of Wexford and Missaukee CountiesVan Buren County United Way
THE UNITED WAYS OF MICHIGAN
Note: In addition to the corporate sponsorships, this Report was made possible by the United Ways noted above in bold.
Thanks to Consumers Energy Foundation, Michigan’s funding partner
NATIONAL ALICE ADVISORY COUNCILThe following companies are major funders and supporters of the United Way ALICE Project.
Aetna Foundation | AT&T | Atlantic Health System | Deloitte | Entergy | Johnson & Johnson KeyBank | Novartis Pharmaceuticals Corporation | OneMain Financial Thrivent Financial Foundation | UPS | U.S. Venture

ii
LETTER TO THE COMMUNITYDear Michiganders,
The launch of the 2014 Michigan United Way ALICE Report (for Asset Limited, Income Constrained, Employed), provided us with greater understanding of the struggles of hard-working families in our communities and the conditions that define their financial hardship.
This 2017 update to the Report shows that many Michiganders are still struggling.
Communities across Michigan continue to have concerns regarding the state of financial hardship that exists with 40 percent of Michigan households, and the growing need for programmatic and policy solutions to help our friends and neighbors reach financial stability.
ALICE represents the men and women of all ages and races who get up each day to go to work, but who face tough financial choices. ALICE is not an individual, but a conceptual blending of all those in our community who bring home a paycheck that doesn’t stretch to cover household needs. ALICE is glad to have a job, proud of their work, and happy to contribute to the community. ALICE has no cushion. ALICE has no fall back, their assets are limited, and their income is constrained. ALICE is one crisis away from poverty. A rent hike, a family illness, the need for new car tires, things that the rest of us see as an inconvenience, are a crisis for ALICE all across our nation.
When the first United Way ALICE Report of low-wage workers was launched, the findings underscored how the fate of our community is directly connected to ALICE. With this update, that core fact remains. ALICE is an important part of our communities. Stability in the lives of ALICE is positive for the companies that employ them and the overall economy. We need to bring this conversation to a higher level, showing others that ALICE is integral to the social fabric of our society – across the nation.
The key is prevention – finding ways to keep people from falling off the edge, either into ALICE or from ALICE into poverty. This report allows us to look upstream and think about populations that are teetering on that edge.
Our goal, and the goal of the United Way ALICE Project, is to place a clearer lens on the ALICE population. By learning how to give people more and better opportunities to build stability for themselves and their families, we take another step toward restoring that dream.
Together we have an opportunity to raise awareness, stimulate conversation and create solutions that offer ALICE and our communities a better future. I hope that this update will leave you better informed and newly inspired by the potential that we have when we work together to improve the financial stability of this demographic.
Together, we can strengthen our communities across Michigan and build a better tomorrow.
Sincerely,
Ann T. Fillmore, United Way of Midland County Executive Director, Michigan ALICE Steering Committee Chair

iii
THE UNITED WAY ALICE PROJECTThe United Way ALICE Project provides a framework, language, and tools to measure and understand the struggles of the growing number of households in our communities that do not earn enough to afford basic necessities, a population called ALICE. This research initiative partners with state United Way organizations to present data that can stimulate meaningful discussion, attract new partners, and ultimately inform strategies that affect positive change.
Based on the overwhelming success of this research in identifying and articulating the needs of this vulnerable population, the United Way ALICE Project has grown from a pilot in Morris County, New Jersey in 2009, to the entire state of New Jersey in 2012, and now to the national level with 15 states participating.
United Ways of Michigan are proud to join the some 450 United Ways from these states to better understand the struggles of ALICE. Organizations across the country are also using this data to better understand the struggles and needs of their employees, customers, and communities. The result is that ALICE is rapidly becoming part of the common vernacular, appearing in the media and in public forums discussing financial hardship in communities across the country.
Together, United Ways, government agencies, nonprofits, and corporations have the opportunity to evaluate current initiatives and discover innovative approaches that give ALICE a voice, and create changes that improve life for ALICE and the wider community.
To access reports from all states, visit UnitedWayALICE.org
States with United Way ALICE Reports
MarylandDistrict ofColumbia
Oregon
Nevada
California
Washington Montana
Idaho
North Dakota
Wyoming
South Dakota
Nebraska
Kansas
Minnesota
Wisconsin
Illinois
Missouri
Iowa
Oklahoma
Texas
ColoradoUtah
Arizona New MexicoArkansas Tennessee
Kentucky Virginia
Pennsylvania
Delaware
ConnecticutRhode Island
Massachusetts
New HampshireVermont
Maine
New Jersey
New York
North Carolina
South Carolina
Indiana
Michigan
Ohio
Alabama
Georgia
Florida
MississippiLouisiana
Hawaii
Alaska
West Virginia
First Cohort (2014)
New Jersey (2012)
Second Cohort (2015-16)
Third Cohort (2016-17)

iv
David Callejo Pérez, Ed.D. Saginaw Valley State University
Neil Carlson, Ph.D. Calvin College
David Clifford, Ph.D. Eastern Michigan University
Lee Coggin, J.D. Baker College of Muskegon
Huda Fadel, M.P.H., Ph.D. Blue Cross Blue Shield of Michigan
Ryan Gimarc Talent 2025
Jane Johnson, M.A. Department of Human Services, Muskegon County
Rex LaMore, Ph.D. Michigan State University
Katherine Frohardt-Lane, Ph.D. Data Driven Detroit
Matt McCauley, M.P.A. Networks Northwest
Kurt Metzger, M.A. Data Driven Detroit
Brian Pittelko, M.P.A. W.E. Upjohn Institute for Employment Research
René Pérez Rosenbaum, Ph.D. Michigan State University
Peter Ruark, M.S.W. Michigan League for Public Policy
Luke Shaefer, Ph.D. University of Michigan
Bridget Flynn Timmeney, M.S.W. W.E. Upjohn Institute for Employment Research
THE ALICE RESEARCH TEAMThe United Way ALICE Project provides high-quality, research-based information to foster a better understanding of who is struggling in our communities. To produce the United Way ALICE Report for Michigan, a team of researchers collaborated with a Research Advisory Committee, composed of representatives from across the state, who advised and contributed to our Report. This collaborative model, practiced in each state, ensures each Report presents unbiased data that is replicable, easily updated on a regular basis, and sensitive to local context. Working closely with United Ways, the United Way ALICE Project seeks to equip communities with information to create innovative solutions.
Lead ResearcherStephanie Hoopes, Ph.D. is the lead researcher and director of the United Way ALICE Project. Dr. Hoopes’ work focuses on the political economy of the United States and specifically on the circumstances of low-income households. Her research has garnered both state and national media attention. She began the United Way ALICE Project as a pilot study of the low-income community in affluent Morris County, New Jersey in 2009, and has overseen its expansion into a broad-based initiative to more accurately measure financial hardship in states across the country. In 2015, Dr. Hoopes joined the staff at United Way of Northern New Jersey in order to expand this project as more and more states become involved.
Dr. Hoopes was an assistant professor at the School of Public Affairs and Administration (SPAA), Rutgers University-Newark, from 2011 to 2015, and director of Rutgers-Newark’s New Jersey DataBank, which makes data available to citizens and policymakers on current issues in 20 policy areas, from 2011 to 2012. SPAA continues to support the United Way ALICE Project with access to research resources.
Dr. Hoopes has a doctorate from the London School of Economics, a master’s degree from the University of North Carolina at Chapel Hill, and a bachelor’s degree from Wellesley College.
Research Support TeamAndrew Abrahamson Helen McGinnis Dan Treglia, Ph.D.
ALICE Research Advisory Committee for Michigan

v
WHAT’S NEWData & Methodology UpdatesEvery two years, the United Way ALICE Project engages a Research Advisory Committee of external experts to scrutinize the ALICE methodology and sources. This rigorous process results in enhancements to the methodology and new ideas in how to more accurately measure and present this important data. While these changes impact specific calculations, the overall trends have remained the same – ALICE represents a large percentage of our population and these households are struggling to provide basic essentials for their families.
For this Report, the following improvements have been incorporated. To ensure consistency and accurate comparison in changes over time, data has been recalculated for previous years. For a more detailed description of the methodology, see the Methodology Exhibit IX.
• The ALICE Threshold for each state now accounts for county-level differences. This key measure is now calculated by combining the average household size for each county rather than using the statewide average household size.
• The ALICE Household Survival and Stability Budgets have been updated to reflect today’s economic and technological realities. The Household Survival Budget’s health care costs increased due to the Affordable Care Act. Because many ALICE households do not qualify for Medicaid but cannot afford even the Bronze Marketplace premiums and deductibles, the penalty for not having coverage is added to the out-of-pocket health care cost. The ALICE Stability Budget added the cost of a cell phone with internet access.
• The Economic Viability Dashboard is now presenting each of its three indices – Housing Affordability, Job Opportunities, and Community Resources – separately instead of as one combined score. Each index represents a critical condition for the stability of ALICE households, and poor scores in one index cannot be compensated by good scores in another. These indices are not cumulative.
• The ALICE Income Assessment has been recalculated to more accurately depict the assistance available to help an ALICE household meet basic needs. Only programs that directly help low-income households meet the Household Survival Budget, such as TANF and Medicaid, are included. It no longer includes programs that assist households in broader ways, such as to attend college, or that assist communities, like community policing.
Source changes• The American Community Survey no longer provides 3-year averages, so data for all communities with
populations less than 65,000 will rely on 5-year averages.
• The National Association of State Budget Officers (NASBO) replaces individual state budgets as the source for state spending on programs to assist vulnerable families, making the spending categories standardized and comparable.
• In the Economic Viability Dashboard, the variables for two of the indicators of the Community Resources Index – education resources and social capital – have been changed to items that vary more by county. The variable for education resources is now 3- and 4-year-olds enrolled in preschool; and the variable for social capital is the percent of the population 18 and older who voted in the most recent election.

vi
ALIC
E IN
MIC
HIGA
N
TABLE OF CONTENTSEXECUTIVE SUMMARY ��������������������������������������������������������������������������������������������������������1
I� WHO IS STRUGGLING IN MICHIGAN? ��������������������������������������������������������������������������������5
II� WHAT DOES IT COST TO FUNCTION IN TODAY’S ECONOMY? ������������������������������������������16
III� ACHIEVING STABILITY: INCOME, SAVINGS AND PUBLIC ASSISTANCE ����������������������������22
IV� HOW HAVE ECONOMIC CONDITIONS CHANGED FOR ALICE FAMILIES? ���������������������������30
CONCLUSION: WHAT CHALLENGES LIE AHEAD? �����������������������������������������������������������������41
BIBLIOGRAPHY �����������������������������������������������������������������������������������������������������������������55
EXHIBIT I: ALICE COUNTY PAGES
EXHIBIT II: ALICE HOUSING DATA BY COUNTY
EXHIBIT III: ALICE THRESHOLD AND DEMOGRAPHICS, MICHIGAN, 2015
EXHIBIT IV: KEY FACTS AND ALICE STATISTICS FOR MICHIGAN CONGRESSIONAL DISTRICTS
EXHIBIT V: THE ECONOMIC VIABILITY DASHBOARD
EXHIBIT VI: KEY FACTS AND ALICE STATISTICS FOR MICHIGAN MUNICIPALITIES
EXHIBIT VII: ALICE HOUSEHOLDS BY INCOME, 2007 TO 2015
EXHIBIT VIII: STRATEGIES THAT CAN MAKE A DIFFERENCE FOR ALICE
EXHIBIT IX: METHODOLOGY OVERVIEW & RATIONALE

INDEX OF FIGURESFigure 1� Household Income, Michigan, 2007 to 2015 �������������������������������������������������������������������������������������������� 5
Figure 2� Household Income by Age of Head of Household, Michigan, 2015 ����������������������������������������������������������� 6
Figure 3� Trends in Households by Income by Age, Michigan, 2007 to 2015 ����������������������������������������������������������� 7
Figure 4� Households by Race/Ethnicity and Income, Michigan, 2015 �������������������������������������������������������������������� 8
Figure 5� Households by Race/Ethnicity and Income, Michigan, 2007 to 2015 ����������������������������������������������������� 10
Figure 6� Household Types by Income, Michigan, 2015 ����������������������������������������������������������������������������������������� 11
Figure 7� Single & Cohabiting (No Children Below 18) Households by Income, Michigan, 2015 ��������������������������� 11
Figure 8� Families with Children by Income, Michigan, 2015 ������������������������������������������������������������������������������� 12
Figure 9� Families with Children by Income, Michigan, 2007 to 2015 ������������������������������������������������������������������ 13
Figure 10� Percentage of Households with Income Below the ALICE Threshold by County, Michigan, 2007 and 2015 ��� 14
Figure 11� Households below the ALICE Threshold, Largest Cities and Towns in Michigan, 2015 ������������������������� 15
Figure 12� Household Survival Budget, Michigan Average, 2015 �������������������������������������������������������������������������� 16
Figure 13� Household Survival Budget, Michigan Average, 2007 to 2015 ������������������������������������������������������������� 17
Figure 14� Comparison of Household Budgets (family of 4), Calhoun County, Michigan, 2015 ���������������������������� 19
Figure 15� Comparison of Household Budgets by Category, 2015 ������������������������������������������������������������������������� 20
Figure 16� Earnings by Number of Households and Aggregate Total, Michigan, 2007 to 2015 ������������������������������ 22
Figure 17� Percent Change in Household Sources of Income, Michigan, 2007 to 2015 ����������������������������������������� 23
Figure 18� Households with Assets, Michigan, 2015 �������������������������������������������������������������������������������������������� 25
Figure 19� ALICE Income Assessment, Michigan, 2012 to 2015 ��������������������������������������������������������������������������� 26
Figure 20� Comparing Basic Need with Public and Nonprofit Spending by Category (Excluding Health Care and Miscellaneous Expenses), Michigan, 2015 ������������������������������������������������������������������������������������������ 27

Figure 21� Total Public and Nonprofit Assistance per Household Below the ALICE Threshold, Michigan, 2015 ����� 29
Figure 22� Number of Jobs by Hourly Wage, Michigan, 2007 to 2015 �������������������������������������������������������������������� 30
Figure 23� Employment and GDP by Industry, Michigan, 2007 to 2015 ��������������������������������������������������������������� 32
Figure 24� Top 20 Occupations by Employment and Wage, Michigan, 2015 ��������������������������������������������������������� 33
Figure 25� Small Business Employment by Sector, Michigan, 2013 ���������������������������������������������������������������������� 34
Figure 26� Work Status, Michigan, 2007 to 2015 �������������������������������������������������������������������������������������������������� 35
Figure 27� Economic Viability Dashboard, Michigan, 2007 to 2015 ���������������������������������������������������������������������� 37
Figure 28� Housing Affordability Index, Michigan, 2010 to 2015 �������������������������������������������������������������������������� 38
Figure 29� Renters Below the ALICE Threshold vs� Rental Stock, Michigan, 2015 ������������������������������������������������ 39
Figure 30� Jobs Opportunities Index, Michigan, 2010 to 2015 ������������������������������������������������������������������������������ 39
Figure 31� Population Inflows and Outflows, Michigan, 2015 ������������������������������������������������������������������������������� 42
Figure 32� Population Projection, Michigan, 2010 to 2030 ����������������������������������������������������������������������������������� 44
Figure 33� New Growth by Occupation, Michigan, 2015 to 2024 �������������������������������������������������������������������������� 46
Figure 34� Employment by Occupation and Impact of Technology, Michigan, 2015 ���������������������������������������������� 48
Figure 35� Median Earnings Asian, Black, Hispanic, and White Workers, Michigan, 2007 to 2015 ����������������������� 51
Figure 36� Unemployment for Asian, White, Hispanic, and Black Workers, Michigan, 2007 to 2015��������������������� 51

1UNIT
ED W
AY A
LICE
REP
ORT
– 20
17 U
PDAT
E FO
R M
ICHI
GAN
EXECUTIVE SUMMARYThis United Way ALICE Report provides the most comprehensive look at Michigan residents who are struggling financially: 40 percent of households in Michigan could not afford basic needs such as housing, child care, food, health care, and transportation in 2015. Many households are living below the Federal Poverty Level (FPL), but an even greater number of households are what United Way calls ALICE – an acronym for Asset Limited, Income Constrained, Employed. ALICE households have incomes above the FPL, but still struggle to afford basic household necessities. Although evidence is emerging that jobs and wages are improving, the percent of households struggling has only improved from 41 percent in 2010 to 40 percent in 2012 and has remained flat since.
This Report focuses on what has changed in Michigan since the first United Way ALICE Report was published three years ago. It updates the cost of basic needs in the Household Survival Budget for each county in Michigan, and the number of households earning below this amount – the ALICE Threshold. It delves deeper into county and municipal data as well as ALICE and poverty-level households by race, ethnicity, age, and household type to reveal variations in hardship that are often masked by state averages. Finally this Report highlights emerging trends that will be important to ALICE in the future.
The data reveals an ongoing struggle for ALICE households and the obstacles to achieving financial stability:
• Struggling Households: Of Michigan’s 3.86 million households, 15 percent lived in poverty in 2015 and another 25 percent were ALICE. Combined, 40 percent (1.53 million households) had income below the ALICE Threshold, an improvement since 2010, but still above the level in 2007.
• Basic Cost of Living: The cost of basic household expenses increased steadily in every county in Michigan between 2007 and 2015. The average budget rose by 18 percent, which was above the national rate of inflation of 14 percent during that time period. In 2015, the average annual Household Survival Budget for a Michigan family of four (two adults with one infant and one preschooler) ranged from $43,920 in Osceola County to $64,320 in Macomb County – well above the family FPL of $ 24,250.
• Low-wage Jobs: Low-wage jobs continued to dominate the landscape in Michigan, with 62 percent of all jobs in the state paying less than $20 per hour. At this wage, a family of four falls far short of the Household Survival Budget of $56,064. And, more than two-thirds of these jobs pay less than $15 per hour.
• Assistance for ALICE: Since 2012, the amount needed to bring all ALICE households to financial stability has grown faster than government spending. Health care spending increased by 23 percent, accounting for two-thirds of all public and nonprofit spending on ALICE and poverty-level households. Because services and funds are not typically transferable from one area of need to another, there are large gaps between spending and need in many categories. For example, the gap to meet housing needs is 44 percent and the gap to meet child care is 50 percent.
• Emerging trends: Several trends could change the economic landscape for ALICE families:
○ The Michigan population is aging, and many seniors do not have the resources they need to support themselves.
○ Differences by race and ethnicity persist, creating challenges for many ALICE families as well as for immigrants in Michigan.
○ Low-wage jobs are projected to grow faster than higher-wage jobs over the next decade.
○ Technology is changing the workplace, adding some jobs, replacing many others, while also changing where people work, the hours they work, and the skills that are required. Technology creates opportunities as well as challenges for ALICE workers.
2 UNIT
ED W
AY A
LICE
REP
ORT
– 20
17 U
PDAT
E FO
R M
ICHI
GAN
Using the best available information on those who are struggling, this Report offers an enhanced set of tools for stakeholders to measure the real challenges ALICE households face in trying to make ends meet. This information is presented to inform the discussion around programmatic and policy solutions for these households and their communities now and for the future. The lack of accurate information about the number of people who are “poor” and struggling distorts the identification of problems related to poverty, misguides policy solutions, and raises questions of equity, transparency, and fairness in the allocation of resources based on an outdated FPL.
GLOSSARYALICE is an acronym that stands for Asset Limited, Income Constrained, Employed, comprising households with income above the Federal Poverty Level but below the basic cost of living.
The Household Survival Budget calculates the actual costs of basic necessities (housing, child care, food, health care, and transportation) in Michigan, adjusted for different counties and household types.
The ALICE Threshold is the average income that a household needs to afford the basic necessities defined by the Household Survival Budget for each county in Michigan. (Unless otherwise noted in this Report, households earning less than the ALICE Threshold include both ALICE and poverty-level households.)
The Household Stability Budget is greater than the basic Household Survival Budget and reflects the cost for household necessities at a modest but sustainable level. It adds a savings category and a cell phone category, and is adjusted for different counties and household types.
The ALICE Income Assessment is the calculation of all sources of income, resources, and assistance for ALICE and poverty-level households. Even with assistance, the Assessment reveals a shortfall, or Unfilled Gap, between what these households bring in and what is needed for them to reach the ALICE Threshold.
The Economic Viability Dashboard is comprised of three Indices that evaluate the economic conditions that matter most to ALICE households – Housing Affordability, Job Opportunities, and Community Resources. A Dashboard is provided for each county in the state.

3UNIT
ED W
AY A
LICE
REP
ORT
– 20
17 U
PDAT
E FO
R M
ICHI
GAN
AT-A
-GLA
NCE:
MIC
HIGA
NAT-A-GLANCE: MICHIGAN, 2015 Point-in-Time Data
Population: 9,922,576 | Number of Counties: 83 | Number of Households: 3,857,706
How many households are struggling?ALICE, an acronym for Asset Limited, Income Constrained, Employed, are households that earn more than the Federal Poverty Level (FPL), but less than the basic cost of living for the state (the ALICE Threshold). Of Michigan’s 3.86 million households, 15 percent earn below the FPL and another 25 percent are ALICE, down slightly from 2010 but still above the 2007 level.
How much does ALICE earn? In Michigan, 62 percent of jobs pay less than $20 per hour, with two-thirds of those paying less than $15 per hour. Another 29 percent of jobs pay between $20 and $40 per hour. Only 9 percent of jobs pay between $40 and $60 per hour.
What does it cost to afford the basic necessities?This bare-minimum Household Survival Budget increased by 18 percent from 2007 to 2015, while the rate of inflation was 14 percent. Affording only a very modest living, this budget is still significantly more than the Federal Poverty Level of $11,770 for a single adult and $24,250 for a family of four.
Monthly Costs, Michigan Average, 2015
SINGLE ADULT2 ADULTS, 1 CHILD,1 PRESCHOOLER
2007 – 2015 PERCENT INCREASE
Monthly Costs Housing $478 $696 14% Child Care $– $1,108 8% Food $184 $609 14% Transportation $359 $718 8% Health Care $183 $702 77% Miscellaneous $138 $425 18% Taxes $174 $414 19%Monthly Total $1,516 $4,672 18%ANNUAL TOTAL $18,192 $56,064 18%Hourly Wage $9.10 $28.04 18%
*Wage working full time required to support this budget Note: Percent increases are an average of the increases in each category for a single-adult and for a four-person family Source: American Community Survey; U.S. Department of Housing and Urban Development (HUD); U.S. Department of Agriculture (USDA); Bureau of Labor Statistics (BLS); Internal Revenue Service (IRS) and Michigan Department of Treasury; and Michigan Office of Great Start, 2015
PovertyALICEAbove AT
15%
60%25%
0
500
1,000
1,500
2,000
2,500
3,000
Num
ber o
f job
s (in
thou
sand
s)9%
$40–$60
0.3%
$60–$80
0.6%
Above $80Less Than $20
62%
LessThan $10
$10–$15
$15–$20
$20–$40
29%
$20–$30
$30–$40

4 UNIT
ED W
AY A
LICE
REP
ORT
– 20
17 U
PDAT
E FO
R M
ICHI
GAN
AT-A
-GLA
NCE:
MIC
HIGA
N
AT-A-GLANCE: MICHIGAN, 2015Point-in-Time Data
Population: 9,922,576 | Number of Counties: 83 | Number of Households: 3,857,706
Michigan Counties, 2015
County Total HH % ALICE & Poverty
Alcona 5,001 42%
Alger 3,470 50%
Allegan 42,079 37%
Alpena 12,722 39%
Antrim 9,689 41%
Arenac 6,447 46%
Baraga 2,974 52%
Barry 22,836 36%
Bay 42,799 37%
Benzie 7,225 37%
Berrien 64,279 37%
Branch 16,022 46%
Calhoun 53,076 41%
Cass 20,101 42%
Charlevoix 10,794 39%
Cheboygan 11,223 41%
Chippewa 13,997 48%
Clare 13,255 53%
Clinton 29,072 30%
Crawford 5,954 38%
Delta 15,685 44%
Dickinson 11,059 39%
Eaton 43,551 29%
Emmet 13,948 37%
Genesee 163,488 40%
Gladwin 10,960 47%
Gogebic 6,741 48%
Grand Traverse 36,952 35%
Gratiot 14,716 48%
Hillsdale 17,810 41%
Houghton 13,765 51%
Huron 13,805 42%
Ingham 111,265 43%
Ionia 22,092 45%
Iosco 11,343 47%
Iron 5,392 49%
Isabella 24,246 50%
Jackson 59,292 36%
Kalamazoo 101,228 36%
Kalkaska 7,185 43%
Kent 237,259 38%
Keweenaw 1,040 47%
Michigan Counties, 2015
County Total HH % ALICE & Poverty
Lake 4,365 59%
Lapeer 32,708 37%
Leelanau 9,234 28%
Lenawee 37,016 43%
Livingston 71,100 27%
Luce 2,377 55%
Mackinac 5,209 33%
Macomb 341,532 38%
Manistee 10,142 39%
Marquette 25,498 41%
Mason 12,248 40%
Mecosta 15,478 47%
Menominee 10,679 39%
Midland 32,977 34%
Missaukee 5,866 44%
Monroe 58,886 33%
Montcalm 23,284 48%
Montmorency 4,070 48%
Muskegon 63,215 40%
Newaygo 18,339 41%
Oakland 497,819 30%
Oceana 9,822 47%
Ogemaw 9,434 46%
Ontonagon 3,084 47%
Osceola 8,757 47%
Oscoda 3,686 47%
Otsego 9,956 36%
Ottawa 98,598 36%
Presque Isle 5,999 37%
Roscommon 11,543 43%
Saginaw 77,211 39%
St Clair 63,571 40%
St Joseph 23,270 40%
Sanilac 16,280 47%
Schoolcraft 3,419 52%
Shiawassee 27,036 31%
Tuscola 21,304 37%
Van Buren 28,564 40%
Washtenaw 138,099 37%
Wayne 667,521 52%
Wexford 12,673 44%

5UNIT
ED W
AY A
LICE
REP
ORT
– 20
17 U
PDAT
E FO
R M
ICHI
GAN
I. WHO IS STRUGGLING IN MICHIGAN?Michigan’s economy saw only incremental growth in recent years, making it difficult for many households to improve their financial status. Between 2012 and 2015, the economy showed signs of improvement, yet 40 percent of households in Michigan struggled financially, as the cost of living continued to exceed what most wages paid. In 2015, 40 percent of the state’s 3,857,706 households could not afford basic needs such as housing, child care, food, health care, and transportation. Many of Michigan’s households are living in poverty An even greater number are households with income above the Federal Poverty Level (FPL), but not earning enough to afford basic household necessities. They are ALICE – Asset Limited, Income Constrained, Employed.
This section reviews demographic trends of ALICE and poverty-level households by race, ethnicity, age, and household type from 2007 to 2015. It also delves into county and municipal data to reveal local variations that are often masked by state averages. While many expected the economic climate to improve in 2010, the technical end of the Great Recession, evidence of recovery didn’t emerge until 2012, and not always statewide.
ALL HOUSEHOLDSIn Michigan, the total number of households decreased by 1.6 percent between 2007 and 2012 and then increased by 2.1 percent from 2012 to 2015, to 3,857,706, slightly above its 2007 number. But the number of ALICE and poverty-level households increased through the Great Recession (from 2007 to 2010) by 7 percent, and then fluctuated from 2010 to 2015 (Figure 1).
• Poverty: The number of households in poverty, defined in 2015 as $11,770 for a single adult and $24,250 for a family of four, increased steadily from 486,363 households in 2007 to 605,210 in 2012, a 22 percent increase; and then decreased by 5 percent from 2012 to 2015 to 571,866. The proportion of poverty-level households rose from 13 percent in 2007 to 16 percent in 2012, and fell slightly to 15 percent in 2015.
• ALICE: The number of ALICE households increased from 931,231 in 2007 to 994,762 in 2010, a 3 percent increase, and then fell slightly from 2010 to 2015 to 959,784. The proportion of ALICE households has fluctuated throughout the period, from a high of 26 percent in 2010 to a low of 24 percent in 2012.
• Above ALICE Threshold: The number of households above the ALICE Threshold decreased overall from 2.34 million in 2007 to 2.33 million in 2015, a 3 percent decrease. The proportion of households above the ALICE Threshold fell from 62 percent in 2007 to 60 percent in 2012 and 2015.
Figure 1�Household Income, Michigan, 2007 to 2015
13% 15% 16% 15%
25% 26% 24% 25%
62%59% 60% 60%
05001,0001,5002,0002,5003,0003,5004,0004,500
0%10%20%30%40%50%60%70%80%90%
100%
2007 2010 2012 2015 Hou
seho
lds
(in th
ousa
nds)
Perc
ent o
f Hou
seho
lds
Above AT
ALICE
Poverty
Total HH
Source: American Community Survey, 2007-2015, and the ALICE Threshold, 2007-2015; see Exhibit VII and ALICE Methodology for details

6 UNIT
ED W
AY A
LICE
REP
ORT
– 20
17 U
PDAT
E FO
R M
ICHI
GAN
AGEWith some exceptions, the age distribution of ALICE households and households in poverty roughly reflects their proportion of the overall population. In 2015, households headed by someone under the age of 25 were by far the most likely to be in poverty (46 percent); with a poverty rate more than twice that of the other household groups (Figure 2). Households 65 and older have the lowest poverty rate (9 percent), but have the second highest ALICE rates (27 percent). Even groups in their prime earning years struggle to support their families: 41 percent of households headed by 25- to 44-year-olds and 37 percent of households headed by 45- to 64-year-olds earn below the ALICE Threshold. This distribution has been relatively consistent over time.
Figure 2�Household Income by Age of Head of Household, Michigan, 2015
46%
18% 13% 9%
29%
23% 24% 27%
25%
59% 63% 64%
153
1,147
1,570
987
0
200
400
600
800
1,000
1,200
1,400
1,600
1,800
0%
10%
20%
30%
40%
50%
60%
70%
80%
90%
100%
Hou
seho
lds
(in th
ousa
nds)
Perc
ent o
f Tot
al A
ge G
roup
Above AT
ALICE
Poverty
Total HHs
Under 25 25 to 44 Years 45 to 64 Years 65 Years and Over
Source: American Community Survey, 2015, and the ALICE Threshold, 2015
Figure 3 shows changes in the population size as well as changes in poverty and ALICE rates for each age group from 2007 to 2015.
There were two notable trends:
• Michigan’s population is aging. The number of younger households decreased, while the number of older households increased. Households headed by someone 25 or younger fell by 10 percent from 2007 to 2015. Those headed by 25- to 44-year-olds saw the biggest decline in numbers, dropping by 15 percent. At the same time, the number of households headed by someone 45 to 64 years old increased by 3 percent from 2007 to 2015, and those headed by someone 65 years and older increased by 22 percent (American Community Survey, 2007, 2010, 2012, and 2015; Michigan Department of Health and Human Services, 2016).
• All age groups saw a decline in financial stability, with the exception of households 65 and older. Between 2007 and 2015, nearly each age group saw an increase in households living below the ALICE Threshold. The one exception is senior households, whose conditions improved throughout the period. While the proportion of households in poverty headed by someone 65 years and older remained flat at 9 percent, the proportion of senior ALICE households decreased steadily from 34 percent in 2007 to 27 percent in 2015. Note in Figure 3 that total household scales vary among age groups.

7UNIT
ED W
AY A
LICE
REP
ORT
– 20
17 U
PDAT
E FO
R M
ICHI
GAN
Figure 3�Trends in Households by Income by Age, Michigan, 2007 to 2015
Under 25
2007 2010 2012 2015
Hou
seho
lds
(in th
ousa
nds)
0%
20%
40%
60%
80%
100%
Perc
ent o
f Hou
seho
lds
43% 51% 52% 46%
32%30% 28%
29%
25%19% 20% 25%
020406080100120140160180
25 to 44
2007 2010 2012 20150
200
400
600
800
1,000
1,200
1,400
Hou
seho
lds
(in th
ousa
nds)
15%
22%
63%
18%
23%
59%
20%
22%
58%
18%
23%
59%
0%
20%
40%
60%
80%
100%
Perc
ent o
f Hou
seho
lds
45 to 64
2007 2010 2012 2015
Hou
seho
lds
(in th
ousa
nds)
0%
20%
40%
60%
80%
100%
Perc
ent o
f Hou
seho
lds
10% 12% 13% 13%
22% 25% 23% 24%
68% 63% 64% 63%
02004006008001,0001,2001,4001,6001,800
65 and Older
2007 2010 2012 2015
Hou
seho
lds
(in th
ousa
nds)
0%
20%
40%
60%
80%
100%
Perc
ent o
f Hou
seho
lds
9% 9% 9% 9%
34% 32% 29% 27%
57% 59% 62% 64%
0
200
400
600
800
1,000
1,200
Above ATALICEPoverty Total HH
Source: American Community Survey, 2007-2015, and the ALICE Threshold, 2015
RACE AND ETHNICITYIn Michigan, the total number of non-white households has grown steadily, while there was a decline in the number of White households (the United Way ALICE Reports follow the U.S. Census classification for non-Whites to include Blacks, Hispanics, Asians, and Native Americans). Without the increase in Hispanic and Asian households, Michigan would have had a negative population growth from 2007 to 2015.
ALICE and poverty-level households exist in every racial and ethnic group in Michigan. Because there are significantly more White households in the state than non-white households, White households also make up the largest number of households living below the ALICE Threshold. There were 1,077,883 White households with income below the ALICE Threshold in 2015, compared to 415,772 for all other ethnic/racial households below the ALICE Threshold. However, non-white households made up a proportionally larger share of households below the ALICE Threshold, with 62 percent of Black households below the ALICE Threshold and 54 percent of Hispanic households, compared to 35 percent of White households (Figure 4).

8 UNIT
ED W
AY A
LICE
REP
ORT
– 20
17 U
PDAT
E FO
R M
ICHI
GAN
Figure 4�Households by Race/Ethnicity and Income, Michigan, 2015
10%
27% 17%
11%
25%
35%
37%
20%
65%
38% 46%
69%
3,050
513
125
87
0
500
1,000
1,500
2,000
2,500
3,000
3,500
0%
10%
20%
30%
40%
50%
60%
70%
80%
90%
100%
Hou
seho
lds
(in th
ousa
nds)
Perc
ent o
f Rac
e/Et
hnic
Gro
up
White Hispanic Black Asian
Above AT
ALICE
Below$15,000/year
Total HH
Note: Because household poverty data is not available for the American Community Survey’s Race/Ethnicity categories, annual income below $15,000 is used as a proxy for poverty. Source: American Community Survey, 2015, and the ALICE Threshold, 2015
The change in the number of households by race and ethnicity reveals some emerging trends in Michigan (Figure 5).
Black Households• Total Households: Blacks are the next largest racial/ethnic group in Michigan, with their number
increasing by 3 percent from 2007 to 2015, to 513,293 households in 2015.
• Poverty: The percent of Black households in poverty increased from 27 percent in 2007 to 30 percent in 2012, but then dropped back down to 27 percent in 2015.
• ALICE: The percent of Black ALICE households remained flat at 34 percent from 2007 to 2012 and then increased to 35 percent in 2015.
• ALICE Threshold: In 2015, 62 percent of Black households lived below the ALICE Threshold.
Hispanic Households• Total Households: Hispanic households are the third largest racial/ethnic group in Michigan, with their
number increasing by 13 from 2007 to 2015 to 124,596 households.
• Poverty: The percent of Hispanic households in poverty stayed relatively flat from 2007 to 2015, hovering around 17 percent.
• ALICE: The percent of Hispanic ALICE households fell from 39 percent in 2007 to 36 percent in 2010, and then increased to 37 percent by 2015.
• ALICE Threshold: In 2015, 54 percent of Hispanic households lived below the ALICE Threshold.

9UNIT
ED W
AY A
LICE
REP
ORT
– 20
17 U
PDAT
E FO
R M
ICHI
GAN
Race and ethnicity are overlapping categories, which can be an issue when reporting Hispanic households. In all Michigan counties, the overlap is minimal; less than 5 percent of the White population is also Hispanic. The percent of Hispanic and White households has increased over time in Michigan and across the country due to the increase in Hispanic immigration as well as to changes in the way people self-identify and answer the Census questions (American Community Survey, 2015; Humes, Jones, & Ramirez, 2011).
Asian Households• Total Households: The total number of Asian households rose by 13 percent from 2007 to 2015 to
86,719 households.
• Poverty: The percent of Asian households in poverty increased from 10 percent in 2007 to 11 percent in 2010, but then remained flat through 2015.
• ALICE: The percent of Asian ALICE households increased steadily from 18 percent in 2007 to 20 percent in 2015.
• ALICE Threshold: In 2015, 31 percent of Asian households lived below the ALICE Threshold.
White Households• Total Households: Following a slightly different trajectory, the total number of White households
decreased by 2 percent from 2007 to 2015, to 3,049,904. This trend reflected a slower birth rate and the consolidation of households, which suggests that people moved in together to save money (such as college graduates moving in with their parents or older workers living with roommates).
• Poverty: The percent of White households in poverty increased from 11 percent in 2007 to 12 percent in 2010, remained flat through 2012, and then fell to 10 percent in 2015.
• ALICE: The percent of White ALICE households increased significantly from 22 percent in 2007 to 25 percent in 2010, and then remained relatively flat.
• ALICE Threshold: In 2015, 35 percent of White households lived below the ALICE Threshold.

10 UNIT
ED W
AY A
LICE
REP
ORT
– 20
17 U
PDAT
E FO
R M
ICHI
GAN
Figure 5�Households by Race/Ethnicity and Income, Michigan, 2007 to 2015
Black
0%
10%20%
30%40%50%60%70%80%90%
100%
Hou
seho
lds
(in th
ousa
nds)
Perc
ent o
f Hou
seho
lds
2007 2010 2012 2015
27% 29% 30% 27%
34% 34% 34% 35%
39% 37% 36% 38%
0
100
200
300
400
500
600
Hispanic
0%
10%20%
30%40%50%60%70%80%90%
100%
Hou
seho
lds
(in th
ousa
nds)
Perc
ent o
f Hou
seho
lds
2007 2010 2012 2015
17% 17% 18% 17%
39% 36% 36% 37%
44% 47% 46%46%
0
20
40
60
80
100
120
140
Asian
0%
10%20%
30%40%50%60%70%80%90%
100%
Hou
seho
lds
(in th
ousa
nds)
Perc
ent o
f Hou
seho
lds
200710%
18%
72%
201011%
18%
71%
2012
11%
19%
70%
201511%
20%
69%
0102030405060708090100
Non-Hispanic White
0%
10%20%
30%40%50%60%70%80%90%
100%
Hou
seho
lds
(in th
ousa
nds)
Perc
ent o
f Hou
seho
lds
2007 2010 2012 201511% 12% 12% 10%
22% 25% 24% 25%
67% 63% 64% 65%
0
500
1,000
1,500
2,000
2,500
3,000
3,500
Above ATALICEPoverty Total HH
Note: Because household poverty data is not available for the American Community Survey’s Race/Ethnicity categories, annual income below $15,000 is used as a proxy for poverty. Source: American Community Survey, 2007-2015, and the ALICE Threshold, 2015

11UNIT
ED W
AY A
LICE
REP
ORT
– 20
17 U
PDAT
E FO
R M
ICHI
GAN
HOUSEHOLD TYPEHouseholds are changing across the U.S. People are increasingly living in a wider variety of arrangements, including singles living alone or with roommates, and grown children living with parents. Since the 1970s, U.S. households have followed a trend of smaller households, fewer households with children, fewer married-couple households, and more people living alone, especially at older ages. Today, single and cohabiting adults with no children under 18 years old make up the largest group in Michigan, accounting for 48 percent of households (Figure 6). The percent of single households in Michigan is not available, but nationally, approximately 27 percent of all households are single-adult households younger than 65 (Vespa, Lewis, & Kreider, 2013).
Figure 6�Household Types by Income, Michigan, 2015
02004006008001,0001,2001,4001,6001,8002,000
0%10%20%30%40%50%60%70%80%90%
100%
Hou
seho
lds
(in th
ousa
nds)
Perc
ent o
f Tot
al A
ge G
roup
14%
28%
58%
1,852
Single & Cohabiting(No Children below 18)
21%
18%
61%
1,018
Families withChildren
9%
27%
64%
987
65 and Over
Above AT
ALICE
Poverty
Total HHs
Source: American Community Survey, 2015, and the ALICE Threshold, 2015
Single and cohabiting households without children under 18 are also the group with the largest number of households below the ALICE Threshold in Michigan. In 2015, 42 percent of these households had income below the ALICE Threshold, with 14 percent in poverty and 28 percent ALICE (Figure 6). The proportion of single and cohabiting households below the ALICE Threshold increased from 38 percent in 2007 to 42 percent in 2015 (Figure 7).
Figure 7�Single & Cohabiting (No Children Below 18) Households by Income, Michigan, 2015
12% 14% 15% 14%
26% 29% 27% 28%
62% 57% 58% 58%
02004006008001,0001,2001,4001,6001,8002,000
0%10%20%30%40%50%60%70%80%90%
100%
2007 2010 2012 2015
Hou
seho
lds
(in th
ousa
nds)
Perc
ent o
f Hou
seho
lds
Above AT
ALICE
Poverty
Total HH
Source: American Community Survey, 2007-2015, and the ALICE Threshold, 2015

12 UNIT
ED W
AY A
LICE
REP
ORT
– 20
17 U
PDAT
E FO
R M
ICHI
GAN
Families with ChildrenNot surprisingly, households with young children have the most expensive Household Survival Budget of all household types. Not only are these households larger, but they have the additional expense of child care, preschool, and after-school care. The biggest factors determining the economic stability of a household with children are the number of wage earners, the gender of the wage earners, and the number and age of children.
The number of families with children in Michigan decreased by 6 percent from 2007 to 2015. Those families with married parents had the biggest decline, falling by 16 percent from 2007 to 2015, while the number of single female-headed families decreased by 12 percent and single male-headed families increased by 3 percent. While married-parent families with children far outnumber single-headed families, a higher number and proportion of children in single-headed families live below the ALICE Threshold (Figure 8).
Figure 8�Families with Children by Income, Michigan, 2015
8%
51%
27% 11%
29%
33%
81%
20% 40%
670
260
88
0
100
200
300
400
500
600
700
800
0%10%20%30%40%50%60%70%80%90%
100%
Fam
ilies
(in
thou
sand
s)
Perc
ent o
f Fam
ily T
ype
Married SingleFemale-Headed
SingleMale-Headed
Above AT ALICE Poverty Total HHs
393,168 Families with ChildrenBelow ALICE Threshold (BAT)
Source: American Community Survey, 2015, and the ALICE Threshold, 2015
There are large differences in the economic conditions of married and single-parent families in Michigan.
In the majority of married-parent families, both parents are working (Working Poor Families Project (WPFP), 2016). Dual-income couples typically have a higher household income than single-parent families and tend to be better able to pay their expenses. This partly explains why 81 percent of married-couple families with children in Michigan have income above the ALICE Threshold (Figure 9).
It is important to note that the reality of a single-parent family is changing. According to the U.S. Census, the category of “single-parent” homes includes one parent as the sole adult (37 percent nationally), or a parent with a cohabiting partner (11 percent), or a parent with another adult age 18 or older who lives in the home, such as a grown child or grandparent (52 percent). In other words, even in most single-parent families, there may be at least two adults in the home who contribute financially to the household (Vespa, Lewis, & Kreider, 2013). Despite these changes, single-parent families are still more likely to have income below the ALICE Threshold.

13UNIT
ED W
AY A
LICE
REP
ORT
– 20
17 U
PDAT
E FO
R M
ICHI
GAN
In 2015, in Michigan, 80 percent of single female-headed families and 60 percent of single male-headed families lived below the ALICE Threshold, compared to 19 percent of married-couple families with children. Yet because the number of married-couple families in Michigan is so large, they still account for a significant portion of all children living below the ALICE Threshold.
When addressing poverty, the media and the community often focus on households with single mothers. But there are households of all types that struggle to make ends meet. Single female-headed families only account for 18 percent of all working-age households below the ALICE Threshold.
Figure 9�Families with Children by Income, Michigan, 2007 to 2015
Married
0100,000200,000300,000400,000500,000600,000700,000800,000900,000
0%10%20%30%40%50%60%70%80%90%
100%
10%
84%
20079%11%
80%
201010%10%
80%
20128%11%
81%
2015
Hou
seho
lds
Perc
ent o
f Hou
seho
lds
6%
Single Female-headed
44%54% 51%
31%26% 29%
25% 20% 20%
0
50,000
100,000
150,000
200,000
250,000
300,000
350,000
0%10%20%30%40%50%60%70%80%90%
100%
2007
51%
27%
22%
2010 2012 2015
Hou
seho
lds
Perc
ent o
f Hou
seho
lds
Single Male-headed
010,00020,00030,00040,00050,00060,00070,00080,00090,000100,000
0%10%20%30%40%50%60%70%80%90%
100%
22%
31%
47%
2007
29%
32%
39%
2010
30%
29%
41%
2012
27%
33%
40%
2015
Hou
seho
lds
Perc
ent o
f Hou
seho
lds
Above ATALICEPoverty Total HH
Source: American Community Survey, 2007-2015
ALICE BY COUNTYWhere ALICE families live matters: The Harvard Equality of Opportunity Project has demonstrated the importance of where we live, and especially where we grow up, in determining the directions that our lives take (Chetty & Hendren, 2015). Local economic conditions largely determine the number of households in a county or state that struggle financially. These conditions indicate how difficult it is to survive without adequate income and assets to afford basic household necessities.
14 UNIT
ED W
AY A
LICE
REP
ORT
– 20
17 U
PDAT
E FO
R M
ICHI
GAN
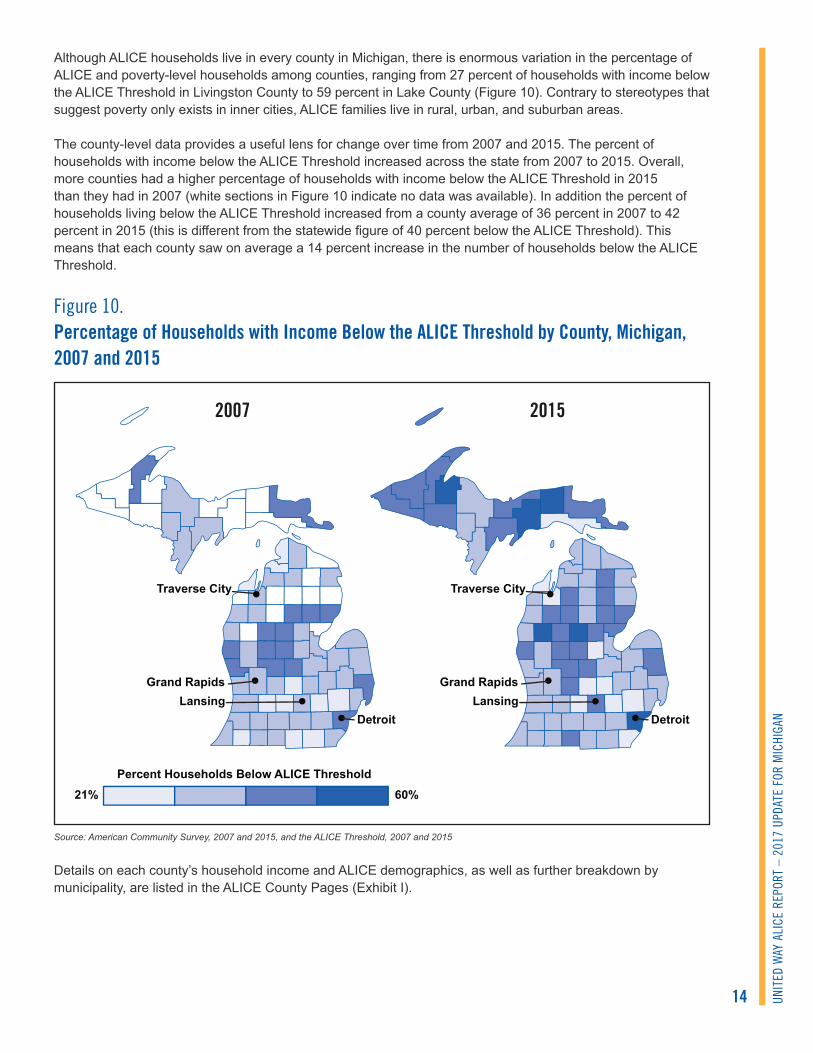
Although ALICE households live in every county in Michigan, there is enormous variation in the percentage of ALICE and poverty-level households among counties, ranging from 27 percent of households with income below the ALICE Threshold in Livingston County to 59 percent in Lake County (Figure 10). Contrary to stereotypes that suggest poverty only exists in inner cities, ALICE families live in rural, urban, and suburban areas.
The county-level data provides a useful lens for change over time from 2007 and 2015. The percent of households with income below the ALICE Threshold increased across the state from 2007 to 2015. Overall, more counties had a higher percentage of households with income below the ALICE Threshold in 2015 than they had in 2007 (white sections in Figure 10 indicate no data was available). In addition the percent of households living below the ALICE Threshold increased from a county average of 36 percent in 2007 to 42 percent in 2015 (this is different from the statewide figure of 40 percent below the ALICE Threshold). This means that each county saw on average a 14 percent increase in the number of households below the ALICE Threshold.
Figure 10� Percentage of Households with Income Below the ALICE Threshold by County, Michigan, 2007 and 2015
21% 60%Percent Households Below ALICE Threshold
20152007
DetroitLansing
Grand Rapids
Traverse City
Grand Rapids
Traverse City
LansingDetroit
Source: American Community Survey, 2007 and 2015, and the ALICE Threshold, 2007 and 2015
Details on each county’s household income and ALICE demographics, as well as further breakdown by municipality, are listed in the ALICE County Pages (Exhibit I).

15UNIT
ED W
AY A
LICE
REP
ORT
– 20
17 U
PDAT
E FO
R M
ICHI
GAN
CHANGES AT THE LOCAL LEVELIn 2015, ALICE and poverty-level households represented 30 percent of households in the majority of the 1,494 towns and cities that reported households with income. It is difficult to measure change over time in Michigan’s smaller towns and cities because small population size and data limited to 5-year estimates make it more difficult to track. But there is reliable data on changes over time for the largest towns in Michigan.
Michigan’s largest cities, those with more than 25,000 households, vary greatly in their proportion of households below the ALICE Threshold, ranging from 22 percent in Troy and Rochester Hills to 70 percent in Detroit. From 2007 to 2015, most large cities experienced only modest population change, with the exception of Dearborn. Home to one of the largest Arab populations, Dearborn saw a 39 percent growth in households, fueled primarily by immigration, but also by residents relocating from Detroit. Reflecting the shift away from high-paying manufacturing jobs, Dearborn, Lansing, and Troy experienced the largest increases in the number of households below the ALICE Threshold (50 percent, 40 percent, and 41 percent respectively). Other cities, such as Farmington Hills and Rochester Hills, benefited from major corporations investing in technology and technology jobs, and experienced a large decrease in the number of households below the ALICE Threshold (39 percent and 24 percent, respectively). Continuing to face hard times, Detroit had one of the largest decreases in the number of households, 8 percent, but only a modest 1 percent decrease in the number of households below the ALICE Threshold (Figure 11) (Rochester Regional Chamber of Commerce, 2016; Greater Farmington Area Chamber of Commerce, 2016; American Immigration Council, 2015).
Figure 11�Households below the ALICE Threshold, Largest Cities and Towns in Michigan, 2015
Largest Cities and Towns (Above 25,000
Households)
Number of Households
Percentage of Households Below ALICE Threshold
Percent Change2007–2015
2015 2015 HOUSEHOLDS BELOW ATDetroit 255,580 70% -8% -1%
Grand Rapids 73,488 49% 2% 2%
Warren City 54,688 48% 3% 13%
Sterling Heights City 49,296 35% 0% 6%
Ann Arbor City 48,803 42% 8% -3%
Lansing City 47,338 56% -2% 40%
Flint City 40,143 61% -4% 5%
Livonia City 36,943 26% 0% 0%
Westland City 33,719 47% -3% 2%
Farmington Hills City 33,505 28% -3% -39%
Troy City 32,004 22% 3% 41%
Southfield City 31,613 43% 0% 5%
Dearborn City 31,183 43% 39% 50%
Kalamazoo City 29,040 53% 8% 4%
Royal Oak City 28,371 32% 2% -4%
Wyoming City 28,200 48% 0% 20%
Rochester Hills City 27,224 22% -6% -24%
Source: American Community Survey, 2007-2015, and the ALICE Threshold, 2007-2015; see Exhibit VI and ALICE Methodology for details

16 UNIT
ED W
AY A
LICE
REP
ORT
– 20
17 U
PDAT
E FO
R M
ICHI
GAN
II. WHAT DOES IT COST TO FUNCTION IN TODAY’S ECONOMY?
HOUSEHOLD SURVIVAL BUDGETThe Household Survival Budget reflects the bare minimum cost to live and work in the modern economy. In Michigan, the average Household Survival Budget was $56,064 for a four-person family and $18,192 for a single adult in Michigan in 2015 (Figure 12). The hourly wage necessary to support a family budget is $28.04 working 40 hours per week for 50 weeks per year for one parent (or $14.02 per hour each, if two parents work), and $9.10 per hour full-time for a single adult.
Figure 12� Household Survival Budget, Michigan Average, 2015
Monthly Costs, Michigan Average, 2015
SINGLE ADULT2 ADULTS, 1 INFANT,
1 PRESCHOOLER2007 – 2015
PERCENT INCREASEMonthly Costs Housing $478 $696 14%
Child care $– $1,108 8%
Food $184 $609 14%
Transportation $359 $718 8%
Health care $183 $702 *77%
Miscellaneous $138 $425 18%
Taxes $174 $414 19%
Monthly Total $1,516 $4,672 18%
ANNUAL TOTAL $18,192 $56,064 18%Hourly Wage** $9.10 $28.04 18%
* Increase in out-of-pocket health care costs from 2007 to 2015 was 48%; increase including ACA penalty was 77%. ** Wage working full-time required to support this budget Note: Percent increases in Figure 12 are an average of the increases in each category for a single-adult and for a four-person family. Source: U.S. Department of Housing and Urban Development (HUD), 2015; U.S. Department of Agriculture (USDA), 2015; Bureau of Labor Statistics (BLS), 2015; Internal Revenue Service (IRS), Michigan Department of Treasury, 2015; and Michigan Office of Great Start, 2015
The cost of household basics in the Household Survival Budget – housing, child care, food, transportation, health care, taxes, and other miscellaneous essentials – increased by 16 percent for a single adult and 20 percent for a family of four from 2007 to 2015 (Figure 13; note, Figure 12 shows the average percent increase for the two budgets between 2007 and 2015) while the average wage increased by 18 percent. In comparison, the rate of inflation nationally was 14 percent. The rise in the Household Survival Budget in Michigan was driven primarily by a 14 percent increase in housing and food and a 77 percent increase in health care costs (Bureau of Labor Statistics (BLS), 2015).

17UNIT
ED W
AY A
LICE
REP
ORT
– 20
17 U
PDAT
E FO
R M
ICHI
GAN
The majority of the increase in health care costs was due to increases in out-of-pocket medical expenses, while one-third of the budget increase in health care costs was due to costs associated with the Affordable Care Act (ACA). Since ALICE does not earn enough to afford the premiums for the ACA Marketplace plans – even the least expensive Bronze plan – and many ALICE households make too much to be eligible for Medicaid (the eligibility cutoff is 138 percent of the FPL), the Household Survival Budget, includes the least expensive option, which is the cost of the “shared responsibility payment” – the penalty for not having coverage. The annual penalty was $325 for a single adult and $975 for a family of four in 2015 (Internal Revenue Service (IRS), 2016). These costs may change in the future as insurance plans change and federal health care legislation changes over time in Michigan and across the country.
From a broader perspective, many households in Michigan with income below the ALICE Threshold were able to purchase insurance through the ACA Marketplace due to Cost Sharing Reductions and Premium Tax Credits. With significant increases in ACA enrollments, Michigan has reduced the number of uninsured in all income groups (American Community Survey, 2007, 2010, 2012, and 2015; Centers for Medicare & Medicaid Services (CMS), 2016).
Figure 13�Household Survival Budget, Michigan Average, 2007 to 2015
16% Change
20% Change
$18,192
$56,064
$0
$10,000
$20,000
$30,000
$40,000
$50,000
$60,000
Adult Family
2007
2010
2015Cos
t of B
udge
t
Source: U.S. Department of Housing and Urban Development (HUD) , 2007-2015; U.S. Department of Agriculture (USDA) , 2007-2015; Bureau of Labor Statistics (BLS), 2007-2015; Internal Revenue Service (IRS), 2007-2015; Michigan Department of Treasury, 2007-2015; and Michigan Office of Great Start, 2007-2015
The Household Survival Budget for seniors is based on the budget for a single adult, so likely underestimates the additional costs many seniors incur, especially those with health issues. For example, Medicare does not cover most dental and foot care, eye exams and glasses, and aides and equipment (Centers for Medicare & Medicaid Services (CMS), 2016).
The Household Survival Budget varies across Michigan counties. The basic essentials were least expensive for a family in Osceola at $43,920 per year, and for a single adult in Tuscola at $16,512. They were most expensive for a family in Macomb at $64,320, and for a single adult in Washtenaw at $21,288. A Household Survival Budget for each county in Michigan is presented in the County Page Exhibit; there is also a Methodology Exhibit, and additional budgets for different family variations are available at http://spaa.newark.rutgers.edu/united-way-alice.

18 UNIT
ED W
AY A
LICE
REP
ORT
– 20
17 U
PDAT
E FO
R M
ICHI
GAN
HOUSEHOLD SURVIVAL BUDGET COMPONENTSHousing: U.S. Department of Housing and Urban Development (HUD)’s Fair Market Rent (FMR) for an efficiency apartment for a single adult and a two-bedroom apartment for a family. The cost includes utilities but not telephone service, and it does not include a security deposit.
Child Care: The cost of registered home-based child care for an infant and a 4-year-old. Home-based child care has only voluntary licensing, so the quality of care that it provides is not regulated and may vary widely between locations (Michigan Office of Great Start, 2007-2015). However, licensed and accredited child care centers, which are fully regulated to meet standards of quality care, are significantly more expensive.
Food: U.S. Department of Agriculture’s (USDA) Thrifty Food Plan, which is also the basis for the Supplemental Nutrition Assistance Program (SNAP) and Special Supplemental Nutrition Program for Women, Infants, and Children (WIC) benefits.
Like the original Economy Food Plan, the Thrifty Food Plan was designed to meet the nutritional requirements of a healthy diet, but it includes foods that need a lot of home preparation time with little waste, plus skill in both buying and preparing food. The cost of the Thrifty Food Plan takes into account broad regional variation across the country but not localized variation, which can be even greater, especially for fruits and vegetables (Hanson, 2008; Leibtag & Kumcu, 2011).
Transportation: The transportation budget is calculated using average annual expenditures for transportation by car and by public transportation from the Bureau of Labor Statistics’ Consumer Expenditure Survey (CES). Since the CES is reported by metropolitan statistical areas and regions, counties are matched with the most local level possible.
Health Care: The health care budget includes nominal out-of-pocket health care spending, medical services, prescription drugs, and medical supplies using the average annual health expenditure reported in the CES plus a penalty for not purchasing insurance as mandated by the Affordable Care Act (ACA). Because ALICE does not qualify for Medicaid but cannot afford even the Bronze Marketplace premiums and deductibles, we add the cost of the “shared responsibility payment” – the penalty for not having coverage – to the current out-of-pocket health care spending. The penalty for 2015 was $325 for a single adult and $975 for a family of four.
Miscellaneous: The miscellaneous category includes 10 percent of the budget total (including taxes) to cover cost overruns. It could be used for items many consider additional essentials, such as toiletries, diapers, cleaning supplies, or work clothes.
Taxes: The tax budget includes both federal and state income taxes where applicable, as well as Social Security and Medicare taxes. These rates include standard federal and state deductions and exemptions, as well as the federal Child Tax Credit and the Child and Dependent Care Credit as defined in the Internal Revenue Service 1040: Individual Income Tax, Forms and Instructions. They also include state tax deductions and exemptions such as the Personal Tax Credit and renter’s credit as defined in each state Department of Revenue’s 1040: Individual Income Tax, Forms and Instructions. In most cases, ALICE households do not qualify for the Earned Income Tax Credit (EITC) eligibility limit.

19UNIT
ED W
AY A
LICE
REP
ORT
– 20
17 U
PDAT
E FO
R M
ICHI
GAN
HOW DOES THE SURVIVAL BUDGET COMPARE?The Household Survival Budget is a very specific measure that is used to recognize the bare minimum costs for a household to live and work in the modern economy, calculated on actual household expenditures. By comparison, other existing budgets provide different ways to view local economies, ranging from the very lowest measure, the Federal Poverty Level (FPL), to the highest, the Household Stability Budget (Figure 14).
Figure 14� Comparison of Household Budgets (family of 4), Calhoun County, Michigan, 2015
$99
$1,039 $1,346 $1,159 $1,201 $927 $567 $567 $1,221
$689 $1,029 $782 $608 $824 $710 $580
$753 $893 $753 $901$4
46 $408 $724
$689 $1,044 $609 $697 $707$4
03$2
85
$0 $1,000 $2,000 $3,000 $4,000 $5,000 $6,000 $7,000 $8,000 $9,000
Housing Child Care Food Transportation Health CareCell Phone Savings Miscellaneous Taxes
ALICE Stability$97,512/year
EPI$62,673/year
MIT$58,830/year
ALICE Survival$53,208/year
FPL$24,250/year
Monthly Cost
Source: American Community Survey, 2015; The ALICE Threshold, 2015; MIT, Calhoun County, 2016; Economic Policy Institute, 2015, U.S. Department of Housing and Urban Development (HUD), 2015; U.S. Department of Agriculture (USDA), 2015; Bureau of Labor Statistics (BLS), 2015; Internal Revenue Service (IRS), 2015
Budget ComparisonsThe Household Survival Budget is significantly higher than the FPL of $24,250 per year for a family of four and $11,770 per year for a single adult in 2015 (U.S. Department of Health & Human Services, 2015). However, it is lower than the Massachusetts Institute of Technology (MIT) Living Wage Calculator’s budget by 11 percent in Calhoun County, Michigan, and the Economic Policy Institute’s Family Budget Calculator by 18 percent in the Battle Creek metro area (Calhoun County) (note, the EPI budget is in 2014 dollars). Though these alternative budgets are slightly more comfortable, providing for higher quality housing and child care, more nutritious food, more reliable transportation, and employer-sponsored health insurance, it would still be hard to live on these budgets for a long period of time. It is important to note that while the budgets use similar calculations for taxes, the amount of taxes in the alternative budgets are higher because their base budgets are higher. As the total budget increases, the income needed to cover the expenses increases, and higher income results in a larger tax bill. Detailed comparison of the budgets is outlined below (Figure 15) (Massachusetts Institute of Technology (MIT), 2015; U.S. Department of Health & Human Services, 2015; Economic Policy Institute, 2015).

20 UNIT
ED W
AY A
LICE
REP
ORT
– 20
17 U
PDAT
E FO
R M
ICHI
GAN
Figure 15�Comparison of Household Budgets by Category, 2015
Household Survival Budget MIT Living Wage Budget EPI Family Budget
Calculator
Housing
HUD’s 40th rent percentile for a two-bedroom apartment (which includes all utilities whether paid by the landlord/owner or by the renter).
HUD’s 40th rent percentile for a two-bedroom apartment plus additional utilities to HUD’s estimate.
HUD’s 40th rent percentile for a two-bedroom apartment plus additional utilities to HUD’s estimate.
Child Care Home-based child care for an infant and a preschooler.
Lowest-cost child care option available (usually home-based care) for a 4-year-old and a school-age child, whose care is generally less costly than infant child care.
Licensed and accredited child care centers, which have significantly higher costs than home-based centers for a “young child” and a “child” (no ages specified), whose care is generally less costly than infant child care.
Food USDA’s Thrifty Food Plan for a family of four.
USDA’s Low-Cost Food Plan for a family of four.
USDA’s Low-Cost Food Plan estimates the cost of food for each person in the family and totals those numbers.
TransportationIncludes only the operating costs for a car (including car insurance), or public transportation where available.
Includes operating costs for a car (including car insurance) and the cost of vehicle financing.
Includes operating costs for a car (including car insurance).
Health CareOut-of-pocket health care expenses plus the Affordable Care Act (ACA) penalty.
Employer-sponsored health insurance, medical services and supplies, and drugs.
ACA’s least expensive Bronze plan.
Miscellaneous Includes 10 percent of the budget for cost overruns.
Includes essential clothing and household expenses.
Includes apparel, personal care, and household supplies.
Source: Massachusetts Institute of Technology (MIT), 2015; Economic Policy Institute, 2015; Glasmeier & Nadeau, 2015
Household Stability BudgetBecause the alternative budgets only cover the bare essentials, it is helpful to calculate a budget that provides for stability over time – as well as a reasonable quality of life, and peace of mind. The ALICE Household Stability Budget is meant to fill this gap. This budget is significantly higher than the other measures because it estimates what it costs to support and sustain a secure and economically viable household.
The Household Stability Budget includes:
• Safer housing that needs fewer repairs, reflected in the median rent for single adults and single parents, and a moderate house with a mortgage for a two-parent family.
• Child care is upgraded to licensed and accredited care where quality is regulated.
• Food is elevated to the USDA’s Moderate Food Plan, which provides more variety than the Thrifty Food Plan and requires less skill and time for shopping and cooking, plus one meal out per month.
• Transportation includes leasing a car, allowing drivers to more easily maintain a basic level of safety and reliability.
• Health insurance is represented by the cost of an employer-sponsored health plan.

21UNIT
ED W
AY A
LICE
REP
ORT
– 20
17 U
PDAT
E FO
R M
ICHI
GAN
• The addition of cell phone ownership, which is increasingly necessary to work in the modern economy.
• A Miscellaneous category, which represents 10 percent of the five basic necessities.
• The addition of a Savings category because savings are crucial to achieving stability. Savings equal 10 percent of the budget, which is typically enough to invest in education and retirement, cover monthly payments on a student loan, or put towards a down payment on a house. However, in many cases, savings are used for emergencies and never accumulate.
The average Household Stability Budget for Michigan is $98,457 per year for a family of four – 83 percent higher than the Household Survival Budget (Figure 14 shows the Household Stability Budget for Calhoun County, which is $97,512).

22 UNIT
ED W
AY A
LICE
REP
ORT
– 20
17 U
PDAT
E FO
R M
ICHI
GAN
III. ACHIEVING STABILITY: INCOME, SAVINGS AND PUBLIC ASSISTANCEIt is often assumed that ALICE households have savings to draw upon in an emergency or have access to public assistance as a last resort. However, most ALICE households have little or no savings, and are not typically eligible for public and private assistance because their earnings are above qualifying limits. This section reports how resources have changed over time.
SHIFTS IN SOURCES OF INCOMEChanges in the sources of income for Michigan households during the period between 2007 and 2015 provide insight into the way the economy’s downturn and rebound impacted families differently. The toughest economic years were from 2007 to 2010, when most of these income changes occurred. Some of those trends have since been reversed, but none have returned to pre-2007 levels (Figure 16).
In 2015, 72 percent (2.77 million) of households had wage or salary income (blue bar, left axis), the most common sources of income for households in Michigan. The number of households with wage or salary income decreased by 7 percent from 2007 to 2012 but then increased by 2 percent from 2012 to 2015. With total earnings rising 19 percent since 2010 (dotted yellow line, right axis), but 62 percent of all jobs paying less than $20 an hour, it suggests that workers earning higher wages are responsible for the increase in total earnings, while low-wage workers’ earnings have not kept pace (American Community Survey, 2007, 2010, 2012, and 2015).
Figure 16� Earnings by Number of Households and Aggregate Total, Michigan, 2007 to 2015
$92
$112
$132
$152
$172
$192
$212
2,600
2,650
2,700
2,750
2,800
2,850
2,900
2,950
2007 2010 2012 2015
Agg
rega
te In
com
e (in
bill
ions
)
Hou
seho
lds
(in th
ousa
nds)
Households with Earnings Aggregate Earnings
Source: American Community Survey, 2007-2015

23UNIT
ED W
AY A
LICE
REP
ORT
– 20
17 U
PDAT
E FO
R M
ICHI
GAN
Households in Michigan receive several other types of income as well (Figure 17). Although much has been written about the “gig” economy (also known as the contract or non-traditional economy), only a small number of households in Michigan list self-employment as a source of income (though more may earn and not report it). Just 9 percent of households reported self-employment income in 2015. The self-employed took a hit during the Great Recession and continued to fall since, dropping by 13 percent from 2007 to 2015 (American Community Survey, 2007, 2010, 2012, and 2015).
Figure 17�Percent Change in Household Sources of Income, Michigan, 2007 to 2015
22% Change
-16% Change 5% Change
40% Change
-13% Change 53% Change
-13% Change
0
200,000
400,000
600,000
800,000
1,000,000
1,200,000
1,400,000
SocialSecurity
Interest orDividends
Retirement SNAP Self-Employment SSI TANF
2007 2010 2012 2015
Hou
seho
lds
Source: American Community Survey, 2007-2015
The next most common source of income after wages is Social Security. The impact of the aging population is evident in the 22 percent increase in the number of households getting Social Security income and the 5 percent increase in households receiving retirement income from 2007 to 2015.
The impact of the financial downturn on households during this time period is also reflected in the striking increase in the number of Michigan households receiving income from government sources other than Social Security. While not all ALICE households qualified for government support between 2007 and 2015, many with one or more members who lost a job during this period began receiving government assistance for the first time. The number of households receiving SNAP, the Supplemental Nutrition Assistance Program formerly known as food stamps, increased by more than 40 percent. The average SNAP benefit increased 44 percent from 2007 to 2012, but then decreased by 8 percent from 2012 to 2015 to $125.65 per person per month (Kaiser Family Foundation, 2014).
At the same time, the number of households receiving government aid once known as “welfare,” through Temporary Assistance for Needy Families (TANF), which totaled about 105,000 families in 2015, increased by 28 percent from 2007 to 2010, but then started to decrease, falling by 32 percent from 2010 to 2015. The number of households receiving Supplemental Security Income (SSI), which includes welfare payments to low-income people who are 65 and older and to people of any age who are blind or disabled, rose by 53 percent through the period (U.S. Department of Health and Human Services, 2009, 2014).

24 UNIT
ED W
AY A
LICE
REP
ORT
– 20
17 U
PDAT
E FO
R M
ICHI
GAN
SAVINGS AND ASSETSWith so many families not able to keep up with the cost of living, accumulating assets is difficult in Michigan. The cost of unexpected emergencies, ranging from natural disasters to personal health crises, can deplete savings. Job losses have forced people to tap into their retirement savings, or take out second mortgages or home equity lines of credit. Having minimal or no assets makes ALICE households more vulnerable to emergencies. It also can increase their overall costs when they have to use alternative financing with fees and high interest rates that make it difficult or impossible to save money or amass more assets.
According to a 2015 Financial Capability Survey, 49 percent of Michigan residents did not have a “rainy day fund” to cover expenses for three months, in case of emergencies such as sickness, job loss, or economic downturn. These findings are on par with the 2011 Corporation for Enterprise Development (CFED) survey that found 25 percent of Michigan households were “asset poor,” defined as not having enough net worth to subsist at the poverty level for three months without income. And 39 percent were “liquid asset poor,” which includes cash or a savings account, but not a vehicle or home (Corporation for Enterprise Development (CFED), 2012; FINRA Investor Education Foundation, 2016).
While data on savings and investments is minimal, levels of ownership of three of the most common assets in Michigan – vehicles, homes, and investments – provide insight into resources families have for emergencies and to accumulate wealth (Figure 18). Most Michigan households have at least one vehicle, a necessity for work. In 2015, 34 percent of all households had one vehicle, 39 percent had two, and 19 percent had three or more. While cars offer benefits beyond their cash value, they are not an effective means of accumulating wealth because the value of a car normally depreciates over time. In addition, many ALICE households need to borrow money in order to buy a vehicle (Jones, 2014; Center for Responsible Lending, 2014; Kiernan, 2016; Zabritski, 2016).
The second most common asset is a home, an asset that has traditionally provided financial stability and the primary means for low-income families to accumulate wealth. Since the subprime housing crisis in 2007, however, homeownership has become a less reliable way of building assets. In 2015, 71 percent of Michigan households owned a home, down from the peak of 77.4 percent in 2006. As homeownership is a primary asset for many families, they are significantly affected by changes in home prices. This is especially important for the 64 percent of Michigan homeowners who have a mortgage. According to the 2015 Financial Capability Survey, 7 percent of Michigan homeowners thought that they would owe more on their home than they would earn by selling it (American Community Survey, 2007, 2010, 2012, and 2015; Federal Reserve Bank of St. Louis, 2016; Herbert, McCue, & Sanchez-Moyano, September 2013; Federal Reserve, 2014; FINRA Investor Education Foundation, 2016).
The most effective resource to weather an emergency is an investment that produces income, which can range from a checking account to a 401K retirement plan to a rental property. Only 21 percent of households in Michigan received interest and dividends or rental income (same as the national average). The number of households with investment income dropped by 16 percent between 2007 and 2012, largely because of the stock market crash as many families used assets to cover expenses during periods of unemployment and lower income. The number with investment income picked up in 2012, increasing by 7 percent from 2012 to 2015. When combined with an emergency, the loss of these assets forced many households below the ALICE Threshold (Bricker, et al., 2014; American Community Survey, 2007, 2010, 2012, and 2015; Federal Reserve, 2014).

25UNIT
ED W
AY A
LICE
REP
ORT
– 20
17 U
PDAT
E FO
R M
ICHI
GAN
Figure 18� Households with Assets, Michigan, 2015
1 Vehicle, 34%
2 Vehicles, 39%
No Mortgage, 28%21%
3+ Vehicles, 19%
With Mortgage,43%
0%
10%
20%
30%
40%
50%
60%
70%
80%
90%
100%Pe
rcen
t of H
ouse
hold
s
Vehicle Home Interest, Dividends, or Rental Income
Source: American Community Survey, 2015
DOES PUBLIC ASSISTANCE BRING FINANCIAL STABILITY?The persistence of low wages, underemployment, periods of unemployment, and loss of employer-sponsored benefits have led to financial insecurity for many ALICE households. As a result, many working ALICE households have turned to government supports and services, often for the first time, to make ends meet. When workers do not earn enough to pay for basic necessities, they may be forced to turn to public support to feed their families, secure health insurance, or pay rent and other basic needs.
The ALICE Income Assessment quantifies total income of households below the ALICE Threshold and how much public and nonprofit assistance is spent on these low-income households. The methodology for the Income Assessment has been slightly revised since the last United Way ALICE Report for Michigan was published, and incorporated into this analysis (for more details, see the What’s New section at the beginning of this report, and Exhibit IX: Methodology Overview).
From 2012 to 2015, the number of households below the ALICE Threshold changed very little, decreasing slightly from 1,540,082 in 2012 to 1,531,650 in 2015. Earnings of these households grew slightly, from $29.0 billion to $30.9 billion over that period, but their total need increased even more, reaching $64.5 billion (up from $60.1 billion in 2012). Federal and state government spending on cash public assistance remained relatively constant, rising from $3.26 billion to $3.36 billion. Other government programs (excluding health) increased by 31 percent to $4.82 billion, and nonprofit spending remained flat at $436 million. Health care spending rose by 23 percent to $18.0 billion. As a result, the size of the Unfilled Gap – what is needed to bring all households to the ALICE Threshold – shrunk by 23 percent, to $7 billion. In other words, $7 billion in additional wages or public resources are still needed for all Michigan households to have income at the ALICE Threshold (Figure 19).

26 UNIT
ED W
AY A
LICE
REP
ORT
– 20
17 U
PDAT
E FO
R M
ICHI
GAN
Figure 19�ALICE Income Assessment, Michigan, 2012 to 2015
$30.9
$29.0
$3.36
$3.26
$4.82
$3.67
$0.4
$0.4
$18.0
$14.6
$7.00
$9.10
$0 $10 $20 $30 $40 $50 $60 $70
2015
2012
Spending (in billions)
Cash Public Assistance
Health Care Unfilled Gap
Income Government Programs
Nonprofits
Source: Office of Management and Budget, 2015; Michigan Department of Treasury, 2015; American Community Survey, 2015; National Association of State Budget Officers, 2015;, Urban Institute, 2010 and 2012; for more detail see the Methodology Exhibit
Without public assistance, many ALICE and poverty-level households would face even greater hardship, and many more households would be in poverty, especially in the wake of the Great Recession. Programs like SNAP, the Earned Income Tax Credit (EITC) and Child care Tax Credit (CTC), Medicaid, and food banks provide a critical safety net for basic household well-being, and enable many families to work (Sherman, Trisi, & Parrott, 2013; Dowd & Horowitz, 2011; Grogger, 2003; Coleman-Jensen, Rabbitt, Gregory, & Singh, September 2015; Rosenbaum, 2013; Feeding America, 2014). This analysis is not an evaluation of the efficiency of the programs in delivering goods or services. However, research has shown that assistance is not always well-targeted, effective, and timely. There are several challenges to meeting basic needs with public and private assistance.
First, the majority of government programs are intended to fill short-term needs, such as basic housing, food, clothing, health care, and education. By design, their goal is not to help households achieve long-term financial stability (Haskins, 2011; Shaefer & Edin, 2013; O’Dea, 2016; Ben-Shalom, Moffitt, & Scholz, 2012).
Second, crucial resources are often targeted to households near or below the Federal Poverty Level (FPL), meaning that many struggling ALICE households are not eligible for assistance. Benefits are often structured to end before a family reaches stability, known as the “cliff effect.” In Michigan, as earnings rise, SNAP benefits decrease once income reaches 185 percent of the FPL, or just $44,123 for a family of four – well below the $56,064 Household Survival Budget for a family (National Conference of State Legislatures, October 2011).
Third, resources may not be available where they are needed. This statewide analysis may mask geographic disparities in the various types of assistance. If funding is disproportionately going to one part of Michigan, there could be unmet need, not reflected in the Income Assessment, in other parts of the state.
Finally, because public and nonprofit assistance is allocated for specific purposes and often delivered as services, it can only be used for specific parts of the household budget. Only 5 percent of the assistance provided in Michigan is done through cash transfers, which households can use toward any of their most pressing needs. The remainder is earmarked for specific items, like food assistance or health care, for which

27UNIT
ED W
AY A
LICE
REP
ORT
– 20
17 U
PDAT
E FO
R M
ICHI
GAN
the need varies across households below the ALICE Threshold. This means that not all households benefit equally from assistance. For example, a household that only visits a doctor for an annual checkup does not receive its share of the spending put toward health care assistance in Michigan, while a household that experiences a medical emergency receives far more than the average.
Spending by Category: Example for Families with ChildrenA breakdown of public and nonprofit spending in Michigan by category reveals that there are large gaps in key areas, particularly housing and child care. Figure 20 compares the budget amounts for each category of the Household Survival Budget for a family of four (shown in dark blue) with income from households below the ALICE Threshold (shown in dark yellow), plus the public and nonprofit spending in each category (shown in yellow cross-hatch). The gap or surplus in each budget area is the difference between the blue column and the yellow/crosshatch column. The comparison assumes that the income households earn is allocated proportionately to each category.
Figure 20�Comparing Basic Need with Public and Nonprofit Spending by Category (Excluding Health Care and Miscellaneous Expenses), Michigan, 2015
44% Gap
50% Gap
31% Gap 51% Gap
5% Gap
$0$2,000$4,000$6,000$8,000
$10,000$12,000$14,000$16,000$18,000
Housing Child Care Food Transportation Taxes
Mill
ions
Minimum Need Income – HH Below AT Government & Nonprofit Assistance
Source: Office of Management and Budget, 2015; U.S. Department of Agriculture (USDA), 2015; Internal Revenue Service, 2015; Michigan Department of Treasury, 2015; American Community Survey, 2015; National Association of State Budget Officers, 2015; 2016; Urban Institute, 2012
HousingIn the Household Survival Budget for a family of four, housing accounts for 15 percent of the family budget. Following this allocation, this analysis assumes that all ALICE households then spend 15 percent of their income on housing. That still leaves them far short of what is needed to afford rent at HUD’s 40th rent percentile. But does public assistance fill the gap? Federal housing programs provide $665 million in assistance, including Section 8 Housing Vouchers, the Low Income Home Energy Assistance Program, the Public Housing Operating Fund, and Community Development Block Grant (CDBG). In addition, nonprofits spend an estimated $87 million on housing assistance (because nonprofit spending is not available by category, the estimate is one-fifth of the total nonprofit budget). Yet when income and government and nonprofit assistance for housing are combined, there is still a 44 percent gap in resources for all households to meet the basic ALICE Threshold for housing. Therefore it is not surprising that most families spend more of their income on housing, which leaves less for other items.

28 UNIT
ED W
AY A
LICE
REP
ORT
– 20
17 U
PDAT
E FO
R M
ICHI
GAN
Child Care In the Household Survival Budget for a family of four, child care accounts for 24 percent of the family budget. Yet for many ALICE households, 24 percent of earned income is not enough to pay for even home-based child care, the least expensive organized care option. Additional child care resources available to Michigan families include $271 million in federal education spending for Head Start, the program that helps children meet their basic needs or is necessary to enable their parents to work. Nonprofits provide additional child care assistance including vouchers and child care services estimated at $87 million. Yet when income and government and nonprofit assistance are combined, there is still a 50 percent gap in resources for all households to meet the basic ALICE Threshold for child care.
Food In the Household Survival Budget for a family of four, food accounts for 13 percent of the family budget, yet for many ALICE households, 13 percent of what they actually earn is insufficient to afford even the USDA Thrifty Food Plan. Food assistance for Michigan households includes $1.8 billion of federal spending on food programs, primarily SNAP (formerly food stamps); school breakfast and lunch programs; and the Special Supplemental Nutrition Program for Women, Infants, and Children (WIC). Nonprofits also provide food assistance – including food pantries, food banks, and soup kitchens – totaling approximately $87 million. Yet when income and government and nonprofit food assistance are combined, there is still a 31 percent gap in resources for all households to meet the basic ALICE Threshold for food.
Transportation In the Household Survival Budget for a family of four, transportation accounts for 16 percent of the family budget. Yet for many ALICE households, 16 percent of what they actually earn is not enough to afford even the running costs of a car. While Michigan’s public transportation systems are state-funded, there is no government spending on transportation targeted specifically to ALICE and poverty-level families. However, nonprofits provide some programs, spending an estimated $76 million. Yet, when income and nonprofit assistance are combined, there is a 51 percent gap in resources for all households to meet the basic ALICE Threshold for transportation.
TaxesIn the Household Survival Budget for a family of four, taxes account for 7 percent of the family budget, so this analysis assumes that 7 percent of income is allocated toward taxes. Though earning enough to afford the Household Survival Budget would put households above the eligibility level for the Earned Income Tax Credit (EITC), many households below the ALICE Threshold benefit from the EITC (the average income for households receiving EITC in Michigan in 2015 was $13,016). The federal EITC provided $2 billion in tax credits and refunds for Michigan’s working families, and Michigan EITC (worth 6 percent of the federal) provided an additional $118 million. Eligible households collected an average federal tax refund of $2,530, which helped 823,000 ALICE and poverty-level families (National Conference of State Legislatures, 2016; Brookings, 2016). The per-household amount of taxes depends on a recipient’s income and the number of children they have. Yet when income and government credits and refunds are combined, there remains a 5 percent gap in resources for all households to meet the basic ALICE Threshold for taxes.
The Special Case of Health CareHealth care resources are separated from other government and nonprofit spending because they account for the largest single source of assistance to low-income households: $18 billion or 68 percent of all spending in Michigan. Health care spending includes federal grants for Medicaid, CHIP, and Hospital Charity Care; state matching grants for Medicaid, CHIP, and Medicare Part D Clawback Payments; and the cost of unreimbursed or unpaid services provided by Michigan hospitals (Office of Management and Budget, 2016; Internal Revenue Service (IRS), 2007, 2010 and 2012; National Association of State Budget Officers, 2014).

29UNIT
ED W
AY A
LICE
REP
ORT
– 20
17 U
PDAT
E FO
R M
ICHI
GAN
With the increasing cost of health care and the implementation of the Affordable Care Act (ACA), federal, state, and hospital spending on health care for low-income households has increased more than any other category, but the percent of residents insured in Michigan has also increased. For this reason, spending on health care in Michigan surpasses the amount needed for each household to afford basic out-of-pocket health care expenses. However, even this level of assistance does not necessarily guarantee good or improved health to low-income Michigan households. This analysis does not include the broader impact of increased health care spending, for example, on jobs or taxes (Ayanian, Ehrlich, Grimes, & Levy, 2017).
Because there is greater variation in the amount of money families need for health care than there is in any other single category, it is difficult to estimate health care needs and costs, and even more difficult to deliver health care efficiently to families in poverty or ALICE families. An uninsured (or even an insured) household with a severe and sudden illness could be burdened with hundreds of thousands of dollars in medical bills in a single year, while a healthy household would have few expenses. National research has shown that a small proportion of households facing severe illness or injury account for more than half of all health care expenses, and those expenses can vary greatly from year to year (U.S. Department of Housing and Urban Development (HUD), 2010; Stanton, 2006; Kaiser Family Foundation, 2012).
Looking at the breakdown of average spending per household below the ALICE Threshold further highlights the difference between health care spending and other types of assistance. In Michigan, the average assistance each household received was $11,762 in health care resources from the government and hospitals in 2015, a 24 percent increase from 2012. By comparison, the average benefit to these households from other types of federal, state, and local government and nonprofit assistance – excluding health care – was $5,626 per household, an 8 percent increase from 2012. Combining the two categories, the average household below the ALICE Threshold received a total of $17,387 in cash and services, shared by all members of the household and spread throughout the year, a 22 percent increase driven primarily by the increase in health care spending (Figure 21) (Office of Management and Budget, 2016; American Community Survey, 2007, 2010, 2012, and 2015; National Association of State Budget Officers, 2014; Urban Institute, 2012; Michigan Department of Treasury, 2015; the ALICE Threshold, 2014).
Figure 21�Total Public and Nonprofit Assistance per Household Below the ALICE Threshold, Michigan, 2015
Spending per Household Below the ALICE Threshold
HEALTH ASSISTANCE ONLY ASSISTANCE EXCLUDING HEALTH TOTAL ASSISTANCE
2012 $9,490 $4,783 $14,273
2015 $11,762 $5,625 $17,387
Source: Office of Management and Budget, 2015; Michigan Department of Treasury, 2015; National Association of State Budget Officers, 2015; Urban Institute, 2012; American Community Survey, 2015; and the ALICE Threshold, 2015
To put the amount of per-household spending in perspective, most Michigan residents, including those well above the ALICE Threshold, receive some form of assistance. For example, households with income between $100,000 and $200,000 receive an average of $7,208 as a home mortgage interest deduction and $4,042 in real estate tax deductions; households with income above $1 million receive an average of $22,873 as a home mortgage interest deduction and $17,100 in real estate tax deductions (Internal Revenue Service, 2014).

30 UNIT
ED W
AY A
LICE
REP
ORT
– 20
17 U
PDAT
E FO
R M
ICHI
GAN
IV. HOW HAVE ECONOMIC CONDITIONS CHANGED FOR ALICE FAMILIES?More than any demographic feature, employment defines ALICE households. The financial stability of ALICE workers depends on local job opportunities, as well as the cost and condition of housing, and the availability of community resources. The updated Economic Viability Dashboard presented in this section describes changes in these economic factors throughout Michigan.
MICHIGAN JOBSMichigan’s job market has improved since 2012, though low-wage jobs still dominate the economic landscape. In Michigan, 62 percent of jobs pay less than $20 per hour, with 69 percent of those paying less than $15 per hour. This is slightly lower than the 65 percent of jobs that were low-wage in 2007 (Figure 22). A full-time job that pays $15 per hour grosses $30,000 per year, which is well below the $56,064 Household Survival Budget for a family of four in Michigan.
With 4.5 million total jobs in Michigan recorded by the Bureau of Labor Statistics in 2015, the job market has shown significant improvement since 2010, and just surpassed the 2007 level (Figure 22). Though jobs paying less than $20 per hour dominate the job landscape, their numbers decreased between 2007 and 2015, primarily driven by a 40 percent reduction in jobs paying less than $10 per hour. The number of jobs paying more than $30 per hour rose dramatically: those paying $30 to $40 increased by 24 percent and jobs paying $40 to $60 more than doubled. Jobs that saw the most growth were team assemblers, general and operations managers, nurses, customer service representatives, and cashiers (Bureau of Labor Statistics (BLS), 2007 and 2015).
When 2007 wages are adjusted for inflation (14 percent increase from 2007 to 2015) and converted into their value in 2015 dollars, the change in wages over time is not as positive. Using these constant 2015 dollars, the proportion of jobs paying less than $20 per hour has actually increased by 7 percentage points, from 55 percent in 2007 to 62 percent in 2015.
Figure 22�Number of Jobs by Hourly Wage, Michigan, 2007 to 2015
-40% Change
15% Change
1% Change
-17% Change
24% Change 114% Change
-9% Change
0
200
400
600
800
1,000
1,200
1,400
Num
ber o
f Job
s (in
thou
sand
s)
Less Than $10 $10-$15 $15-$20 $20-$30 $30-$40 $40-$60 Above $60
2007 2012 2015
Number of Jobs2007: 4.13 Million2012: 3.74 Million2015: 4.17 Million
Source: Bureau of Labor Statistics, Occupational Employment Statistics (OES) Wage Survey – All Industries Combined, 2007-2015

31UNIT
ED W
AY A
LICE
REP
ORT
– 20
17 U
PDAT
E FO
R M
ICHI
GAN
Industries in Michigan vary in the contributions they make to the state’s employment and gross domestic product (GDP). The industries with large GDP contributions but low employment tend to pay higher wages to employees, while those with smaller GDP contributions but higher employment have more people to pay at lower wages. In Michigan, ALICE workers tend to be concentrated in the industries with smaller GDP contributions (Figure 23).
Manufacturing contributed $92 billion to Michigan’s GDP in 2015, a 17 percent increase from 2007. Though manufacturing has become more automated, especially motor vehicles and parts, and diversified into chemical projects, it still accounts for the largest portion of GDP, 20 percent (Figure 23). The trends for manufacturing do not completely reflect the change occurring in this sector. With the Great Recession and automation, factory jobs declined. During the recovery, some factory jobs returned but they paid less, and some new technology jobs were created to oversee the new automated production. As manufacturing became more automated, the new demand for cars was met with a significant surge in productivity but not more jobs (Senate Fiscal Agency, 2016; Glazer & Grimes, 2015; Bureau of Economic Analysis, 2015).
The trade, transportation and utilities industry made the second largest contribution to GDP (17.2 percent) and employed the largest number of workers, 771,000 workers or 17 percent of the workforce. While its contribution to GDP increased between 2007 and 2015 (21 percent), employment in the industry fell by 2 percent, although it continues to employ significant numbers of ALICE workers (Bureau of Labor Statistics (BLS), 2015; Bureau of Economic Analysis, 2015).
Conversely, the financial sector continues to be the third largest contributor to GDP, with over $79 billion in 2015 or 17 percent of total GDP, but employment in the industry remains below 5 percent of the workforce. There are few ALICE workers in this field, and they are primarily in administrative support roles (Bureau of Labor Statistics (BLS), 2015; Bureau of Economic Analysis, 2015).
The next five largest employing industries – professional and business services, government, education and health services, leisure and hospitality, and agriculture employ – a larger share of the population than is represented by its contribution to GDP. Primarily service industries, these are large employers of ALICE workers. While growth in agriculture and government has declined, education and health services and professional and business services are the fastest growing for employment. Growth in health care services stands out: In 2014, 17 of every 100 jobs in Michigan were directly or indirectly tied to health care organizations. In fact, Michigan’s health care industry contributes more direct jobs and taxes paid to the economy than education and auto manufacturing (Bureau of Labor Statistics (BLS), 2015; Michigan Health and Hospital Association, 2015; Bureau of Economic Analysis, 2015).
While small in terms of size, the construction industry was hit especially hard by the Great Recession, but it has been recovering and is predicted to be one of the top job producers over the next two years (Fulton, 2016).

32 UNIT
ED W
AY A
LICE
REP
ORT
– 20
17 U
PDAT
E FO
R M
ICHI
GAN
Figure 23�Employment and GDP by Industry, Michigan, 2007 to 2015
0%
5%
10%
15%
20%
25%
Perc
ent o
f Tot
al
17%
Cha
nge
21%
Cha
nge
-2%
Cha
nge
26%
Cha
nge
7% C
hang
e
25%
Cha
nge
16%
Cha
nge
26%
Cha
nge
26%
Cha
nge
8% C
hang
e
0% C
hang
e
2% C
hang
e
9% C
hang
e
-8%
Cha
nge
9% C
hang
e
-7%
Cha
nge
3% C
hang
e
-32%
Cha
nge
GDP (Total = $468 Billion) Employment (Total = 4.5 Million)
Man
ufac
turin
gTr
ade,
Tra
nspo
rtatio
n &
Utili
ties
Prof
essi
onal
&
Busi
ness
Ser
vice
s
Fina
ncia
l Act
iviti
es
Gove
rnm
ent
Educ
atio
n &
Heal
th S
ervi
ces
Cons
truct
ion
Leis
ure
& Ho
spita
lity
Agric
ultu
re
Source: Bureau of Labor Statistics (BLS), 2007-2015, and U.S. Department of Commerce, Bureau of Economic Analysis, 2007-2015
With the service sector employing a large number of ALICE workers, it’s important to address several characteristics of the service-sector economy that add to the struggles of their employees. Most notably, service sector jobs pay low wages. In 2015, only five of the 20 most common service sector occupations paid enough to support the family Household Survival Budget, a minimum of $28.04 per hour: registered nurses, general and operations managers, sales representatives, mechanical engineers, and elementary school teachers (except special education) (Figure 24). This, however, is an improvement since 2007, when only registered nurses and general and operations managers reached this minimum.
The most common occupation in Michigan, retail sales, pays a wage that is well below what is needed to make ends meet. The more than 144,300 retail salespeople make an average of $10.06 per hour, or $20,120 if working full-time year round. These jobs fall short of meeting the family Household Survival Budget by more than $36,000 per year. Even if both parents worked full time at this wage, they would fall short of the Household Survival Budget by more than $15,000 per year.
Working in service sector jobs can put more financial stress on ALICE families in other ways. One is the location of these jobs, which is often in areas with high housing costs, meaning that employees have to either pay more for housing or have longer commutes and higher transportation costs. Most of these jobs require employees to work on-site, and they often have unpredictable or nontraditional work schedules which makes it harder to plan around public transportation and child care.
This is especially true for some areas along the shores of Lake Michigan and Mackinac Island, where tourism and resort communities exacerbate some of these challenges. In these areas, the demand for jobs is highest in areas where housing costs are highest, and yet many jobs are low wage and seasonal, making it expensive for workers to live near their work (Wheeler, 2016).

33UNIT
ED W
AY A
LICE
REP
ORT
– 20
17 U
PDAT
E FO
R M
ICHI
GAN
Figure 24� Top 20 Occupations by Employment and Wage, Michigan, 2015
2015 2007–2015Percent Change
OCCUPATION NUMBER OF
JOBS MEDIAN
HOURLY WAGE NUMBER OF
JOBS MEDIAN
HOURLY WAGE Retail Salespersons 144,300 10.06 -6% 4%
Office Clerks, General 109,640 14.51 1% 75%
Food Prep, Including Fast Food 109,150 8.99 1% -24%
Team Assemblers 104,210 15.48 23% -46%
Cashiers 94,520 9.24 18% 22%
Registered Nurses 91,130 31.65 20% 323%
Customer Service Representatives 86,440 14.94 18% 30%
Waiters and Waitresses 77,740 9.08 9% -18%
Laborers and Movers, Hand 68,320 12.48 9% -16%
Janitors and Cleaners 63,150 11.21 12% 6%
General and Operations Managers 62,950 44.78 21% 202%
Stock Clerks and Order Fillers 58,710 10.34 17% -33%
Sales Representatives 56,400 26.48 15% 121%
Secretaries and Administrative Assistants 52,890 15.92 10% -11%
Heavy and Tractor-Trailer Truck Drivers 51,340 18.54 10% -42%
Nursing Assistants 49,780 13.38 7% -46%
Maintenance and Repair Workers 41,590 16.71 -4% -37%
Mechanical Engineers 40,490 42.85 -5% 244%
Bookkeeping and Auditing Clerks 39,060 17.54 -2% 51%
Elementary School Teachers 38,190 31.77 -3% 79%
Source: Bureau of Labor Statistics, Occupational Employment Statistics (OES) Wage Survey – All Industries Combined, 2007 and 2015
Small BusinessesSmall businesses – firms employing fewer than 500 employees – employed just over half of the private sector workforce in 2013 in Michigan. Firms employing less than 20 people employed the largest share. Small businesses, and their employees, experienced the largest shifts during the Great Recession, a trend that continued through 2015. In the second quarter of 2015, for example, 4,867 businesses started up in Michigan and 4,773 exited (meaning they closed, moved to another state, or merged with another company). Startups generated 24,339 new jobs while exits caused 19,208 job losses. Small businesses are more vulnerable to changes in demand, price of materials, and transportation, as well as to cyber attacks and natural disasters. Many small businesses have fewer resources to pay their employees, and even fewer to maintain employees in lean times (U.S. Small Business Administration, 2016).
Some sectors are more heavily reliant on small businesses, such as agriculture (95 percent of employees work in small businesses) and construction (89 percent), while others are almost not at all, such as utilities (less than 1 percent) (Figure 25). For many small businesses, there is a dual challenge when ALICE is both the employee and the customer, such as child care, where more than 90 percent of operators are sole proprietors (included as part of Educational Services in Figure 25). On the one hand, child care workers are ALICE; there are 16,990
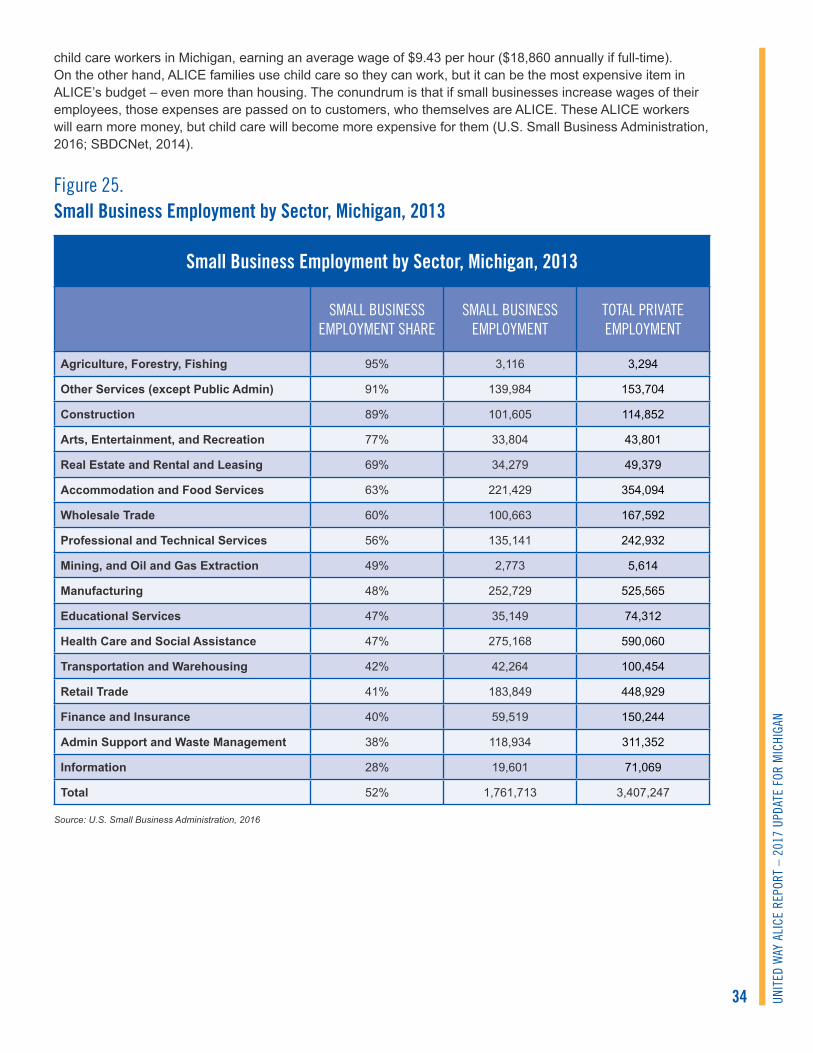
34 UNIT
ED W
AY A
LICE
REP
ORT
– 20
17 U
PDAT
E FO
R M
ICHI
GAN
child care workers in Michigan, earning an average wage of $9.43 per hour ($18,860 annually if full-time). On the other hand, ALICE families use child care so they can work, but it can be the most expensive item in ALICE’s budget – even more than housing. The conundrum is that if small businesses increase wages of their employees, those expenses are passed on to customers, who themselves are ALICE. These ALICE workers will earn more money, but child care will become more expensive for them (U.S. Small Business Administration, 2016; SBDCNet, 2014).
Figure 25�Small Business Employment by Sector, Michigan, 2013
Small Business Employment by Sector, Michigan, 2013
SMALL BUSINESS EMPLOYMENT SHARE
SMALL BUSINESS EMPLOYMENT
TOTAL PRIVATE EMPLOYMENT
Agriculture, Forestry, Fishing 95% 3,116 3,294
Other Services (except Public Admin) 91% 139,984 153,704
Construction 89% 101,605 114,852
Arts, Entertainment, and Recreation 77% 33,804 43,801
Real Estate and Rental and Leasing 69% 34,279 49,379
Accommodation and Food Services 63% 221,429 354,094
Wholesale Trade 60% 100,663 167,592
Professional and Technical Services 56% 135,141 242,932
Mining, and Oil and Gas Extraction 49% 2,773 5,614
Manufacturing 48% 252,729 525,565
Educational Services 47% 35,149 74,312
Health Care and Social Assistance 47% 275,168 590,060
Transportation and Warehousing 42% 42,264 100,454
Retail Trade 41% 183,849 448,929
Finance and Insurance 40% 59,519 150,244
Admin Support and Waste Management 38% 118,934 311,352
Information 28% 19,601 71,069
Total 52% 1,761,713 3,407,247
Source: U.S. Small Business Administration, 2016

35UNIT
ED W
AY A
LICE
REP
ORT
– 20
17 U
PDAT
E FO
R M
ICHI
GAN
SHIFTING TOWARDS THE “GIG ECONOMY”
NEW ECONOMY TERMSGig – also referred to as contract or freelance work – one-time project and compensation
Contingent – work arrangements without traditional employers or regular, full-time schedules
On-demand – also referred to as on-call – work with schedule variability according to customer activity
Shadow economy – also referred to as the grey or underground economy – unreported activity and income from the production of legal goods and services
The nature of work is changing dramatically in Michigan and across the country, and these changes impact ALICE workers disproportionately. The most significant change is that low-wage jobs, especially those in the service sector, are increasingly shifting away from traditional full-time employment with benefits towards part-time, on-demand, or contingent employment with fluctuating hours and few benefits. At the same time, workers are replacing or supplementing their traditional jobs with a new gig-to-gig, project-to-project work life. Freelance and contingent (on-call) labor has more than doubled its share of the national labor force over the last 20 years, from 7 percent in 1993 to 15 percent in 2015, and is expected to grow to nearly 20 percent by 2020.
These positions may help ALICE households who need to fill short-term gaps in standard employment, and may provide more lucrative opportunities than exist in the traditional employment market. Companies have also come to value the new hiring model since it provides flexibility to scale up or down on demand, and often can be cheaper than hiring a part-time or full-time employee on staff when considering health insurance and other benefits (Boudreau, 2015). The non-traditional nature of this work is not captured in the American Community Survey, which only asks about number of weeks and hours worked, not number of jobs or quality of relationships with the employers. In fact, the American Community Survey statistics show a decline in part-time work and self-employment (Figure 26), whereas recent national surveys focusing on changes in the labor market report an increase in part-time work and self-employment (U.S. Census Bureau, 2010, 2015; American Community Survey, 2007, 2010, 2012, and 2015; Fehr, 2017; Boudreau, 2015).
Figure 26�Work Status, Michigan, 2007 to 2015
41% 40% 42% 45%
36% 31% 30% 29%
23% 29% 28% 26%
6,656 6,470 6,457 6,414
0 1,000 2,000 3,000 4,000 5,000 6,000 7,000
2007 2010 2012 2015Popu
latio
n A
ged
16-6
4 Ye
ars
(in th
ousa
nds) Did not Work
Part-Time
Full-Time
Source: American Community Survey, 2007-2015.

36 UNIT
ED W
AY A
LICE
REP
ORT
– 20
17 U
PDAT
E FO
R M
ICHI
GAN
Likewise, declining unemployment rates do not account for the changing numbers of underemployed workers – defined as those who are employed part time (either in the traditional or gig economy), those who have accepted a lower income than they had in the past, or those who have stopped looking for work but would like to work. For example, Michigan’s unemployment rate was 7.2 percent in 2015, but the underemployment rate was 13.9 percent. In addition, those who reported not working may be engaged in non-traditional work and not captured in traditional reports (Bureau of Labor Statistics (BLS), 2015).
While information specific to Michigan was not available, two national surveys provide greater insight on the growing prevalence of alternative work arrangements in primary and supplementary jobs. Nationally, the percentage of workers employed as temporary help agency workers, on-call workers, contract workers, independent contractors, or freelancers as their main job rose from 10.1 percent in 2005 to 15.8 percent in 2015, according to the RAND-Princeton Contingent Worker Survey (RPCWS).
By a broader measure, one-third of all workers in the U.S. have had supplemental, temporary, or contract-based work in addition to their main job in the past 12 months, according to an independent survey by Freelancers Union and Elance-oDesk. These findings are supported by IRS data showing a steady increase in nonemployee compensation (1099 form), sole proprietorship businesses, and self-employment. Because low-wage jobs continue to dominate the employment landscape, income earned through alternative and supplemental employment is increasingly critical for many ALICE families (Abraham, Haltiwanger, Sandusky, & Spletzer, 2016; Katz & Krueger, 2016; Freelancers Union & Elance-oDesk; Wald, 2014).
The characteristics and experiences of non-traditional, contingent workers differ from those of standard, full-time workers in a number of ways. The U.S. Government Accountability Office’s report on the contingent workforce found that core contingent workers are less likely to have a high school degree and more likely to have low family income. They are more likely to experience job instability, have worker-safety issues, and feel less satisfied with their benefits and employment arrangements than standard full-time workers. In addition, contingent work tends to yield lower earnings with fewer benefits (such as retirement plans and health insurance), which results in greater reliance on public assistance (U.S. Government Accountability Office (U.S. GAO), 2015).
MICHIGAN’S ECONOMY AND LOCAL CONDITIONSIn addition to shifting labor market conditions, the financial stability of ALICE households depends on local conditions. The Economic Viability Dashboard is composed of three indices that evaluate the local economic conditions that matter most to ALICE households – the Housing Affordability Index, the Job Opportunities Index, and the Community Resources Index. Index scores range from 1 to 100, with higher scores reflecting better conditions. Each county’s score is relative to other counties in Michigan and compared to prior years. A score of 100 does not necessarily mean that conditions are very good; it means that they are better than scores in other counties in the state. These indices are used only for comparison within the state, not for comparison to other states.
The change in statewide Dashboard scores from 2007 to 2015 provides a picture of the Great Recession and emerging recovery in Michigan (Figure 27). Between 2007 and 2010, scores for housing affordability fell by 6 percent; job opportunities fell by 10 percent, and community resources rose by 1 percent. In the five years since the recession ended in 2010, housing affordability scores increased by 27 percent, and job opportunities rose by 19 percent, while community resources fluctuated with a net increase of 5 percent.

37UNIT
ED W
AY A
LICE
REP
ORT
– 20
17 U
PDAT
E FO
R M
ICHI
GAN
Figure 27�Economic Viability Dashboard, Michigan, 2007 to 2015
53 55 50 50 50 50 51 53
69 64
59 53 A
vera
ge In
dex
Scor
e
2007
2010
2012
2015
Housing Affordability Job Opportunities Community Resources
Source: American Community Survey; 2010 and 2015; Bureau of Labor Statistics (BLS), 2010 and 2015; U.S. Department of Housing and Urban Development (HUD), 2010 and 2015
The biggest change in the Economic Viability Dashboard was in the improvement in the Housing Affordability Index from 2010 to 2015, which includes measures on the affordable housing stock, housing burden, and real estate taxes. Most of the improvement occurred between 2012 and 2015, when Housing Affordability scores surpassed their 2007 levels. The statewide improvement masked varying conditions across the state. Housing Affordability scores improved from 2010 to 2015 in most counties; the higher scores shown in Figure 28 shifted these counties from darker blues (worse conditions) to lighter blues (better conditions). At the same time, affordability scores fell in five counties – Keweenaw, Mason, Ontonagon, Iron, and Mackinac counties (though the decrease didn’t always push the county into the darker shade of blue). See Exhibit V for all county scores.
The counties where housing affordability improved the most were concentrated in south eastern Michigan, with scores more than doubling in Genesee, Macomb, Kalamazoo, Oakland, Wayne, Isabella, Ingham, and Washtenaw counties.
In general, lower cost housing enables ALICE households to afford their budget, but the reasons housing becomes affordable are not always good for the community. In Michigan, one reason housing became more affordable was the housing crisis, which led to foreclosures. In 2015, Michigan had the second highest rate of foreclosures in the country (behind Florida), with the majority of foreclosures on the east side of the state. This has left many neighborhoods with empty and unkempt houses, bringing down the value for the whole community, yet making housing more affordable. Distressed sales, real-estate owned sales, and short sales have continued, accounting for 18.9 percent of sales in 2015, further depressing housing prices (Evans, 2016; CoreLogic, 2016; Boesel, 2016).
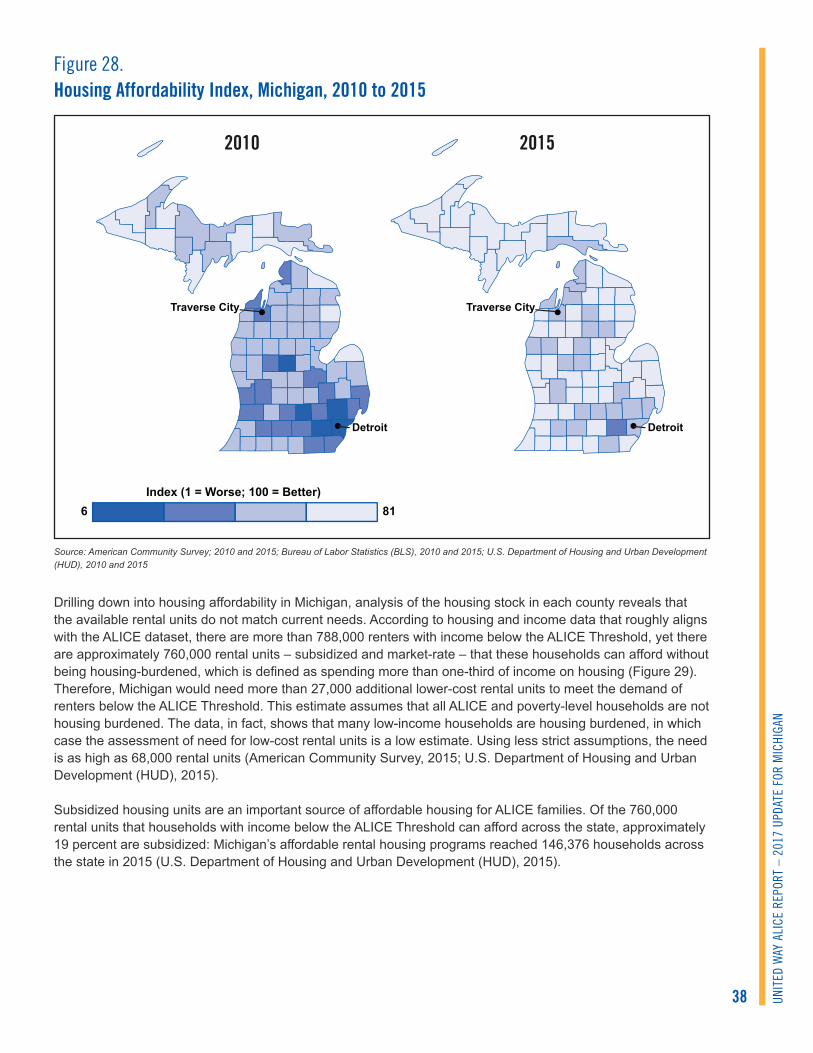
38 UNIT
ED W
AY A
LICE
REP
ORT
– 20
17 U
PDAT
E FO
R M
ICHI
GAN
Figure 28� Housing Affordability Index, Michigan, 2010 to 2015
Index (1 = Worse; 100 = Better)6 81
20152010
Detroit
Traverse City
Detroit
Traverse City
Source: American Community Survey; 2010 and 2015; Bureau of Labor Statistics (BLS), 2010 and 2015; U.S. Department of Housing and Urban Development (HUD), 2010 and 2015
Drilling down into housing affordability in Michigan, analysis of the housing stock in each county reveals that the available rental units do not match current needs. According to housing and income data that roughly aligns with the ALICE dataset, there are more than 788,000 renters with income below the ALICE Threshold, yet there are approximately 760,000 rental units – subsidized and market-rate – that these households can afford without being housing-burdened, which is defined as spending more than one-third of income on housing (Figure 29). Therefore, Michigan would need more than 27,000 additional lower-cost rental units to meet the demand of renters below the ALICE Threshold. This estimate assumes that all ALICE and poverty-level households are not housing burdened. The data, in fact, shows that many low-income households are housing burdened, in which case the assessment of need for low-cost rental units is a low estimate. Using less strict assumptions, the need is as high as 68,000 rental units (American Community Survey, 2015; U.S. Department of Housing and Urban Development (HUD), 2015).
Subsidized housing units are an important source of affordable housing for ALICE families. Of the 760,000 rental units that households with income below the ALICE Threshold can afford across the state, approximately 19 percent are subsidized: Michigan’s affordable rental housing programs reached 146,376 households across the state in 2015 (U.S. Department of Housing and Urban Development (HUD), 2015).

39UNIT
ED W
AY A
LICE
REP
ORT
– 20
17 U
PDAT
E FO
R M
ICHI
GAN
Figure 29� Renters Below the ALICE Threshold vs. Rental Stock, Michigan, 2015
788,818
0
200
400
600
800
1,000
1,200R
enta
l Uni
ts (i
n th
ousa
nds) 1.1 Million
The Gap Between Renters Below the ALICE Threshold and Affordable Units is 27,748
Renters BelowALICE Threshold
Rental Units
146,376-Subsidized
614,694-Market RateAffordable
379,034-All Other
Rental Units
Source: American Community Survey, 2015, HUD, 2015, and the ALICE Threshold, 2015
Job opportunities improved across Michigan since 2010, the end of the Recession. Genessee County had the greatest improvement, with scores increasing by 93 percent. Six additional counties, mostly within the southern central part of the state, had scores improve by more than 50 percent: Cheboygan, Gladwin, Grand Traverse, St. Clair, Iosco, and Jackson. Eleven other counties experienced some positive change in job opportunities: Baraga, Roscommon, Cass, Gogebic, Menominee, Schoolcraft, Luce, Ontonagon, Alcona, Missaukee, and Osceola. Although scores may have improved more dramatically in some parts of the state, these counties still have relatively low scores compared to the southern central part of the state, which has the best job opportunities (Figure 30).
Figure 30� Jobs Opportunities Index, Michigan, 2010 to 2015
Index (1 = Worse; 100 = Better)28 85
2010 2015
Detroit
Traverse City
Detroit
Traverse City
Source: American Community Survey; 2010 and 2015; Bureau of Labor Statistics (BLS), 2010 and 2015; U.S. Department of Housing and Urban Development (HUD), 2010 and 2015

40 UNIT
ED W
AY A
LICE
REP
ORT
– 20
17 U
PDAT
E FO
R M
ICHI
GAN
Improvement in Community Resources was driven primarily by the increased rate of those with health insurance. The spike in the index in 2012 was due to voting, which is an indicator of social capital, or how invested people are in their community. Voting was higher during the 2012 presidential election. See Exhibit V for county scores.
ECONOMIC VIABILITY DASHBOARDThe Housing Affordability Index
Key Indicators: Affordable Housing Gap + Housing Burden + Real Estate Taxes
The more affordable a county, the easier it is for a household to be financially stable. The three key indicators for the Housing Affordability Index are the affordable housing gap, the housing burden, and real estate taxes.
The Job Opportunities IndexKey Indicators: Income Distribution + Unemployment Rate + New Hire Wages
The more job opportunities there are in a county, the more likely a household is to be financially stable. The three key indicators for the Job Opportunities Index are income distribution as measured by the share of income for the lowest two quintiles, the unemployment rate, and the average wage for new hires.
The Community Resources IndexKey Indicators: Education Resources + Health Resources + Social Capital
Collective resources in a location can make a difference in the financial stability of ALICE households. The three key indicators for the Community Resources Index are the percent of 3- and 4-year-olds enrolled in preschool, health insurance coverage rate, and the percent of the adult population who voted.
Refer to the Methodology Exhibit for more information

41UNIT
ED W
AY A
LICE
REP
ORT
– 20
17 U
PDAT
E FO
R M
ICHI
GAN
CONCLUSION: WHAT CHALLENGES LIE AHEAD?While ALICE families differ in their composition, challenges, and level of need, there are three broad trends that will impact the conditions these households face in the next decade and their opportunities to change their financial status. These trends will also have significant implications for local communities and the state as a whole:
1. Population Changes – Migration and Aging Population
2. Jobs – Technology and Future Prospects
3. Education and Income Gap
POPULATION CHANGESMichigan has been depicted as one of the few states with negative population growth – a state that is aging and not appealing to young workers. This is only partly true. Although the state is aging, domestic migration has stabilized, and international migration has contributed to recent population growth. When the large waves of people coming into and moving out of the state are broken down by age group, the numbers tell a different story (Figure 31). Michigan is actually attracting large numbers of college students; though some return to their home states with their degrees, many stay in Michigan, become productive workers, and raise families. Some older Michigan residents leave their high-paying jobs for jobs in other states, some retire to states in warmer climates, but many stay and retire in Michigan. These population flows present both opportunities and challenges for ALICE (American Community Survey, 2007, 2010, 2012, and 2015; U.S. Census Bureau, 2010, 2015; Farley, 2010).
The largest movement of people into and out of Michigan in 2015 was by 20 to 24 year olds. Between 2014 and 2015, more than 44,400 people ages 18 to 24 moved to Michigan, including 11,371 high-school graduates going to college in Michigan. At the same time, 39,000 18- to 24-year-olds left the state, of which a quarter (10,642) were high-school graduates going to college in another state. Michigan has a dual challenge; attracting back the Michigan residents who leave the state for college and finding productive employment for the large number of youth who are not enrolled in college (National Center for Education Statistics (NCES), 2014; American Community Survey, 2015; U.S. Census Bureau, 2010, 2015).
The next largest movement of people was among those under 18 years old. More than 37,000 children and teens moved to Michigan in 2015; 26 percent came from outside the U.S. As minors, most came with their families, indicating inflows of 20-, 30-, and 40-somethings as well. Population movement slowed significantly for residents 40 years and older, but remained with a positive net inflow, except for the age group 65 years and older. Seniors are the only group to have a net outflow, 4,321 people.
Foreign migration (light blue portion of the bar in Figure 31) is a significant component of population inflows to Michigan, especially for the age groups under 40, including 29,648 foreign students in 2015.

42 UNIT
ED W
AY A
LICE
REP
ORT
– 20
17 U
PDAT
E FO
R M
ICHI
GAN
Figure 31�Population Inflows and Outflows, Michigan, 2015
9,029 5,399 4,881 5,907 1,494 2,401
(4,321)
(50,000)
(40,000)
(30,000)
(20,000)
(10,000)
0
10,000
20,000
30,000
40,000
50,000
Outflow Inflow - ForeignInflow - Domestic Net Migration
Under 18 18 to 24Years
Mid 20s 30s 40s Mid-Career Retired65+
Popu
latio
n
Source: American Community Survey, 2015
What Shifting Demographics Means for the CommunityWhen unemployment rates are low, a large college-age population is a potential engine for a state’s future economic growth. Michigan’s challenge is to have job opportunities and affordable living available to these young residents. Debt for unemployed or underemployed college graduates can cause them to remain below the ALICE Threshold. Michigan’s college loan default rate was 11.8 percent, just slightly higher than the national rate of 11.3 percent in 2013 (U.S. Department of Education, 2016).
The high cost of living combined with college debt has made it difficult for young workers in Michigan. This is reflected in the decline in the number of households headed by someone under 25 years old in Michigan, and in the high rate of poverty and ALICE among young people living alone. Recent graduates and young workers are choosing to move in with their parents or roommates, and delaying buying a home and starting a family on their own. With fewer young people choosing to strike out on their own, not only has the housing construction sector suffered, but there has also been a reduction in furniture and appliance manufacturing and other indirect effects for retail and utilities (Keely, van Ark, Levanon, & Burbank, 2012; American Community Survey, 2007, 2010, 2012, and 2015; U.S. Department of Education, 2016).
Foreign-born ResidentsInternational migration plays an increasing role in Michigan’s racial and ethnic composition. The foreign-born population represented 6.6 percent of the state total in 2015, up from 5.3 percent in 2000. The light blue portion of the inflow bars in Figure 31 represents the number of people moving to Michigan from outside the U.S. Almost 652,000 foreign-born residents live in Michigan. Following a decade old trend, immigration has been the key driver for several of Michigan’s largest metro areas. From 2000 to 2010, over half (54 percent) of the Lansing metro area’s population gain was attributable to immigration, according to the Chicago Council on Global Affairs. Similarly, immigration contributed to population gains in Ann Arbor (37 percent), Grand Rapids (23 percent), and Kalamazoo (14 percent) (American Immigration Council, 2015; Paral, 2014).

43UNIT
ED W
AY A
LICE
REP
ORT
– 20
17 U
PDAT
E FO
R M
ICHI
GAN
The largest group of immigrants, 17 percent, come from the Middle East (including Armenia, Azerbaijan, Bahrain, Cyprus, Georgia, Iraq, Israel, Jordan, Kuwait, Lebanon, Oman, Qatar, Saudi Arabia, Syria, Turkey, United Arab Emirates, and Yemen), followed by Mexico (13 percent), India (10 percent), and China and Canada (6 percent each). The proportion of Middle Eastern immigrants in the metro Detroit area is the largest in the U.S. (Migration Policy Institute, 2014; American Community Survey, 2015; Mack, 2015).
More than a half (52 percent) of Michigan’s foreign born residents have become citizens, 1.3 percent are undocumented, and 47 percent are legal permanent residents (Migration Policy Institute, 2014; American Community Survey, 2015; Pew Research Center, 2014).
Immigrants vary widely in language, education, age, and skills – as well as in their financial stability. Among adults ages 25 and older, 21 percent of Michigan’s foreign-born population has less than a high school education, compared to 8 percent of the native population. However, a much higher percentage of the foreign-born population has a graduate or professional degree (20 percent) compared to the native-born population (9 percent). As a result, there are many well-educated and financially successful immigrants in Michigan. Yet, there are also other immigrant families with distinct challenges that make them more likely to be unemployed or in struggling ALICE households. These challenges include low levels of education, minimal English proficiency, and lack of access to support services if their citizenship status is undocumented (American Community Survey, 2015; Aspen Institute, 2013).
As both workers and entrepreneurs, immigrants are an important source of economic growth in Michigan, making up 7.2 percent of the state’s workforce (349,138 workers) in 2013, according to the U.S. Census Bureau. Households led by immigrants in Michigan earned $19.6 billion in income in 2014 and paid $5.4 billion in taxes, including $1.5 billion in state and local taxes. Immigrants have been a driving force in entrepreneurship, job creation, strengthening the housing market and filling Michigan’s growing demand for jobs in the STEM (Science, Technology, Engineering, and Math) fields according to a recent report by the Governor’s Office (U.S. Census Bureau, 2013; Migration Policy Institute, 2014; Gardner, Johnson, & Wiehe, 2015; Perryman Group, 2008; U.S. Chamber of Commerce, 2013).
Recognizing the role undocumented workers play in Michigan, especially in the accommodation and food services industry, the Governor’s office reports that these workers take on labor-intensive roles in a range of industries that could not thrive without them (Michigan Office for New Americans, 2016).
Implications of Undocumented Workers for the CommunityNot only do immigrants run businesses and pay taxes, they facilitate growth in the economy. They contribute to a range of fields from engineering to science to the service sector and are more likely to start their own business. In addition, the availability of low-skilled immigrant workers, such as child care providers and housecleaners, has enabled higher-income American women to work more and to pursue careers while having children (Furman & Gray, 2012).
Though undocumented workers make up a small part of the overall immigrant population, their costs and benefits to Michigan’s economy are being hotly debated. On the one hand, they contribute to economic growth and the tax base. The Perryman Group estimates that if all undocumented immigrants were removed from the state, Michigan would lose millions in economic activity, approximately 58,000 jobs, and according to the Institute for Taxation and Economic Policy, millions in state and local taxes. According to the U.S. Chamber of Commerce, removing undocumented workers would not lead to the same number of job openings for unemployed Americans, because undocumented workers have a different set of skills that complement rather than replicate the U.S. workforce. Specifically, undocumented workers (as well as other immigrants) fill jobs that require physical strength and stamina in labor-intensive occupations such as building maintenance, landscaping, construction, food processing, food preparation, and food service (Perryman Group, 2008; U.S. Chamber of Commerce, 2013; Zavodny and Jacoby, 2013).

44 UNIT
ED W
AY A
LICE
REP
ORT
– 20
17 U
PDAT
E FO
R M
ICHI
GAN
On the other hand, undocumented workers use community resources, though they use a lot fewer resources than legal residents because they are often not eligible for assistance. In Michigan, state and local governments provide services for undocumented residents including schooling for K-12 children of undocumented residents and medical care (Gardner, Johnson, & Wiehe, April 2015; Martin & Ruark, 2010; National Academies of Sciences, Engineering, and Medicine, 2016).
Exacerbating this issues is the fact that foreign born, and especially undocumented, workers are often underpaid and are among the most likely to live in poverty and ALICE households. Often without access to any government safety net, they can be more likely to need emergency services in a crisis. There continues to be high demand for foreign born workers in Michigan, especially those who are bilingual. Both job opportunities and wages need to be sufficient in order to continue to attract these workers and prevent them from being ALICE (Pew Charitable Trusts, 2014; Camarota, 2015; Pereira, et al., 2012).
An Aging PopulationBy 2030, when all baby boomers are 65 or older, the senior share of the population is projected to increase in nearly every country in the world. Because this shift will likely lower labor force participation and reduce the amount of money people put towards savings, there are well-founded concerns about a potential slowing in future economic growth (Bloom, Canning, & Fink, 2011).
Michigan’s elderly population is projected to grow from 13 percent in 2010 to 19 percent by 2030, a 56 percent increase (Figure 32). Over the next 20 years, the elderly are the only age group expected to grow. The number of people under the age of 18 is predicted to fall by 2 percent and those aged 18 to 64 years will decrease by 6 percent (U.S. Census Bureau, 2005).
Figure 32�Population Projection, Michigan, 2010 to 2030
24% 23%
63% 58%
13% 19%
0
2,000
4,000
6,000
8,000
10,000
12,000
2010 Actual 2030 Projected
Popu
latio
n (in
thou
sand
s)
65 and Over
18-64 years
Under 18
Source: U.S. Census, 2005
As 2.7 million Michigan residents will age into retirement over the next 20 years, this demographic shift has implications for the financial stability of these households, as well as for the economic stability of the state. In Michigan, and nationally, these trends will likely produce increases in the number of ALICE households. Since the start of the Great Recession, retirement plan participation decreased for all families, and has continued to drop for families in the bottom half of the income distribution. For upper-middle income families, participation rebounded slightly from 2010 to 2015, but it did not return to 2007 levels (Bricker, et al., 2014).

45UNIT
ED W
AY A
LICE
REP
ORT
– 20
17 U
PDAT
E FO
R M
ICHI
GAN
Compared to the rest of the U.S., Michigan residents are doing well planning for retirement with 62 percent of workers participating in an employer-sponsored retirement plan, compared to the national average of 49 percent. Rates differ further within Michigan by metro area. Grand Rapids actually has the highest rate in the country, at 71 percent; while Detroit metro area is at 58 percent (Pew Charitable Trusts, 2016a and 2016b).
However, those on the brink of retirement are finding that they cannot afford to fully leave the workforce. Combined with the large numbers of the post-WWII baby boom generation, those aged 55 and over are expected to make up a larger share of the labor force, nationally, in the next decade. The over 55 age group has steadily increased its share of the labor force from 11.8 percent in 1992 to 14.3 percent in 2002 to 20.9 percent in 2012 and is projected to increase to 25.6 percent by 2022. In Michigan, 44 percent of the over 65 population was in the workforce in 2011 (Bricker, et al., 2014; AARP, 2012; Bureau of Labor Statistics (BLS), 2014).
Those working part-time fare less well, with only 32 percent of part-time workers in metro Detroit having access to a retirement plan, compared to 58 percent of full-time workers. However, those on the brink of retirement are finding that they cannot afford to fully leave the workforce. In the U.S. from 1990s to 2012, the share of the workforce composed of seniors increased from 16 percent to 23 percent, and data from multiple surveys suggests that at least half of people nearing 65 plan to continue working beyond retirement age (Bricker, et al., 2014; AARP, 2012; Pew Charitable Trusts, May 2016; He, Goodkind, & Kowal, 2016).
More of the ALICE seniors will be women because they are likely to live longer than their generation of men, and have fewer resources on which to draw. Generally, women have worked less and earned less than men, and therefore have lower or no pensions and lower Social Security retirement benefits. Since women tend to live longer than men, they are more likely to be single and depend on one income at older age. In Michigan in 2015, there were 20 percent more women 65 or older than men of the same age, but 50 percent more in poverty (Waid, 2013; Hounsell, 2008; American Community Survey, 2007, 2010, 2012, and 2015; Brown, Rhee, Saad-Lessler, & Oakley, March 2016).
Broader Consequences of an Aging PopulationThe aging of the population in Michigan presents new challenges. First, there will be greater pressure on the state’s infrastructure, especially the housing market for smaller, affordable rental units. These units need to be near family, health care, and other services. Likewise, transportation services need to be expanded for older adults who cannot drive, especially those in rural areas. Unless changes are made to Michigan’s housing stock, the current shortage will increase, pushing up prices for low-cost units and making it harder for ALICE households of all ages to find and afford basic housing. In addition, homeowners trying to downsize may have difficulty selling their homes at the prices they had estimated in better times, a source of income they were relying on to support their retirement plans (U.S. Department of Transportation, 2015). As a result of the financial hardships of home ownership for seniors, increasing numbers are actually living together, in rented and owned homes, to maintain independence while minimizing the economic burden (Abrahms, 2013).
The aging population will increase demand for geriatric health services, including assisted living and nursing facilities and home health care. Along with the traditional increase in physical health problems, low-income seniors in Michigan are more likely to face mental health issues. According to American’s Health Rankings, seniors in Michigan with income below $25,000 average 3.2 poor mental health days in the last month compared to 1.3 days for those with income above $75,000. Seniors reporting mental distress are also more likely to report poor or fair physical health (United Health Foundation, 2016; Substance Abuse and Mental Health Services Administration in partnership with the U.S. Administration on Aging, 2012).
Without sufficient savings, many families will not be able to afford the health care they need. A collaborative project of AARP, the Commonwealth Fund, and The Scan Foundation suggests that the state is ill-prepared. The Long-Term Services and Support Scorecard project ranks Michigan 31st among all states in its long-term support and services for older adults on a scale including affordability, access, and quality of life (Reinhard, et al., 2014).

46 UNIT
ED W
AY A
LICE
REP
ORT
– 20
17 U
PDAT
E FO
R M
ICHI
GAN
Shifting demographics also have implications for caring for the growing number of seniors. The Caregiver Support Ratio, the number of potential caregivers aged 45 to 64 for each person aged 80 and older, was 7 in 2010, and is projected to fall to 4.1 by 2030, and then to 3.3 in 2050. In fact, The Long-Term Services and Support Scorecard ranked Michigan 44th out of 50 in its support for family caregivers (Reinhard, et al., 2014; AARP Public Policy Institute, 2015; Redfoot, Feinberg, & Houser, 2013).
A number of additional consequences are emerging, ranging from job implications to elder abuse. With the increased demand for caregivers, there is a growing need for more paid health aides, who are themselves likely to be ALICE. Nursing assistants, one of the fastest growing jobs in Michigan, are paid $13.38 per hour, and require reliable transportation, which can consume a significant portion of the worker’s wage. Also in this area, home health aides and personal care assistants are jobs that do not require much training, are not well regulated, and yet involve substantial responsibility for the health of vulnerable clients. Together, these factors may lead to poor quality caregiving. There are significant downsides to poor quality caregiving, including abuse and neglect – physical, mental, and financial – an issue that is on the rise in Michigan and across the country (MetLife Mature Market Institute, June 2011; U.S. Bureau of Justice Statistics, 2015).
JOBS – TECHNOLOGY AND THE FUTUREMore than any other factor, jobs define ALICE. The outlook for new jobs shows that they will be dominated by low-wage jobs that will require no work experience and minimal education. According to the Bureau of Labor Statistics 2015 to 2024 job projections for Michigan, 63 percent of new jobs will pay less than $15 per hour, and only 7 percent will require any work experience. In terms of education, 49 percent of new jobs will not require a high school diploma, 34 percent will require only a high school diploma, while 9 percent will require an associate degree or post secondary non-degree award, and only 9 percent will require a bachelor’s degree (Figure 33) (Projections Central, 2016; Bureau of Labor Statistics (BLS), 2015; Bureau of Labor Statistics, 2016).
Figure 33�New Growth by Occupation, Michigan, 2015 to 2024
OCCUPATION 2015 EMPLOYMENT
ANNUAL NEW
GROWTH
HOURLY WAGE
EDUCATION OR TRAINING
WORK EXPERIENCE
Retail Salespersons 142,040 911 10.06 No formal educational credential None
Office Clerks 122,250 461 14.51 High school diploma or equivalent None
Team Assemblers 100,460 1,062 15.48 High school diploma or equivalent None
Combined Food Prep, Including Fast Food 98,640 1,642 8.99 No formal educational
credential None
Cashiers 93,680 1,155 9.24 No formal educational credential None
Registered Nurses 93,670 143 31.65 Bachelor’s degree None
Customer Service Representatives 86,710 1,162 14.94 High school diploma
or equivalent None
Waiters and Waitresses 74,560 942 9.08 No formal educational credential None
Janitors and Cleaners 67,400 283 11.21 No formal educational credential None

47UNIT
ED W
AY A
LICE
REP
ORT
– 20
17 U
PDAT
E FO
R M
ICHI
GAN
OCCUPATION 2015 EMPLOYMENT
ANNUAL NEW
GROWTH
HOURLY WAGE
EDUCATION OR TRAINING
WORK EXPERIENCE
Laborers and Movers, Hand 66,300 393 12.48 No formal educational
credential None
General and Operations Managers 62,420 542 44.78 Bachelor’s degree 5 years or more
Stock Clerks and Order Fillers 54,870 589 10.34 No formal educational
credential None
Sales Representatives 54,560 191 26.48 High school diploma or equivalent None
Heavy and Tractor-Trailer Truck Drivers 54,330 433 18.54 Postsecondary non-
degree award None
Secretaries and Admin Assistants 53,790 642 15.92 High school diploma
or equivalent None
Nursing Assistants 50,710 124 13.38 Postsecondary non-degree award None
Bookkeeping and Auditing Clerks 44,230 492 17.54 Some college, no
degree None
First-Line Supervisors of Retail Sales Workers 43,910 -313 23.68 High school diploma
or equivalent Less than 5 years
Maintenance and Repair Workers 42,680 221 16.71 High school diploma
or equivalent None
Mechanical Engineers 40,060 370 42.85 Bachelor’s degree None
Source: Michigan Department of Technology, Management, and Budget, 2016
Jobs and Technology Not only is Michigan’s tech sector growing in both the automotive industry and Michigan’s University Research Corridor, but Michigan is ranked among the most innovative locations outside of California in terms of employment and research and development (R&D) spending (Rosaen & Taylor, 2017; Michigan Economic Development Corporation (MEDC), 2016).
But due to technology, jobs across the state in all sectors are changing in ways that will likely have a large impact on the future of both low-wage and high-wage jobs. While technology has been changing jobs for centuries as businesses weigh the costs of capital versus wages, the latest wave comes as technology has

48 UNIT
ED W
AY A
LICE
REP
ORT
– 20
17 U
PDAT
E FO
R M
ICHI
GAN
decreased the costs of automation of manufacturing and many services. Wendy’s, for example, recently announced plans to replace front-line staff with computer kiosks. Figure 34 shows the likelihood that Michigan’s top 20 occupations will be replaced by technology over the next two decades. While some of the changes are likely to be positive and offer new opportunities, there are many new risks associated that will negatively impact ALICE workers (Frey & Osborne, September 2013; CBRE Research, 2015; Glazer & Grimes, 2015).
Figure 34� Employment by Occupation and Impact of Technology, Michigan, 2015
55%
92%
0%
10%
20%
30%
40%
50%
60%
70%
80%
90%
100%
0
20,000
40,000
60,000
80,000
100,000
120,000
140,000
160,000
Prob
abili
ty o
f Bei
ng R
epla
ced
by T
echn
olog
y
Num
ber o
f Job
s
Number of Jobs Probability of Being Replaced by Technology
Regi
ster
ed N
urse
s
Elem
enta
ry S
choo
l Tea
cher
sM
echa
nica
l Eng
inee
rs
Cust
omer
Ser
vice
Rep
rese
ntat
ives
Gene
ral O
pera
tions
Man
ager
sSt
ock
Cler
ks &
Ord
er F
iller
s
Mai
nten
ance
& R
epai
r Wor
kers
Sale
s Re
pres
enta
tives
Labo
rers
& M
over
s
Heav
y &
Trac
tor-T
raile
r Tru
ck D
river
s
Jani
tors
& C
lean
ers
Food
Pre
p, In
clud
ing
Fast
Foo
d
Reta
il Sa
lesp
erso
nsW
aite
rs &
Wai
tress
es
Team
Ass
embl
ers
Secr
etar
ies
& Ad
min
Ass
ista
nts
Offic
e Cl
erks
, Gen
eral
Book
keep
ing
& Au
ditin
g Cl
erks
Cash
iers
Source: Bureau of Labor Statistics (BLS), OES wages, 2015, and Frey and Osborne, 2013
New jobs: Technology has created new opportunities in types of jobs as well as the availability of jobs. Most commonly, technology is changing the scope of jobs. For example, at Ford’s Chicago Assembly Plant, operators used to spend 70 percent of their time scanning and 30 percent repairing defects. Now they spend 10 percent of their time scanning and 90 percent of their time finessing the final assembly of the vehicle. And in Detroit, as bank tellers are replaced with automatic tellers, employees are shifted to other tasks such as assisting customers with online transactions, and serving as a notary. Technology is also creating new services, and has ushered in a “gig” economy, creating new jobs such as TaskRabbit workers and Uber and Lyft drivers. Gig positions may help ALICE households fill short-term gaps in standard employment and may be more lucrative than jobs in the traditional employment market (Knight, 2012; Smith, 2016; Manyika, et al., 2016; Abdel-Razzaq, 2015).
Cost of changing jobs: When technology eliminates jobs, even if new jobs are created, there is disruption for those losing their jobs and they incur costs associated with unemployment, moving, and retraining. The cost of changing jobs will affect millions of U.S. workers, as more than 60 percent
49UNIT
ED W
AY A
LICE
REP
ORT
– 20
17 U
PDAT
E FO
R M
ICHI
GAN
of jobs have a higher than 50 percent chance of being replaced by technology by 2020. Low-wage workers, especially those with lower levels of education, are among those most at-risk of not benefiting from new technology-based jobs. For example, a hard-working cashier does not necessarily have the skills to repair digital checkout kiosks. The jobs that remain will be service jobs that cannot be automated and are often low paying, such as health aides, janitors, sales representatives, and movers (Brynjolfsson & McAfee, 2014; Frey & Osborne, September 2013).
Risks to job security: A contingent workforce provides flexibility for companies to scale up or down on demand, but it subjects workers to unexpected gains or losses in work hours, making it difficult for ALICE households to pay bills regularly or to make long-term financial plans, especially qualifying for a mortgage. In the gig economy, there are no benefits, such as health insurance and retirement plans. This increases costs to ALICE families and makes them more vulnerable should they have a health crisis or have to retire early. In addition, unpredictable wages can put employer or government benefits that are tied to work hours in jeopardy, including paid and unpaid time off, health insurance, unemployment insurance, public assistance, and work supports. For example, low-wage workers are 2.5 times more likely to be out of work than other workers, but only half as likely to receive unemployment benefits (Garfield, Damico, Stephens, & Rouhani, 2015; Watson, Frohlich, & Johnston, 2014; U.S. Government Accountability Office (U.S. GAO), 2007).
Fewer standard workplace protections: Independent contractors lack other standard workplace protections. Namely, they do not have recourse under the Fair Labor Standards Act (FLSA), which mandates that eligible workers be compensated for hours worked in excess of 40 per workweek, or the Family and Medical Leave Act (FMLA), which entitles eligible workers to unpaid, job-protected leave depending on their work history with a company. Without workforce protections, ALICE workers are vulnerable to exploitation, legal bills, and poor working conditions (Donovan, Bradley, & Shimabukuro, 2016).
The impact of technology on education: Technology – and increasingly affordable technology – will enable more online education options and could change the recent trajectory of poor returns on education. Colleges are embracing online courses for matriculated students and Massive Open Online Courses (MOOCs) for the wider community. These can lower the cost of education and enable many more avenues to gain and update skills. However, technology also makes it easier to create fraudulent educational organizations and to cheat unsuspecting students. For-profit colleges nationwide enroll about 11 percent of all higher education students but account for nearly 50 percent of all loan defaults. The U.S. Government Accountability Office (U.S. GAO) and several state attorneys general are investigating numerous fraudulent educational practices and money-making education schemes (State Attorneys General, 2014; U.S. Government Accountability Office (U.S. GAO), September 21, 2009; U.S. Government Accountability Office (U.S. GAO), October 7, 2010; U.S. Government Accountability Office (U.S. GAO), August 4, 2010; Cohen, 2015; Minnesota Attorney General’s Office, 2016; United States Senate Health, Education, Labor and Pensions Committee, July 30, 2012).
Wider economic impact: When those in the gig economy face limited incomes and reduced income growth, they depress overall consumption and investment, which lowers economic growth and reduces tax revenue. When these workers are not included in traditional labor force statistics, they represent a somewhat hidden group of workers who can reenter the formal workforce, causing a surplus of workers, which then depresses overall wages. Therefore, the expansion of the gig economy may have a slowing effect on the future growth of the overall economy (Senate Fiscal Agency, 2016).

50 UNIT
ED W
AY A
LICE
REP
ORT
– 20
17 U
PDAT
E FO
R M
ICHI
GAN
The future of Michigan’s jobs landscape depends on the state’s ability to shift from goods-producing industries, particularly auto manufacturing, which is experiencing long-term structural decline, to knowledge-based services that cannot be replaced by technology and require workers with a bachelor’s degree or more (Glazer & Grimes, 2015; Gautz, 2013).
EDUCATION AND INCOME GAPThere are many compounding factors to being ALICE or in poverty. Being a racial or ethnic minority, an undocumented or unskilled recent immigrant, or being language-isolated make a household more likely to be ALICE. Likewise, as discussed in the full United Way ALICE Report published in 2014 having a household headed by a female or transgender individual, having a low level of education, or living with a disability predispose a household to being ALICE. Groups with more than one of these factors – younger combat veterans or ex-offenders, for example, who may have both a disability and a low level of education – are even more likely to fall below the ALICE Threshold. While awareness of these challenges has increased, along with some economic recovery, these risk factors persist in Michigan, especially for Black and Hispanics.
The Education GapThe education gap among racial and ethnic groups persists in Michigan. Black students represent 17 percent of all students, but only 7 percent of the top 30 percent of students across all grades in reading and math. Hispanic students represent 6 percent of all students, but only 4 percent of the top 30 percent, while White students represent 71 percent of students and 81 percent of the top 30 percent in the 2012-2013 school year, according to the Michigan Department of Education (MDE). The achievement gap in education is larger for Black male students, especially in reading. Nationally, Michigan ranks in the bottom five states for Black students achieving proficient scores in 4th and 8th grade (Michigan Department of Education, 2014; U.S. Chamber of Commerce Foundation, 2015).
These differences impact graduation rates as well as college attendance and performance. Among teenagers, 65 percent of Black students, 69 percent of Hispanic students, and 66 percent of economically disadvantaged students in the state go on to college after high school, compared to 83 percent of White students. However, once in college, Black and Hispanic students were more likely to need remediation and had lower grade point averages than White students (NCES, 2015; U.S. Chamber of Commerce Foundation, 2015).
Income Trends among Ethnic and Racial GroupsThe differences between racial and ethnic groups are also apparent in earnings and employment. All groups (except Asians) experienced a decline in earnings during the Great Recession, as noted in the drop from 2007 to 2010 in Figure 35. Since 2010, White workers have rebounded and are earning 10 percent above their 2007 level. Hispanics are earning 16 percent more, and Asians are earning 11 percent more. But Black workers have not recouped their pre-Recession earning level, and in fact are earning 7 percent less (American Community Survey, 2007, 2010, 2012, and 2015).
Differences in the median earnings between White and Hispanic workers have decreased from 48 percent in 2007 to 40 percent in 2015, while differences between White and Black workers have increased from 23 percent in 2007 to 45 percent in 2015 (American Community Survey, 2007, 2010, 2012, and 2015).
In addition to having lower earnings, Black and Hispanic households have substantially less wealth than White households, a gap that has been widening in recent years. Nationally (wealth data is not available at the state level), the median wealth of White households was 13 times the median wealth of Black households in 2013, compared with eight times the wealth in 2010, according to the Pew Research Center (Kochhar & Fry, 2014).

51UNIT
ED W
AY A
LICE
REP
ORT
– 20
17 U
PDAT
E FO
R M
ICHI
GAN
Figure 35� Median Earnings Asian, Black, Hispanic, and White Workers, Michigan, 2007 to 2015
$0
$5,000
$10,000
$15,000
$20,000
$25,000
$30,000
$35,000
$40,000
$45,000
Asian Black Hispanic White
Med
ian
Ann
ual E
arni
ngs
2007
2010
2012
2015
Source: American Community Survey, 2007-2015
Black and Hispanic workers also face higher rates of unemployment in Michigan. Though all groups faced higher rates of unemployment through the Great Recession, Blacks had the highest rate of unemployment than any group between 2007 and 2015, and only recovered to their 2007 levels in 2015. The unemployment rate increased more for Blacks and Hispanics and has recovered at a slower rate than for Whites. By 2015, the unemployment rate for Whites was 6 percent compared to 8 percent in 2007. The Hispanic unemployment rate is a third higher than that of Whites at 9 percent, and the unemployment rate for Blacks was nearly triple that of Whites at 17 percent in 2015 (Figure 36).
Figure 36�Unemployment for Asian, White, Hispanic, and Black Workers, Michigan, 2007 to 2015
5%
9% 7%
6% 8%
13%
9%
6%
14%
17%
14%
9%
19%
28%
23%
17%
0%
5%
10%
15%
20%
25%
30%
2007 2010 2012 2015
Perc
ent U
nem
ploy
ed
White
Asian
Hispanic
Black
Source: American Community Survey, 2007-2015

52 UNIT
ED W
AY A
LICE
REP
ORT
– 20
17 U
PDAT
E FO
R M
ICHI
GAN
Implications for the CommunityThe importance of high-quality child care and public education remains a fundamental American value, but ALICE households are challenged to find quality, affordable education at all levels in Michigan. With inadequate educational opportunities, the state economy loses talent and suffers from lower productivity from less-skilled workers. In order for Michigan’s economy to continue to grow and sustain an aging population, the state must also then continue to attract workers from other states and abroad. An education system that works for all residents would be an important draw.
Education is also important for communities; people with lower levels of education are often less engaged in their communities and less able to improve conditions for their families. More than half of those without a high school diploma report not understanding political issues, while 89 percent of those with a bachelor’s degree have at least some understanding of political issues. Similarly, having a college degree significantly increases the likelihood of volunteering, even controlling for other demographic characteristics (Baum, Ma, & Payea, 2013; Campbell, 2006; Mitra, 2011).
Ultimately, basic secondary education remains essential for any job. According to the Alliance for Excellent Education, if all students graduated from high school in Michigan, their aggregate increased annual income would be $43 million, and annual crime-related savings would be would be $695 million (Alliance for Excellent Education (AEE), 2013).
What Will it Take to Meet the Challenges Ahead?There is a basic belief in America that if you work hard, you can support your family. Yet, the data presented in this Report shows that this is not the case for hundreds of thousands of hard-working families in Michigan. The Report also debunks the assumptions and stereotypes that those who cannot support their families are primarily people of color, live in urban areas, are unemployed, or in extreme cases are thought to be simply lazy or have some sort of moral failing.
Why is there a mismatch between stereotypes and the facts? First, there has been a lack of awareness. Before the United Way ALICE Reports, 1.53 million struggling households in Michigan had not been fully named and counted. Second, the situation has developed over decades and barriers are embedded in many parts of our economy and communities.
Solutions require addressing the layers of obstacles outlined in this Report that prevent ALICE families from achieving financial stability: An economy heavily dependent on low-wage jobs, fast-changing job landscape, institutional bias against populations of color, changing demographics, increasing cost of household basics, and even the increasing occurrence of natural disasters.
What Will it Take to Overcome These Barriers?The most common approaches to overcoming these barriers are short-term efforts that help an ALICE family weather an emergency. Temporary housing, child care assistance, meals, rides to work, and caregiving for ill or elderly relatives help ALICE recover from the loss of housing, a lack of food, an accident, or illness. These approaches can be crucial to preventing an ALICE household from falling into poverty or becoming homeless. But, these short-term relief efforts are not designed to move households to long-term financial stability.
The issues affecting ALICE are complex and solutions are difficult. Real change requires identifying where barriers exist and understanding how they are connected. Only then can stakeholders begin to envision bold ideas and take the steps necessary to remove barriers so that ALICE families can thrive. The following solutions need to be a part of the dialogue when addressing the financial stability of Michigan residents.
53UNIT
ED W
AY A
LICE
REP
ORT
– 20
17 U
PDAT
E FO
R M
ICHI
GAN
Decrease the cost of household basics: The cost of basic household necessities in Michigan has increased faster than the national rate of inflation – and wages of most jobs – leaving ALICE households further behind than a decade ago. Large-scale economic and social changes that could significantly reduce basic household costs over time include a larger supply of affordable housing (market-rate or subsidized), public preschool, accessible and affordable health care, and more public transportation (Collins & Gjertson, 2013; Consumer and Community Development Research Section of the Federal Reserve Board’s Division of Consumer and Community Affairs (DCCA), 2015; Lusardi, Schneider, & Tufano, 2011; Allard, Danziger, & Wathe, 2012).
Improve job opportunities: The seemingly simple solution – to increase the wages of current low-paying jobs – has complex consequences. The increased cost of doing business is either passed on to the consumer, who in many cases is ALICE, or absorbed by the business, resulting in fewer resources to invest in growth, or in some cases in a reduction in staff. However, if ALICE families have more income, they can spend more and utilize less assistance. Increased consumer activity provides benefits to businesses that can offset increased costs in production (Knowledge@Wharton, 2013; Congressional Budget Office, 2014; Wolfson, 2014).
Another option is to focus on restructuring the Michigan economy towards more medium- and high-skilled jobs in both the public and private sectors, an enormous undertaking involving a wide range of stakeholders. But as technology increasingly replaces many low-wage jobs, this will be even more important for Michigan. Such a shift would require an influx of new businesses and new industries, increased education and training for workers, and policies for labor migration to ensure skill needs are met (Luis, 2009; Frey & Osborne, September 2013).
Adjust to fast-paced job change: New gig-focused job opportunities help many ALICE households fill short-term gaps in standard employment and some provide more lucrative opportunities than exist in the traditional employment market. While part-time and contract work has been part of the Michigan economy for decades, these jobs are growing rapidly, pushing economists and policymakers into uncharted territory. With the shift to contract work, the burden of economic risk is increasingly shifted to workers, including retraining and securing benefits such as health insurance and disability insurance. Since any period of unemployment is a financial hardship for ALICE families, new safety measures that keep workers from sliding into financial distress during periods of transition will be needed (Friedman, 2016; Donovan, Bradley, & Shimabukuro, 2016; Watson, Frohlich, & Johnston, 2014).
Accommodate changing demographics: Based on forecasted economic and demographic changes, particularly the increasing number of seniors and immigrants, it is foreseeable that significantly more households will need smaller, lower-cost housing over the next two decades. In addition, these groups prefer housing that is close to transportation and community services. The changing structure of households, including the decline in the number of married parents with children and the increase in single male-parent families, will impact child care and schools as well as neighborhoods (sidewalks and playgrounds) and consumer goods (United Health Foundation, 2016; Stilwell, 2015).
The economics of building, especially in rural areas, and current zoning laws, especially in urban areas, in Michigan limit the building of new, small, or low-cost housing units in most of the remaining open areas in Michigan. To meet the needs of seniors, and preferences of millennials and immigrants, the zoning laws will need to be changed to allow for townhouses and multifamily units in location-efficient areas (close to job centers and public amenities). These groups also prefer energy-efficient homes with lower running and maintenance costs. However, such changes impact developers and existing homeowners, making this a complex undertaking (Joint Center for Housing Studies, 2013; The White House, 2016; Prevost, 2013; Michigan Association of Planning, 2007; Ireland, 2016).
Address institutional bias: While attitudes about race and ethnicity have improved over the last few decades, there is a deeper cause for the sharp economic racial disparities. Recent reports have found that the gaps in education, income, and wealth that now exist along racial lines in the U.S. have little to

54 UNIT
ED W
AY A
LICE
REP
ORT
– 20
17 U
PDAT
E FO
R M
ICHI
GAN
do with individual behaviors. Instead, these gaps reflect policies and institutional practices that create different opportunities for Whites, Blacks, and Hispanics. To make a difference for ALICE families that are Black, Hispanic, or another disadvantaged group, changes need to be made within the institutions that impede equity in the legal system, health care, housing, education, and jobs (Mishel, Bivens, Gould, & Shierholz, 2012; Shapiro, Meschede, & Osoro, 2013; Oliver & Shapiro, 2006; Cramer, 2012; Leadership Conference on Civil Rights, 2000; Agency for Healthcare Research and Quality (AHRQ), 2015; Goldrick-Rab, Kelchen, & Houle, 2014; Sum & Khatiwada, 2010) .
Prepare for natural disasters: For the most part, Michigan is less susceptible to natural disasters than coastal states. But there are still extreme winter storms and cold, flooding along lake and river shores, and occasionally tornados, wild fires, and extreme heat. However, the case of lead pipes in Flint serves as an example of how low-income communities can be vulnerable to man-made disasters (Michigan Prepares, 2016; Ankenbrand, 2016).
Natural disasters have a disproportionate impact on low-income families. With no savings to cover even minor damage to their homes or cars, many households have no way to pay for these additional expenses. With a tight budget, most ALICE households cannot afford insurance or even preventative maintenance. As a result, they cannot repair even minor damage to homes and property, or afford dislocation. These natural disasters can also lead to increased mental health issues (Cooley, Eli Moore, & Allen, 2012; Deryugina, Kawano, & Levitt, 2013; Michigan Legal Aid, 2016).
However, because of the demand for more housing, areas have been developed that are vulnerable to flooding and wild fires. The housing that ALICE households can afford is often less expensive because it is located in vulnerable or remote areas, or because the infrastructure is minimal, aging or both (U.S. Global Change Research Program, 2014; Flint Water Advisory Task Force, 2016; School of Public Health, University of Michigan, 2012).
Ultimately, if ALICE households were financially stable, Michigan’s economy would be stronger and communities would be more vibrant. It will not be easy to bring about positive change for ALICE and all families. To do so, Michigan stakeholders – family, friends, nonprofits, and the government – will need to work together with innovation and vision, and be willing to change the structure of the local and national economy and even the fabric of their communities.

55UNIT
ED W
AY A
LICE
REP
ORT
– 20
17 U
PDAT
E FO
R M
ICHI
GAN
BIBLIOGRAPHYAARP. (2012). AARP Workforce Profiles: Michigan. Retrieved from http://www.aarp.org/content/dam/aarp/research/surveys_statistics/general/2013/workforceprofiles/AARP%20Workforce%20Profile%20-%20Michigan.pdf
AARP Public Policy Institute. (2015, June). Caregiving in the U.S. 2015. National Alliance for Caregiving. Retrieved from http://www.caregiving.org/wp-content/uploads/2015/05/2015_CaregivingintheUS_Final-Report-June-4_WEB.pdf
Abdel-Razzaq, L. (2015). Banks Redefine Role of Teller in Move Toward Technology. The Detroit News. Retrieved from http://www.detroitnews.com/story/business/2015/02/27/technology-changing-bank-teller-role/24156071/
Abraham, K., Haltiwanger, J., Sandusky, K., & Spletzer, J. (2016, May ). Measuring the Gig Economy. Society of Labor Economists. Retrieved from http://www.sole-jole.org/16375.pdf
Abrahms, S. (2013, May 31). House Sharing for Boomer Women Who Would Rather Not Live Alone. AARP Bulletin. Retrieved from http://www.aarp.org/home-family/your-home/info-05-2013/ older-women-roommates-house-sharing.html
Agency for Healthcare Research and Quality (AHRQ). (2015, May). 2014 National Healthcare Quality and Disparities Report. AHRQ Pub. No. 15-0007. Retrieved from https://www.ahrq.gov/research/findings/nhqrdr/nhqdr14/index.html
Allard, S. W., Danziger, S., & Wathe, M. (2012). Policy Brief. National Poverty Center. Retrieved from http://www.npc.umich.edu/publications/policy_briefs/brief31/PolicyBrief31.pdf
Alliance for Excellent Education (AEE). (2013, September). Saving Futures, Saving Dollars: The Impact of Education on Crime Reduction and Earnings. Retrieved from http://all4ed.org/wp-content/uploads/2013/09/SavingFutures.pdf
American Community Survey. (2007, 2010, 2012, and 2015). 2007, 2010, 2012, and 2014; 1-, 3-, and 5-Year Estimates. Retrieved from U.S. Census Bureau: http://factfinder2.census.gov/faces/nav/jsf/pages/searchresults.xhtml?refresh=t
American Community Survey. (2015). 2014; 1-, and 3-, and 5-Year Estimates. Retrieved from U.S. Census Bureau: http://factfinder2.census.gov/faces/nav/jsf/ pages/searchresults.xhtml?refresh=t
American Immigration Council. (2015). New Americans in Michigan. Retrieved from https://www.americanimmigrationcouncil.org/research/new-americans-michigan
Ankenbrand, A. (2016). Top 5 Reasons Why Michigan is a Good Disaster Recovery Location. Retrieved from http://resource.onlinetech.com/top-5-reasons-why- michigan-is-a-good-disaster-recovery-location/
Aspen Institute. (2013). Experiences Of Immigrant Workers: Challenges, Opportunities, And The Future Of Our Economy. Retrieved from http://www.aspenwsi.org/resource/immigrant-workers/
Ayanian, J. Z., Ehrlich, G. M., Grimes, D. R., & Levy, H. (2017). Economic Effects of Medicaid Expansion in Michigan. New England Journal of Medicine. Retrieved from http://www.nejm.org/doi/full/10.1056/NEJMp1613981#t=article
Baum, S., Ma, J., & Payea, K. (2013). Education Pays: The Benefits of Higher Education for Individuals and Society. Retrieved from https://trends.collegeboard.org/sites/default/files/ education-pays-2013-full-report.pdf
Ben-Shalom, Y., Moffitt, R., & Scholz, J. (2012). An Assessment of the Effectiveness of Anti-Poverty Programs in the United States. (Chapter 22). Retrieved from http://www.irp.wisc.edu/publications/dps/pdfs/dp139211.pdf
Bloom, D., Canning, D., & Fink, G. (2011, January). Implications of Population Aging for Economic Growth. (P. o. Aging, Ed.) (Working Paper No. 64). Retrieved from http://www.hsph.harvard.edu/program-on-the-global-demography-of-aging/WorkingPapers/2011/PGDA_WP_64.pdf
Boesel, M. (2016). Distressed Sales Update: June 2016. Retrieved from http://www.corelogic.com/blog/authors/molly-boesel/2016/09/distressed-sales-update-june-2016.aspx#.WKNrHlUrKUk
Boudreau, J. (2015). We Need to Move Beyond the Employee vs. Contractor Debate. Harvard Business Review. Retrieved from https://hbr.org/2015/07/we-need-to-move-beyond-the-employee-vs-contractor-debate
Bricker, J., Dettling, L., Henriques, A., Hsu, J., Moore, K., Sabelhaus, J., & Windle, R. (2014, September). Changes in U.S. Family Finances from 2010 to 2013: Evidence from the Survey of Consumer Finances. Federal Reserve Bulletin, 100(4). Retrieved from http://www.federalreserve.gov/pubs/bulletin/2014/pdf/scf14.pdf
Brookings. (2016). Earned Income Tax Credit (EITC) Interactive. Retrieved from https://www.brookings.edu/interactives/earned-income-tax-credit-eitc-interactive-and-resources/?keyword=CHARACTERISTICS%20OF%20EITC-ELIGIBLE%20TAX%20UNITS%20IN%202014
Brown, J., Rhee, N., Saad-Lessler, J., & Oakley, D. (March 2016). Shortchanged in Retirement: Continuing Challenges to Women’s Financial Future. National Institute on Retirement Security. Retrieved from http://www.nirsonline.org/storage/nirs/documents/Shortchanged/final_shortchanged_retirement_report_2016.pdf
Brynjolfsson, E., & McAfee, A. (2014). The Second Machine Age: Work, Progress, and Prosperity in a Time of Brilliant Technologies (First Edition ed.). Retrieved from http://www.amazon.com/The-Second-Machine-Age-Technologies/dp/0393239357
Bureau of Economic Analysis. (2015). Annual Gross Domestic Product (GDP) by State. Retrieved from https://www.bea.gov/iTable/iTable.cfm?reqid=70&step=1&isuri =1&acrdn=2#reqid=70&step=1&isuri=1&7003=200&7035=-1&7004=naics&7005=-1&7006=19000&7036=-1&7001=1200& 7002=1&7090=70&7007=2014&7093=levels
Bureau of Labor Statistics (BLS). (2007 and 2015). Occupational Employment Statistics (OES) Survey. U.S. Department of Labor. Retrieved from http://www.bls.gov/oes/
Bureau of Labor Statistics (BLS). (2015). Alternative Measures of Labor Underutilization for States, 2015 Annual Averages. Retrieved from Local Area Unemployment Statistics, U.S. Department of Labor: http://www.bls.gov/lau/stalt14q4.htm

56 UNIT
ED W
AY A
LICE
REP
ORT
– 20
17 U
PDAT
E FO
R M
ICHI
GAN
Bureau of Labor Statistics (BLS). (2015). QCEW State and County Map. Retrieved from BLS Beta Labs, U.S. Department of Labor: http://beta.bls.gov/maps/cew/us
Bureau of Labor Statistics (BLS). (2015). States: Employment status of the civilian noninstitutional population, 1976 to 2015 annual averages. Retrieved from U.S. Department of Labor: http://www.bls.gov/lau/staadata.txt
Bureau of Labor Statistics. (2016). Occupational employment, job openings and worker characteristics. Retrieved from http://www.bls.gov/emp/ep_table_107.htm
Camarota, S. A. (2015). Welfare Use by Legal and Illegal Immigrant Households. Retrieved from http://cis.org/Welfare-Use-Legal-Illegal-Immigrant-Households
Campbell, D. (2006). What is Education’s Impact on Civic and Social Engagement?” Measuring the Effects of Education on Health and Civic Engagement. Retrieved from http://www.oecd.org/edu/innovation-education/37425694.pdf
CBRE Research. (2015). Tech Thirty, 2015. Retrieved from http://www.cbre.us/research/2015-US-Reports/ Pages/Tech-Thirty-2015.aspx
Center for Responsible Lending. (2014). The State of Lending in America and Its Impact on U.S. Households. Retrieved from http://www.responsiblelending.org/state-of-lending/ reports/SOL-full-5-12-14.pdf
Centers for Medicare & Medicaid Services (CMS). (2016). Retrieved from https://www.medicare.gov/what-medicare-covers/not-covered/item-and-services-not-covered-by-part-a-and-b.html
Centers for Medicare & Medicaid Services (CMS). (2016). Retrieved from https://www.cms.gov/Newsroom/MediaReleaseDatabase/ Fact-sheets/2016-Fact-sheets-items/2016-06-30.html
Chetty, R., & Hendren, N. (2015, April). The Impacts of Neighborhoods on Intergenerational Mobility: Childhood Exposure Effects and County-Level Estimates . (T. E. Project, Ed.) Retrieved from http://www.equality-of-opportunity.org/images/nbhds_exec_summary.pdf
Cohen, P. (2015, October). For-Profit Colleges Accused of Fraud Still Receive U.S. Funds. The New York Times. Retrieved from http://www.nytimes.com/2015/10/13/business/for-profit-colleges-accused-of-fraud-still-receive-us-funds.html?_r=0
Coleman-Jensen, A., Rabbitt, M. P., Gregory, C., & Singh, A. (September 2015). Household Food Security in the United States in 2014. Economic Research Report Number 194, United States Department of Agriculture (USDA). Retrieved from https://www.ers.usda.gov/webdocs/publications/err194/53740_err194.pdf
Collins, M., & Gjertson, L. (2013). Emergency savings for low-income consumers. Focus, 12. Retrieved from http://www.irp.wisc.edu/publications/focus/pdfs/foc301.pdf
Congressional Budget Office. (2014). The Effects of a Minimum-Wage Increase on Employment and Family Income. Retrieved from https://www.cbo.gov/publication/44995
Consumer and Community Development Research Section of the Federal Reserve Board’s Division of Consumer and Community Affairs (DCCA). (2015). Report on the Economic Well-Being of U.S. Households in 2014. Retrieved from https://www.federalreserve.gov/econresdata/2014-report-economic-well-being-us-households-201505.pdf
Cooley, H., Eli Moore, M. H., & Allen, L. (2012). Social Vulnerability to Climate Change in California. California Energy Commission’s California Climate Change Center. Retrieved from http://www.energy.ca.gov/2012publications/ CEC-500-2012-013/CEC-500-2012-013.pdf
CoreLogic. (2016). CoreLogic Reports 38,000 Completed Foreclosures in May 2016. Retrieved from http://www.corelogic.com/about-us/news/corelogic-reports- 38,000-completed-foreclosures-in-may-2016.aspx
Corporation for Enterprise Development (CFED). (2012). Asset and Opportunity Scorecard, 2012. Retrieved from http://assetsandopportunity.org/scorecard/state_data/
Cramer, R. (2012, December 13). Trends in Savings, Debt, and Net Worth: Testimony to FDIC Advisory Committee on Economic Inclusion (ComE-IN). Retrieved from https://static.newamerica.org/attachments/8991-fdic-is-focusing-on-saving-and-financial-inclusion/CramerFDIC1.3 13 a91df04065274d9f8e5c50910114f0c0.pdf
Deryugina, T., Kawano, L., & Levitt, S. (2013). The Economic Impact of Hurricane Katrina on its Victims: Evidence from Individual Tax Returns. American Economic Association. Retrieved from http://www.nber.org/papers/w20713
Donovan, S., Bradley, D., & Shimabukuro, J. (2016). What Does the Gig Economy Mean for Workers? Congressional Research Service. Retrieved from https://www.fas.org/sgp/crs/misc/R44365.pdf
Dowd, T., & Horowitz, J. (2011, September). Income Mobility and the Earned Income Tax Credit: Short-Term Safety Net or Long-Term Income Support . Public Finance Review. Retrieved from https://cms.bsu.edu/-/media/WWW/DepartmentalContent/MillerCollegeofBusiness/Econ/research/FacultyPapers/horowitz2011pfr.pdf
Economic Policy Institute. (2015). Family Budget Calculator. Retrieved May 22, 2014, from http://www.epi.org/resources/budget/
Education Equality Index. (n.d.). Retrieved June 23, 2016, from http://www.educationequalityindex.org/data/#
Education Equality Index. (2016). Education Equality in America: Comparing the Achievement Gap Across Schools and Cities, http://www.educationequalityindex.org/wp-content/uploads/2016/02/Education-Equality-in-America-v12.pdf
Evans, P. (2016). Reports show state’s housing crisis isn’t over. Retrieved from http://www.grbj.com/articles/ 84405-reports-show-states-housing-crisis-isnt-over
Farley, R. (2010). Michigan’s Demographic Outlook: Implications for the University of Michigan. Retrieved from http://www.psc.isr.umich.edu/pubs/pdf/rr10-699.pdf
Federal Reserve. (2014, July). Report on the Economic Well-Being of U.S. Households in 2013. Board of Governors of the Federal Reserve System. Retrieved from http://www.federalreserve.gov/econresdata/2013-report-economic-well-being-us-households-201407.pdf
Federal Reserve Bank of St. Louis. (2016). Homeownership Rate for Michigan. Retrieved from Economic Research: https://fred.stlouisfed.org/series/MIHOWN

57UNIT
ED W
AY A
LICE
REP
ORT
– 20
17 U
PDAT
E FO
R M
ICHI
GAN
Feeding America. (2014, August). Hunger in America 2014: National Report. Retrieved from http://help.feedingamerica.org/HungerInAmerica/hunger-in-america-2014-full-report.pdf?s_src=W159ORGSC&s_referrer=google&s_subsrc=http%3A%2F%2Fwww.feedingamerica.org%2Fhunger-inameric
Fehr, J. (2017). Why Hire Temporary and Contract Workers. Retrieved from http://www.thehartford.com/business-playbook/in-depth/benefits-temporary-contract-employees
FINRA Investor Education Foundation. (2016). Michigan Survey Data, 2015. Retrieved from National Financial Capbility Study: http://www.usfinancialcapability.org
Flint Water Advisory Task Force. (2016). Retrieved from https://www.michigan.gov/documents/snyder/ FWATF_FINAL_REPORT_21March2016_517805_7.pdf
Freelancers Union & Elance-oDesk. (n.d.). Freelancing in America: A National Survey of the New Workforce. Retrieved July 15, 2016, from https://fu-web-storage-prod.s3.amazonaws.com/content/filer_public/7c/45/7c457488-0740-4bc4-ae45-0aa60daac531/freelancinginamerica_report.pdf
Frey, C., & Osborne, M. (September 2013). The Future of Employment: How Susceptible Are Jobs To Computerisation? Oxford Martin School, University of Oxford. Retrieved from http://www.oxfordmartin.ox.ac.uk/downloads/academic/ The_Future_of_Employment.pdf
Friedman, T. (2016). Thank You for Being Late: An Optimist’s Guide to Thriving in the Age of Accelerations. Retrieved from http://us.macmillan.com/thankyouforbeinglate/thomaslfriedman
Fulton, G. A. (2016). Research Seminar in Quantitative Economics. Retrieved from http://www.rsqe.econ.lsa.umich.edu/ Docs/RSQE-MI-ForecastHighlights(2016.11).pdf#zoom=100
Furman, J., & Gray, D. (2012, July 12). Ten Ways Immigrants Help Build and Strengthen Our Economy . Retrieved from https://www.whitehouse.gov/blog/2012/07/12/ten-ways-immigrants-help-build-and-strengthen-our-economy
Gardner, M., Johnson, S., & Wiehe, M. (April 2015). Undocumented Immigrants’ State & Local Tax Contributions. Institute on Taxation & Economic Policy. Retrieved from http://www.itep.org/pdf/undocumentedtaxes2015.pdf
Garfield, R., Damico, A., Stephens, J., & Rouhani, S. (2015, April 17). The Coverage Gap: Uninsured Poor Adults in States that Do Not Expand Medicaid – An Update. Retrieved January 21, 2016, from http://kff.org/health-reform/issue-brief/the-coverage-gap-uninsured-poor-adults-in-states-that-do-not-expand-medicaid-an-update/
Gautz, C. (2013). Report: Michigan’s Future will Rely Less on Auto Factory Employment, More on Knowledge-based Service Sector. Crain’s Detroit Business. Retrieved from http://www.crainsdetroit.com/article/20131108/NEWS/131109842/report-michigans-future-will-rely-less-on-auto-factory-employment
Glasmeier, A., & Nadeau, C. (2015). Living Wage Calculator User’s Guide/Technical Notes, 2015 Update. Massachusetts Institute of Technology (MIT). Retrieved from http://livingwage.mit.edu/resources/Living-Wage-User-Guide-and-Technical-Notes-2015.pdf
Glazer, L., & Grimes, D. (2015). Michigan’s Transition to a Knowledge-Based Economy, 2007-2014. Retrieved from http://michiganfuture.org/cms/assets/uploads/ 2015/11/Michigan-Future_2015-Report.pdf
Goldrick-Rab, S., Kelchen, R., & Houle, J. (2014, September 2). The Color of Student Debt: Implications of Federal Loan Program Reforms for Black Students and Historically Black Colleges and Universities. (W. H. Lab, Ed.) Retrieved from https://news.education.wisc.edu/docs/WebDispenser/news-connections-pdf/thecolorofstudentdebt-draft.pdf?sfvrsn=4
Greater Farmington Area Chamber of Commerce. (2016). Retrieved from http://www.gfachamber.com/
Grogger, J. (2003, January). Welfare Transitions in the 1990s: the Economy, Welfare Policy, and the EITC. National Bureau of Economic Research, Working Paper No. 9472. Retrieved from http://www.nber.org/papers/w9472.pdf
Hanson, K. (2008). Mollie Orshansky’s Strategy to Poverty Measurement as a Relationship between Household Food Expenditures and Economy Food Plan. Review of Agricultural Economics, Volume 30(Number 3), 572–580 . Retrieved from http://handle.nal.usda.gov/10113/20301
Haskins, R. (2011, June ). Fighting Poverty the American Way . Retrieved from https://www.brookings.edu/research/fighting-poverty-the-american-way/
He, W., Goodkind, D., & Kowal, P. (2016). An Aging World: 2015. Retrieved from https://www.census.gov/content/dam/ Census/library/publications/2016/demo/p95-16-1.pdf
Herbert, C., McCue, D., & Sanchez-Moyano, R. (September 2013). Is Homeownership Still an Effective Means of Building Wealth for Low-income and Minority Households? (Was it Ever?). Harvard University, Joint Center for Housing Studies. Retrieved from http://www.jchs.harvard.edu/sites/jchs.harvard.edu/files/hbtl-06.pdf
Hounsell, C. (2008). The Female Factor 2008: Why Women Are at Greater Financial Risk in Retirement and How Annuities Can Help. Retrieved from https://www.wiserwomen.org/images/ imagefiles/The%20Female%20Factor%202008.pdf
Humes, K. R., Jones, N. A., & Ramirez, R. R. (2011). Overview of Race and Hispanic Origin: 2010. U.S. Census. Retrieved from http://www.census.gov/prod/cen2010/briefs/c2010br-02.pdf
Internal Revenue Service (IRS). (2007, 2010 and 2012). NCCS Data Web Report Builder, Statistics of Income 990EZc3 Report and 990 c3 Report.
Internal Revenue Service (IRS). (2016). Individual Shared Responsibility Provision – Reporting and Calculating the Payment. Retrieved from https://www.irs.gov/affordable-care-act/ individuals-and-families/aca-individual-shared-responsibility-provision-calculating-the-payment
Internal Revenue Service. (2014). Individual Income and Tax Data, by State and Size of Adjusted Gross Income, Tax Year 2014. Retrieved from https://www.irs.gov/uac/soi-tax-stats-historic-table-2
Ireland, E. (2016). Why Does it Cost so Much to Build Affordable Housing? Retrieved from https://communityhousingnetwork.org/cost-much-build-affordable-housing/#_ftn1
Joint Center for Housing Studies. (2013). America’s Rental Housing: Evolving Markets and Needs. Retrieved from http://www.jchs.harvard.edu/sites/jchs.harvard.edu/ files/jchs_americas_rental_housing_2013_1_0.pdf

58 UNIT
ED W
AY A
LICE
REP
ORT
– 20
17 U
PDAT
E FO
R M
ICHI
GAN
Jones, S. (2014). Table: The Rise in Auto Loans Across the U.S. Retrieved from Bankrate.com: http://www.bankrate.com/finance/auto/table-auto-loan-debt-per-capita-by-state.aspx
Kaiser Family Foundation. (2012). Health Care Costs: A Primer. Retrieved from http://kff.org/report-section/health-care-costs-a-primer-2012-report/
Kaiser Family Foundation. (2014). Average Monthly Food Stamp Benefits Per Person. Retrieved from State Health Facts: http://kff.org/other/state-indicator/avg-monthly-food-stamp-benefits/
Katz, L., & Krueger, A. (2016). The Rise and Nature of Alternative Work Arrangements in the United States, 1995-2015. RAND-Princeton Contingent Worker Survey. Retrieved from https://krueger.princeton.edu/sites/default/files/akrueger/ files/katz_krueger_cws_-_march_29_20165.pdf
Keely, L., van Ark, B., Levanon, G., & Burbank, J. (May 2012). The Shifting Nature of U.S. Housing Demand. Demand Institute. Retrieved from http://demandinstitute.org/demandwp/wp-content/uploads/2015/03/the-shifting-nature-of-us-housing-demand.pdf
Kiernan, J. (2016). Q2 2016 Auto Financing Report. WalletHub. Retrieved March 30, 2016, from https://wallethub.com/edu/auto-financing-report/10131/
Knight, W. (2012). This Robot Could Transform Manufacturing. MIT Technology Review. Retrieved from https://www.technologyreview.com/s/429248/this-robot-could-transform-manufacturing/
Knowledge@Wharton. (2013). The Complex Economics of America’s Minimum Wage. Retrieved from http://knowledge.wharton.upenn.edu/article/complex-economics-americas-minimum-wage/
Kochhar, R., & Fry, R. (2014). Wealth Inequality Has Widened along Racial, Ethnic Lines Since End of Great Recession. FactTank. Retrieved from http://www.pewresearch.org/fact-tank/ 2014/12/12/racial-wealth-gaps-great-recession/
Leadership Conference on Civil Rights. (2000). Justice on Trial: Racial Disparities in the American Criminal Justice System. Leadership Conference Education Fund. Retrieved from http://www.protectcivilrights.org/pdf/reports/justice.pdf
Leibtag, E., & Kumcu, A. (2011, May). The WIC Fruit and Vegetable Cash Voucher: Does Regional Price Variation Affect Buying Power?. Economic Information Bulletin (Number 75). Retrieved from http://www.ers.usda.gov/media/127579/eib
Luis, M. (2009). A Tale of Ten Cities: Attracting and Retaining Talent. Retrieved from http://www.psrc.org/assets/5585/IRBC2-Talent1109.pdf
Lusardi, A., Schneider, D., & Tufano, P. (2011). Financially Fragile Households:Evidence and Implications. Retrieved from https://www.brookings.edu/wp-content/uploads/ 2011/03/2011a_bpea_lusardi.pdf
Mack, J. (2015). 6% of Michigan residents are foreign born, and 9 other facts about immigrants. MLive. Retrieved from http://www.mlive.com/news/kalamazoo/index.ssf/ 2015/11/6_of_michigan_residents_are_fo.html
Manyika, J., Lund, S., Bughin, J., Robinson, K., Mischke, J., & Mahajan, D. (2016). Independent work: Choice, necessity, and the gig economy. McKinsey Global Institute. Retrieved from http://www.mckinsey.com/global-themes/employment-and-growth/independent-work-choice-necessity-and-the-gig-economy
Martin, J., & Ruark, E. (2010). The Fiscal Burden Of Illegal Immigration On United States Taxpayers. Federation for American Immigration Reform . Retrieved from http://www.fairus.org/DocServer/research-pub/USCostStudy_2013upd.pdf
Massachusetts Institute of Technology (MIT). (2015). Living Wage Calculator User’s Guide/Technical Notes, 2015 Update. Retrieved from http://livingwage.mit.edu/resources/ Living-Wage-User-Guide-and-Technical-Notes-2015.pdf
MetLife Mature Market Institute. (June 2011). The MetLife Study of Elder Financial Abuse. Retrieved from https://www.metlife.com/assets/cao/mmi/publications/studies/2011/mmi-elder-financial-abuse.pdf
Michigan Association of Planning. (2007). Retrieved from http://www.planningmi.org/downloads/issue_36_affordable_housing.pdf
Michigan Department of Education. (2014). Quantifying the Achievement Gap. Retrieved from https://www.michigan.gov/documents/mde/Quantifying_the_Achievement_Gap_473719_7.pdf
Michigan Department of Health and Human Services. (2016). Retrieved from http://www.mdch.state.mi.us/pha/osr/CHI/POP/DP00_A1.asp
Michigan Department of Treasury. (2015).Retrieved from http://www.michigan.gov/documents/taxes/MI-1040_Book_406578_7.pdf; https://www.michigan.gov/documents/taxes/1040_Book_-_Instructions_Only_508950_7.pdf;http://www.michigan.gov/documents/taxes/MI1040book_341323_7.pdf; http://www.michigan.gov/documents/taxes/MI-1040booklet_219043_7.pdf
Michigan Economic Development Corporation (MEDC). (2016) Retrieved from http://www.michiganbusiness.org/cm/Files/Reports/MEDC-2014-2015-Annual-Report_E3.pdf?rnd=1486489335669
Michigan Health and Hospital Association. (2015). Retrieved from http://www.mha.org/Newsroom/Publications/Economic-Impact
Michigan Legal Aid. (2016). Recovering from Hurricanes and Other Natural Disaters: Your Rights. Retrieved from http://www.michiganlegalaid.org/library_client/individual_rights/recovering_from_disasters_your_legal_rights/html_view
Michigan Office for New Americans. (2016). The Contributions of New Americans in Michigan. Retrieved from http://www.michigan.gov/documents/ona/PNAE_Michigan_Final_Report_531020_7.pdf
Michigan Office of Great Start. (2015). Retrieved from https://www.michigan.gov/documents/mde/ MI_2015_MRS_Final_Report_493236_7.pdf
Michigan Prepares. (2016). Retrieved from http://www.michigan.gov/michiganprepares/
Migration Policy Institute. (2014). State Immigration Data Profiles: Demographics & Social. Retrieved from http://www.migrationpolicy.org/programs/ data-hub/state-immigration-data-profiles

59UNIT
ED W
AY A
LICE
REP
ORT
– 20
17 U
PDAT
E FO
R M
ICHI
GAN
Minnesota Attorney General’s Office. (2016). For-Profit Colleges: Do Your Homework. Retrieved from https://www.ag.state.mn.us/Brochures/pubForProfitColleges.pdf
Mishel, L., Bivens, J., Gould, E., & Shierholz, H. (2012). The State of Working America, 12th Edition. Ithaca, NY: An Economic Policy Institute Book, Cornell University Press.
MIT, Calhoun County. (n.d.). Retrieved from http://livingwage.mit.edu/counties/26025
Mitra, D. (2011). Pennsylvania’s Best Investment: The Social and Economic Benefits of Public Education. Retrieved from http://www.elc-pa.org/wp-content/uploads/2011/06/ BestInvestment_Full_Report_6.27.11.pdf
National Academies of Sciences, Engineering, and Medicine. (2016). The Economic and Fiscal Consequences of Immigration. Retrieved from https://www.nap.edu/catalog/23550/ the-economic-and-fiscal-consequences-of-immigration
National Association of State Budget Officers. (2014). State Expenditure Report: Examining Fiscal 2012-2014 State Spending. Retrieved from https://higherlogicdownload.s3.amazonaws.com/NASBO/9d2d2db1-c943-4f1b-b750-0fca152d64c2/UploadedImages/SER%20Archive/State%20Expenditure%20Report%20Fiscal%202012%202014%20S.pdf
National Center for Education Statistics (NCES). (2014). Retrieved from http://nces.ed.gov/programs/digest/d14/tables/dt14_309.10.asp
National Conference of State Legislatures. (2016). Tax Credits for Working Families: Earned Income Tax Credit (EITC). Retrieved from http://www.ncsl.org/research/labor-and-employment/ earned-income-tax-credits-for-working-families.aspx
National Conference of State Legislatures. (October 2011). State Policies to Counteract the Cliff Effect in Public Programs: Summary Prepared by National Conference of State Legislatures. Retrieved from http://www.legis.nd.gov/files/committees/64-2014%20appendices/17_9066_01000appendixb.pdf
Networks Northwest. (2011). Retrieved from www.networksnorthwest.org/userfiles/filemanager/3813/
O’Dea, C. (2016). Explainer: NJ’s Welfare Programs pay Well Below Federal Poverty Level. NJ Spotlight. Retrieved from http://www.njspotlight.com/stories/16/02/22/explainer-nj-s- welfare-programs-pay-well-below-poverty-level-impose-strict-rules/
Office of Management and Budget. (2016). Fiscal Year 2016 Analytical Perspectives Budget of the U.S. Government. Retrieved from https://www.gpo.gov/fdsys/pkg/BUDGET-2016-PER/ pdf/BUDGET-2016-PER.pdf
Oliver, M., & Shapiro, T. (2006). Black Wealth/White Wealth: A New Perspective on Racial Inequality (2nd ed.). New York, NY: Routledge. Retrieved from http://www.amazon.com/Black-Wealth-White-Perspective-Inequality/dp/0415951674
Paral, R. (2014). Growing the Heartland: How Immigrants Offset Population Decline and an Aging Workforce in Midwest Metropolitan Areas. Retrieved from https://www.thechicagocouncil.org/sites/ default/files/GrowingHeartland_June2014.pdf
Pereira, K. M., Crosnoe, R., Fortuny, K., Pedroza, J. M., Ulvestad, K., Weiland, C., . . . Chaudry, A. (2012). Barrier to Immigrants Acces to Health and Human Services Programs. Retrieved from https://aspe.hhs.gov/basic-report/barriers-immigrants-access-health-and-human-services-programs
Perryman Group. (2008, April). An Essential Resource: An Analysis of the Economic Impact of Undocumented Workers on Business Activity in the US with Estimated Effects by State and Industry. Retrieved from https://www.perrymangroup.com/wp-content/uploads/Impact_of_the_Undocumented_Workforce.pdf
Pew Charitable Trusts. (2014). Mapping Public Benefits for Immigrants in the States. Retrieved from http://www.pewtrusts.org/en/research-and-analysis/issue-briefs/ 2014/09/mapping-public-benefits-for-immigrants-in-the-states
Pew Charitable Trusts. (May 2016). A Look at Access to Employer-Based Retirement Plans in the Nation’s Metropolitan Areas. Brief. Retrieved from http://www.pewtrusts.org/~/media/assets/2016/05/employerbased_retirement_plans_metropolitan_areas.pdf?la=en
Pew Research Center. (2014, November 18). Unauthorized Immigrants in the U.S., 2012. Hispanic Trends. Retrieved from http://www.pewhispanic.org/interactives/unauthorized-immigrants-2012/map/all-immigrant-share/
Prevost, L. (2013). Snob Zones: Fear, Prejudice, and Real Estate. Boston, MA: Beacon Press. Retrieved from http://www.amazon.com/Snob-Zones-Fear-Prejudice-Estate-ebook/dp/B008ED6AL8
Projections Central. (2016). Long Term Occupational Projections. Retrieved from http://www.projectionscentral.com/Projections/LongTerm
Redfoot, D., Feinberg, L., & Houser, A. (2013, August). The Aging of the Baby Boom and the Growing Care Gap: A Look at Future Declines in the Availability of Family Caregivers. Retrieved from http://www.aarp.org/content/dam/aarp/research/public_policy_institute/ltc/2013/baby-boom-and-the-growing-care-gap-insight-AARP-ppi-ltc.pdf
Reinhard, S. C., Kassner, E., Houser, A., Ujvari, K., Mollica, R., & Hendrickson, L. (2014). Raising Expectations: A State Scorecard on Long-Term Services and Supports for Older Adults, People With Physical Disabilities, and Family Caregivers. Retrieved from http://www.aarp.org/content/dam/aarp/research/public_policy_institute/ ltc/2014/raising-expectations-2014-AARP-ppi-itc.pdf
Rochester Regional Chamber of Commerce. (2016). Retrieved from http://www.rrc-mi.com/pages/EconomicDevelopment
Rosaen, A., & Taylor, T. (2017). Empowering Michigan. Retrieved from http://www.andersoneconomicgroup.com/Portals/ 0/upload/URC_Econ%20Impact_1-24-2017.pdf
Rosenbaum, D. (2013, January ). The Relationship Between SNAP and Work Among Low-Income Households. Center on Budget and Policy Priorities. Retrieved from http://www.cbpp.org/cms/index.cfm?fa=view&id=38
SBDCNet. (2014). Daycare Business 2014. Retrieved from http://www.sbdcnet.org/small-business-research-reports/daycare-business-2014
School of Public Health, University of Michigan. (2012). Environmental Justice & Vulnerable Populations. Retrieved from https://sph.umich.edu/findings/spring2012/michigan/moves.html

60 UNIT
ED W
AY A
LICE
REP
ORT
– 20
17 U
PDAT
E FO
R M
ICHI
GAN
Senate Fiscal Agency. (2016). Retrieved from http://www.senate.michigan.gov/sfa/Publications/ BudUpdates/EconomicOutlookMay16.pdf
Shaefer, H. L., & Edin, K. (2013, May ). Rising Extreme Poverty in the United States and the Response of Federal Means-Tested Transfer Programs . (Working Paper #13-06). Retrieved from http://www.npc.umich.edu/publications/working_papers/?publication_id=255&
Shapiro, T., Meschede, T., & Osoro, S. (2013). The Roots of the Widening Racial Wealth Gap: Explaining the Black-White Economic Divide. Brandeis University, Institute on Assets and Social Policy. Retrieved from http://iasp.brandeis.edu/pdfs/Author/ shapiro-thomas-m/racialwealthgapbrief.pdf
Sherman, A., Trisi, D., & Parrott, S. (2013, July 30). Various Supports for Low-Income Families Reduce Poverty and Have Long-Term Positive Effects On Families and Children. Center on Budget and Policy Priorities. Retrieved from http://www.cbpp.org/sites/default/files/atoms/files/7-30-13pov.pdf
Smith, A. (2016). Gig Work, Online Selling and Home Sharing. Pew Research Center. Retrieved from http://www.pewinternet.org/2016/11/17/labor-platforms-technology-enabled-gig-work/
Stanton, M. (2006). The High Concentration of U.S. Health Care Expenditures. Agency for Healthcare Research and Quality. Retrieved from https://archive.ahrq.gov/research/ findings/factsheets/costs/expriach/expendria.pdf
State Attorneys General. (2014, September 9). Re: S.2204 - Proprietary Education Oversight Coordination Improvement Act. Retrieved from http://ag.ky.gov/pdf_news/s2204-letter.pdf
Stilwell, V. (2015). Boomers Competing With Millennials for U.S. Urban Rental Housing. Bloomberg. Retrieved from http://www.bloomberg.com/news/articles/2015-07-21/boomers-competing-with-millennials-for-u-s-urban-rental-housing
Substance Abuse and Mental Health Services Administration in partnership with the U.S. Administration on Aging. (2012, December). Policy Academy State Profile: [STATE]. Retrieved from https://aoa.acl.gov/AoA_Programs/HPW/Behavioral/ docs2/Michigan%20Epi%20Profile%20Final.pdf
Sum, A., & Khatiwada, I. (2010). The Nation’s Underemployed in the ‘Great Recession’ of 2007–09. Monthly Labor Review, Vol. 133. Retrieved from http://www.bls.gov/opub/mlr/2010/11/mlr201011.pdf
The White House. (2016). Housing Development Toolkit. Retrieved from https://www.whitehouse.gov/sites/whitehouse.gov/ files/images/Housing_Development_Toolkit%20f.2.pdf
U.S. Bureau of Justice Statistics. (2015). Elderly Abuse Statistics. National Center on Elder Abuse. Retrieved from http://www.statisticbrain.com/elderly-abuse-statistics/
U.S. Census Bureau. (2005). Population Projections. Retrieved from https://www.census.gov/population/projections/ data/state/projectionsagesex.html
U.S. Census Bureau. (2010, 2015). Population Estimates: Historical Data. U.S. Census Bureau. Retrieved from https://www.census.gov/popest/data/historical/index.html
U.S. Census Bureau. (2013). Statistics for All U.S. Firms by Industry, Gender, Ethnicity, and Race for the U.S., States, Metro Areas, Counties, and Places: 2012, 2012 Survey of Business Owners. Retrieved from American Fact Finder: http://factfinder.census.gov/faces/tableservices/ jsf/pages/productview.xhtml?src=bkmk
U.S. Chamber of Commerce. (2013). Immigration Myths and Facts. Retrieved from https://www.uschamber.com/sites/ default/files/legacy/reports/Immigration_MythsFacts.pdf
U.S. Chamber of Commerce Foundation. (2015). The Path Froward: Improving Opportunities for African-American Students. Retrieved from http://www.leadersandlaggards.org/sites/default/files/ThePathForward_Improving_Opportunities_AfricanAmerican_Students.pdf
U.S. Department of Education. (2016). FY 2013 3-Year Official Cohort Default Rates by State/Territory. Retrieved from https://www2.ed.gov/offices/OSFAP/defaultmanagement/staterates.pdf
U.S. Department of Health & Human Services. (2015). Poverty Guidelines. Retrieved from https://aspe.hhs.gov/prior-hhs-poverty-guidelines-and-federal-register-references
U.S. Department of Health and Human Services. (2009, 2014). Retrieved from https://www.acf.hhs.gov/ofa/resource/tanf-financial-data-fy-2009; https://www.acf.hhs.gov/ofa/resource/tanf-financial-data-fy-2014
U.S. Department of Housing and Urban Development (HUD). (2010, March). Costs Associated with First-Time Homelessness for Families and Individuals. Retrieved from http://www.huduser.org/publications/pdf/Costs_Homeless.pdf
U.S. Department of Housing and Urban Development (HUD). (2015). Picture of Subsidized Households: Summary of all HUD Programs, 2015 based on 2010 Census. Retrieved from https://www.huduser.gov/portal/datasets/picture/yearlydata.html
U.S. Department of Transportation. (2015). Beyond Traffic: Trends and Choices 2045. Retrieved from https://www.transportation.gov/sites/dot.gov/files/docs/Draft_Beyond_Traffic_Framework.pdf
U.S. Global Change Research Program. (2014). Retrieved from http://www.globalchange.gov/nca3-downloads-materials
U.S. Government Accountability Office (U.S. GAO). (2007). Unemployment Insurance: Low-Wage And Part-Time Workers Continue To Experience Low Rates Of Receipt. Retrieved from http://www.gao.gov/new.items/d071147.pdf
U.S. Government Accountability Office (U.S. GAO). (2015). Contingent Workforce: Size, Characteristics, Earnings, and Benefits. GAO-15-168R. Retrieved from http://www.gao.gov/assets/670/669766.pdf
U.S. Government Accountability Office (U.S. GAO). (August 4, 2010). For-Profit Colleges: Undercover Testing Finds Colleges Encouraged Fraud and Engaged in Deceptive and Questionable Marketing Practices. Retrieved from http://www.gao.gov/products/GAO-10-948T
U.S. Government Accountability Office (U.S. GAO). (October 7, 2010). Higher Education: Stronger Federal Oversight Needed to Enforce Ban on Incentive Payments to School Recruiters. Retrieved from http://www.gao.gov/products/GAO-11-10

61UNIT
ED W
AY A
LICE
REP
ORT
– 20
17 U
PDAT
E FO
R M
ICHI
GAN
U.S. Government Accountability Office (U.S. GAO). (September 21, 2009). Proprietary Schools: Stronger Department of Education Oversight Needed to Help Ensure Only Eligible Students Receive Federal Student Aid. Retrieved from http://www.gao.gov/products/GAO-09-600
U.S. Small Business Administration. (2016). Small Business Profile: Michigan. Retrieved from https://www.sba.gov/sites/default/files/advocacy/Michigan.pdf
United Health Foundation. (2016). America’s Health Rankings, 2016 Senior Report. Retrieved from http://www.americashealthrankings.org/explore/2016-senior-report/measure/mental_health_days_sr
United Health Foundation. (2016). America’s Health Rankings, 2016 Senior Report. Retrieved from http://www.americashealthrankings.org/explore/2015-annual-report/measure/MentalHealth/state/MI
United States Senate Health, Education, Labor and Pensions Committee. (July 30, 2012). For Profi t Higher Education: The Failure to Safeguard the Federal Investment and Ensure Student Success. Retrieved from http://www.help.senate.gov/imo/ media/for_profit_report/PartI-PartIII-SelectedAppendixes.pdf
Urban Institute. (2012). NCCS Data Web Report Builder, Statistics of Income 990EZc3 Report and 990 c3 Report. Retrieved from National Center for Charitable Statistics: http://nccs.urban.org/NCCS-Databases-and-Tools.cfm
Vespa, J., Lewis, J. M., & Kreider, R. M. (2013, August ). America’s Families and Living Arrangements: 2012, Population Characteristics. Retrieved from https://www.census.gov/prod/2013pubs/p20-570.pdf
Waid, M. D. (2013, April). An Uphill Climb: Women Face Greater Obstacles to Retirement Security. (Fact Sheet 281). Retrieved from http://www.aarp.org/content/dam/aarp/research/public_policy_institute/econ_sec/2013/uphill-climb-women-face-greater- obstacles-retirement-security-AARP-ppi-econ-sec.pdf
Wald, J. (2014, July). What the Rise of the Freelance Economy Really Means for Businesses. Forbes. Retrieved from http://www.forbes.com/sites/waldleventhal/2014/07/01/a-modern-human-capital-talent-strategy-usingfreelancers/#289aace16a06
Watson, L., Frohlich, L., & Johnston, E. (2014, April ). Collateral Damage: Scheduling Challenges for Workers in Low-Wage Jobs and Their Consequences . Retrieved from http://www.nwlc.org/sites/default/files/pdfs/collateral_damage_s
Wheeler, J. (2016). Where are the Workers. The Betsie Current. Retrieved from http://betsiecurrent.com/index.php/where-are-the-workers/
Wolfson, D. B. (2014). What Does the Minimum Wage Do? Retrieved from http://research.upjohn.org/up_press/227/
Working Poor Families Project (WPFP). (2016, Accessed March 28). Indicators and data, Supplemental data, Table S.5. Retrieved from http://www.workingpoorfamilies.org/indicators/
Zabritski, M. (2016). State of the Automotive Finance Market: A Look at Loans and Leases in Q1 2016. Retrieved from http://www.experian.com/assets/automotive/quarterly-webinars/ 2016-q1-safm.pdf
Zavodny, M., & Jacoby, T. (2013). Filling the Gap. Retrieved from https://www.aei.org/wp-content/uploads/2013/06/-zavodny-filling-the-gap-immigration-report_140631709214.pdf

62 UNIT
ED W
AY A
LICE
REP
ORT
– 20
17 U
PDAT
E FO
R M
ICHI
GAN

UNIT
ED W
AY A
LICE
REP
ORT
– 20
17 U
PDAT
E FO
R M
ICHI
GAN
EXHIBITSThe following Exhibits present key data for better understanding ALICE households in Michigan from a variety of geographic and demographic perspectives. Exhibit IX describes an overview of the methodology used in the ALICE Reports.
EXHIBIT I: ALICE COUNTY PAGES
EXHIBIT II: ALICE HOUSING DATA BY COUNTY
EXHIBIT III: ALICE THRESHOLD AND DEMOGRAPHICS, MICHIGAN, 2015
EXHIBIT IV: KEY FACTS AND ALICE STATISTICS FOR MICHIGAN CONGRESSIONAL DISTRICTS
EXHIBIT V: THE ECONOMIC VIABILITY DASHBOARD
EXHIBIT VI: KEY FACTS AND ALICE STATISTICS FOR MICHIGAN MUNICIPALITIES
EXHIBIT VII: ALICE HOUSEHOLDS BY INCOME, 2007 TO 2015
EXHIBIT VIII: STRATEGIES THAT CAN MAKE A DIFFERENCE FOR ALICE
EXHIBIT IX: METHODOLOGY OVERVIEW & RATIONALE

ALICE COUNTY PAGESThe following section presents a snapshot of ALICE in each of Michigan’s 83 counties, including the number and percent of households by income, Economic Viability Dashboard scores, Household Survival Budget, key economic indicators, and data for each municipality in the county (where available).
Because state averages often smooth over local variation, these county pages are crucial to understanding the unique combination of demographic and economic circumstances in each county in Michigan. Building on American Community Survey data, for counties with populations over 65,000, the data are 1-year estimates; for populations below 65,000, data are 5-year estimates (starting in 2014, there are no 3-year estimates).
UNIT
ED W
AY A
LICE
REP
ORT
– 20
17 U
PDAT
E FO
R M
ICHI
GAN
– EX
HIBI
T I

UNIT
ED W
AY A
LICE
REP
ORT
– 20
17 U
PDAT
E FO
R M
ICHI
GAN
– EX
HIBI
T I
2015 Point-in-Time Data
Households by Income, 2007 to 2015
Population: 10,550 | Number of Households: 5,001Median Household Income: $38,033 (state average: $51,084)Unemployment Rate: 12.2% (state average: 7.2%)ALICE Households: 27% (state average: 25%); Poverty Households: 15% (state average: 15%)
How many households are struggling?ALICE is an acronym for Asset Limited, Income Constrained, Employed – households that earn more than the Federal Poverty Level, but less than the basic cost of living for the county (the ALICE Threshold, or AT). Combined, the number of poverty and ALICE households equals the total population struggling to afford basic needs. The number of households below the ALICE Threshold changes over time; households move in and out of poverty and ALICE as circumstances improve or worsen. The Great Recession, from 2007 to 2010, caused hardship for many families. Conditions started to improve in 2010 and 2012 for some, but not for all.
What does it cost to afford the basic necessities?The bare-minimum Household Survival Budget does not include any savings, leaving a household vulnerable to unexpected expenses. ALICE households typically earn above the Federal Poverty Level of $11,770 for a single adult and $24,250 for a family of four, but less than the Household Survival Budget.
ALICE IN ALCONA COUNTY
Household Survival Budget, Alcona County
SINGLE ADULT2 ADULTS, 1 INFANT,
1 PRESCHOOLERMonthly Costs
Housing $448 $643Child Care $– $1,229Food $184 $609Transportation $349 $697Health Care $184 $707Miscellaneous $133 $421Taxes $165 $328
Monthly Total $1,463 $4,634ANNUAL TOTAL $17,556 $55,608Hourly Wage $8.78 $27.80
Sources: 2015 Point-in-Time Data: American Community Survey. ALICE Demographics: American Community Survey; the ALICE Threshold. Budget: U.S. Department of Housing and Urban Development (HUD); U.S. Department of Agriculture (USDA); Bureau of Labor Statistics (BLS); Internal Revenue Service (IRS); Michigan Department of Treasury; Early Childhood Investment Corporation.
#N/A 13% 14% 15%
29% 24% 27%
58% 62%
58%
4,608 4,740 5,001
-
1,000
2,000
3,000
4,000
5,000
6,000
0%
10%
20%
30%
40%
50%
60%
70%
80%
90%
100%
2010 2012 2015
Tota
l Hou
seho
lds
Perc
ent o
f Hou
seho
lds
260011
Poverty ALICE Above AT Total HH
N/A

UNIT
ED W
AY A
LICE
REP
ORT
– 20
17 U
PDAT
E FO
R M
ICHI
GAN
– EX
HIBI
T I
Note: Municipal-level data on this page is for Places and County Subdivisions, which include Census Designated Places (CDP). These are overlapping geographies so totals will not match county-level data. Municipal-level data often relies on 5-year averages and is not available for the smallest towns that do not report income.
Families with Children by Income, 2015
Assets, All Households, 2015
How many families with children are struggling?Children add significant expense to a family budget, so it is not surprising that many Alcona County families with children live below the ALICE Threshold. Though more Alcona County families are headed by married parents, those families with a single parent are more likely to have income below the ALICE Threshold.
What assets do households have?Ownership of assets can contribute to stability of households. Yet few families in Alcona County own liquid assets, such as a savings account, 401(k) plan, or rental income, that are readily available to cover emergency expenses. Vehicles, the most common asset, depreciate over time. Homeownership, the next most common asset, can build wealth, but is not a liquid asset.
1 Vehicle
2 Vehicles
No Mortgage
3 Vehicles
With Mortgage
4+ Vehicles
0%
20%
40%
60%
80%
100%
120%
Vehicle Home Interest, Dividends, or RentalIncome
Perc
ent o
f Hou
seho
lds
260013
14%
56%
28% 10%
13%
29%
76%
31% 43%
484
90 72
0
100
200
300
400
500
600
0%
10%
20%
30%
40%
50%
60%
70%
80%
90%
100%
Married SingleFemale-Headed
SingleMale-
HeadedTo
tal H
ouse
hold
s
Perc
ent o
f Fam
ilies
with
Chi
ldre
n
260012
Poverty ALICE Above AT Total HH
Alcona County, 2015
Town Total HH% ALICE
& Poverty
Alcona Township 521 30%
Caledonia Township 501 39%
Curtis Township 577 51%
Greenbush Township 709 34%
Gustin Township 329 43%
Harrisville City 194 63%
Harrisville Township 573 43%
Hawes Township 459 44%
Haynes Township 341 31%
Mikado Township 435 47%
Millen Township 171 56%
Mitchell Township 191 42%

UNIT
ED W
AY A
LICE
REP
ORT
– 20
17 U
PDAT
E FO
R M
ICHI
GAN
– EX
HIBI
T I
2015 Point-in-Time Data
Households by Income, 2007 to 2015
Population: 9,476 | Number of Households: 3,470Median Household Income: $39,300 (state average: $51,084)Unemployment Rate: 10.8% (state average: 7.2%)ALICE Households: 36% (state average: 25%); Poverty Households: 14% (state average: 15%)
How many households are struggling?ALICE is an acronym for Asset Limited, Income Constrained, Employed – households that earn more than the Federal Poverty Level, but less than the basic cost of living for the county (the ALICE Threshold, or AT). Combined, the number of poverty and ALICE households equals the total population struggling to afford basic needs. The number of households below the ALICE Threshold changes over time; households move in and out of poverty and ALICE as circumstances improve or worsen. The Great Recession, from 2007 to 2010, caused hardship for many families. Conditions started to improve in 2010 and 2012 for some, but not for all.
What does it cost to afford the basic necessities?The bare-minimum Household Survival Budget does not include any savings, leaving a household vulnerable to unexpected expenses. ALICE households typically earn above the Federal Poverty Level of $11,770 for a single adult and $24,250 for a family of four, but less than the Household Survival Budget.
ALICE IN ALGER COUNTY
Household Survival Budget, Alger County
SINGLE ADULT2 ADULTS, 1 INFANT,
1 PRESCHOOLERMonthly Costs
Housing $448 $643Child Care $– $1,229Food $184 $609Transportation $349 $697Health Care $184 $707Miscellaneous $133 $421Taxes $165 $328
Monthly Total $1,463 $4,634ANNUAL TOTAL $17,556 $55,608Hourly Wage $8.78 $27.80
Sources: 2015 Point-in-Time Data: American Community Survey. ALICE Demographics: American Community Survey; the ALICE Threshold. Budget: U.S. Department of Housing and Urban Development (HUD); U.S. Department of Agriculture (USDA); Bureau of Labor Statistics (BLS); Internal Revenue Service (IRS); Michigan Department of Treasury; Early Childhood Investment Corporation.
#N/A 13% 13% 14%
30% 29% 36%
57% 58%
50%
3,688 3,558 3,470
-
500
1,000
1,500
2,000
2,500
3,000
3,500
4,000
0%
10%
20%
30%
40%
50%
60%
70%
80%
90%
100%
2010 2012 2015
Tota
l Hou
seho
lds
Perc
ent o
f Hou
seho
lds
260031
Poverty ALICE Above AT Total HH
N/A

UNIT
ED W
AY A
LICE
REP
ORT
– 20
17 U
PDAT
E FO
R M
ICHI
GAN
– EX
HIBI
T I
Note: Municipal-level data on this page is for Places and County Subdivisions, which include Census Designated Places (CDP). These are overlapping geographies so totals will not match county-level data. Municipal-level data often relies on 5-year averages and is not available for the smallest towns that do not report income.
Families with Children by Income, 2015
Assets, All Households, 2015
How many families with children are struggling?Children add significant expense to a family budget, so it is not surprising that many Alger County families with children live below the ALICE Threshold. Though more Alger County families are headed by married parents, those families with a single parent are more likely to have income below the ALICE Threshold.
What assets do households have?Ownership of assets can contribute to stability of households. Yet few families in Alger County own liquid assets, such as a savings account, 401(k) plan, or rental income, that are readily available to cover emergency expenses. Vehicles, the most common asset, depreciate over time. Homeownership, the next most common asset, can build wealth, but is not a liquid asset.
1 Vehicle
2 Vehicles
No Mortgage
3 Vehicles
With Mortgage
4+ Vehicles
0%
10%
20%
30%
40%
50%
60%
70%
80%
90%
100%
Vehicle Home Interest, Dividends, or RentalIncome
Perc
ent o
f Hou
seho
lds
260033
8%
40% 31% 16%
51%
37%
76%
9%
32%
425
103 106
0
50
100
150
200
250
300
350
400
450
0%
10%
20%
30%
40%
50%
60%
70%
80%
90%
100%
Married SingleFemale-Headed
SingleMale-
HeadedTo
tal H
ouse
hold
s
Perc
ent o
f Fam
ilies
with
Chi
ldre
n
260032
Poverty ALICE Above AT Total HH
Alger County, 2015
Town Total HH% ALICE
& Poverty
Au Train Township 494 45%
Burt Township 192 56%
Limestone Township 155 53%
Mathias Township 194 52%
Munising City 909 57%
Munising Township 786 47%
Onota Township 142 48%
Rock River Township 576 43%

UNIT
ED W
AY A
LICE
REP
ORT
– 20
17 U
PDAT
E FO
R M
ICHI
GAN
– EX
HIBI
T I
2015 Point-in-Time Data
Households by Income, 2007 to 2015
Population: 114,625 | Number of Households: 42,079Median Household Income: $55,250 (state average: $51,084)Unemployment Rate: 1.9% (state average: 7.2%)ALICE Households: 26% (state average: 25%); Poverty Households: 11% (state average: 15%)
How many households are struggling?ALICE is an acronym for Asset Limited, Income Constrained, Employed – households that earn more than the Federal Poverty Level, but less than the basic cost of living for the county (the ALICE Threshold, or AT). Combined, the number of poverty and ALICE households equals the total population struggling to afford basic needs. The number of households below the ALICE Threshold changes over time; households move in and out of poverty and ALICE as circumstances improve or worsen. The Great Recession, from 2007 to 2010, caused hardship for many families. Conditions started to improve in 2010 and 2012 for some, but not for all.
What does it cost to afford the basic necessities?The bare-minimum Household Survival Budget does not include any savings, leaving a household vulnerable to unexpected expenses. ALICE households typically earn above the Federal Poverty Level of $11,770 for a single adult and $24,250 for a family of four, but less than the Household Survival Budget.
ALICE IN ALLEGAN COUNTY
Household Survival Budget, Allegan County
SINGLE ADULT2 ADULTS, 1 INFANT,
1 PRESCHOOLERMonthly Costs
Housing $576 $713Child Care $– $1,039Food $184 $609Transportation $349 $697Health Care $184 $707Miscellaneous $149 $406Taxes $194 $291
Monthly Total $1,636 $4,462ANNUAL TOTAL $19,632 $53,544Hourly Wage $9.82 $26.77
Sources: 2015 Point-in-Time Data: American Community Survey. ALICE Demographics: American Community Survey; the ALICE Threshold. Budget: U.S. Department of Housing and Urban Development (HUD); U.S. Department of Agriculture (USDA); Bureau of Labor Statistics (BLS); Internal Revenue Service (IRS); Michigan Department of Treasury; Early Childhood Investment Corporation.
11% 16% 14% 11%
20% 25% 21%
26%
69%
59% 65% 63%
41,008 41,724 42,930 42,079
-
5,000
10,000
15,000
20,000
25,000
30,000
35,000
40,000
45,000
50,000
0%
10%
20%
30%
40%
50%
60%
70%
80%
90%
100%
2007 2010 2012 2015
Tota
l Hou
seho
lds
Perc
ent o
f Hou
seho
lds
260051
Poverty ALICE Above AT Total HH

UNIT
ED W
AY A
LICE
REP
ORT
– 20
17 U
PDAT
E FO
R M
ICHI
GAN
– EX
HIBI
T I
Note: Municipal-level data on this page is for Places and County Subdivisions, which include Census Designated Places (CDP). These are overlapping geographies so totals will not match county-level data. Municipal-level data often relies on 5-year averages and is not available for the smallest towns that do not report income.
Families with Children by Income, 2015
Assets, All Households, 2015
How many families with children are struggling?Children add significant expense to a family budget, so it is not surprising that many Allegan County families with children live below the ALICE Threshold. Though more Allegan County families are headed by married parents, those families with a single parent are more likely to have income below the ALICE Threshold.
What assets do households have?Ownership of assets can contribute to stability of households. Yet few families in Allegan County own liquid assets, such as a savings account, 401(k) plan, or rental income, that are readily available to cover emergency expenses. Vehicles, the most common asset, depreciate over time. Homeownership, the next most common asset, can build wealth, but is not a liquid asset.
1 Vehicle
2 Vehicles
No Mortgage
3 Vehicles
With Mortgage
4+ Vehicles
0%
20%
40%
60%
80%
100%
120%
Vehicle Home Interest, Dividends, or RentalIncome
Perc
ent o
f Hou
seho
lds
260053
5%
54% 41%
14%
28%
23% 81%
18%
36%
9,416
2,389
667
0
1,000
2,000
3,000
4,000
5,000
6,000
7,000
8,000
9,000
10,000
0%
10%
20%
30%
40%
50%
60%
70%
80%
90%
100%
Married SingleFemale-Headed
SingleMale-
HeadedTo
tal H
ouse
hold
s
Perc
ent o
f Fam
ilies
with
Chi
ldre
n
260052
Poverty ALICE Above AT Total HH
Allegan County, 2015
Town Total HH% ALICE
& Poverty
Allegan City 2,071 52%
Allegan Township 1,659 37%
Casco Township 1,048 35%
Cheshire Township 803 39%
Clyde Township 733 58%
Dorr Township 2,418 29%
Douglas City 537 46%
Fennville City 571 62%
Fillmore Township 964 37%
Ganges Township 1,077 39%
Gun Plain Township 2,147 26%
Heath Township 1,128 29%
Holland City 2,665 50%
Hopkins Township 927 38%
Laketown Township 2,311 23%
Lee Township 1,301 54%
Leighton Township 1,761 23%
Manlius Township 1,120 34%
Martin Township 922 36%
Monterey Township 832 34%
Otsego City 1,729 51%
Otsego Township 2,069 38%
Overisel Township 974 26%
Plainwell City 1,628 48%
Salem Township 1,535 21%
Saugatuck City 434 38%
Saugatuck Township 1,239 30%
Trowbridge Township 1,051 38%
Valley Township 793 37%
Watson Township 782 35%
Wayland City 1,434 50%
Wayland Township 1,230 31%

UNIT
ED W
AY A
LICE
REP
ORT
– 20
17 U
PDAT
E FO
R M
ICHI
GAN
– EX
HIBI
T I
2015 Point-in-Time Data
Households by Income, 2007 to 2015
Population: 29,068 | Number of Households: 12,722Median Household Income: $38,829 (state average: $51,084)Unemployment Rate: 9.3% (state average: 7.2%)ALICE Households: 21% (state average: 25%); Poverty Households: 18% (state average: 15%)
How many households are struggling?ALICE is an acronym for Asset Limited, Income Constrained, Employed – households that earn more than the Federal Poverty Level, but less than the basic cost of living for the county (the ALICE Threshold, or AT). Combined, the number of poverty and ALICE households equals the total population struggling to afford basic needs. The number of households below the ALICE Threshold changes over time; households move in and out of poverty and ALICE as circumstances improve or worsen. The Great Recession, from 2007 to 2010, caused hardship for many families. Conditions started to improve in 2010 and 2012 for some, but not for all.
What does it cost to afford the basic necessities?The bare-minimum Household Survival Budget does not include any savings, leaving a household vulnerable to unexpected expenses. ALICE households typically earn above the Federal Poverty Level of $11,770 for a single adult and $24,250 for a family of four, but less than the Household Survival Budget.
ALICE IN ALPENA COUNTY
Household Survival Budget, Alpena County
SINGLE ADULT2 ADULTS, 1 INFANT,
1 PRESCHOOLERMonthly Costs
Housing $411 $643Child Care $– $936Food $184 $609Transportation $349 $697Health Care $184 $707Miscellaneous $128 $383Taxes $156 $238
Monthly Total $1,412 $4,213ANNUAL TOTAL $16,944 $50,556Hourly Wage $8.47 $25.28
Sources: 2015 Point-in-Time Data: American Community Survey. ALICE Demographics: American Community Survey; the ALICE Threshold. Budget: U.S. Department of Housing and Urban Development (HUD); U.S. Department of Agriculture (USDA); Bureau of Labor Statistics (BLS); Internal Revenue Service (IRS); Michigan Department of Treasury; Early Childhood Investment Corporation.
14% 17% 17% 18%
22% 23% 25% 21%
64% 60% 58%
61%
12,996 13,490
12,862 12,722
-
2,000
4,000
6,000
8,000
10,000
12,000
14,000
16,000
0%
10%
20%
30%
40%
50%
60%
70%
80%
90%
100%
2007 2010 2012 2015
Tota
l Hou
seho
lds
Perc
ent o
f Hou
seho
lds
260071
Poverty ALICE Above AT Total HH

UNIT
ED W
AY A
LICE
REP
ORT
– 20
17 U
PDAT
E FO
R M
ICHI
GAN
– EX
HIBI
T I
Note: Municipal-level data on this page is for Places and County Subdivisions, which include Census Designated Places (CDP). These are overlapping geographies so totals will not match county-level data. Municipal-level data often relies on 5-year averages and is not available for the smallest towns that do not report income.
Families with Children by Income, 2015
Assets, All Households, 2015
How many families with children are struggling?Children add significant expense to a family budget, so it is not surprising that many Alpena County families with children live below the ALICE Threshold. Though more Alpena County families are headed by married parents, those families with a single parent are more likely to have income below the ALICE Threshold.
What assets do households have?Ownership of assets can contribute to stability of households. Yet few families in Alpena County own liquid assets, such as a savings account, 401(k) plan, or rental income, that are readily available to cover emergency expenses. Vehicles, the most common asset, depreciate over time. Homeownership, the next most common asset, can build wealth, but is not a liquid asset.
1 Vehicle
2 Vehicles
No Mortgage
3 Vehicles
With Mortgage
4+ Vehicles
0%
10%
20%
30%
40%
50%
60%
70%
80%
90%
100%
Vehicle Home Interest, Dividends, or RentalIncome
Perc
ent o
f Hou
seho
lds
260073
11%
62%
36% 7%
16%
18%
82%
22%
46%
1,866
841
237
0
200
400
600
800
1,000
1,200
1,400
1,600
1,800
2,000
0%
10%
20%
30%
40%
50%
60%
70%
80%
90%
100%
Married SingleFemale-Headed
SingleMale-
HeadedTo
tal H
ouse
hold
s
Perc
ent o
f Fam
ilies
with
Chi
ldre
n
260072
Poverty ALICE Above AT Total HH
Alpena County, 2015
Town Total HH% ALICE
& Poverty
Alpena City 4,499 46%
Alpena Township 4,051 37%
Green Township 485 28%
Long Rapids Township 435 33%
Maple Ridge Township 707 31%
Ossineke Township 737 40%
Sanborn Township 861 41%
Wellington Township 114 36%
Wilson Township 833 29%

UNIT
ED W
AY A
LICE
REP
ORT
– 20
17 U
PDAT
E FO
R M
ICHI
GAN
– EX
HIBI
T I
2015 Point-in-Time Data
Households by Income, 2007 to 2015
Population: 23,267 | Number of Households: 9,689Median Household Income: $46,845 (state average: $51,084)Unemployment Rate: 9.7% (state average: 7.2%)ALICE Households: 28% (state average: 25%); Poverty Households: 13% (state average: 15%)
How many households are struggling?ALICE is an acronym for Asset Limited, Income Constrained, Employed – households that earn more than the Federal Poverty Level, but less than the basic cost of living for the county (the ALICE Threshold, or AT). Combined, the number of poverty and ALICE households equals the total population struggling to afford basic needs. The number of households below the ALICE Threshold changes over time; households move in and out of poverty and ALICE as circumstances improve or worsen. The Great Recession, from 2007 to 2010, caused hardship for many families. Conditions started to improve in 2010 and 2012 for some, but not for all.
What does it cost to afford the basic necessities?The bare-minimum Household Survival Budget does not include any savings, leaving a household vulnerable to unexpected expenses. ALICE households typically earn above the Federal Poverty Level of $11,770 for a single adult and $24,250 for a family of four, but less than the Household Survival Budget.
ALICE IN ANTRIM COUNTY
Household Survival Budget, Antrim County
SINGLE ADULT2 ADULTS, 1 INFANT,
1 PRESCHOOLERMonthly Costs
Housing $391 $658Child Care $– $1,440Food $184 $609Transportation $349 $697Health Care $184 $707Miscellaneous $126 $451Taxes $152 $397
Monthly Total $1,386 $4,959ANNUAL TOTAL $16,632 $59,508Hourly Wage $8.32 $29.75
Sources: 2015 Point-in-Time Data: American Community Survey. ALICE Demographics: American Community Survey; the ALICE Threshold. Budget: U.S. Department of Housing and Urban Development (HUD); U.S. Department of Agriculture (USDA); Bureau of Labor Statistics (BLS); Internal Revenue Service (IRS); Michigan Department of Treasury; Early Childhood Investment Corporation.
12% 13% 13% 13%
21% 27% 23% 28%
67%
60% 64%
59%
9,878 9,770 9,536 9,689
-
2,000
4,000
6,000
8,000
10,000
12,000
0%
10%
20%
30%
40%
50%
60%
70%
80%
90%
100%
2007 2010 2012 2015
Tota
l Hou
seho
lds
Perc
ent o
f Hou
seho
lds
260091
Poverty ALICE Above AT Total HH

UNIT
ED W
AY A
LICE
REP
ORT
– 20
17 U
PDAT
E FO
R M
ICHI
GAN
– EX
HIBI
T I
Note: Municipal-level data on this page is for Places and County Subdivisions, which include Census Designated Places (CDP). These are overlapping geographies so totals will not match county-level data. Municipal-level data often relies on 5-year averages and is not available for the smallest towns that do not report income.
Families with Children by Income, 2015
Assets, All Households, 2015
How many families with children are struggling?Children add significant expense to a family budget, so it is not surprising that many Antrim County families with children live below the ALICE Threshold. Though more Antrim County families are headed by married parents, those families with a single parent are more likely to have income below the ALICE Threshold.
What assets do households have?Ownership of assets can contribute to stability of households. Yet few families in Antrim County own liquid assets, such as a savings account, 401(k) plan, or rental income, that are readily available to cover emergency expenses. Vehicles, the most common asset, depreciate over time. Homeownership, the next most common asset, can build wealth, but is not a liquid asset.
1 Vehicle
2 Vehicles
No Mortgage
3 Vehicles
With Mortgage
4+ Vehicles
0%
20%
40%
60%
80%
100%
120%
Vehicle Home Interest, Dividends, or RentalIncome
Perc
ent o
f Hou
seho
lds
260093
12%
60%
18%
19%
31%
57%
69%
9%
25%
1,518
391
192
0
200
400
600
800
1,000
1,200
1,400
1,600
0%
10%
20%
30%
40%
50%
60%
70%
80%
90%
100%
Married SingleFemale-Headed
SingleMale-
HeadedTo
tal H
ouse
hold
s
Perc
ent o
f Fam
ilies
with
Chi
ldre
n
260092
Poverty ALICE Above AT Total HH
Antrim County, 2015
Town Total HH% ALICE
& Poverty
Banks Township 625 43%
Central Lake Township 874 42%
Chestonia Township 223 54%
Custer Township 487 39%
Echo Township 369 42%
Elk Rapids Township 1,256 40%
Forest Home Township 804 34%
Helena Township 448 34%
Jordan Township 354 43%
Kearney Township 706 41%
Mancelona Township 1,592 55%
Milton Township 907 27%
Star Township 370 49%
Torch Lake Township 553 23%
Warner Township 121 45%

UNIT
ED W
AY A
LICE
REP
ORT
– 20
17 U
PDAT
E FO
R M
ICHI
GAN
– EX
HIBI
T I
2015 Point-in-Time Data
Households by Income, 2007 to 2015
Population: 15,424 | Number of Households: 6,447Median Household Income: $38,307 (state average: $51,084)Unemployment Rate: 12% (state average: 7.2%)ALICE Households: 28% (state average: 25%); Poverty Households: 18% (state average: 15%)
How many households are struggling?ALICE is an acronym for Asset Limited, Income Constrained, Employed – households that earn more than the Federal Poverty Level, but less than the basic cost of living for the county (the ALICE Threshold, or AT). Combined, the number of poverty and ALICE households equals the total population struggling to afford basic needs. The number of households below the ALICE Threshold changes over time; households move in and out of poverty and ALICE as circumstances improve or worsen. The Great Recession, from 2007 to 2010, caused hardship for many families. Conditions started to improve in 2010 and 2012 for some, but not for all.
What does it cost to afford the basic necessities?The bare-minimum Household Survival Budget does not include any savings, leaving a household vulnerable to unexpected expenses. ALICE households typically earn above the Federal Poverty Level of $11,770 for a single adult and $24,250 for a family of four, but less than the Household Survival Budget.
ALICE IN ARENAC COUNTY
Household Survival Budget, Arenac County
SINGLE ADULT2 ADULTS, 1 INFANT,
1 PRESCHOOLERMonthly Costs
Housing $485 $643Child Care $– $936Food $184 $609Transportation $349 $697Health Care $184 $707Miscellaneous $137 $383Taxes $173 $238
Monthly Total $1,512 $4,213ANNUAL TOTAL $18,144 $50,556Hourly Wage $9.07 $25.28
Sources: 2015 Point-in-Time Data: American Community Survey. ALICE Demographics: American Community Survey; the ALICE Threshold. Budget: U.S. Department of Housing and Urban Development (HUD); U.S. Department of Agriculture (USDA); Bureau of Labor Statistics (BLS); Internal Revenue Service (IRS); Michigan Department of Treasury; Early Childhood Investment Corporation.
#N/A 16% 17% 18%
26% 24% 28%
58% 59% 54%
6,686 6,435 6,447
-
1,000
2,000
3,000
4,000
5,000
6,000
7,000
8,000
0%
10%
20%
30%
40%
50%
60%
70%
80%
90%
100%
2010 2012 2015
Tota
l Hou
seho
lds
Perc
ent o
f Hou
seho
lds
260111
Poverty ALICE Above AT Total HH
N/A

UNIT
ED W
AY A
LICE
REP
ORT
– 20
17 U
PDAT
E FO
R M
ICHI
GAN
– EX
HIBI
T I
Note: Municipal-level data on this page is for Places and County Subdivisions, which include Census Designated Places (CDP). These are overlapping geographies so totals will not match county-level data. Municipal-level data often relies on 5-year averages and is not available for the smallest towns that do not report income.
Families with Children by Income, 2015
Assets, All Households, 2015
How many families with children are struggling?Children add significant expense to a family budget, so it is not surprising that many Arenac County families with children live below the ALICE Threshold. Though more Arenac County families are headed by married parents, those families with a single parent are more likely to have income below the ALICE Threshold.
What assets do households have?Ownership of assets can contribute to stability of households. Yet few families in Arenac County own liquid assets, such as a savings account, 401(k) plan, or rental income, that are readily available to cover emergency expenses. Vehicles, the most common asset, depreciate over time. Homeownership, the next most common asset, can build wealth, but is not a liquid asset.
1 Vehicle
2 Vehicles
No Mortgage
3 Vehicles
With Mortgage
4+ Vehicles
0%
10%
20%
30%
40%
50%
60%
70%
80%
90%
100%
Vehicle Home Interest, Dividends, or RentalIncome
Perc
ent o
f Hou
seho
lds
260113
21%
49%
28%
12%
36%
50%
67%
15% 22% 983
399
123
0
200
400
600
800
1,000
1,200
0%
10%
20%
30%
40%
50%
60%
70%
80%
90%
100%
Married SingleFemale-Headed
SingleMale-
HeadedTo
tal H
ouse
hold
s
Perc
ent o
f Fam
ilies
with
Chi
ldre
n
260112
Poverty ALICE Above AT Total HH
Arenac County, 2015
Town Total HH% ALICE
& Poverty
Adams Township 220 40%
Arenac Township 362 48%
Au Gres City 423 60%
Au Gres Township 425 40%
Clayton Township 386 52%
Deep River Township 831 48%
Lincoln Township 371 42%
Mason Township 341 54%
Moffatt Township 457 35%
Omer City 133 44%
Sims Township 470 40%
Standish City 651 60%
Standish Township 705 38%
Turner Township 220 52%
Whitney Township 452 41%

UNIT
ED W
AY A
LICE
REP
ORT
– 20
17 U
PDAT
E FO
R M
ICHI
GAN
– EX
HIBI
T I
2015 Point-in-Time Data
Households by Income, 2007 to 2015
Population: 8,690 | Number of Households: 2,974Median Household Income: $39,803 (state average: $51,084)Unemployment Rate: 8.1% (state average: 7.2%)ALICE Households: 36% (state average: 25%); Poverty Households: 16% (state average: 15%)
How many households are struggling?ALICE is an acronym for Asset Limited, Income Constrained, Employed – households that earn more than the Federal Poverty Level, but less than the basic cost of living for the county (the ALICE Threshold, or AT). Combined, the number of poverty and ALICE households equals the total population struggling to afford basic needs. The number of households below the ALICE Threshold changes over time; households move in and out of poverty and ALICE as circumstances improve or worsen. The Great Recession, from 2007 to 2010, caused hardship for many families. Conditions started to improve in 2010 and 2012 for some, but not for all.
What does it cost to afford the basic necessities?The bare-minimum Household Survival Budget does not include any savings, leaving a household vulnerable to unexpected expenses. ALICE households typically earn above the Federal Poverty Level of $11,770 for a single adult and $24,250 for a family of four, but less than the Household Survival Budget.
ALICE IN BARAGA COUNTY
Household Survival Budget, Baraga County
SINGLE ADULT2 ADULTS, 1 INFANT,
1 PRESCHOOLERMonthly Costs
Housing $448 $643Child Care $– $1,229Food $184 $609Transportation $349 $697Health Care $184 $707Miscellaneous $133 $421Taxes $165 $328
Monthly Total $1,463 $4,634ANNUAL TOTAL $17,556 $55,608Hourly Wage $8.78 $27.80
Sources: 2015 Point-in-Time Data: American Community Survey. ALICE Demographics: American Community Survey; the ALICE Threshold. Budget: U.S. Department of Housing and Urban Development (HUD); U.S. Department of Agriculture (USDA); Bureau of Labor Statistics (BLS); Internal Revenue Service (IRS); Michigan Department of Treasury; Early Childhood Investment Corporation.
#N/A 13% 14% 16%
28% 31% 36%
59% 55%
48%
3,336 3,161
2,974
-
500
1,000
1,500
2,000
2,500
3,000
3,500
4,000
0%
10%
20%
30%
40%
50%
60%
70%
80%
90%
100%
2010 2012 2015
Tota
l Hou
seho
lds
Perc
ent o
f Hou
seho
lds
260131
Poverty ALICE Above AT Total HH
N/A

UNIT
ED W
AY A
LICE
REP
ORT
– 20
17 U
PDAT
E FO
R M
ICHI
GAN
– EX
HIBI
T I
Note: Municipal-level data on this page is for Places and County Subdivisions, which include Census Designated Places (CDP). These are overlapping geographies so totals will not match county-level data. Municipal-level data often relies on 5-year averages and is not available for the smallest towns that do not report income.
Families with Children by Income, 2015
Assets, All Households, 2015
How many families with children are struggling?Children add significant expense to a family budget, so it is not surprising that many Baraga County families with children live below the ALICE Threshold. Though more Baraga County families are headed by married parents, those families with a single parent are more likely to have income below the ALICE Threshold.
What assets do households have?Ownership of assets can contribute to stability of households. Yet few families in Baraga County own liquid assets, such as a savings account, 401(k) plan, or rental income, that are readily available to cover emergency expenses. Vehicles, the most common asset, depreciate over time. Homeownership, the next most common asset, can build wealth, but is not a liquid asset.
1 Vehicle
2 Vehicles
No Mortgage
3 Vehicles
With Mortgage
4+ Vehicles
0%
10%
20%
30%
40%
50%
60%
70%
80%
90%
100%
Vehicle Home Interest, Dividends, or RentalIncome
Perc
ent o
f Hou
seho
lds
260133
8%
58%
19%
24% 73%
18% 407
161
0
50
100
150
200
250
300
350
400
450
0%
10%
20%
30%
40%
50%
60%
70%
80%
90%
100%
Married SingleFemale-Headed
SingleMale-
HeadedTo
tal H
ouse
hold
s
Perc
ent o
f Fam
ilies
with
Chi
ldre
n
260132
Poverty ALICE Above AT Total HH
N/A
Baraga County, 2015
Town Total HH% ALICE
& Poverty
Arvon Township 153 49%
Baraga Township 882 57%
Covington Township 173 37%
L’Anse Township 1,674 53%
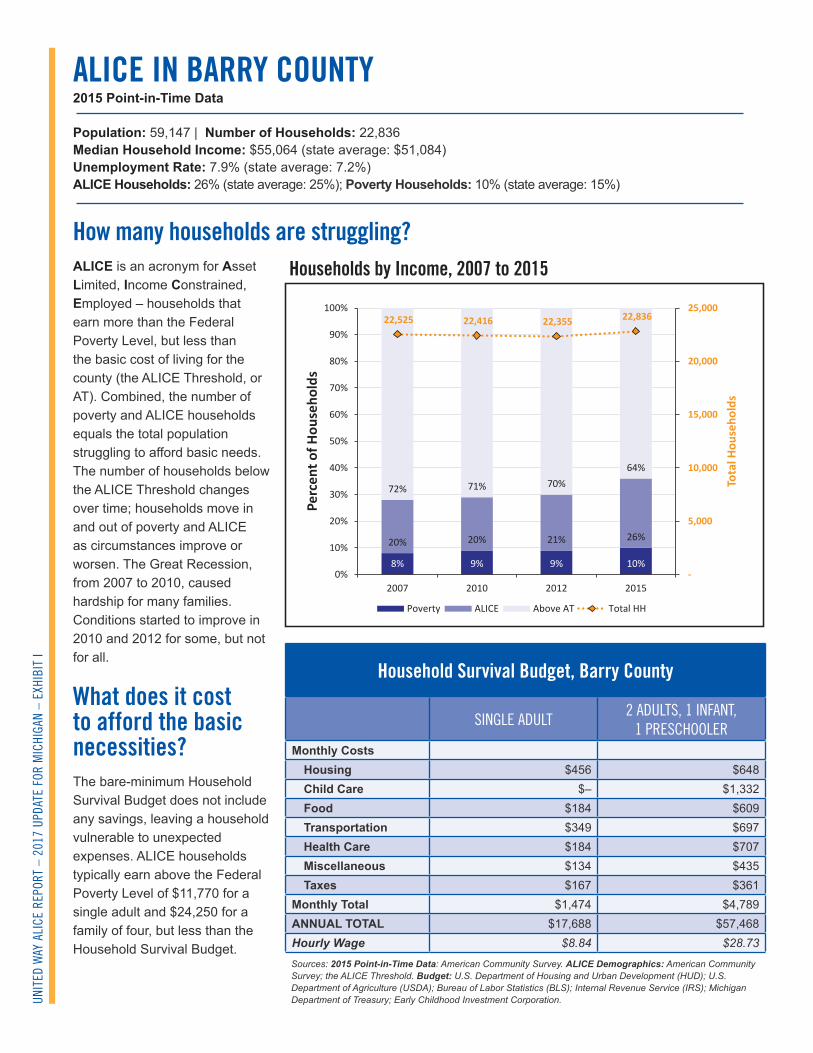
UNIT
ED W
AY A
LICE
REP
ORT
– 20
17 U
PDAT
E FO
R M
ICHI
GAN
– EX
HIBI
T I
2015 Point-in-Time Data
Households by Income, 2007 to 2015
Population: 59,147 | Number of Households: 22,836Median Household Income: $55,064 (state average: $51,084)Unemployment Rate: 7.9% (state average: 7.2%)ALICE Households: 26% (state average: 25%); Poverty Households: 10% (state average: 15%)
How many households are struggling?ALICE is an acronym for Asset Limited, Income Constrained, Employed – households that earn more than the Federal Poverty Level, but less than the basic cost of living for the county (the ALICE Threshold, or AT). Combined, the number of poverty and ALICE households equals the total population struggling to afford basic needs. The number of households below the ALICE Threshold changes over time; households move in and out of poverty and ALICE as circumstances improve or worsen. The Great Recession, from 2007 to 2010, caused hardship for many families. Conditions started to improve in 2010 and 2012 for some, but not for all.
What does it cost to afford the basic necessities?The bare-minimum Household Survival Budget does not include any savings, leaving a household vulnerable to unexpected expenses. ALICE households typically earn above the Federal Poverty Level of $11,770 for a single adult and $24,250 for a family of four, but less than the Household Survival Budget.
ALICE IN BARRY COUNTY
Household Survival Budget, Barry County
SINGLE ADULT2 ADULTS, 1 INFANT,
1 PRESCHOOLERMonthly Costs
Housing $456 $648Child Care $– $1,332Food $184 $609Transportation $349 $697Health Care $184 $707Miscellaneous $134 $435Taxes $167 $361
Monthly Total $1,474 $4,789ANNUAL TOTAL $17,688 $57,468Hourly Wage $8.84 $28.73
Sources: 2015 Point-in-Time Data: American Community Survey. ALICE Demographics: American Community Survey; the ALICE Threshold. Budget: U.S. Department of Housing and Urban Development (HUD); U.S. Department of Agriculture (USDA); Bureau of Labor Statistics (BLS); Internal Revenue Service (IRS); Michigan Department of Treasury; Early Childhood Investment Corporation.
8% 9% 9% 10%
20% 20% 21% 26%
72% 71% 70% 64%
22,525 22,416 22,355 22,836
-
5,000
10,000
15,000
20,000
25,000
0%
10%
20%
30%
40%
50%
60%
70%
80%
90%
100%
2007 2010 2012 2015
Tota
l Hou
seho
lds
Perc
ent o
f Hou
seho
lds
260151
Poverty ALICE Above AT Total HH

UNIT
ED W
AY A
LICE
REP
ORT
– 20
17 U
PDAT
E FO
R M
ICHI
GAN
– EX
HIBI
T I
Note: Municipal-level data on this page is for Places and County Subdivisions, which include Census Designated Places (CDP). These are overlapping geographies so totals will not match county-level data. Municipal-level data often relies on 5-year averages and is not available for the smallest towns that do not report income.
Families with Children by Income, 2015
Assets, All Households, 2015
How many families with children are struggling?Children add significant expense to a family budget, so it is not surprising that many Barry County families with children live below the ALICE Threshold. Though more Barry County families are headed by married parents, those families with a single parent are more likely to have income below the ALICE Threshold.
What assets do households have?Ownership of assets can contribute to stability of households. Yet few families in Barry County own liquid assets, such as a savings account, 401(k) plan, or rental income, that are readily available to cover emergency expenses. Vehicles, the most common asset, depreciate over time. Homeownership, the next most common asset, can build wealth, but is not a liquid asset.
1 Vehicle
2 Vehicles
No Mortgage
3 Vehicles
With Mortgage
4+ Vehicles
0%
10%
20%
30%
40%
50%
60%
70%
80%
90%
100%
Vehicle Home Interest, Dividends, or RentalIncome
Perc
ent o
f Hou
seho
lds
260153
7%
48%
14% 12%
34%
48%
81%
18%
38% 4,801
861 543
0
1,000
2,000
3,000
4,000
5,000
6,000
0%
10%
20%
30%
40%
50%
60%
70%
80%
90%
100%
Married SingleFemale-Headed
SingleMale-
HeadedTo
tal H
ouse
hold
s
Perc
ent o
f Fam
ilies
with
Chi
ldre
n
260152
Poverty ALICE Above AT Total HH
Barry County, 2015
Town Total HH% ALICE
& Poverty
Assyria Township 787 34%
Baltimore Township 808 36%
Barry Township 1,448 37%
Carlton Township 885 22%
Castleton Township 1,327 52%
Hastings Charter Township 1,059 42%
Hastings City 3,042 52%
Hope Township 1,382 38%
Irving Township 1,160 24%
Johnstown Township 1,287 30%
Maple Grove Township 536 33%
Orangeville Township 1,276 32%
Prairieville Township 1,238 21%
Rutland Charter Township 1,438 29%
Thornapple Township 2,813 32%
Woodland Township 736 36%
Yankee Springs Township 1,614 28%

UNIT
ED W
AY A
LICE
REP
ORT
– 20
17 U
PDAT
E FO
R M
ICHI
GAN
– EX
HIBI
T I
2015 Point-in-Time Data
Households by Income, 2007 to 2015
Population: 105,659 | Number of Households: 42,799Median Household Income: $46,560 (state average: $51,084)Unemployment Rate: 5.9% (state average: 7.2%)ALICE Households: 23% (state average: 25%); Poverty Households: 14% (state average: 15%)
How many households are struggling?ALICE is an acronym for Asset Limited, Income Constrained, Employed – households that earn more than the Federal Poverty Level, but less than the basic cost of living for the county (the ALICE Threshold, or AT). Combined, the number of poverty and ALICE households equals the total population struggling to afford basic needs. The number of households below the ALICE Threshold changes over time; households move in and out of poverty and ALICE as circumstances improve or worsen. The Great Recession, from 2007 to 2010, caused hardship for many families. Conditions started to improve in 2010 and 2012 for some, but not for all.
What does it cost to afford the basic necessities?The bare-minimum Household Survival Budget does not include any savings, leaving a household vulnerable to unexpected expenses. ALICE households typically earn above the Federal Poverty Level of $11,770 for a single adult and $24,250 for a family of four, but less than the Household Survival Budget.
ALICE IN BAY COUNTY
Household Survival Budget, Bay County
SINGLE ADULT2 ADULTS, 1 INFANT,
1 PRESCHOOLERMonthly Costs
Housing $418 $702Child Care $– $1,141Food $184 $609Transportation $349 $697Health Care $184 $707Miscellaneous $129 $418Taxes $158 $319
Monthly Total $1,422 $4,593ANNUAL TOTAL $17,064 $55,116Hourly Wage $8.53 $27.56
Sources: 2015 Point-in-Time Data: American Community Survey. ALICE Demographics: American Community Survey; the ALICE Threshold. Budget: U.S. Department of Housing and Urban Development (HUD); U.S. Department of Agriculture (USDA); Bureau of Labor Statistics (BLS); Internal Revenue Service (IRS); Michigan Department of Treasury; Early Childhood Investment Corporation.
11% 15% 13% 14%
24% 19% 21% 23%
65% 66% 66% 63%
43,987 44,064 43,967 42,799
-
5,000
10,000
15,000
20,000
25,000
30,000
35,000
40,000
45,000
50,000
0%
10%
20%
30%
40%
50%
60%
70%
80%
90%
100%
2007 2010 2012 2015
Tota
l Hou
seho
lds
Perc
ent o
f Hou
seho
lds
260171
Poverty ALICE Above AT Total HH

UNIT
ED W
AY A
LICE
REP
ORT
– 20
17 U
PDAT
E FO
R M
ICHI
GAN
– EX
HIBI
T I
Note: Municipal-level data on this page is for Places and County Subdivisions, which include Census Designated Places (CDP). These are overlapping geographies so totals will not match county-level data. Municipal-level data often relies on 5-year averages and is not available for the smallest towns that do not report income.
Families with Children by Income, 2015
Assets, All Households, 2015
How many families with children are struggling?Children add significant expense to a family budget, so it is not surprising that many Bay County families with children live below the ALICE Threshold. Though more Bay County families are headed by married parents, those families with a single parent are more likely to have income below the ALICE Threshold.
What assets do households have?Ownership of assets can contribute to stability of households. Yet few families in Bay County own liquid assets, such as a savings account, 401(k) plan, or rental income, that are readily available to cover emergency expenses. Vehicles, the most common asset, depreciate over time. Homeownership, the next most common asset, can build wealth, but is not a liquid asset.
1 Vehicle
2 Vehicles
No Mortgage
3 Vehicles
With Mortgage
4+ Vehicles
0%
10%
20%
30%
40%
50%
60%
70%
80%
90%
100%
Vehicle Home Interest, Dividends, or RentalIncome
Perc
ent o
f Hou
seho
lds
260173
5%
45%
15% 10%
36%
38%
85%
19%
47%
6,982
3,021
988
0
1,000
2,000
3,000
4,000
5,000
6,000
7,000
8,000
0%
10%
20%
30%
40%
50%
60%
70%
80%
90%
100%
Married SingleFemale-Headed
SingleMale-
HeadedTo
tal H
ouse
hold
s
Perc
ent o
f Fam
ilies
with
Chi
ldre
n
260172
Poverty ALICE Above AT Total HH
Bay County, 2015
Town Total HH% ALICE
& Poverty
Auburn City 954 29%
Bangor Charter Township 6,044 38%
Bay City 14,139 49%
Beaver Township 1,028 26%
Essexville City 1,403 25%
Frankenlust Township 1,427 19%
Fraser Township 1,315 33%
Garfield Township 663 28%
Gibson Township 447 32%
Hampton Charter Township 4,181 42%
Kawkawlin Township 1,956 28%
Merritt Township 521 21%
Monitor Charter Township 4,263 25%
Mount Forest Township 561 34%
Pinconning City 567 56%
Pinconning Township 914 34%
Portsmouth Charter Township 1,351 26%
Williams Charter Township 1,768 24%

UNIT
ED W
AY A
LICE
REP
ORT
– 20
17 U
PDAT
E FO
R M
ICHI
GAN
– EX
HIBI
T I
2015 Point-in-Time Data
Households by Income, 2007 to 2015
Population: 17,437 | Number of Households: 7,225Median Household Income: $47,388 (state average: $51,084)Unemployment Rate: 8.4% (state average: 7.2%)ALICE Households: 27% (state average: 25%); Poverty Households: 10% (state average: 15%)
How many households are struggling?ALICE is an acronym for Asset Limited, Income Constrained, Employed – households that earn more than the Federal Poverty Level, but less than the basic cost of living for the county (the ALICE Threshold, or AT). Combined, the number of poverty and ALICE households equals the total population struggling to afford basic needs. The number of households below the ALICE Threshold changes over time; households move in and out of poverty and ALICE as circumstances improve or worsen. The Great Recession, from 2007 to 2010, caused hardship for many families. Conditions started to improve in 2010 and 2012 for some, but not for all.
What does it cost to afford the basic necessities?The bare-minimum Household Survival Budget does not include any savings, leaving a household vulnerable to unexpected expenses. ALICE households typically earn above the Federal Poverty Level of $11,770 for a single adult and $24,250 for a family of four, but less than the Household Survival Budget.
ALICE IN BENZIE COUNTY
Household Survival Budget, Benzie County
SINGLE ADULT2 ADULTS, 1 INFANT,
1 PRESCHOOLERMonthly Costs
Housing $549 $680Child Care $– $1,170Food $184 $609Transportation $349 $697Health Care $184 $707Miscellaneous $145 $418Taxes $188 $321
Monthly Total $1,599 $4,602ANNUAL TOTAL $19,188 $55,224Hourly Wage $9.59 $27.61
Sources: 2015 Point-in-Time Data: American Community Survey. ALICE Demographics: American Community Survey; the ALICE Threshold. Budget: U.S. Department of Housing and Urban Development (HUD); U.S. Department of Agriculture (USDA); Bureau of Labor Statistics (BLS); Internal Revenue Service (IRS); Michigan Department of Treasury; Early Childhood Investment Corporation.
#N/A 10% 11% 10%
30% 21% 27%
60%
68% 63%
7,366 7,520 7,225
-
1,000
2,000
3,000
4,000
5,000
6,000
7,000
8,000
0%
10%
20%
30%
40%
50%
60%
70%
80%
90%
100%
2010 2012 2015
Tota
l Hou
seho
lds
Perc
ent o
f Hou
seho
lds
260191
Poverty ALICE Above AT Total HH
N/A

UNIT
ED W
AY A
LICE
REP
ORT
– 20
17 U
PDAT
E FO
R M
ICHI
GAN
– EX
HIBI
T I
Note: Municipal-level data on this page is for Places and County Subdivisions, which include Census Designated Places (CDP). These are overlapping geographies so totals will not match county-level data. Municipal-level data often relies on 5-year averages and is not available for the smallest towns that do not report income.
Families with Children by Income, 2015
Assets, All Households, 2015
How many families with children are struggling?Children add significant expense to a family budget, so it is not surprising that many Benzie County families with children live below the ALICE Threshold. Though more Benzie County families are headed by married parents, those families with a single parent are more likely to have income below the ALICE Threshold.
What assets do households have?Ownership of assets can contribute to stability of households. Yet few families in Benzie County own liquid assets, such as a savings account, 401(k) plan, or rental income, that are readily available to cover emergency expenses. Vehicles, the most common asset, depreciate over time. Homeownership, the next most common asset, can build wealth, but is not a liquid asset.
1 Vehicle
2 Vehicles
No Mortgage
3 Vehicles
With Mortgage
4+ Vehicles
0%
20%
40%
60%
80%
100%
120%
Vehicle Home Interest, Dividends, or RentalIncome
Perc
ent o
f Hou
seho
lds
260193
6%
31% 33% 16%
40% 30%
78%
29% 37%
1,002
369
154
0
200
400
600
800
1,000
1,200
0%
10%
20%
30%
40%
50%
60%
70%
80%
90%
100%
Married SingleFemale-Headed
SingleMale-
HeadedTo
tal H
ouse
hold
s
Perc
ent o
f Fam
ilies
with
Chi
ldre
n
260192
Poverty ALICE Above AT Total HH
Benzie County, 2015
Town Total HH% ALICE
& Poverty
Almira Township 1,446 33%
Benzonia Township 1,044 34%
Blaine Township 239 30%
Colfax Township 261 40%
Crystal Lake Township 497 35%
Frankfort City 578 47%
Gilmore Township 322 35%
Homestead Township 945 40%
Inland Township 839 41%
Joyfield Township 313 42%
Lake Township 355 24%
Platte Township 153 46%
Weldon Township 233 52%

UNIT
ED W
AY A
LICE
REP
ORT
– 20
17 U
PDAT
E FO
R M
ICHI
GAN
– EX
HIBI
T I
2015 Point-in-Time Data
Households by Income, 2007 to 2015
Population: 154,636 | Number of Households: 64,279Median Household Income: $46,649 (state average: $51,084)Unemployment Rate: 8% (state average: 7.2%)ALICE Households: 22% (state average: 25%); Poverty Households: 15% (state average: 15%)
How many households are struggling?ALICE is an acronym for Asset Limited, Income Constrained, Employed – households that earn more than the Federal Poverty Level, but less than the basic cost of living for the county (the ALICE Threshold, or AT). Combined, the number of poverty and ALICE households equals the total population struggling to afford basic needs. The number of households below the ALICE Threshold changes over time; households move in and out of poverty and ALICE as circumstances improve or worsen. The Great Recession, from 2007 to 2010, caused hardship for many families. Conditions started to improve in 2010 and 2012 for some, but not for all.
What does it cost to afford the basic necessities?The bare-minimum Household Survival Budget does not include any savings, leaving a household vulnerable to unexpected expenses. ALICE households typically earn above the Federal Poverty Level of $11,770 for a single adult and $24,250 for a family of four, but less than the Household Survival Budget.
ALICE IN BERRIEN COUNTY
Household Survival Budget, Berrien County
SINGLE ADULT2 ADULTS, 1 INFANT,
1 PRESCHOOLERMonthly Costs
Housing $492 $730Child Care $– $965Food $184 $609Transportation $349 $697Health Care $184 $707Miscellaneous $138 $398Taxes $175 $273
Monthly Total $1,522 $4,379ANNUAL TOTAL $18,264 $52,548Hourly Wage $9.13 $26.27
Sources: 2015 Point-in-Time Data: American Community Survey. ALICE Demographics: American Community Survey; the ALICE Threshold. Budget: U.S. Department of Housing and Urban Development (HUD); U.S. Department of Agriculture (USDA); Bureau of Labor Statistics (BLS); Internal Revenue Service (IRS); Michigan Department of Treasury; Early Childhood Investment Corporation.
15% 15% 18% 15%
24% 29% 23%
22%
61% 56%
59% 63%
63,645 59,915 60,223
64,279
-
10,000
20,000
30,000
40,000
50,000
60,000
70,000
0%
10%
20%
30%
40%
50%
60%
70%
80%
90%
100%
2007 2010 2012 2015
Tota
l Hou
seho
lds
Perc
ent o
f Hou
seho
lds
260211
Poverty ALICE Above AT Total HH

UNIT
ED W
AY A
LICE
REP
ORT
– 20
17 U
PDAT
E FO
R M
ICHI
GAN
– EX
HIBI
T I
Note: Municipal-level data on this page is for Places and County Subdivisions, which include Census Designated Places (CDP). These are overlapping geographies so totals will not match county-level data. Municipal-level data often relies on 5-year averages and is not available for the smallest towns that do not report income.
Families with Children by Income, 2015
Assets, All Households, 2015
How many families with children are struggling?Children add significant expense to a family budget, so it is not surprising that many Berrien County families with children live below the ALICE Threshold. Though more Berrien County families are headed by married parents, those families with a single parent are more likely to have income below the ALICE Threshold.
What assets do households have?Ownership of assets can contribute to stability of households. Yet few families in Berrien County own liquid assets, such as a savings account, 401(k) plan, or rental income, that are readily available to cover emergency expenses. Vehicles, the most common asset, depreciate over time. Homeownership, the next most common asset, can build wealth, but is not a liquid asset.
1 Vehicle
2 Vehicles
No Mortgage
3 Vehicles
With Mortgage
4+ Vehicles
0%
10%
20%
30%
40%
50%
60%
70%
80%
90%
100%
Vehicle Home Interest, Dividends, or RentalIncome
Perc
ent o
f Hou
seho
lds
260213
8%
55%
22% 13%
23%
24%
79%
22%
54%
9,940
5,613
1,125
0
2,000
4,000
6,000
8,000
10,000
12,000
0%
10%
20%
30%
40%
50%
60%
70%
80%
90%
100%
Married SingleFemale-Headed
SingleMale-
HeadedTo
tal H
ouse
hold
s
Perc
ent o
f Fam
ilies
with
Chi
ldre
n
260212
Poverty ALICE Above AT Total HH
Berrien County, 2015
Town Total HH% ALICE
& Poverty
Bainbridge Township 1,062 25%
Baroda Township 1,181 37%
Benton Charter Township 5,606 58%
Benton Harbor City 3,902 77%
Berrien Township 1,724 26%
Bertrand Township 1,016 22%
Bridgman City 872 41%
Buchanan City 2,027 44%
Buchanan Township 1,295 33%
Chikaming Township 1,442 22%
Coloma Charter Township 2,045 30%
Coloma City 627 40%
Galien Township 593 37%
Hagar Township 1,535 37%
Lake Charter Township 1,218 27%
Lincoln Charter Township 6,006 24%
New Buffalo City 823 39%
New Buffalo Township 1,020 28%
Niles City 4,567 54%
Niles Township 5,276 38%
Oronoko Charter Township 2,312 45%
Pipestone Township 862 28%
Royalton Township 1,548 15%
Sodus Township 833 32%
St. Joseph Charter Township 4,094 21%
St. Joseph City 4,013 34%
Three Oaks Township 1,063 43%
Watervliet City 638 44%
Watervliet Township 1,243 45%
Weesaw Township 724 37%

UNIT
ED W
AY A
LICE
REP
ORT
– 20
17 U
PDAT
E FO
R M
ICHI
GAN
– EX
HIBI
T I
2015 Point-in-Time Data
Households by Income, 2007 to 2015
Population: 43,706 | Number of Households: 16,022Median Household Income: $44,373 (state average: $51,084)Unemployment Rate: 7% (state average: 7.2%)ALICE Households: 31% (state average: 25%); Poverty Households: 15% (state average: 15%)
How many households are struggling?ALICE is an acronym for Asset Limited, Income Constrained, Employed – households that earn more than the Federal Poverty Level, but less than the basic cost of living for the county (the ALICE Threshold, or AT). Combined, the number of poverty and ALICE households equals the total population struggling to afford basic needs. The number of households below the ALICE Threshold changes over time; households move in and out of poverty and ALICE as circumstances improve or worsen. The Great Recession, from 2007 to 2010, caused hardship for many families. Conditions started to improve in 2010 and 2012 for some, but not for all.
What does it cost to afford the basic necessities?The bare-minimum Household Survival Budget does not include any savings, leaving a household vulnerable to unexpected expenses. ALICE households typically earn above the Federal Poverty Level of $11,770 for a single adult and $24,250 for a family of four, but less than the Household Survival Budget.
ALICE IN BRANCH COUNTY
Household Survival Budget, Branch County
SINGLE ADULT2 ADULTS, 1 INFANT,
1 PRESCHOOLERMonthly Costs
Housing $512 $655Child Care $– $1,069Food $184 $609Transportation $349 $697Health Care $184 $707Miscellaneous $141 $402Taxes $180 $282
Monthly Total $1,550 $4,421ANNUAL TOTAL $18,600 $53,052Hourly Wage $9.30 $26.53
Sources: 2015 Point-in-Time Data: American Community Survey. ALICE Demographics: American Community Survey; the ALICE Threshold. Budget: U.S. Department of Housing and Urban Development (HUD); U.S. Department of Agriculture (USDA); Bureau of Labor Statistics (BLS); Internal Revenue Service (IRS); Michigan Department of Treasury; Early Childhood Investment Corporation.
13% 15% 15% 15%
24% 27% 27% 31%
63% 58% 58%
54%
16,578 16,054 15,640 16,022
-
2,000
4,000
6,000
8,000
10,000
12,000
14,000
16,000
18,000
0%
10%
20%
30%
40%
50%
60%
70%
80%
90%
100%
2007 2010 2012 2015
Tota
l Hou
seho
lds
Perc
ent o
f Hou
seho
lds
260231
Poverty ALICE Above AT Total HH

UNIT
ED W
AY A
LICE
REP
ORT
– 20
17 U
PDAT
E FO
R M
ICHI
GAN
– EX
HIBI
T I
Note: Municipal-level data on this page is for Places and County Subdivisions, which include Census Designated Places (CDP). These are overlapping geographies so totals will not match county-level data. Municipal-level data often relies on 5-year averages and is not available for the smallest towns that do not report income.
Families with Children by Income, 2015
Assets, All Households, 2015
How many families with children are struggling?Children add significant expense to a family budget, so it is not surprising that many Branch County families with children live below the ALICE Threshold. Though more Branch County families are headed by married parents, those families with a single parent are more likely to have income below the ALICE Threshold.
What assets do households have?Ownership of assets can contribute to stability of households. Yet few families in Branch County own liquid assets, such as a savings account, 401(k) plan, or rental income, that are readily available to cover emergency expenses. Vehicles, the most common asset, depreciate over time. Homeownership, the next most common asset, can build wealth, but is not a liquid asset.
1 Vehicle
2 Vehicles
No Mortgage
3 Vehicles
With Mortgage
4+ Vehicles
0%
10%
20%
30%
40%
50%
60%
70%
80%
90%
100%
Vehicle Home Interest, Dividends, or RentalIncome
Perc
ent o
f Hou
seho
lds
260233
16%
42%
23%
20%
43%
46%
64%
15%
31% 3,042
1,061
426
0
500
1,000
1,500
2,000
2,500
3,000
3,500
0%
10%
20%
30%
40%
50%
60%
70%
80%
90%
100%
Married SingleFemale-Headed
SingleMale-
HeadedTo
tal H
ouse
hold
s
Perc
ent o
f Fam
ilies
with
Chi
ldre
n
260232
Poverty ALICE Above AT Total HH
Branch County, 2015
Town Total HH% ALICE
& Poverty
Algansee Township 669 43%
Batavia Township 518 42%
Bethel Township 487 41%
Bronson City 854 59%
Bronson Township 490 39%
Butler Township 447 50%
California Township 329 60%
Coldwater City 4,079 56%
Coldwater Township 1,158 43%
Gilead Township 266 42%
Girard Township 787 38%
Kinderhook Township 658 30%
Matteson Township 444 37%
Noble Township 190 27%
Ovid Township 994 31%
Quincy Township 1,670 44%
Sherwood Township 804 37%
Union Township 1,178 46%

UNIT
ED W
AY A
LICE
REP
ORT
– 20
17 U
PDAT
E FO
R M
ICHI
GAN
– EX
HIBI
T I
2015 Point-in-Time Data
Households by Income, 2007 to 2015
Population: 134,314 | Number of Households: 53,076Median Household Income: $43,084 (state average: $51,084)Unemployment Rate: 8.4% (state average: 7.2%)ALICE Households: 26% (state average: 25%); Poverty Households: 15% (state average: 15%)
How many households are struggling?ALICE is an acronym for Asset Limited, Income Constrained, Employed – households that earn more than the Federal Poverty Level, but less than the basic cost of living for the county (the ALICE Threshold, or AT). Combined, the number of poverty and ALICE households equals the total population struggling to afford basic needs. The number of households below the ALICE Threshold changes over time; households move in and out of poverty and ALICE as circumstances improve or worsen. The Great Recession, from 2007 to 2010, caused hardship for many families. Conditions started to improve in 2010 and 2012 for some, but not for all.
What does it cost to afford the basic necessities?The bare-minimum Household Survival Budget does not include any savings, leaving a household vulnerable to unexpected expenses. ALICE households typically earn above the Federal Poverty Level of $11,770 for a single adult and $24,250 for a family of four, but less than the Household Survival Budget.
ALICE IN CALHOUN COUNTY
Household Survival Budget, Calhoun County
SINGLE ADULT2 ADULTS, 1 INFANT,
1 PRESCHOOLERMonthly Costs
Housing $418 $689Child Care $– $1,044Food $184 $609Transportation $349 $697Health Care $184 $707Miscellaneous $129 $403Taxes $158 $285
Monthly Total $1,422 $4,434ANNUAL TOTAL $17,064 $53,208Hourly Wage $8.53 $26.60
Sources: 2015 Point-in-Time Data: American Community Survey. ALICE Demographics: American Community Survey; the ALICE Threshold. Budget: U.S. Department of Housing and Urban Development (HUD); U.S. Department of Agriculture (USDA); Bureau of Labor Statistics (BLS); Internal Revenue Service (IRS); Michigan Department of Treasury; Early Childhood Investment Corporation.
16% 15% 17% 15%
21% 26% 29% 26%
63% 59%
54% 59%
54,146 52,600 53,182 53,076
-
10,000
20,000
30,000
40,000
50,000
60,000
0%
10%
20%
30%
40%
50%
60%
70%
80%
90%
100%
2007 2010 2012 2015
Tota
l Hou
seho
lds
Perc
ent o
f Hou
seho
lds
260251
Poverty ALICE Above AT Total HH

UNIT
ED W
AY A
LICE
REP
ORT
– 20
17 U
PDAT
E FO
R M
ICHI
GAN
– EX
HIBI
T I
Note: Municipal-level data on this page is for Places and County Subdivisions, which include Census Designated Places (CDP). These are overlapping geographies so totals will not match county-level data. Municipal-level data often relies on 5-year averages and is not available for the smallest towns that do not report income.
Families with Children by Income, 2015
Assets, All Households, 2015
How many families with children are struggling?Children add significant expense to a family budget, so it is not surprising that many Calhoun County families with children live below the ALICE Threshold. Though more Calhoun County families are headed by married parents, those families with a single parent are more likely to have income below the ALICE Threshold.
What assets do households have?Ownership of assets can contribute to stability of households. Yet few families in Calhoun County own liquid assets, such as a savings account, 401(k) plan, or rental income, that are readily available to cover emergency expenses. Vehicles, the most common asset, depreciate over time. Homeownership, the next most common asset, can build wealth, but is not a liquid asset.
1 Vehicle
2 Vehicles
No Mortgage
3 Vehicles
With Mortgage
4+ Vehicles
0%
10%
20%
30%
40%
50%
60%
70%
80%
90%
100%
Vehicle Home Interest, Dividends, or RentalIncome
Perc
ent o
f Hou
seho
lds
260253
9%
52%
12%
12%
39%
60%
79%
9%
28%
8,281
3,717
1,324
0
1,000
2,000
3,000
4,000
5,000
6,000
7,000
8,000
9,000
0%
10%
20%
30%
40%
50%
60%
70%
80%
90%
100%
Married SingleFemale-Headed
SingleMale-
HeadedTo
tal H
ouse
hold
s
Perc
ent o
f Fam
ilies
with
Chi
ldre
n
260252
Poverty ALICE Above AT Total HH
Calhoun County, 2015
Town Total HH% ALICE
& Poverty
Albion City 2,894 61%
Albion Township 373 43%
Athens Township 911 31%
Battle Creek City 20,629 47%
Bedford Charter Township 3,736 32%
Burlington Township 687 28%
Clarence Township 822 31%
Clarendon Township 400 31%
Convis Township 607 34%
Eckford Township 525 27%
Emmett Charter Township 4,704 35%
Fredonia Township 615 31%
Homer Township 1,086 46%
Lee Township 356 30%
Leroy Township 1,438 23%
Marengo Township 863 29%
Marshall City 3,074 35%
Marshall Township 1,204 22%
Newton Township 914 26%
Pennfield Charter Township 3,686 40%
Sheridan Township 723 42%
Springfield City 1,994 52%
Tekonsha Township 609 36%

UNIT
ED W
AY A
LICE
REP
ORT
– 20
17 U
PDAT
E FO
R M
ICHI
GAN
– EX
HIBI
T I
2015 Point-in-Time Data
Households by Income, 2007 to 2015
Population: 51,952 | Number of Households: 20,101Median Household Income: $46,570 (state average: $51,084)Unemployment Rate: 9.7% (state average: 7.2%)ALICE Households: 29% (state average: 25%); Poverty Households: 13% (state average: 15%)
How many households are struggling?ALICE is an acronym for Asset Limited, Income Constrained, Employed – households that earn more than the Federal Poverty Level, but less than the basic cost of living for the county (the ALICE Threshold, or AT). Combined, the number of poverty and ALICE households equals the total population struggling to afford basic needs. The number of households below the ALICE Threshold changes over time; households move in and out of poverty and ALICE as circumstances improve or worsen. The Great Recession, from 2007 to 2010, caused hardship for many families. Conditions started to improve in 2010 and 2012 for some, but not for all.
What does it cost to afford the basic necessities?The bare-minimum Household Survival Budget does not include any savings, leaving a household vulnerable to unexpected expenses. ALICE households typically earn above the Federal Poverty Level of $11,770 for a single adult and $24,250 for a family of four, but less than the Household Survival Budget.
ALICE IN CASS COUNTY
Household Survival Budget, Cass County
SINGLE ADULT2 ADULTS, 1 INFANT,
1 PRESCHOOLERMonthly Costs
Housing $523 $689Child Care $– $1,229Food $184 $609Transportation $349 $697Health Care $184 $707Miscellaneous $142 $427Taxes $182 $342
Monthly Total $1,564 $4,700ANNUAL TOTAL $18,768 $56,400Hourly Wage $9.38 $28.20
Sources: 2015 Point-in-Time Data: American Community Survey. ALICE Demographics: American Community Survey; the ALICE Threshold. Budget: U.S. Department of Housing and Urban Development (HUD); U.S. Department of Agriculture (USDA); Bureau of Labor Statistics (BLS); Internal Revenue Service (IRS); Michigan Department of Treasury; Early Childhood Investment Corporation.
12% 14% 12% 13%
18% 21% 27% 29%
70% 65%
61% 58%
20,897 19,757 19,742 20,101
-
5,000
10,000
15,000
20,000
25,000
0%
10%
20%
30%
40%
50%
60%
70%
80%
90%
100%
2007 2010 2012 2015
Tota
l Hou
seho
lds
Perc
ent o
f Hou
seho
lds
260271
Poverty ALICE Above AT Total HH

UNIT
ED W
AY A
LICE
REP
ORT
– 20
17 U
PDAT
E FO
R M
ICHI
GAN
– EX
HIBI
T I
Note: Municipal-level data on this page is for Places and County Subdivisions, which include Census Designated Places (CDP). These are overlapping geographies so totals will not match county-level data. Municipal-level data often relies on 5-year averages and is not available for the smallest towns that do not report income.
Families with Children by Income, 2015
Assets, All Households, 2015
How many families with children are struggling?Children add significant expense to a family budget, so it is not surprising that many Cass County families with children live below the ALICE Threshold. Though more Cass County families are headed by married parents, those families with a single parent are more likely to have income below the ALICE Threshold.
What assets do households have?Ownership of assets can contribute to stability of households. Yet few families in Cass County own liquid assets, such as a savings account, 401(k) plan, or rental income, that are readily available to cover emergency expenses. Vehicles, the most common asset, depreciate over time. Homeownership, the next most common asset, can build wealth, but is not a liquid asset.
1 Vehicle
2 Vehicles
No Mortgage
3 Vehicles
With Mortgage
4+ Vehicles
0%
20%
40%
60%
80%
100%
120%
Vehicle Home Interest, Dividends, or RentalIncome
Perc
ent o
f Hou
seho
lds
260273
8%
56%
27% 14%
28%
36%
78%
16%
37%
3,268
1,216
489
0
500
1,000
1,500
2,000
2,500
3,000
3,500
0%
10%
20%
30%
40%
50%
60%
70%
80%
90%
100%
Married SingleFemale-Headed
SingleMale-
HeadedTo
tal H
ouse
hold
s
Perc
ent o
f Fam
ilies
with
Chi
ldre
n
260272
Poverty ALICE Above AT Total HH
Cass County, 2015
Town Total HH% ALICE
& Poverty
Calvin Township 700 44%
Dowagiac City 2,187 70%
Howard Township 2,524 37%
Jefferson Township 906 31%
Lagrange Township 1,398 54%
Marcellus Township 884 41%
Mason Township 997 41%
Milton Township 1,449 32%
Newberg Township 596 37%
Ontwa Township 2,477 38%
Penn Township 753 35%
Pokagon Township 880 46%
Porter Township 1,574 34%
Silver Creek Township 1,277 35%
Volinia Township 428 35%
Wayne Township 1,071 46%

UNIT
ED W
AY A
LICE
REP
ORT
– 20
17 U
PDAT
E FO
R M
ICHI
GAN
– EX
HIBI
T I
2015 Point-in-Time Data
Households by Income, 2007 to 2015
Population: 26,134 | Number of Households: 10,794Median Household Income: $46,554 (state average: $51,084)Unemployment Rate: 7.8% (state average: 7.2%)ALICE Households: 27% (state average: 25%); Poverty Households: 12% (state average: 15%)
How many households are struggling?ALICE is an acronym for Asset Limited, Income Constrained, Employed – households that earn more than the Federal Poverty Level, but less than the basic cost of living for the county (the ALICE Threshold, or AT). Combined, the number of poverty and ALICE households equals the total population struggling to afford basic needs. The number of households below the ALICE Threshold changes over time; households move in and out of poverty and ALICE as circumstances improve or worsen. The Great Recession, from 2007 to 2010, caused hardship for many families. Conditions started to improve in 2010 and 2012 for some, but not for all.
What does it cost to afford the basic necessities?The bare-minimum Household Survival Budget does not include any savings, leaving a household vulnerable to unexpected expenses. ALICE households typically earn above the Federal Poverty Level of $11,770 for a single adult and $24,250 for a family of four, but less than the Household Survival Budget.
ALICE IN CHARLEVOIX COUNTY
Household Survival Budget, Charlevoix County
SINGLE ADULT2 ADULTS, 1 INFANT,
1 PRESCHOOLERMonthly Costs
Housing $533 $660Child Care $– $1,229Food $184 $609Transportation $349 $697Health Care $184 $707Miscellaneous $143 $424Taxes $184 $333
Monthly Total $1,577 $4,659ANNUAL TOTAL $18,924 $55,908Hourly Wage $9.46 $27.95
Sources: 2015 Point-in-Time Data: American Community Survey. ALICE Demographics: American Community Survey; the ALICE Threshold. Budget: U.S. Department of Housing and Urban Development (HUD); U.S. Department of Agriculture (USDA); Bureau of Labor Statistics (BLS); Internal Revenue Service (IRS); Michigan Department of Treasury; Early Childhood Investment Corporation.
9% 12% 13% 12%
17% 21% 28% 27%
74%
67%
59% 61%
11,707 10,973
10,191 10,794
-
2,000
4,000
6,000
8,000
10,000
12,000
14,000
0%
10%
20%
30%
40%
50%
60%
70%
80%
90%
100%
2007 2010 2012 2015
Tota
l Hou
seho
lds
Perc
ent o
f Hou
seho
lds
260291
Poverty ALICE Above AT Total HH

UNIT
ED W
AY A
LICE
REP
ORT
– 20
17 U
PDAT
E FO
R M
ICHI
GAN
– EX
HIBI
T I
Note: Municipal-level data on this page is for Places and County Subdivisions, which include Census Designated Places (CDP). These are overlapping geographies so totals will not match county-level data. Municipal-level data often relies on 5-year averages and is not available for the smallest towns that do not report income.
Families with Children by Income, 2015
Assets, All Households, 2015
How many families with children are struggling?Children add significant expense to a family budget, so it is not surprising that many Charlevoix County families with children live below the ALICE Threshold. Though more Charlevoix County families are headed by married parents, those families with a single parent are more likely to have income below the ALICE Threshold.
What assets do households have?Ownership of assets can contribute to stability of households. Yet few families in Charlevoix County own liquid assets, such as a savings account, 401(k) plan, or rental income, that are readily available to cover emergency expenses. Vehicles, the most common asset, depreciate over time. Homeownership, the next most common asset, can build wealth, but is not a liquid asset.
1 Vehicle
2 Vehicles
No Mortgage
3 Vehicles
With Mortgage
4+ Vehicles
0%
10%
20%
30%
40%
50%
60%
70%
80%
90%
100%
Vehicle Home Interest, Dividends, or RentalIncome
Perc
ent o
f Hou
seho
lds
260293
9%
43%
21% 14%
25%
30%
77%
32%
49%
1,672
516
247
0
200
400
600
800
1,000
1,200
1,400
1,600
1,800
0%
10%
20%
30%
40%
50%
60%
70%
80%
90%
100%
Married SingleFemale-Headed
SingleMale-
HeadedTo
tal H
ouse
hold
s
Perc
ent o
f Fam
ilies
with
Chi
ldre
n
260292
Poverty ALICE Above AT Total HH
Charlevoix County, 2015
Town Total HH% ALICE
& Poverty
Bay Township 493 22%
Boyne City 1,628 44%
Boyne Valley Township 536 35%
Chandler Township 112 35%
Charlevoix City 1,333 54%
Charlevoix Township 607 33%
East Jordan City 959 55%
Evangeline Township 325 36%
Eveline Township 639 29%
Hayes Township 771 31%
Hudson Township 257 33%
Marion Township 629 31%
Melrose Township 513 44%
Norwood Township 320 29%
Peaine Township 128 24%
South Arm Township 668 37%
St. James Township 141 47%
Wilson Township 735 32%

UNIT
ED W
AY A
LICE
REP
ORT
– 20
17 U
PDAT
E FO
R M
ICHI
GAN
– EX
HIBI
T I
2015 Point-in-Time Data
Households by Income, 2007 to 2015
Population: 25,690 | Number of Households: 11,223Median Household Income: $40,219 (state average: $51,084)Unemployment Rate: 13.9% (state average: 7.2%)ALICE Households: 23% (state average: 25%); Poverty Households: 18% (state average: 15%)
How many households are struggling?ALICE is an acronym for Asset Limited, Income Constrained, Employed – households that earn more than the Federal Poverty Level, but less than the basic cost of living for the county (the ALICE Threshold, or AT). Combined, the number of poverty and ALICE households equals the total population struggling to afford basic needs. The number of households below the ALICE Threshold changes over time; households move in and out of poverty and ALICE as circumstances improve or worsen. The Great Recession, from 2007 to 2010, caused hardship for many families. Conditions started to improve in 2010 and 2012 for some, but not for all.
What does it cost to afford the basic necessities?The bare-minimum Household Survival Budget does not include any savings, leaving a household vulnerable to unexpected expenses. ALICE households typically earn above the Federal Poverty Level of $11,770 for a single adult and $24,250 for a family of four, but less than the Household Survival Budget.
ALICE IN CHEBOYGAN COUNTY
Household Survival Budget, Cheboygan County
SINGLE ADULT2 ADULTS, 1 INFANT,
1 PRESCHOOLERMonthly Costs
Housing $448 $643Child Care $– $959Food $184 $609Transportation $349 $697Health Care $184 $707Miscellaneous $133 $386Taxes $165 $245
Monthly Total $1,463 $4,246ANNUAL TOTAL $17,556 $50,952Hourly Wage $8.78 $25.48
Sources: 2015 Point-in-Time Data: American Community Survey. ALICE Demographics: American Community Survey; the ALICE Threshold. Budget: U.S. Department of Housing and Urban Development (HUD); U.S. Department of Agriculture (USDA); Bureau of Labor Statistics (BLS); Internal Revenue Service (IRS); Michigan Department of Treasury; Early Childhood Investment Corporation.
14% 15% 17% 18%
23% 24% 24% 23%
63% 61% 59% 59%
11,744 11,560 11,201 11,223
-
2,000
4,000
6,000
8,000
10,000
12,000
14,000
0%
10%
20%
30%
40%
50%
60%
70%
80%
90%
100%
2007 2010 2012 2015
Tota
l Hou
seho
lds
Perc
ent o
f Hou
seho
lds
260311
Poverty ALICE Above AT Total HH

UNIT
ED W
AY A
LICE
REP
ORT
– 20
17 U
PDAT
E FO
R M
ICHI
GAN
– EX
HIBI
T I
Note: Municipal-level data on this page is for Places and County Subdivisions, which include Census Designated Places (CDP). These are overlapping geographies so totals will not match county-level data. Municipal-level data often relies on 5-year averages and is not available for the smallest towns that do not report income.
Families with Children by Income, 2015
Assets, All Households, 2015
How many families with children are struggling?Children add significant expense to a family budget, so it is not surprising that many Cheboygan County families with children live below the ALICE Threshold. Though more Cheboygan County families are headed by married parents, those families with a single parent are more likely to have income below the ALICE Threshold.
What assets do households have?Ownership of assets can contribute to stability of households. Yet few families in Cheboygan County own liquid assets, such as a savings account, 401(k) plan, or rental income, that are readily available to cover emergency expenses. Vehicles, the most common asset, depreciate over time. Homeownership, the next most common asset, can build wealth, but is not a liquid asset.
1 Vehicle
2 Vehicles
No Mortgage
3 Vehicles
With Mortgage
4+ Vehicles
0%
10%
20%
30%
40%
50%
60%
70%
80%
90%
100%
Vehicle Home Interest, Dividends, or RentalIncome
Perc
ent o
f Hou
seho
lds
260313
20%
58%
30%
8%
27%
31%
72%
15%
39%
1,602
633
243
0
200
400
600
800
1,000
1,200
1,400
1,600
1,800
0%
10%
20%
30%
40%
50%
60%
70%
80%
90%
100%
Married SingleFemale-Headed
SingleMale-
HeadedTo
tal H
ouse
hold
s
Perc
ent o
f Fam
ilies
with
Chi
ldre
n
260312
Poverty ALICE Above AT Total HH
Cheboygan County, 2015
Town Total HH% ALICE
& Poverty
Aloha Township 418 35%
Beaugrand Township 534 41%
Benton Township 1,448 34%
Burt Township 370 26%
Cheboygan City 1,959 61%
Ellis Township 227 39%
Forest Township 451 51%
Grant Township 344 24%
Hebron Township 116 30%
Inverness Township 1,001 35%
Koehler Township 439 35%
Mackinaw Township 210 39%
Mentor Township 362 33%
Mullett Township 533 30%
Munro Township 304 31%
Nunda Township 483 41%
Tuscarora Township 1,391 38%
Walker Township 115 47%
Waverly Township 222 30%
Wilmot Township 296 48%

UNIT
ED W
AY A
LICE
REP
ORT
– 20
17 U
PDAT
E FO
R M
ICHI
GAN
– EX
HIBI
T I
2015 Point-in-Time Data
Households by Income, 2007 to 2015
Population: 38,586 | Number of Households: 13,997Median Household Income: $41,993 (state average: $51,084)Unemployment Rate: 11.7% (state average: 7.2%)ALICE Households: 31% (state average: 25%); Poverty Households: 17% (state average: 15%)
How many households are struggling?ALICE is an acronym for Asset Limited, Income Constrained, Employed – households that earn more than the Federal Poverty Level, but less than the basic cost of living for the county (the ALICE Threshold, or AT). Combined, the number of poverty and ALICE households equals the total population struggling to afford basic needs. The number of households below the ALICE Threshold changes over time; households move in and out of poverty and ALICE as circumstances improve or worsen. The Great Recession, from 2007 to 2010, caused hardship for many families. Conditions started to improve in 2010 and 2012 for some, but not for all.
What does it cost to afford the basic necessities?The bare-minimum Household Survival Budget does not include any savings, leaving a household vulnerable to unexpected expenses. ALICE households typically earn above the Federal Poverty Level of $11,770 for a single adult and $24,250 for a family of four, but less than the Household Survival Budget.
ALICE IN CHIPPEWA COUNTY
Household Survival Budget, Chippewa County
SINGLE ADULT2 ADULTS, 1 INFANT,
1 PRESCHOOLERMonthly Costs
Housing $465 $667Child Care $– $914Food $184 $609Transportation $349 $697Health Care $184 $707Miscellaneous $135 $383Taxes $169 $239
Monthly Total $1,486 $4,216ANNUAL TOTAL $17,832 $50,592Hourly Wage $8.92 $25.30
Sources: 2015 Point-in-Time Data: American Community Survey. ALICE Demographics: American Community Survey; the ALICE Threshold. Budget: U.S. Department of Housing and Urban Development (HUD); U.S. Department of Agriculture (USDA); Bureau of Labor Statistics (BLS); Internal Revenue Service (IRS); Michigan Department of Treasury; Early Childhood Investment Corporation.
18% 18% 19% 17%
23% 22% 28% 31%
59% 60%
53% 52%
14,663 14,783 14,597 13,997
-
2,000
4,000
6,000
8,000
10,000
12,000
14,000
16,000
0%
10%
20%
30%
40%
50%
60%
70%
80%
90%
100%
2007 2010 2012 2015
Tota
l Hou
seho
lds
Perc
ent o
f Hou
seho
lds
260331
Poverty ALICE Above AT Total HH

UNIT
ED W
AY A
LICE
REP
ORT
– 20
17 U
PDAT
E FO
R M
ICHI
GAN
– EX
HIBI
T I
Note: Municipal-level data on this page is for Places and County Subdivisions, which include Census Designated Places (CDP). These are overlapping geographies so totals will not match county-level data. Municipal-level data often relies on 5-year averages and is not available for the smallest towns that do not report income.
Families with Children by Income, 2015
Assets, All Households, 2015
How many families with children are struggling?Children add significant expense to a family budget, so it is not surprising that many Chippewa County families with children live below the ALICE Threshold. Though more Chippewa County families are headed by married parents, those families with a single parent are more likely to have income below the ALICE Threshold.
What assets do households have?Ownership of assets can contribute to stability of households. Yet few families in Chippewa County own liquid assets, such as a savings account, 401(k) plan, or rental income, that are readily available to cover emergency expenses. Vehicles, the most common asset, depreciate over time. Homeownership, the next most common asset, can build wealth, but is not a liquid asset.
1 Vehicle
2 Vehicles
No Mortgage
3 Vehicles
With Mortgage
4+ Vehicles
0%
10%
20%
30%
40%
50%
60%
70%
80%
90%
100%
Vehicle Home Interest, Dividends, or RentalIncome
Perc
ent o
f Hou
seho
lds
260333
10%
55%
30% 20%
31%
41%
70%
14%
29% 2,173
891
420
0
500
1,000
1,500
2,000
2,500
0%
10%
20%
30%
40%
50%
60%
70%
80%
90%
100%
Married SingleFemale-Headed
SingleMale-
HeadedTo
tal H
ouse
hold
s
Perc
ent o
f Fam
ilies
with
Chi
ldre
n
260332
Poverty ALICE Above AT Total HH
Chippewa County, 2015
Town Total HH% ALICE
& Poverty
Bay Mills Township 603 41%
Bruce Township 860 33%
Dafter Township 437 32%
Detour Township 378 54%
Drummond Township 554 43%
Kinross Charter Township 1,476 52%
Pickford Township 754 43%
Raber Township 291 52%
Rudyard Township 451 30%
Sault Ste. Marie City 5,666 60%
Soo Township 1,197 27%
Sugar Island Township 303 34%
Superior Township 497 41%
Trout Lake Township 192 51%
Whitefish Township 221 51%

UNIT
ED W
AY A
LICE
REP
ORT
– 20
17 U
PDAT
E FO
R M
ICHI
GAN
– EX
HIBI
T I
2015 Point-in-Time Data
Households by Income, 2007 to 2015
Population: 30,710 | Number of Households: 13,255Median Household Income: $33,015 (state average: $51,084)Unemployment Rate: 13.2% (state average: 7.2%)ALICE Households: 29% (state average: 25%); Poverty Households: 24% (state average: 15%)
How many households are struggling?ALICE is an acronym for Asset Limited, Income Constrained, Employed – households that earn more than the Federal Poverty Level, but less than the basic cost of living for the county (the ALICE Threshold, or AT). Combined, the number of poverty and ALICE households equals the total population struggling to afford basic needs. The number of households below the ALICE Threshold changes over time; households move in and out of poverty and ALICE as circumstances improve or worsen. The Great Recession, from 2007 to 2010, caused hardship for many families. Conditions started to improve in 2010 and 2012 for some, but not for all.
What does it cost to afford the basic necessities?The bare-minimum Household Survival Budget does not include any savings, leaving a household vulnerable to unexpected expenses. ALICE households typically earn above the Federal Poverty Level of $11,770 for a single adult and $24,250 for a family of four, but less than the Household Survival Budget.
ALICE IN CLARE COUNTY
Household Survival Budget, Clare County
SINGLE ADULT2 ADULTS, 1 INFANT,
1 PRESCHOOLERMonthly Costs
Housing $448 $643Child Care $– $1,229Food $184 $609Transportation $349 $697Health Care $184 $707Miscellaneous $133 $421Taxes $165 $328
Monthly Total $1,463 $4,634ANNUAL TOTAL $17,556 $55,608Hourly Wage $8.78 $27.80
Sources: 2015 Point-in-Time Data: American Community Survey. ALICE Demographics: American Community Survey; the ALICE Threshold. Budget: U.S. Department of Housing and Urban Development (HUD); U.S. Department of Agriculture (USDA); Bureau of Labor Statistics (BLS); Internal Revenue Service (IRS); Michigan Department of Treasury; Early Childhood Investment Corporation.
18% 19% 26% 24%
23% 25%
24% 29%
59% 56%
50% 47%
12,766 13,208 13,436 13,255
-
2,000
4,000
6,000
8,000
10,000
12,000
14,000
16,000
0%
10%
20%
30%
40%
50%
60%
70%
80%
90%
100%
2007 2010 2012 2015
Tota
l Hou
seho
lds
Perc
ent o
f Hou
seho
lds
260351
Poverty ALICE Above AT Total HH

UNIT
ED W
AY A
LICE
REP
ORT
– 20
17 U
PDAT
E FO
R M
ICHI
GAN
– EX
HIBI
T I
Note: Municipal-level data on this page is for Places and County Subdivisions, which include Census Designated Places (CDP). These are overlapping geographies so totals will not match county-level data. Municipal-level data often relies on 5-year averages and is not available for the smallest towns that do not report income.
Families with Children by Income, 2015
Assets, All Households, 2015
How many families with children are struggling?Children add significant expense to a family budget, so it is not surprising that many Clare County families with children live below the ALICE Threshold. Though more Clare County families are headed by married parents, those families with a single parent are more likely to have income below the ALICE Threshold.
What assets do households have?Ownership of assets can contribute to stability of households. Yet few families in Clare County own liquid assets, such as a savings account, 401(k) plan, or rental income, that are readily available to cover emergency expenses. Vehicles, the most common asset, depreciate over time. Homeownership, the next most common asset, can build wealth, but is not a liquid asset.
1 Vehicle
2 Vehicles
No Mortgage
3 Vehicles
With Mortgage
4+ Vehicles
0%
10%
20%
30%
40%
50%
60%
70%
80%
90%
100%
Vehicle Home Interest, Dividends, or RentalIncome
Perc
ent o
f Hou
seho
lds
260353
25%
73%
48%
13%
18%
20%
62%
9%
32%
1,642
966
343
0
200
400
600
800
1,000
1,200
1,400
1,600
1,800
0%
10%
20%
30%
40%
50%
60%
70%
80%
90%
100%
Married SingleFemale-Headed
SingleMale-
HeadedTo
tal H
ouse
hold
s
Perc
ent o
f Fam
ilies
with
Chi
ldre
n
260352
Poverty ALICE Above AT Total HH
Clare County, 2015
Town Total HH% ALICE
& Poverty
Arthur Township 263 30%
Clare City 1,417 61%
Franklin Township 350 50%
Freeman Township 480 51%
Frost Township 487 53%
Garfield Township 853 45%
Grant Township 1,255 36%
Greenwood Township 497 42%
Hamilton Township 887 60%
Harrison City 895 60%
Hatton Township 361 39%
Hayes Township 2,085 65%
Lincoln Township 772 58%
Redding Township 191 59%
Sheridan Township 493 35%
Summerfield Township 223 57%
Surrey Township 1,550 56%
Winterfield Township 196 43%

UNIT
ED W
AY A
LICE
REP
ORT
– 20
17 U
PDAT
E FO
R M
ICHI
GAN
– EX
HIBI
T I
2015 Point-in-Time Data
Households by Income, 2007 to 2015
Population: 77,390 | Number of Households: 29,072Median Household Income: $63,764 (state average: $51,084)Unemployment Rate: 5% (state average: 7.2%)ALICE Households: 18% (state average: 25%); Poverty Households: 12% (state average: 15%)
How many households are struggling?ALICE is an acronym for Asset Limited, Income Constrained, Employed – households that earn more than the Federal Poverty Level, but less than the basic cost of living for the county (the ALICE Threshold, or AT). Combined, the number of poverty and ALICE households equals the total population struggling to afford basic needs. The number of households below the ALICE Threshold changes over time; households move in and out of poverty and ALICE as circumstances improve or worsen. The Great Recession, from 2007 to 2010, caused hardship for many families. Conditions started to improve in 2010 and 2012 for some, but not for all.
What does it cost to afford the basic necessities?The bare-minimum Household Survival Budget does not include any savings, leaving a household vulnerable to unexpected expenses. ALICE households typically earn above the Federal Poverty Level of $11,770 for a single adult and $24,250 for a family of four, but less than the Household Survival Budget.
ALICE IN CLINTON COUNTY
Household Survival Budget, Clinton County
SINGLE ADULT2 ADULTS, 1 INFANT,
1 PRESCHOOLERMonthly Costs
Housing $490 $776Child Care $– $1,066Food $184 $609Transportation $349 $697Health Care $184 $707Miscellaneous $138 $417Taxes $175 $318
Monthly Total $1,520 $4,590ANNUAL TOTAL $18,240 $55,080Hourly Wage $9.12 $27.54
Sources: 2015 Point-in-Time Data: American Community Survey. ALICE Demographics: American Community Survey; the ALICE Threshold. Budget: U.S. Department of Housing and Urban Development (HUD); U.S. Department of Agriculture (USDA); Bureau of Labor Statistics (BLS); Internal Revenue Service (IRS); Michigan Department of Treasury; Early Childhood Investment Corporation.
8% 12% 10% 12%
18% 16% 22% 18%
74% 72% 68% 70%
28,572 27,753 29,443 29,072
-
5,000
10,000
15,000
20,000
25,000
30,000
35,000
0%
10%
20%
30%
40%
50%
60%
70%
80%
90%
100%
2007 2010 2012 2015
Tota
l Hou
seho
lds
Perc
ent o
f Hou
seho
lds
260371
Poverty ALICE Above AT Total HH

UNIT
ED W
AY A
LICE
REP
ORT
– 20
17 U
PDAT
E FO
R M
ICHI
GAN
– EX
HIBI
T I
Note: Municipal-level data on this page is for Places and County Subdivisions, which include Census Designated Places (CDP). These are overlapping geographies so totals will not match county-level data. Municipal-level data often relies on 5-year averages and is not available for the smallest towns that do not report income.
Families with Children by Income, 2015
Assets, All Households, 2015
How many families with children are struggling?Children add significant expense to a family budget, so it is not surprising that many Clinton County families with children live below the ALICE Threshold. Though more Clinton County families are headed by married parents, those families with a single parent are more likely to have income below the ALICE Threshold.
What assets do households have?Ownership of assets can contribute to stability of households. Yet few families in Clinton County own liquid assets, such as a savings account, 401(k) plan, or rental income, that are readily available to cover emergency expenses. Vehicles, the most common asset, depreciate over time. Homeownership, the next most common asset, can build wealth, but is not a liquid asset.
1 Vehicle
2 Vehicles
No Mortgage
3 Vehicles
With Mortgage
4+ Vehicles
0%
20%
40%
60%
80%
100%
120%
Vehicle Home Interest, Dividends, or RentalIncome
Perc
ent o
f Hou
seho
lds
260373
4%
36%
19% 10%
30%
32%
86%
34%
49%
6,260
1,456
588
0
1,000
2,000
3,000
4,000
5,000
6,000
7,000
0%
10%
20%
30%
40%
50%
60%
70%
80%
90%
100%
Married SingleFemale-Headed
SingleMale-
HeadedTo
tal H
ouse
hold
s
Perc
ent o
f Fam
ilies
with
Chi
ldre
n
260372
Poverty ALICE Above AT Total HH
Clinton County, 2015
Town Total HH% ALICE
& Poverty
Bath Charter Township 4,465 35%
Bengal Township 381 23%
Bingham Township 1,070 35%
Dallas Township 805 30%
Dewitt Charter Township 5,794 33%
Dewitt City 1,698 27%
Duplain Township 848 40%
Eagle Township 983 14%
East Lansing City 758 39%
Essex Township 707 28%
Greenbush Township 819 35%
Lebanon Township 230 28%
Olive Township 997 24%
Ovid Township 1,341 37%
Riley Township 711 17%
St. Johns City 3,210 53%
Victor Township 1,334 24%
Watertown Charter Township 1,883 17%
Westphalia Township 823 26%

UNIT
ED W
AY A
LICE
REP
ORT
– 20
17 U
PDAT
E FO
R M
ICHI
GAN
– EX
HIBI
T I
2015 Point-in-Time Data
Households by Income, 2007 to 2015
Population: 13,895 | Number of Households: 5,954Median Household Income: $41,743 (state average: $51,084)Unemployment Rate: 12% (state average: 7.2%)ALICE Households: 25% (state average: 25%); Poverty Households: 13% (state average: 15%)
How many households are struggling?ALICE is an acronym for Asset Limited, Income Constrained, Employed – households that earn more than the Federal Poverty Level, but less than the basic cost of living for the county (the ALICE Threshold, or AT). Combined, the number of poverty and ALICE households equals the total population struggling to afford basic needs. The number of households below the ALICE Threshold changes over time; households move in and out of poverty and ALICE as circumstances improve or worsen. The Great Recession, from 2007 to 2010, caused hardship for many families. Conditions started to improve in 2010 and 2012 for some, but not for all.
What does it cost to afford the basic necessities?The bare-minimum Household Survival Budget does not include any savings, leaving a household vulnerable to unexpected expenses. ALICE households typically earn above the Federal Poverty Level of $11,770 for a single adult and $24,250 for a family of four, but less than the Household Survival Budget.
ALICE IN CRAWFORD COUNTY
Household Survival Budget, Crawford County
SINGLE ADULT2 ADULTS, 1 INFANT,
1 PRESCHOOLERMonthly Costs
Housing $452 $648Child Care $– $922Food $184 $609Transportation $349 $697Health Care $184 $707Miscellaneous $133 $382Taxes $166 $235
Monthly Total $1,468 $4,200ANNUAL TOTAL $17,616 $50,400Hourly Wage $8.81 $25.20
Sources: 2015 Point-in-Time Data: American Community Survey. ALICE Demographics: American Community Survey; the ALICE Threshold. Budget: U.S. Department of Housing and Urban Development (HUD); U.S. Department of Agriculture (USDA); Bureau of Labor Statistics (BLS); Internal Revenue Service (IRS); Michigan Department of Treasury; Early Childhood Investment Corporation.
#N/A 15% 16% 13%
24% 22% 25%
61% 62% 62%
5,761 5,921 5,954
-
1,000
2,000
3,000
4,000
5,000
6,000
7,000
0%
10%
20%
30%
40%
50%
60%
70%
80%
90%
100%
2010 2012 2015
Tota
l Hou
seho
lds
Perc
ent o
f Hou
seho
lds
260391
Poverty ALICE Above AT Total HH
N/A

UNIT
ED W
AY A
LICE
REP
ORT
– 20
17 U
PDAT
E FO
R M
ICHI
GAN
– EX
HIBI
T I
Note: Municipal-level data on this page is for Places and County Subdivisions, which include Census Designated Places (CDP). These are overlapping geographies so totals will not match county-level data. Municipal-level data often relies on 5-year averages and is not available for the smallest towns that do not report income.
Families with Children by Income, 2015
Assets, All Households, 2015
How many families with children are struggling?Children add significant expense to a family budget, so it is not surprising that many Crawford County families with children live below the ALICE Threshold. Though more Crawford County families are headed by married parents, those families with a single parent are more likely to have income below the ALICE Threshold.
What assets do households have?Ownership of assets can contribute to stability of households. Yet few families in Crawford County own liquid assets, such as a savings account, 401(k) plan, or rental income, that are readily available to cover emergency expenses. Vehicles, the most common asset, depreciate over time. Homeownership, the next most common asset, can build wealth, but is not a liquid asset.
1 Vehicle
2 Vehicles
No Mortgage
3 Vehicles
With Mortgage
4+ Vehicles
0%
10%
20%
30%
40%
50%
60%
70%
80%
90%
100%
Vehicle Home Interest, Dividends, or RentalIncome
Perc
ent o
f Hou
seho
lds
260393
8%
57%
36% 8%
21%
14%
84%
22%
50%
728
220
148
0
100
200
300
400
500
600
700
800
0%
10%
20%
30%
40%
50%
60%
70%
80%
90%
100%
Married SingleFemale-Headed
SingleMale-
HeadedTo
tal H
ouse
hold
s
Perc
ent o
f Fam
ilies
with
Chi
ldre
n
260392
Poverty ALICE Above AT Total HH
Crawford County, 2015
Town Total HH% ALICE
& Poverty
Beaver Creek Township 749 41%
Frederic Township 597 38%
Grayling Charter Township 2,507 34%
Grayling City 697 57%
Lovells Township 292 35%
Maple Forest Township 271 31%
South Branch Township 841 36%

UNIT
ED W
AY A
LICE
REP
ORT
– 20
17 U
PDAT
E FO
R M
ICHI
GAN
– EX
HIBI
T I
2015 Point-in-Time Data
Households by Income, 2007 to 2015
Population: 36,712 | Number of Households: 15,685Median Household Income: $42,031 (state average: $51,084)Unemployment Rate: 9.2% (state average: 7.2%)ALICE Households: 27% (state average: 25%); Poverty Households: 17% (state average: 15%)
How many households are struggling?ALICE is an acronym for Asset Limited, Income Constrained, Employed – households that earn more than the Federal Poverty Level, but less than the basic cost of living for the county (the ALICE Threshold, or AT). Combined, the number of poverty and ALICE households equals the total population struggling to afford basic needs. The number of households below the ALICE Threshold changes over time; households move in and out of poverty and ALICE as circumstances improve or worsen. The Great Recession, from 2007 to 2010, caused hardship for many families. Conditions started to improve in 2010 and 2012 for some, but not for all.
What does it cost to afford the basic necessities?The bare-minimum Household Survival Budget does not include any savings, leaving a household vulnerable to unexpected expenses. ALICE households typically earn above the Federal Poverty Level of $11,770 for a single adult and $24,250 for a family of four, but less than the Household Survival Budget.
ALICE IN DELTA COUNTY
Household Survival Budget, Delta County
SINGLE ADULT2 ADULTS, 1 INFANT,
1 PRESCHOOLERMonthly Costs
Housing $482 $643Child Care $– $1,075Food $184 $609Transportation $349 $697Health Care $184 $707Miscellaneous $137 $401Taxes $173 $280
Monthly Total $1,509 $4,412ANNUAL TOTAL $18,108 $52,944Hourly Wage $9.05 $26.47
Sources: 2015 Point-in-Time Data: American Community Survey. ALICE Demographics: American Community Survey; the ALICE Threshold. Budget: U.S. Department of Housing and Urban Development (HUD); U.S. Department of Agriculture (USDA); Bureau of Labor Statistics (BLS); Internal Revenue Service (IRS); Michigan Department of Treasury; Early Childhood Investment Corporation.
13% 14% 17% 17%
23% 22% 24% 27%
64% 64% 59%
56%
16,571 16,145 15,973 15,685
-
2,000
4,000
6,000
8,000
10,000
12,000
14,000
16,000
18,000
0%
10%
20%
30%
40%
50%
60%
70%
80%
90%
100%
2007 2010 2012 2015
Tota
l Hou
seho
lds
Perc
ent o
f Hou
seho
lds
260411
Poverty ALICE Above AT Total HH

UNIT
ED W
AY A
LICE
REP
ORT
– 20
17 U
PDAT
E FO
R M
ICHI
GAN
– EX
HIBI
T I
Note: Municipal-level data on this page is for Places and County Subdivisions, which include Census Designated Places (CDP). These are overlapping geographies so totals will not match county-level data. Municipal-level data often relies on 5-year averages and is not available for the smallest towns that do not report income.
Families with Children by Income, 2015
Assets, All Households, 2015
How many families with children are struggling?Children add significant expense to a family budget, so it is not surprising that many Delta County families with children live below the ALICE Threshold. Though more Delta County families are headed by married parents, those families with a single parent are more likely to have income below the ALICE Threshold.
What assets do households have?Ownership of assets can contribute to stability of households. Yet few families in Delta County own liquid assets, such as a savings account, 401(k) plan, or rental income, that are readily available to cover emergency expenses. Vehicles, the most common asset, depreciate over time. Homeownership, the next most common asset, can build wealth, but is not a liquid asset.
1 Vehicle
2 Vehicles
No Mortgage
3 Vehicles
With Mortgage
4+ Vehicles
0%
10%
20%
30%
40%
50%
60%
70%
80%
90%
100%
Vehicle Home Interest, Dividends, or RentalIncome
Perc
ent o
f Hou
seho
lds
260413
12%
59%
19% 8%
30%
23%
80%
11%
58%
2,367
772
409
0
500
1,000
1,500
2,000
2,500
0%
10%
20%
30%
40%
50%
60%
70%
80%
90%
100%
Married SingleFemale-Headed
SingleMale-
HeadedTo
tal H
ouse
hold
s
Perc
ent o
f Fam
ilies
with
Chi
ldre
n
260412
Poverty ALICE Above AT Total HH
Delta County, 2015
Town Total HH% ALICE
& Poverty
Baldwin Township 309 41%
Bark River Township 569 37%
Bay De Noc Township 147 42%
Brampton Township 423 26%
Cornell Township 211 43%
Ensign Township 368 32%
Escanaba City 5,693 60%
Escanaba Township 1,417 19%
Fairbanks Township 141 49%
Ford River Township 912 29%
Garden Township 354 38%
Gladstone City 2,032 44%
Maple Ridge Township 323 45%
Masonville Township 715 40%
Nahma Township 221 46%
Wells Township 1,850 32%

UNIT
ED W
AY A
LICE
REP
ORT
– 20
17 U
PDAT
E FO
R M
ICHI
GAN
– EX
HIBI
T I
2015 Point-in-Time Data
Households by Income, 2007 to 2015
Population: 26,012 | Number of Households: 11,059Median Household Income: $43,779 (state average: $51,084)Unemployment Rate: 7% (state average: 7.2%)ALICE Households: 25% (state average: 25%); Poverty Households: 14% (state average: 15%)
How many households are struggling?ALICE is an acronym for Asset Limited, Income Constrained, Employed – households that earn more than the Federal Poverty Level, but less than the basic cost of living for the county (the ALICE Threshold, or AT). Combined, the number of poverty and ALICE households equals the total population struggling to afford basic needs. The number of households below the ALICE Threshold changes over time; households move in and out of poverty and ALICE as circumstances improve or worsen. The Great Recession, from 2007 to 2010, caused hardship for many families. Conditions started to improve in 2010 and 2012 for some, but not for all.
What does it cost to afford the basic necessities?The bare-minimum Household Survival Budget does not include any savings, leaving a household vulnerable to unexpected expenses. ALICE households typically earn above the Federal Poverty Level of $11,770 for a single adult and $24,250 for a family of four, but less than the Household Survival Budget.
ALICE IN DICKINSON COUNTY
Household Survival Budget, Dickinson County
SINGLE ADULT2 ADULTS, 1 INFANT,
1 PRESCHOOLERMonthly Costs
Housing $448 $643Child Care $– $1,229Food $184 $609Transportation $349 $697Health Care $184 $707Miscellaneous $133 $421Taxes $165 $328
Monthly Total $1,463 $4,634ANNUAL TOTAL $17,556 $55,608Hourly Wage $8.78 $27.80
Sources: 2015 Point-in-Time Data: American Community Survey. ALICE Demographics: American Community Survey; the ALICE Threshold. Budget: U.S. Department of Housing and Urban Development (HUD); U.S. Department of Agriculture (USDA); Bureau of Labor Statistics (BLS); Internal Revenue Service (IRS); Michigan Department of Treasury; Early Childhood Investment Corporation.
11% 14% 12% 14%
26% 23% 25% 25%
63% 63% 63% 61%
11,415 11,422 11,405 11,059
-
2,000
4,000
6,000
8,000
10,000
12,000
0%
10%
20%
30%
40%
50%
60%
70%
80%
90%
100%
2007 2010 2012 2015
Tota
l Hou
seho
lds
Perc
ent o
f Hou
seho
lds
260431
Poverty ALICE Above AT Total HH

UNIT
ED W
AY A
LICE
REP
ORT
– 20
17 U
PDAT
E FO
R M
ICHI
GAN
– EX
HIBI
T I
Note: Municipal-level data on this page is for Places and County Subdivisions, which include Census Designated Places (CDP). These are overlapping geographies so totals will not match county-level data. Municipal-level data often relies on 5-year averages and is not available for the smallest towns that do not report income.
Families with Children by Income, 2015
Assets, All Households, 2015
How many families with children are struggling?Children add significant expense to a family budget, so it is not surprising that many Dickinson County families with children live below the ALICE Threshold. Though more Dickinson County families are headed by married parents, those families with a single parent are more likely to have income below the ALICE Threshold.
What assets do households have?Ownership of assets can contribute to stability of households. Yet few families in Dickinson County own liquid assets, such as a savings account, 401(k) plan, or rental income, that are readily available to cover emergency expenses. Vehicles, the most common asset, depreciate over time. Homeownership, the next most common asset, can build wealth, but is not a liquid asset.
1 Vehicle
2 Vehicles
No Mortgage
3 Vehicles
With Mortgage
4+ Vehicles
0%
10%
20%
30%
40%
50%
60%
70%
80%
90%
100%
Vehicle Home Interest, Dividends, or RentalIncome
Perc
ent o
f Hou
seho
lds
260433
8%
27%
4%
11%
37%
41%
81%
36%
55%
1,613
690
210
0
200
400
600
800
1,000
1,200
1,400
1,600
1,800
0%
10%
20%
30%
40%
50%
60%
70%
80%
90%
100%
Married SingleFemale-Headed
SingleMale-
HeadedTo
tal H
ouse
hold
s
Perc
ent o
f Fam
ilies
with
Chi
ldre
n
260432
Poverty ALICE Above AT Total HH
Dickinson County, 2015
Town Total HH% ALICE
& Poverty
Breen Township 198 42%
Breitung Charter Township 2,340 28%
Felch Township 296 34%
Iron Mountain City 3,121 45%
Kingsford City 2,281 45%
Norway City 1,330 38%
Norway Township 658 27%
Sagola Township 478 40%
Waucedah Township 343 26%

UNIT
ED W
AY A
LICE
REP
ORT
– 20
17 U
PDAT
E FO
R M
ICHI
GAN
– EX
HIBI
T I
2015 Point-in-Time Data
Households by Income, 2007 to 2015
Population: 108,801 | Number of Households: 43,551Median Household Income: $56,005 (state average: $51,084)Unemployment Rate: 3.8% (state average: 7.2%)ALICE Households: 19% (state average: 25%); Poverty Households: 10% (state average: 15%)
How many households are struggling?ALICE is an acronym for Asset Limited, Income Constrained, Employed – households that earn more than the Federal Poverty Level, but less than the basic cost of living for the county (the ALICE Threshold, or AT). Combined, the number of poverty and ALICE households equals the total population struggling to afford basic needs. The number of households below the ALICE Threshold changes over time; households move in and out of poverty and ALICE as circumstances improve or worsen. The Great Recession, from 2007 to 2010, caused hardship for many families. Conditions started to improve in 2010 and 2012 for some, but not for all.
What does it cost to afford the basic necessities?The bare-minimum Household Survival Budget does not include any savings, leaving a household vulnerable to unexpected expenses. ALICE households typically earn above the Federal Poverty Level of $11,770 for a single adult and $24,250 for a family of four, but less than the Household Survival Budget.
ALICE IN EATON COUNTY
Household Survival Budget, Eaton County
SINGLE ADULT2 ADULTS, 1 INFANT,
1 PRESCHOOLERMonthly Costs
Housing $490 $776Child Care $– $1,046Food $184 $609Transportation $349 $697Health Care $184 $707Miscellaneous $138 $415Taxes $175 $312
Monthly Total $1,520 $4,562ANNUAL TOTAL $18,240 $54,744Hourly Wage $9.12 $27.37
Sources: 2015 Point-in-Time Data: American Community Survey. ALICE Demographics: American Community Survey; the ALICE Threshold. Budget: U.S. Department of Housing and Urban Development (HUD); U.S. Department of Agriculture (USDA); Bureau of Labor Statistics (BLS); Internal Revenue Service (IRS); Michigan Department of Treasury; Early Childhood Investment Corporation.
9% 11% 9% 10%
21% 21% 22% 19%
70% 68% 69% 71%
42,374 42,810 42,811 43,551
-
5,000
10,000
15,000
20,000
25,000
30,000
35,000
40,000
45,000
50,000
0%
10%
20%
30%
40%
50%
60%
70%
80%
90%
100%
2007 2010 2012 2015
Tota
l Hou
seho
lds
Perc
ent o
f Hou
seho
lds
260451
Poverty ALICE Above AT Total HH

UNIT
ED W
AY A
LICE
REP
ORT
– 20
17 U
PDAT
E FO
R M
ICHI
GAN
– EX
HIBI
T I
Note: Municipal-level data on this page is for Places and County Subdivisions, which include Census Designated Places (CDP). These are overlapping geographies so totals will not match county-level data. Municipal-level data often relies on 5-year averages and is not available for the smallest towns that do not report income.
Families with Children by Income, 2015
Assets, All Households, 2015
How many families with children are struggling?Children add significant expense to a family budget, so it is not surprising that many Eaton County families with children live below the ALICE Threshold. Though more Eaton County families are headed by married parents, those families with a single parent are more likely to have income below the ALICE Threshold.
What assets do households have?Ownership of assets can contribute to stability of households. Yet few families in Eaton County own liquid assets, such as a savings account, 401(k) plan, or rental income, that are readily available to cover emergency expenses. Vehicles, the most common asset, depreciate over time. Homeownership, the next most common asset, can build wealth, but is not a liquid asset.
1 Vehicle
2 Vehicles
No Mortgage
3 Vehicles
With Mortgage
4+ Vehicles
0%
10%
20%
30%
40%
50%
60%
70%
80%
90%
100%
Vehicle Home Interest, Dividends, or RentalIncome
Perc
ent o
f Hou
seho
lds
260453
7%
32%
5%
6%
35%
53%
87%
33% 42%
7,887
2,716
802
0
1,000
2,000
3,000
4,000
5,000
6,000
7,000
8,000
9,000
0%
10%
20%
30%
40%
50%
60%
70%
80%
90%
100%
Married SingleFemale-Headed
SingleMale-
HeadedTo
tal H
ouse
hold
s
Perc
ent o
f Fam
ilies
with
Chi
ldre
n
260452
Poverty ALICE Above AT Total HH
Eaton County, 2015
Town Total HH% ALICE
& Poverty
Bellevue Township 1,273 34%
Benton Township 1,066 17%
Brookfield Township 597 29%
Carmel Township 1,116 23%
Charlotte City 3,564 43%
Chester Township 681 24%
Delta Charter Township 14,288 30%
Eaton Rapids City 1,958 47%
Eaton Rapids Township 1,523 15%
Eaton Township 1,472 18%
Grand Ledge City 3,478 34%
Hamlin Township 1,246 24%
Kalamo Township 675 27%
Lansing City 2,123 61%
Olivet City 380 40%
Oneida Charter Township 1,521 24%
Potterville City 1,007 31%
Roxand Township 741 27%
Sunfield Township 755 27%
Vermontville Township 724 36%
Walton Township 758 24%
Windsor Charter Township 2,686 23%

UNIT
ED W
AY A
LICE
REP
ORT
– 20
17 U
PDAT
E FO
R M
ICHI
GAN
– EX
HIBI
T I
2015 Point-in-Time Data
Households by Income, 2007 to 2015
Population: 33,018 | Number of Households: 13,948Median Household Income: $51,018 (state average: $51,084)Unemployment Rate: 8.4% (state average: 7.2%)ALICE Households: 26% (state average: 25%); Poverty Households: 11% (state average: 15%)
How many households are struggling?ALICE is an acronym for Asset Limited, Income Constrained, Employed – households that earn more than the Federal Poverty Level, but less than the basic cost of living for the county (the ALICE Threshold, or AT). Combined, the number of poverty and ALICE households equals the total population struggling to afford basic needs. The number of households below the ALICE Threshold changes over time; households move in and out of poverty and ALICE as circumstances improve or worsen. The Great Recession, from 2007 to 2010, caused hardship for many families. Conditions started to improve in 2010 and 2012 for some, but not for all.
What does it cost to afford the basic necessities?The bare-minimum Household Survival Budget does not include any savings, leaving a household vulnerable to unexpected expenses. ALICE households typically earn above the Federal Poverty Level of $11,770 for a single adult and $24,250 for a family of four, but less than the Household Survival Budget.
ALICE IN EMMET COUNTY
Household Survival Budget, Emmet County
SINGLE ADULT2 ADULTS, 1 INFANT,
1 PRESCHOOLERMonthly Costs
Housing $553 $764Child Care $– $1,001Food $184 $609Transportation $349 $697Health Care $184 $707Miscellaneous $146 $407Taxes $189 $295
Monthly Total $1,605 $4,480ANNUAL TOTAL $19,260 $53,760Hourly Wage $9.63 $26.88
Sources: 2015 Point-in-Time Data: American Community Survey. ALICE Demographics: American Community Survey; the ALICE Threshold. Budget: U.S. Department of Housing and Urban Development (HUD); U.S. Department of Agriculture (USDA); Bureau of Labor Statistics (BLS); Internal Revenue Service (IRS); Michigan Department of Treasury; Early Childhood Investment Corporation.
7% 13% 11% 11%
21% 21% 23% 26%
72% 66% 66%
63%
13,790 13,731 13,140
13,948
-
2,000
4,000
6,000
8,000
10,000
12,000
14,000
16,000
0%
10%
20%
30%
40%
50%
60%
70%
80%
90%
100%
2007 2010 2012 2015
Tota
l Hou
seho
lds
Perc
ent o
f Hou
seho
lds
260471
Poverty ALICE Above AT Total HH

UNIT
ED W
AY A
LICE
REP
ORT
– 20
17 U
PDAT
E FO
R M
ICHI
GAN
– EX
HIBI
T I
Note: Municipal-level data on this page is for Places and County Subdivisions, which include Census Designated Places (CDP). These are overlapping geographies so totals will not match county-level data. Municipal-level data often relies on 5-year averages and is not available for the smallest towns that do not report income.
Families with Children by Income, 2015
Assets, All Households, 2015
How many families with children are struggling?Children add significant expense to a family budget, so it is not surprising that many Emmet County families with children live below the ALICE Threshold. Though more Emmet County families are headed by married parents, those families with a single parent are more likely to have income below the ALICE Threshold.
What assets do households have?Ownership of assets can contribute to stability of households. Yet few families in Emmet County own liquid assets, such as a savings account, 401(k) plan, or rental income, that are readily available to cover emergency expenses. Vehicles, the most common asset, depreciate over time. Homeownership, the next most common asset, can build wealth, but is not a liquid asset.
1 Vehicle
2 Vehicles
No Mortgage
3 Vehicles
With Mortgage
4+ Vehicles
0%
10%
20%
30%
40%
50%
60%
70%
80%
90%
100%
Vehicle Home Interest, Dividends, or RentalIncome
Perc
ent o
f Hou
seho
lds
260473
5%
32% 35%
10%
37% 33% 85%
31% 32%
2,286
684
265
0
500
1,000
1,500
2,000
2,500
0%
10%
20%
30%
40%
50%
60%
70%
80%
90%
100%
Married SingleFemale-Headed
SingleMale-
HeadedTo
tal H
ouse
hold
s
Perc
ent o
f Fam
ilies
with
Chi
ldre
n
260472
Poverty ALICE Above AT Total HH
Emmet County, 2015
Town Total HH% ALICE
& Poverty
Bear Creek Township 2,466 32%
Bliss Township 259 45%
Carp Lake Township 356 38%
Center Township 225 41%
Cross Village Township 127 52%
Friendship Township 352 35%
Harbor Springs City 482 41%
Little Traverse Township 1,077 29%
Littlefield Township 1,186 32%
Maple River Township 515 42%
Mckinley Township 521 58%
Petoskey City 2,869 50%
Pleasantview Township 367 32%
Readmond Township 286 30%
Resort Township 1,006 21%
Springvale Township 795 27%
Wawatam Township 294 51%
West Traverse Township 765 23%

UNIT
ED W
AY A
LICE
REP
ORT
– 20
17 U
PDAT
E FO
R M
ICHI
GAN
– EX
HIBI
T I
2015 Point-in-Time Data
Households by Income, 2007 to 2015
Population: 410,849 | Number of Households: 163,488Median Household Income: $44,025 (state average: $51,084)Unemployment Rate: 10% (state average: 7.2%)ALICE Households: 21% (state average: 25%); Poverty Households: 19% (state average: 15%)
How many households are struggling?ALICE is an acronym for Asset Limited, Income Constrained, Employed – households that earn more than the Federal Poverty Level, but less than the basic cost of living for the county (the ALICE Threshold, or AT). Combined, the number of poverty and ALICE households equals the total population struggling to afford basic needs. The number of households below the ALICE Threshold changes over time; households move in and out of poverty and ALICE as circumstances improve or worsen. The Great Recession, from 2007 to 2010, caused hardship for many families. Conditions started to improve in 2010 and 2012 for some, but not for all.
What does it cost to afford the basic necessities?The bare-minimum Household Survival Budget does not include any savings, leaving a household vulnerable to unexpected expenses. ALICE households typically earn above the Federal Poverty Level of $11,770 for a single adult and $24,250 for a family of four, but less than the Household Survival Budget.
ALICE IN GENESEE COUNTY
Household Survival Budget, Genesee County
SINGLE ADULT2 ADULTS, 1 INFANT,
1 PRESCHOOLERMonthly Costs
Housing $424 $712Child Care $– $909Food $184 $609Transportation $349 $697Health Care $184 $707Miscellaneous $130 $389Taxes $159 $251
Monthly Total $1,430 $4,274ANNUAL TOTAL $17,160 $51,288Hourly Wage $8.58 $25.64
Sources: 2015 Point-in-Time Data: American Community Survey. ALICE Demographics: American Community Survey; the ALICE Threshold. Budget: U.S. Department of Housing and Urban Development (HUD); U.S. Department of Agriculture (USDA); Bureau of Labor Statistics (BLS); Internal Revenue Service (IRS); Michigan Department of Treasury; Early Childhood Investment Corporation.
15% 19% 19% 19%
22% 26% 24% 21%
63%
55% 57% 60%
170,767 166,539 166,225 163,488
-
20,000
40,000
60,000
80,000
100,000
120,000
140,000
160,000
180,000
0%
10%
20%
30%
40%
50%
60%
70%
80%
90%
100%
2007 2010 2012 2015
Tota
l Hou
seho
lds
Perc
ent o
f Hou
seho
lds
260491
Poverty ALICE Above AT Total HH
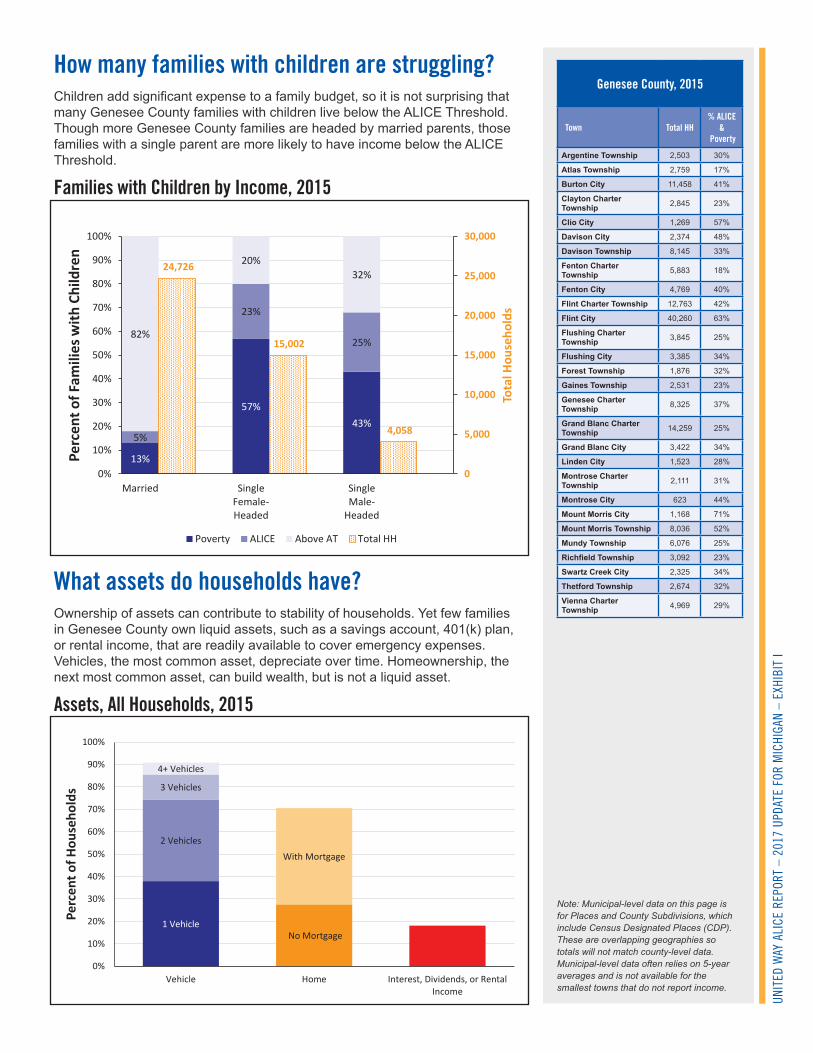
UNIT
ED W
AY A
LICE
REP
ORT
– 20
17 U
PDAT
E FO
R M
ICHI
GAN
– EX
HIBI
T I
Note: Municipal-level data on this page is for Places and County Subdivisions, which include Census Designated Places (CDP). These are overlapping geographies so totals will not match county-level data. Municipal-level data often relies on 5-year averages and is not available for the smallest towns that do not report income.
Families with Children by Income, 2015
Assets, All Households, 2015
How many families with children are struggling?Children add significant expense to a family budget, so it is not surprising that many Genesee County families with children live below the ALICE Threshold. Though more Genesee County families are headed by married parents, those families with a single parent are more likely to have income below the ALICE Threshold.
What assets do households have?Ownership of assets can contribute to stability of households. Yet few families in Genesee County own liquid assets, such as a savings account, 401(k) plan, or rental income, that are readily available to cover emergency expenses. Vehicles, the most common asset, depreciate over time. Homeownership, the next most common asset, can build wealth, but is not a liquid asset.
1 Vehicle
2 Vehicles
No Mortgage
3 Vehicles
With Mortgage
4+ Vehicles
0%
10%
20%
30%
40%
50%
60%
70%
80%
90%
100%
Vehicle Home Interest, Dividends, or RentalIncome
Perc
ent o
f Hou
seho
lds
260493
13%
57% 43%
5%
23%
25% 82%
20% 32%
24,726
15,002
4,058
0
5,000
10,000
15,000
20,000
25,000
30,000
0%
10%
20%
30%
40%
50%
60%
70%
80%
90%
100%
Married SingleFemale-Headed
SingleMale-
HeadedTo
tal H
ouse
hold
s
Perc
ent o
f Fam
ilies
with
Chi
ldre
n
260492
Poverty ALICE Above AT Total HH
Genesee County, 2015
Town Total HH% ALICE
& Poverty
Argentine Township 2,503 30%
Atlas Township 2,759 17%
Burton City 11,458 41%
Clayton Charter Township 2,845 23%
Clio City 1,269 57%
Davison City 2,374 48%
Davison Township 8,145 33%
Fenton Charter Township 5,883 18%
Fenton City 4,769 40%
Flint Charter Township 12,763 42%
Flint City 40,260 63%
Flushing Charter Township 3,845 25%
Flushing City 3,385 34%
Forest Township 1,876 32%
Gaines Township 2,531 23%
Genesee Charter Township 8,325 37%
Grand Blanc Charter Township 14,259 25%
Grand Blanc City 3,422 34%
Linden City 1,523 28%
Montrose Charter Township 2,111 31%
Montrose City 623 44%
Mount Morris City 1,168 71%
Mount Morris Township 8,036 52%
Mundy Township 6,076 25%
Richfield Township 3,092 23%
Swartz Creek City 2,325 34%
Thetford Township 2,674 32%
Vienna Charter Township 4,969 29%

UNIT
ED W
AY A
LICE
REP
ORT
– 20
17 U
PDAT
E FO
R M
ICHI
GAN
– EX
HIBI
T I
2015 Point-in-Time Data
Households by Income, 2007 to 2015
Population: 25,501 | Number of Households: 10,960Median Household Income: $38,021 (state average: $51,084)Unemployment Rate: 11% (state average: 7.2%)ALICE Households: 29% (state average: 25%); Poverty Households: 18% (state average: 15%)
How many households are struggling?ALICE is an acronym for Asset Limited, Income Constrained, Employed – households that earn more than the Federal Poverty Level, but less than the basic cost of living for the county (the ALICE Threshold, or AT). Combined, the number of poverty and ALICE households equals the total population struggling to afford basic needs. The number of households below the ALICE Threshold changes over time; households move in and out of poverty and ALICE as circumstances improve or worsen. The Great Recession, from 2007 to 2010, caused hardship for many families. Conditions started to improve in 2010 and 2012 for some, but not for all.
What does it cost to afford the basic necessities?The bare-minimum Household Survival Budget does not include any savings, leaving a household vulnerable to unexpected expenses. ALICE households typically earn above the Federal Poverty Level of $11,770 for a single adult and $24,250 for a family of four, but less than the Household Survival Budget.
ALICE IN GLADWIN COUNTY
Household Survival Budget, Gladwin County
SINGLE ADULT2 ADULTS, 1 INFANT,
1 PRESCHOOLERMonthly Costs
Housing $448 $643Child Care $– $990Food $184 $609Transportation $349 $697Health Care $184 $707Miscellaneous $133 $390Taxes $165 $254
Monthly Total $1,463 $4,290ANNUAL TOTAL $17,556 $51,480Hourly Wage $8.78 $25.74
Sources: 2015 Point-in-Time Data: American Community Survey. ALICE Demographics: American Community Survey; the ALICE Threshold. Budget: U.S. Department of Housing and Urban Development (HUD); U.S. Department of Agriculture (USDA); Bureau of Labor Statistics (BLS); Internal Revenue Service (IRS); Michigan Department of Treasury; Early Childhood Investment Corporation.
19% 18% 18% 18%
19% 19% 23% 29%
62% 63% 59%
53%
11,537 11,338 10,721 10,960
-
2,000
4,000
6,000
8,000
10,000
12,000
14,000
0%
10%
20%
30%
40%
50%
60%
70%
80%
90%
100%
2007 2010 2012 2015
Tota
l Hou
seho
lds
Perc
ent o
f Hou
seho
lds
260511
Poverty ALICE Above AT Total HH

UNIT
ED W
AY A
LICE
REP
ORT
– 20
17 U
PDAT
E FO
R M
ICHI
GAN
– EX
HIBI
T I
Note: Municipal-level data on this page is for Places and County Subdivisions, which include Census Designated Places (CDP). These are overlapping geographies so totals will not match county-level data. Municipal-level data often relies on 5-year averages and is not available for the smallest towns that do not report income.
Families with Children by Income, 2015
Assets, All Households, 2015
How many families with children are struggling?Children add significant expense to a family budget, so it is not surprising that many Gladwin County families with children live below the ALICE Threshold. Though more Gladwin County families are headed by married parents, those families with a single parent are more likely to have income below the ALICE Threshold.
What assets do households have?Ownership of assets can contribute to stability of households. Yet few families in Gladwin County own liquid assets, such as a savings account, 401(k) plan, or rental income, that are readily available to cover emergency expenses. Vehicles, the most common asset, depreciate over time. Homeownership, the next most common asset, can build wealth, but is not a liquid asset.
1 Vehicle
2 Vehicles
No Mortgage
3 Vehicles
With Mortgage
4+ Vehicles
0%
10%
20%
30%
40%
50%
60%
70%
80%
90%
100%
Vehicle Home Interest, Dividends, or RentalIncome
Perc
ent o
f Hou
seho
lds
260513
20%
69%
25%
10%
17%
57%
70%
14% 18% 1,524
561
281
0
200
400
600
800
1,000
1,200
1,400
1,600
1,800
0%
10%
20%
30%
40%
50%
60%
70%
80%
90%
100%
Married SingleFemale-Headed
SingleMale-
HeadedTo
tal H
ouse
hold
s
Perc
ent o
f Fam
ilies
with
Chi
ldre
n
260512
Poverty ALICE Above AT Total HH
Gladwin County, 2015
Town Total HH% ALICE
& Poverty
Beaverton City 504 64%
Beaverton Township 766 43%
Bentley Township 344 35%
Billings Township 1,087 53%
Bourret Township 191 44%
Buckeye Township 562 50%
Butman Township 894 40%
Clement Township 399 44%
Gladwin City 1,298 64%
Gladwin Township 433 47%
Grout Township 660 35%
Hay Township 581 56%
Sage Township 1,035 42%
Secord Township 592 38%
Sherman Township 468 52%
Tobacco Township 1,094 35%

UNIT
ED W
AY A
LICE
REP
ORT
– 20
17 U
PDAT
E FO
R M
ICHI
GAN
– EX
HIBI
T I
2015 Point-in-Time Data
Households by Income, 2007 to 2015
Population: 15,824 | Number of Households: 6,741Median Household Income: $35,686 (state average: $51,084)Unemployment Rate: 9.5% (state average: 7.2%)ALICE Households: 29% (state average: 25%); Poverty Households: 19% (state average: 15%)
How many households are struggling?ALICE is an acronym for Asset Limited, Income Constrained, Employed – households that earn more than the Federal Poverty Level, but less than the basic cost of living for the county (the ALICE Threshold, or AT). Combined, the number of poverty and ALICE households equals the total population struggling to afford basic needs. The number of households below the ALICE Threshold changes over time; households move in and out of poverty and ALICE as circumstances improve or worsen. The Great Recession, from 2007 to 2010, caused hardship for many families. Conditions started to improve in 2010 and 2012 for some, but not for all.
What does it cost to afford the basic necessities?The bare-minimum Household Survival Budget does not include any savings, leaving a household vulnerable to unexpected expenses. ALICE households typically earn above the Federal Poverty Level of $11,770 for a single adult and $24,250 for a family of four, but less than the Household Survival Budget.
ALICE IN GOGEBIC COUNTY
Household Survival Budget, Gogebic County
SINGLE ADULT2 ADULTS, 1 INFANT,
1 PRESCHOOLERMonthly Costs
Housing $442 $643Child Care $– $1,001Food $184 $609Transportation $349 $697Health Care $184 $707Miscellaneous $132 $392Taxes $164 $258
Monthly Total $1,455 $4,307ANNUAL TOTAL $17,460 $51,684Hourly Wage $8.73 $25.84
Sources: 2015 Point-in-Time Data: American Community Survey. ALICE Demographics: American Community Survey; the ALICE Threshold. Budget: U.S. Department of Housing and Urban Development (HUD); U.S. Department of Agriculture (USDA); Bureau of Labor Statistics (BLS); Internal Revenue Service (IRS); Michigan Department of Treasury; Early Childhood Investment Corporation.
#N/A 16% 19% 19%
27% 27% 29%
57% 54% 52%
7,302 7,234 6,741
-
1,000
2,000
3,000
4,000
5,000
6,000
7,000
8,000
0%
10%
20%
30%
40%
50%
60%
70%
80%
90%
100%
2010 2012 2015
Tota
l Hou
seho
lds
Perc
ent o
f Hou
seho
lds
260531
Poverty ALICE Above AT Total HH
N/A

UNIT
ED W
AY A
LICE
REP
ORT
– 20
17 U
PDAT
E FO
R M
ICHI
GAN
– EX
HIBI
T I
Note: Municipal-level data on this page is for Places and County Subdivisions, which include Census Designated Places (CDP). These are overlapping geographies so totals will not match county-level data. Municipal-level data often relies on 5-year averages and is not available for the smallest towns that do not report income.
Families with Children by Income, 2015
Assets, All Households, 2015
How many families with children are struggling?Children add significant expense to a family budget, so it is not surprising that many Gogebic County families with children live below the ALICE Threshold. Though more Gogebic County families are headed by married parents, those families with a single parent are more likely to have income below the ALICE Threshold.
What assets do households have?Ownership of assets can contribute to stability of households. Yet few families in Gogebic County own liquid assets, such as a savings account, 401(k) plan, or rental income, that are readily available to cover emergency expenses. Vehicles, the most common asset, depreciate over time. Homeownership, the next most common asset, can build wealth, but is not a liquid asset.
1 Vehicle
2 Vehicles
No Mortgage
3 Vehicles
With Mortgage
4+ Vehicles
0%
10%
20%
30%
40%
50%
60%
70%
80%
90%
100%
Vehicle Home Interest, Dividends, or RentalIncome
Perc
ent o
f Hou
seho
lds
260533
19%
64%
16%
10%
24%
30%
71%
12%
54%
710
355
106
0
100
200
300
400
500
600
700
800
0%
10%
20%
30%
40%
50%
60%
70%
80%
90%
100%
Married SingleFemale-Headed
SingleMale-
HeadedTo
tal H
ouse
hold
s
Perc
ent o
f Fam
ilies
with
Chi
ldre
n
260532
Poverty ALICE Above AT Total HH
Gogebic County, 2015
Town Total HH% ALICE
& Poverty
Bessemer City 857 50%
Bessemer Township 501 40%
Erwin Township 153 36%
Ironwood Charter Township 950 33%
Ironwood City 2,490 61%
Marenisco Township 250 40%
Wakefield City 771 42%
Wakefield Township 149 51%
Watersmeet Township 620 31%

UNIT
ED W
AY A
LICE
REP
ORT
– 20
17 U
PDAT
E FO
R M
ICHI
GAN
– EX
HIBI
T I
2015 Point-in-Time Data
Households by Income, 2007 to 2015
Population: 91,636 | Number of Households: 36,952Median Household Income: $55,013 (state average: $51,084)Unemployment Rate: 4.4% (state average: 7.2%)ALICE Households: 25% (state average: 25%); Poverty Households: 10% (state average: 15%)
How many households are struggling?ALICE is an acronym for Asset Limited, Income Constrained, Employed – households that earn more than the Federal Poverty Level, but less than the basic cost of living for the county (the ALICE Threshold, or AT). Combined, the number of poverty and ALICE households equals the total population struggling to afford basic needs. The number of households below the ALICE Threshold changes over time; households move in and out of poverty and ALICE as circumstances improve or worsen. The Great Recession, from 2007 to 2010, caused hardship for many families. Conditions started to improve in 2010 and 2012 for some, but not for all.
What does it cost to afford the basic necessities?The bare-minimum Household Survival Budget does not include any savings, leaving a household vulnerable to unexpected expenses. ALICE households typically earn above the Federal Poverty Level of $11,770 for a single adult and $24,250 for a family of four, but less than the Household Survival Budget.
ALICE IN GRAND TRAVERSE COUNTY
Household Survival Budget, Grand Traverse County
SINGLE ADULT2 ADULTS, 1 INFANT,
1 PRESCHOOLERMonthly Costs
Housing $591 $825Child Care $– $1,229Food $184 $609Transportation $349 $697Health Care $184 $707Miscellaneous $150 $445Taxes $198 $383
Monthly Total $1,656 $4,895ANNUAL TOTAL $19,872 $58,740Hourly Wage $9.94 $29.37
Sources: 2015 Point-in-Time Data: American Community Survey. ALICE Demographics: American Community Survey; the ALICE Threshold. Budget: U.S. Department of Housing and Urban Development (HUD); U.S. Department of Agriculture (USDA); Bureau of Labor Statistics (BLS); Internal Revenue Service (IRS); Michigan Department of Treasury; Early Childhood Investment Corporation.
9% 12% 12% 10%
29% 27% 27% 25%
62% 61% 61% 65%
34,900 35,273 35,018 36,952
-
5,000
10,000
15,000
20,000
25,000
30,000
35,000
40,000
0%
10%
20%
30%
40%
50%
60%
70%
80%
90%
100%
2007 2010 2012 2015
Tota
l Hou
seho
lds
Perc
ent o
f Hou
seho
lds
260551
Poverty ALICE Above AT Total HH

UNIT
ED W
AY A
LICE
REP
ORT
– 20
17 U
PDAT
E FO
R M
ICHI
GAN
– EX
HIBI
T I
Note: Municipal-level data on this page is for Places and County Subdivisions, which include Census Designated Places (CDP). These are overlapping geographies so totals will not match county-level data. Municipal-level data often relies on 5-year averages and is not available for the smallest towns that do not report income.
Families with Children by Income, 2015
Assets, All Households, 2015
How many families with children are struggling?Children add significant expense to a family budget, so it is not surprising that many Grand Traverse County families with children live below the ALICE Threshold. Though more Grand Traverse County families are headed by married parents, those families with a single parent are more likely to have income below the ALICE Threshold.
What assets do households have?Ownership of assets can contribute to stability of households. Yet few families in Grand Traverse County own liquid assets, such as a savings account, 401(k) plan, or rental income, that are readily available to cover emergency expenses. Vehicles, the most common asset, depreciate over time. Homeownership, the next most common asset, can build wealth, but is not a liquid asset.
1 Vehicle
2 Vehicles
No Mortgage
3 Vehicles
With Mortgage
4+ Vehicles
0%
20%
40%
60%
80%
100%
120%
Vehicle Home Interest, Dividends, or RentalIncome
Perc
ent o
f Hou
seho
lds
260553
4%
47%
13% 14%
34%
47%
82%
19%
40%
5,933
1,833
768
0
1,000
2,000
3,000
4,000
5,000
6,000
7,000
0%
10%
20%
30%
40%
50%
60%
70%
80%
90%
100%
Married SingleFemale-Headed
SingleMale-
HeadedTo
tal H
ouse
hold
s
Perc
ent o
f Fam
ilies
with
Chi
ldre
n
260552
Poverty ALICE Above AT Total HH
Grand Traverse County, 2015
Town Total HH% ALICE
& Poverty
Acme Township 1,875 21%
Blair Township 2,944 50%
East Bay Township 4,318 31%
Fife Lake Township 529 43%
Garfield Charter Township 7,033 45%
Grant Township 427 39%
Green Lake Township 2,107 31%
Long Lake Township 3,529 29%
Mayfield Township 534 35%
Paradise Township 1,689 40%
Peninsula Township 2,603 21%
Traverse City 6,375 44%
Union Township 143 33%
Whitewater Township 976 21%

UNIT
ED W
AY A
LICE
REP
ORT
– 20
17 U
PDAT
E FO
R M
ICHI
GAN
– EX
HIBI
T I
2015 Point-in-Time Data
Households by Income, 2007 to 2015
Population: 41,878 | Number of Households: 14,716Median Household Income: $41,912 (state average: $51,084)Unemployment Rate: 8.5% (state average: 7.2%)ALICE Households: 30% (state average: 25%); Poverty Households: 18% (state average: 15%)
How many households are struggling?ALICE is an acronym for Asset Limited, Income Constrained, Employed – households that earn more than the Federal Poverty Level, but less than the basic cost of living for the county (the ALICE Threshold, or AT). Combined, the number of poverty and ALICE households equals the total population struggling to afford basic needs. The number of households below the ALICE Threshold changes over time; households move in and out of poverty and ALICE as circumstances improve or worsen. The Great Recession, from 2007 to 2010, caused hardship for many families. Conditions started to improve in 2010 and 2012 for some, but not for all.
What does it cost to afford the basic necessities?The bare-minimum Household Survival Budget does not include any savings, leaving a household vulnerable to unexpected expenses. ALICE households typically earn above the Federal Poverty Level of $11,770 for a single adult and $24,250 for a family of four, but less than the Household Survival Budget.
ALICE IN GRATIOT COUNTY
Household Survival Budget, Gratiot County
SINGLE ADULT2 ADULTS, 1 INFANT,
1 PRESCHOOLERMonthly Costs
Housing $448 $643Child Care $– $916Food $184 $609Transportation $349 $697Health Care $184 $707Miscellaneous $133 $380Taxes $165 $232
Monthly Total $1,463 $4,184ANNUAL TOTAL $17,556 $50,208Hourly Wage $8.78 $25.10
Sources: 2015 Point-in-Time Data: American Community Survey. ALICE Demographics: American Community Survey; the ALICE Threshold. Budget: U.S. Department of Housing and Urban Development (HUD); U.S. Department of Agriculture (USDA); Bureau of Labor Statistics (BLS); Internal Revenue Service (IRS); Michigan Department of Treasury; Early Childhood Investment Corporation.
15% 15% 18% 18%
28% 33% 32% 30%
57% 52% 50% 52%
14,317 14,720 14,754 14,716
-
2,000
4,000
6,000
8,000
10,000
12,000
14,000
16,000
0%
10%
20%
30%
40%
50%
60%
70%
80%
90%
100%
2007 2010 2012 2015
Tota
l Hou
seho
lds
Perc
ent o
f Hou
seho
lds
260571
Poverty ALICE Above AT Total HH

UNIT
ED W
AY A
LICE
REP
ORT
– 20
17 U
PDAT
E FO
R M
ICHI
GAN
– EX
HIBI
T I
Note: Municipal-level data on this page is for Places and County Subdivisions, which include Census Designated Places (CDP). These are overlapping geographies so totals will not match county-level data. Municipal-level data often relies on 5-year averages and is not available for the smallest towns that do not report income.
Families with Children by Income, 2015
Assets, All Households, 2015
How many families with children are struggling?Children add significant expense to a family budget, so it is not surprising that many Gratiot County families with children live below the ALICE Threshold. Though more Gratiot County families are headed by married parents, those families with a single parent are more likely to have income below the ALICE Threshold.
What assets do households have?Ownership of assets can contribute to stability of households. Yet few families in Gratiot County own liquid assets, such as a savings account, 401(k) plan, or rental income, that are readily available to cover emergency expenses. Vehicles, the most common asset, depreciate over time. Homeownership, the next most common asset, can build wealth, but is not a liquid asset.
1 Vehicle
2 Vehicles
No Mortgage
3 Vehicles
With Mortgage
4+ Vehicles
0%
10%
20%
30%
40%
50%
60%
70%
80%
90%
100%
Vehicle Home Interest, Dividends, or RentalIncome
Perc
ent o
f Hou
seho
lds
260573
10%
59%
30% 16%
29%
42%
74%
12%
28% 2,487
1,082
499
0
500
1,000
1,500
2,000
2,500
3,000
0%
10%
20%
30%
40%
50%
60%
70%
80%
90%
100%
Married SingleFemale-Headed
SingleMale-
HeadedTo
tal H
ouse
hold
s
Perc
ent o
f Fam
ilies
with
Chi
ldre
n
260572
Poverty ALICE Above AT Total HH
Gratiot County, 2015
Town Total HH% ALICE
& Poverty
Alma City 3,423 59%
Arcada Township 748 41%
Bethany Township 514 35%
Elba Township 483 44%
Emerson Township 354 37%
Fulton Township 901 33%
Hamilton Township 185 48%
Ithaca City 1,210 51%
Lafayette Township 216 30%
New Haven Township 413 43%
Newark Township 435 35%
North Shade Township 238 36%
North Star Township 360 39%
Pine River Township 878 44%
Seville Township 812 44%
St. Louis City 1,310 58%
Sumner Township 738 47%
Washington Township 354 38%
Wheeler Township 1,144 51%

UNIT
ED W
AY A
LICE
REP
ORT
– 20
17 U
PDAT
E FO
R M
ICHI
GAN
– EX
HIBI
T I
2015 Point-in-Time Data
Households by Income, 2007 to 2015
Population: 46,178 | Number of Households: 17,810Median Household Income: $41,961 (state average: $51,084)Unemployment Rate: 9% (state average: 7.2%)ALICE Households: 24% (state average: 25%); Poverty Households: 17% (state average: 15%)
How many households are struggling?ALICE is an acronym for Asset Limited, Income Constrained, Employed – households that earn more than the Federal Poverty Level, but less than the basic cost of living for the county (the ALICE Threshold, or AT). Combined, the number of poverty and ALICE households equals the total population struggling to afford basic needs. The number of households below the ALICE Threshold changes over time; households move in and out of poverty and ALICE as circumstances improve or worsen. The Great Recession, from 2007 to 2010, caused hardship for many families. Conditions started to improve in 2010 and 2012 for some, but not for all.
What does it cost to afford the basic necessities?The bare-minimum Household Survival Budget does not include any savings, leaving a household vulnerable to unexpected expenses. ALICE households typically earn above the Federal Poverty Level of $11,770 for a single adult and $24,250 for a family of four, but less than the Household Survival Budget.
ALICE IN HILLSDALE COUNTY
Household Survival Budget, Hillsdale County
SINGLE ADULT2 ADULTS, 1 INFANT,
1 PRESCHOOLERMonthly Costs
Housing $393 $643Child Care $– $695Food $184 $609Transportation $349 $697Health Care $184 $707Miscellaneous $126 $352Taxes $152 $171
Monthly Total $1,388 $3,874ANNUAL TOTAL $16,656 $46,488Hourly Wage $8.33 $23.24
Sources: 2015 Point-in-Time Data: American Community Survey. ALICE Demographics: American Community Survey; the ALICE Threshold. Budget: U.S. Department of Housing and Urban Development (HUD); U.S. Department of Agriculture (USDA); Bureau of Labor Statistics (BLS); Internal Revenue Service (IRS); Michigan Department of Treasury; Early Childhood Investment Corporation.
14% 16% 17% 17%
16% 21% 21% 24%
70%
63% 62% 59%
18,206 17,074
17,784 17,810
-
2,000
4,000
6,000
8,000
10,000
12,000
14,000
16,000
18,000
20,000
0%
10%
20%
30%
40%
50%
60%
70%
80%
90%
100%
2007 2010 2012 2015
Tota
l Hou
seho
lds
Perc
ent o
f Hou
seho
lds
260591
Poverty ALICE Above AT Total HH

UNIT
ED W
AY A
LICE
REP
ORT
– 20
17 U
PDAT
E FO
R M
ICHI
GAN
– EX
HIBI
T I
Note: Municipal-level data on this page is for Places and County Subdivisions, which include Census Designated Places (CDP). These are overlapping geographies so totals will not match county-level data. Municipal-level data often relies on 5-year averages and is not available for the smallest towns that do not report income.
Families with Children by Income, 2015
Assets, All Households, 2015
How many families with children are struggling?Children add significant expense to a family budget, so it is not surprising that many Hillsdale County families with children live below the ALICE Threshold. Though more Hillsdale County families are headed by married parents, those families with a single parent are more likely to have income below the ALICE Threshold.
What assets do households have?Ownership of assets can contribute to stability of households. Yet few families in Hillsdale County own liquid assets, such as a savings account, 401(k) plan, or rental income, that are readily available to cover emergency expenses. Vehicles, the most common asset, depreciate over time. Homeownership, the next most common asset, can build wealth, but is not a liquid asset.
1 Vehicle
2 Vehicles
No Mortgage
3 Vehicles
With Mortgage
4+ Vehicles
0%
10%
20%
30%
40%
50%
60%
70%
80%
90%
100%
Vehicle Home Interest, Dividends, or RentalIncome
Perc
ent o
f Hou
seho
lds
260593
16%
58%
34% 12%
27%
30%
72%
15%
36%
3,072
862
458
0
500
1,000
1,500
2,000
2,500
3,000
3,500
0%
10%
20%
30%
40%
50%
60%
70%
80%
90%
100%
Married SingleFemale-Headed
SingleMale-
HeadedTo
tal H
ouse
hold
s
Perc
ent o
f Fam
ilies
with
Chi
ldre
n
260592
Poverty ALICE Above AT Total HH
Hillsdale County, 2015
Town Total HH% ALICE
& Poverty
Adams Township 972 44%
Allen Township 609 40%
Amboy Township 444 36%
Cambria Township 989 36%
Camden Township 716 41%
Fayette Township 341 40%
Hillsdale City 2,930 59%
Hillsdale Township 812 24%
Jefferson Township 1,217 40%
Litchfield City 529 50%
Litchfield Township 402 36%
Moscow Township 547 37%
Pittsford Township 580 33%
Ransom Township 328 35%
Reading City 412 57%
Reading Township 732 35%
Scipio Township 633 39%
Somerset Township 2,108 32%
Wheatland Township 522 32%
Woodbridge Township 439 48%
Wright Township 656 47%

UNIT
ED W
AY A
LICE
REP
ORT
– 20
17 U
PDAT
E FO
R M
ICHI
GAN
– EX
HIBI
T I
2015 Point-in-Time Data
Households by Income, 2007 to 2015
Population: 36,660 | Number of Households: 13,765Median Household Income: $37,776 (state average: $51,084)Unemployment Rate: 7.2% (state average: 7.2%)ALICE Households: 31% (state average: 25%); Poverty Households: 20% (state average: 15%)
How many households are struggling?ALICE is an acronym for Asset Limited, Income Constrained, Employed – households that earn more than the Federal Poverty Level, but less than the basic cost of living for the county (the ALICE Threshold, or AT). Combined, the number of poverty and ALICE households equals the total population struggling to afford basic needs. The number of households below the ALICE Threshold changes over time; households move in and out of poverty and ALICE as circumstances improve or worsen. The Great Recession, from 2007 to 2010, caused hardship for many families. Conditions started to improve in 2010 and 2012 for some, but not for all.
What does it cost to afford the basic necessities?The bare-minimum Household Survival Budget does not include any savings, leaving a household vulnerable to unexpected expenses. ALICE households typically earn above the Federal Poverty Level of $11,770 for a single adult and $24,250 for a family of four, but less than the Household Survival Budget.
ALICE IN HOUGHTON COUNTY
Household Survival Budget, Houghton County
SINGLE ADULT2 ADULTS, 1 INFANT,
1 PRESCHOOLERMonthly Costs
Housing $465 $643Child Care $– $1,231Food $184 $609Transportation $349 $697Health Care $184 $707Miscellaneous $135 $422Taxes $169 $328
Monthly Total $1,486 $4,637ANNUAL TOTAL $17,832 $55,644Hourly Wage $8.92 $27.82
Sources: 2015 Point-in-Time Data: American Community Survey. ALICE Demographics: American Community Survey; the ALICE Threshold. Budget: U.S. Department of Housing and Urban Development (HUD); U.S. Department of Agriculture (USDA); Bureau of Labor Statistics (BLS); Internal Revenue Service (IRS); Michigan Department of Treasury; Early Childhood Investment Corporation.
23% 22% 21% 20%
25% 29% 28% 31%
52% 49% 51% 49%
14,086 13,737 13,987 13,765
-
2,000
4,000
6,000
8,000
10,000
12,000
14,000
16,000
0%
10%
20%
30%
40%
50%
60%
70%
80%
90%
100%
2007 2010 2012 2015
Tota
l Hou
seho
lds
Perc
ent o
f Hou
seho
lds
260611
Poverty ALICE Above AT Total HH

UNIT
ED W
AY A
LICE
REP
ORT
– 20
17 U
PDAT
E FO
R M
ICHI
GAN
– EX
HIBI
T I
Note: Municipal-level data on this page is for Places and County Subdivisions, which include Census Designated Places (CDP). These are overlapping geographies so totals will not match county-level data. Municipal-level data often relies on 5-year averages and is not available for the smallest towns that do not report income.
Families with Children by Income, 2015
Assets, All Households, 2015
How many families with children are struggling?Children add significant expense to a family budget, so it is not surprising that many Houghton County families with children live below the ALICE Threshold. Though more Houghton County families are headed by married parents, those families with a single parent are more likely to have income below the ALICE Threshold.
What assets do households have?Ownership of assets can contribute to stability of households. Yet few families in Houghton County own liquid assets, such as a savings account, 401(k) plan, or rental income, that are readily available to cover emergency expenses. Vehicles, the most common asset, depreciate over time. Homeownership, the next most common asset, can build wealth, but is not a liquid asset.
1 Vehicle
2 Vehicles
No Mortgage
3 Vehicles
With Mortgage
4+ Vehicles
0%
10%
20%
30%
40%
50%
60%
70%
80%
90%
100%
Vehicle Home Interest, Dividends, or RentalIncome
Perc
ent o
f Hou
seho
lds
260613
10%
46% 32% 14%
41%
43%
76%
13% 25%
2,248
637
251
0
500
1,000
1,500
2,000
2,500
0%
10%
20%
30%
40%
50%
60%
70%
80%
90%
100%
Married SingleFemale-Headed
SingleMale-
HeadedTo
tal H
ouse
hold
s
Perc
ent o
f Fam
ilies
with
Chi
ldre
n
260612
Poverty ALICE Above AT Total HH
Houghton County, 2015
Town Total HH% ALICE
& Poverty
Adams Township 898 46%
Calumet Charter Township 2,602 59%
Chassell Township 715 39%
Duncan Township 129 53%
Franklin Township 498 44%
Hancock City 1,825 57%
Hancock Township 192 38%
Houghton City 2,650 63%
Laird Township 180 47%
Osceola Township 666 45%
Portage Charter Township 1,202 38%
Quincy Township 108 43%
Schoolcraft Township 725 49%
Stanton Township 471 37%
Torch Lake Township 837 43%

UNIT
ED W
AY A
LICE
REP
ORT
– 20
17 U
PDAT
E FO
R M
ICHI
GAN
– EX
HIBI
T I
2015 Point-in-Time Data
Households by Income, 2007 to 2015
Population: 32,290 | Number of Households: 13,805Median Household Income: $42,161 (state average: $51,084)Unemployment Rate: 7.8% (state average: 7.2%)ALICE Households: 28% (state average: 25%); Poverty Households: 14% (state average: 15%)
How many households are struggling?ALICE is an acronym for Asset Limited, Income Constrained, Employed – households that earn more than the Federal Poverty Level, but less than the basic cost of living for the county (the ALICE Threshold, or AT). Combined, the number of poverty and ALICE households equals the total population struggling to afford basic needs. The number of households below the ALICE Threshold changes over time; households move in and out of poverty and ALICE as circumstances improve or worsen. The Great Recession, from 2007 to 2010, caused hardship for many families. Conditions started to improve in 2010 and 2012 for some, but not for all.
What does it cost to afford the basic necessities?The bare-minimum Household Survival Budget does not include any savings, leaving a household vulnerable to unexpected expenses. ALICE households typically earn above the Federal Poverty Level of $11,770 for a single adult and $24,250 for a family of four, but less than the Household Survival Budget.
ALICE IN HURON COUNTY
Household Survival Budget, Huron County
SINGLE ADULT2 ADULTS, 1 INFANT,
1 PRESCHOOLERMonthly Costs
Housing $448 $643Child Care $– $986Food $184 $609Transportation $349 $697Health Care $184 $707Miscellaneous $133 $390Taxes $165 $253
Monthly Total $1,463 $4,285ANNUAL TOTAL $17,556 $51,420Hourly Wage $8.78 $25.71
Sources: 2015 Point-in-Time Data: American Community Survey. ALICE Demographics: American Community Survey; the ALICE Threshold. Budget: U.S. Department of Housing and Urban Development (HUD); U.S. Department of Agriculture (USDA); Bureau of Labor Statistics (BLS); Internal Revenue Service (IRS); Michigan Department of Treasury; Early Childhood Investment Corporation.
13% 14% 14% 14%
23% 26% 23% 28%
64% 60%
63% 58%
15,062 14,273 13,957 13,805
-
2,000
4,000
6,000
8,000
10,000
12,000
14,000
16,000
0%
10%
20%
30%
40%
50%
60%
70%
80%
90%
100%
2007 2010 2012 2015
Tota
l Hou
seho
lds
Perc
ent o
f Hou
seho
lds
260631
Poverty ALICE Above AT Total HH

UNIT
ED W
AY A
LICE
REP
ORT
– 20
17 U
PDAT
E FO
R M
ICHI
GAN
– EX
HIBI
T I
Note: Municipal-level data on this page is for Places and County Subdivisions, which include Census Designated Places (CDP). These are overlapping geographies so totals will not match county-level data. Municipal-level data often relies on 5-year averages and is not available for the smallest towns that do not report income.
Families with Children by Income, 2015
Assets, All Households, 2015
How many families with children are struggling?Children add significant expense to a family budget, so it is not surprising that many Huron County families with children live below the ALICE Threshold. Though more Huron County families are headed by married parents, those families with a single parent are more likely to have income below the ALICE Threshold.
What assets do households have?Ownership of assets can contribute to stability of households. Yet few families in Huron County own liquid assets, such as a savings account, 401(k) plan, or rental income, that are readily available to cover emergency expenses. Vehicles, the most common asset, depreciate over time. Homeownership, the next most common asset, can build wealth, but is not a liquid asset.
1 Vehicle
2 Vehicles
No Mortgage
3 Vehicles
With Mortgage
4+ Vehicles
0%
10%
20%
30%
40%
50%
60%
70%
80%
90%
100%
Vehicle Home Interest, Dividends, or RentalIncome
Perc
ent o
f Hou
seho
lds
260633
8%
53%
24% 13%
32%
40%
79%
15%
36% 2,079
734
341
0
500
1,000
1,500
2,000
2,500
0%
10%
20%
30%
40%
50%
60%
70%
80%
90%
100%
Married SingleFemale-Headed
SingleMale-
HeadedTo
tal H
ouse
hold
s
Perc
ent o
f Fam
ilies
with
Chi
ldre
n
260632
Poverty ALICE Above AT Total HH
Huron County, 2015
Town Total HH% ALICE
& Poverty
Bad Axe City 1,299 52%
Bingham Township 616 43%
Bloomfield Township 180 39%
Brookfield Township 291 35%
Caseville City 408 57%
Caseville Township 823 42%
Chandler Township 186 35%
Colfax Township 689 39%
Dwight Township 333 48%
Fairhaven Township 459 54%
Grant Township 350 32%
Harbor Beach City 807 55%
Hume Township 327 32%
Huron Township 176 50%
Lake Township 350 42%
Lincoln Township 319 49%
Mckinley Township 206 35%
Meade Township 317 30%
Oliver Township 586 50%
Paris Township 190 40%
Port Austin Township 725 43%
Rubicon Township 346 42%
Sand Beach Township 429 37%
Sebewaing Township 1,117 30%
Sheridan Township 247 30%
Sherman Township 415 43%
Sigel Township 184 27%
Verona Township 454 29%
Winsor Township 876 43%

UNIT
ED W
AY A
LICE
REP
ORT
– 20
17 U
PDAT
E FO
R M
ICHI
GAN
– EX
HIBI
T I
2015 Point-in-Time Data
Households by Income, 2007 to 2015
Population: 286,085 | Number of Households: 111,265Median Household Income: $47,082 (state average: $51,084)Unemployment Rate: 7.5% (state average: 7.2%)ALICE Households: 23% (state average: 25%); Poverty Households: 20% (state average: 15%)
How many households are struggling?ALICE is an acronym for Asset Limited, Income Constrained, Employed – households that earn more than the Federal Poverty Level, but less than the basic cost of living for the county (the ALICE Threshold, or AT). Combined, the number of poverty and ALICE households equals the total population struggling to afford basic needs. The number of households below the ALICE Threshold changes over time; households move in and out of poverty and ALICE as circumstances improve or worsen. The Great Recession, from 2007 to 2010, caused hardship for many families. Conditions started to improve in 2010 and 2012 for some, but not for all.
What does it cost to afford the basic necessities?The bare-minimum Household Survival Budget does not include any savings, leaving a household vulnerable to unexpected expenses. ALICE households typically earn above the Federal Poverty Level of $11,770 for a single adult and $24,250 for a family of four, but less than the Household Survival Budget.
ALICE IN INGHAM COUNTY
Household Survival Budget, Ingham County
SINGLE ADULT2 ADULTS, 1 INFANT,
1 PRESCHOOLERMonthly Costs
Housing $490 $776Child Care $– $1,134Food $184 $609Transportation $349 $697Health Care $184 $707Miscellaneous $138 $426Taxes $175 $339
Monthly Total $1,520 $4,688ANNUAL TOTAL $18,240 $56,256Hourly Wage $9.12 $28.13
Sources: 2015 Point-in-Time Data: American Community Survey. ALICE Demographics: American Community Survey; the ALICE Threshold. Budget: U.S. Department of Housing and Urban Development (HUD); U.S. Department of Agriculture (USDA); Bureau of Labor Statistics (BLS); Internal Revenue Service (IRS); Michigan Department of Treasury; Early Childhood Investment Corporation.
18% 19% 23% 20%
20% 23% 19%
23%
62% 58% 58% 57%
107,111 108,234 109,008 111,265
-
20,000
40,000
60,000
80,000
100,000
120,000
0%
10%
20%
30%
40%
50%
60%
70%
80%
90%
100%
2007 2010 2012 2015
Tota
l Hou
seho
lds
Perc
ent o
f Hou
seho
lds
260651
Poverty ALICE Above AT Total HH

UNIT
ED W
AY A
LICE
REP
ORT
– 20
17 U
PDAT
E FO
R M
ICHI
GAN
– EX
HIBI
T I
Note: Municipal-level data on this page is for Places and County Subdivisions, which include Census Designated Places (CDP). These are overlapping geographies so totals will not match county-level data. Municipal-level data often relies on 5-year averages and is not available for the smallest towns that do not report income.
Families with Children by Income, 2015
Assets, All Households, 2015
How many families with children are struggling?Children add significant expense to a family budget, so it is not surprising that many Ingham County families with children live below the ALICE Threshold. Though more Ingham County families are headed by married parents, those families with a single parent are more likely to have income below the ALICE Threshold.
What assets do households have?Ownership of assets can contribute to stability of households. Yet few families in Ingham County own liquid assets, such as a savings account, 401(k) plan, or rental income, that are readily available to cover emergency expenses. Vehicles, the most common asset, depreciate over time. Homeownership, the next most common asset, can build wealth, but is not a liquid asset.
1 Vehicle
2 Vehicles
No Mortgage
3 Vehicles
With Mortgage
4+ Vehicles
0%
10%
20%
30%
40%
50%
60%
70%
80%
90%
100%
Vehicle Home Interest, Dividends, or RentalIncome
Perc
ent o
f Hou
seho
lds
260653
8%
44% 39% 9%
34%
26% 83%
22% 35%
14,892
7,409
2,541
0
2,000
4,000
6,000
8,000
10,000
12,000
14,000
16,000
0%
10%
20%
30%
40%
50%
60%
70%
80%
90%
100%
Married SingleFemale-Headed
SingleMale-
HeadedTo
tal H
ouse
hold
s
Perc
ent o
f Fam
ilies
with
Chi
ldre
n
260652
Poverty ALICE Above AT Total HH
Ingham County, 2015
Town Total HH% ALICE
& Poverty
Alaiedon Township 1,072 17%
Aurelius Township 1,381 16%
Bunker Hill Township 740 28%
Delhi Charter Township 10,515 29%
East Lansing City 13,169 57%
Ingham Township 835 22%
Lansing Charter Township 3,671 46%
Lansing City 46,291 56%
Leroy Township 1,331 41%
Leslie City 630 45%
Leslie Township 920 28%
Locke Township 573 18%
Mason City 3,201 36%
Meridian Charter Township 17,607 31%
Onondaga Township 1,098 34%
Stockbridge Township 1,425 38%
Vevay Township 1,269 12%
Wheatfield Township 648 18%
White Oak Township 470 26%
Williamston City 1,579 32%
Williamstown Township 1,993 16%

UNIT
ED W
AY A
LICE
REP
ORT
– 20
17 U
PDAT
E FO
R M
ICHI
GAN
– EX
HIBI
T I
2015 Point-in-Time Data
Households by Income, 2007 to 2015
Population: 64,064 | Number of Households: 22,092Median Household Income: $49,124 (state average: $51,084)Unemployment Rate: 10.4% (state average: 7.2%)ALICE Households: 31% (state average: 25%); Poverty Households: 14% (state average: 15%)
How many households are struggling?ALICE is an acronym for Asset Limited, Income Constrained, Employed – households that earn more than the Federal Poverty Level, but less than the basic cost of living for the county (the ALICE Threshold, or AT). Combined, the number of poverty and ALICE households equals the total population struggling to afford basic needs. The number of households below the ALICE Threshold changes over time; households move in and out of poverty and ALICE as circumstances improve or worsen. The Great Recession, from 2007 to 2010, caused hardship for many families. Conditions started to improve in 2010 and 2012 for some, but not for all.
What does it cost to afford the basic necessities?The bare-minimum Household Survival Budget does not include any savings, leaving a household vulnerable to unexpected expenses. ALICE households typically earn above the Federal Poverty Level of $11,770 for a single adult and $24,250 for a family of four, but less than the Household Survival Budget.
ALICE IN IONIA COUNTY
Household Survival Budget, Ionia County
SINGLE ADULT2 ADULTS, 1 INFANT,
1 PRESCHOOLERMonthly Costs
Housing $512 $680Child Care $– $1,091Food $184 $609Transportation $349 $697Health Care $184 $707Miscellaneous $141 $408Taxes $180 $297
Monthly Total $1,550 $4,489ANNUAL TOTAL $18,600 $53,868Hourly Wage $9.30 $26.93
Sources: 2015 Point-in-Time Data: American Community Survey. ALICE Demographics: American Community Survey; the ALICE Threshold. Budget: U.S. Department of Housing and Urban Development (HUD); U.S. Department of Agriculture (USDA); Bureau of Labor Statistics (BLS); Internal Revenue Service (IRS); Michigan Department of Treasury; Early Childhood Investment Corporation.
12% 15% 15% 14%
26% 24% 23% 31%
62% 61% 62%
55%
21,847 22,728 22,464 22,092
-
5,000
10,000
15,000
20,000
25,000
0%
10%
20%
30%
40%
50%
60%
70%
80%
90%
100%
2007 2010 2012 2015
Tota
l Hou
seho
lds
Perc
ent o
f Hou
seho
lds
260671
Poverty ALICE Above AT Total HH

UNIT
ED W
AY A
LICE
REP
ORT
– 20
17 U
PDAT
E FO
R M
ICHI
GAN
– EX
HIBI
T I
Note: Municipal-level data on this page is for Places and County Subdivisions, which include Census Designated Places (CDP). These are overlapping geographies so totals will not match county-level data. Municipal-level data often relies on 5-year averages and is not available for the smallest towns that do not report income.
Families with Children by Income, 2015
Assets, All Households, 2015
How many families with children are struggling?Children add significant expense to a family budget, so it is not surprising that many Ionia County families with children live below the ALICE Threshold. Though more Ionia County families are headed by married parents, those families with a single parent are more likely to have income below the ALICE Threshold.
What assets do households have?Ownership of assets can contribute to stability of households. Yet few families in Ionia County own liquid assets, such as a savings account, 401(k) plan, or rental income, that are readily available to cover emergency expenses. Vehicles, the most common asset, depreciate over time. Homeownership, the next most common asset, can build wealth, but is not a liquid asset.
1 Vehicle
2 Vehicles
No Mortgage
3 Vehicles
With Mortgage
4+ Vehicles
0%
10%
20%
30%
40%
50%
60%
70%
80%
90%
100%
Vehicle Home Interest, Dividends, or RentalIncome
Perc
ent o
f Hou
seho
lds
260673
13%
49%
25%
20%
34%
40%
67%
17%
35% 4,941
1,206
701
0
1,000
2,000
3,000
4,000
5,000
6,000
0%
10%
20%
30%
40%
50%
60%
70%
80%
90%
100%
Married SingleFemale-Headed
SingleMale-
HeadedTo
tal H
ouse
hold
s
Perc
ent o
f Fam
ilies
with
Chi
ldre
n
260672
Poverty ALICE Above AT Total HH
Ionia County, 2015
Town Total HH% ALICE
& Poverty
Belding City 2,086 59%
Berlin Township 882 41%
Boston Township 2,092 43%
Campbell Township 887 34%
Danby Township 1,047 27%
Easton Township 1,210 37%
Ionia City 2,784 65%
Ionia Township 1,261 54%
Keene Township 689 33%
Lyons Township 1,350 41%
North Plains Township 461 45%
Odessa Township 1,453 46%
Orange Township 358 37%
Orleans Township 962 55%
Otisco Township 791 42%
Portland City 1,389 41%
Portland Township 1,323 15%
Ronald Township 614 45%
Sebewa Township 453 31%

UNIT
ED W
AY A
LICE
REP
ORT
– 20
17 U
PDAT
E FO
R M
ICHI
GAN
– EX
HIBI
T I
2015 Point-in-Time Data
Households by Income, 2007 to 2015
Population: 25,401 | Number of Households: 11,343Median Household Income: $37,317 (state average: $51,084)Unemployment Rate: 12.1% (state average: 7.2%)ALICE Households: 31% (state average: 25%); Poverty Households: 16% (state average: 15%)
How many households are struggling?ALICE is an acronym for Asset Limited, Income Constrained, Employed – households that earn more than the Federal Poverty Level, but less than the basic cost of living for the county (the ALICE Threshold, or AT). Combined, the number of poverty and ALICE households equals the total population struggling to afford basic needs. The number of households below the ALICE Threshold changes over time; households move in and out of poverty and ALICE as circumstances improve or worsen. The Great Recession, from 2007 to 2010, caused hardship for many families. Conditions started to improve in 2010 and 2012 for some, but not for all.
What does it cost to afford the basic necessities?The bare-minimum Household Survival Budget does not include any savings, leaving a household vulnerable to unexpected expenses. ALICE households typically earn above the Federal Poverty Level of $11,770 for a single adult and $24,250 for a family of four, but less than the Household Survival Budget.
ALICE IN IOSCO COUNTY
Household Survival Budget, Iosco County
SINGLE ADULT2 ADULTS, 1 INFANT,
1 PRESCHOOLERMonthly Costs
Housing $519 $643Child Care $– $1,229Food $184 $609Transportation $349 $697Health Care $184 $707Miscellaneous $142 $421Taxes $181 $328
Monthly Total $1,559 $4,634ANNUAL TOTAL $18,708 $55,608Hourly Wage $9.35 $27.80
Sources: 2015 Point-in-Time Data: American Community Survey. ALICE Demographics: American Community Survey; the ALICE Threshold. Budget: U.S. Department of Housing and Urban Development (HUD); U.S. Department of Agriculture (USDA); Bureau of Labor Statistics (BLS); Internal Revenue Service (IRS); Michigan Department of Treasury; Early Childhood Investment Corporation.
14% 16% 16% 16%
29% 34% 30% 31%
57%
50% 54% 53%
12,216
10,508 11,256 11,343
-
2,000
4,000
6,000
8,000
10,000
12,000
14,000
0%
10%
20%
30%
40%
50%
60%
70%
80%
90%
100%
2007 2010 2012 2015
Tota
l Hou
seho
lds
Perc
ent o
f Hou
seho
lds
260691
Poverty ALICE Above AT Total HH

UNIT
ED W
AY A
LICE
REP
ORT
– 20
17 U
PDAT
E FO
R M
ICHI
GAN
– EX
HIBI
T I
Note: Municipal-level data on this page is for Places and County Subdivisions, which include Census Designated Places (CDP). These are overlapping geographies so totals will not match county-level data. Municipal-level data often relies on 5-year averages and is not available for the smallest towns that do not report income.
Families with Children by Income, 2015
Assets, All Households, 2015
How many families with children are struggling?Children add significant expense to a family budget, so it is not surprising that many Iosco County families with children live below the ALICE Threshold. Though more Iosco County families are headed by married parents, those families with a single parent are more likely to have income below the ALICE Threshold.
What assets do households have?Ownership of assets can contribute to stability of households. Yet few families in Iosco County own liquid assets, such as a savings account, 401(k) plan, or rental income, that are readily available to cover emergency expenses. Vehicles, the most common asset, depreciate over time. Homeownership, the next most common asset, can build wealth, but is not a liquid asset.
1 Vehicle
2 Vehicles
No Mortgage
3 Vehicles
With Mortgage
4+ Vehicles
0%
10%
20%
30%
40%
50%
60%
70%
80%
90%
100%
Vehicle Home Interest, Dividends, or RentalIncome
Perc
ent o
f Hou
seho
lds
260693
14%
64% 51%
15%
16% 28% 71%
20% 21% 1,235
491
189
0
200
400
600
800
1,000
1,200
1,400
0%
10%
20%
30%
40%
50%
60%
70%
80%
90%
100%
Married SingleFemale-Headed
SingleMale-
HeadedTo
tal H
ouse
hold
s
Perc
ent o
f Fam
ilies
with
Chi
ldre
n
260692
Poverty ALICE Above AT Total HH
Iosco County, 2015
Town Total HH% ALICE
& Poverty
Alabaster Township 220 26%
Au Sable Charter Township 894 46%
Baldwin Township 708 39%
Burleigh Township 273 51%
East Tawas City 1,245 47%
Grant Township 720 49%
Oscoda Charter Township 3,224 49%
Plainfield Township 1,753 51%
Reno Township 243 49%
Sherman Township 186 50%
Tawas City 717 47%
Tawas Township 688 37%
Whittemore City 188 65%
Wilber Township 284 39%

UNIT
ED W
AY A
LICE
REP
ORT
– 20
17 U
PDAT
E FO
R M
ICHI
GAN
– EX
HIBI
T I
2015 Point-in-Time Data
Households by Income, 2007 to 2015
Population: 11,507 | Number of Households: 5,392Median Household Income: $33,663 (state average: $51,084)Unemployment Rate: 9% (state average: 7.2%)ALICE Households: 33% (state average: 25%); Poverty Households: 16% (state average: 15%)
How many households are struggling?ALICE is an acronym for Asset Limited, Income Constrained, Employed – households that earn more than the Federal Poverty Level, but less than the basic cost of living for the county (the ALICE Threshold, or AT). Combined, the number of poverty and ALICE households equals the total population struggling to afford basic needs. The number of households below the ALICE Threshold changes over time; households move in and out of poverty and ALICE as circumstances improve or worsen. The Great Recession, from 2007 to 2010, caused hardship for many families. Conditions started to improve in 2010 and 2012 for some, but not for all.
What does it cost to afford the basic necessities?The bare-minimum Household Survival Budget does not include any savings, leaving a household vulnerable to unexpected expenses. ALICE households typically earn above the Federal Poverty Level of $11,770 for a single adult and $24,250 for a family of four, but less than the Household Survival Budget.
ALICE IN IRON COUNTY
Household Survival Budget, Iron County
SINGLE ADULT2 ADULTS, 1 INFANT,
1 PRESCHOOLERMonthly Costs
Housing $466 $643Child Care $– $1,229Food $184 $609Transportation $349 $697Health Care $184 $707Miscellaneous $135 $421Taxes $169 $328
Monthly Total $1,487 $4,634ANNUAL TOTAL $17,844 $55,608Hourly Wage $8.92 $27.80
Sources: 2015 Point-in-Time Data: American Community Survey. ALICE Demographics: American Community Survey; the ALICE Threshold. Budget: U.S. Department of Housing and Urban Development (HUD); U.S. Department of Agriculture (USDA); Bureau of Labor Statistics (BLS); Internal Revenue Service (IRS); Michigan Department of Treasury; Early Childhood Investment Corporation.
#N/A 13% 13% 16%
31% 29% 33%
56% 58%
51%
5,386 5,276 5,392
-
1,000
2,000
3,000
4,000
5,000
6,000
0%
10%
20%
30%
40%
50%
60%
70%
80%
90%
100%
2010 2012 2015
Tota
l Hou
seho
lds
Perc
ent o
f Hou
seho
lds
260711
Poverty ALICE Above AT Total HH
N/A

UNIT
ED W
AY A
LICE
REP
ORT
– 20
17 U
PDAT
E FO
R M
ICHI
GAN
– EX
HIBI
T I
Note: Municipal-level data on this page is for Places and County Subdivisions, which include Census Designated Places (CDP). These are overlapping geographies so totals will not match county-level data. Municipal-level data often relies on 5-year averages and is not available for the smallest towns that do not report income.
Families with Children by Income, 2015
Assets, All Households, 2015
How many families with children are struggling?Children add significant expense to a family budget, so it is not surprising that many Iron County families with children live below the ALICE Threshold. Though more Iron County families are headed by married parents, those families with a single parent are more likely to have income below the ALICE Threshold.
What assets do households have?Ownership of assets can contribute to stability of households. Yet few families in Iron County own liquid assets, such as a savings account, 401(k) plan, or rental income, that are readily available to cover emergency expenses. Vehicles, the most common asset, depreciate over time. Homeownership, the next most common asset, can build wealth, but is not a liquid asset.
1 Vehicle
2 Vehicles
No Mortgage
3 Vehicles
With Mortgage
4+ Vehicles
0%
10%
20%
30%
40%
50%
60%
70%
80%
90%
100%
Vehicle Home Interest, Dividends, or RentalIncome
Perc
ent o
f Hou
seho
lds
260713
6%
68%
14% 13%
16%
18%
81%
16%
68%
553
240
66
0
100
200
300
400
500
600
0%
10%
20%
30%
40%
50%
60%
70%
80%
90%
100%
Married SingleFemale-Headed
SingleMale-
HeadedTo
tal H
ouse
hold
s
Perc
ent o
f Fam
ilies
with
Chi
ldre
n
260712
Poverty ALICE Above AT Total HH
Iron County, 2015
Town Total HH% ALICE
& Poverty
Bates Township 442 32%
Caspian City 373 64%
Crystal Falls City 713 47%
Crystal Falls Township 649 35%
Gaastra City 149 57%
Hematite Township 164 55%
Iron River City 1,529 63%
Iron River Township 471 52%
Mansfield Township 105 38%
Mastodon Township 276 41%
Stambaugh Township 521 33%

UNIT
ED W
AY A
LICE
REP
ORT
– 20
17 U
PDAT
E FO
R M
ICHI
GAN
– EX
HIBI
T I
2015 Point-in-Time Data
Households by Income, 2007 to 2015
Population: 70,698 | Number of Households: 24,246Median Household Income: $40,838 (state average: $51,084)Unemployment Rate: 8.1% (state average: 7.2%)ALICE Households: 25% (state average: 25%); Poverty Households: 25% (state average: 15%)
How many households are struggling?ALICE is an acronym for Asset Limited, Income Constrained, Employed – households that earn more than the Federal Poverty Level, but less than the basic cost of living for the county (the ALICE Threshold, or AT). Combined, the number of poverty and ALICE households equals the total population struggling to afford basic needs. The number of households below the ALICE Threshold changes over time; households move in and out of poverty and ALICE as circumstances improve or worsen. The Great Recession, from 2007 to 2010, caused hardship for many families. Conditions started to improve in 2010 and 2012 for some, but not for all.
What does it cost to afford the basic necessities?The bare-minimum Household Survival Budget does not include any savings, leaving a household vulnerable to unexpected expenses. ALICE households typically earn above the Federal Poverty Level of $11,770 for a single adult and $24,250 for a family of four, but less than the Household Survival Budget.
ALICE IN ISABELLA COUNTY
Household Survival Budget, Isabella County
SINGLE ADULT2 ADULTS, 1 INFANT,
1 PRESCHOOLERMonthly Costs
Housing $424 $679Child Care $– $850Food $184 $609Transportation $349 $697Health Care $184 $707Miscellaneous $130 $376Taxes $159 $223
Monthly Total $1,430 $4,141ANNUAL TOTAL $17,160 $49,692Hourly Wage $8.58 $24.85
Sources: 2015 Point-in-Time Data: American Community Survey. ALICE Demographics: American Community Survey; the ALICE Threshold. Budget: U.S. Department of Housing and Urban Development (HUD); U.S. Department of Agriculture (USDA); Bureau of Labor Statistics (BLS); Internal Revenue Service (IRS); Michigan Department of Treasury; Early Childhood Investment Corporation.
27% 29% 26% 25%
16% 26% 26% 25%
57%
45% 48% 50%
24,671 25,139 24,663 24,246
-
5,000
10,000
15,000
20,000
25,000
30,000
0%
10%
20%
30%
40%
50%
60%
70%
80%
90%
100%
2007 2010 2012 2015
Tota
l Hou
seho
lds
Perc
ent o
f Hou
seho
lds
260731
Poverty ALICE Above AT Total HH

UNIT
ED W
AY A
LICE
REP
ORT
– 20
17 U
PDAT
E FO
R M
ICHI
GAN
– EX
HIBI
T I
Note: Municipal-level data on this page is for Places and County Subdivisions, which include Census Designated Places (CDP). These are overlapping geographies so totals will not match county-level data. Municipal-level data often relies on 5-year averages and is not available for the smallest towns that do not report income.
Families with Children by Income, 2015
Assets, All Households, 2015
How many families with children are struggling?Children add significant expense to a family budget, so it is not surprising that many Isabella County families with children live below the ALICE Threshold. Though more Isabella County families are headed by married parents, those families with a single parent are more likely to have income below the ALICE Threshold.
What assets do households have?Ownership of assets can contribute to stability of households. Yet few families in Isabella County own liquid assets, such as a savings account, 401(k) plan, or rental income, that are readily available to cover emergency expenses. Vehicles, the most common asset, depreciate over time. Homeownership, the next most common asset, can build wealth, but is not a liquid asset.
1 Vehicle
2 Vehicles
No Mortgage
3 Vehicles
With Mortgage
4+ Vehicles
0%
10%
20%
30%
40%
50%
60%
70%
80%
90%
100%
Vehicle Home Interest, Dividends, or RentalIncome
Perc
ent o
f Hou
seho
lds
260733
12%
44%
14%
13%
35%
54%
75%
21% 32%
3,778
1,740
562
0
500
1,000
1,500
2,000
2,500
3,000
3,500
4,000
0%
10%
20%
30%
40%
50%
60%
70%
80%
90%
100%
Married SingleFemale-Headed
SingleMale-
HeadedTo
tal H
ouse
hold
s
Perc
ent o
f Fam
ilies
with
Chi
ldre
n
260732
Poverty ALICE Above AT Total HH
Isabella County, 2015
Town Total HH% ALICE
& Poverty
Broomfield Township 686 31%
Chippewa Township 1,762 42%
Coe Township 1,188 41%
Coldwater Township 301 55%
Deerfield Township 1,188 22%
Denver Township 408 46%
Fremont Township 541 47%
Gilmore Township 538 48%
Isabella Township 785 43%
Lincoln Township 751 33%
Mount Pleasant City 8,188 61%
Nottawa Township 859 35%
Rolland Township 500 35%
Sherman Township 1,163 44%
Union Charter Township 4,804 62%
Vernon Township 469 32%
Wise Township 530 43%

UNIT
ED W
AY A
LICE
REP
ORT
– 20
17 U
PDAT
E FO
R M
ICHI
GAN
– EX
HIBI
T I
2015 Point-in-Time Data
Households by Income, 2007 to 2015
Population: 159,494 | Number of Households: 59,292Median Household Income: $50,783 (state average: $51,084)Unemployment Rate: 6.9% (state average: 7.2%)ALICE Households: 21% (state average: 25%); Poverty Households: 15% (state average: 15%)
How many households are struggling?ALICE is an acronym for Asset Limited, Income Constrained, Employed – households that earn more than the Federal Poverty Level, but less than the basic cost of living for the county (the ALICE Threshold, or AT). Combined, the number of poverty and ALICE households equals the total population struggling to afford basic needs. The number of households below the ALICE Threshold changes over time; households move in and out of poverty and ALICE as circumstances improve or worsen. The Great Recession, from 2007 to 2010, caused hardship for many families. Conditions started to improve in 2010 and 2012 for some, but not for all.
What does it cost to afford the basic necessities?The bare-minimum Household Survival Budget does not include any savings, leaving a household vulnerable to unexpected expenses. ALICE households typically earn above the Federal Poverty Level of $11,770 for a single adult and $24,250 for a family of four, but less than the Household Survival Budget.
ALICE IN JACKSON COUNTY
Household Survival Budget, Jackson County
SINGLE ADULT2 ADULTS, 1 INFANT,
1 PRESCHOOLERMonthly Costs
Housing $483 $728Child Care $– $828Food $184 $609Transportation $349 $697Health Care $184 $707Miscellaneous $137 $380Taxes $173 $231
Monthly Total $1,510 $4,180ANNUAL TOTAL $18,120 $50,160Hourly Wage $9.06 $25.08
Sources: 2015 Point-in-Time Data: American Community Survey. ALICE Demographics: American Community Survey; the ALICE Threshold. Budget: U.S. Department of Housing and Urban Development (HUD); U.S. Department of Agriculture (USDA); Bureau of Labor Statistics (BLS); Internal Revenue Service (IRS); Michigan Department of Treasury; Early Childhood Investment Corporation.
14% 18% 18% 15%
23% 23% 23%
21%
63% 59% 59%
64%
60,965 58,388
60,420 59,292
-
10,000
20,000
30,000
40,000
50,000
60,000
70,000
0%
10%
20%
30%
40%
50%
60%
70%
80%
90%
100%
2007 2010 2012 2015
Tota
l Hou
seho
lds
Perc
ent o
f Hou
seho
lds
260751
Poverty ALICE Above AT Total HH

UNIT
ED W
AY A
LICE
REP
ORT
– 20
17 U
PDAT
E FO
R M
ICHI
GAN
– EX
HIBI
T I
Note: Municipal-level data on this page is for Places and County Subdivisions, which include Census Designated Places (CDP). These are overlapping geographies so totals will not match county-level data. Municipal-level data often relies on 5-year averages and is not available for the smallest towns that do not report income.
Families with Children by Income, 2015
Assets, All Households, 2015
How many families with children are struggling?Children add significant expense to a family budget, so it is not surprising that many Jackson County families with children live below the ALICE Threshold. Though more Jackson County families are headed by married parents, those families with a single parent are more likely to have income below the ALICE Threshold.
What assets do households have?Ownership of assets can contribute to stability of households. Yet few families in Jackson County own liquid assets, such as a savings account, 401(k) plan, or rental income, that are readily available to cover emergency expenses. Vehicles, the most common asset, depreciate over time. Homeownership, the next most common asset, can build wealth, but is not a liquid asset.
1 Vehicle
2 Vehicles
No Mortgage
3 Vehicles
With Mortgage
4+ Vehicles
0%
10%
20%
30%
40%
50%
60%
70%
80%
90%
100%
Vehicle Home Interest, Dividends, or RentalIncome
Perc
ent o
f Hou
seho
lds
260753
12%
63%
31% 11%
17%
15%
77%
20%
54%
10,511
3,625
1,959
0
2,000
4,000
6,000
8,000
10,000
12,000
0%
10%
20%
30%
40%
50%
60%
70%
80%
90%
100%
Married SingleFemale-Headed
SingleMale-
HeadedTo
tal H
ouse
hold
s
Perc
ent o
f Fam
ilies
with
Chi
ldre
n
260752
Poverty ALICE Above AT Total HH
Jackson County, 2015
Town Total HH% ALICE
& Poverty
Blackman Charter Township 7,929 50%
Columbia Township 2,962 24%
Concord Township 1,005 25%
Grass Lake Charter Township 2,200 23%
Hanover Township 1,303 25%
Henrietta Township 1,739 32%
Jackson City 12,650 61%
Leoni Township 5,724 39%
Liberty Township 1,195 21%
Napoleon Township 2,802 29%
Norvell Township 1,234 46%
Parma Township 1,063 42%
Pulaski Township 770 38%
Rives Township 1,640 25%
Sandstone Township 1,408 35%
Spring Arbor Township 2,579 29%
Springport Township 858 37%
Summit Township 9,323 29%
Tompkins Township 1,075 33%
Waterloo Township 1,132 23%

UNIT
ED W
AY A
LICE
REP
ORT
– 20
17 U
PDAT
E FO
R M
ICHI
GAN
– EX
HIBI
T I
2015 Point-in-Time Data
Households by Income, 2007 to 2015
Population: 260,263 | Number of Households: 101,228Median Household Income: $52,164 (state average: $51,084)Unemployment Rate: 7.3% (state average: 7.2%)ALICE Households: 21% (state average: 25%); Poverty Households: 15% (state average: 15%)
How many households are struggling?ALICE is an acronym for Asset Limited, Income Constrained, Employed – households that earn more than the Federal Poverty Level, but less than the basic cost of living for the county (the ALICE Threshold, or AT). Combined, the number of poverty and ALICE households equals the total population struggling to afford basic needs. The number of households below the ALICE Threshold changes over time; households move in and out of poverty and ALICE as circumstances improve or worsen. The Great Recession, from 2007 to 2010, caused hardship for many families. Conditions started to improve in 2010 and 2012 for some, but not for all.
What does it cost to afford the basic necessities?The bare-minimum Household Survival Budget does not include any savings, leaving a household vulnerable to unexpected expenses. ALICE households typically earn above the Federal Poverty Level of $11,770 for a single adult and $24,250 for a family of four, but less than the Household Survival Budget.
ALICE IN KALAMAZOO COUNTY
Household Survival Budget, Kalamazoo County
SINGLE ADULT2 ADULTS, 1 INFANT,
1 PRESCHOOLERMonthly Costs
Housing $472 $728Child Care $– $1,255Food $184 $609Transportation $349 $697Health Care $184 $707Miscellaneous $136 $436Taxes $170 $361
Monthly Total $1,495 $4,793ANNUAL TOTAL $17,940 $57,516Hourly Wage $8.97 $28.76
Sources: 2015 Point-in-Time Data: American Community Survey. ALICE Demographics: American Community Survey; the ALICE Threshold. Budget: U.S. Department of Housing and Urban Development (HUD); U.S. Department of Agriculture (USDA); Bureau of Labor Statistics (BLS); Internal Revenue Service (IRS); Michigan Department of Treasury; Early Childhood Investment Corporation.
16% 18% 17% 15%
21% 24% 26% 21%
63% 58% 57%
64%
98,668 99,256 100,789 101,228
-
20,000
40,000
60,000
80,000
100,000
120,000
0%
10%
20%
30%
40%
50%
60%
70%
80%
90%
100%
2007 2010 2012 2015
Tota
l Hou
seho
lds
Perc
ent o
f Hou
seho
lds
260771
Poverty ALICE Above AT Total HH

UNIT
ED W
AY A
LICE
REP
ORT
– 20
17 U
PDAT
E FO
R M
ICHI
GAN
– EX
HIBI
T I
Note: Municipal-level data on this page is for Places and County Subdivisions, which include Census Designated Places (CDP). These are overlapping geographies so totals will not match county-level data. Municipal-level data often relies on 5-year averages and is not available for the smallest towns that do not report income.
Families with Children by Income, 2015
Assets, All Households, 2015
How many families with children are struggling?Children add significant expense to a family budget, so it is not surprising that many Kalamazoo County families with children live below the ALICE Threshold. Though more Kalamazoo County families are headed by married parents, those families with a single parent are more likely to have income below the ALICE Threshold.
What assets do households have?Ownership of assets can contribute to stability of households. Yet few families in Kalamazoo County own liquid assets, such as a savings account, 401(k) plan, or rental income, that are readily available to cover emergency expenses. Vehicles, the most common asset, depreciate over time. Homeownership, the next most common asset, can build wealth, but is not a liquid asset.
1 Vehicle
2 Vehicles
No Mortgage
3 Vehicles
With Mortgage
4+ Vehicles
0%
10%
20%
30%
40%
50%
60%
70%
80%
90%
100%
Vehicle Home Interest, Dividends, or RentalIncome
Perc
ent o
f Hou
seho
lds
260773
5%
37% 34%
7%
36% 28%
88%
27% 38%
15,115
7,164
2,298
0
2,000
4,000
6,000
8,000
10,000
12,000
14,000
16,000
0%
10%
20%
30%
40%
50%
60%
70%
80%
90%
100%
Married SingleFemale-Headed
SingleMale-
HeadedTo
tal H
ouse
hold
s
Perc
ent o
f Fam
ilies
with
Chi
ldre
n
260772
Poverty ALICE Above AT Total HH
Kalamazoo County, 2015
Town Total HH% ALICE
& Poverty
Alamo Township 1,474 30%
Brady Township 1,606 30%
Charleston Township 747 30%
Climax Township 918 24%
Comstock Charter Township 6,312 37%
Cooper Charter Township 3,831 30%
Galesburg City 748 61%
Kalamazoo Charter Township 9,370 45%
Kalamazoo City 28,025 59%
Oshtemo Charter Township 9,948 45%
Parchment City 847 51%
Pavilion Township 2,295 36%
Portage City 19,492 36%
Prairie Ronde Township 848 21%
Richland Township 2,873 21%
Ross Township 1,874 21%
Schoolcraft Township 3,239 32%
Texas Charter Township 5,385 16%
Wakeshma Township 509 33%

UNIT
ED W
AY A
LICE
REP
ORT
– 20
17 U
PDAT
E FO
R M
ICHI
GAN
– EX
HIBI
T I
2015 Point-in-Time Data
Households by Income, 2007 to 2015
Population: 17,230 | Number of Households: 7,185Median Household Income: $40,534 (state average: $51,084)Unemployment Rate: 10.4% (state average: 7.2%)ALICE Households: 27% (state average: 25%); Poverty Households: 16% (state average: 15%)
How many households are struggling?ALICE is an acronym for Asset Limited, Income Constrained, Employed – households that earn more than the Federal Poverty Level, but less than the basic cost of living for the county (the ALICE Threshold, or AT). Combined, the number of poverty and ALICE households equals the total population struggling to afford basic needs. The number of households below the ALICE Threshold changes over time; households move in and out of poverty and ALICE as circumstances improve or worsen. The Great Recession, from 2007 to 2010, caused hardship for many families. Conditions started to improve in 2010 and 2012 for some, but not for all.
What does it cost to afford the basic necessities?The bare-minimum Household Survival Budget does not include any savings, leaving a household vulnerable to unexpected expenses. ALICE households typically earn above the Federal Poverty Level of $11,770 for a single adult and $24,250 for a family of four, but less than the Household Survival Budget.
ALICE IN KALKASKA COUNTY
Household Survival Budget, Kalkaska County
SINGLE ADULT2 ADULTS, 1 INFANT,
1 PRESCHOOLERMonthly Costs
Housing $478 $685Child Care $– $1,066Food $184 $609Transportation $349 $697Health Care $184 $707Miscellaneous $137 $405Taxes $172 $290
Monthly Total $1,504 $4,459ANNUAL TOTAL $18,048 $53,508Hourly Wage $9.02 $26.75
Sources: 2015 Point-in-Time Data: American Community Survey. ALICE Demographics: American Community Survey; the ALICE Threshold. Budget: U.S. Department of Housing and Urban Development (HUD); U.S. Department of Agriculture (USDA); Bureau of Labor Statistics (BLS); Internal Revenue Service (IRS); Michigan Department of Treasury; Early Childhood Investment Corporation.
#N/A 15% 15% 16%
24% 27% 27%
61% 58% 57%
7,232 7,276 7,185
-
1,000
2,000
3,000
4,000
5,000
6,000
7,000
8,000
0%
10%
20%
30%
40%
50%
60%
70%
80%
90%
100%
2010 2012 2015
Tota
l Hou
seho
lds
Perc
ent o
f Hou
seho
lds
260791
Poverty ALICE Above AT Total HH
N/A

UNIT
ED W
AY A
LICE
REP
ORT
– 20
17 U
PDAT
E FO
R M
ICHI
GAN
– EX
HIBI
T I
Note: Municipal-level data on this page is for Places and County Subdivisions, which include Census Designated Places (CDP). These are overlapping geographies so totals will not match county-level data. Municipal-level data often relies on 5-year averages and is not available for the smallest towns that do not report income.
Families with Children by Income, 2015
Assets, All Households, 2015
How many families with children are struggling?Children add significant expense to a family budget, so it is not surprising that many Kalkaska County families with children live below the ALICE Threshold. Though more Kalkaska County families are headed by married parents, those families with a single parent are more likely to have income below the ALICE Threshold.
What assets do households have?Ownership of assets can contribute to stability of households. Yet few families in Kalkaska County own liquid assets, such as a savings account, 401(k) plan, or rental income, that are readily available to cover emergency expenses. Vehicles, the most common asset, depreciate over time. Homeownership, the next most common asset, can build wealth, but is not a liquid asset.
1 Vehicle
2 Vehicles
No Mortgage
3 Vehicles
With Mortgage
4+ Vehicles
0%
10%
20%
30%
40%
50%
60%
70%
80%
90%
100%
Vehicle Home Interest, Dividends, or RentalIncome
Perc
ent o
f Hou
seho
lds
260793
13%
46%
22%
14%
28%
29%
73%
26%
49%
1,006
238 305
0
200
400
600
800
1,000
1,200
0%
10%
20%
30%
40%
50%
60%
70%
80%
90%
100%
Married SingleFemale-Headed
SingleMale-
HeadedTo
tal H
ouse
hold
s
Perc
ent o
f Fam
ilies
with
Chi
ldre
n
260792
Poverty ALICE Above AT Total HH
Kalkaska County, 2015
Town Total HH% ALICE
& Poverty
Bear Lake Township 299 38%
Blue Lake Township 227 31%
Boardman Township 542 37%
Clearwater Township 1,029 44%
Coldsprings Township 661 42%
Excelsior Township 335 33%
Garfield Township 383 46%
Kalkaska Township 2,015 47%
Oliver Township 131 35%
Orange Township 493 40%
Rapid River Township 509 43%
Springfield Township 561 47%

UNIT
ED W
AY A
LICE
REP
ORT
– 20
17 U
PDAT
E FO
R M
ICHI
GAN
– EX
HIBI
T I
2015 Point-in-Time Data
Households by Income, 2007 to 2015
Population: 636,369 | Number of Households: 237,259Median Household Income: $54,340 (state average: $51,084)Unemployment Rate: 5.3% (state average: 7.2%)ALICE Households: 25% (state average: 25%); Poverty Households: 13% (state average: 15%)
How many households are struggling?ALICE is an acronym for Asset Limited, Income Constrained, Employed – households that earn more than the Federal Poverty Level, but less than the basic cost of living for the county (the ALICE Threshold, or AT). Combined, the number of poverty and ALICE households equals the total population struggling to afford basic needs. The number of households below the ALICE Threshold changes over time; households move in and out of poverty and ALICE as circumstances improve or worsen. The Great Recession, from 2007 to 2010, caused hardship for many families. Conditions started to improve in 2010 and 2012 for some, but not for all.
What does it cost to afford the basic necessities?The bare-minimum Household Survival Budget does not include any savings, leaving a household vulnerable to unexpected expenses. ALICE households typically earn above the Federal Poverty Level of $11,770 for a single adult and $24,250 for a family of four, but less than the Household Survival Budget.
ALICE IN KENT COUNTY
Household Survival Budget, Kent County
SINGLE ADULT2 ADULTS, 1 INFANT,
1 PRESCHOOLERMonthly Costs
Housing $519 $737Child Care $– $1,184Food $184 $609Transportation $349 $697Health Care $184 $707Miscellaneous $142 $428Taxes $181 $343
Monthly Total $1,559 $4,705ANNUAL TOTAL $18,708 $56,460Hourly Wage $9.35 $28.23
Sources: 2015 Point-in-Time Data: American Community Survey. ALICE Demographics: American Community Survey; the ALICE Threshold. Budget: U.S. Department of Housing and Urban Development (HUD); U.S. Department of Agriculture (USDA); Bureau of Labor Statistics (BLS); Internal Revenue Service (IRS); Michigan Department of Treasury; Early Childhood Investment Corporation.
12% 14% 15% 13%
25% 26% 22% 25%
63% 60%
63% 62%
225,921 227,443 231,171 237,259
-
50,000
100,000
150,000
200,000
250,000
0%
10%
20%
30%
40%
50%
60%
70%
80%
90%
100%
2007 2010 2012 2015
Tota
l Hou
seho
lds
Perc
ent o
f Hou
seho
lds
260811
Poverty ALICE Above AT Total HH

UNIT
ED W
AY A
LICE
REP
ORT
– 20
17 U
PDAT
E FO
R M
ICHI
GAN
– EX
HIBI
T I
Note: Municipal-level data on this page is for Places and County Subdivisions, which include Census Designated Places (CDP). These are overlapping geographies so totals will not match county-level data. Municipal-level data often relies on 5-year averages and is not available for the smallest towns that do not report income.
Families with Children by Income, 2015
Assets, All Households, 2015
How many families with children are struggling?Children add significant expense to a family budget, so it is not surprising that many Kent County families with children live below the ALICE Threshold. Though more Kent County families are headed by married parents, those families with a single parent are more likely to have income below the ALICE Threshold.
What assets do households have?Ownership of assets can contribute to stability of households. Yet few families in Kent County own liquid assets, such as a savings account, 401(k) plan, or rental income, that are readily available to cover emergency expenses. Vehicles, the most common asset, depreciate over time. Homeownership, the next most common asset, can build wealth, but is not a liquid asset.
1 Vehicle
2 Vehicles
No Mortgage
3 Vehicles
With Mortgage
4+ Vehicles
0%
10%
20%
30%
40%
50%
60%
70%
80%
90%
100%
Vehicle Home Interest, Dividends, or RentalIncome
Perc
ent o
f Hou
seho
lds
260813
6%
45%
20% 13%
35%
35%
81%
20%
45%
46,109
17,759
5,779
0
5,000
10,000
15,000
20,000
25,000
30,000
35,000
40,000
45,000
50,000
0%
10%
20%
30%
40%
50%
60%
70%
80%
90%
100%
Married SingleFemale-Headed
SingleMale-
HeadedTo
tal H
ouse
hold
s
Perc
ent o
f Fam
ilies
with
Chi
ldre
n
260812
Poverty ALICE Above AT Total HH
Kent County, 2015
Town Total HH% ALICE
& Poverty
Ada Township 4,626 7%
Algoma Township 3,500 22%
Alpine Township 5,338 49%
Bowne Township 1,076 26%
Byron Township 7,829 30%
Caledonia Township 4,432 24%
Cannon Township 4,752 15%
Cascade Charter Township 6,515 13%
Cedar Springs City 1,247 57%
Courtland Township 2,701 16%
East Grand Rapids City 3,974 13%
Gaines Charter Township 9,800 35%
Grand Rapids Charter Township 6,198 18%
Grand Rapids City 73,026 51%
Grandville City 6,149 35%
Grattan Township 1,459 22%
Kentwood City 19,860 43%
Lowell Charter Township 2,292 25%
Lowell City 1,428 29%
Nelson Township 1,713 26%
Oakfield Township 2,036 23%
Plainfield Charter Township 12,665 31%
Rockford City 2,255 41%
Solon Township 2,351 31%
Sparta Township 3,482 42%
Spencer Township 1,644 39%
Tyrone Township 1,658 40%
Vergennes Township 1,431 27%
Walker City 9,922 39%
Wyoming City 27,602 45%

UNIT
ED W
AY A
LICE
REP
ORT
– 20
17 U
PDAT
E FO
R M
ICHI
GAN
– EX
HIBI
T I
2015 Point-in-Time Data
Households by Income, 2007 to 2015
Population: 2,198 | Number of Households: 1,040Median Household Income: $37,813 (state average: $51,084)Unemployment Rate: 7% (state average: 7.2%)ALICE Households: 32% (state average: 25%); Poverty Households: 15% (state average: 15%)
How many households are struggling?ALICE is an acronym for Asset Limited, Income Constrained, Employed – households that earn more than the Federal Poverty Level, but less than the basic cost of living for the county (the ALICE Threshold, or AT). Combined, the number of poverty and ALICE households equals the total population struggling to afford basic needs. The number of households below the ALICE Threshold changes over time; households move in and out of poverty and ALICE as circumstances improve or worsen. The Great Recession, from 2007 to 2010, caused hardship for many families. Conditions started to improve in 2010 and 2012 for some, but not for all.
What does it cost to afford the basic necessities?The bare-minimum Household Survival Budget does not include any savings, leaving a household vulnerable to unexpected expenses. ALICE households typically earn above the Federal Poverty Level of $11,770 for a single adult and $24,250 for a family of four, but less than the Household Survival Budget.
ALICE IN KEWEENAW COUNTY
Household Survival Budget, Keweenaw County
SINGLE ADULT2 ADULTS, 1 INFANT,
1 PRESCHOOLERMonthly Costs
Housing $592 $849Child Care $– $1,229Food $184 $609Transportation $349 $697Health Care $184 $707Miscellaneous $151 $448Taxes $198 $391
Monthly Total $1,658 $4,930ANNUAL TOTAL $19,896 $59,160Hourly Wage $9.95 $29.58
Sources: 2015 Point-in-Time Data: American Community Survey. ALICE Demographics: American Community Survey; the ALICE Threshold. Budget: U.S. Department of Housing and Urban Development (HUD); U.S. Department of Agriculture (USDA); Bureau of Labor Statistics (BLS); Internal Revenue Service (IRS); Michigan Department of Treasury; Early Childhood Investment Corporation.
#N/A 16% 15% 15%
19% 16% 32%
65% 69%
53%
957 1,012 1,040
-
200
400
600
800
1,000
1,200
0%
10%
20%
30%
40%
50%
60%
70%
80%
90%
100%
2010 2012 2015
Tota
l Hou
seho
lds
Perc
ent o
f Hou
seho
lds
260831
Poverty ALICE Above AT Total HH
N/A

UNIT
ED W
AY A
LICE
REP
ORT
– 20
17 U
PDAT
E FO
R M
ICHI
GAN
– EX
HIBI
T I
Note: Municipal-level data on this page is for Places and County Subdivisions, which include Census Designated Places (CDP). These are overlapping geographies so totals will not match county-level data. Municipal-level data often relies on 5-year averages and is not available for the smallest towns that do not report income.
Families with Children by Income, 2015
Assets, All Households, 2015
How many families with children are struggling?Children add significant expense to a family budget, so it is not surprising that many Keweenaw County families with children live below the ALICE Threshold. Though more Keweenaw County families are headed by married parents, those families with a single parent are more likely to have income below the ALICE Threshold.
What assets do households have?Ownership of assets can contribute to stability of households. Yet few families in Keweenaw County own liquid assets, such as a savings account, 401(k) plan, or rental income, that are readily available to cover emergency expenses. Vehicles, the most common asset, depreciate over time. Homeownership, the next most common asset, can build wealth, but is not a liquid asset.
1 Vehicle
2 Vehicles
No Mortgage
3 Vehicles
With Mortgage
4+ Vehicles
0%
20%
40%
60%
80%
100%
120%
Vehicle Home Interest, Dividends, or RentalIncome
Perc
ent o
f Hou
seho
lds
260833
9%
36% 8%
41% 83%
23%
91
66
0
10
20
30
40
50
60
70
80
90
100
0%
10%
20%
30%
40%
50%
60%
70%
80%
90%
100%
Married SingleFemale-Headed
SingleMale-
HeadedTo
tal H
ouse
hold
s
Perc
ent o
f Fam
ilies
with
Chi
ldre
n
260832
Poverty ALICE Above AT Total HH
N/A
Keweenaw County, 2015
Town Total HH% ALICE
& Poverty
Allouez Township 675 52%
Eagle Harbor Township 162 22%
Grant Township 104 49%

UNIT
ED W
AY A
LICE
REP
ORT
– 20
17 U
PDAT
E FO
R M
ICHI
GAN
– EX
HIBI
T I
2015 Point-in-Time Data
Households by Income, 2007 to 2015
Population: 11,426 | Number of Households: 4,365Median Household Income: $30,439 (state average: $51,084)Unemployment Rate: 13.2% (state average: 7.2%)ALICE Households: 34% (state average: 25%); Poverty Households: 25% (state average: 15%)
How many households are struggling?ALICE is an acronym for Asset Limited, Income Constrained, Employed – households that earn more than the Federal Poverty Level, but less than the basic cost of living for the county (the ALICE Threshold, or AT). Combined, the number of poverty and ALICE households equals the total population struggling to afford basic needs. The number of households below the ALICE Threshold changes over time; households move in and out of poverty and ALICE as circumstances improve or worsen. The Great Recession, from 2007 to 2010, caused hardship for many families. Conditions started to improve in 2010 and 2012 for some, but not for all.
What does it cost to afford the basic necessities?The bare-minimum Household Survival Budget does not include any savings, leaving a household vulnerable to unexpected expenses. ALICE households typically earn above the Federal Poverty Level of $11,770 for a single adult and $24,250 for a family of four, but less than the Household Survival Budget.
ALICE IN LAKE COUNTY
Household Survival Budget, Lake County
SINGLE ADULT2 ADULTS, 1 INFANT,
1 PRESCHOOLERMonthly Costs
Housing $448 $643Child Care $– $1,229Food $184 $609Transportation $349 $697Health Care $184 $707Miscellaneous $133 $421Taxes $165 $328
Monthly Total $1,463 $4,634ANNUAL TOTAL $17,556 $55,608Hourly Wage $8.78 $27.80
Sources: 2015 Point-in-Time Data: American Community Survey. ALICE Demographics: American Community Survey; the ALICE Threshold. Budget: U.S. Department of Housing and Urban Development (HUD); U.S. Department of Agriculture (USDA); Bureau of Labor Statistics (BLS); Internal Revenue Service (IRS); Michigan Department of Treasury; Early Childhood Investment Corporation.
#N/A 19% 22% 25%
39% 36%
34%
42% 42% 41%
4,078 4,139 4,365
-
500
1,000
1,500
2,000
2,500
3,000
3,500
4,000
4,500
5,000
0%
10%
20%
30%
40%
50%
60%
70%
80%
90%
100%
2010 2012 2015
Tota
l Hou
seho
lds
Perc
ent o
f Hou
seho
lds
260851
Poverty ALICE Above AT Total HH
N/A

UNIT
ED W
AY A
LICE
REP
ORT
– 20
17 U
PDAT
E FO
R M
ICHI
GAN
– EX
HIBI
T I
Note: Municipal-level data on this page is for Places and County Subdivisions, which include Census Designated Places (CDP). These are overlapping geographies so totals will not match county-level data. Municipal-level data often relies on 5-year averages and is not available for the smallest towns that do not report income.
Families with Children by Income, 2015
Assets, All Households, 2015
How many families with children are struggling?Children add significant expense to a family budget, so it is not surprising that many Lake County families with children live below the ALICE Threshold. Though more Lake County families are headed by married parents, those families with a single parent are more likely to have income below the ALICE Threshold.
What assets do households have?Ownership of assets can contribute to stability of households. Yet few families in Lake County own liquid assets, such as a savings account, 401(k) plan, or rental income, that are readily available to cover emergency expenses. Vehicles, the most common asset, depreciate over time. Homeownership, the next most common asset, can build wealth, but is not a liquid asset.
1 Vehicle
2 Vehicles
No Mortgage
3 Vehicles
With Mortgage
4+ Vehicles
0%
10%
20%
30%
40%
50%
60%
70%
80%
90%
100%
Vehicle Home Interest, Dividends, or RentalIncome
Perc
ent o
f Hou
seho
lds
260853
22%
84%
65% 19%
13%
6% 59%
3%
29%
402
255
52
0
50
100
150
200
250
300
350
400
450
0%
10%
20%
30%
40%
50%
60%
70%
80%
90%
100%
Married SingleFemale-Headed
SingleMale-
HeadedTo
tal H
ouse
hold
s
Perc
ent o
f Fam
ilies
with
Chi
ldre
n
260852
Poverty ALICE Above AT Total HH
Lake County, 2015
Town Total HH% ALICE
& Poverty
Chase Township 382 53%
Cherry Valley Township 177 57%
Dover Township 152 39%
Eden Township 217 70%
Elk Township 408 43%
Ellsworth Township 249 46%
Lake Township 319 44%
Newkirk Township 288 60%
Peacock Township 171 56%
Pinora Township 261 55%
Pleasant Plains Township 677 68%
Sauble Township 157 48%
Webber Township 539 77%
Yates Township 275 76%

UNIT
ED W
AY A
LICE
REP
ORT
– 20
17 U
PDAT
E FO
R M
ICHI
GAN
– EX
HIBI
T I
2015 Point-in-Time Data
Households by Income, 2007 to 2015
Population: 88,373 | Number of Households: 32,708Median Household Income: $57,762 (state average: $51,084)Unemployment Rate: 6% (state average: 7.2%)ALICE Households: 26% (state average: 25%); Poverty Households: 11% (state average: 15%)
How many households are struggling?ALICE is an acronym for Asset Limited, Income Constrained, Employed – households that earn more than the Federal Poverty Level, but less than the basic cost of living for the county (the ALICE Threshold, or AT). Combined, the number of poverty and ALICE households equals the total population struggling to afford basic needs. The number of households below the ALICE Threshold changes over time; households move in and out of poverty and ALICE as circumstances improve or worsen. The Great Recession, from 2007 to 2010, caused hardship for many families. Conditions started to improve in 2010 and 2012 for some, but not for all.
What does it cost to afford the basic necessities?The bare-minimum Household Survival Budget does not include any savings, leaving a household vulnerable to unexpected expenses. ALICE households typically earn above the Federal Poverty Level of $11,770 for a single adult and $24,250 for a family of four, but less than the Household Survival Budget.
ALICE IN LAPEER COUNTY
Household Survival Budget, Lapeer County
SINGLE ADULT2 ADULTS, 1 INFANT,
1 PRESCHOOLERMonthly Costs
Housing $510 $846Child Care $– $1,195Food $184 $609Transportation $491 $981Health Care $166 $637Miscellaneous $156 $471Taxes $209 $444
Monthly Total $1,716 $5,183ANNUAL TOTAL $20,592 $62,196Hourly Wage $10.30 $31.10
Sources: 2015 Point-in-Time Data: American Community Survey. ALICE Demographics: American Community Survey; the ALICE Threshold. Budget: U.S. Department of Housing and Urban Development (HUD); U.S. Department of Agriculture (USDA); Bureau of Labor Statistics (BLS); Internal Revenue Service (IRS); Michigan Department of Treasury; Early Childhood Investment Corporation.
10% 14% 9% 11%
22% 25%
27% 26%
68%
61% 64% 63%
32,505 32,145 32,790 32,708
-
5,000
10,000
15,000
20,000
25,000
30,000
35,000
0%
10%
20%
30%
40%
50%
60%
70%
80%
90%
100%
2007 2010 2012 2015
Tota
l Hou
seho
lds
Perc
ent o
f Hou
seho
lds
260871
Poverty ALICE Above AT Total HH

UNIT
ED W
AY A
LICE
REP
ORT
– 20
17 U
PDAT
E FO
R M
ICHI
GAN
– EX
HIBI
T I
Note: Municipal-level data on this page is for Places and County Subdivisions, which include Census Designated Places (CDP). These are overlapping geographies so totals will not match county-level data. Municipal-level data often relies on 5-year averages and is not available for the smallest towns that do not report income.
Families with Children by Income, 2015
Assets, All Households, 2015
How many families with children are struggling?Children add significant expense to a family budget, so it is not surprising that many Lapeer County families with children live below the ALICE Threshold. Though more Lapeer County families are headed by married parents, those families with a single parent are more likely to have income below the ALICE Threshold.
What assets do households have?Ownership of assets can contribute to stability of households. Yet few families in Lapeer County own liquid assets, such as a savings account, 401(k) plan, or rental income, that are readily available to cover emergency expenses. Vehicles, the most common asset, depreciate over time. Homeownership, the next most common asset, can build wealth, but is not a liquid asset.
1 Vehicle
2 Vehicles
No Mortgage
3 Vehicles
With Mortgage
4+ Vehicles
0%
10%
20%
30%
40%
50%
60%
70%
80%
90%
100%
Vehicle Home Interest, Dividends, or RentalIncome
Perc
ent o
f Hou
seho
lds
260873
4%
38%
23% 23%
46%
33%
73%
16%
44%
6,821
1,609
910
0
1,000
2,000
3,000
4,000
5,000
6,000
7,000
8,000
0%
10%
20%
30%
40%
50%
60%
70%
80%
90%
100%
Married SingleFemale-Headed
SingleMale-
HeadedTo
tal H
ouse
hold
s
Perc
ent o
f Fam
ilies
with
Chi
ldre
n
260872
Poverty ALICE Above AT Total HH
Lapeer County, 2015
Town Total HH% ALICE
& Poverty
Almont Township 2,442 36%
Arcadia Township 1,168 37%
Attica Township 1,676 40%
Burlington Township 555 48%
Burnside Township 659 40%
Deerfield Township 1,958 38%
Dryden Township 1,786 34%
Elba Township 2,071 23%
Goodland Township 574 36%
Hadley Township 1,684 29%
Imlay City 1,427 60%
Imlay Township 1,020 35%
Lapeer City 3,391 66%
Lapeer Township 2,003 35%
Marathon Township 1,655 39%
Mayfield Township 3,029 43%
Metamora Township 1,582 31%
North Branch Township 1,377 48%
Oregon Township 2,077 27%
Rich Township 537 35%

UNIT
ED W
AY A
LICE
REP
ORT
– 20
17 U
PDAT
E FO
R M
ICHI
GAN
– EX
HIBI
T I
2015 Point-in-Time Data
Households by Income, 2007 to 2015
Population: 21,772 | Number of Households: 9,234Median Household Income: $56,189 (state average: $51,084)Unemployment Rate: 7.1% (state average: 7.2%)ALICE Households: 20% (state average: 25%); Poverty Households: 8% (state average: 15%)
How many households are struggling?ALICE is an acronym for Asset Limited, Income Constrained, Employed – households that earn more than the Federal Poverty Level, but less than the basic cost of living for the county (the ALICE Threshold, or AT). Combined, the number of poverty and ALICE households equals the total population struggling to afford basic needs. The number of households below the ALICE Threshold changes over time; households move in and out of poverty and ALICE as circumstances improve or worsen. The Great Recession, from 2007 to 2010, caused hardship for many families. Conditions started to improve in 2010 and 2012 for some, but not for all.
What does it cost to afford the basic necessities?The bare-minimum Household Survival Budget does not include any savings, leaving a household vulnerable to unexpected expenses. ALICE households typically earn above the Federal Poverty Level of $11,770 for a single adult and $24,250 for a family of four, but less than the Household Survival Budget.
ALICE IN LEELANAU COUNTY
Household Survival Budget, Leelanau County
SINGLE ADULT2 ADULTS, 1 INFANT,
1 PRESCHOOLERMonthly Costs
Housing $528 $765Child Care $– $1,229Food $184 $609Transportation $349 $697Health Care $184 $707Miscellaneous $143 $437Taxes $183 $365
Monthly Total $1,571 $4,809ANNUAL TOTAL $18,852 $57,708Hourly Wage $9.43 $28.85
Sources: 2015 Point-in-Time Data: American Community Survey. ALICE Demographics: American Community Survey; the ALICE Threshold. Budget: U.S. Department of Housing and Urban Development (HUD); U.S. Department of Agriculture (USDA); Bureau of Labor Statistics (BLS); Internal Revenue Service (IRS); Michigan Department of Treasury; Early Childhood Investment Corporation.
8% 10% 10% 8%
20% 21% 20% 20%
72% 69% 70% 72%
9,559 9,294 9,267 9,234
-
2,000
4,000
6,000
8,000
10,000
12,000
0%
10%
20%
30%
40%
50%
60%
70%
80%
90%
100%
2007 2010 2012 2015
Tota
l Hou
seho
lds
Perc
ent o
f Hou
seho
lds
260891
Poverty ALICE Above AT Total HH

UNIT
ED W
AY A
LICE
REP
ORT
– 20
17 U
PDAT
E FO
R M
ICHI
GAN
– EX
HIBI
T I
Note: Municipal-level data on this page is for Places and County Subdivisions, which include Census Designated Places (CDP). These are overlapping geographies so totals will not match county-level data. Municipal-level data often relies on 5-year averages and is not available for the smallest towns that do not report income.
Families with Children by Income, 2015
Assets, All Households, 2015
How many families with children are struggling?Children add significant expense to a family budget, so it is not surprising that many Leelanau County families with children live below the ALICE Threshold. Though more Leelanau County families are headed by married parents, those families with a single parent are more likely to have income below the ALICE Threshold.
What assets do households have?Ownership of assets can contribute to stability of households. Yet few families in Leelanau County own liquid assets, such as a savings account, 401(k) plan, or rental income, that are readily available to cover emergency expenses. Vehicles, the most common asset, depreciate over time. Homeownership, the next most common asset, can build wealth, but is not a liquid asset.
1 Vehicle
2 Vehicles
No Mortgage
3 Vehicles
With Mortgage
4+ Vehicles
0%
20%
40%
60%
80%
100%
120%
Vehicle Home Interest, Dividends, or RentalIncome
Perc
ent o
f Hou
seho
lds
260893
7%
52%
15% 11%
17%
33%
82%
31%
52%
1,448
358
92
0
200
400
600
800
1,000
1,200
1,400
1,600
0%
10%
20%
30%
40%
50%
60%
70%
80%
90%
100%
Married SingleFemale-Headed
SingleMale-
HeadedTo
tal H
ouse
hold
s
Perc
ent o
f Fam
ilies
with
Chi
ldre
n
260892
Poverty ALICE Above AT Total HH
Leelanau County, 2015
Town Total HH% ALICE
& Poverty
Bingham Township 1,053 26%
Centerville Township 512 32%
Cleveland Township 496 33%
Elmwood Charter Township 1,892 22%
Empire Township 614 26%
Glen Arbor Township 343 23%
Kasson Township 544 36%
Leelanau Township 998 30%
Leland Township 876 29%
Solon Township 573 31%
Suttons Bay Township 1,241 34%

UNIT
ED W
AY A
LICE
REP
ORT
– 20
17 U
PDAT
E FO
R M
ICHI
GAN
– EX
HIBI
T I
2015 Point-in-Time Data
Households by Income, 2007 to 2015
Population: 98,573 | Number of Households: 37,016Median Household Income: $48,279 (state average: $51,084)Unemployment Rate: 5.9% (state average: 7.2%)ALICE Households: 31% (state average: 25%); Poverty Households: 12% (state average: 15%)
How many households are struggling?ALICE is an acronym for Asset Limited, Income Constrained, Employed – households that earn more than the Federal Poverty Level, but less than the basic cost of living for the county (the ALICE Threshold, or AT). Combined, the number of poverty and ALICE households equals the total population struggling to afford basic needs. The number of households below the ALICE Threshold changes over time; households move in and out of poverty and ALICE as circumstances improve or worsen. The Great Recession, from 2007 to 2010, caused hardship for many families. Conditions started to improve in 2010 and 2012 for some, but not for all.
What does it cost to afford the basic necessities?The bare-minimum Household Survival Budget does not include any savings, leaving a household vulnerable to unexpected expenses. ALICE households typically earn above the Federal Poverty Level of $11,770 for a single adult and $24,250 for a family of four, but less than the Household Survival Budget.
ALICE IN LENAWEE COUNTY
Household Survival Budget, Lenawee County
SINGLE ADULT2 ADULTS, 1 INFANT,
1 PRESCHOOLERMonthly Costs
Housing $617 $764Child Care $– $1,103Food $184 $609Transportation $349 $697Health Care $184 $707Miscellaneous $154 $421Taxes $204 $326
Monthly Total $1,692 $4,627ANNUAL TOTAL $20,304 $55,524Hourly Wage $10.15 $27.76
Sources: 2015 Point-in-Time Data: American Community Survey. ALICE Demographics: American Community Survey; the ALICE Threshold. Budget: U.S. Department of Housing and Urban Development (HUD); U.S. Department of Agriculture (USDA); Bureau of Labor Statistics (BLS); Internal Revenue Service (IRS); Michigan Department of Treasury; Early Childhood Investment Corporation.
10% 13% 12% 12%
18% 25% 25% 31%
72%
62% 63% 57%
38,000 36,341
37,998 37,016
-
5,000
10,000
15,000
20,000
25,000
30,000
35,000
40,000
0%
10%
20%
30%
40%
50%
60%
70%
80%
90%
100%
2007 2010 2012 2015
Tota
l Hou
seho
lds
Perc
ent o
f Hou
seho
lds
260911
Poverty ALICE Above AT Total HH

UNIT
ED W
AY A
LICE
REP
ORT
– 20
17 U
PDAT
E FO
R M
ICHI
GAN
– EX
HIBI
T I
Note: Municipal-level data on this page is for Places and County Subdivisions, which include Census Designated Places (CDP). These are overlapping geographies so totals will not match county-level data. Municipal-level data often relies on 5-year averages and is not available for the smallest towns that do not report income.
Families with Children by Income, 2015
Assets, All Households, 2015
How many families with children are struggling?Children add significant expense to a family budget, so it is not surprising that many Lenawee County families with children live below the ALICE Threshold. Though more Lenawee County families are headed by married parents, those families with a single parent are more likely to have income below the ALICE Threshold.
What assets do households have?Ownership of assets can contribute to stability of households. Yet few families in Lenawee County own liquid assets, such as a savings account, 401(k) plan, or rental income, that are readily available to cover emergency expenses. Vehicles, the most common asset, depreciate over time. Homeownership, the next most common asset, can build wealth, but is not a liquid asset.
1 Vehicle
2 Vehicles
No Mortgage
3 Vehicles
With Mortgage
4+ Vehicles
0%
20%
40%
60%
80%
100%
120%
Vehicle Home Interest, Dividends, or RentalIncome
Perc
ent o
f Hou
seho
lds
260913
6%
44%
24% 16%
40%
37%
78%
16%
39%
6,403
2,607
816
0
1,000
2,000
3,000
4,000
5,000
6,000
7,000
0%
10%
20%
30%
40%
50%
60%
70%
80%
90%
100%
Married SingleFemale-Headed
SingleMale-
HeadedTo
tal H
ouse
hold
s
Perc
ent o
f Fam
ilies
with
Chi
ldre
n
260912
Poverty ALICE Above AT Total HH
Lenawee County, 2015
Town Total HH% ALICE
& Poverty
Adrian City 7,869 61%
Adrian Township 2,591 37%
Blissfield Township 1,669 43%
Cambridge Township 2,362 34%
Clinton Township 1,344 38%
Deerfield Township 578 33%
Dover Township 711 48%
Fairfield Township 652 50%
Franklin Township 1,243 33%
Hudson City 851 45%
Hudson Township 623 49%
Macon Township 515 27%
Madison Charter Township 2,232 45%
Medina Township 415 38%
Morenci City 922 53%
Ogden Township 390 35%
Palmyra Township 787 46%
Raisin Township 2,608 28%
Ridgeway Township 642 37%
Riga Township 463 33%
Rollin Township 1,504 41%
Rome Township 639 44%
Seneca Township 450 36%
Tecumseh City 3,731 37%
Tecumseh Township 723 25%
Woodstock Township 1,450 40%

UNIT
ED W
AY A
LICE
REP
ORT
– 20
17 U
PDAT
E FO
R M
ICHI
GAN
– EX
HIBI
T I
2015 Point-in-Time Data
Households by Income, 2007 to 2015
Population: 187,316 | Number of Households: 71,100Median Household Income: $76,455 (state average: $51,084)Unemployment Rate: 4.5% (state average: 7.2%)ALICE Households: 21% (state average: 25%); Poverty Households: 6% (state average: 15%)
How many households are struggling?ALICE is an acronym for Asset Limited, Income Constrained, Employed – households that earn more than the Federal Poverty Level, but less than the basic cost of living for the county (the ALICE Threshold, or AT). Combined, the number of poverty and ALICE households equals the total population struggling to afford basic needs. The number of households below the ALICE Threshold changes over time; households move in and out of poverty and ALICE as circumstances improve or worsen. The Great Recession, from 2007 to 2010, caused hardship for many families. Conditions started to improve in 2010 and 2012 for some, but not for all.
What does it cost to afford the basic necessities?The bare-minimum Household Survival Budget does not include any savings, leaving a household vulnerable to unexpected expenses. ALICE households typically earn above the Federal Poverty Level of $11,770 for a single adult and $24,250 for a family of four, but less than the Household Survival Budget.
ALICE IN LIVINGSTON COUNTY
Household Survival Budget, Livingston County
SINGLE ADULT2 ADULTS, 1 INFANT,
1 PRESCHOOLERMonthly Costs
Housing $520 $863Child Care $– $1,206Food $184 $609Transportation $491 $981Health Care $166 $637Miscellaneous $157 $475Taxes $212 $453
Monthly Total $1,730 $5,224ANNUAL TOTAL $20,760 $62,688Hourly Wage $10.38 $31.34
Sources: 2015 Point-in-Time Data: American Community Survey. ALICE Demographics: American Community Survey; the ALICE Threshold. Budget: U.S. Department of Housing and Urban Development (HUD); U.S. Department of Agriculture (USDA); Bureau of Labor Statistics (BLS); Internal Revenue Service (IRS); Michigan Department of Treasury; Early Childhood Investment Corporation.
5% 7% 7% 6% 23% 24% 21% 21%
72% 69%
72% 73%
67,027 68,756 66,808 71,100
-
10,000
20,000
30,000
40,000
50,000
60,000
70,000
80,000
0%
10%
20%
30%
40%
50%
60%
70%
80%
90%
100%
2007 2010 2012 2015
Tota
l Hou
seho
lds
Perc
ent o
f Hou
seho
lds
260931
Poverty ALICE Above AT Total HH

UNIT
ED W
AY A
LICE
REP
ORT
– 20
17 U
PDAT
E FO
R M
ICHI
GAN
– EX
HIBI
T I
Note: Municipal-level data on this page is for Places and County Subdivisions, which include Census Designated Places (CDP). These are overlapping geographies so totals will not match county-level data. Municipal-level data often relies on 5-year averages and is not available for the smallest towns that do not report income.
Families with Children by Income, 2015
Assets, All Households, 2015
How many families with children are struggling?Children add significant expense to a family budget, so it is not surprising that many Livingston County families with children live below the ALICE Threshold. Though more Livingston County families are headed by married parents, those families with a single parent are more likely to have income below the ALICE Threshold.
What assets do households have?Ownership of assets can contribute to stability of households. Yet few families in Livingston County own liquid assets, such as a savings account, 401(k) plan, or rental income, that are readily available to cover emergency expenses. Vehicles, the most common asset, depreciate over time. Homeownership, the next most common asset, can build wealth, but is not a liquid asset.
1 Vehicle
2 Vehicles
No Mortgage
3 Vehicles
With Mortgage
4+ Vehicles
0%
20%
40%
60%
80%
100%
120%
Vehicle Home Interest, Dividends, or RentalIncome
Perc
ent o
f Hou
seho
lds
260933
2%
45%
12% 6%
31%
43%
92%
24%
45%
16,545
2,954 2,422
0
2,000
4,000
6,000
8,000
10,000
12,000
14,000
16,000
18,000
0%
10%
20%
30%
40%
50%
60%
70%
80%
90%
100%
Married SingleFemale-Headed
SingleMale-
HeadedTo
tal H
ouse
hold
s
Perc
ent o
f Fam
ilies
with
Chi
ldre
n
260932
Poverty ALICE Above AT Total HH
Livingston County, 2015
Town Total HH% ALICE
& Poverty
Brighton City 3,705 38%
Brighton Township 6,521 17%
Cohoctah Township 1,238 28%
Conway Township 1,092 29%
Deerfield Township 1,538 23%
Genoa Township 7,886 28%
Green Oak Township 6,870 28%
Hamburg Township 8,184 23%
Handy Township 3,006 40%
Hartland Township 5,139 22%
Howell City 4,085 54%
Howell Township 2,565 34%
Iosco Township 1,263 16%
Marion Township 3,565 19%
Oceola Township 4,415 16%
Putnam Township 3,183 29%
Tyrone Township 3,457 23%
Unadilla Township 1,268 34%

UNIT
ED W
AY A
LICE
REP
ORT
– 20
17 U
PDAT
E FO
R M
ICHI
GAN
– EX
HIBI
T I
2015 Point-in-Time Data
Households by Income, 2007 to 2015
Population: 6,477 | Number of Households: 2,377Median Household Income: $37,088 (state average: $51,084)Unemployment Rate: 11.6% (state average: 7.2%)ALICE Households: 36% (state average: 25%); Poverty Households: 19% (state average: 15%)
How many households are struggling?ALICE is an acronym for Asset Limited, Income Constrained, Employed – households that earn more than the Federal Poverty Level, but less than the basic cost of living for the county (the ALICE Threshold, or AT). Combined, the number of poverty and ALICE households equals the total population struggling to afford basic needs. The number of households below the ALICE Threshold changes over time; households move in and out of poverty and ALICE as circumstances improve or worsen. The Great Recession, from 2007 to 2010, caused hardship for many families. Conditions started to improve in 2010 and 2012 for some, but not for all.
What does it cost to afford the basic necessities?The bare-minimum Household Survival Budget does not include any savings, leaving a household vulnerable to unexpected expenses. ALICE households typically earn above the Federal Poverty Level of $11,770 for a single adult and $24,250 for a family of four, but less than the Household Survival Budget.
ALICE IN LUCE COUNTY
Household Survival Budget, Luce County
SINGLE ADULT2 ADULTS, 1 INFANT,
1 PRESCHOOLERMonthly Costs
Housing $448 $643Child Care $– $1,363Food $184 $609Transportation $349 $697Health Care $184 $707Miscellaneous $133 $439Taxes $165 $368
Monthly Total $1,463 $4,826ANNUAL TOTAL $17,556 $57,912Hourly Wage $8.78 $28.96
Sources: 2015 Point-in-Time Data: American Community Survey. ALICE Demographics: American Community Survey; the ALICE Threshold. Budget: U.S. Department of Housing and Urban Development (HUD); U.S. Department of Agriculture (USDA); Bureau of Labor Statistics (BLS); Internal Revenue Service (IRS); Michigan Department of Treasury; Early Childhood Investment Corporation.
#N/A 15% 14% 19%
26% 27% 36%
59% 59%
45%
2,473 2,404 2,377
-
500
1,000
1,500
2,000
2,500
3,000
0%
10%
20%
30%
40%
50%
60%
70%
80%
90%
100%
2010 2012 2015
Tota
l Hou
seho
lds
Perc
ent o
f Hou
seho
lds
260951
Poverty ALICE Above AT Total HH
N/A

UNIT
ED W
AY A
LICE
REP
ORT
– 20
17 U
PDAT
E FO
R M
ICHI
GAN
– EX
HIBI
T I
Note: Municipal-level data on this page is for Places and County Subdivisions, which include Census Designated Places (CDP). These are overlapping geographies so totals will not match county-level data. Municipal-level data often relies on 5-year averages and is not available for the smallest towns that do not report income.
Families with Children by Income, 2015
Assets, All Households, 2015
How many families with children are struggling?Children add significant expense to a family budget, so it is not surprising that many Luce County families with children live below the ALICE Threshold. Though more Luce County families are headed by married parents, those families with a single parent are more likely to have income below the ALICE Threshold.
What assets do households have?Ownership of assets can contribute to stability of households. Yet few families in Luce County own liquid assets, such as a savings account, 401(k) plan, or rental income, that are readily available to cover emergency expenses. Vehicles, the most common asset, depreciate over time. Homeownership, the next most common asset, can build wealth, but is not a liquid asset.
1 Vehicle
2 Vehicles
No Mortgage
3 Vehicles
With Mortgage
4+ Vehicles
0%
10%
20%
30%
40%
50%
60%
70%
80%
90%
100%
Vehicle Home Interest, Dividends, or RentalIncome
Perc
ent o
f Hou
seho
lds
260953
20%
61%
21%
30%
18%
62%
50%
21% 17% 389
154
81
0
50
100
150
200
250
300
350
400
450
0%
10%
20%
30%
40%
50%
60%
70%
80%
90%
100%
Married SingleFemale-Headed
SingleMale-
HeadedTo
tal H
ouse
hold
s
Perc
ent o
f Fam
ilies
with
Chi
ldre
n
260952
Poverty ALICE Above AT Total HH
Luce County, 2015
Town Total HH% ALICE
& Poverty
Lakefield Township 449 49%
Mcmillan Township 1,193 64%
Pentland Township 641 44%

UNIT
ED W
AY A
LICE
REP
ORT
– 20
17 U
PDAT
E FO
R M
ICHI
GAN
– EX
HIBI
T I
2015 Point-in-Time Data
Households by Income, 2007 to 2015
Population: 11,044 | Number of Households: 5,209Median Household Income: $38,434 (state average: $51,084)Unemployment Rate: 12.5% (state average: 7.2%)ALICE Households: 19% (state average: 25%); Poverty Households: 14% (state average: 15%)
How many households are struggling?ALICE is an acronym for Asset Limited, Income Constrained, Employed – households that earn more than the Federal Poverty Level, but less than the basic cost of living for the county (the ALICE Threshold, or AT). Combined, the number of poverty and ALICE households equals the total population struggling to afford basic needs. The number of households below the ALICE Threshold changes over time; households move in and out of poverty and ALICE as circumstances improve or worsen. The Great Recession, from 2007 to 2010, caused hardship for many families. Conditions started to improve in 2010 and 2012 for some, but not for all.
What does it cost to afford the basic necessities?The bare-minimum Household Survival Budget does not include any savings, leaving a household vulnerable to unexpected expenses. ALICE households typically earn above the Federal Poverty Level of $11,770 for a single adult and $24,250 for a family of four, but less than the Household Survival Budget.
ALICE IN MACKINAC COUNTY
Household Survival Budget, Mackinac County
SINGLE ADULT2 ADULTS, 1 INFANT,
1 PRESCHOOLERMonthly Costs
Housing $448 $643Child Care $– $790Food $184 $609Transportation $349 $697Health Care $184 $707Miscellaneous $133 $364Taxes $165 $195
Monthly Total $1,463 $4,005ANNUAL TOTAL $17,556 $48,060Hourly Wage $8.78 $24.03
Sources: 2015 Point-in-Time Data: American Community Survey. ALICE Demographics: American Community Survey; the ALICE Threshold. Budget: U.S. Department of Housing and Urban Development (HUD); U.S. Department of Agriculture (USDA); Bureau of Labor Statistics (BLS); Internal Revenue Service (IRS); Michigan Department of Treasury; Early Childhood Investment Corporation.
#N/A 13% 14% 14%
21% 19% 19%
66% 67% 67%
4,927 4,940 5,209
-
1,000
2,000
3,000
4,000
5,000
6,000
0%
10%
20%
30%
40%
50%
60%
70%
80%
90%
100%
2010 2012 2015
Tota
l Hou
seho
lds
Perc
ent o
f Hou
seho
lds
260971
Poverty ALICE Above AT Total HH
N/A

UNIT
ED W
AY A
LICE
REP
ORT
– 20
17 U
PDAT
E FO
R M
ICHI
GAN
– EX
HIBI
T I
Note: Municipal-level data on this page is for Places and County Subdivisions, which include Census Designated Places (CDP). These are overlapping geographies so totals will not match county-level data. Municipal-level data often relies on 5-year averages and is not available for the smallest towns that do not report income.
Families with Children by Income, 2015
Assets, All Households, 2015
How many families with children are struggling?Children add significant expense to a family budget, so it is not surprising that many Mackinac County families with children live below the ALICE Threshold. Though more Mackinac County families are headed by married parents, those families with a single parent are more likely to have income below the ALICE Threshold.
What assets do households have?Ownership of assets can contribute to stability of households. Yet few families in Mackinac County own liquid assets, such as a savings account, 401(k) plan, or rental income, that are readily available to cover emergency expenses. Vehicles, the most common asset, depreciate over time. Homeownership, the next most common asset, can build wealth, but is not a liquid asset.
1 Vehicle
2 Vehicles
No Mortgage
3 Vehicles
With Mortgage
4+ Vehicles
0%
10%
20%
30%
40%
50%
60%
70%
80%
90%
100%
Vehicle Home Interest, Dividends, or RentalIncome
Perc
ent o
f Hou
seho
lds
260973
8%
69%
27% 3%
16%
31%
89%
15%
42%
643
247
137
0
100
200
300
400
500
600
700
0%
10%
20%
30%
40%
50%
60%
70%
80%
90%
100%
Married SingleFemale-Headed
SingleMale-
HeadedTo
tal H
ouse
hold
s
Perc
ent o
f Fam
ilies
with
Chi
ldre
n
260972
Poverty ALICE Above AT Total HH
Mackinac County, 2015
Town Total HH% ALICE
& Poverty
Brevort Township 222 31%
Clark Township 974 30%
Garfield Township 517 34%
Mackinac Island City 296 23%
Marquette Township 327 28%
Moran Township 410 23%
Newton Township 204 52%
Portage Township 405 31%
St. Ignace City 1,205 39%
St. Ignace Township 420 36%

UNIT
ED W
AY A
LICE
REP
ORT
– 20
17 U
PDAT
E FO
R M
ICHI
GAN
– EX
HIBI
T I
2015 Point-in-Time Data
Households by Income, 2007 to 2015
Population: 864,840 | Number of Households: 341,532Median Household Income: $54,640 (state average: $51,084)Unemployment Rate: 6.6% (state average: 7.2%)ALICE Households: 27% (state average: 25%); Poverty Households: 11% (state average: 15%)
How many households are struggling?ALICE is an acronym for Asset Limited, Income Constrained, Employed – households that earn more than the Federal Poverty Level, but less than the basic cost of living for the county (the ALICE Threshold, or AT). Combined, the number of poverty and ALICE households equals the total population struggling to afford basic needs. The number of households below the ALICE Threshold changes over time; households move in and out of poverty and ALICE as circumstances improve or worsen. The Great Recession, from 2007 to 2010, caused hardship for many families. Conditions started to improve in 2010 and 2012 for some, but not for all.
What does it cost to afford the basic necessities?The bare-minimum Household Survival Budget does not include any savings, leaving a household vulnerable to unexpected expenses. ALICE households typically earn above the Federal Poverty Level of $11,770 for a single adult and $24,250 for a family of four, but less than the Household Survival Budget.
ALICE IN MACOMB COUNTY
Household Survival Budget, Macomb County
SINGLE ADULT2 ADULTS, 1 INFANT,
1 PRESCHOOLERMonthly Costs
Housing $510 $846Child Care $– $1,318Food $184 $609Transportation $491 $981Health Care $166 $637Miscellaneous $156 $487Taxes $209 $482
Monthly Total $1,716 $5,360ANNUAL TOTAL $20,592 $64,320Hourly Wage $10.30 $32.16
Sources: 2015 Point-in-Time Data: American Community Survey. ALICE Demographics: American Community Survey; the ALICE Threshold. Budget: U.S. Department of Housing and Urban Development (HUD); U.S. Department of Agriculture (USDA); Bureau of Labor Statistics (BLS); Internal Revenue Service (IRS); Michigan Department of Treasury; Early Childhood Investment Corporation.
8% 12% 12% 11%
28% 29% 27% 27%
64% 59% 61% 62%
327,470 332,628 330,541 341,532
-
50,000
100,000
150,000
200,000
250,000
300,000
350,000
400,000
0%
10%
20%
30%
40%
50%
60%
70%
80%
90%
100%
2007 2010 2012 2015
Tota
l Hou
seho
lds
Perc
ent o
f Hou
seho
lds
260991
Poverty ALICE Above AT Total HH

UNIT
ED W
AY A
LICE
REP
ORT
– 20
17 U
PDAT
E FO
R M
ICHI
GAN
– EX
HIBI
T I
Note: Municipal-level data on this page is for Places and County Subdivisions, which include Census Designated Places (CDP). These are overlapping geographies so totals will not match county-level data. Municipal-level data often relies on 5-year averages and is not available for the smallest towns that do not report income.
Families with Children by Income, 2015
Assets, All Households, 2015
How many families with children are struggling?Children add significant expense to a family budget, so it is not surprising that many Macomb County families with children live below the ALICE Threshold. Though more Macomb County families are headed by married parents, those families with a single parent are more likely to have income below the ALICE Threshold.
What assets do households have?Ownership of assets can contribute to stability of households. Yet few families in Macomb County own liquid assets, such as a savings account, 401(k) plan, or rental income, that are readily available to cover emergency expenses. Vehicles, the most common asset, depreciate over time. Homeownership, the next most common asset, can build wealth, but is not a liquid asset.
1 Vehicle
2 Vehicles
No Mortgage
3 Vehicles
With Mortgage
4+ Vehicles
0%
10%
20%
30%
40%
50%
60%
70%
80%
90%
100%
Vehicle Home Interest, Dividends, or RentalIncome
Perc
ent o
f Hou
seho
lds
260993
7%
43%
26% 13%
33%
39%
80%
24% 35%
64,780
19,819
6,729
0
10,000
20,000
30,000
40,000
50,000
60,000
70,000
0%
10%
20%
30%
40%
50%
60%
70%
80%
90%
100%
Married SingleFemale-Headed
SingleMale-
HeadedTo
tal H
ouse
hold
s
Perc
ent o
f Fam
ilies
with
Chi
ldre
n
260992
Poverty ALICE Above AT Total HH
Macomb County, 2015
Town Total HH% ALICE
& Poverty
Armada Township 1,980 28%
Bruce Township 3,075 23%
Center Line City 3,694 61%
Chesterfield Township 16,710 31%
Clinton Charter Township 42,792 44%
Eastpointe City 12,305 54%
Fraser City 6,181 41%
Harrison Charter Township 11,076 39%
Lenox Township 3,175 32%
Macomb Township 27,989 18%
Memphis City 340 51%
Mount Clemens City 6,645 58%
New Baltimore City 4,523 27%
Ray Township 1,556 30%
Richmond City 2,262 50%
Richmond Township 1,251 24%
Roseville City 19,772 54%
Shelby Charter Township 29,464 30%
St. Clair Shores City 26,808 39%
Sterling Heights City 49,444 36%
Utica City 2,191 42%
Warren City 53,493 49%
Washington Township 9,602 26%

UNIT
ED W
AY A
LICE
REP
ORT
– 20
17 U
PDAT
E FO
R M
ICHI
GAN
– EX
HIBI
T I
2015 Point-in-Time Data
Households by Income, 2007 to 2015
Population: 24,536 | Number of Households: 10,142Median Household Income: $41,395 (state average: $51,084)Unemployment Rate: 11.5% (state average: 7.2%)ALICE Households: 25% (state average: 25%); Poverty Households: 14% (state average: 15%)
How many households are struggling?ALICE is an acronym for Asset Limited, Income Constrained, Employed – households that earn more than the Federal Poverty Level, but less than the basic cost of living for the county (the ALICE Threshold, or AT). Combined, the number of poverty and ALICE households equals the total population struggling to afford basic needs. The number of households below the ALICE Threshold changes over time; households move in and out of poverty and ALICE as circumstances improve or worsen. The Great Recession, from 2007 to 2010, caused hardship for many families. Conditions started to improve in 2010 and 2012 for some, but not for all.
What does it cost to afford the basic necessities?The bare-minimum Household Survival Budget does not include any savings, leaving a household vulnerable to unexpected expenses. ALICE households typically earn above the Federal Poverty Level of $11,770 for a single adult and $24,250 for a family of four, but less than the Household Survival Budget.
ALICE IN MANISTEE COUNTY
Household Survival Budget, Manistee County
SINGLE ADULT2 ADULTS, 1 INFANT,
1 PRESCHOOLERMonthly Costs
Housing $448 $643Child Care $– $1,046Food $184 $609Transportation $349 $697Health Care $184 $707Miscellaneous $133 $397Taxes $165 $272
Monthly Total $1,463 $4,371ANNUAL TOTAL $17,556 $52,452Hourly Wage $8.78 $26.23
Sources: 2015 Point-in-Time Data: American Community Survey. ALICE Demographics: American Community Survey; the ALICE Threshold. Budget: U.S. Department of Housing and Urban Development (HUD); U.S. Department of Agriculture (USDA); Bureau of Labor Statistics (BLS); Internal Revenue Service (IRS); Michigan Department of Treasury; Early Childhood Investment Corporation.
13% 14% 15% 14%
23% 26% 25% 25%
64% 60% 60% 61%
10,373 10,768 10,729
10,142
-
2,000
4,000
6,000
8,000
10,000
12,000
0%
10%
20%
30%
40%
50%
60%
70%
80%
90%
100%
2007 2010 2012 2015
Tota
l Hou
seho
lds
Perc
ent o
f Hou
seho
lds
261011
Poverty ALICE Above AT Total HH

UNIT
ED W
AY A
LICE
REP
ORT
– 20
17 U
PDAT
E FO
R M
ICHI
GAN
– EX
HIBI
T I
Note: Municipal-level data on this page is for Places and County Subdivisions, which include Census Designated Places (CDP). These are overlapping geographies so totals will not match county-level data. Municipal-level data often relies on 5-year averages and is not available for the smallest towns that do not report income.
Families with Children by Income, 2015
Assets, All Households, 2015
How many families with children are struggling?Children add significant expense to a family budget, so it is not surprising that many Manistee County families with children live below the ALICE Threshold. Though more Manistee County families are headed by married parents, those families with a single parent are more likely to have income below the ALICE Threshold.
What assets do households have?Ownership of assets can contribute to stability of households. Yet few families in Manistee County own liquid assets, such as a savings account, 401(k) plan, or rental income, that are readily available to cover emergency expenses. Vehicles, the most common asset, depreciate over time. Homeownership, the next most common asset, can build wealth, but is not a liquid asset.
1 Vehicle
2 Vehicles
No Mortgage
3 Vehicles
With Mortgage
4+ Vehicles
0%
10%
20%
30%
40%
50%
60%
70%
80%
90%
100%
Vehicle Home Interest, Dividends, or RentalIncome
Perc
ent o
f Hou
seho
lds
261013
10%
57% 55%
8%
27% 17%
82%
16% 28%
1,305
396
248
0
200
400
600
800
1,000
1,200
1,400
0%
10%
20%
30%
40%
50%
60%
70%
80%
90%
100%
Married SingleFemale-Headed
SingleMale-
HeadedTo
tal H
ouse
hold
s
Perc
ent o
f Fam
ilies
with
Chi
ldre
n
261012
Poverty ALICE Above AT Total HH
Manistee County, 2015
Town Total HH% ALICE
& Poverty
Arcadia Township 284 27%
Bear Lake Township 721 31%
Brown Township 277 31%
Cleon Township 409 40%
Dickson Township 432 45%
Filer Charter Township 1,043 29%
Manistee City 2,807 45%
Manistee Township 1,234 31%
Maple Grove Township 542 47%
Marilla Township 137 38%
Norman Township 655 55%
Onekama Township 615 32%
Pleasanton Township 334 28%
Springdale Township 309 49%
Stronach Township 343 41%

UNIT
ED W
AY A
LICE
REP
ORT
– 20
17 U
PDAT
E FO
R M
ICHI
GAN
– EX
HIBI
T I
2015 Point-in-Time Data
Households by Income, 2007 to 2015
Population: 67,215 | Number of Households: 25,498Median Household Income: $48,259 (state average: $51,084)Unemployment Rate: 6.8% (state average: 7.2%)ALICE Households: 26% (state average: 25%); Poverty Households: 15% (state average: 15%)
How many households are struggling?ALICE is an acronym for Asset Limited, Income Constrained, Employed – households that earn more than the Federal Poverty Level, but less than the basic cost of living for the county (the ALICE Threshold, or AT). Combined, the number of poverty and ALICE households equals the total population struggling to afford basic needs. The number of households below the ALICE Threshold changes over time; households move in and out of poverty and ALICE as circumstances improve or worsen. The Great Recession, from 2007 to 2010, caused hardship for many families. Conditions started to improve in 2010 and 2012 for some, but not for all.
What does it cost to afford the basic necessities?The bare-minimum Household Survival Budget does not include any savings, leaving a household vulnerable to unexpected expenses. ALICE households typically earn above the Federal Poverty Level of $11,770 for a single adult and $24,250 for a family of four, but less than the Household Survival Budget.
ALICE IN MARQUETTE COUNTY
Household Survival Budget, Marquette County
SINGLE ADULT2 ADULTS, 1 INFANT,
1 PRESCHOOLERMonthly Costs
Housing $476 $691Child Care $– $1,197Food $184 $609Transportation $349 $697Health Care $184 $707Miscellaneous $136 $423Taxes $171 $332
Monthly Total $1,500 $4,656ANNUAL TOTAL $18,000 $55,872Hourly Wage $9.00 $27.94
Sources: 2015 Point-in-Time Data: American Community Survey. ALICE Demographics: American Community Survey; the ALICE Threshold. Budget: U.S. Department of Housing and Urban Development (HUD); U.S. Department of Agriculture (USDA); Bureau of Labor Statistics (BLS); Internal Revenue Service (IRS); Michigan Department of Treasury; Early Childhood Investment Corporation.
17% 16% 20% 15%
18% 21% 17%
26%
65% 63% 63% 59%
24,940
27,094 27,203 25,498
-
5,000
10,000
15,000
20,000
25,000
30,000
0%
10%
20%
30%
40%
50%
60%
70%
80%
90%
100%
2007 2010 2012 2015
Tota
l Hou
seho
lds
Perc
ent o
f Hou
seho
lds
261031
Poverty ALICE Above AT Total HH

UNIT
ED W
AY A
LICE
REP
ORT
– 20
17 U
PDAT
E FO
R M
ICHI
GAN
– EX
HIBI
T I
Note: Municipal-level data on this page is for Places and County Subdivisions, which include Census Designated Places (CDP). These are overlapping geographies so totals will not match county-level data. Municipal-level data often relies on 5-year averages and is not available for the smallest towns that do not report income.
Families with Children by Income, 2015
Assets, All Households, 2015
How many families with children are struggling?Children add significant expense to a family budget, so it is not surprising that many Marquette County families with children live below the ALICE Threshold. Though more Marquette County families are headed by married parents, those families with a single parent are more likely to have income below the ALICE Threshold.
What assets do households have?Ownership of assets can contribute to stability of households. Yet few families in Marquette County own liquid assets, such as a savings account, 401(k) plan, or rental income, that are readily available to cover emergency expenses. Vehicles, the most common asset, depreciate over time. Homeownership, the next most common asset, can build wealth, but is not a liquid asset.
1 Vehicle
2 Vehicles
No Mortgage
3 Vehicles
With Mortgage
4+ Vehicles
0%
10%
20%
30%
40%
50%
60%
70%
80%
90%
100%
Vehicle Home Interest, Dividends, or RentalIncome
Perc
ent o
f Hou
seho
lds
261033
6%
56% 50%
12%
23%
12% 82%
21%
38%
4,086
1,202
521
0
500
1,000
1,500
2,000
2,500
3,000
3,500
4,000
4,500
0%
10%
20%
30%
40%
50%
60%
70%
80%
90%
100%
Married SingleFemale-Headed
SingleMale-
HeadedTo
tal H
ouse
hold
s
Perc
ent o
f Fam
ilies
with
Chi
ldre
n
261032
Poverty ALICE Above AT Total HH
Marquette County, 2015
Town Total HH% ALICE
& Poverty
Champion Township 129 50%
Chocolay Charter Township 2,341 36%
Ely Township 778 30%
Forsyth Township 2,496 49%
Humboldt Township 206 39%
Ishpeming City 2,747 54%
Ishpeming Township 1,429 35%
Marquette Charter Township 1,695 34%
Marquette City 7,852 55%
Michigamme Township 145 41%
Negaunee City 1,858 42%
Negaunee Township 1,097 24%
Powell Township 215 38%
Republic Township 432 49%
Richmond Township 335 48%
Sands Township 987 30%
Skandia Township 377 49%
Tilden Township 456 26%
Wells Township 104 59%
West Branch Township 655 55%

UNIT
ED W
AY A
LICE
REP
ORT
– 20
17 U
PDAT
E FO
R M
ICHI
GAN
– EX
HIBI
T I
2015 Point-in-Time Data
Households by Income, 2007 to 2015
Population: 28,711 | Number of Households: 12,248Median Household Income: $42,024 (state average: $51,084)Unemployment Rate: 10.7% (state average: 7.2%)ALICE Households: 25% (state average: 25%); Poverty Households: 15% (state average: 15%)
How many households are struggling?ALICE is an acronym for Asset Limited, Income Constrained, Employed – households that earn more than the Federal Poverty Level, but less than the basic cost of living for the county (the ALICE Threshold, or AT). Combined, the number of poverty and ALICE households equals the total population struggling to afford basic needs. The number of households below the ALICE Threshold changes over time; households move in and out of poverty and ALICE as circumstances improve or worsen. The Great Recession, from 2007 to 2010, caused hardship for many families. Conditions started to improve in 2010 and 2012 for some, but not for all.
What does it cost to afford the basic necessities?The bare-minimum Household Survival Budget does not include any savings, leaving a household vulnerable to unexpected expenses. ALICE households typically earn above the Federal Poverty Level of $11,770 for a single adult and $24,250 for a family of four, but less than the Household Survival Budget.
ALICE IN MASON COUNTY
Household Survival Budget, Mason County
SINGLE ADULT2 ADULTS, 1 INFANT,
1 PRESCHOOLERMonthly Costs
Housing $459 $658Child Care $– $900Food $184 $609Transportation $349 $697Health Care $184 $707Miscellaneous $134 $380Taxes $167 $232
Monthly Total $1,477 $4,183ANNUAL TOTAL $17,724 $50,196Hourly Wage $8.86 $25.10
Sources: 2015 Point-in-Time Data: American Community Survey. ALICE Demographics: American Community Survey; the ALICE Threshold. Budget: U.S. Department of Housing and Urban Development (HUD); U.S. Department of Agriculture (USDA); Bureau of Labor Statistics (BLS); Internal Revenue Service (IRS); Michigan Department of Treasury; Early Childhood Investment Corporation.
15% 15% 14% 15%
19% 20% 26% 25%
66% 65% 60% 60%
12,328 12,156 12,242 12,248
-
2,000
4,000
6,000
8,000
10,000
12,000
14,000
0%
10%
20%
30%
40%
50%
60%
70%
80%
90%
100%
2007 2010 2012 2015
Tota
l Hou
seho
lds
Perc
ent o
f Hou
seho
lds
261051
Poverty ALICE Above AT Total HH

UNIT
ED W
AY A
LICE
REP
ORT
– 20
17 U
PDAT
E FO
R M
ICHI
GAN
– EX
HIBI
T I
Note: Municipal-level data on this page is for Places and County Subdivisions, which include Census Designated Places (CDP). These are overlapping geographies so totals will not match county-level data. Municipal-level data often relies on 5-year averages and is not available for the smallest towns that do not report income.
Families with Children by Income, 2015
Assets, All Households, 2015
How many families with children are struggling?Children add significant expense to a family budget, so it is not surprising that many Mason County families with children live below the ALICE Threshold. Though more Mason County families are headed by married parents, those families with a single parent are more likely to have income below the ALICE Threshold.
What assets do households have?Ownership of assets can contribute to stability of households. Yet few families in Mason County own liquid assets, such as a savings account, 401(k) plan, or rental income, that are readily available to cover emergency expenses. Vehicles, the most common asset, depreciate over time. Homeownership, the next most common asset, can build wealth, but is not a liquid asset.
1 Vehicle
2 Vehicles
No Mortgage
3 Vehicles
With Mortgage
4+ Vehicles
0%
10%
20%
30%
40%
50%
60%
70%
80%
90%
100%
Vehicle Home Interest, Dividends, or RentalIncome
Perc
ent o
f Hou
seho
lds
261053
12%
63%
35% 10%
22%
30%
78%
15%
35%
1,604
899
226
0
200
400
600
800
1,000
1,200
1,400
1,600
1,800
0%
10%
20%
30%
40%
50%
60%
70%
80%
90%
100%
Married SingleFemale-Headed
SingleMale-
HeadedTo
tal H
ouse
hold
s
Perc
ent o
f Fam
ilies
with
Chi
ldre
n
261052
Poverty ALICE Above AT Total HH
Mason County, 2015
Town Total HH% ALICE
& Poverty
Amber Township 1,092 36%
Branch Township 591 53%
Custer Township 531 38%
Eden Township 226 43%
Free Soil Township 361 40%
Grant Township 355 33%
Hamlin Township 1,542 27%
Logan Township 149 37%
Ludington City 3,668 49%
Pere Marquette Charter Township 933 30%
Riverton Township 450 32%
Scottville City 450 48%
Sheridan Township 490 43%
Sherman Township 448 42%
Summit Township 398 34%
Victory Township 494 30%

UNIT
ED W
AY A
LICE
REP
ORT
– 20
17 U
PDAT
E FO
R M
ICHI
GAN
– EX
HIBI
T I
2015 Point-in-Time Data
Households by Income, 2007 to 2015
Population: 43,301 | Number of Households: 15,478Median Household Income: $41,889 (state average: $51,084)Unemployment Rate: 12.2% (state average: 7.2%)ALICE Households: 28% (state average: 25%); Poverty Households: 19% (state average: 15%)
How many households are struggling?ALICE is an acronym for Asset Limited, Income Constrained, Employed – households that earn more than the Federal Poverty Level, but less than the basic cost of living for the county (the ALICE Threshold, or AT). Combined, the number of poverty and ALICE households equals the total population struggling to afford basic needs. The number of households below the ALICE Threshold changes over time; households move in and out of poverty and ALICE as circumstances improve or worsen. The Great Recession, from 2007 to 2010, caused hardship for many families. Conditions started to improve in 2010 and 2012 for some, but not for all.
What does it cost to afford the basic necessities?The bare-minimum Household Survival Budget does not include any savings, leaving a household vulnerable to unexpected expenses. ALICE households typically earn above the Federal Poverty Level of $11,770 for a single adult and $24,250 for a family of four, but less than the Household Survival Budget.
ALICE IN MECOSTA COUNTY
Household Survival Budget, Mecosta County
SINGLE ADULT2 ADULTS, 1 INFANT,
1 PRESCHOOLERMonthly Costs
Housing $468 $643Child Care $– $1,073Food $184 $609Transportation $349 $697Health Care $184 $707Miscellaneous $135 $401Taxes $169 $280
Monthly Total $1,489 $4,410ANNUAL TOTAL $17,868 $52,920Hourly Wage $8.93 $26.46
Sources: 2015 Point-in-Time Data: American Community Survey. ALICE Demographics: American Community Survey; the ALICE Threshold. Budget: U.S. Department of Housing and Urban Development (HUD); U.S. Department of Agriculture (USDA); Bureau of Labor Statistics (BLS); Internal Revenue Service (IRS); Michigan Department of Treasury; Early Childhood Investment Corporation.
21% 20% 19% 19%
23% 25% 26% 28%
56% 55% 55% 53%
16,360 15,949 15,376 15,478
-
2,000
4,000
6,000
8,000
10,000
12,000
14,000
16,000
18,000
0%
10%
20%
30%
40%
50%
60%
70%
80%
90%
100%
2007 2010 2012 2015
Tota
l Hou
seho
lds
Perc
ent o
f Hou
seho
lds
261071
Poverty ALICE Above AT Total HH

UNIT
ED W
AY A
LICE
REP
ORT
– 20
17 U
PDAT
E FO
R M
ICHI
GAN
– EX
HIBI
T I
Note: Municipal-level data on this page is for Places and County Subdivisions, which include Census Designated Places (CDP). These are overlapping geographies so totals will not match county-level data. Municipal-level data often relies on 5-year averages and is not available for the smallest towns that do not report income.
Families with Children by Income, 2015
Assets, All Households, 2015
How many families with children are struggling?Children add significant expense to a family budget, so it is not surprising that many Mecosta County families with children live below the ALICE Threshold. Though more Mecosta County families are headed by married parents, those families with a single parent are more likely to have income below the ALICE Threshold.
What assets do households have?Ownership of assets can contribute to stability of households. Yet few families in Mecosta County own liquid assets, such as a savings account, 401(k) plan, or rental income, that are readily available to cover emergency expenses. Vehicles, the most common asset, depreciate over time. Homeownership, the next most common asset, can build wealth, but is not a liquid asset.
1 Vehicle
2 Vehicles
No Mortgage
3 Vehicles
With Mortgage
4+ Vehicles
0%
10%
20%
30%
40%
50%
60%
70%
80%
90%
100%
Vehicle Home Interest, Dividends, or RentalIncome
Perc
ent o
f Hou
seho
lds
261073
14%
61%
44% 17%
24%
36% 69%
15% 20% 2,488
788
343
0
500
1,000
1,500
2,000
2,500
3,000
0%
10%
20%
30%
40%
50%
60%
70%
80%
90%
100%
Married SingleFemale-Headed
SingleMale-
HeadedTo
tal H
ouse
hold
s
Perc
ent o
f Fam
ilies
with
Chi
ldre
n
261072
Poverty ALICE Above AT Total HH
Mecosta County, 2015
Town Total HH% ALICE
& Poverty
Aetna Township 861 56%
Austin Township 525 36%
Big Rapids Charter Township 1,715 46%
Big Rapids City 2,966 62%
Chippewa Township 511 36%
Colfax Township 799 35%
Deerfield Township 594 51%
Fork Township 636 62%
Grant Township 261 42%
Green Charter Township 1,162 44%
Hinton Township 360 38%
Martiny Township 649 48%
Mecosta Township 1,076 47%
Millbrook Township 387 59%
Morton Township 1,897 35%
Sheridan Township 550 39%
Wheatland Township 529 46%

UNIT
ED W
AY A
LICE
REP
ORT
– 20
17 U
PDAT
E FO
R M
ICHI
GAN
– EX
HIBI
T I
2015 Point-in-Time Data
Households by Income, 2007 to 2015
Population: 23,717 | Number of Households: 10,679Median Household Income: $40,373 (state average: $51,084)Unemployment Rate: 8.5% (state average: 7.2%)ALICE Households: 23% (state average: 25%); Poverty Households: 16% (state average: 15%)
How many households are struggling?ALICE is an acronym for Asset Limited, Income Constrained, Employed – households that earn more than the Federal Poverty Level, but less than the basic cost of living for the county (the ALICE Threshold, or AT). Combined, the number of poverty and ALICE households equals the total population struggling to afford basic needs. The number of households below the ALICE Threshold changes over time; households move in and out of poverty and ALICE as circumstances improve or worsen. The Great Recession, from 2007 to 2010, caused hardship for many families. Conditions started to improve in 2010 and 2012 for some, but not for all.
What does it cost to afford the basic necessities?The bare-minimum Household Survival Budget does not include any savings, leaving a household vulnerable to unexpected expenses. ALICE households typically earn above the Federal Poverty Level of $11,770 for a single adult and $24,250 for a family of four, but less than the Household Survival Budget.
ALICE IN MENOMINEE COUNTY
Household Survival Budget, Menominee County
SINGLE ADULT2 ADULTS, 1 INFANT,
1 PRESCHOOLERMonthly Costs
Housing $448 $643Child Care $– $1,030Food $184 $609Transportation $349 $697Health Care $184 $707Miscellaneous $133 $395Taxes $165 $267
Monthly Total $1,463 $4,348ANNUAL TOTAL $17,556 $52,176Hourly Wage $8.78 $26.09
Sources: 2015 Point-in-Time Data: American Community Survey. ALICE Demographics: American Community Survey; the ALICE Threshold. Budget: U.S. Department of Housing and Urban Development (HUD); U.S. Department of Agriculture (USDA); Bureau of Labor Statistics (BLS); Internal Revenue Service (IRS); Michigan Department of Treasury; Early Childhood Investment Corporation.
12% 14% 14% 16%
22% 19% 24% 23%
66% 67% 62% 61%
10,692 11,037
10,622 10,679
-
2,000
4,000
6,000
8,000
10,000
12,000
0%
10%
20%
30%
40%
50%
60%
70%
80%
90%
100%
2007 2010 2012 2015
Tota
l Hou
seho
lds
Perc
ent o
f Hou
seho
lds
261091
Poverty ALICE Above AT Total HH

UNIT
ED W
AY A
LICE
REP
ORT
– 20
17 U
PDAT
E FO
R M
ICHI
GAN
– EX
HIBI
T I
Note: Municipal-level data on this page is for Places and County Subdivisions, which include Census Designated Places (CDP). These are overlapping geographies so totals will not match county-level data. Municipal-level data often relies on 5-year averages and is not available for the smallest towns that do not report income.
Families with Children by Income, 2015
Assets, All Households, 2015
How many families with children are struggling?Children add significant expense to a family budget, so it is not surprising that many Menominee County families with children live below the ALICE Threshold. Though more Menominee County families are headed by married parents, those families with a single parent are more likely to have income below the ALICE Threshold.
What assets do households have?Ownership of assets can contribute to stability of households. Yet few families in Menominee County own liquid assets, such as a savings account, 401(k) plan, or rental income, that are readily available to cover emergency expenses. Vehicles, the most common asset, depreciate over time. Homeownership, the next most common asset, can build wealth, but is not a liquid asset.
1 Vehicle
2 Vehicles
No Mortgage
3 Vehicles
With Mortgage
4+ Vehicles
0%
10%
20%
30%
40%
50%
60%
70%
80%
90%
100%
Vehicle Home Interest, Dividends, or RentalIncome
Perc
ent o
f Hou
seho
lds
261093
7%
70%
27% 6%
7%
11%
87%
23%
62%
1,361
637
418
0
200
400
600
800
1,000
1,200
1,400
1,600
0%
10%
20%
30%
40%
50%
60%
70%
80%
90%
100%
Married SingleFemale-Headed
SingleMale-
HeadedTo
tal H
ouse
hold
s
Perc
ent o
f Fam
ilies
with
Chi
ldre
n
261092
Poverty ALICE Above AT Total HH
Menominee County, 2015
Town Total HH% ALICE
& Poverty
Cedarville Township 114 39%
Daggett Township 257 23%
Faithorn Township 108 17%
Gourley Township 162 42%
Harris Township 670 42%
Holmes Township 191 35%
Ingallston Township 465 23%
Lake Township 279 42%
Mellen Township 489 36%
Menominee City 3,992 46%
Menominee Township 1,685 26%
Meyer Township 407 38%
Nadeau Township 510 43%
Spalding Township 727 44%
Stephenson City 364 49%
Stephenson Township 259 36%

UNIT
ED W
AY A
LICE
REP
ORT
– 20
17 U
PDAT
E FO
R M
ICHI
GAN
– EX
HIBI
T I
2015 Point-in-Time Data
Households by Income, 2007 to 2015
Population: 83,632 | Number of Households: 32,977Median Household Income: $59,292 (state average: $51,084)Unemployment Rate: 7.9% (state average: 7.2%)ALICE Households: 23% (state average: 25%); Poverty Households: 11% (state average: 15%)
How many households are struggling?ALICE is an acronym for Asset Limited, Income Constrained, Employed – households that earn more than the Federal Poverty Level, but less than the basic cost of living for the county (the ALICE Threshold, or AT). Combined, the number of poverty and ALICE households equals the total population struggling to afford basic needs. The number of households below the ALICE Threshold changes over time; households move in and out of poverty and ALICE as circumstances improve or worsen. The Great Recession, from 2007 to 2010, caused hardship for many families. Conditions started to improve in 2010 and 2012 for some, but not for all.
What does it cost to afford the basic necessities?The bare-minimum Household Survival Budget does not include any savings, leaving a household vulnerable to unexpected expenses. ALICE households typically earn above the Federal Poverty Level of $11,770 for a single adult and $24,250 for a family of four, but less than the Household Survival Budget.
ALICE IN MIDLAND COUNTY
Household Survival Budget, Midland County
SINGLE ADULT2 ADULTS, 1 INFANT,
1 PRESCHOOLERMonthly Costs
Housing $615 $803Child Care $– $1,143Food $184 $609Transportation $349 $697Health Care $184 $707Miscellaneous $153 $431Taxes $204 $350
Monthly Total $1,689 $4,740ANNUAL TOTAL $20,268 $56,880Hourly Wage $10.13 $28.44
Sources: 2015 Point-in-Time Data: American Community Survey. ALICE Demographics: American Community Survey; the ALICE Threshold. Budget: U.S. Department of Housing and Urban Development (HUD); U.S. Department of Agriculture (USDA); Bureau of Labor Statistics (BLS); Internal Revenue Service (IRS); Michigan Department of Treasury; Early Childhood Investment Corporation.
11% 9% 13% 11%
22% 24% 19% 23%
67% 67% 68% 66%
32,571 33,843 33,235 32,977
-
5,000
10,000
15,000
20,000
25,000
30,000
35,000
40,000
0%
10%
20%
30%
40%
50%
60%
70%
80%
90%
100%
2007 2010 2012 2015
Tota
l Hou
seho
lds
Perc
ent o
f Hou
seho
lds
261111
Poverty ALICE Above AT Total HH

UNIT
ED W
AY A
LICE
REP
ORT
– 20
17 U
PDAT
E FO
R M
ICHI
GAN
– EX
HIBI
T I
Note: Municipal-level data on this page is for Places and County Subdivisions, which include Census Designated Places (CDP). These are overlapping geographies so totals will not match county-level data. Municipal-level data often relies on 5-year averages and is not available for the smallest towns that do not report income.
Families with Children by Income, 2015
Assets, All Households, 2015
How many families with children are struggling?Children add significant expense to a family budget, so it is not surprising that many Midland County families with children live below the ALICE Threshold. Though more Midland County families are headed by married parents, those families with a single parent are more likely to have income below the ALICE Threshold.
What assets do households have?Ownership of assets can contribute to stability of households. Yet few families in Midland County own liquid assets, such as a savings account, 401(k) plan, or rental income, that are readily available to cover emergency expenses. Vehicles, the most common asset, depreciate over time. Homeownership, the next most common asset, can build wealth, but is not a liquid asset.
1 Vehicle
2 Vehicles
No Mortgage
3 Vehicles
With Mortgage
4+ Vehicles
0%
20%
40%
60%
80%
100%
120%
Vehicle Home Interest, Dividends, or RentalIncome
Perc
ent o
f Hou
seho
lds
261113
7%
50%
30% 11%
27%
31%
82%
23%
39%
6,853
1,729
791
0
1,000
2,000
3,000
4,000
5,000
6,000
7,000
8,000
0%
10%
20%
30%
40%
50%
60%
70%
80%
90%
100%
Married SingleFemale-Headed
SingleMale-
HeadedTo
tal H
ouse
hold
s
Perc
ent o
f Fam
ilies
with
Chi
ldre
n
261112
Poverty ALICE Above AT Total HH
Midland County, 2015
Town Total HH% ALICE
& Poverty
Coleman City 591 70%
Edenville Township 989 42%
Geneva Township 451 37%
Greendale Township 650 49%
Homer Township 1,502 30%
Hope Township 556 41%
Ingersoll Township 1,048 31%
Jasper Township 441 48%
Jerome Township 1,978 40%
Larkin Charter Township 1,896 14%
Lee Township 1,555 36%
Lincoln Township 1,058 34%
Midland Charter Township 844 34%
Midland City 17,429 41%
Mills Township 693 44%
Mount Haley Township 708 42%
Porter Township 445 43%
Warren Township 783 48%

UNIT
ED W
AY A
LICE
REP
ORT
– 20
17 U
PDAT
E FO
R M
ICHI
GAN
– EX
HIBI
T I
2015 Point-in-Time Data
Households by Income, 2007 to 2015
Population: 14,988 | Number of Households: 5,866Median Household Income: $41,098 (state average: $51,084)Unemployment Rate: 11% (state average: 7.2%)ALICE Households: 29% (state average: 25%); Poverty Households: 15% (state average: 15%)
How many households are struggling?ALICE is an acronym for Asset Limited, Income Constrained, Employed – households that earn more than the Federal Poverty Level, but less than the basic cost of living for the county (the ALICE Threshold, or AT). Combined, the number of poverty and ALICE households equals the total population struggling to afford basic needs. The number of households below the ALICE Threshold changes over time; households move in and out of poverty and ALICE as circumstances improve or worsen. The Great Recession, from 2007 to 2010, caused hardship for many families. Conditions started to improve in 2010 and 2012 for some, but not for all.
What does it cost to afford the basic necessities?The bare-minimum Household Survival Budget does not include any savings, leaving a household vulnerable to unexpected expenses. ALICE households typically earn above the Federal Poverty Level of $11,770 for a single adult and $24,250 for a family of four, but less than the Household Survival Budget.
ALICE IN MISSAUKEE COUNTY
Household Survival Budget, Missaukee County
SINGLE ADULT2 ADULTS, 1 INFANT,
1 PRESCHOOLERMonthly Costs
Housing $448 $643Child Care $– $1,229Food $184 $609Transportation $349 $697Health Care $184 $707Miscellaneous $133 $421Taxes $165 $328
Monthly Total $1,463 $4,634ANNUAL TOTAL $17,556 $55,608Hourly Wage $8.78 $27.80
Sources: 2015 Point-in-Time Data: American Community Survey. ALICE Demographics: American Community Survey; the ALICE Threshold. Budget: U.S. Department of Housing and Urban Development (HUD); U.S. Department of Agriculture (USDA); Bureau of Labor Statistics (BLS); Internal Revenue Service (IRS); Michigan Department of Treasury; Early Childhood Investment Corporation.
#N/A 13% 13% 15%
25% 28% 29%
62% 59%
56%
5,809 5,855 5,866
-
1,000
2,000
3,000
4,000
5,000
6,000
7,000
0%
10%
20%
30%
40%
50%
60%
70%
80%
90%
100%
2010 2012 2015
Tota
l Hou
seho
lds
Perc
ent o
f Hou
seho
lds
261131
Poverty ALICE Above AT Total HH
N/A

UNIT
ED W
AY A
LICE
REP
ORT
– 20
17 U
PDAT
E FO
R M
ICHI
GAN
– EX
HIBI
T I
Note: Municipal-level data on this page is for Places and County Subdivisions, which include Census Designated Places (CDP). These are overlapping geographies so totals will not match county-level data. Municipal-level data often relies on 5-year averages and is not available for the smallest towns that do not report income.
Families with Children by Income, 2015
Assets, All Households, 2015
How many families with children are struggling?Children add significant expense to a family budget, so it is not surprising that many Missaukee County families with children live below the ALICE Threshold. Though more Missaukee County families are headed by married parents, those families with a single parent are more likely to have income below the ALICE Threshold.
What assets do households have?Ownership of assets can contribute to stability of households. Yet few families in Missaukee County own liquid assets, such as a savings account, 401(k) plan, or rental income, that are readily available to cover emergency expenses. Vehicles, the most common asset, depreciate over time. Homeownership, the next most common asset, can build wealth, but is not a liquid asset.
1 Vehicle
2 Vehicles
No Mortgage
3 Vehicles
With Mortgage
4+ Vehicles
0%
10%
20%
30%
40%
50%
60%
70%
80%
90%
100%
Vehicle Home Interest, Dividends, or RentalIncome
Perc
ent o
f Hou
seho
lds
261133
16%
58%
20%
14%
27%
46%
70%
15%
34%
1,065
295
179
0
200
400
600
800
1,000
1,200
0%
10%
20%
30%
40%
50%
60%
70%
80%
90%
100%
Married SingleFemale-Headed
SingleMale-
HeadedTo
tal H
ouse
hold
s
Perc
ent o
f Fam
ilies
with
Chi
ldre
n
261132
Poverty ALICE Above AT Total HH
Missaukee County, 2015
Town Total HH% ALICE
& Poverty
Aetna Township 167 30%
Bloomfield Township 191 42%
Butterfield Township 200 59%
Caldwell Township 550 46%
Clam Union Township 408 47%
Forest Township 385 54%
Holland Township 110 49%
Lake City 355 55%
Lake Township 1,174 34%
Mcbain City 265 59%
Norwich Township 286 56%
Pioneer Township 211 54%
Reeder Township 387 38%
Richland Township 573 34%
Riverside Township 355 33%
West Branch Township 193 51%

UNIT
ED W
AY A
LICE
REP
ORT
– 20
17 U
PDAT
E FO
R M
ICHI
GAN
– EX
HIBI
T I
2015 Point-in-Time Data
Households by Income, 2007 to 2015
Population: 149,568 | Number of Households: 58,886Median Household Income: $54,396 (state average: $51,084)Unemployment Rate: 5.4% (state average: 7.2%)ALICE Households: 22% (state average: 25%); Poverty Households: 11% (state average: 15%)
How many households are struggling?ALICE is an acronym for Asset Limited, Income Constrained, Employed – households that earn more than the Federal Poverty Level, but less than the basic cost of living for the county (the ALICE Threshold, or AT). Combined, the number of poverty and ALICE households equals the total population struggling to afford basic needs. The number of households below the ALICE Threshold changes over time; households move in and out of poverty and ALICE as circumstances improve or worsen. The Great Recession, from 2007 to 2010, caused hardship for many families. Conditions started to improve in 2010 and 2012 for some, but not for all.
What does it cost to afford the basic necessities?The bare-minimum Household Survival Budget does not include any savings, leaving a household vulnerable to unexpected expenses. ALICE households typically earn above the Federal Poverty Level of $11,770 for a single adult and $24,250 for a family of four, but less than the Household Survival Budget.
ALICE IN MONROE COUNTY
Household Survival Budget, Monroe County
SINGLE ADULT2 ADULTS, 1 INFANT,
1 PRESCHOOLERMonthly Costs
Housing $475 $798Child Care $– $1,363Food $184 $609Transportation $349 $697Health Care $184 $707Miscellaneous $136 $459Taxes $171 $416
Monthly Total $1,499 $5,049ANNUAL TOTAL $17,988 $60,588Hourly Wage $8.99 $30.29
Sources: 2015 Point-in-Time Data: American Community Survey. ALICE Demographics: American Community Survey; the ALICE Threshold. Budget: U.S. Department of Housing and Urban Development (HUD); U.S. Department of Agriculture (USDA); Bureau of Labor Statistics (BLS); Internal Revenue Service (IRS); Michigan Department of Treasury; Early Childhood Investment Corporation.
7% 12% 12% 11%
25% 24% 27% 22%
68% 64%
61% 67%
57,333 58,596 57,506 58,886
-
10,000
20,000
30,000
40,000
50,000
60,000
70,000
0%
10%
20%
30%
40%
50%
60%
70%
80%
90%
100%
2007 2010 2012 2015
Tota
l Hou
seho
lds
Perc
ent o
f Hou
seho
lds
261151
Poverty ALICE Above AT Total HH

UNIT
ED W
AY A
LICE
REP
ORT
– 20
17 U
PDAT
E FO
R M
ICHI
GAN
– EX
HIBI
T I
Note: Municipal-level data on this page is for Places and County Subdivisions, which include Census Designated Places (CDP). These are overlapping geographies so totals will not match county-level data. Municipal-level data often relies on 5-year averages and is not available for the smallest towns that do not report income.
Families with Children by Income, 2015
Assets, All Households, 2015
How many families with children are struggling?Children add significant expense to a family budget, so it is not surprising that many Monroe County families with children live below the ALICE Threshold. Though more Monroe County families are headed by married parents, those families with a single parent are more likely to have income below the ALICE Threshold.
What assets do households have?Ownership of assets can contribute to stability of households. Yet few families in Monroe County own liquid assets, such as a savings account, 401(k) plan, or rental income, that are readily available to cover emergency expenses. Vehicles, the most common asset, depreciate over time. Homeownership, the next most common asset, can build wealth, but is not a liquid asset.
1 Vehicle
2 Vehicles
No Mortgage
3 Vehicles
With Mortgage
4+ Vehicles
0%
10%
20%
30%
40%
50%
60%
70%
80%
90%
100%
Vehicle Home Interest, Dividends, or RentalIncome
Perc
ent o
f Hou
seho
lds
261153
6%
46%
8%
12%
33%
43%
82%
21%
49%
11,615
3,174
1,713
0
2,000
4,000
6,000
8,000
10,000
12,000
14,000
0%
10%
20%
30%
40%
50%
60%
70%
80%
90%
100%
Married SingleFemale-Headed
SingleMale-
HeadedTo
tal H
ouse
hold
s
Perc
ent o
f Fam
ilies
with
Chi
ldre
n
261152
Poverty ALICE Above AT Total HH
Monroe County, 2015
Town Total HH% ALICE
& Poverty
Ash Township 2,925 31%
Bedford Township 12,509 28%
Berlin Charter Township 3,453 27%
Dundee Township 2,896 34%
Erie Township 1,702 27%
Exeter Township 1,339 25%
Frenchtown Township 7,723 40%
Ida Township 1,866 19%
La Salle Township 1,818 19%
London Township 1,074 28%
Luna Pier City 652 38%
Milan City 790 24%
Milan Township 580 18%
Monroe Charter Township 5,708 39%
Monroe City 8,175 44%
Petersburg City 509 36%
Raisinville Township 1,962 26%
Summerfield Township 1,145 25%
Whiteford Township 1,740 28%

UNIT
ED W
AY A
LICE
REP
ORT
– 20
17 U
PDAT
E FO
R M
ICHI
GAN
– EX
HIBI
T I
2015 Point-in-Time Data
Households by Income, 2007 to 2015
Population: 63,004 | Number of Households: 23,284Median Household Income: $41,584 (state average: $51,084)Unemployment Rate: 11.2% (state average: 7.2%)ALICE Households: 32% (state average: 25%); Poverty Households: 16% (state average: 15%)
How many households are struggling?ALICE is an acronym for Asset Limited, Income Constrained, Employed – households that earn more than the Federal Poverty Level, but less than the basic cost of living for the county (the ALICE Threshold, or AT). Combined, the number of poverty and ALICE households equals the total population struggling to afford basic needs. The number of households below the ALICE Threshold changes over time; households move in and out of poverty and ALICE as circumstances improve or worsen. The Great Recession, from 2007 to 2010, caused hardship for many families. Conditions started to improve in 2010 and 2012 for some, but not for all.
What does it cost to afford the basic necessities?The bare-minimum Household Survival Budget does not include any savings, leaving a household vulnerable to unexpected expenses. ALICE households typically earn above the Federal Poverty Level of $11,770 for a single adult and $24,250 for a family of four, but less than the Household Survival Budget.
ALICE IN MONTCALM COUNTY
Household Survival Budget, Montcalm County
SINGLE ADULT2 ADULTS, 1 INFANT,
1 PRESCHOOLERMonthly Costs
Housing $480 $643Child Care $– $1,051Food $184 $609Transportation $349 $697Health Care $184 $707Miscellaneous $137 $398Taxes $172 $273
Monthly Total $1,506 $4,378ANNUAL TOTAL $18,072 $52,536Hourly Wage $9.04 $26.27
Sources: 2015 Point-in-Time Data: American Community Survey. ALICE Demographics: American Community Survey; the ALICE Threshold. Budget: U.S. Department of Housing and Urban Development (HUD); U.S. Department of Agriculture (USDA); Bureau of Labor Statistics (BLS); Internal Revenue Service (IRS); Michigan Department of Treasury; Early Childhood Investment Corporation.
15% 18% 16% 16%
26% 28% 28% 32%
59% 54% 56%
52%
22,779 23,326 23,285 23,284
-
5,000
10,000
15,000
20,000
25,000
0%
10%
20%
30%
40%
50%
60%
70%
80%
90%
100%
2007 2010 2012 2015
Tota
l Hou
seho
lds
Perc
ent o
f Hou
seho
lds
261171
Poverty ALICE Above AT Total HH

UNIT
ED W
AY A
LICE
REP
ORT
– 20
17 U
PDAT
E FO
R M
ICHI
GAN
– EX
HIBI
T I
Note: Municipal-level data on this page is for Places and County Subdivisions, which include Census Designated Places (CDP). These are overlapping geographies so totals will not match county-level data. Municipal-level data often relies on 5-year averages and is not available for the smallest towns that do not report income.
Families with Children by Income, 2015
Assets, All Households, 2015
How many families with children are struggling?Children add significant expense to a family budget, so it is not surprising that many Montcalm County families with children live below the ALICE Threshold. Though more Montcalm County families are headed by married parents, those families with a single parent are more likely to have income below the ALICE Threshold.
What assets do households have?Ownership of assets can contribute to stability of households. Yet few families in Montcalm County own liquid assets, such as a savings account, 401(k) plan, or rental income, that are readily available to cover emergency expenses. Vehicles, the most common asset, depreciate over time. Homeownership, the next most common asset, can build wealth, but is not a liquid asset.
1 Vehicle
2 Vehicles
No Mortgage
3 Vehicles
With Mortgage
4+ Vehicles
0%
10%
20%
30%
40%
50%
60%
70%
80%
90%
100%
Vehicle Home Interest, Dividends, or RentalIncome
Perc
ent o
f Hou
seho
lds
261173
13%
58%
24%
19%
24%
42%
68%
18%
34%
4,056
1,586
832
0
500
1,000
1,500
2,000
2,500
3,000
3,500
4,000
4,500
0%
10%
20%
30%
40%
50%
60%
70%
80%
90%
100%
Married SingleFemale-Headed
SingleMale-
HeadedTo
tal H
ouse
hold
s
Perc
ent o
f Fam
ilies
with
Chi
ldre
n
261172
Poverty ALICE Above AT Total HH
Montcalm County, 2015
Town Total HH% ALICE
& Poverty
Belvidere Township 884 56%
Bloomer Township 553 38%
Bushnell Township 600 48%
Carson City 444 60%
Cato Township 1,009 53%
Crystal Township 1,059 48%
Day Township 389 49%
Douglass Township 869 51%
Eureka Township 1,468 31%
Evergreen Township 1,247 52%
Fairplain Township 675 48%
Ferris Township 499 46%
Greenville City 3,299 59%
Home Township 995 51%
Maple Valley Township 741 46%
Montcalm Township 1,340 40%
Pierson Township 1,190 39%
Pine Township 726 45%
Reynolds Township 1,888 43%
Richland Township 1,058 49%
Sidney Township 1,063 46%
Stanton City 539 67%
Winfield Township 749 34%

UNIT
ED W
AY A
LICE
REP
ORT
– 20
17 U
PDAT
E FO
R M
ICHI
GAN
– EX
HIBI
T I
2015 Point-in-Time Data
Households by Income, 2007 to 2015
Population: 9,401 | Number of Households: 4,070Median Household Income: $36,250 (state average: $51,084)Unemployment Rate: 16% (state average: 7.2%)ALICE Households: 33% (state average: 25%); Poverty Households: 15% (state average: 15%)
How many households are struggling?ALICE is an acronym for Asset Limited, Income Constrained, Employed – households that earn more than the Federal Poverty Level, but less than the basic cost of living for the county (the ALICE Threshold, or AT). Combined, the number of poverty and ALICE households equals the total population struggling to afford basic needs. The number of households below the ALICE Threshold changes over time; households move in and out of poverty and ALICE as circumstances improve or worsen. The Great Recession, from 2007 to 2010, caused hardship for many families. Conditions started to improve in 2010 and 2012 for some, but not for all.
What does it cost to afford the basic necessities?The bare-minimum Household Survival Budget does not include any savings, leaving a household vulnerable to unexpected expenses. ALICE households typically earn above the Federal Poverty Level of $11,770 for a single adult and $24,250 for a family of four, but less than the Household Survival Budget.
ALICE IN MONTMORENCY COUNTY
Household Survival Budget, Montmorency County
SINGLE ADULT2 ADULTS, 1 INFANT,
1 PRESCHOOLERMonthly Costs
Housing $450 $674Child Care $– $1,229Food $184 $609Transportation $349 $697Health Care $184 $707Miscellaneous $133 $425Taxes $165 $337
Monthly Total $1,465 $4,678ANNUAL TOTAL $17,580 $56,136Hourly Wage $8.79 $28.07
Sources: 2015 Point-in-Time Data: American Community Survey. ALICE Demographics: American Community Survey; the ALICE Threshold. Budget: U.S. Department of Housing and Urban Development (HUD); U.S. Department of Agriculture (USDA); Bureau of Labor Statistics (BLS); Internal Revenue Service (IRS); Michigan Department of Treasury; Early Childhood Investment Corporation.
#N/A 16% 18% 15%
26% 25% 33%
58% 57% 52%
4,335 4,312 4,070
-
500
1,000
1,500
2,000
2,500
3,000
3,500
4,000
4,500
5,000
0%
10%
20%
30%
40%
50%
60%
70%
80%
90%
100%
2010 2012 2015
Tota
l Hou
seho
lds
Perc
ent o
f Hou
seho
lds
261191
Poverty ALICE Above AT Total HH
N/A

UNIT
ED W
AY A
LICE
REP
ORT
– 20
17 U
PDAT
E FO
R M
ICHI
GAN
– EX
HIBI
T I
Note: Municipal-level data on this page is for Places and County Subdivisions, which include Census Designated Places (CDP). These are overlapping geographies so totals will not match county-level data. Municipal-level data often relies on 5-year averages and is not available for the smallest towns that do not report income.
Families with Children by Income, 2015
Assets, All Households, 2015
How many families with children are struggling?Children add significant expense to a family budget, so it is not surprising that many Montmorency County families with children live below the ALICE Threshold. Though more Montmorency County families are headed by married parents, those families with a single parent are more likely to have income below the ALICE Threshold.
What assets do households have?Ownership of assets can contribute to stability of households. Yet few families in Montmorency County own liquid assets, such as a savings account, 401(k) plan, or rental income, that are readily available to cover emergency expenses. Vehicles, the most common asset, depreciate over time. Homeownership, the next most common asset, can build wealth, but is not a liquid asset.
1 Vehicle
2 Vehicles
No Mortgage
3 Vehicles
With Mortgage
4+ Vehicles
0%
10%
20%
30%
40%
50%
60%
70%
80%
90%
100%
Vehicle Home Interest, Dividends, or RentalIncome
Perc
ent o
f Hou
seho
lds
261193
19%
44% 35%
12%
41%
18%
69%
15%
47%
339
144
100
0
50
100
150
200
250
300
350
400
0%
10%
20%
30%
40%
50%
60%
70%
80%
90%
100%
Married SingleFemale-Headed
SingleMale-
HeadedTo
tal H
ouse
hold
s
Perc
ent o
f Fam
ilies
with
Chi
ldre
n
261192
Poverty ALICE Above AT Total HH
Montmorency County, 2015
Town Total HH% ALICE
& Poverty
Albert Township 1,001 55%
Avery Township 297 47%
Briley Township 809 50%
Hillman Township 953 48%
Loud Township 110 47%
Montmorency Township 487 34%
Rust Township 188 54%
Vienna Township 225 30%

UNIT
ED W
AY A
LICE
REP
ORT
– 20
17 U
PDAT
E FO
R M
ICHI
GAN
– EX
HIBI
T I
2015 Point-in-Time Data
Households by Income, 2007 to 2015
Population: 172,790 | Number of Households: 63,215Median Household Income: $47,453 (state average: $51,084)Unemployment Rate: 7.5% (state average: 7.2%)ALICE Households: 25% (state average: 25%); Poverty Households: 15% (state average: 15%)
How many households are struggling?ALICE is an acronym for Asset Limited, Income Constrained, Employed – households that earn more than the Federal Poverty Level, but less than the basic cost of living for the county (the ALICE Threshold, or AT). Combined, the number of poverty and ALICE households equals the total population struggling to afford basic needs. The number of households below the ALICE Threshold changes over time; households move in and out of poverty and ALICE as circumstances improve or worsen. The Great Recession, from 2007 to 2010, caused hardship for many families. Conditions started to improve in 2010 and 2012 for some, but not for all.
What does it cost to afford the basic necessities?The bare-minimum Household Survival Budget does not include any savings, leaving a household vulnerable to unexpected expenses. ALICE households typically earn above the Federal Poverty Level of $11,770 for a single adult and $24,250 for a family of four, but less than the Household Survival Budget.
ALICE IN MUSKEGON COUNTY
Household Survival Budget, Muskegon County
SINGLE ADULT2 ADULTS, 1 INFANT,
1 PRESCHOOLERMonthly Costs
Housing $419 $705Child Care $– $1,051Food $184 $609Transportation $349 $697Health Care $184 $707Miscellaneous $129 $406Taxes $158 $292
Monthly Total $1,423 $4,467ANNUAL TOTAL $17,076 $53,604Hourly Wage $8.54 $26.80
Sources: 2015 Point-in-Time Data: American Community Survey. ALICE Demographics: American Community Survey; the ALICE Threshold. Budget: U.S. Department of Housing and Urban Development (HUD); U.S. Department of Agriculture (USDA); Bureau of Labor Statistics (BLS); Internal Revenue Service (IRS); Michigan Department of Treasury; Early Childhood Investment Corporation.
16% 19% 20% 15%
25% 25% 23%
25%
59% 56% 57%
60%
64,455 65,892 63,860 63,215
-
10,000
20,000
30,000
40,000
50,000
60,000
70,000
0%
10%
20%
30%
40%
50%
60%
70%
80%
90%
100%
2007 2010 2012 2015
Tota
l Hou
seho
lds
Perc
ent o
f Hou
seho
lds
261211
Poverty ALICE Above AT Total HH

UNIT
ED W
AY A
LICE
REP
ORT
– 20
17 U
PDAT
E FO
R M
ICHI
GAN
– EX
HIBI
T I
Note: Municipal-level data on this page is for Places and County Subdivisions, which include Census Designated Places (CDP). These are overlapping geographies so totals will not match county-level data. Municipal-level data often relies on 5-year averages and is not available for the smallest towns that do not report income.
Families with Children by Income, 2015
Assets, All Households, 2015
How many families with children are struggling?Children add significant expense to a family budget, so it is not surprising that many Muskegon County families with children live below the ALICE Threshold. Though more Muskegon County families are headed by married parents, those families with a single parent are more likely to have income below the ALICE Threshold.
What assets do households have?Ownership of assets can contribute to stability of households. Yet few families in Muskegon County own liquid assets, such as a savings account, 401(k) plan, or rental income, that are readily available to cover emergency expenses. Vehicles, the most common asset, depreciate over time. Homeownership, the next most common asset, can build wealth, but is not a liquid asset.
1 Vehicle
2 Vehicles
No Mortgage
3 Vehicles
With Mortgage
4+ Vehicles
0%
10%
20%
30%
40%
50%
60%
70%
80%
90%
100%
Vehicle Home Interest, Dividends, or RentalIncome
Perc
ent o
f Hou
seho
lds
261213
6%
65%
18% 15%
18%
44%
79%
17%
38%
10,780
5,125
1,820
0
2,000
4,000
6,000
8,000
10,000
12,000
0%
10%
20%
30%
40%
50%
60%
70%
80%
90%
100%
Married SingleFemale-Headed
SingleMale-
HeadedTo
tal H
ouse
hold
s
Perc
ent o
f Fam
ilies
with
Chi
ldre
n
261212
Poverty ALICE Above AT Total HH
Muskegon County, 2015
Town Total HH% ALICE
& Poverty
Blue Lake Township 749 37%
Casnovia Township 922 38%
Cedar Creek Township 1,266 41%
Dalton Township 3,302 32%
Egelston Township 3,372 46%
Fruitland Township 2,067 28%
Fruitport Charter Township 5,058 28%
Holton Township 822 51%
Laketon Township 2,949 24%
Montague City 999 42%
Montague Township 594 31%
Moorland Township 564 37%
Muskegon Charter Township 6,565 47%
Muskegon City 13,577 64%
Muskegon Heights City 4,156 73%
North Muskegon City 1,679 30%
Norton Shores City 10,020 34%
Ravenna Township 997 32%
Roosevelt Park City 1,681 48%
Sullivan Township 842 24%
White River Township 502 28%
Whitehall City 1,115 43%
Whitehall Township 692 28%

UNIT
ED W
AY A
LICE
REP
ORT
– 20
17 U
PDAT
E FO
R M
ICHI
GAN
– EX
HIBI
T I
2015 Point-in-Time Data
Households by Income, 2007 to 2015
Population: 48,029 | Number of Households: 18,339Median Household Income: $43,693 (state average: $51,084)Unemployment Rate: 10.1% (state average: 7.2%)ALICE Households: 24% (state average: 25%); Poverty Households: 17% (state average: 15%)
How many households are struggling?ALICE is an acronym for Asset Limited, Income Constrained, Employed – households that earn more than the Federal Poverty Level, but less than the basic cost of living for the county (the ALICE Threshold, or AT). Combined, the number of poverty and ALICE households equals the total population struggling to afford basic needs. The number of households below the ALICE Threshold changes over time; households move in and out of poverty and ALICE as circumstances improve or worsen. The Great Recession, from 2007 to 2010, caused hardship for many families. Conditions started to improve in 2010 and 2012 for some, but not for all.
What does it cost to afford the basic necessities?The bare-minimum Household Survival Budget does not include any savings, leaving a household vulnerable to unexpected expenses. ALICE households typically earn above the Federal Poverty Level of $11,770 for a single adult and $24,250 for a family of four, but less than the Household Survival Budget.
ALICE IN NEWAYGO COUNTY
Household Survival Budget, Newaygo County
SINGLE ADULT2 ADULTS, 1 INFANT,
1 PRESCHOOLERMonthly Costs
Housing $502 $644Child Care $– $900Food $184 $609Transportation $349 $697Health Care $184 $707Miscellaneous $140 $378Taxes $177 $227
Monthly Total $1,536 $4,162ANNUAL TOTAL $18,432 $49,944Hourly Wage $9.22 $24.97
Sources: 2015 Point-in-Time Data: American Community Survey. ALICE Demographics: American Community Survey; the ALICE Threshold. Budget: U.S. Department of Housing and Urban Development (HUD); U.S. Department of Agriculture (USDA); Bureau of Labor Statistics (BLS); Internal Revenue Service (IRS); Michigan Department of Treasury; Early Childhood Investment Corporation.
15% 16% 16% 17%
22% 23% 27% 24%
63% 61% 57% 59%
18,950 18,692 18,074 18,339
-
2,000
4,000
6,000
8,000
10,000
12,000
14,000
16,000
18,000
20,000
0%
10%
20%
30%
40%
50%
60%
70%
80%
90%
100%
2007 2010 2012 2015
Tota
l Hou
seho
lds
Perc
ent o
f Hou
seho
lds
261231
Poverty ALICE Above AT Total HH

UNIT
ED W
AY A
LICE
REP
ORT
– 20
17 U
PDAT
E FO
R M
ICHI
GAN
– EX
HIBI
T I
Note: Municipal-level data on this page is for Places and County Subdivisions, which include Census Designated Places (CDP). These are overlapping geographies so totals will not match county-level data. Municipal-level data often relies on 5-year averages and is not available for the smallest towns that do not report income.
Families with Children by Income, 2015
Assets, All Households, 2015
How many families with children are struggling?Children add significant expense to a family budget, so it is not surprising that many Newaygo County families with children live below the ALICE Threshold. Though more Newaygo County families are headed by married parents, those families with a single parent are more likely to have income below the ALICE Threshold.
What assets do households have?Ownership of assets can contribute to stability of households. Yet few families in Newaygo County own liquid assets, such as a savings account, 401(k) plan, or rental income, that are readily available to cover emergency expenses. Vehicles, the most common asset, depreciate over time. Homeownership, the next most common asset, can build wealth, but is not a liquid asset.
1 Vehicle
2 Vehicles
No Mortgage
3 Vehicles
With Mortgage
4+ Vehicles
0%
10%
20%
30%
40%
50%
60%
70%
80%
90%
100%
Vehicle Home Interest, Dividends, or RentalIncome
Perc
ent o
f Hou
seho
lds
261233
14%
64%
29% 9%
25%
26%
77%
11%
45%
3,507
1,053
438
0
500
1,000
1,500
2,000
2,500
3,000
3,500
4,000
0%
10%
20%
30%
40%
50%
60%
70%
80%
90%
100%
Married SingleFemale-Headed
SingleMale-
HeadedTo
tal H
ouse
hold
s
Perc
ent o
f Fam
ilies
with
Chi
ldre
n
261232
Poverty ALICE Above AT Total HH
Newaygo County, 2015
Town Total HH% ALICE
& Poverty
Ashland Township 868 35%
Barton Township 281 36%
Beaver Township 178 47%
Big Prairie Township 997 56%
Bridgeton Township 804 42%
Brooks Township 1,661 40%
Croton Township 1,263 36%
Dayton Township 711 22%
Denver Township 740 49%
Ensley Township 903 30%
Everett Township 685 47%
Fremont City 1,674 38%
Garfield Township 871 39%
Goodwell Township 213 31%
Grant City 385 63%
Grant Township 1,074 34%
Lilley Township 329 55%
Lincoln Township 579 32%
Merrill Township 260 63%
Monroe Township 149 48%
Newaygo City 769 60%
Norwich Township 227 34%
Sheridan Charter Township 946 32%
Sherman Township 730 35%
White Cloud City 452 67%
Wilcox Township 411 43%

UNIT
ED W
AY A
LICE
REP
ORT
– 20
17 U
PDAT
E FO
R M
ICHI
GAN
– EX
HIBI
T I
2015 Point-in-Time Data
Households by Income, 2007 to 2015
Population: 1,242,304 | Number of Households: 497,819Median Household Income: $69,998 (state average: $51,084)Unemployment Rate: 5.1% (state average: 7.2%)ALICE Households: 20% (state average: 25%); Poverty Households: 10% (state average: 15%)
How many households are struggling?ALICE is an acronym for Asset Limited, Income Constrained, Employed – households that earn more than the Federal Poverty Level, but less than the basic cost of living for the county (the ALICE Threshold, or AT). Combined, the number of poverty and ALICE households equals the total population struggling to afford basic needs. The number of households below the ALICE Threshold changes over time; households move in and out of poverty and ALICE as circumstances improve or worsen. The Great Recession, from 2007 to 2010, caused hardship for many families. Conditions started to improve in 2010 and 2012 for some, but not for all.
What does it cost to afford the basic necessities?The bare-minimum Household Survival Budget does not include any savings, leaving a household vulnerable to unexpected expenses. ALICE households typically earn above the Federal Poverty Level of $11,770 for a single adult and $24,250 for a family of four, but less than the Household Survival Budget.
ALICE IN OAKLAND COUNTY
Household Survival Budget, Oakland County
SINGLE ADULT2 ADULTS, 1 INFANT,
1 PRESCHOOLERMonthly Costs
Housing $510 $846Child Care $– $1,280Food $184 $609Transportation $491 $981Health Care $166 $637Miscellaneous $156 $482Taxes $209 $470
Monthly Total $1,716 $5,305ANNUAL TOTAL $20,592 $63,660Hourly Wage $10.30 $31.83
Sources: 2015 Point-in-Time Data: American Community Survey. ALICE Demographics: American Community Survey; the ALICE Threshold. Budget: U.S. Department of Housing and Urban Development (HUD); U.S. Department of Agriculture (USDA); Bureau of Labor Statistics (BLS); Internal Revenue Service (IRS); Michigan Department of Treasury; Early Childhood Investment Corporation.
8% 10% 10% 10%
22% 24% 22% 20%
70% 66% 68% 70%
480,262 482,286 489,897 497,819
-
100,000
200,000
300,000
400,000
500,000
600,000
0%
10%
20%
30%
40%
50%
60%
70%
80%
90%
100%
2007 2010 2012 2015
Tota
l Hou
seho
lds
Perc
ent o
f Hou
seho
lds
261251
Poverty ALICE Above AT Total HH

UNIT
ED W
AY A
LICE
REP
ORT
– 20
17 U
PDAT
E FO
R M
ICHI
GAN
– EX
HIBI
T I
Note: Municipal-level data on this page is for Places and County Subdivisions, which include Census Designated Places (CDP). These are overlapping geographies so totals will not match county-level data. Municipal-level data often relies on 5-year averages and is not available for the smallest towns that do not report income.
Families with Children by Income, 2015
Assets, All Households, 2015
How many families with children are struggling?Children add significant expense to a family budget, so it is not surprising that many Oakland County families with children live below the ALICE Threshold. Though more Oakland County families are headed by married parents, those families with a single parent are more likely to have income below the ALICE Threshold.
What assets do households have?Ownership of assets can contribute to stability of households. Yet few families in Oakland County own liquid assets, such as a savings account, 401(k) plan, or rental income, that are readily available to cover emergency expenses. Vehicles, the most common asset, depreciate over time. Homeownership, the next most common asset, can build wealth, but is not a liquid asset.
1 Vehicle
2 Vehicles
No Mortgage
3 Vehicles
With Mortgage
4+ Vehicles
0%
10%
20%
30%
40%
50%
60%
70%
80%
90%
100%
Vehicle Home Interest, Dividends, or RentalIncome
Perc
ent o
f Hou
seho
lds
261253
4%
37%
18% 7%
28%
27%
89%
35%
55%
103,767
24,968
9,092
0
20,000
40,000
60,000
80,000
100,000
120,000
0%
10%
20%
30%
40%
50%
60%
70%
80%
90%
100%
Married Single Female-Headed Single Male-HeadedTo
tal H
ouse
hold
s
Perc
ent o
f Fam
ilies
with
Chi
ldre
n
261252
Poverty ALICE Above AT Total HH
Oakland County, 2015
Town Total HH% ALICE
& Poverty
Addison Township 2,257 23%
Auburn Hills City 8,988 40%
Berkley City 6,573 25%Birmingham City 8,835 17%Bloomfield Charter Township 16,648 17%
Bloomfield Hills City 1,277 9%Brandon Charter Township 5,467 25%
Clawson City 5,481 33%Commerce Charter Township 15,405 22%
Farmington City 4,671 31%Farmington Hills City 34,013 29%Ferndale City 9,479 42%Groveland Township 1,894 20%Hazel Park City 6,958 59%Highland Charter Township 7,306 29%
Holly Township 4,272 32%Huntington Woods City 2,457 11%Independence Charter Township 13,377 23%
Keego Harbor City 1,409 52%Lake Angelus City 134 7%Lathrup Village City 1,553 12%Lyon Charter Township 5,907 25%Madison Heights City 12,855 51%Milford Charter Township 6,219 23%
Northville City 1,350 15%Novi City 23,077 24%Oak Park City 11,494 44%Oakland Charter Township 6,298 16%
Orchard Lake Village City 805 5%
Orion Charter Township 13,249 24%Oxford Charter Township 7,868 27%Pleasant Ridge City 1,109 17%Pontiac City 23,566 66%Rochester City 5,544 27%Rochester Hills City 28,046 24%Rose Township 2,587 29%Royal Oak Charter Township 1,052 73%
Royal Oak City 28,371 32%South Lyon City 4,805 34%Southfield City 32,219 42%Southfield Township 5,720 15%Springfield Charter Township 5,107 22%
Sylvan Lake City 811 25%Troy City 30,812 22%Village Of Clarkston City 408 29%Walled Lake City 3,372 44%Waterford Charter Township 30,127 37%
West Bloomfield Charter Township 24,453 19%
White Lake Charter Township 11,602 27%
Wixom City 6,153 46%

UNIT
ED W
AY A
LICE
REP
ORT
– 20
17 U
PDAT
E FO
R M
ICHI
GAN
– EX
HIBI
T I
2015 Point-in-Time Data
Households by Income, 2007 to 2015
Population: 26,229 | Number of Households: 9,822Median Household Income: $41,617 (state average: $51,084)Unemployment Rate: 8.7% (state average: 7.2%)ALICE Households: 31% (state average: 25%); Poverty Households: 16% (state average: 15%)
How many households are struggling?ALICE is an acronym for Asset Limited, Income Constrained, Employed – households that earn more than the Federal Poverty Level, but less than the basic cost of living for the county (the ALICE Threshold, or AT). Combined, the number of poverty and ALICE households equals the total population struggling to afford basic needs. The number of households below the ALICE Threshold changes over time; households move in and out of poverty and ALICE as circumstances improve or worsen. The Great Recession, from 2007 to 2010, caused hardship for many families. Conditions started to improve in 2010 and 2012 for some, but not for all.
What does it cost to afford the basic necessities?The bare-minimum Household Survival Budget does not include any savings, leaving a household vulnerable to unexpected expenses. ALICE households typically earn above the Federal Poverty Level of $11,770 for a single adult and $24,250 for a family of four, but less than the Household Survival Budget.
ALICE IN OCEANA COUNTY
Household Survival Budget, Oceana County
SINGLE ADULT2 ADULTS, 1 INFANT,
1 PRESCHOOLERMonthly Costs
Housing $486 $643Child Care $– $1,229Food $184 $609Transportation $349 $697Health Care $184 $707Miscellaneous $138 $421Taxes $174 $328
Monthly Total $1,515 $4,634ANNUAL TOTAL $18,180 $55,608Hourly Wage $9.09 $27.80
Sources: 2015 Point-in-Time Data: American Community Survey. ALICE Demographics: American Community Survey; the ALICE Threshold. Budget: U.S. Department of Housing and Urban Development (HUD); U.S. Department of Agriculture (USDA); Bureau of Labor Statistics (BLS); Internal Revenue Service (IRS); Michigan Department of Treasury; Early Childhood Investment Corporation.
17% 13% 17% 16%
24% 31%
28% 31%
59% 56% 55% 53%
10,364 9,619 9,466
9,822
-
2,000
4,000
6,000
8,000
10,000
12,000
0%
10%
20%
30%
40%
50%
60%
70%
80%
90%
100%
2007 2010 2012 2015
Tota
l Hou
seho
lds
Perc
ent o
f Hou
seho
lds
261271
Poverty ALICE Above AT Total HH

UNIT
ED W
AY A
LICE
REP
ORT
– 20
17 U
PDAT
E FO
R M
ICHI
GAN
– EX
HIBI
T I
Note: Municipal-level data on this page is for Places and County Subdivisions, which include Census Designated Places (CDP). These are overlapping geographies so totals will not match county-level data. Municipal-level data often relies on 5-year averages and is not available for the smallest towns that do not report income.
Families with Children by Income, 2015
Assets, All Households, 2015
How many families with children are struggling?Children add significant expense to a family budget, so it is not surprising that many Oceana County families with children live below the ALICE Threshold. Though more Oceana County families are headed by married parents, those families with a single parent are more likely to have income below the ALICE Threshold.
What assets do households have?Ownership of assets can contribute to stability of households. Yet few families in Oceana County own liquid assets, such as a savings account, 401(k) plan, or rental income, that are readily available to cover emergency expenses. Vehicles, the most common asset, depreciate over time. Homeownership, the next most common asset, can build wealth, but is not a liquid asset.
1 Vehicle
2 Vehicles
No Mortgage
3 Vehicles
With Mortgage
4+ Vehicles
0%
10%
20%
30%
40%
50%
60%
70%
80%
90%
100%
Vehicle Home Interest, Dividends, or RentalIncome
Perc
ent o
f Hou
seho
lds
261273
16%
62%
44% 21%
23%
34%
63%
15% 22%
1,815
458 340
0
200
400
600
800
1,000
1,200
1,400
1,600
1,800
2,000
0%
10%
20%
30%
40%
50%
60%
70%
80%
90%
100%
Married SingleFemale-Headed
SingleMale-
HeadedTo
tal H
ouse
hold
s
Perc
ent o
f Fam
ilies
with
Chi
ldre
n
261272
Poverty ALICE Above AT Total HH
Oceana County, 2015
Town Total HH% ALICE
& Poverty
Benona Township 623 42%
Claybanks Township 350 39%
Colfax Township 157 35%
Crystal Township 273 61%
Elbridge Township 359 52%
Ferry Township 458 47%
Golden Township 720 46%
Grant Township 1,051 40%
Greenwood Township 414 45%
Hart City 701 65%
Hart Township 700 46%
Leavitt Township 292 56%
Newfield Township 909 45%
Otto Township 317 51%
Pentwater Township 695 38%
Shelby Township 1,361 51%
Weare Township 442 46%

UNIT
ED W
AY A
LICE
REP
ORT
– 20
17 U
PDAT
E FO
R M
ICHI
GAN
– EX
HIBI
T I
2015 Point-in-Time Data
Households by Income, 2007 to 2015
Population: 21,222 | Number of Households: 9,434Median Household Income: $36,063 (state average: $51,084)Unemployment Rate: 12.4% (state average: 7.2%)ALICE Households: 26% (state average: 25%); Poverty Households: 20% (state average: 15%)
How many households are struggling?ALICE is an acronym for Asset Limited, Income Constrained, Employed – households that earn more than the Federal Poverty Level, but less than the basic cost of living for the county (the ALICE Threshold, or AT). Combined, the number of poverty and ALICE households equals the total population struggling to afford basic needs. The number of households below the ALICE Threshold changes over time; households move in and out of poverty and ALICE as circumstances improve or worsen. The Great Recession, from 2007 to 2010, caused hardship for many families. Conditions started to improve in 2010 and 2012 for some, but not for all.
What does it cost to afford the basic necessities?The bare-minimum Household Survival Budget does not include any savings, leaving a household vulnerable to unexpected expenses. ALICE households typically earn above the Federal Poverty Level of $11,770 for a single adult and $24,250 for a family of four, but less than the Household Survival Budget.
ALICE IN OGEMAW COUNTY
Household Survival Budget, Ogemaw County
SINGLE ADULT2 ADULTS, 1 INFANT,
1 PRESCHOOLERMonthly Costs
Housing $452 $649Child Care $– $1,229Food $184 $609Transportation $349 $697Health Care $184 $707Miscellaneous $133 $422Taxes $166 $329
Monthly Total $1,468 $4,642ANNUAL TOTAL $17,616 $55,704Hourly Wage $8.81 $27.85
Sources: 2015 Point-in-Time Data: American Community Survey. ALICE Demographics: American Community Survey; the ALICE Threshold. Budget: U.S. Department of Housing and Urban Development (HUD); U.S. Department of Agriculture (USDA); Bureau of Labor Statistics (BLS); Internal Revenue Service (IRS); Michigan Department of Treasury; Early Childhood Investment Corporation.
18% 18% 20% 20%
26% 30% 22% 26%
56% 52%
58% 54%
8,479 8,074
9,031 9,434
-
1,000
2,000
3,000
4,000
5,000
6,000
7,000
8,000
9,000
10,000
0%
10%
20%
30%
40%
50%
60%
70%
80%
90%
100%
2007 2010 2012 2015
Tota
l Hou
seho
lds
Perc
ent o
f Hou
seho
lds
261291
Poverty ALICE Above AT Total HH

UNIT
ED W
AY A
LICE
REP
ORT
– 20
17 U
PDAT
E FO
R M
ICHI
GAN
– EX
HIBI
T I
Note: Municipal-level data on this page is for Places and County Subdivisions, which include Census Designated Places (CDP). These are overlapping geographies so totals will not match county-level data. Municipal-level data often relies on 5-year averages and is not available for the smallest towns that do not report income.
Families with Children by Income, 2015
Assets, All Households, 2015
How many families with children are struggling?Children add significant expense to a family budget, so it is not surprising that many Ogemaw County families with children live below the ALICE Threshold. Though more Ogemaw County families are headed by married parents, those families with a single parent are more likely to have income below the ALICE Threshold.
What assets do households have?Ownership of assets can contribute to stability of households. Yet few families in Ogemaw County own liquid assets, such as a savings account, 401(k) plan, or rental income, that are readily available to cover emergency expenses. Vehicles, the most common asset, depreciate over time. Homeownership, the next most common asset, can build wealth, but is not a liquid asset.
1 Vehicle
2 Vehicles
No Mortgage
3 Vehicles
With Mortgage
4+ Vehicles
0%
10%
20%
30%
40%
50%
60%
70%
80%
90%
100%
Vehicle Home Interest, Dividends, or RentalIncome
Perc
ent o
f Hou
seho
lds
261293
22%
66%
26%
10%
23%
38%
68%
11%
36%
1,258
616
222
0
200
400
600
800
1,000
1,200
1,400
0%
10%
20%
30%
40%
50%
60%
70%
80%
90%
100%
Married SingleFemale-Headed
SingleMale-
HeadedTo
tal H
ouse
hold
s
Perc
ent o
f Fam
ilies
with
Chi
ldre
n
261292
Poverty ALICE Above AT Total HH
Ogemaw County, 2015
Town Total HH% ALICE
& Poverty
Churchill Township 700 31%
Cumming Township 291 48%
Edwards Township 608 41%
Foster Township 373 38%
Goodar Township 211 38%
Hill Township 687 35%
Horton Township 443 40%
Klacking Township 254 34%
Logan Township 232 45%
Mills Township 1,902 61%
Ogemaw Township 412 34%
Richland Township 400 37%
Rose City 216 69%
Rose Township 568 38%
West Branch City 1,063 61%
West Branch Township 1,074 37%

UNIT
ED W
AY A
LICE
REP
ORT
– 20
17 U
PDAT
E FO
R M
ICHI
GAN
– EX
HIBI
T I
2015 Point-in-Time Data
Households by Income, 2007 to 2015
Population: 6,298 | Number of Households: 3,084Median Household Income: $34,459 (state average: $51,084)Unemployment Rate: 13.7% (state average: 7.2%)ALICE Households: 32% (state average: 25%); Poverty Households: 15% (state average: 15%)
How many households are struggling?ALICE is an acronym for Asset Limited, Income Constrained, Employed – households that earn more than the Federal Poverty Level, but less than the basic cost of living for the county (the ALICE Threshold, or AT). Combined, the number of poverty and ALICE households equals the total population struggling to afford basic needs. The number of households below the ALICE Threshold changes over time; households move in and out of poverty and ALICE as circumstances improve or worsen. The Great Recession, from 2007 to 2010, caused hardship for many families. Conditions started to improve in 2010 and 2012 for some, but not for all.
What does it cost to afford the basic necessities?The bare-minimum Household Survival Budget does not include any savings, leaving a household vulnerable to unexpected expenses. ALICE households typically earn above the Federal Poverty Level of $11,770 for a single adult and $24,250 for a family of four, but less than the Household Survival Budget.
ALICE IN ONTONAGON COUNTY
Household Survival Budget, Ontonagon County
SINGLE ADULT2 ADULTS, 1 INFANT,
1 PRESCHOOLERMonthly Costs
Housing $501 $643Child Care $– $1,229Food $184 $609Transportation $349 $697Health Care $184 $707Miscellaneous $139 $421Taxes $177 $328
Monthly Total $1,534 $4,634ANNUAL TOTAL $18,408 $55,608Hourly Wage $9.20 $27.80
Sources: 2015 Point-in-Time Data: American Community Survey. ALICE Demographics: American Community Survey; the ALICE Threshold. Budget: U.S. Department of Housing and Urban Development (HUD); U.S. Department of Agriculture (USDA); Bureau of Labor Statistics (BLS); Internal Revenue Service (IRS); Michigan Department of Treasury; Early Childhood Investment Corporation.
#N/A 14% 16% 15%
26% 23% 32%
60% 61%
53%
3,410 3,333 3,084
-
500
1,000
1,500
2,000
2,500
3,000
3,500
4,000
0%
10%
20%
30%
40%
50%
60%
70%
80%
90%
100%
2010 2012 2015
Tota
l Hou
seho
lds
Perc
ent o
f Hou
seho
lds
261311
Poverty ALICE Above AT Total HH
N/A

UNIT
ED W
AY A
LICE
REP
ORT
– 20
17 U
PDAT
E FO
R M
ICHI
GAN
– EX
HIBI
T I
Note: Municipal-level data on this page is for Places and County Subdivisions, which include Census Designated Places (CDP). These are overlapping geographies so totals will not match county-level data. Municipal-level data often relies on 5-year averages and is not available for the smallest towns that do not report income.
Families with Children by Income, 2015
Assets, All Households, 2015
How many families with children are struggling?Children add significant expense to a family budget, so it is not surprising that many Ontonagon County families with children live below the ALICE Threshold. Though more Ontonagon County families are headed by married parents, those families with a single parent are more likely to have income below the ALICE Threshold.
What assets do households have?Ownership of assets can contribute to stability of households. Yet few families in Ontonagon County own liquid assets, such as a savings account, 401(k) plan, or rental income, that are readily available to cover emergency expenses. Vehicles, the most common asset, depreciate over time. Homeownership, the next most common asset, can build wealth, but is not a liquid asset.
1 Vehicle
2 Vehicles
No Mortgage
3 Vehicles
With Mortgage
4+ Vehicles
0%
10%
20%
30%
40%
50%
60%
70%
80%
90%
100%
Vehicle Home Interest, Dividends, or RentalIncome
Perc
ent o
f Hou
seho
lds
261313
9%
90%
26% 20%
0%
49%
71%
10%
25%
285
60 53
0
50
100
150
200
250
300
0%
10%
20%
30%
40%
50%
60%
70%
80%
90%
100%
Married SingleFemale-Headed
SingleMale-
HeadedTo
tal H
ouse
hold
s
Perc
ent o
f Fam
ilies
with
Chi
ldre
n
261312
Poverty ALICE Above AT Total HH
Ontonagon County, 2015
Town Total HH% ALICE
& Poverty
Bergland Township 233 48%
Carp Lake Township 300 42%
Greenland Township 349 46%
Haight Township 100 38%
Interior Township 166 55%
Mcmillan Township 198 35%
Ontonagon Township 1,226 48%
Stannard Township 336 56%

UNIT
ED W
AY A
LICE
REP
ORT
– 20
17 U
PDAT
E FO
R M
ICHI
GAN
– EX
HIBI
T I
2015 Point-in-Time Data
Households by Income, 2007 to 2015
Population: 23,234 | Number of Households: 8,757Median Household Income: $38,999 (state average: $51,084)Unemployment Rate: 10.3% (state average: 7.2%)ALICE Households: 28% (state average: 25%); Poverty Households: 19% (state average: 15%)
How many households are struggling?ALICE is an acronym for Asset Limited, Income Constrained, Employed – households that earn more than the Federal Poverty Level, but less than the basic cost of living for the county (the ALICE Threshold, or AT). Combined, the number of poverty and ALICE households equals the total population struggling to afford basic needs. The number of households below the ALICE Threshold changes over time; households move in and out of poverty and ALICE as circumstances improve or worsen. The Great Recession, from 2007 to 2010, caused hardship for many families. Conditions started to improve in 2010 and 2012 for some, but not for all.
What does it cost to afford the basic necessities?The bare-minimum Household Survival Budget does not include any savings, leaving a household vulnerable to unexpected expenses. ALICE households typically earn above the Federal Poverty Level of $11,770 for a single adult and $24,250 for a family of four, but less than the Household Survival Budget.
ALICE IN OSCEOLA COUNTY
Household Survival Budget, Osceola County
SINGLE ADULT2 ADULTS, 1 INFANT,
1 PRESCHOOLERMonthly Costs
Housing $448 $643Child Care $– $536Food $184 $609Transportation $349 $697Health Care $184 $707Miscellaneous $133 $333Taxes $165 $135
Monthly Total $1,463 $3,660ANNUAL TOTAL $17,556 $43,920Hourly Wage $8.78 $21.96
Sources: 2015 Point-in-Time Data: American Community Survey. ALICE Demographics: American Community Survey; the ALICE Threshold. Budget: U.S. Department of Housing and Urban Development (HUD); U.S. Department of Agriculture (USDA); Bureau of Labor Statistics (BLS); Internal Revenue Service (IRS); Michigan Department of Treasury; Early Childhood Investment Corporation.
17% 17% 19% 19%
27% 23% 26% 28%
56% 60%
55% 53%
8,665 9,076 8,877 8,757
-
1,000
2,000
3,000
4,000
5,000
6,000
7,000
8,000
9,000
10,000
0%
10%
20%
30%
40%
50%
60%
70%
80%
90%
100%
2007 2010 2012 2015
Tota
l Hou
seho
lds
Perc
ent o
f Hou
seho
lds
261331
Poverty ALICE Above AT Total HH

UNIT
ED W
AY A
LICE
REP
ORT
– 20
17 U
PDAT
E FO
R M
ICHI
GAN
– EX
HIBI
T I
Note: Municipal-level data on this page is for Places and County Subdivisions, which include Census Designated Places (CDP). These are overlapping geographies so totals will not match county-level data. Municipal-level data often relies on 5-year averages and is not available for the smallest towns that do not report income.
Families with Children by Income, 2015
Assets, All Households, 2015
How many families with children are struggling?Children add significant expense to a family budget, so it is not surprising that many Osceola County families with children live below the ALICE Threshold. Though more Osceola County families are headed by married parents, those families with a single parent are more likely to have income below the ALICE Threshold.
What assets do households have?Ownership of assets can contribute to stability of households. Yet few families in Osceola County own liquid assets, such as a savings account, 401(k) plan, or rental income, that are readily available to cover emergency expenses. Vehicles, the most common asset, depreciate over time. Homeownership, the next most common asset, can build wealth, but is not a liquid asset.
1 Vehicle
2 Vehicles
No Mortgage
3 Vehicles
With Mortgage
4+ Vehicles
0%
10%
20%
30%
40%
50%
60%
70%
80%
90%
100%
Vehicle Home Interest, Dividends, or RentalIncome
Perc
ent o
f Hou
seho
lds
261333
15%
72%
35% 13%
11%
31%
72%
17%
34% 1,344
608
267
0
200
400
600
800
1,000
1,200
1,400
1,600
0%
10%
20%
30%
40%
50%
60%
70%
80%
90%
100%
Married SingleFemale-Headed
SingleMale-
HeadedTo
tal H
ouse
hold
s
Perc
ent o
f Fam
ilies
with
Chi
ldre
n
261332
Poverty ALICE Above AT Total HH
Osceola County, 2015
Town Total HH% ALICE
& Poverty
Burdell Township 466 37%
Cedar Township 178 43%
Evart City 644 72%
Evart Township 557 35%
Hartwick Township 238 48%
Hersey Township 695 44%
Highland Township 459 38%
Le Roy Township 432 40%
Lincoln Township 618 50%
Marion Township 593 54%
Middle Branch Township 310 52%
Orient Township 300 44%
Osceola Township 393 41%
Reed City 1,060 57%
Richmond Township 604 35%
Rose Lake Township 492 46%
Sherman Township 374 41%
Sylvan Township 344 39%

UNIT
ED W
AY A
LICE
REP
ORT
– 20
17 U
PDAT
E FO
R M
ICHI
GAN
– EX
HIBI
T I
2015 Point-in-Time Data
Households by Income, 2007 to 2015
Population: 8,444 | Number of Households: 3,686Median Household Income: $33,021 (state average: $51,084)Unemployment Rate: 13.2% (state average: 7.2%)ALICE Households: 28% (state average: 25%); Poverty Households: 19% (state average: 15%)
How many households are struggling?ALICE is an acronym for Asset Limited, Income Constrained, Employed – households that earn more than the Federal Poverty Level, but less than the basic cost of living for the county (the ALICE Threshold, or AT). Combined, the number of poverty and ALICE households equals the total population struggling to afford basic needs. The number of households below the ALICE Threshold changes over time; households move in and out of poverty and ALICE as circumstances improve or worsen. The Great Recession, from 2007 to 2010, caused hardship for many families. Conditions started to improve in 2010 and 2012 for some, but not for all.
What does it cost to afford the basic necessities?The bare-minimum Household Survival Budget does not include any savings, leaving a household vulnerable to unexpected expenses. ALICE households typically earn above the Federal Poverty Level of $11,770 for a single adult and $24,250 for a family of four, but less than the Household Survival Budget.
ALICE IN OSCODA COUNTY
Household Survival Budget, Oscoda County
SINGLE ADULT2 ADULTS, 1 INFANT,
1 PRESCHOOLERMonthly Costs
Housing $482 $692Child Care $– $1,229Food $184 $609Transportation $349 $697Health Care $184 $707Miscellaneous $137 $428Taxes $173 $343
Monthly Total $1,509 $4,705ANNUAL TOTAL $18,108 $56,460Hourly Wage $9.05 $28.23
Sources: 2015 Point-in-Time Data: American Community Survey. ALICE Demographics: American Community Survey; the ALICE Threshold. Budget: U.S. Department of Housing and Urban Development (HUD); U.S. Department of Agriculture (USDA); Bureau of Labor Statistics (BLS); Internal Revenue Service (IRS); Michigan Department of Treasury; Early Childhood Investment Corporation.
#N/A 19% 17% 19%
24% 28% 28%
57% 55% 53%
4,052 3,842
3,686
-
500
1,000
1,500
2,000
2,500
3,000
3,500
4,000
4,500
0%
10%
20%
30%
40%
50%
60%
70%
80%
90%
100%
2010 2012 2015
Tota
l Hou
seho
lds
Perc
ent o
f Hou
seho
lds
261351
Poverty ALICE Above AT Total HH
N/A

UNIT
ED W
AY A
LICE
REP
ORT
– 20
17 U
PDAT
E FO
R M
ICHI
GAN
– EX
HIBI
T I
Note: Municipal-level data on this page is for Places and County Subdivisions, which include Census Designated Places (CDP). These are overlapping geographies so totals will not match county-level data. Municipal-level data often relies on 5-year averages and is not available for the smallest towns that do not report income.
Families with Children by Income, 2015
Assets, All Households, 2015
How many families with children are struggling?Children add significant expense to a family budget, so it is not surprising that many Oscoda County families with children live below the ALICE Threshold. Though more Oscoda County families are headed by married parents, those families with a single parent are more likely to have income below the ALICE Threshold.
What assets do households have?Ownership of assets can contribute to stability of households. Yet few families in Oscoda County own liquid assets, such as a savings account, 401(k) plan, or rental income, that are readily available to cover emergency expenses. Vehicles, the most common asset, depreciate over time. Homeownership, the next most common asset, can build wealth, but is not a liquid asset.
1 Vehicle
2 Vehicles
No Mortgage
3 Vehicles
With Mortgage
4+ Vehicles
0%
10%
20%
30%
40%
50%
60%
70%
80%
90%
100%
Vehicle Home Interest, Dividends, or RentalIncome
Perc
ent o
f Hou
seho
lds
261353
22%
52%
33%
13%
32%
28%
65%
16%
39%
397
146 120
0
50
100
150
200
250
300
350
400
450
0%
10%
20%
30%
40%
50%
60%
70%
80%
90%
100%
Married SingleFemale-Headed
SingleMale-
HeadedTo
tal H
ouse
hold
s
Perc
ent o
f Fam
ilies
with
Chi
ldre
n
261352
Poverty ALICE Above AT Total HH
Oscoda County, 2015
Town Total HH% ALICE
& Poverty
Big Creek Township 1,270 51%
Clinton Township 241 44%
Comins Township 727 46%
Elmer Township 395 37%
Greenwood Township 560 42%
Mentor Township 493 53%

UNIT
ED W
AY A
LICE
REP
ORT
– 20
17 U
PDAT
E FO
R M
ICHI
GAN
– EX
HIBI
T I
2015 Point-in-Time Data
Households by Income, 2007 to 2015
Population: 24,141 | Number of Households: 9,956Median Household Income: $48,917 (state average: $51,084)Unemployment Rate: 8.2% (state average: 7.2%)ALICE Households: 24% (state average: 25%); Poverty Households: 12% (state average: 15%)
How many households are struggling?ALICE is an acronym for Asset Limited, Income Constrained, Employed – households that earn more than the Federal Poverty Level, but less than the basic cost of living for the county (the ALICE Threshold, or AT). Combined, the number of poverty and ALICE households equals the total population struggling to afford basic needs. The number of households below the ALICE Threshold changes over time; households move in and out of poverty and ALICE as circumstances improve or worsen. The Great Recession, from 2007 to 2010, caused hardship for many families. Conditions started to improve in 2010 and 2012 for some, but not for all.
What does it cost to afford the basic necessities?The bare-minimum Household Survival Budget does not include any savings, leaving a household vulnerable to unexpected expenses. ALICE households typically earn above the Federal Poverty Level of $11,770 for a single adult and $24,250 for a family of four, but less than the Household Survival Budget.
ALICE IN OTSEGO COUNTY
Household Survival Budget, Otsego County
SINGLE ADULT2 ADULTS, 1 INFANT,
1 PRESCHOOLERMonthly Costs
Housing $462 $663Child Care $– $947Food $184 $609Transportation $349 $697Health Care $184 $707Miscellaneous $135 $387Taxes $168 $247
Monthly Total $1,482 $4,257ANNUAL TOTAL $17,784 $51,084Hourly Wage $8.89 $25.54
Sources: 2015 Point-in-Time Data: American Community Survey. ALICE Demographics: American Community Survey; the ALICE Threshold. Budget: U.S. Department of Housing and Urban Development (HUD); U.S. Department of Agriculture (USDA); Bureau of Labor Statistics (BLS); Internal Revenue Service (IRS); Michigan Department of Treasury; Early Childhood Investment Corporation.
13% 12% 11% 12%
24% 24% 19% 24%
63% 64% 70%
64%
9,508 9,817 9,803 9,956
-
2,000
4,000
6,000
8,000
10,000
12,000
0%
10%
20%
30%
40%
50%
60%
70%
80%
90%
100%
2007 2010 2012 2015
Tota
l Hou
seho
lds
Perc
ent o
f Hou
seho
lds
261371
Poverty ALICE Above AT Total HH

UNIT
ED W
AY A
LICE
REP
ORT
– 20
17 U
PDAT
E FO
R M
ICHI
GAN
– EX
HIBI
T I
Note: Municipal-level data on this page is for Places and County Subdivisions, which include Census Designated Places (CDP). These are overlapping geographies so totals will not match county-level data. Municipal-level data often relies on 5-year averages and is not available for the smallest towns that do not report income.
Families with Children by Income, 2015
Assets, All Households, 2015
How many families with children are struggling?Children add significant expense to a family budget, so it is not surprising that many Otsego County families with children live below the ALICE Threshold. Though more Otsego County families are headed by married parents, those families with a single parent are more likely to have income below the ALICE Threshold.
What assets do households have?Ownership of assets can contribute to stability of households. Yet few families in Otsego County own liquid assets, such as a savings account, 401(k) plan, or rental income, that are readily available to cover emergency expenses. Vehicles, the most common asset, depreciate over time. Homeownership, the next most common asset, can build wealth, but is not a liquid asset.
1 Vehicle
2 Vehicles
No Mortgage
3 Vehicles
With Mortgage
4+ Vehicles
0%
10%
20%
30%
40%
50%
60%
70%
80%
90%
100%
Vehicle Home Interest, Dividends, or RentalIncome
Perc
ent o
f Hou
seho
lds
261373
10%
63%
12% 5%
18%
41%
85%
19%
47%
1,752
442 298
0
200
400
600
800
1,000
1,200
1,400
1,600
1,800
2,000
0%
10%
20%
30%
40%
50%
60%
70%
80%
90%
100%
Married SingleFemale-Headed
SingleMale-
HeadedTo
tal H
ouse
hold
s
Perc
ent o
f Fam
ilies
with
Chi
ldre
n
261372
Poverty ALICE Above AT Total HH
Otsego County, 2015
Town Total HH% ALICE
& Poverty
Bagley Township 2,312 33%
Charlton Township 647 36%
Chester Township 505 31%
Corwith Township 781 55%
Dover Township 192 23%
Elmira Township 684 22%
Gaylord City 1,709 54%
Hayes Township 972 27%
Livingston Township 972 35%
Otsego Lake Township 1,182 23%

UNIT
ED W
AY A
LICE
REP
ORT
– 20
17 U
PDAT
E FO
R M
ICHI
GAN
– EX
HIBI
T I
2015 Point-in-Time Data
Households by Income, 2007 to 2015
Population: 279,955 | Number of Households: 98,598Median Household Income: $61,012 (state average: $51,084)Unemployment Rate: 4.3% (state average: 7.2%)ALICE Households: 28% (state average: 25%); Poverty Households: 8% (state average: 15%)
How many households are struggling?ALICE is an acronym for Asset Limited, Income Constrained, Employed – households that earn more than the Federal Poverty Level, but less than the basic cost of living for the county (the ALICE Threshold, or AT). Combined, the number of poverty and ALICE households equals the total population struggling to afford basic needs. The number of households below the ALICE Threshold changes over time; households move in and out of poverty and ALICE as circumstances improve or worsen. The Great Recession, from 2007 to 2010, caused hardship for many families. Conditions started to improve in 2010 and 2012 for some, but not for all.
What does it cost to afford the basic necessities?The bare-minimum Household Survival Budget does not include any savings, leaving a household vulnerable to unexpected expenses. ALICE households typically earn above the Federal Poverty Level of $11,770 for a single adult and $24,250 for a family of four, but less than the Household Survival Budget.
ALICE IN OTTAWA COUNTY
Household Survival Budget, Ottawa County
SINGLE ADULT2 ADULTS, 1 INFANT,
1 PRESCHOOLERMonthly Costs
Housing $590 $730Child Care $– $1,188Food $184 $609Transportation $349 $697Health Care $184 $707Miscellaneous $150 $427Taxes $197 $342
Monthly Total $1,654 $4,700ANNUAL TOTAL $19,848 $56,400Hourly Wage $9.92 $28.20
Sources: 2015 Point-in-Time Data: American Community Survey. ALICE Demographics: American Community Survey; the ALICE Threshold. Budget: U.S. Department of Housing and Urban Development (HUD); U.S. Department of Agriculture (USDA); Bureau of Labor Statistics (BLS); Internal Revenue Service (IRS); Michigan Department of Treasury; Early Childhood Investment Corporation.
6% 11% 9% 8% 25%
25% 27% 28%
69% 64% 64% 64%
92,845 91,334 95,048
98,598
-
20,000
40,000
60,000
80,000
100,000
120,000
0%
10%
20%
30%
40%
50%
60%
70%
80%
90%
100%
2007 2010 2012 2015
Tota
l Hou
seho
lds
Perc
ent o
f Hou
seho
lds
261391
Poverty ALICE Above AT Total HH

UNIT
ED W
AY A
LICE
REP
ORT
– 20
17 U
PDAT
E FO
R M
ICHI
GAN
– EX
HIBI
T I
Note: Municipal-level data on this page is for Places and County Subdivisions, which include Census Designated Places (CDP). These are overlapping geographies so totals will not match county-level data. Municipal-level data often relies on 5-year averages and is not available for the smallest towns that do not report income.
Families with Children by Income, 2015
Assets, All Households, 2015
How many families with children are struggling?Children add significant expense to a family budget, so it is not surprising that many Ottawa County families with children live below the ALICE Threshold. Though more Ottawa County families are headed by married parents, those families with a single parent are more likely to have income below the ALICE Threshold.
What assets do households have?Ownership of assets can contribute to stability of households. Yet few families in Ottawa County own liquid assets, such as a savings account, 401(k) plan, or rental income, that are readily available to cover emergency expenses. Vehicles, the most common asset, depreciate over time. Homeownership, the next most common asset, can build wealth, but is not a liquid asset.
1 Vehicle
2 Vehicles
No Mortgage
3 Vehicles
With Mortgage
4+ Vehicles
0%
20%
40%
60%
80%
100%
120%
Vehicle Home Interest, Dividends, or RentalIncome
Perc
ent o
f Hou
seho
lds
261393
3%
39%
2%
12%
46%
43%
85%
15%
55%
24,932
4,698
1,972
0
5,000
10,000
15,000
20,000
25,000
30,000
0%
10%
20%
30%
40%
50%
60%
70%
80%
90%
100%
Married SingleFemale-Headed
SingleMale-
HeadedTo
tal H
ouse
hold
s
Perc
ent o
f Fam
ilies
with
Chi
ldre
n
261392
Poverty ALICE Above AT Total HH
Ottawa County, 2015
Town Total HH% ALICE
& Poverty
Allendale Charter Township 5,807 51%
Blendon Township 2,020 34%
Chester Township 743 33%
Coopersville City 1,671 50%
Crockery Township 1,525 53%
Ferrysburg City 1,363 28%
Georgetown Charter Township 17,272 32%
Grand Haven Charter Township 5,658 30%
Grand Haven City 4,988 50%
Holland Charter Township 13,056 38%
Holland City 8,679 49%
Hudsonville City 2,519 43%
Jamestown Charter Township 2,463 19%
Olive Township 1,501 37%
Park Township 6,635 25%
Polkton Charter Township 926 31%
Port Sheldon Township 1,710 36%
Robinson Township 2,127 29%
Spring Lake Township 5,994 39%
Tallmadge Charter Township 2,798 34%
Wright Township 1,082 40%
Zeeland Charter Township 3,350 33%
Zeeland City 2,396 59%

UNIT
ED W
AY A
LICE
REP
ORT
– 20
17 U
PDAT
E FO
R M
ICHI
GAN
– EX
HIBI
T I
2015 Point-in-Time Data
Households by Income, 2007 to 2015
Population: 13,037 | Number of Households: 5,999Median Household Income: $41,213 (state average: $51,084)Unemployment Rate: 13.1% (state average: 7.2%)ALICE Households: 23% (state average: 25%); Poverty Households: 14% (state average: 15%)
How many households are struggling?ALICE is an acronym for Asset Limited, Income Constrained, Employed – households that earn more than the Federal Poverty Level, but less than the basic cost of living for the county (the ALICE Threshold, or AT). Combined, the number of poverty and ALICE households equals the total population struggling to afford basic needs. The number of households below the ALICE Threshold changes over time; households move in and out of poverty and ALICE as circumstances improve or worsen. The Great Recession, from 2007 to 2010, caused hardship for many families. Conditions started to improve in 2010 and 2012 for some, but not for all.
What does it cost to afford the basic necessities?The bare-minimum Household Survival Budget does not include any savings, leaving a household vulnerable to unexpected expenses. ALICE households typically earn above the Federal Poverty Level of $11,770 for a single adult and $24,250 for a family of four, but less than the Household Survival Budget.
ALICE IN PRESQUE ISLE COUNTY
Household Survival Budget, Presque Isle County
SINGLE ADULT2 ADULTS, 1 INFANT,
1 PRESCHOOLERMonthly Costs
Housing $448 $643Child Care $– $1,229Food $184 $609Transportation $349 $697Health Care $184 $707Miscellaneous $133 $421Taxes $165 $328
Monthly Total $1,463 $4,634ANNUAL TOTAL $17,556 $55,608Hourly Wage $8.78 $27.80
Sources: 2015 Point-in-Time Data: American Community Survey. ALICE Demographics: American Community Survey; the ALICE Threshold. Budget: U.S. Department of Housing and Urban Development (HUD); U.S. Department of Agriculture (USDA); Bureau of Labor Statistics (BLS); Internal Revenue Service (IRS); Michigan Department of Treasury; Early Childhood Investment Corporation.
#N/A 13% 13% 14%
19% 24% 23%
68% 63% 63%
6,332 6,123 5,999
-
1,000
2,000
3,000
4,000
5,000
6,000
7,000
0%
10%
20%
30%
40%
50%
60%
70%
80%
90%
100%
2010 2012 2015
Tota
l Hou
seho
lds
Perc
ent o
f Hou
seho
lds
261411
Poverty ALICE Above AT Total HH
N/A

UNIT
ED W
AY A
LICE
REP
ORT
– 20
17 U
PDAT
E FO
R M
ICHI
GAN
– EX
HIBI
T I
Note: Municipal-level data on this page is for Places and County Subdivisions, which include Census Designated Places (CDP). These are overlapping geographies so totals will not match county-level data. Municipal-level data often relies on 5-year averages and is not available for the smallest towns that do not report income.
Families with Children by Income, 2015
Assets, All Households, 2015
How many families with children are struggling?Children add significant expense to a family budget, so it is not surprising that many Presque Isle County families with children live below the ALICE Threshold. Though more Presque Isle County families are headed by married parents, those families with a single parent are more likely to have income below the ALICE Threshold.
What assets do households have?Ownership of assets can contribute to stability of households. Yet few families in Presque Isle County own liquid assets, such as a savings account, 401(k) plan, or rental income, that are readily available to cover emergency expenses. Vehicles, the most common asset, depreciate over time. Homeownership, the next most common asset, can build wealth, but is not a liquid asset.
1 Vehicle
2 Vehicles
No Mortgage
3 Vehicles
With Mortgage
4+ Vehicles
0%
20%
40%
60%
80%
100%
120%
Vehicle Home Interest, Dividends, or RentalIncome
Perc
ent o
f Hou
seho
lds
261413
11%
57%
42% 9%
10% 37% 80%
33% 21%
731
185
111
0
100
200
300
400
500
600
700
800
0%
10%
20%
30%
40%
50%
60%
70%
80%
90%
100%
Married SingleFemale-Headed
SingleMale-
HeadedTo
tal H
ouse
hold
s
Perc
ent o
f Fam
ilies
with
Chi
ldre
n
261412
Poverty ALICE Above AT Total HH
Presque Isle County, 2015
Town Total HH% ALICE
& Poverty
Allis Township 424 48%
Bearinger Township 171 29%
Belknap Township 307 41%
Bismarck Township 179 46%
Case Township 364 43%
Krakow Township 356 38%
Metz Township 124 48%
Moltke Township 126 31%
North Allis Township 198 25%
Ocqueoc Township 305 37%
Onaway City 344 61%
Posen Township 349 38%
Presque Isle Township 828 16%
Pulawski Township 146 41%
Rogers City 1,325 42%
Rogers Township 453 27%

UNIT
ED W
AY A
LICE
REP
ORT
– 20
17 U
PDAT
E FO
R M
ICHI
GAN
– EX
HIBI
T I
2015 Point-in-Time Data
Households by Income, 2007 to 2015
Population: 24,068 | Number of Households: 11,543Median Household Income: $35,133 (state average: $51,084)Unemployment Rate: 14.2% (state average: 7.2%)ALICE Households: 24% (state average: 25%); Poverty Households: 19% (state average: 15%)
How many households are struggling?ALICE is an acronym for Asset Limited, Income Constrained, Employed – households that earn more than the Federal Poverty Level, but less than the basic cost of living for the county (the ALICE Threshold, or AT). Combined, the number of poverty and ALICE households equals the total population struggling to afford basic needs. The number of households below the ALICE Threshold changes over time; households move in and out of poverty and ALICE as circumstances improve or worsen. The Great Recession, from 2007 to 2010, caused hardship for many families. Conditions started to improve in 2010 and 2012 for some, but not for all.
What does it cost to afford the basic necessities?The bare-minimum Household Survival Budget does not include any savings, leaving a household vulnerable to unexpected expenses. ALICE households typically earn above the Federal Poverty Level of $11,770 for a single adult and $24,250 for a family of four, but less than the Household Survival Budget.
ALICE IN ROSCOMMON COUNTY
Household Survival Budget, Roscommon County
SINGLE ADULT2 ADULTS, 1 INFANT,
1 PRESCHOOLERMonthly Costs
Housing $448 $643Child Care $– $1,082Food $184 $609Transportation $349 $697Health Care $184 $707Miscellaneous $133 $402Taxes $165 $283
Monthly Total $1,463 $4,423ANNUAL TOTAL $17,556 $53,076Hourly Wage $8.78 $26.54
Sources: 2015 Point-in-Time Data: American Community Survey. ALICE Demographics: American Community Survey; the ALICE Threshold. Budget: U.S. Department of Housing and Urban Development (HUD); U.S. Department of Agriculture (USDA); Bureau of Labor Statistics (BLS); Internal Revenue Service (IRS); Michigan Department of Treasury; Early Childhood Investment Corporation.
20% 18% 19% 19%
24% 25% 21% 24%
56% 57% 60%
57%
11,987
11,028 11,723 11,543
-
2,000
4,000
6,000
8,000
10,000
12,000
14,000
0%
10%
20%
30%
40%
50%
60%
70%
80%
90%
100%
2007 2010 2012 2015
Tota
l Hou
seho
lds
Perc
ent o
f Hou
seho
lds
261431
Poverty ALICE Above AT Total HH

UNIT
ED W
AY A
LICE
REP
ORT
– 20
17 U
PDAT
E FO
R M
ICHI
GAN
– EX
HIBI
T I
Note: Municipal-level data on this page is for Places and County Subdivisions, which include Census Designated Places (CDP). These are overlapping geographies so totals will not match county-level data. Municipal-level data often relies on 5-year averages and is not available for the smallest towns that do not report income.
Families with Children by Income, 2015
Assets, All Households, 2015
How many families with children are struggling?Children add significant expense to a family budget, so it is not surprising that many Roscommon County families with children live below the ALICE Threshold. Though more Roscommon County families are headed by married parents, those families with a single parent are more likely to have income below the ALICE Threshold.
What assets do households have?Ownership of assets can contribute to stability of households. Yet few families in Roscommon County own liquid assets, such as a savings account, 401(k) plan, or rental income, that are readily available to cover emergency expenses. Vehicles, the most common asset, depreciate over time. Homeownership, the next most common asset, can build wealth, but is not a liquid asset.
1 Vehicle
2 Vehicles
No Mortgage
3 Vehicles
With Mortgage
4+ Vehicles
0%
10%
20%
30%
40%
50%
60%
70%
80%
90%
100%
Vehicle Home Interest, Dividends, or RentalIncome
Perc
ent o
f Hou
seho
lds
261433
16%
56% 51% 16%
16% 14%
68%
28% 35%
1,103
618
165
0
200
400
600
800
1,000
1,200
0%
10%
20%
30%
40%
50%
60%
70%
80%
90%
100%
Married SingleFemale-Headed
SingleMale-
HeadedTo
tal H
ouse
hold
s
Perc
ent o
f Fam
ilies
with
Chi
ldre
n
261432
Poverty ALICE Above AT Total HH
Roscommon County, 2015
Town Total HH% ALICE
& Poverty
Au Sable Township 133 54%
Backus Township 161 36%
Denton Township 2,832 47%
Gerrish Township 1,387 30%
Higgins Township 796 47%
Lake Township 520 32%
Lyon Township 601 35%
Markey Township 1,215 41%
Nester Township 123 34%
Richfield Township 1,770 47%
Roscommon Township 2,005 50%

UNIT
ED W
AY A
LICE
REP
ORT
– 20
17 U
PDAT
E FO
R M
ICHI
GAN
– EX
HIBI
T I
2015 Point-in-Time Data
Households by Income, 2007 to 2015
Population: 193,307 | Number of Households: 77,211Median Household Income: $43,383 (state average: $51,084)Unemployment Rate: 9.1% (state average: 7.2%)ALICE Households: 21% (state average: 25%); Poverty Households: 18% (state average: 15%)
How many households are struggling?ALICE is an acronym for Asset Limited, Income Constrained, Employed – households that earn more than the Federal Poverty Level, but less than the basic cost of living for the county (the ALICE Threshold, or AT). Combined, the number of poverty and ALICE households equals the total population struggling to afford basic needs. The number of households below the ALICE Threshold changes over time; households move in and out of poverty and ALICE as circumstances improve or worsen. The Great Recession, from 2007 to 2010, caused hardship for many families. Conditions started to improve in 2010 and 2012 for some, but not for all.
What does it cost to afford the basic necessities?The bare-minimum Household Survival Budget does not include any savings, leaving a household vulnerable to unexpected expenses. ALICE households typically earn above the Federal Poverty Level of $11,770 for a single adult and $24,250 for a family of four, but less than the Household Survival Budget.
ALICE IN SAGINAW COUNTY
Household Survival Budget, Saginaw County
SINGLE ADULT2 ADULTS, 1 INFANT,
1 PRESCHOOLERMonthly Costs
Housing $419 $699Child Care $– $1,152Food $184 $609Transportation $349 $697Health Care $184 $707Miscellaneous $129 $419Taxes $158 $321
Monthly Total $1,423 $4,604ANNUAL TOTAL $17,076 $55,248Hourly Wage $8.54 $27.62
Sources: 2015 Point-in-Time Data: American Community Survey. ALICE Demographics: American Community Survey; the ALICE Threshold. Budget: U.S. Department of Housing and Urban Development (HUD); U.S. Department of Agriculture (USDA); Bureau of Labor Statistics (BLS); Internal Revenue Service (IRS); Michigan Department of Treasury; Early Childhood Investment Corporation.
16% 15% 17% 18%
24% 26% 26% 21%
60% 59% 57% 61%
76,003 75,609 78,010 77,211
-
10,000
20,000
30,000
40,000
50,000
60,000
70,000
80,000
90,000
0%
10%
20%
30%
40%
50%
60%
70%
80%
90%
100%
2007 2010 2012 2015
Tota
l Hou
seho
lds
Perc
ent o
f Hou
seho
lds
261451
Poverty ALICE Above AT Total HH

UNIT
ED W
AY A
LICE
REP
ORT
– 20
17 U
PDAT
E FO
R M
ICHI
GAN
– EX
HIBI
T I
Note: Municipal-level data on this page is for Places and County Subdivisions, which include Census Designated Places (CDP). These are overlapping geographies so totals will not match county-level data. Municipal-level data often relies on 5-year averages and is not available for the smallest towns that do not report income.
Families with Children by Income, 2015
Assets, All Households, 2015
How many families with children are struggling?Children add significant expense to a family budget, so it is not surprising that many Saginaw County families with children live below the ALICE Threshold. Though more Saginaw County families are headed by married parents, those families with a single parent are more likely to have income below the ALICE Threshold.
What assets do households have?Ownership of assets can contribute to stability of households. Yet few families in Saginaw County own liquid assets, such as a savings account, 401(k) plan, or rental income, that are readily available to cover emergency expenses. Vehicles, the most common asset, depreciate over time. Homeownership, the next most common asset, can build wealth, but is not a liquid asset.
1 Vehicle
2 Vehicles
No Mortgage
3 Vehicles
With Mortgage
4+ Vehicles
0%
10%
20%
30%
40%
50%
60%
70%
80%
90%
100%
Vehicle Home Interest, Dividends, or RentalIncome
Perc
ent o
f Hou
seho
lds
261453
12%
49% 45% 8%
27%
5%
80%
24%
50%
11,284
7,689
1,245
0
2,000
4,000
6,000
8,000
10,000
12,000
0%
10%
20%
30%
40%
50%
60%
70%
80%
90%
100%
Married SingleFemale-Headed
SingleMale-
HeadedTo
tal H
ouse
hold
s
Perc
ent o
f Fam
ilies
with
Chi
ldre
n
261452
Poverty ALICE Above AT Total HH
Saginaw County, 2015
Town Total HH% ALICE
& Poverty
Albee Township 781 34%
Birch Run Township 2,361 27%
Blumfield Township 746 20%
Brady Township 814 32%
Brant Township 749 26%
Bridgeport Charter Township 4,387 41%
Buena Vista Charter Township 3,502 67%
Carrollton Township 2,203 44%
Chapin Township 370 45%
Chesaning Township 1,901 41%
Frankenmuth City 2,269 27%
Frankenmuth Township 770 15%
Fremont Township 795 21%
James Township 727 22%
Jonesfield Township 602 35%
Kochville Township 1,249 41%
Lakefield Township 371 29%
Maple Grove Township 954 24%
Marion Township 350 42%
Richland Township 1,583 21%
Saginaw Charter Township 17,844 32%
Saginaw City 19,286 61%
Spaulding Township 787 29%
St. Charles Township 1,301 38%
Swan Creek Township 960 23%
Taymouth Township 1,582 32%
Thomas Township 4,743 24%
Tittabawassee Township 3,143 21%
Zilwaukee City 749 32%

UNIT
ED W
AY A
LICE
REP
ORT
– 20
17 U
PDAT
E FO
R M
ICHI
GAN
– EX
HIBI
T I
2015 Point-in-Time Data
Households by Income, 2007 to 2015
Population: 159,875 | Number of Households: 63,571Median Household Income: $51,127 (state average: $51,084)Unemployment Rate: 7.6% (state average: 7.2%)ALICE Households: 28% (state average: 25%); Poverty Households: 12% (state average: 15%)
How many households are struggling?ALICE is an acronym for Asset Limited, Income Constrained, Employed – households that earn more than the Federal Poverty Level, but less than the basic cost of living for the county (the ALICE Threshold, or AT). Combined, the number of poverty and ALICE households equals the total population struggling to afford basic needs. The number of households below the ALICE Threshold changes over time; households move in and out of poverty and ALICE as circumstances improve or worsen. The Great Recession, from 2007 to 2010, caused hardship for many families. Conditions started to improve in 2010 and 2012 for some, but not for all.
What does it cost to afford the basic necessities?The bare-minimum Household Survival Budget does not include any savings, leaving a household vulnerable to unexpected expenses. ALICE households typically earn above the Federal Poverty Level of $11,770 for a single adult and $24,250 for a family of four, but less than the Household Survival Budget.
ALICE IN ST CLAIR COUNTY
Household Survival Budget, St Clair County
SINGLE ADULT2 ADULTS, 1 INFANT,
1 PRESCHOOLERMonthly Costs
Housing $510 $846Child Care $– $1,141Food $184 $609Transportation $491 $981Health Care $166 $637Miscellaneous $156 $464Taxes $209 $428
Monthly Total $1,716 $5,106ANNUAL TOTAL $20,592 $61,272Hourly Wage $10.30 $30.64
Sources: 2015 Point-in-Time Data: American Community Survey. ALICE Demographics: American Community Survey; the ALICE Threshold. Budget: U.S. Department of Housing and Urban Development (HUD); U.S. Department of Agriculture (USDA); Bureau of Labor Statistics (BLS); Internal Revenue Service (IRS); Michigan Department of Treasury; Early Childhood Investment Corporation.
11% 13% 15% 12%
30% 28% 26% 28%
59% 59% 59% 60%
65,343 64,501 65,075 63,571
-
10,000
20,000
30,000
40,000
50,000
60,000
70,000
0%
10%
20%
30%
40%
50%
60%
70%
80%
90%
100%
2007 2010 2012 2015
Tota
l Hou
seho
lds
Perc
ent o
f Hou
seho
lds
261471
Poverty ALICE Above AT Total HH

UNIT
ED W
AY A
LICE
REP
ORT
– 20
17 U
PDAT
E FO
R M
ICHI
GAN
– EX
HIBI
T I
Note: Municipal-level data on this page is for Places and County Subdivisions, which include Census Designated Places (CDP). These are overlapping geographies so totals will not match county-level data. Municipal-level data often relies on 5-year averages and is not available for the smallest towns that do not report income.
Families with Children by Income, 2015
Assets, All Households, 2015
How many families with children are struggling?Children add significant expense to a family budget, so it is not surprising that many St Clair County families with children live below the ALICE Threshold. Though more St Clair County families are headed by married parents, those families with a single parent are more likely to have income below the ALICE Threshold.
What assets do households have?Ownership of assets can contribute to stability of households. Yet few families in St Clair County own liquid assets, such as a savings account, 401(k) plan, or rental income, that are readily available to cover emergency expenses. Vehicles, the most common asset, depreciate over time. Homeownership, the next most common asset, can build wealth, but is not a liquid asset.
1 Vehicle
2 Vehicles
No Mortgage
3 Vehicles
With Mortgage
4+ Vehicles
0%
10%
20%
30%
40%
50%
60%
70%
80%
90%
100%
Vehicle Home Interest, Dividends, or RentalIncome
Perc
ent o
f Hou
seho
lds
261473
4%
79%
24% 11%
12%
57% 85%
9% 19%
11,292
2,923
1,067
0
2,000
4,000
6,000
8,000
10,000
12,000
0%
10%
20%
30%
40%
50%
60%
70%
80%
90%
100%
Married SingleFemale-Headed
SingleMale-
HeadedTo
tal H
ouse
hold
s
Perc
ent o
f Fam
ilies
with
Chi
ldre
n
261472
Poverty ALICE Above AT Total HH
St Clair County, 2015
Town Total HH% ALICE
& Poverty
Algonac City 1,956 53%
Berlin Township 1,233 24%
Brockway Township 644 31%
Burtchville Township 1,577 42%
Casco Township 1,401 30%
China Township 1,242 21%
Clay Township 3,905 35%
Clyde Township 2,083 38%
Columbus Township 1,450 29%
Cottrellville Township 1,332 40%
East China Township 1,588 37%
Emmett Township 933 35%
Fort Gratiot Charter Township 4,479 40%
Grant Township 679 32%
Greenwood Township 525 33%
Ira Township 1,975 35%
Kenockee Township 952 35%
Kimball Township 3,665 45%
Lynn Township 461 38%
Marine City 1,837 51%
Marysville City 4,208 40%
Memphis City 149 41%
Mussey Township 1,431 38%
Port Huron Charter Township 3,980 48%
Port Huron City 12,354 60%
Riley Township 1,167 30%
St. Clair City 2,309 40%
St. Clair Township 2,555 24%
Wales Township 1,281 30%
Yale City 790 59%

UNIT
ED W
AY A
LICE
REP
ORT
– 20
17 U
PDAT
E FO
R M
ICHI
GAN
– EX
HIBI
T I
2015 Point-in-Time Data
Households by Income, 2007 to 2015
Population: 61,022 | Number of Households: 23,270Median Household Income: $44,449 (state average: $51,084)Unemployment Rate: 8.6% (state average: 7.2%)ALICE Households: 26% (state average: 25%); Poverty Households: 14% (state average: 15%)
How many households are struggling?ALICE is an acronym for Asset Limited, Income Constrained, Employed – households that earn more than the Federal Poverty Level, but less than the basic cost of living for the county (the ALICE Threshold, or AT). Combined, the number of poverty and ALICE households equals the total population struggling to afford basic needs. The number of households below the ALICE Threshold changes over time; households move in and out of poverty and ALICE as circumstances improve or worsen. The Great Recession, from 2007 to 2010, caused hardship for many families. Conditions started to improve in 2010 and 2012 for some, but not for all.
What does it cost to afford the basic necessities?The bare-minimum Household Survival Budget does not include any savings, leaving a household vulnerable to unexpected expenses. ALICE households typically earn above the Federal Poverty Level of $11,770 for a single adult and $24,250 for a family of four, but less than the Household Survival Budget.
ALICE IN ST JOSEPH COUNTY
Household Survival Budget, St Joseph County
SINGLE ADULT2 ADULTS, 1 INFANT,
1 PRESCHOOLERMonthly Costs
Housing $458 $648Child Care $– $799Food $184 $609Transportation $349 $697Health Care $184 $707Miscellaneous $134 $366Taxes $167 $199
Monthly Total $1,476 $4,025ANNUAL TOTAL $17,712 $48,300Hourly Wage $8.86 $24.15
Sources: 2015 Point-in-Time Data: American Community Survey. ALICE Demographics: American Community Survey; the ALICE Threshold. Budget: U.S. Department of Housing and Urban Development (HUD); U.S. Department of Agriculture (USDA); Bureau of Labor Statistics (BLS); Internal Revenue Service (IRS); Michigan Department of Treasury; Early Childhood Investment Corporation.
14% 14% 16% 14%
26% 25% 24% 26%
60% 61% 60% 60%
22,810 21,832
22,577 23,270
-
5,000
10,000
15,000
20,000
25,000
0%
10%
20%
30%
40%
50%
60%
70%
80%
90%
100%
2007 2010 2012 2015
Tota
l Hou
seho
lds
Perc
ent o
f Hou
seho
lds
261491
Poverty ALICE Above AT Total HH

UNIT
ED W
AY A
LICE
REP
ORT
– 20
17 U
PDAT
E FO
R M
ICHI
GAN
– EX
HIBI
T I
Note: Municipal-level data on this page is for Places and County Subdivisions, which include Census Designated Places (CDP). These are overlapping geographies so totals will not match county-level data. Municipal-level data often relies on 5-year averages and is not available for the smallest towns that do not report income.
Families with Children by Income, 2015
Assets, All Households, 2015
How many families with children are struggling?Children add significant expense to a family budget, so it is not surprising that many St Joseph County families with children live below the ALICE Threshold. Though more St Joseph County families are headed by married parents, those families with a single parent are more likely to have income below the ALICE Threshold.
What assets do households have?Ownership of assets can contribute to stability of households. Yet few families in St Joseph County own liquid assets, such as a savings account, 401(k) plan, or rental income, that are readily available to cover emergency expenses. Vehicles, the most common asset, depreciate over time. Homeownership, the next most common asset, can build wealth, but is not a liquid asset.
1 Vehicle
2 Vehicles
No Mortgage
3 Vehicles
With Mortgage
4+ Vehicles
0%
10%
20%
30%
40%
50%
60%
70%
80%
90%
100%
Vehicle Home Interest, Dividends, or RentalIncome
Perc
ent o
f Hou
seho
lds
261493
12%
60%
17%
11%
28%
25%
77%
12%
58%
4,315
1,622
614
0
500
1,000
1,500
2,000
2,500
3,000
3,500
4,000
4,500
5,000
0%
10%
20%
30%
40%
50%
60%
70%
80%
90%
100%
Married SingleFemale-Headed
SingleMale-
HeadedTo
tal H
ouse
hold
s
Perc
ent o
f Fam
ilies
with
Chi
ldre
n
261492
Poverty ALICE Above AT Total HH
St Joseph County, 2015
Town Total HH% ALICE
& Poverty
Burr Oak Township 925 38%
Colon Township 1,315 44%
Constantine Township 1,596 42%
Fabius Township 1,276 29%
Fawn River Township 548 36%
Florence Township 507 40%
Flowerfield Township 560 36%
Leonidas Township 414 34%
Lockport Township 1,526 28%
Mendon Township 1,023 38%
Mottville Township 612 38%
Nottawa Township 1,381 32%
Park Township 960 26%
Sherman Township 1,272 25%
Sturgis City 4,150 52%
Sturgis Township 884 50%
Three Rivers City 2,942 52%
White Pigeon Township 1,379 39%

UNIT
ED W
AY A
LICE
REP
ORT
– 20
17 U
PDAT
E FO
R M
ICHI
GAN
– EX
HIBI
T I
2015 Point-in-Time Data
Households by Income, 2007 to 2015
Population: 42,014 | Number of Households: 16,280Median Household Income: $41,100 (state average: $51,084)Unemployment Rate: 10.7% (state average: 7.2%)ALICE Households: 32% (state average: 25%); Poverty Households: 15% (state average: 15%)
How many households are struggling?ALICE is an acronym for Asset Limited, Income Constrained, Employed – households that earn more than the Federal Poverty Level, but less than the basic cost of living for the county (the ALICE Threshold, or AT). Combined, the number of poverty and ALICE households equals the total population struggling to afford basic needs. The number of households below the ALICE Threshold changes over time; households move in and out of poverty and ALICE as circumstances improve or worsen. The Great Recession, from 2007 to 2010, caused hardship for many families. Conditions started to improve in 2010 and 2012 for some, but not for all.
What does it cost to afford the basic necessities?The bare-minimum Household Survival Budget does not include any savings, leaving a household vulnerable to unexpected expenses. ALICE households typically earn above the Federal Poverty Level of $11,770 for a single adult and $24,250 for a family of four, but less than the Household Survival Budget.
ALICE IN SANILAC COUNTY
Household Survival Budget, Sanilac County
SINGLE ADULT2 ADULTS, 1 INFANT,
1 PRESCHOOLERMonthly Costs
Housing $448 $643Child Care $– $1,229Food $184 $609Transportation $349 $697Health Care $184 $707Miscellaneous $133 $421Taxes $165 $328
Monthly Total $1,463 $4,634ANNUAL TOTAL $17,556 $55,608Hourly Wage $8.78 $27.80
Sources: 2015 Point-in-Time Data: American Community Survey. ALICE Demographics: American Community Survey; the ALICE Threshold. Budget: U.S. Department of Housing and Urban Development (HUD); U.S. Department of Agriculture (USDA); Bureau of Labor Statistics (BLS); Internal Revenue Service (IRS); Michigan Department of Treasury; Early Childhood Investment Corporation.
13% 15% 15% 15%
26% 25% 32% 32%
61% 60%
53% 53%
17,173 16,985 16,011 16,280
-
2,000
4,000
6,000
8,000
10,000
12,000
14,000
16,000
18,000
20,000
0%
10%
20%
30%
40%
50%
60%
70%
80%
90%
100%
2007 2010 2012 2015
Tota
l Hou
seho
lds
Perc
ent o
f Hou
seho
lds
261511
Poverty ALICE Above AT Total HH

UNIT
ED W
AY A
LICE
REP
ORT
– 20
17 U
PDAT
E FO
R M
ICHI
GAN
– EX
HIBI
T I
Note: Municipal-level data on this page is for Places and County Subdivisions, which include Census Designated Places (CDP). These are overlapping geographies so totals will not match county-level data. Municipal-level data often relies on 5-year averages and is not available for the smallest towns that do not report income.
Families with Children by Income, 2015
Assets, All Households, 2015
How many families with children are struggling?Children add significant expense to a family budget, so it is not surprising that many Sanilac County families with children live below the ALICE Threshold. Though more Sanilac County families are headed by married parents, those families with a single parent are more likely to have income below the ALICE Threshold.
What assets do households have?Ownership of assets can contribute to stability of households. Yet few families in Sanilac County own liquid assets, such as a savings account, 401(k) plan, or rental income, that are readily available to cover emergency expenses. Vehicles, the most common asset, depreciate over time. Homeownership, the next most common asset, can build wealth, but is not a liquid asset.
1 Vehicle
2 Vehicles
No Mortgage
3 Vehicles
With Mortgage
4+ Vehicles
0%
10%
20%
30%
40%
50%
60%
70%
80%
90%
100%
Vehicle Home Interest, Dividends, or RentalIncome
Perc
ent o
f Hou
seho
lds
261513
11%
51%
13%
18%
36%
44%
71%
13%
43%
2,613
763
223
0
500
1,000
1,500
2,000
2,500
3,000
0%
10%
20%
30%
40%
50%
60%
70%
80%
90%
100%
Married SingleFemale-Headed
SingleMale-
HeadedTo
tal H
ouse
hold
s
Perc
ent o
f Fam
ilies
with
Chi
ldre
n
261512
Poverty ALICE Above AT Total HH
Sanilac County, 2015
Town Total HH% ALICE
& Poverty
Argyle Township 266 42%
Austin Township 216 43%
Bridgehampton Township 291 57%
Brown City 521 60%
Buel Township 472 52%
Croswell City 966 58%
Custer Township 400 46%
Delaware Township 374 32%
Elk Township 543 44%
Elmer Township 294 35%
Evergreen Township 319 46%
Flynn Township 340 42%
Forester Township 398 41%
Fremont Township 361 44%
Greenleaf Township 296 41%
Lamotte Township 318 51%
Lexington Township 1,647 48%
Maple Valley Township 398 36%
Marion Township 633 51%
Marlette City 684 61%
Marlette Township 601 41%
Minden Township 202 40%
Moore Township 371 44%
Sandusky City 1,024 66%
Sanilac Township 998 49%
Speaker Township 501 42%
Washington Township 611 53%
Watertown Township 482 40%
Wheatland Township 180 50%
Worth Township 1,573 37%

UNIT
ED W
AY A
LICE
REP
ORT
– 20
17 U
PDAT
E FO
R M
ICHI
GAN
– EX
HIBI
T I
2015 Point-in-Time Data
Households by Income, 2007 to 2015
Population: 8,288 | Number of Households: 3,419Median Household Income: $34,118 (state average: $51,084)Unemployment Rate: 15.6% (state average: 7.2%)ALICE Households: 33% (state average: 25%); Poverty Households: 19% (state average: 15%)
How many households are struggling?ALICE is an acronym for Asset Limited, Income Constrained, Employed – households that earn more than the Federal Poverty Level, but less than the basic cost of living for the county (the ALICE Threshold, or AT). Combined, the number of poverty and ALICE households equals the total population struggling to afford basic needs. The number of households below the ALICE Threshold changes over time; households move in and out of poverty and ALICE as circumstances improve or worsen. The Great Recession, from 2007 to 2010, caused hardship for many families. Conditions started to improve in 2010 and 2012 for some, but not for all.
What does it cost to afford the basic necessities?The bare-minimum Household Survival Budget does not include any savings, leaving a household vulnerable to unexpected expenses. ALICE households typically earn above the Federal Poverty Level of $11,770 for a single adult and $24,250 for a family of four, but less than the Household Survival Budget.
ALICE IN SCHOOLCRAFT COUNTY
Household Survival Budget, Schoolcraft County
SINGLE ADULT2 ADULTS, 1 INFANT,
1 PRESCHOOLERMonthly Costs
Housing $448 $643Child Care $– $1,130Food $184 $609Transportation $349 $697Health Care $184 $707Miscellaneous $133 $408Taxes $165 $297
Monthly Total $1,463 $4,491ANNUAL TOTAL $17,556 $53,892Hourly Wage $8.78 $26.95
Sources: 2015 Point-in-Time Data: American Community Survey. ALICE Demographics: American Community Survey; the ALICE Threshold. Budget: U.S. Department of Housing and Urban Development (HUD); U.S. Department of Agriculture (USDA); Bureau of Labor Statistics (BLS); Internal Revenue Service (IRS); Michigan Department of Treasury; Early Childhood Investment Corporation.
#N/A 17% 17% 19%
25% 25% 33%
58% 58%
48%
3,621 3,651 3,419
-
500
1,000
1,500
2,000
2,500
3,000
3,500
4,000
0%
10%
20%
30%
40%
50%
60%
70%
80%
90%
100%
2010 2012 2015
Tota
l Hou
seho
lds
Perc
ent o
f Hou
seho
lds
261531
Poverty ALICE Above AT Total HH
N/A

UNIT
ED W
AY A
LICE
REP
ORT
– 20
17 U
PDAT
E FO
R M
ICHI
GAN
– EX
HIBI
T I
Note: Municipal-level data on this page is for Places and County Subdivisions, which include Census Designated Places (CDP). These are overlapping geographies so totals will not match county-level data. Municipal-level data often relies on 5-year averages and is not available for the smallest towns that do not report income.
Families with Children by Income, 2015
Assets, All Households, 2015
How many families with children are struggling?Children add significant expense to a family budget, so it is not surprising that many Schoolcraft County families with children live below the ALICE Threshold. Though more Schoolcraft County families are headed by married parents, those families with a single parent are more likely to have income below the ALICE Threshold.
What assets do households have?Ownership of assets can contribute to stability of households. Yet few families in Schoolcraft County own liquid assets, such as a savings account, 401(k) plan, or rental income, that are readily available to cover emergency expenses. Vehicles, the most common asset, depreciate over time. Homeownership, the next most common asset, can build wealth, but is not a liquid asset.
1 Vehicle
2 Vehicles
No Mortgage
3 Vehicles
With Mortgage
4+ Vehicles
0%
10%
20%
30%
40%
50%
60%
70%
80%
90%
100%
Vehicle Home Interest, Dividends, or RentalIncome
Perc
ent o
f Hou
seho
lds
261533
21%
67%
44% 5%
20%
4%
74%
13%
52%
370
166
75
0
50
100
150
200
250
300
350
400
0%
10%
20%
30%
40%
50%
60%
70%
80%
90%
100%
Married SingleFemale-Headed
SingleMale-
HeadedTo
tal H
ouse
hold
s
Perc
ent o
f Fam
ilies
with
Chi
ldre
n
261532
Poverty ALICE Above AT Total HH
Schoolcraft County, 2015
Town Total HH% ALICE
& Poverty
Doyle Township 258 44%
Germfask Township 207 44%
Hiawatha Township 555 37%
Inwood Township 283 42%
Manistique City 1,249 66%
Manistique Township 390 44%
Mueller Township 128 52%
Thompson Township 313 47%

UNIT
ED W
AY A
LICE
REP
ORT
– 20
17 U
PDAT
E FO
R M
ICHI
GAN
– EX
HIBI
T I
2015 Point-in-Time Data
Households by Income, 2007 to 2015
Population: 68,619 | Number of Households: 27,036Median Household Income: $51,839 (state average: $51,084)Unemployment Rate: 4.5% (state average: 7.2%)ALICE Households: 21% (state average: 25%); Poverty Households: 10% (state average: 15%)
How many households are struggling?ALICE is an acronym for Asset Limited, Income Constrained, Employed – households that earn more than the Federal Poverty Level, but less than the basic cost of living for the county (the ALICE Threshold, or AT). Combined, the number of poverty and ALICE households equals the total population struggling to afford basic needs. The number of households below the ALICE Threshold changes over time; households move in and out of poverty and ALICE as circumstances improve or worsen. The Great Recession, from 2007 to 2010, caused hardship for many families. Conditions started to improve in 2010 and 2012 for some, but not for all.
What does it cost to afford the basic necessities?The bare-minimum Household Survival Budget does not include any savings, leaving a household vulnerable to unexpected expenses. ALICE households typically earn above the Federal Poverty Level of $11,770 for a single adult and $24,250 for a family of four, but less than the Household Survival Budget.
ALICE IN SHIAWASSEE COUNTY
Household Survival Budget, Shiawassee County
SINGLE ADULT2 ADULTS, 1 INFANT,
1 PRESCHOOLERMonthly Costs
Housing $397 $668Child Care $– $1,179Food $184 $609Transportation $349 $697Health Care $184 $707Miscellaneous $127 $418Taxes $153 $320
Monthly Total $1,394 $4,598ANNUAL TOTAL $16,728 $55,176Hourly Wage $8.36 $27.59
Sources: 2015 Point-in-Time Data: American Community Survey. ALICE Demographics: American Community Survey; the ALICE Threshold. Budget: U.S. Department of Housing and Urban Development (HUD); U.S. Department of Agriculture (USDA); Bureau of Labor Statistics (BLS); Internal Revenue Service (IRS); Michigan Department of Treasury; Early Childhood Investment Corporation.
16% 13% 17% 10%
21% 20%
21%
21%
63% 67%
62%
69%
28,256 27,134 27,132 27,036
-
5,000
10,000
15,000
20,000
25,000
30,000
0%
10%
20%
30%
40%
50%
60%
70%
80%
90%
100%
2007 2010 2012 2015
Tota
l Hou
seho
lds
Perc
ent o
f Hou
seho
lds
261551
Poverty ALICE Above AT Total HH

UNIT
ED W
AY A
LICE
REP
ORT
– 20
17 U
PDAT
E FO
R M
ICHI
GAN
– EX
HIBI
T I
Note: Municipal-level data on this page is for Places and County Subdivisions, which include Census Designated Places (CDP). These are overlapping geographies so totals will not match county-level data. Municipal-level data often relies on 5-year averages and is not available for the smallest towns that do not report income.
Families with Children by Income, 2015
Assets, All Households, 2015
How many families with children are struggling?Children add significant expense to a family budget, so it is not surprising that many Shiawassee County families with children live below the ALICE Threshold. Though more Shiawassee County families are headed by married parents, those families with a single parent are more likely to have income below the ALICE Threshold.
What assets do households have?Ownership of assets can contribute to stability of households. Yet few families in Shiawassee County own liquid assets, such as a savings account, 401(k) plan, or rental income, that are readily available to cover emergency expenses. Vehicles, the most common asset, depreciate over time. Homeownership, the next most common asset, can build wealth, but is not a liquid asset.
1 Vehicle
2 Vehicles
No Mortgage
3 Vehicles
With Mortgage
4+ Vehicles
0%
20%
40%
60%
80%
100%
120%
Vehicle Home Interest, Dividends, or RentalIncome
Perc
ent o
f Hou
seho
lds
261553
9%
54%
36% 11%
24%
36% 80%
22% 28%
5,346
1,583
709
0
1,000
2,000
3,000
4,000
5,000
6,000
0%
10%
20%
30%
40%
50%
60%
70%
80%
90%
100%
Married SingleFemale-Headed
SingleMale-
HeadedTo
tal H
ouse
hold
s
Perc
ent o
f Fam
ilies
with
Chi
ldre
n
261552
Poverty ALICE Above AT Total HH
Shiawassee County, 2015
Town Total HH% ALICE
& Poverty
Antrim Township 836 32%
Bennington Township 1,233 22%
Burns Township 1,219 25%
Caledonia Charter Township 1,759 36%
Corunna City 1,381 51%
Durand City 1,450 44%
Fairfield Township 270 40%
Hazelton Township 752 20%
Laingsburg City 468 22%
Middlebury Township 629 24%
New Haven Township 486 25%
Owosso Charter Township 1,819 38%
Owosso City 6,181 50%
Perry City 901 45%
Perry Township 1,541 26%
Rush Township 507 29%
Sciota Township 658 28%
Shiawassee Township 1,059 27%
Venice Township 952 29%
Vernon Township 1,843 38%
Woodhull Township 1,465 21%

UNIT
ED W
AY A
LICE
REP
ORT
– 20
17 U
PDAT
E FO
R M
ICHI
GAN
– EX
HIBI
T I
2015 Point-in-Time Data
Households by Income, 2007 to 2015
Population: 54,420 | Number of Households: 21,304Median Household Income: $43,768 (state average: $51,084)Unemployment Rate: 9.3% (state average: 7.2%)ALICE Households: 23% (state average: 25%); Poverty Households: 14% (state average: 15%)
How many households are struggling?ALICE is an acronym for Asset Limited, Income Constrained, Employed – households that earn more than the Federal Poverty Level, but less than the basic cost of living for the county (the ALICE Threshold, or AT). Combined, the number of poverty and ALICE households equals the total population struggling to afford basic needs. The number of households below the ALICE Threshold changes over time; households move in and out of poverty and ALICE as circumstances improve or worsen. The Great Recession, from 2007 to 2010, caused hardship for many families. Conditions started to improve in 2010 and 2012 for some, but not for all.
What does it cost to afford the basic necessities?The bare-minimum Household Survival Budget does not include any savings, leaving a household vulnerable to unexpected expenses. ALICE households typically earn above the Federal Poverty Level of $11,770 for a single adult and $24,250 for a family of four, but less than the Household Survival Budget.
ALICE IN TUSCOLA COUNTY
Household Survival Budget, Tuscola County
SINGLE ADULT2 ADULTS, 1 INFANT,
1 PRESCHOOLERMonthly Costs
Housing $384 $643Child Care $– $1,100Food $184 $609Transportation $349 $697Health Care $184 $707Miscellaneous $125 $404Taxes $150 $288
Monthly Total $1,376 $4,448ANNUAL TOTAL $16,512 $53,376Hourly Wage $8.26 $26.69
Sources: 2015 Point-in-Time Data: American Community Survey. ALICE Demographics: American Community Survey; the ALICE Threshold. Budget: U.S. Department of Housing and Urban Development (HUD); U.S. Department of Agriculture (USDA); Bureau of Labor Statistics (BLS); Internal Revenue Service (IRS); Michigan Department of Treasury; Early Childhood Investment Corporation.
12% 15% 14% 14%
22% 23% 25% 23%
66% 62% 61% 63%
21,716 21,635 21,180 21,304
-
5,000
10,000
15,000
20,000
25,000
0%
10%
20%
30%
40%
50%
60%
70%
80%
90%
100%
2007 2010 2012 2015
Tota
l Hou
seho
lds
Perc
ent o
f Hou
seho
lds
261571
Poverty ALICE Above AT Total HH

UNIT
ED W
AY A
LICE
REP
ORT
– 20
17 U
PDAT
E FO
R M
ICHI
GAN
– EX
HIBI
T I
Note: Municipal-level data on this page is for Places and County Subdivisions, which include Census Designated Places (CDP). These are overlapping geographies so totals will not match county-level data. Municipal-level data often relies on 5-year averages and is not available for the smallest towns that do not report income.
Families with Children by Income, 2015
Assets, All Households, 2015
How many families with children are struggling?Children add significant expense to a family budget, so it is not surprising that many Tuscola County families with children live below the ALICE Threshold. Though more Tuscola County families are headed by married parents, those families with a single parent are more likely to have income below the ALICE Threshold.
What assets do households have?Ownership of assets can contribute to stability of households. Yet few families in Tuscola County own liquid assets, such as a savings account, 401(k) plan, or rental income, that are readily available to cover emergency expenses. Vehicles, the most common asset, depreciate over time. Homeownership, the next most common asset, can build wealth, but is not a liquid asset.
1 Vehicle
2 Vehicles
No Mortgage
3 Vehicles
With Mortgage
4+ Vehicles
0%
10%
20%
30%
40%
50%
60%
70%
80%
90%
100%
Vehicle Home Interest, Dividends, or RentalIncome
Perc
ent o
f Hou
seho
lds
261573
13%
54%
32% 12%
28%
32%
75%
18%
36%
4,000
1,132
491
0
500
1,000
1,500
2,000
2,500
3,000
3,500
4,000
4,500
0%
10%
20%
30%
40%
50%
60%
70%
80%
90%
100%
Married SingleFemale-Headed
SingleMale-
HeadedTo
tal H
ouse
hold
s
Perc
ent o
f Fam
ilies
with
Chi
ldre
n
261572
Poverty ALICE Above AT Total HH
Tuscola County, 2015
Town Total HH% ALICE
& Poverty
Akron Township 605 39%
Almer Township 828 32%
Arbela Township 1,130 29%
Caro City 1,775 51%
Columbia Township 476 35%
Dayton Township 645 37%
Denmark Township 1,329 35%
Elkland Township 1,336 34%
Ellington Township 507 30%
Elmwood Township 411 38%
Fairgrove Township 620 39%
Fremont Township 1,386 41%
Gilford Township 294 26%
Indianfields Township 1,005 37%
Juniata Township 653 35%
Kingston Township 558 46%
Koylton Township 572 40%
Millington Township 1,603 35%
Novesta Township 565 37%
Tuscola Township 873 21%
Vassar City 1,013 46%
Vassar Township 1,394 41%
Watertown Township 798 36%
Wells Township 641 36%
Wisner Township 287 39%
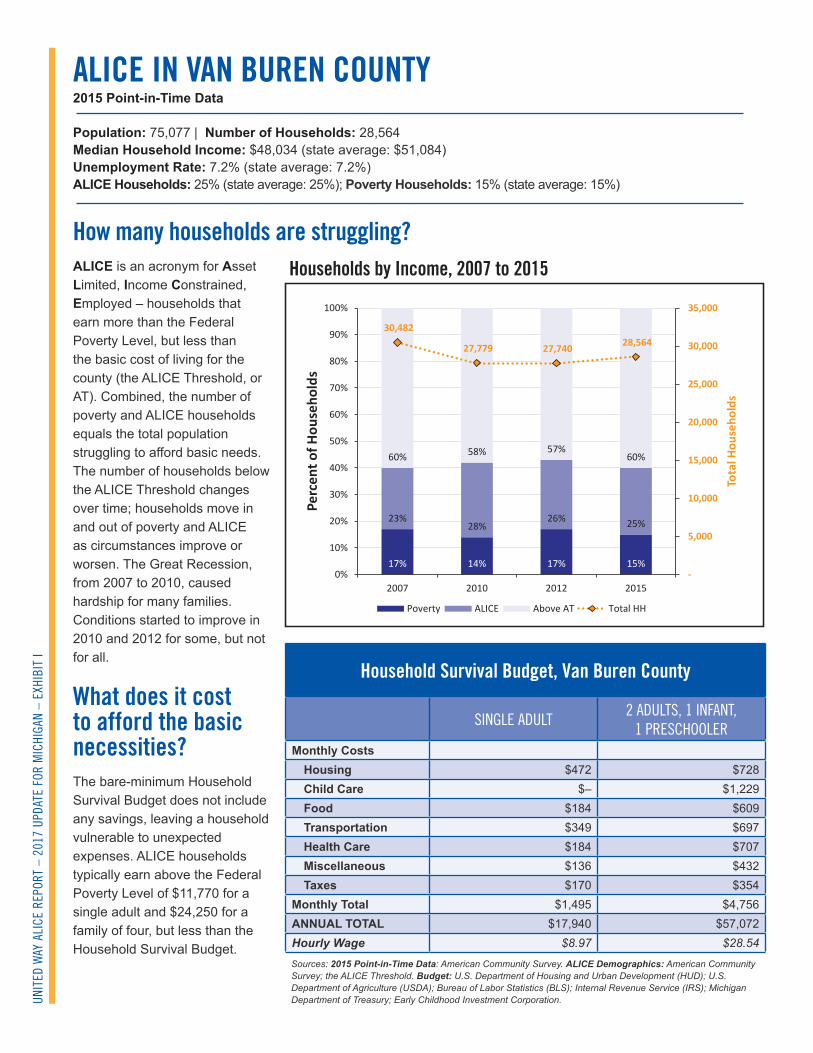
UNIT
ED W
AY A
LICE
REP
ORT
– 20
17 U
PDAT
E FO
R M
ICHI
GAN
– EX
HIBI
T I
2015 Point-in-Time Data
Households by Income, 2007 to 2015
Population: 75,077 | Number of Households: 28,564Median Household Income: $48,034 (state average: $51,084)Unemployment Rate: 7.2% (state average: 7.2%)ALICE Households: 25% (state average: 25%); Poverty Households: 15% (state average: 15%)
How many households are struggling?ALICE is an acronym for Asset Limited, Income Constrained, Employed – households that earn more than the Federal Poverty Level, but less than the basic cost of living for the county (the ALICE Threshold, or AT). Combined, the number of poverty and ALICE households equals the total population struggling to afford basic needs. The number of households below the ALICE Threshold changes over time; households move in and out of poverty and ALICE as circumstances improve or worsen. The Great Recession, from 2007 to 2010, caused hardship for many families. Conditions started to improve in 2010 and 2012 for some, but not for all.
What does it cost to afford the basic necessities?The bare-minimum Household Survival Budget does not include any savings, leaving a household vulnerable to unexpected expenses. ALICE households typically earn above the Federal Poverty Level of $11,770 for a single adult and $24,250 for a family of four, but less than the Household Survival Budget.
ALICE IN VAN BUREN COUNTY
Household Survival Budget, Van Buren County
SINGLE ADULT2 ADULTS, 1 INFANT,
1 PRESCHOOLERMonthly Costs
Housing $472 $728Child Care $– $1,229Food $184 $609Transportation $349 $697Health Care $184 $707Miscellaneous $136 $432Taxes $170 $354
Monthly Total $1,495 $4,756ANNUAL TOTAL $17,940 $57,072Hourly Wage $8.97 $28.54
Sources: 2015 Point-in-Time Data: American Community Survey. ALICE Demographics: American Community Survey; the ALICE Threshold. Budget: U.S. Department of Housing and Urban Development (HUD); U.S. Department of Agriculture (USDA); Bureau of Labor Statistics (BLS); Internal Revenue Service (IRS); Michigan Department of Treasury; Early Childhood Investment Corporation.
17% 14% 17% 15%
23% 28%
26% 25%
60% 58% 57% 60%
30,482
27,779 27,740 28,564
-
5,000
10,000
15,000
20,000
25,000
30,000
35,000
0%
10%
20%
30%
40%
50%
60%
70%
80%
90%
100%
2007 2010 2012 2015
Tota
l Hou
seho
lds
Perc
ent o
f Hou
seho
lds
261591
Poverty ALICE Above AT Total HH

UNIT
ED W
AY A
LICE
REP
ORT
– 20
17 U
PDAT
E FO
R M
ICHI
GAN
– EX
HIBI
T I
Note: Municipal-level data on this page is for Places and County Subdivisions, which include Census Designated Places (CDP). These are overlapping geographies so totals will not match county-level data. Municipal-level data often relies on 5-year averages and is not available for the smallest towns that do not report income.
Families with Children by Income, 2015
Assets, All Households, 2015
How many families with children are struggling?Children add significant expense to a family budget, so it is not surprising that many Van Buren County families with children live below the ALICE Threshold. Though more Van Buren County families are headed by married parents, those families with a single parent are more likely to have income below the ALICE Threshold.
What assets do households have?Ownership of assets can contribute to stability of households. Yet few families in Van Buren County own liquid assets, such as a savings account, 401(k) plan, or rental income, that are readily available to cover emergency expenses. Vehicles, the most common asset, depreciate over time. Homeownership, the next most common asset, can build wealth, but is not a liquid asset.
1 Vehicle
2 Vehicles
No Mortgage
3 Vehicles
With Mortgage
4+ Vehicles
0%
10%
20%
30%
40%
50%
60%
70%
80%
90%
100%
Vehicle Home Interest, Dividends, or RentalIncome
Perc
ent o
f Hou
seho
lds
261593
10%
46%
20%
18%
28%
48%
72%
26% 32%
5,380
1,973
688
0
1,000
2,000
3,000
4,000
5,000
6,000
0%
10%
20%
30%
40%
50%
60%
70%
80%
90%
100%
Married SingleFemale-Headed
SingleMale-
HeadedTo
tal H
ouse
hold
s
Perc
ent o
f Fam
ilies
with
Chi
ldre
n
261592
Poverty ALICE Above AT Total HH
Van Buren County, 2015
Town Total HH% ALICE
& Poverty
Almena Township 1,737 25%
Antwerp Township 4,299 31%
Arlington Township 755 52%
Bangor City 716 59%
Bangor Township 773 51%
Bloomingdale Township 1,366 44%
Columbia Township 923 45%
Covert Township 994 64%
Decatur Township 1,343 56%
Geneva Township 1,185 50%
Gobles City 303 53%
Hamilton Township 506 41%
Hartford City 887 62%
Hartford Township 1,075 43%
Keeler Township 781 46%
Lawrence Township 1,219 43%
Paw Paw Township 2,748 48%
Pine Grove Township 1,075 31%
Porter Township 973 29%
South Haven Charter Township 1,714 49%
South Haven City 2,035 50%
Waverly Township 960 43%

UNIT
ED W
AY A
LICE
REP
ORT
– 20
17 U
PDAT
E FO
R M
ICHI
GAN
– EX
HIBI
T I
2015 Point-in-Time Data
Households by Income, 2007 to 2015
Population: 358,880 | Number of Households: 138,099Median Household Income: $61,977 (state average: $51,084)Unemployment Rate: 5.4% (state average: 7.2%)ALICE Households: 23% (state average: 25%); Poverty Households: 14% (state average: 15%)
How many households are struggling?ALICE is an acronym for Asset Limited, Income Constrained, Employed – households that earn more than the Federal Poverty Level, but less than the basic cost of living for the county (the ALICE Threshold, or AT). Combined, the number of poverty and ALICE households equals the total population struggling to afford basic needs. The number of households below the ALICE Threshold changes over time; households move in and out of poverty and ALICE as circumstances improve or worsen. The Great Recession, from 2007 to 2010, caused hardship for many families. Conditions started to improve in 2010 and 2012 for some, but not for all.
What does it cost to afford the basic necessities?The bare-minimum Household Survival Budget does not include any savings, leaving a household vulnerable to unexpected expenses. ALICE households typically earn above the Federal Poverty Level of $11,770 for a single adult and $24,250 for a family of four, but less than the Household Survival Budget.
ALICE IN WASHTENAW COUNTY
Household Survival Budget, Washtenaw County
SINGLE ADULT2 ADULTS, 1 INFANT,
1 PRESCHOOLERMonthly Costs
Housing $675 $964Child Care $– $1,343Food $184 $609Transportation $349 $697Health Care $184 $707Miscellaneous $161 $478Taxes $221 $460
Monthly Total $1,774 $5,258ANNUAL TOTAL $21,288 $63,096Hourly Wage $10.64 $31.55
Sources: 2015 Point-in-Time Data: American Community Survey. ALICE Demographics: American Community Survey; the ALICE Threshold. Budget: U.S. Department of Housing and Urban Development (HUD); U.S. Department of Agriculture (USDA); Bureau of Labor Statistics (BLS); Internal Revenue Service (IRS); Michigan Department of Treasury; Early Childhood Investment Corporation.
12% 12% 15% 14%
24% 26% 23% 23%
64% 62% 62% 63%
133,075 132,028 137,565 138,099
-
20,000
40,000
60,000
80,000
100,000
120,000
140,000
160,000
0%
10%
20%
30%
40%
50%
60%
70%
80%
90%
100%
2007 2010 2012 2015
Tota
l Hou
seho
lds
Perc
ent o
f Hou
seho
lds
261611
Poverty ALICE Above AT Total HH

UNIT
ED W
AY A
LICE
REP
ORT
– 20
17 U
PDAT
E FO
R M
ICHI
GAN
– EX
HIBI
T I
Note: Municipal-level data on this page is for Places and County Subdivisions, which include Census Designated Places (CDP). These are overlapping geographies so totals will not match county-level data. Municipal-level data often relies on 5-year averages and is not available for the smallest towns that do not report income.
Families with Children by Income, 2015
Assets, All Households, 2015
How many families with children are struggling?Children add significant expense to a family budget, so it is not surprising that many Washtenaw County families with children live below the ALICE Threshold. Though more Washtenaw County families are headed by married parents, those families with a single parent are more likely to have income below the ALICE Threshold.
What assets do households have?Ownership of assets can contribute to stability of households. Yet few families in Washtenaw County own liquid assets, such as a savings account, 401(k) plan, or rental income, that are readily available to cover emergency expenses. Vehicles, the most common asset, depreciate over time. Homeownership, the next most common asset, can build wealth, but is not a liquid asset.
1 Vehicle
2 Vehicles
No Mortgage
3 Vehicles
With Mortgage
4+ Vehicles
0%
10%
20%
30%
40%
50%
60%
70%
80%
90%
100%
Vehicle Home Interest, Dividends, or RentalIncome
Perc
ent o
f Hou
seho
lds
261613
3%
42%
10% 10%
35%
24%
87%
23%
66%
24,215
7,167
2,394
0
5,000
10,000
15,000
20,000
25,000
30,000
0%
10%
20%
30%
40%
50%
60%
70%
80%
90%
100%
Married SingleFemale-Headed
SingleMale-
HeadedTo
tal H
ouse
hold
s
Perc
ent o
f Fam
ilies
with
Chi
ldre
n
261612
Poverty ALICE Above AT Total HH
Washtenaw County, 2015
Town Total HH% ALICE
& Poverty
Ann Arbor Charter Township 1,786 19%
Ann Arbor City 47,179 43%
Augusta Charter Township 2,191 30%
Bridgewater Township 597 34%
Chelsea City 2,307 30%
Dexter Township 2,252 19%
Freedom Township 611 27%
Lima Township 1,341 20%
Lodi Township 2,275 17%
Lyndon Township 987 19%
Manchester Township 1,826 36%
Milan City 1,482 29%
Northfield Township 3,303 40%
Pittsfield Charter Township 13,991 36%
Salem Township 2,122 23%
Saline City 3,831 35%
Saline Township 766 33%
Scio Township 7,704 24%
Sharon Township 723 24%
Superior Charter Township 4,890 34%
Sylvan Township 1,169 20%
Webster Township 2,445 15%
York Charter Township 2,407 14%
Ypsilanti Charter Township 22,071 50%
Ypsilanti City 7,811 65%

UNIT
ED W
AY A
LICE
REP
ORT
– 20
17 U
PDAT
E FO
R M
ICHI
GAN
– EX
HIBI
T I
2015 Point-in-Time Data
Households by Income, 2007 to 2015
Population: 1,759,335 | Number of Households: 667,521Median Household Income: $41,557 (state average: $51,084)Unemployment Rate: 11.6% (state average: 7.2%)ALICE Households: 29% (state average: 25%); Poverty Households: 23% (state average: 15%)
How many households are struggling?ALICE is an acronym for Asset Limited, Income Constrained, Employed – households that earn more than the Federal Poverty Level, but less than the basic cost of living for the county (the ALICE Threshold, or AT). Combined, the number of poverty and ALICE households equals the total population struggling to afford basic needs. The number of households below the ALICE Threshold changes over time; households move in and out of poverty and ALICE as circumstances improve or worsen. The Great Recession, from 2007 to 2010, caused hardship for many families. Conditions started to improve in 2010 and 2012 for some, but not for all.
What does it cost to afford the basic necessities?The bare-minimum Household Survival Budget does not include any savings, leaving a household vulnerable to unexpected expenses. ALICE households typically earn above the Federal Poverty Level of $11,770 for a single adult and $24,250 for a family of four, but less than the Household Survival Budget.
ALICE IN WAYNE COUNTY
Household Survival Budget, Wayne County
SINGLE ADULT2 ADULTS, 1 INFANT,
1 PRESCHOOLERMonthly Costs
Housing $510 $846Child Care $– $1,192Food $184 $609Transportation $491 $981Health Care $166 $637Miscellaneous $156 $471Taxes $209 $443
Monthly Total $1,716 $5,179ANNUAL TOTAL $20,592 $62,148Hourly Wage $10.30 $31.07
Sources: 2015 Point-in-Time Data: American Community Survey. ALICE Demographics: American Community Survey; the ALICE Threshold. Budget: U.S. Department of Housing and Urban Development (HUD); U.S. Department of Agriculture (USDA); Bureau of Labor Statistics (BLS); Internal Revenue Service (IRS); Michigan Department of Treasury; Early Childhood Investment Corporation.
18% 21% 23% 23%
30% 31% 27% 29%
52% 48% 50% 48%
706,198 675,079 660,724 667,521
-
100,000
200,000
300,000
400,000
500,000
600,000
700,000
800,000
0%
10%
20%
30%
40%
50%
60%
70%
80%
90%
100%
2007 2010 2012 2015
Tota
l Hou
seho
lds
Perc
ent o
f Hou
seho
lds
261631
Poverty ALICE Above AT Total HH

UNIT
ED W
AY A
LICE
REP
ORT
– 20
17 U
PDAT
E FO
R M
ICHI
GAN
– EX
HIBI
T I
Note: Municipal-level data on this page is for Places and County Subdivisions, which include Census Designated Places (CDP). These are overlapping geographies so totals will not match county-level data. Municipal-level data often relies on 5-year averages and is not available for the smallest towns that do not report income.
Families with Children by Income, 2015
Assets, All Households, 2015
How many families with children are struggling?Children add significant expense to a family budget, so it is not surprising that many Wayne County families with children live below the ALICE Threshold. Though more Wayne County families are headed by married parents, those families with a single parent are more likely to have income below the ALICE Threshold.
What assets do households have?Ownership of assets can contribute to stability of households. Yet few families in Wayne County own liquid assets, such as a savings account, 401(k) plan, or rental income, that are readily available to cover emergency expenses. Vehicles, the most common asset, depreciate over time. Homeownership, the next most common asset, can build wealth, but is not a liquid asset.
1 Vehicle
2 Vehicles
No Mortgage
3 Vehicles
With Mortgage
4+ Vehicles
0%
10%
20%
30%
40%
50%
60%
70%
80%
90%
Vehicle Home Interest, Dividends, or RentalIncome
Perc
ent o
f Hou
seho
lds
261633
17%
61%
39% 14%
25%
29%
69%
14%
32%
93,283
65,833
17,233
0
10,000
20,000
30,000
40,000
50,000
60,000
70,000
80,000
90,000
100,000
0%
10%
20%
30%
40%
50%
60%
70%
80%
90%
100%
Married Single Female-Headed Single Male-HeadedTo
tal H
ouse
hold
s
Perc
ent o
f Fam
ilies
with
Chi
ldre
n
261632
Poverty ALICE Above AT Total HH
Wayne County, 2015
Town Total HH% ALICE
& Poverty
Allen Park City 10,592 31%
Belleville City 1,617 47%
Brownstown Charter Township 11,119 32%
Canton Charter Township 31,505 21%
Dearborn City 31,502 46%
Dearborn Heights City 20,646 48%
Detroit City 255,740 70%
Ecorse City 3,438 69%
Flat Rock City 3,664 41%
Garden City 10,326 44%
Gibraltar City 1,739 36%
Grosse Ile Township 4,035 20%
Grosse Pointe City 2,155 17%
Grosse Pointe Farms City 3,373 12%
Grosse Pointe Park City 4,303 25%
Grosse Pointe Woods City 6,089 20%
Hamtramck City 6,241 75%
Harper Woods City 5,283 46%
Highland Park City 4,499 78%
Huron Charter Township 5,472 28%
Inkster City 9,451 64%
Lincoln Park City 14,401 52%
Livonia City 37,199 26%
Melvindale City 4,124 64%
Northville City 1,195 27%
Northville Township 10,975 20%
Plymouth Charter Township 10,622 25%
Plymouth City 4,083 31%
Redford Charter Township 18,057 44%
River Rouge City 2,769 70%
Riverview City 4,930 42%
Rockwood City 1,318 43%
Romulus City 8,506 53%
Southgate City 12,499 43%
Sumpter Township 3,533 42%
Taylor City 23,742 53%
Trenton City 7,798 35%
Van Buren Charter Township 11,275 41%
Village Of Grosse Pointe Shores City 1,163 9%
Wayne City 6,792 58%
Westland City 33,717 49%
Woodhaven City 5,163 37%
Wyandotte City 10,625 43%

UNIT
ED W
AY A
LICE
REP
ORT
– 20
17 U
PDAT
E FO
R M
ICHI
GAN
– EX
HIBI
T I
2015 Point-in-Time Data
Households by Income, 2007 to 2015
Population: 32,751 | Number of Households: 12,673Median Household Income: $41,534 (state average: $51,084)Unemployment Rate: 9.5% (state average: 7.2%)ALICE Households: 28% (state average: 25%); Poverty Households: 16% (state average: 15%)
How many households are struggling?ALICE is an acronym for Asset Limited, Income Constrained, Employed – households that earn more than the Federal Poverty Level, but less than the basic cost of living for the county (the ALICE Threshold, or AT). Combined, the number of poverty and ALICE households equals the total population struggling to afford basic needs. The number of households below the ALICE Threshold changes over time; households move in and out of poverty and ALICE as circumstances improve or worsen. The Great Recession, from 2007 to 2010, caused hardship for many families. Conditions started to improve in 2010 and 2012 for some, but not for all.
What does it cost to afford the basic necessities?The bare-minimum Household Survival Budget does not include any savings, leaving a household vulnerable to unexpected expenses. ALICE households typically earn above the Federal Poverty Level of $11,770 for a single adult and $24,250 for a family of four, but less than the Household Survival Budget.
ALICE IN WEXFORD COUNTY
Household Survival Budget, Wexford County
SINGLE ADULT2 ADULTS, 1 INFANT,
1 PRESCHOOLERMonthly Costs
Housing $415 $698Child Care $– $961Food $184 $609Transportation $349 $697Health Care $184 $707Miscellaneous $129 $394Taxes $157 $262
Monthly Total $1,418 $4,328ANNUAL TOTAL $17,016 $51,936Hourly Wage $8.51 $25.97
Sources: 2015 Point-in-Time Data: American Community Survey. ALICE Demographics: American Community Survey; the ALICE Threshold. Budget: U.S. Department of Housing and Urban Development (HUD); U.S. Department of Agriculture (USDA); Bureau of Labor Statistics (BLS); Internal Revenue Service (IRS); Michigan Department of Treasury; Early Childhood Investment Corporation.
15% 17% 18% 16%
20% 22% 28% 28%
65% 61%
54% 56%
12,877 12,314 12,271
12,673
-
2,000
4,000
6,000
8,000
10,000
12,000
14,000
0%
10%
20%
30%
40%
50%
60%
70%
80%
90%
100%
2007 2010 2012 2015
Tota
l Hou
seho
lds
Perc
ent o
f Hou
seho
lds
261651
Poverty ALICE Above AT Total HH

UNIT
ED W
AY A
LICE
REP
ORT
– 20
17 U
PDAT
E FO
R M
ICHI
GAN
– EX
HIBI
T I
Note: Municipal-level data on this page is for Places and County Subdivisions, which include Census Designated Places (CDP). These are overlapping geographies so totals will not match county-level data. Municipal-level data often relies on 5-year averages and is not available for the smallest towns that do not report income.
Families with Children by Income, 2015
Assets, All Households, 2015
How many families with children are struggling?Children add significant expense to a family budget, so it is not surprising that many Wexford County families with children live below the ALICE Threshold. Though more Wexford County families are headed by married parents, those families with a single parent are more likely to have income below the ALICE Threshold.
What assets do households have?Ownership of assets can contribute to stability of households. Yet few families in Wexford County own liquid assets, such as a savings account, 401(k) plan, or rental income, that are readily available to cover emergency expenses. Vehicles, the most common asset, depreciate over time. Homeownership, the next most common asset, can build wealth, but is not a liquid asset.
1 Vehicle
2 Vehicles
No Mortgage
3 Vehicles
With Mortgage
4+ Vehicles
0%
10%
20%
30%
40%
50%
60%
70%
80%
90%
100%
Vehicle Home Interest, Dividends, or RentalIncome
Perc
ent o
f Hou
seho
lds
261653
14%
56%
21%
16%
33%
38%
70%
11%
41%
2,183
677
383
0
500
1,000
1,500
2,000
2,500
0%
10%
20%
30%
40%
50%
60%
70%
80%
90%
100%
Married SingleFemale-Headed
SingleMale-
HeadedTo
tal H
ouse
hold
s
Perc
ent o
f Fam
ilies
with
Chi
ldre
n
261652
Poverty ALICE Above AT Total HH
Wexford County, 2015
Town Total HH% ALICE
& Poverty
Antioch Township 353 41%
Boon Township 277 51%
Cadillac City 4,226 49%
Cedar Creek Township 638 38%
Cherry Grove Township 821 37%
Clam Lake Township 859 22%
Colfax Township 345 38%
Greenwood Township 205 45%
Hanover Township 538 39%
Haring Charter Township 1,208 36%
Liberty Township 351 37%
Manton City 496 55%
Selma Township 899 46%
Slagle Township 245 52%
South Branch Township 142 41%
Springville Township 637 58%
Wexford Township 339 39%

UNIT
ED W
AY A
LICE
REP
ORT
– 20
17 U
PDAT
E FO
R M
ICHI
GAN
– EX
HIBI
T II
ALICE HOUSING DATA BY COUNTYALICE, an acronym for Asset Limited, Income Constrained, Employed, represents the growing number of individuals and families who are working, but are unable to afford the basic necessities of housing, food, child care, health care, and transportation.
The United Way ALICE Report uses standardized measurements to quantify the cost of a basic household budget in each county in Michigan, and to show how many households are struggling to afford it.
This table presents key housing data for each county in Michigan in 2015 for owner-occupied and renter-occupied units.
The Gap in Rental Units is an average of the high and low estimates for the number of rental units necessary to enable all households below the ALICE Threshold to spend less than one-third of their income on housing.
Source: American Community Survey, 2015; counties with populations over 65,000 use 1-year estimates; populations under 65,000 use 5-year estimates. Starting in 2014, there are no 3-year estimates
Housing Data by County, Michigan, 2015
County Owner-Occupied Units Renter-Occupied Units Source
Owner-Occupied
Percent Owned by HHs Below ALICE
Threshold
Housing Burden: Percent Owners Pay More Than 30% of
Income
Renter-Occupied
Percent Rented by HHs Below ALICE
Threshold
Housing Burden: Percent Renters Pay
More Than 30% of Income
Gap in Rental Units Affordable for All HHs Below ALICE Threshold
American Community Survey
Estimate
Alger 2,977 55% 25% 493 95% 55% 81 5-Year
Allegan 33,215 39% 16% 8,864 60% 36% 5,354 1-Year
Alpena 9,693 35% 21% 3,029 75% 49% 1,283 5-Year
Antrim 8,096 48% 28% 1,593 78% 54% 79 5-Year
Arenac 5,352 40% 26% 1,095 74% 51% 806 5-Year
Baraga 2,498 57% 23% 476 86% 46% 410 5-Year
Barry 18,714 39% 22% 4,122 76% 48% 196 5-Year
Bay 32,907 32% 21% 9,892 60% 41% 7,306 1-Year
Benzie 6,166 32% 26% 1,059 57% 44% 20 5-Year
Berrien 44,342 28% 21% 19,937 62% 46% 12,428 1-Year
Branch 12,234 47% 21% 3,788 82% 48% 44 5-Year
Calhoun 36,763 31% 23% 16,313 61% 56% 12,495 1-Year
Cass 16,605 48% 26% 3,496 82% 49% 294 5-Year
Charlevoix 8,689 29% 27% 2,105 72% 48% 3 5-Year
Cheboygan 9,131 36% 25% 2,092 74% 47% 898 5-Year
Chippewa 9,833 48% 21% 4,164 81% 49% 3,380 5-Year
Clare 10,679 47% 31% 2,576 79% 62% 2,027 5-Year
Clinton 22,698 30% 16% 6,374 64% 44% 4,100 1-Year
Crawford 4,803 34% 24% 1,151 68% 50% 586 5-Year
Delta 12,321 34% 22% 3,364 76% 52% 2,573 5-Year
Dickinson 8,977 36% 20% 2,082 61% 43% 1,277 5-Year
Eaton 31,072 16% 17% 12,479 51% 47% 353 1-Year
Emmet 10,534 26% 26% 3,414 63% 52% 2,157 5-Year
Genesee 115,325 31% 26% 48,163 64% 50% 30,863 1-Year
Gladwin 9,134 40% 28% 1,826 73% 52% 1,333 5-Year
Gogebic 5,247 42% 21% 1,494 75% 50% 1,114 5-Year

UNIT
ED W
AY A
LICE
REP
ORT
– 20
17 U
PDAT
E FO
R M
ICHI
GAN
– EX
HIBI
T II
County Owner-Occupied Units Renter-Occupied Units Source
Owner-Occupied
Percent Owned by HHs Below ALICE
Threshold
Housing Burden: Percent Owners Pay More Than 30% of
Income
Renter-Occupied
Percent Rented by HHs Below ALICE
Threshold
Housing Burden: Percent Renters Pay
More Than 30% of Income
Gap in Rental Units Affordable for All HHs Below ALICE Threshold
American Community Survey
Estimate
Grand Traverse 27,376 41% 26% 9,576 57% 31% 5,504 1-Year
Gratiot 10,852 50% 22% 3,864 83% 56% 81 5-Year
Hillsdale 13,759 34% 25% 4,051 68% 49% 2,752 5-Year
Houghton 9,373 49% 18% 4,392 87% 55% 428 5-Year
Huron 11,253 34% 22% 2,552 69% 49% 1,756 5-Year
Ingham 64,311 37% 21% 46,954 72% 50% 33,720 1-Year
Ionia 17,337 43% 24% 4,755 79% 52% 1 5-Year
Iosco 9,091 42% 23% 2,252 64% 43% 1,444 5-Year
Iron 4,515 47% 26% 877 78% 49% 305 5-Year
Isabella 14,581 38% 21% 9,665 85% 62% 694 1-Year
Jackson 41,809 22% 18% 17,483 59% 50% 13,019 1-Year
Kalamazoo 64,681 33% 19% 36,547 73% 44% 26,842 1-Year
Kalkaska 5,791 38% 27% 1,394 64% 44% 887 5-Year
Kent 162,396 34% 18% 74,863 72% 48% 53,974 1-Year
Keweenaw 922 42% 27% 118 90% 61% 18 5-Year
Lake 3,606 69% 31% 759 91% 59% 99 5-Year
Lapeer 27,628 38% 21% 5,080 74% 56% 3,739 1-Year
Leelanau 7,836 24% 31% 1,398 51% 49% 66 5-Year
Lenawee 29,309 45% 26% 7,707 77% 51% 201 1-Year
Livingston 60,228 26% 22% 10,872 62% 51% 454 1-Year
Luce 1,795 56% 22% 582 80% 49% 466 5-Year
Mackinac 3,839 37% 25% 1,370 68% 43% 490 5-Year
Macomb 244,923 36% 21% 96,609 68% 51% 8,726 1-Year
Manistee 8,192 38% 25% 1,950 67% 49% 19 5-Year
Marquette 17,644 39% 20% 7,854 79% 45% 6,174 1-Year
Mason 9,192 34% 28% 3,056 69% 52% 1,500 5-Year
Mecosta 11,532 49% 24% 3,946 84% 61% 400 5-Year
Menominee 8,390 37% 21% 2,289 70% 47% 744 5-Year
Midland 24,908 31% 17% 8,069 64% 46% 5,148 1-Year
Missaukee 4,810 38% 25% 1,056 61% 48% 68 5-Year
Monroe 47,149 37% 22% 11,737 79% 50% 756 1-Year
Montcalm 18,408 54% 27% 4,876 79% 49% 3,861 5-Year
Montmorency 3,481 43% 27% 589 75% 59% 440 5-Year
Muskegon 46,354 43% 19% 16,861 78% 51% 13,108 1-Year
Newaygo 15,249 34% 25% 3,090 68% 55% 36 5-Year
Oakland 348,195 26% 21% 149,624 59% 45% 14,581 1-Year
Oceana 7,913 52% 25% 1,909 85% 52% 182 5-Year
Ogemaw 7,689 43% 29% 1,745 74% 63% 1,295 5-Year
Ontonagon 2,709 47% 24% 375 81% 53% 107 5-Year
Osceola 6,902 38% 25% 1,855 73% 51% 1,358 5-Year
Oscoda 3,117 48% 28% 569 78% 53% 21 5-Year
Otsego 7,877 27% 22% 2,079 63% 54% 1,301 5-Year
Ottawa 76,393 31% 17% 22,205 69% 43% 15,258 1-Year
Presque Isle 5,237 36% 21% 762 70% 46% 289 5-Year
Roscommon 9,503 44% 29% 2,040 76% 63% 1,093 5-Year
Saginaw 54,489 31% 21% 22,722 66% 55% 17,635 1-Year
St Clair 48,888 41% 20% 14,683 73% 52% 122 1-Year

UNIT
ED W
AY A
LICE
REP
ORT
– 20
17 U
PDAT
E FO
R M
ICHI
GAN
– EX
HIBI
T II
County Owner-Occupied Units Renter-Occupied Units Source
Owner-Occupied
Percent Owned by HHs Below ALICE
Threshold
Housing Burden: Percent Owners Pay More Than 30% of
Income
Renter-Occupied
Percent Rented by HHs Below ALICE
Threshold
Housing Burden: Percent Renters Pay
More Than 30% of Income
Gap in Rental Units Affordable for All HHs Below ALICE Threshold
American Community Survey
Estimate
St Joseph 17,458 29% 22% 5,812 64% 48% 3,745 5-Year
Sanilac 13,009 53% 24% 3,271 83% 48% 183 5-Year
Schoolcraft 2,739 43% 21% 680 81% 65% 16 5-Year
Shiawassee 20,754 22% 18% 6,282 58% 42% 101 1-Year
Tuscola 17,347 32% 24% 3,957 65% 52% 52 5-Year
Van Buren 22,398 44% 21% 6,166 82% 53% 31 1-Year
Washtenaw 81,042 26% 21% 57,057 61% 48% 5,614 1-Year
Wayne 409,245 44% 25% 258,276 76% 57% 19,771 1-Year
Wexford 9,719 34% 25% 2,954 66% 49% 2,375 5-Year
Housing Data by County, Michigan, 2015

UNIT
ED W
AY A
LICE
REP
ORT
– 20
17 U
PDAT
E FO
R M
ICHI
GAN
– EX
HIBI
T III
ALICE THRESHOLD AND DEMOGRAPHICS, MICHIGAN, 2015ALICE, an acronym for Asset Limited, Income Constrained, Employed, represents the growing number of individuals and families who are working, but are unable to afford the basic necessities of housing, food, child care, health care, and transportation.
The United Way ALICE Report uses standardized measurements to quantify the cost of a Household Survival Budget in each county in Michigan, and to show the number of households earning below this amount – the ALICE Threshold.
The table presents ALICE demographics for each county broken down by race/ethnicity and age. Note that percentages of race/ethnicity and age can mask size of the population. The ALICE Thresholds for households under and over 65 years old for each county are presented.
For details of the methodology, see the Methodology Overview.
Source: American Community Survey, 2015; counties with populations over 65,000 use 1-year estimates; populations under 65,000 use 5-year estimates.Starting in 2014, there are no 3-year estimates
ALICE Threshold and ALICE Households by Race/Ethnicity and Age, Michigan, 2015
County Total HHs
HHs Below ALICE
ThresholdPercent HH Below AT – Race/Ethnicity
Percent HH Below AT – Age
ALICE Threshold
Asian Black Hispanic White Seniors ALICE Threshold – HH Under 65 Years
ALICE Threshold – HH 65 Years and Over
Alcona 5,001 42% 67% N/A 56% 41% 41% $35,000 $30,000
Alger 3,470 50% N/A 100% 62% 51% 47% $50,000 $30,000
Allegan 42,079 37% 25% 55% 55% 36% 50% $45,000 $35,000
Alpena 12,722 39% 34% 54% 57% 39% 36% $35,000 $25,000
Antrim 9,689 41% 71% N/A 51% 41% 31% $45,000 $30,000
Arenac 6,447 46% 0% 86% 50% 46% 42% $40,000 $30,000
Baraga 2,974 52% 60% 100% 80% 51% 49% $50,000 $30,000
Barry 22,836 36% 29% 46% 63% 35% 40% $45,000 $30,000
Bay 42,799 37% 26% 61% 59% 36% 37% $40,000 $25,000
Benzie 7,225 37% 0% N/A 68% 36% 35% $40,000 $30,000
Berrien 64,279 37% 34% 70% 51% 33% 31% $40,000 $25,000
Branch 16,022 46% 49% 47% 63% 45% 47% $45,000 $30,000
Calhoun 53,076 41% 36% 64% 53% 36% 38% $40,000 $25,000
Cass 20,101 42% 34% 66% 70% 40% 38% $45,000 $30,000
Charlevoix 10,794 39% 45% 0% 44% 39% 37% $40,000 $30,000
Cheboygan 11,223 41% 80% 0% 65% 39% 39% $35,000 $30,000
Chippewa 13,997 48% 61% 53% 48% 46% 48% $45,000 $30,000
Clare 13,255 53% 0% 0% 61% 53% 45% $40,000 $30,000
Clinton 29,072 30% 45% 61% 53% 28% 34% $45,000 $30,000
Crawford 5,954 38% 89% 100% 56% 38% 39% $35,000 $30,000
Delta 15,685 44% 92% N/A 81% 43% 50% $40,000 $30,000
Dickinson 11,059 39% 71% 0% 32% 38% 38% $40,000 $25,000
Eaton 43,551 29% 29% 51% 36% 27% 22% $40,000 $30,000
Emmet 13,948 37% 35% 64% 76% 36% 32% $40,000 $30,000
Genesee 163,488 40% 24% 61% 42% 34% 29% $40,000 $25,000
Gladwin 10,960 47% 59% 75% 37% 47% 45% $40,000 $30,000
Gogebic 6,741 48% 48% 0% 100% 47% 42% $40,000 $25,000

UNIT
ED W
AY A
LICE
REP
ORT
– 20
17 U
PDAT
E FO
R M
ICHI
GAN
– EX
HIBI
T III
County Total HHs
HHs Below ALICE
ThresholdPercent HH Below AT – Race/Ethnicity
Percent HH Below AT – Age
ALICE Threshold
Asian Black Hispanic White SeniorsALICE Threshold – HH Under 65 Years
ALICE Threshold – HH 65 Years and Over
Grand Traverse 36,952 35% 61% 64% 38% 35% 37% $45,000 $30,000
Gratiot 14,716 48% 20% 60% 64% 47% 47% $45,000 $30,000
Hillsdale 17,810 41% 45% 52% 46% 41% 36% $40,000 $25,000
Houghton 13,765 51% 76% 72% 66% 50% 47% $45,000 $30,000
Huron 13,805 42% 10% 0% 55% 42% 45% $40,000 $30,000
Ingham 111,265 43% 50% 61% 57% 39% 23% $45,000 $25,000
Ionia 22,092 45% 77% 6% 56% 44% 42% $50,000 $30,000
Iosco 11,343 47% 70% 57% 9% 47% 42% $40,000 $30,000
Iron 5,392 49% 40% 100% 75% 49% 56% $35,000 $30,000
Isabella 24,246 50% 62% 66% 55% 48% 31% $45,000 $25,000
Jackson 59,292 36% 34% 73% 43% 32% 33% $40,000 $30,000
Kalamazoo 101,228 36% 50% 69% 60% 31% 27% $45,000 $25,000
Kalkaska 7,185 43% N/A 81% 35% 43% 38% $40,000 $25,000
Kent 237,259 38% 34% 66% 61% 33% 36% $45,000 $30,000
Keweenaw 1,040 47% N/A 100% 100% 46% 42% $40,000 $30,000
Lake 4,365 59% 100% 84% 46% 55% 51% $45,000 $30,000
Lapeer 32,708 37% 59% 100% 60% 36% 40% $50,000 $35,000
Leelanau 9,234 28% 51% N/A 42% 27% 26% $40,000 $30,000
Lenawee 37,016 43% 51% 70% 61% 42% 49% $45,000 $35,000
Livingston 71,100 27% 24% 31% 27% 26% 30% $50,000 $35,000
Luce 2,377 55% 100% N/A 77% 53% 54% $50,000 $30,000
Mackinac 5,209 33% 26% 56% 39% 31% 31% $30,000 $25,000
Macomb 341,532 38% 34% 58% 47% 36% 34% $50,000 $30,000
Manistee 10,142 39% 24% 59% 48% 38% 30% $40,000 $25,000
Marquette 25,498 41% 27% 54% 86% 40% 33% $45,000 $30,000
Mason 12,248 40% 21% 30% 54% 39% 42% $35,000 $30,000
Mecosta 15,478 47% 61% 72% 65% 47% 41% $45,000 $30,000
Menominee 10,679 39% 0% N/A 44% 39% 46% $35,000 $25,000
Midland 32,977 34% 17% 62% 51% 35% 36% $45,000 $35,000
Missaukee 5,866 44% 0% 14% 37% 43% 42% $40,000 $30,000
Monroe 58,886 33% 16% 50% 53% 32% 25% $45,000 $25,000
Montcalm 23,284 48% 21% 71% 59% 48% 48% $45,000 $30,000
Montmorency 4,070 48% N/A N/A 62% 48% 41% $40,000 $30,000
Muskegon 63,215 40% 42% 72% 55% 33% 27% $45,000 $25,000
Newaygo 18,339 41% 71% 55% 54% 40% 43% $40,000 $30,000
Oakland 497,819 30% 16% 44% 45% 27% 34% $45,000 $35,000
Oceana 9,822 47% 67% 100% 61% 45% 43% $45,000 $30,000
Ogemaw 9,434 46% 0% 92% 45% 46% 37% $40,000 $25,000
Ontonagon 3,084 47% 0% 0% 40% 47% 47% $35,000 $30,000
Osceola 8,757 47% 0% 77% 54% 46% 48% $40,000 $30,000
Oscoda 3,686 47% N/A N/A 55% 47% 38% $40,000 $25,000
Otsego 9,956 36% 63% 0% 0% 36% 38% $40,000 $30,000
Ottawa 98,598 36% 40% 72% 54% 35% 41% $50,000 $35,000
Presque Isle 5,999 37% 0% 100% 39% 37% 42% $35,000 $30,000
Roscommon 11,543 43% N/A N/A 54% 43% 33% $35,000 $25,000
Saginaw 77,211 39% 23% 67% 50% 30% 26% $40,000 $25,000
St Clair 63,571 40% 34% 76% 45% 40% 45% $45,000 $35,000
St Joseph 23,270 40% 39% 65% 60% 39% 45% $40,000 $30,000
Sanilac 16,280 47% 57% 35% 53% 47% 47% $45,000 $30,000
Schoolcraft 3,419 52% 60% N/A 50% 51% 55% $40,000 $30,000
Shiawassee 27,036 31% 51% 81% 47% 31% 27% $40,000 $25,000
Tuscola 21,304 37% 14% 59% 50% 37% 31% $40,000 $25,000
Van Buren 28,564 40% 48% 70% 63% 38% 45% $45,000 $30,000
Washtenaw 138,099 37% 42% 58% 56% 32% 32% $50,000 $35,000
Wayne 667,521 52% 35% 67% 60% 39% 44% $50,000 $30,000
Wexford 12,673 44% 10% 85% 53% 43% 43% $40,000 $30,000
ALICE Threshold and ALICE Households by Race/Ethnicity and Age, Michigan, 2015

UNIT
ED W
AY A
LICE
REP
ORT
– 20
17 U
PDAT
E FO
R M
ICHI
GAN
– EX
HIBI
T IV
KEY FACTS AND ALICE STATISTICS FOR MICHIGAN CONGRESSIONAL DISTRICTSALICE, an acronym for Asset Limited, Income Constrained, Employed, represents the growing number of individuals and families who are working, but are unable to afford the basic necessities of housing, food, child care, health care, and transportation.
The United Way ALICE Report uses standardized measurements to quantify the cost of a basic household budget in each county in Michigan, and to show how many households are struggling to afford it.
Key data and ALICE statistics for the state’s 14 congressional districts (114th Congress) are presented below.
Source: American Community Survey, 2015, 1-year estimates
Districts for the 114th Congress
Population Households Poverty %
ALICE %
Above ALICE
Threshold %
Unemployment Rate
Health Insurance Coverage
%
Housing Burden: Owner
Over 30%
Housing Burden: Renter
Over 30%
Source, American
Community Survey
Estimate
Congressional District 1 700,136 289,509 14% 26% 60% 6.7% 94% 21% 41% 1-Year
Congressional District 2 731,188 270,589 12% 22% 66% 5.4% 95% 19% 44% 1-Year
Congressional District 3 730,423 273,074 13% 25% 62% 6.2% 94% 19% 46% 1-Year
Congressional District 4 701,635 268,340 15% 24% 61% 6.6% 93% 20% 45% 1-Year
Congressional District 5 682,716 277,003 19% 22% 59% 9.5% 94% 24% 46% 1-Year
Congressional District 6 713,644 279,199 14% 25% 61% 6.6% 94% 19% 41% 1-Year
Congressional District 7 697,627 265,607 11% 21% 68% 5.4% 95% 20% 43% 1-Year
Congressional District 8 728,781 277,217 12% 23% 65% 5.9% 95% 20% 46% 1-Year
Congressional District 9 717,641 298,469 12% 28% 60% 6.7% 94% 22% 45% 1-Year
Congressional District 10 715,535 276,435 10% 23% 67% 6.0% 94% 20% 48% 1-Year
Congressional District 11 720,585 280,995 7% 18% 75% 4.2% 95% 19% 37% 1-Year
Congressional District 12 708,020 274,068 15% 25% 60% 6.5% 94% 21% 45% 1-Year
Congressional District 13 679,235 258,660 29% 32% 39% 14.6% 91% 28% 54% 1-Year
Congressional District 14 695,410 269,367 23% 27% 50% 12.8% 92% 26% 53% 1-Year

UNIT
ED W
AY A
LICE
REP
ORT
– 20
17 U
PDAT
E FO
R M
ICHI
GAN
– EX
HIBI
T V
THE ECONOMIC VIABILITY DASHBOARDALICE, an acronym for Asset Limited, Income Constrained, Employed, represents the growing number of individuals and families who are working, but are unable to afford the basic necessities of housing, food, child care, health care, and transportation.
The United Way ALICE Report uses standardized measurements to quantify the cost of a basic household budget in each county in Michigan, and to show how many households are struggling to afford it.
The Economic Viability Dashboard is composed of three indices that evaluate the local economic conditions that matter most to ALICE households – the Housing Affordability Index, the Job Opportunities Index, and the Community Resources Index. Index scores range from 1 to 100, with higher scores reflecting better conditions. Each county’s score is relative to other counties in Michigan and compared to prior years. A score of 100 does not necessarily mean that conditions are very good; it means that they are better than in other counties in the state. These indices are used only for comparison within the state, not for comparison to other states. Scores are presented for 2010 and 2015.
Source: American Community Survey, U.S. Census, and Bureau of Labor Statistics (BLS), 2015
ECONOMIC VIABILITY DASHBOARDThe Housing Affordability Index
Key Indicators: Affordable Housing Gap + Housing Burden + Real Estate Taxes
The more affordable a county, the easier it is for a household to be financially stable. The three key indicators for the Housing Affordability Index are the affordable housing gap, the housing burden, and real estate taxes.
The Job Opportunities IndexKey Indicators: Income Distribution + Unemployment Rate + New Hire Wages
The more job opportunities there are in a county, the more likely a household is to be financially stable. The three key indicators for the Job Opportunities Index are income distribution as measured by the share of income for the lowest two quintiles, the unemployment rate, and the average wage for new hires.
The Community Resources IndexKey Indicators: Education Resources + Health Resources + Social Capital
Collective resources in a location can also make a difference in the financial stability of ALICE households in both the short and long terms. The three key indicators for the Community Resources Index are the percent of 3- and 4-year-olds enrolled in preschool, health insurance coverage rate, and percent of the adult population who voted.

UNIT
ED W
AY A
LICE
REP
ORT
– 20
17 U
PDAT
E FO
R M
ICHI
GAN
– EX
HIBI
T V
Economic Viability Dashboard, Michigan, 2010 and 20151 = worse, 100 = better
County Housing Affordability Job Opportunities Community Resources2015 2010 2015 2010 2015 2010
Alcona 68 63 47 48 58 44
Alger 68 60 57 50 50 47
Allegan 74 42 85 64 54 51
Alpena 63 58 58 48 54 63
Antrim 61 50 50 41 61 68
Arenac 67 60 57 46 55 42
Baraga 70 64 50 62 43 45
Barry 66 53 71 64 53 55
Bay 69 58 63 54 63 50
Benzie 67 52 76 57 50 54
Berrien 64 46 54 47 51 52
Branch 70 56 63 56 43 45
Calhoun 57 41 68 56 48 49
Cass 66 59 61 66 38 41
Charlevoix 61 46 63 49 65 56
Cheboygan 64 57 42 28 62 54
Chippewa 68 57 47 42 47 55
Clare 61 58 43 38 44 43
Clinton 68 50 71 65 58 60
Crawford 60 56 58 43 57 42
Delta 69 55 51 45 58 60
Dickinson 73 61 62 59 49 56
Eaton 62 37 78 61 56 54
Emmet 58 40 59 57 57 52
Genesee 58 29 54 28 52 50
Gladwin 65 52 53 34 51 54
Gogebic 74 63 50 53 44 42
Grand Traverse 45 32 73 43 65 54
Gratiot 66 52 59 51 45 41
Hillsdale 66 58 59 56 49 47
Houghton 65 50 50 45 42 43
Huron 71 63 64 58 58 63
Ingham 49 11 49 39 47 48
Ionia 65 45 58 53 46 53
Iosco 73 55 50 29 51 49
Iron 64 67 62 59 53 42
Isabella 51 15 40 32 39 45
Jackson 65 43 64 37 52 56
Kalamazoo 57 25 58 43 55 51
Kalkaska 68 57 70 56 49 36
Kent 60 31 68 58 54 54

UNIT
ED W
AY A
LICE
REP
ORT
– 20
17 U
PDAT
E FO
R M
ICHI
GAN
– EX
HIBI
T V
County Housing Affordability Job Opportunities Community Resources2015 2010 2015 2010 2015 2010
Keweenaw 66 81 52 46 71 39
Lake 61 57 45 42 45 42
Lapeer 68 51 71 56 49 50
Leelanau 51 42 66 57 79 80
Lenawee 58 43 76 52 41 45
Livingston 55 38 76 62 64 60
Luce 76 67 51 53 47 25
Mackinac 62 63 49 49 54 49
Macomb 53 26 73 52 54 51
Manistee 67 54 54 49 50 61
Marquette 67 62 66 53 47 51
Mason 49 55 53 51 53 54
Mecosta 61 42 45 34 47 40
Menominee 68 68 53 56 49 52
Midland 67 45 65 61 59 66
Missaukee 70 59 60 61 52 37
Monroe 64 40 72 54 54 47
Montcalm 65 48 62 46 49 50
Montmorency 68 59 58 49 52 31
Muskegon 68 45 58 40 45 49
Newaygo 66 55 59 56 55 50
Oakland 47 18 74 54 65 64
Oceana 65 57 66 65 51 49
Ogemaw 62 50 46 35 50 44
Ontonagon 71 75 47 48 57 36
Osceola 69 60 65 66 48 49
Oscoda 69 60 55 42 44 35
Otsego 69 60 57 52 57 51
Ottawa 67 41 78 63 50 57
Presque Isle 73 70 53 51 55 45
Roscommon 54 45 38 45 63 52
Saginaw 63 43 52 44 61 58
St. Clair 65 36 65 38 64 56
St. Joseph 69 58 66 50 39 41
Sanilac 69 57 61 44 51 52
Schoolcraft 71 68 48 50 53 43
Shiawassee 72 55 76 65 57 63
Tuscola 67 58 62 52 53 55
Van Buren 64 48 62 52 45 48
Washtenaw 34 6 62 54 62 61
Wayne 47 14 50 34 50 49
Wexford 66 46 59 46 49 47
Economic Viability Dashboard, Michigan, 2010 and 20151 = worse, 100 = better

UNIT
ED W
AY A
LICE
REP
ORT
– 20
17 U
PDAT
E FO
R M
ICHI
GAN
– EX
HIBI
T VI
KEY FACTS AND ALICE STATISTICS FOR MICHIGAN MUNICIPALITIESALICE, an acronym for Asset Limited, Income Constrained, Employed, represents the growing number of individuals and families who are working, but are unable to afford the basic necessities of housing, food, child care, health care, and transportation.
The United Way ALICE Report uses standardized measurements to quantify the cost of a basic household budget in each county in Michigan, and to show how many households are struggling to afford it. Knowing the extent of local variation is an important aspect of understanding the challenges facing households earning below the ALICE Threshold in Michigan.
Key data and ALICE statistics for the state’s municipalities are presented here.
Source: American Community Survey, 2015; towns with populations over 65,000 use 1-year estimates; populations under 65,000 use 5-year estimates. Starting in 2014, there are no 3-year estimates.
Key Facts and ALICE Statistics for Michigan Municipalities
Municipality by County Population Households Poverty % ALICE % Above ALICE Threshold %
Unemployment Rate
Health Insurance
Coverage %
Housing Burden: Owner Over 30%
Housing Burden: Renter Over 30%
Source, American Community
Survey Estimate
Alcona Township, Alcona County 1,036 521 8% 22% 70% 4.2% 94% 18% 0% 5-Year
Caledonia Township, Alcona County 1,075 501 13% 26% 61% 14.5% 90% 23% 72% 5-Year
Curtis Township, Alcona County 1,170 577 17% 34% 49% 19.4% 89% 30% 7% 5-Year
Greenbush Township, Alcona County 1,468 709 14% 20% 66% 14.7% 91% 22% 31% 5-Year
Gustin Township, Alcona County 686 329 20% 23% 57% 14.9% 86% 19% 57% 5-Year
Harrisville City, Alcona County 380 194 28% 35% 37% 6.2% 93% 27% 41% 5-Year
Harrisville Township, Alcona County 1,284 573 14% 29% 57% 6.7% 90% 29% 31% 5-Year
Hawes Township, Alcona County 968 459 17% 27% 56% 9.3% 89% 28% 42% 5-Year
Haynes Township, Alcona County 718 341 8% 23% 69% 5.4% 96% 26% 0% 5-Year
Mikado Township, Alcona County 1,078 435 19% 28% 53% 15.6% 85% 26% 42% 5-Year
Millen Township, Alcona County 326 171 27% 29% 44% 28.3% 74% 27% 8% 5-Year
Mitchell Township, Alcona County 361 191 11% 31% 58% 9.1% 89% 35% 33% 5-Year
Au Train Township, Alger County 1,033 494 12% 33% 55% 8.1% 93% 33% 72% 5-Year
Burt Township, Alger County 441 192 15% 41% 44% 7.3% 88% 39% 55% 5-Year
Limestone Township, Alger County 422 155 20% 33% 47% 15.8% 82% 28% 30% 5-Year
Mathias Township, Alger County 469 194 13% 39% 48% 16.5% 84% 8% 63% 5-Year
Munising City, Alger County 2,303 909 16% 41% 43% 14.8% 83% 24% 42% 5-Year
Munising Township, Alger County 2,970 786 14% 33% 53% 8.4% 89% 20% 63% 5-Year
Onota Township, Alger County 263 142 18% 30% 52% 10.8% 89% 30% 50% 5-Year
Rock River Township, Alger County 1,506 576 11% 32% 57% 6.8% 93% 21% 24% 5-Year
Allegan City, Allegan County 5,036 2,071 17% 35% 48% 8.2% 91% 14% 46% 5-Year
Allegan Township, Allegan County 4,452 1,659 7% 30% 63% 5.1% 93% 17% 13% 5-Year
Casco Township, Allegan County 2,895 1,048 13% 22% 65% 13.1% 85% 26% 19% 5-Year
Cheshire Township, Allegan County 2,004 803 16% 23% 61% 5.8% 91% 16% 49% 5-Year
Clyde Township, Allegan County 1,959 733 21% 37% 42% 5.8% 81% 22% 56% 5-Year
Dorr Township, Allegan County 7,546 2,418 8% 21% 71% 4.5% 94% 15% 23% 5-Year
Douglas City, Allegan County 1,113 537 9% 37% 54% 6.2% 89% 42% 25% 5-Year
Fennville City, Allegan County 1,777 571 34% 28% 38% 11.8% 83% 36% 38% 5-Year

UNIT
ED W
AY A
LICE
REP
ORT
– 20
17 U
PDAT
E FO
R M
ICHI
GAN
– EX
HIBI
T VI
Municipality by County Population Households Poverty % ALICE % Above ALICE Threshold %
Unemployment Rate
Health Insurance
Coverage %
Housing Burden: Owner Over 30%
Housing Burden: Renter Over 30%
Source, American Community
Survey Estimate
Fillmore Township, Allegan County 2,708 964 15% 22% 63% 3.3% 96% 20% 38% 5-Year
Ganges Township, Allegan County 2,576 1,077 10% 29% 61% 4.4% 89% 27% 17% 5-Year
Gun Plain Township, Allegan County 5,952 2,147 9% 17% 74% 6.9% 93% 16% 24% 5-Year
Heath Township, Allegan County 3,371 1,128 9% 20% 71% 2.7% 96% 17% 43% 5-Year
Holland City, Allegan County 7,033 2,665 18% 32% 50% 6.5% 88% 32% 36% 5-Year
Hopkins Township, Allegan County 2,649 927 7% 31% 62% 6.8% 94% 22% 26% 5-Year
Laketown Township, Allegan County 5,600 2,311 5% 18% 77% 2.8% 94% 19% 32% 5-Year
Lee Township, Allegan County 4,009 1,301 23% 31% 46% 22.3% 82% 25% 37% 5-Year
Leighton Township, Allegan County 5,176 1,761 7% 16% 77% 5.8% 92% 12% 51% 5-Year
Manlius Township, Allegan County 3,043 1,120 9% 25% 66% 4.6% 96% 27% 65% 5-Year
Martin Township, Allegan County 2,647 922 13% 23% 64% 5.5% 85% 24% 18% 5-Year
Monterey Township, Allegan County 2,373 832 14% 20% 66% 8.1% 91% 25% 19% 5-Year
Otsego City, Allegan County 3,975 1,729 11% 40% 49% 9.5% 95% 26% 32% 5-Year
Otsego Township, Allegan County 5,636 2,069 10% 28% 62% 8.3% 93% 22% 49% 5-Year
Overisel Township, Allegan County 2,955 974 5% 21% 74% 1.7% 93% 15% 24% 5-Year
Plainwell City, Allegan County 3,810 1,628 20% 28% 52% 7.5% 87% 15% 43% 5-Year
Salem Township, Allegan County 4,589 1,535 5% 16% 79% 1.6% 93% 20% 54% 5-Year
Saugatuck City, Allegan County 842 434 21% 17% 62% 7.4% 93% 38% 38% 5-Year
Saugatuck Township, Allegan County 3,021 1,239 12% 18% 70% 3.3% 94% 16% 22% 5-Year
Trowbridge Township, Allegan County 2,506 1,051 13% 25% 62% 3.8% 90% 15% 24% 5-Year
Valley Township, Allegan County 2,067 793 10% 27% 63% 4.2% 91% 32% 44% 5-Year
Watson Township, Allegan County 2,270 782 12% 23% 65% 7.5% 85% 25% 29% 5-Year
Wayland City, Allegan County 4,109 1,434 12% 38% 50% 5.5% 94% 15% 49% 5-Year
Wayland Township, Allegan County 3,138 1,230 10% 21% 69% 2.0% 94% 29% 25% 5-Year
Alpena City, Alpena County 10,273 4,499 25% 21% 54% 9.2% 88% 19% 50% 5-Year
Alpena Township, Alpena County 8,944 4,051 14% 23% 63% 10.8% 89% 20% 39% 5-Year
Green Township, Alpena County 1,146 485 12% 16% 72% 9.4% 90% 21% 19% 5-Year
Long Rapids Township, Alpena County 975 435 11% 22% 67% 7.3% 89% 31% 30% 5-Year
Maple Ridge Township, Alpena County 1,683 707 9% 22% 69% 9.8% 87% 21% 34% 5-Year
Ossineke Township, Alpena County 1,795 737 19% 21% 60% 11.4% 86% 30% 32% 5-Year
Sanborn Township, Alpena County 2,104 861 15% 26% 59% 5.9% 84% 27% 29% 5-Year
Wellington Township, Alpena County 262 114 12% 24% 64% 8.4% 88% 31% 0% 5-Year
Wilson Township, Alpena County 1,886 833 16% 13% 71% 5.1% 89% 18% 38% 5-Year
Banks Township, Antrim County 1,636 625 12% 31% 57% 6.2% 89% 28% 48% 5-Year
Central Lake Township, Antrim County 1,995 874 12% 30% 58% 11.3% 89% 28% 33% 5-Year
Chestonia Township, Antrim County 526 223 12% 42% 46% 15.4% 76% 35% 0% 5-Year
Custer Township, Antrim County 1,074 487 8% 31% 61% 8.3% 88% 27% 41% 5-Year
Echo Township, Antrim County 929 369 11% 31% 58% 9.6% 88% 24% 22% 5-Year
Elk Rapids Township, Antrim County 2,596 1,256 16% 24% 60% 6.2% 91% 29% 48% 5-Year
Forest Home Township, Antrim County 1,748 804 6% 28% 66% 7.3% 95% 23% 23% 5-Year
Helena Township, Antrim County 930 448 15% 19% 66% 9.4% 94% 39% 21% 5-Year
Jordan Township, Antrim County 984 354 12% 31% 57% 11.7% 86% 21% 68% 5-Year
Kearney Township, Antrim County 1,812 706 19% 22% 59% 9.8% 84% 31% 44% 5-Year
Mancelona Township, Antrim County 4,327 1,592 22% 33% 45% 12.7% 85% 28% 63% 5-Year
Milton Township, Antrim County 2,320 907 5% 22% 73% 10.6% 92% 27% 44% 5-Year
Star Township, Antrim County 927 370 12% 37% 51% 14.7% 87% 26% 30% 5-Year
Torch Lake Township, Antrim County 1,112 553 3% 20% 77% 1.1% 94% 29% 0% 5-Year
Warner Township, Antrim County 351 121 17% 28% 55% 12.1% 87% 29% 67% 5-Year
Adams Township, Arenac County 577 220 10% 30% 60% 6.7% 91% 19% 30% 5-Year
Key Facts and ALICE Statistics for Michigan Municipalities

UNIT
ED W
AY A
LICE
REP
ORT
– 20
17 U
PDAT
E FO
R M
ICHI
GAN
– EX
HIBI
T VI
Municipality by County Population Households Poverty % ALICE % Above ALICE Threshold %
Unemployment Rate
Health Insurance
Coverage %
Housing Burden: Owner Over 30%
Housing Burden: Renter Over 30%
Source, American Community
Survey Estimate
Arenac Township, Arenac County 919 362 20% 28% 52% 13.2% 91% 33% 47% 5-Year
Au Gres City, Arenac County 832 423 25% 35% 40% 16.4% 92% 22% 44% 5-Year
Au Gres Township, Arenac County 935 425 16% 24% 60% 6.8% 91% 26% 46% 5-Year
Clayton Township, Arenac County 1,061 386 16% 36% 48% 17.2% 81% 28% 56% 5-Year
Deep River Township, Arenac County 2,063 831 17% 31% 52% 10.1% 91% 25% 26% 5-Year
Lincoln Township, Arenac County 937 371 22% 20% 58% 10.1% 91% 30% 25% 5-Year
Mason Township, Arenac County 919 341 26% 28% 46% 18.1% 88% 37% 43% 5-Year
Moffatt Township, Arenac County 993 457 14% 21% 65% 6.6% 92% 25% 33% 5-Year
Omer City, Arenac County 315 133 10% 34% 56% 7.3% 84% 30% 36% 5-Year
Sims Township, Arenac County 1,030 470 15% 25% 60% 13.6% 92% 21% 62% 5-Year
Standish City, Arenac County 1,701 651 32% 28% 40% 17.3% 88% 33% 42% 5-Year
Standish Township, Arenac County 1,668 705 12% 26% 62% 13.1% 91% 21% 47% 5-Year
Turner Township, Arenac County 481 220 20% 32% 48% 7.1% 85% 29% 71% 5-Year
Whitney Township, Arenac County 993 452 11% 30% 59% 10.2% 90% 22% 63% 5-Year
Arvon Township, Baraga County 282 153 12% 37% 51% 1.4% 95% 24% 0% 5-Year
Baraga Township, Baraga County 4,103 882 22% 35% 43% 9.3% 89% 31% 51% 5-Year
Covington Township, Baraga County 383 173 3% 34% 63% 13.8% 93% 18% 71% 5-Year
L'Anse Township, Baraga County 3,724 1,674 15% 38% 47% 7.4% 93% 20% 36% 5-Year
Assyria Township, Barry County 1,979 787 5% 29% 66% 9.2% 90% 24% 49% 5-Year
Baltimore Township, Barry County 2,166 808 9% 27% 64% 10.6% 86% 21% 53% 5-Year
Barry Township, Barry County 3,389 1,448 7% 30% 63% 4.8% 89% 26% 20% 5-Year
Carlton Township, Barry County 2,403 885 5% 17% 78% 7.8% 93% 19% 15% 5-Year
Castleton Township, Barry County 3,456 1,327 17% 35% 48% 10.5% 89% 29% 50% 5-Year
Hastings Charter Township, Barry County 2,954 1,059 14% 28% 58% 7.8% 89% 15% 41% 5-Year
Hastings City, Barry County 7,304 3,042 21% 31% 48% 12.3% 92% 20% 44% 5-Year
Hope Township, Barry County 3,228 1,382 10% 28% 62% 6.7% 92% 30% 25% 5-Year
Irving Township, Barry County 3,249 1,160 7% 17% 76% 10.4% 94% 29% 33% 5-Year
Johnstown Township, Barry County 3,018 1,287 5% 25% 70% 7.3% 95% 17% 23% 5-Year
Maple Grove Township, Barry County 1,399 536 7% 26% 67% 9.8% 91% 21% 54% 5-Year
Orangeville Township, Barry County 3,318 1,276 9% 23% 68% 10.4% 89% 17% 78% 5-Year
Prairieville Township, Barry County 3,393 1,238 5% 16% 79% 6.0% 90% 23% 24% 5-Year
Rutland Charter Township, Barry County 3,974 1,438 2% 27% 71% 4.3% 96% 10% 18% 5-Year
Thornapple Township, Barry County 7,882 2,813 7% 25% 68% 4.2% 96% 22% 58% 5-Year
Woodland Township, Barry County 1,962 736 9% 27% 64% 6.7% 92% 21% 35% 5-Year
Yankee Springs Township, Barry County 4,073 1,614 9% 19% 72% 8.2% 95% 27% 53% 5-Year
Auburn City, Bay County 2,175 954 6% 23% 71% 3.5% 93% 13% 28% 5-Year
Bangor Charter Township, Bay County 14,468 6,044 15% 23% 62% 8.3% 90% 22% 63% 5-Year
Bay City, Bay County 34,402 14,139 21% 28% 51% 12.4% 90% 26% 51% 5-Year
Beaver Township, Bay County 2,873 1,028 5% 21% 74% 8.0% 91% 28% 37% 5-Year
Essexville City, Bay County 3,432 1,403 8% 17% 75% 13.3% 92% 21% 48% 5-Year
Frankenlust Township, Bay County 3,563 1,427 7% 12% 81% 4.8% 96% 20% 35% 5-Year
Fraser Township, Bay County 3,167 1,315 17% 16% 67% 10.5% 95% 27% 12% 5-Year
Garfield Township, Bay County 1,677 663 9% 19% 72% 9.1% 93% 23% 27% 5-Year
Gibson Township, Bay County 1,306 447 12% 20% 68% 7.3% 89% 25% 53% 5-Year
Hampton Charter Township, Bay County 9,545 4,181 16% 26% 58% 7.7% 92% 20% 43% 5-Year
Kawkawlin Township, Bay County 4,786 1,956 11% 17% 72% 7.3% 94% 18% 41% 5-Year
Merritt Township, Bay County 1,234 521 7% 14% 79% 8.1% 94% 25% 13% 5-Year
Monitor Charter Township, Bay County 10,658 4,263 8% 17% 75% 5.7% 95% 16% 34% 5-Year
Mount Forest Township, Bay County 1,475 561 9% 25% 66% 10.0% 92% 24% 50% 5-Year

UNIT
ED W
AY A
LICE
REP
ORT
– 20
17 U
PDAT
E FO
R M
ICHI
GAN
– EX
HIBI
T VI
Municipality by County Population Households Poverty % ALICE % Above ALICE Threshold %
Unemployment Rate
Health Insurance
Coverage %
Housing Burden: Owner Over 30%
Housing Burden: Renter Over 30%
Source, American Community
Survey Estimate
Pinconning City, Bay County 1,348 567 23% 33% 44% 14.0% 87% 21% 64% 5-Year
Pinconning Township, Bay County 2,352 914 14% 20% 66% 10.3% 93% 21% 58% 5-Year
Portsmouth Charter Township, Bay County 3,263 1,351 6% 20% 74% 14.3% 92% 16% 17% 5-Year
Williams Charter Township, Bay County 4,841 1,768 7% 17% 76% 10.0% 91% 21% 19% 5-Year
Almira Township, Benzie County 3,627 1,446 6% 27% 67% 2.7% 90% 23% 14% 5-Year
Benzonia Township, Benzie County 2,736 1,044 11% 23% 66% 9.6% 85% 25% 27% 5-Year
Blaine Township, Benzie County 496 239 13% 17% 70% 15.5% 92% 23% 55% 5-Year
Colfax Township, Benzie County 712 261 18% 22% 60% 11.5% 82% 32% 18% 5-Year
Crystal Lake Township, Benzie County 1,134 497 7% 28% 65% 10.5% 95% 17% 65% 5-Year
Frankfort City, Benzie County 1,396 578 16% 31% 53% 8.3% 88% 25% 42% 5-Year
Gilmore Township, Benzie County 755 322 9% 26% 65% 11.4% 89% 26% 25% 5-Year
Homestead Township, Benzie County 2,288 945 11% 29% 60% 15.9% 80% 30% 32% 5-Year
Inland Township, Benzie County 1,866 839 8% 33% 59% 4.2% 94% 29% 68% 5-Year
Joyfield Township, Benzie County 808 313 14% 28% 58% 12.0% 91% 27% 53% 5-Year
Lake Township, Benzie County 662 355 8% 16% 76% 5.1% 98% 29% 42% 5-Year
Platte Township, Benzie County 323 153 7% 39% 54% 5.7% 85% 29% 29% 5-Year
Weldon Township, Benzie County 634 233 23% 29% 48% 8.9% 80% 28% 50% 5-Year
Bainbridge Township, Berrien County 2,823 1,062 6% 19% 75% 7.6% 87% 15% 18% 5-Year
Baroda Township, Berrien County 2,767 1,181 7% 30% 63% 9.3% 90% 27% 33% 5-Year
Benton Charter Township, Berrien County 14,565 5,606 30% 28% 42% 13.5% 84% 25% 56% 5-Year
Benton Harbor City, Berrien County 10,014 3,902 48% 29% 23% 23.9% 85% 40% 64% 5-Year
Berrien Township, Berrien County 5,039 1,724 14% 12% 74% 5.3% 84% 21% 53% 5-Year
Bertrand Township, Berrien County 2,630 1,016 6% 16% 78% 8.5% 91% 18% 60% 5-Year
Bridgman City, Berrien County 1,997 872 11% 30% 59% 5.8% 90% 31% 46% 5-Year
Buchanan City, Berrien County 4,401 2,027 19% 25% 56% 7.9% 87% 19% 50% 5-Year
Buchanan Township, Berrien County 3,510 1,295 12% 21% 67% 12.3% 87% 21% 5% 5-Year
Chikaming Township, Berrien County 3,095 1,442 6% 16% 78% 3.2% 86% 22% 45% 5-Year
Coloma Charter Township, Berrien County 4,993 2,045 13% 17% 70% 12.1% 92% 19% 33% 5-Year
Coloma City, Berrien County 1,600 627 12% 28% 60% 7.7% 90% 21% 55% 5-Year
Galien Township, Berrien County 1,504 593 14% 23% 63% 5.2% 89% 22% 33% 5-Year
Hagar Township, Berrien County 3,638 1,535 12% 25% 63% 10.7% 89% 21% 52% 5-Year
Lake Charter Township, Berrien County 2,948 1,218 5% 22% 73% 3.5% 96% 19% 26% 5-Year
Lincoln Charter Township, Berrien County 14,591 6,006 6% 18% 76% 6.2% 95% 18% 33% 5-Year
New Buffalo City, Berrien County 1,893 823 12% 27% 61% 6.6% 86% 26% 68% 5-Year
New Buffalo Township, Berrien County 2,430 1,020 11% 17% 72% 8.3% 90% 31% 42% 5-Year
Niles City, Berrien County 11,450 4,567 27% 27% 46% 12.0% 88% 25% 53% 5-Year
Niles Township, Berrien County 14,008 5,276 16% 22% 62% 10.4% 89% 19% 49% 5-Year
Oronoko Charter Township, Berrien County 9,151 2,312 21% 24% 55% 8.3% 83% 27% 49% 5-Year
Pipestone Township, Berrien County 2,508 862 14% 14% 72% 9.0% 90% 25% 33% 5-Year
Royalton Township, Berrien County 4,772 1,548 6% 9% 85% 3.9% 94% 20% 30% 5-Year
Sodus Township, Berrien County 1,828 833 9% 23% 68% 13.6% 88% 18% 35% 5-Year
St. Joseph Charter Township, Berrien County 9,953 4,094 4% 17% 79% 6.3% 95% 19% 32% 5-Year
St. Joseph City, Berrien County 8,311 4,013 9% 25% 66% 5.2% 88% 19% 29% 5-Year
Three Oaks Township, Berrien County 2,542 1,063 13% 30% 57% 8.3% 84% 27% 60% 5-Year
Watervliet City, Berrien County 1,773 638 15% 29% 56% 8.9% 92% 19% 43% 5-Year
Watervliet Township, Berrien County 3,083 1,243 20% 25% 55% 11.1% 88% 24% 42% 5-Year
Key Facts and ALICE Statistics for Michigan Municipalities

UNIT
ED W
AY A
LICE
REP
ORT
– 20
17 U
PDAT
E FO
R M
ICHI
GAN
– EX
HIBI
T VI
Municipality by County Population Households Poverty % ALICE % Above ALICE Threshold %
Unemployment Rate
Health Insurance
Coverage %
Housing Burden: Owner Over 30%
Housing Burden: Renter Over 30%
Source, American Community
Survey Estimate
Weesaw Township, Berrien County 1,748 724 9% 28% 63% 8.3% 87% 22% 26% 5-Year
Algansee Township, Branch County 1,980 669 16% 27% 57% 7.1% 74% 23% 47% 5-Year
Batavia Township, Branch County 1,353 518 9% 33% 58% 7.3% 92% 23% 35% 5-Year
Bethel Township, Branch County 1,277 487 17% 24% 59% 10.0% 84% 14% 27% 5-Year
Bronson City, Branch County 2,437 854 25% 34% 41% 12.1% 84% 20% 47% 5-Year
Bronson Township, Branch County 1,270 490 12% 27% 61% 3.7% 92% 21% 29% 5-Year
Butler Township, Branch County 1,323 447 16% 34% 50% 12.2% 79% 23% 50% 5-Year
California Township, Branch County 1,093 329 24% 36% 40% 8.0% 63% 37% 41% 5-Year
Coldwater City, Branch County 10,866 4,079 19% 37% 44% 8.8% 90% 21% 49% 5-Year
Coldwater Township, Branch County 4,875 1,158 8% 35% 57% 4.2% 92% 21% 37% 5-Year
Gilead Township, Branch County 694 266 17% 25% 58% 3.0% 92% 26% 28% 5-Year
Girard Township, Branch County 1,909 787 12% 26% 62% 6.0% 94% 25% 40% 5-Year
Kinderhook Township, Branch County 1,415 658 7% 23% 70% 4.1% 91% 17% 36% 5-Year
Matteson Township, Branch County 1,119 444 14% 23% 63% 6.3% 91% 26% 43% 5-Year
Noble Township, Branch County 562 190 6% 21% 73% 5.1% 87% 14% 6% 5-Year
Ovid Township, Branch County 2,273 994 12% 19% 69% 4.0% 95% 22% 23% 5-Year
Quincy Township, Branch County 4,260 1,670 14% 30% 56% 3.0% 89% 18% 38% 5-Year
Sherwood Township, Branch County 2,152 804 15% 22% 63% 7.9% 88% 20% 38% 5-Year
Union Township, Branch County 2,848 1,178 13% 33% 54% 8.9% 92% 21% 31% 5-Year
Albion City, Calhoun County 8,316 2,894 28% 33% 39% 13.3% 89% 23% 61% 5-Year
Albion Township, Calhoun County 862 373 14% 29% 57% 4.5% 94% 29% 38% 5-Year
Athens Township, Calhoun County 2,522 911 8% 23% 69% 10.0% 89% 24% 33% 5-Year
Battle Creek City, Calhoun County 51,830 20,629 21% 26% 53% 12.1% 90% 27% 52% 5-Year
Bedford Charter Township, Calhoun County 9,377 3,736 10% 22% 68% 15.4% 89% 21% 23% 5-Year
Burlington Township, Calhoun County 1,946 687 8% 20% 72% 7.2% 90% 22% 26% 5-Year
Clarence Township, Calhoun County 2,054 822 11% 20% 69% 6.0% 91% 25% 50% 5-Year
Clarendon Township, Calhoun County 1,271 400 14% 17% 69% 11.7% 89% 27% 61% 5-Year
Convis Township, Calhoun County 1,546 607 14% 20% 66% 10.6% 92% 28% 29% 5-Year
Eckford Township, Calhoun County 1,422 525 3% 24% 73% 5.9% 92% 25% 33% 5-Year
Emmett Charter Township, Calhoun County 11,669 4,704 14% 21% 65% 7.3% 89% 20% 40% 5-Year
Fredonia Township, Calhoun County 1,510 615 10% 21% 69% 2.2% 94% 18% 22% 5-Year
Homer Township, Calhoun County 2,970 1,086 19% 27% 54% 9.6% 88% 19% 48% 5-Year
Lee Township, Calhoun County 1,011 356 9% 21% 70% 11.5% 90% 26% 69% 5-Year
Leroy Township, Calhoun County 3,696 1,438 7% 16% 77% 4.1% 91% 16% 66% 5-Year
Marengo Township, Calhoun County 2,274 863 8% 21% 71% 8.1% 93% 24% 41% 5-Year
Marshall City, Calhoun County 7,038 3,074 10% 25% 65% 4.9% 91% 31% 30% 5-Year
Marshall Township, Calhoun County 3,103 1,204 3% 19% 78% 2.6% 97% 18% 45% 5-Year
Newton Township, Calhoun County 2,541 914 11% 15% 74% 5.3% 91% 26% 55% 5-Year
Pennfield Charter Township, Calhoun County 8,932 3,686 14% 26% 60% 5.3% 93% 19% 63% 5-Year
Sheridan Township, Calhoun County 2,064 723 20% 22% 58% 8.6% 89% 30% 43% 5-Year
Springfield City, Calhoun County 5,216 1,994 25% 27% 48% 16.2% 84% 23% 43% 5-Year
Tekonsha Township, Calhoun County 1,620 609 21% 15% 64% 8.6% 90% 23% 56% 5-Year
Calvin Township, Cass County 1,749 700 15% 29% 56% 7.3% 93% 34% 73% 5-Year
Dowagiac City, Cass County 5,866 2,187 33% 37% 30% 20.2% 84% 39% 58% 5-Year
Howard Township, Cass County 6,169 2,524 10% 27% 63% 11.5% 90% 18% 40% 5-Year
Jefferson Township, Cass County 2,532 906 11% 20% 69% 8.5% 92% 28% 28% 5-Year
Lagrange Township, Cass County 3,456 1,398 21% 33% 46% 13.1% 86% 34% 40% 5-Year
Marcellus Township, Cass County 2,458 884 13% 28% 59% 7.7% 91% 28% 31% 5-Year
Mason Township, Cass County 2,916 997 12% 29% 59% 10.8% 80% 24% 19% 5-Year
Milton Township, Cass County 3,866 1,449 4% 28% 68% 9.2% 92% 23% 17% 5-Year

UNIT
ED W
AY A
LICE
REP
ORT
– 20
17 U
PDAT
E FO
R M
ICHI
GAN
– EX
HIBI
T VI
Municipality by County Population Households Poverty % ALICE % Above ALICE Threshold %
Unemployment Rate
Health Insurance
Coverage %
Housing Burden: Owner Over 30%
Housing Burden: Renter Over 30%
Source, American Community
Survey Estimate
Newberg Township, Cass County 1,488 596 10% 27% 63% 5.9% 91% 25% 23% 5-Year
Ontwa Township, Cass County 6,531 2,477 10% 28% 62% 6.0% 88% 22% 48% 5-Year
Penn Township, Cass County 1,994 753 14% 21% 65% 6.4% 86% 27% 45% 5-Year
Pokagon Township, Cass County 2,198 880 8% 38% 54% 12.3% 88% 29% 14% 5-Year
Porter Township, Cass County 3,795 1,574 14% 20% 66% 4.1% 91% 28% 31% 5-Year
Silver Creek Township, Cass County 3,188 1,277 9% 26% 65% 9.4% 94% 19% 33% 5-Year
Volinia Township, Cass County 1,120 428 9% 26% 65% 9.6% 88% 25% 23% 5-Year
Wayne Township, Cass County 2,626 1,071 10% 36% 54% 5.0% 93% 26% 16% 5-Year
Bay Township, Charlevoix County 1,231 493 8% 14% 78% 4.3% 92% 24% 27% 5-Year
Boyne City, Charlevoix County 3,766 1,628 15% 29% 56% 6.6% 90% 28% 52% 5-Year
Boyne Valley Township, Charlevoix County 1,369 536 9% 26% 65% 6.7% 90% 22% 20% 5-Year
Chandler Township, Charlevoix County 267 112 14% 21% 65% 4.9% 97% 32% 0% 5-Year
Charlevoix City, Charlevoix County 2,523 1,333 18% 36% 46% 5.0% 95% 16% 46% 5-Year
Charlevoix Township, Charlevoix County 1,557 607 11% 22% 67% 10.7% 93% 31% 49% 5-Year
East Jordan City, Charlevoix County 2,474 959 15% 40% 45% 10.2% 85% 24% 30% 5-Year
Evangeline Township, Charlevoix County 762 325 17% 19% 64% 16.5% 92% 28% 54% 5-Year
Eveline Township, Charlevoix County 1,467 639 6% 23% 71% 7.4% 93% 29% 25% 5-Year
Hayes Township, Charlevoix County 1,981 771 8% 23% 69% 9.0% 91% 31% 24% 5-Year
Hudson Township, Charlevoix County 654 257 12% 21% 67% 6.9% 87% 22% 29% 5-Year
Marion Township, Charlevoix County 1,538 629 6% 25% 69% 7.1% 89% 26% 56% 5-Year
Melrose Township, Charlevoix County 1,374 513 11% 33% 56% 9.0% 86% 31% 34% 5-Year
Norwood Township, Charlevoix County 826 320 8% 21% 71% 5.5% 89% 34% 58% 5-Year
Peaine Township, Charlevoix County 272 128 5% 19% 76% 9.7% 87% 26% ? 5-Year
South Arm Township, Charlevoix County 1,816 668 9% 28% 63% 7.5% 90% 23% 38% 5-Year
St. James Township, Charlevoix County 312 141 9% 38% 53% 11.6% 93% 42% 29% 5-Year
Wilson Township, Charlevoix County 1,945 735 11% 21% 68% 9.2% 90% 26% 80% 5-Year
Aloha Township, Cheboygan County 909 418 11% 24% 65% 8.5% 92% 25% 22% 5-Year
Beaugrand Township, Cheboygan County 1,314 534 14% 27% 59% 17.3% 91% 27% 36% 5-Year
Benton Township, Cheboygan County 3,156 1,448 13% 21% 66% 12.9% 85% 22% 39% 5-Year
Burt Township, Cheboygan County 717 370 9% 17% 74% 15.1% 90% 30% 20% 5-Year
Cheboygan City, Cheboygan County 4,783 1,959 32% 29% 39% 19.8% 86% 33% 38% 5-Year
Ellis Township, Cheboygan County 542 227 16% 23% 61% 6.6% 89% 30% 20% 5-Year
Forest Township, Cheboygan County 1,001 451 21% 30% 49% 17.1% 86% 17% 40% 5-Year
Grant Township, Cheboygan County 757 344 7% 17% 76% 7.9% 89% 23% 35% 5-Year
Hebron Township, Cheboygan County 298 116 18% 12% 70% 9.2% 89% 31% 39% 5-Year
Inverness Township, Cheboygan County 2,300 1,001 19% 16% 65% 8.2% 88% 18% 48% 5-Year
Koehler Township, Cheboygan County 1,135 439 19% 16% 65% 10.9% 89% 20% 55% 5-Year
Mackinaw Township, Cheboygan County 418 210 2% 37% 61% 30.0% 90% 19% 51% 5-Year
Mentor Township, Cheboygan County 826 362 13% 20% 67% 9.2% 83% 28% 31% 5-Year
Mullett Township, Cheboygan County 1,249 533 13% 17% 70% 9.6% 86% 27% 30% 5-Year
Munro Township, Cheboygan County 587 304 7% 24% 69% 11.0% 92% 27% 56% 5-Year
Nunda Township, Cheboygan County 1,117 483 18% 23% 59% 13.8% 83% 33% 35% 5-Year
Tuscarora Township, Cheboygan County 3,001 1,391 16% 22% 62% 13.6% 83% 20% 32% 5-Year
Walker Township, Cheboygan County 366 115 22% 25% 53% 26.5% 92% 23% 31% 5-Year
Waverly Township, Cheboygan County 475 222 14% 16% 70% 15.1% 84% 18% 0% 5-Year
Key Facts and ALICE Statistics for Michigan Municipalities

UNIT
ED W
AY A
LICE
REP
ORT
– 20
17 U
PDAT
E FO
R M
ICHI
GAN
– EX
HIBI
T VI
Municipality by County Population Households Poverty % ALICE % Above ALICE Threshold %
Unemployment Rate
Health Insurance
Coverage %
Housing Burden: Owner Over 30%
Housing Burden: Renter Over 30%
Source, American Community
Survey Estimate
Wilmot Township, Cheboygan County 739 296 16% 32% 52% 15.8% 88% 26% 43% 5-Year
Bay Mills Township, Chippewa County 1,593 603 16% 25% 59% 14.9% 92% 20% 42% 5-Year
Bruce Township, Chippewa County 2,185 860 5% 28% 67% 4.1% 92% 21% 21% 5-Year
Dafter Township, Chippewa County 1,321 437 11% 21% 68% 12.1% 90% 19% 68% 5-Year
Detour Township, Chippewa County 721 378 12% 42% 46% 16.1% 90% 30% 2% 5-Year
Drummond Township, Chippewa County 1,126 554 7% 36% 57% 18.3% 80% 33% 43% 5-Year
Kinross Charter Township, Chippewa County 7,661 1,476 26% 26% 48% 15.0% 85% 21% 37% 5-Year
Pickford Township, Chippewa County 1,926 754 12% 31% 57% 9.5% 93% 20% 22% 5-Year
Raber Township, Chippewa County 627 291 14% 38% 48% 19.9% 94% 23% 10% 5-Year
Rudyard Township, Chippewa County 1,211 451 3% 27% 70% 9.3% 90% 22% 4% 5-Year
Sault Ste. Marie City, Chippewa County 14,048 5,666 24% 36% 40% 11.7% 87% 20% 50% 5-Year
Soo Township, Chippewa County 3,157 1,197 5% 22% 73% 9.2% 94% 14% 31% 5-Year
Sugar Island Township, Chippewa County 670 303 10% 24% 66% 12.5% 87% 21% 63% 5-Year
Superior Township, Chippewa County 1,203 497 10% 31% 59% 8.4% 90% 18% 76% 5-Year
Trout Lake Township, Chippewa County 402 192 15% 36% 49% 25.1% 83% 16% 83% 5-Year
Whitefish Township, Chippewa County 475 221 14% 37% 49% 11.8% 84% 17% 41% 5-Year
Arthur Township, Clare County 716 263 11% 19% 70% 18.8% 92% 28% 31% 5-Year
Clare City, Clare County 3,042 1,417 36% 25% 39% 9.0% 85% 27% 54% 5-Year
Franklin Township, Clare County 744 350 21% 29% 50% 15.1% 92% 30% 63% 5-Year
Freeman Township, Clare County 1,001 480 16% 35% 49% 17.3% 86% 22% 56% 5-Year
Frost Township, Clare County 997 487 25% 28% 47% 16.7% 89% 39% 24% 5-Year
Garfield Township, Clare County 1,990 853 19% 26% 55% 15.3% 90% 26% 55% 5-Year
Grant Township, Clare County 3,247 1,255 17% 19% 64% 7.4% 86% 25% 48% 5-Year
Greenwood Township, Clare County 1,147 497 16% 26% 58% 11.5% 72% 27% 35% 5-Year
Hamilton Township, Clare County 1,899 887 24% 36% 40% 17.5% 86% 36% 68% 5-Year
Harrison City, Clare County 2,011 895 34% 26% 40% 14.5% 93% 34% 55% 5-Year
Hatton Township, Clare County 952 361 22% 17% 61% 10.6% 85% 24% 52% 5-Year
Hayes Township, Clare County 4,639 2,085 26% 39% 35% 17.0% 83% 40% 54% 5-Year
Lincoln Township, Clare County 1,940 772 28% 30% 42% 26.4% 88% 35% 63% 5-Year
Redding Township, Clare County 409 191 32% 27% 41% 1.6% 95% 43% 45% 5-Year
Sheridan Township, Clare County 1,444 493 7% 28% 65% 1.4% 69% 22% 9% 5-Year
Summerfield Township, Clare County 496 223 18% 39% 43% 28.8% 91% 33% 39% 5-Year
Surrey Township, Clare County 3,558 1,550 26% 30% 44% 11.0% 88% 24% 60% 5-Year
Winterfield Township, Clare County 478 196 15% 28% 57% 4.3% 91% 20% 38% 5-Year
Bath Charter Township, Clinton County 11,952 4,465 17% 18% 65% 7.6% 90% 18% 61% 5-Year
Bengal Township, Clinton County 1,198 381 3% 20% 77% 4.1% 98% 17% 0% 5-Year
Bingham Township, Clinton County 2,888 1,070 9% 26% 65% 8.4% 96% 19% 61% 5-Year
Dallas Township, Clinton County 2,260 805 8% 22% 70% 4.3% 97% 17% 42% 5-Year
Dewitt Charter Township, Clinton County 14,599 5,794 10% 23% 67% 5.8% 92% 19% 50% 5-Year
Dewitt City, Clinton County 4,631 1,698 4% 23% 73% 3.7% 96% 18% 32% 5-Year
Duplain Township, Clinton County 2,315 848 9% 31% 60% 11.2% 89% 19% 28% 5-Year
Eagle Township, Clinton County 2,720 983 5% 9% 86% 3.2% 95% 12% 28% 5-Year
East Lansing City, Clinton County 2,142 758 22% 17% 61% 8.7% 95% 29% 53% 5-Year
Essex Township, Clinton County 1,857 707 8% 20% 72% 9.0% 93% 19% 15% 5-Year
Greenbush Township, Clinton County 2,097 819 10% 25% 65% 11.8% 91% 23% 33% 5-Year
Lebanon Township, Clinton County 678 230 6% 22% 72% 6.2% 86% 15% 6% 5-Year
Olive Township, Clinton County 2,524 997 7% 17% 76% 5.9% 97% 25% 32% 5-Year
Ovid Township, Clinton County 3,828 1,341 11% 26% 63% 5.7% 89% 19% 44% 5-Year
Riley Township, Clinton County 2,262 711 3% 14% 83% 6.3% 93% 14% 14% 5-Year

UNIT
ED W
AY A
LICE
REP
ORT
– 20
17 U
PDAT
E FO
R M
ICHI
GAN
– EX
HIBI
T VI
Municipality by County Population Households Poverty % ALICE % Above ALICE Threshold %
Unemployment Rate
Health Insurance
Coverage %
Housing Burden: Owner Over 30%
Housing Burden: Renter Over 30%
Source, American Community
Survey Estimate
St. Johns City, Clinton County 7,954 3,210 18% 35% 47% 6.7% 93% 28% 45% 5-Year
Victor Township, Clinton County 3,518 1,334 7% 17% 76% 5.9% 95% 19% 32% 5-Year
Watertown Charter Township, Clinton County 5,083 1,883 2% 15% 83% 8.1% 97% 16% 13% 5-Year
Westphalia Township, Clinton County 2,399 823 3% 23% 74% 1.5% 98% 15% 22% 5-Year
Beaver Creek Township, Crawford County 1,736 749 16% 25% 59% 11.4% 91% 22% 59% 5-Year
Frederic Township, Crawford County 1,453 597 14% 24% 62% 13.7% 91% 26% 45% 5-Year
Grayling Charter Township, Crawford County 5,739 2,507 10% 24% 66% 11.7% 92% 20% 44% 5-Year
Grayling City, Crawford County 1,834 697 27% 30% 43% 15.9% 87% 26% 46% 5-Year
Lovells Township, Crawford County 550 292 9% 26% 65% 10.8% 94% 33% 41% 5-Year
Maple Forest Township, Crawford County 731 271 9% 22% 69% 10.5% 95% 37% 21% 5-Year
South Branch Township, Crawford County 1,852 841 13% 23% 64% 8.9% 91% 27% 60% 5-Year
Baldwin Township, Delta County 705 309 11% 30% 59% 14.6% 79% 25% 13% 5-Year
Bark River Township, Delta County 1,498 569 15% 22% 63% 4.6% 89% 21% 63% 5-Year
Bay De Noc Township, Delta County 297 147 10% 32% 58% 12.2% 90% 32% 0% 5-Year
Brampton Township, Delta County 947 423 5% 21% 74% 7.7% 93% 16% 67% 5-Year
Cornell Township, Delta County 521 211 13% 30% 57% 14.7% 91% 25% 43% 5-Year
Ensign Township, Delta County 825 368 13% 19% 68% 7.3% 89% 26% 30% 5-Year
Escanaba City, Delta County 12,468 5,693 26% 34% 40% 11.1% 84% 26% 53% 5-Year
Escanaba Township, Delta County 3,451 1,417 8% 11% 81% 11.6% 96% 12% 0% 5-Year
Fairbanks Township, Delta County 296 141 15% 34% 51% 14.1% 88% 21% 0% 5-Year
Ford River Township, Delta County 2,181 912 7% 22% 71% 10.4% 94% 18% 25% 5-Year
Garden Township, Delta County 752 354 11% 27% 62% 10.9% 93% 23% 32% 5-Year
Gladstone City, Delta County 4,902 2,032 14% 30% 56% 5.7% 89% 22% 37% 5-Year
Maple Ridge Township, Delta County 735 323 11% 34% 55% 11.5% 86% 27% 56% 5-Year
Masonville Township, Delta County 1,805 715 14% 26% 60% 10.8% 91% 17% 45% 5-Year
Nahma Township, Delta County 478 221 17% 29% 54% 9.7% 84% 32% 7% 5-Year
Wells Township, Delta County 4,851 1,850 12% 20% 68% 4.7% 95% 18% 47% 5-Year
Breen Township, Dickinson County 564 198 20% 22% 58% 5.1% 94% 31% 45% 5-Year
Breitung Charter Township, Dickinson County 5,831 2,340 12% 16% 72% 4.1% 91% 19% 11% 5-Year
Felch Township, Dickinson County 747 296 10% 24% 66% 4.5% 91% 15% 41% 5-Year
Iron Mountain City, Dickinson County 7,571 3,121 13% 32% 55% 4.6% 91% 23% 37% 5-Year
Kingsford City, Dickinson County 5,104 2,281 15% 30% 55% 6.9% 89% 18% 40% 5-Year
Norway City, Dickinson County 2,820 1,330 18% 20% 62% 20.2% 95% 15% 44% 5-Year
Norway Township, Dickinson County 1,591 658 12% 15% 73% 1.9% 95% 13% 33% 5-Year
Sagola Township, Dickinson County 991 478 18% 22% 60% 10.8% 91% 34% 53% 5-Year
Waucedah Township, Dickinson County 748 343 6% 20% 74% 4.8% 96% 26% 18% 5-Year
Bellevue Township, Eaton County 3,135 1,273 6% 28% 66% 12.0% 88% 22% 49% 5-Year
Benton Township, Eaton County 2,802 1,066 8% 9% 83% 8.7% 95% 22% 28% 5-Year
Brookfield Township, Eaton County 1,672 597 11% 18% 71% 4.4% 93% 24% 47% 5-Year
Carmel Township, Eaton County 2,875 1,116 10% 13% 77% 10.7% 96% 24% 52% 5-Year
Charlotte City, Eaton County 9,057 3,564 19% 24% 57% 8.6% 89% 17% 43% 5-Year
Chester Township, Eaton County 1,885 681 9% 15% 76% 5.0% 92% 22% 45% 5-Year
Delta Charter Township, Eaton County 32,815 14,288 8% 22% 70% 6.8% 92% 17% 41% 5-Year
Eaton Rapids City, Eaton County 5,221 1,958 18% 29% 53% 13.2% 90% 26% 48% 5-Year
Eaton Rapids Township, Eaton County 4,129 1,523 2% 13% 85% 3.6% 96% 20% 53% 5-Year
Eaton Township, Eaton County 4,102 1,472 7% 11% 82% 6.6% 92% 22% 27% 5-Year
Key Facts and ALICE Statistics for Michigan Municipalities
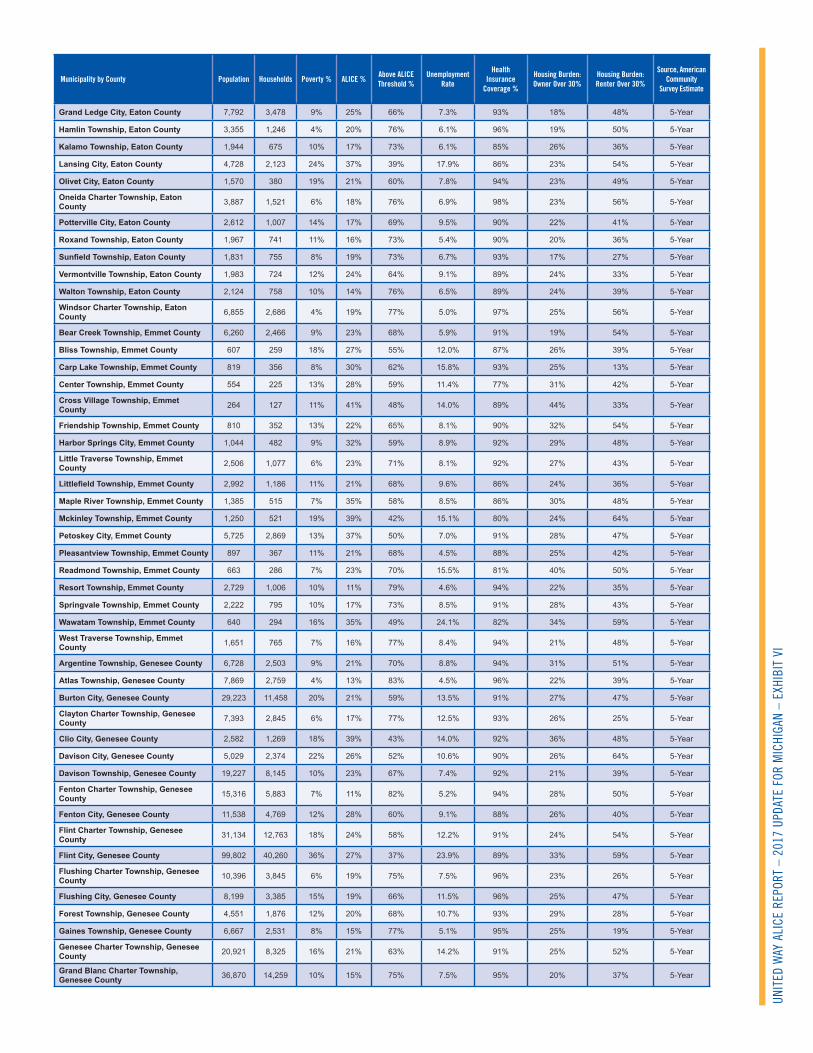
UNIT
ED W
AY A
LICE
REP
ORT
– 20
17 U
PDAT
E FO
R M
ICHI
GAN
– EX
HIBI
T VI
Municipality by County Population Households Poverty % ALICE % Above ALICE Threshold %
Unemployment Rate
Health Insurance
Coverage %
Housing Burden: Owner Over 30%
Housing Burden: Renter Over 30%
Source, American Community
Survey Estimate
Grand Ledge City, Eaton County 7,792 3,478 9% 25% 66% 7.3% 93% 18% 48% 5-Year
Hamlin Township, Eaton County 3,355 1,246 4% 20% 76% 6.1% 96% 19% 50% 5-Year
Kalamo Township, Eaton County 1,944 675 10% 17% 73% 6.1% 85% 26% 36% 5-Year
Lansing City, Eaton County 4,728 2,123 24% 37% 39% 17.9% 86% 23% 54% 5-Year
Olivet City, Eaton County 1,570 380 19% 21% 60% 7.8% 94% 23% 49% 5-Year
Oneida Charter Township, Eaton County 3,887 1,521 6% 18% 76% 6.9% 98% 23% 56% 5-Year
Potterville City, Eaton County 2,612 1,007 14% 17% 69% 9.5% 90% 22% 41% 5-Year
Roxand Township, Eaton County 1,967 741 11% 16% 73% 5.4% 90% 20% 36% 5-Year
Sunfield Township, Eaton County 1,831 755 8% 19% 73% 6.7% 93% 17% 27% 5-Year
Vermontville Township, Eaton County 1,983 724 12% 24% 64% 9.1% 89% 24% 33% 5-Year
Walton Township, Eaton County 2,124 758 10% 14% 76% 6.5% 89% 24% 39% 5-Year
Windsor Charter Township, Eaton County 6,855 2,686 4% 19% 77% 5.0% 97% 25% 56% 5-Year
Bear Creek Township, Emmet County 6,260 2,466 9% 23% 68% 5.9% 91% 19% 54% 5-Year
Bliss Township, Emmet County 607 259 18% 27% 55% 12.0% 87% 26% 39% 5-Year
Carp Lake Township, Emmet County 819 356 8% 30% 62% 15.8% 93% 25% 13% 5-Year
Center Township, Emmet County 554 225 13% 28% 59% 11.4% 77% 31% 42% 5-Year
Cross Village Township, Emmet County 264 127 11% 41% 48% 14.0% 89% 44% 33% 5-Year
Friendship Township, Emmet County 810 352 13% 22% 65% 8.1% 90% 32% 54% 5-Year
Harbor Springs City, Emmet County 1,044 482 9% 32% 59% 8.9% 92% 29% 48% 5-Year
Little Traverse Township, Emmet County 2,506 1,077 6% 23% 71% 8.1% 92% 27% 43% 5-Year
Littlefield Township, Emmet County 2,992 1,186 11% 21% 68% 9.6% 86% 24% 36% 5-Year
Maple River Township, Emmet County 1,385 515 7% 35% 58% 8.5% 86% 30% 48% 5-Year
Mckinley Township, Emmet County 1,250 521 19% 39% 42% 15.1% 80% 24% 64% 5-Year
Petoskey City, Emmet County 5,725 2,869 13% 37% 50% 7.0% 91% 28% 47% 5-Year
Pleasantview Township, Emmet County 897 367 11% 21% 68% 4.5% 88% 25% 42% 5-Year
Readmond Township, Emmet County 663 286 7% 23% 70% 15.5% 81% 40% 50% 5-Year
Resort Township, Emmet County 2,729 1,006 10% 11% 79% 4.6% 94% 22% 35% 5-Year
Springvale Township, Emmet County 2,222 795 10% 17% 73% 8.5% 91% 28% 43% 5-Year
Wawatam Township, Emmet County 640 294 16% 35% 49% 24.1% 82% 34% 59% 5-Year
West Traverse Township, Emmet County 1,651 765 7% 16% 77% 8.4% 94% 21% 48% 5-Year
Argentine Township, Genesee County 6,728 2,503 9% 21% 70% 8.8% 94% 31% 51% 5-Year
Atlas Township, Genesee County 7,869 2,759 4% 13% 83% 4.5% 96% 22% 39% 5-Year
Burton City, Genesee County 29,223 11,458 20% 21% 59% 13.5% 91% 27% 47% 5-Year
Clayton Charter Township, Genesee County 7,393 2,845 6% 17% 77% 12.5% 93% 26% 25% 5-Year
Clio City, Genesee County 2,582 1,269 18% 39% 43% 14.0% 92% 36% 48% 5-Year
Davison City, Genesee County 5,029 2,374 22% 26% 52% 10.6% 90% 26% 64% 5-Year
Davison Township, Genesee County 19,227 8,145 10% 23% 67% 7.4% 92% 21% 39% 5-Year
Fenton Charter Township, Genesee County 15,316 5,883 7% 11% 82% 5.2% 94% 28% 50% 5-Year
Fenton City, Genesee County 11,538 4,769 12% 28% 60% 9.1% 88% 26% 40% 5-Year
Flint Charter Township, Genesee County 31,134 12,763 18% 24% 58% 12.2% 91% 24% 54% 5-Year
Flint City, Genesee County 99,802 40,260 36% 27% 37% 23.9% 89% 33% 59% 5-Year
Flushing Charter Township, Genesee County 10,396 3,845 6% 19% 75% 7.5% 96% 23% 26% 5-Year
Flushing City, Genesee County 8,199 3,385 15% 19% 66% 11.5% 96% 25% 47% 5-Year
Forest Township, Genesee County 4,551 1,876 12% 20% 68% 10.7% 93% 29% 28% 5-Year
Gaines Township, Genesee County 6,667 2,531 8% 15% 77% 5.1% 95% 25% 19% 5-Year
Genesee Charter Township, Genesee County 20,921 8,325 16% 21% 63% 14.2% 91% 25% 52% 5-Year
Grand Blanc Charter Township, Genesee County 36,870 14,259 10% 15% 75% 7.5% 95% 20% 37% 5-Year

UNIT
ED W
AY A
LICE
REP
ORT
– 20
17 U
PDAT
E FO
R M
ICHI
GAN
– EX
HIBI
T VI
Municipality by County Population Households Poverty % ALICE % Above ALICE Threshold %
Unemployment Rate
Health Insurance
Coverage %
Housing Burden: Owner Over 30%
Housing Burden: Renter Over 30%
Source, American Community
Survey Estimate
Grand Blanc City, Genesee County 8,088 3,422 16% 18% 66% 9.7% 94% 19% 57% 5-Year
Linden City, Genesee County 3,886 1,523 4% 24% 72% 6.0% 96% 24% 34% 5-Year
Montrose Charter Township, Genesee County 6,081 2,111 13% 18% 69% 11.9% 92% 22% 55% 5-Year
Montrose City, Genesee County 1,659 623 19% 25% 56% 19.3% 90% 29% 46% 5-Year
Mount Morris City, Genesee County 3,003 1,168 37% 34% 29% 27.9% 91% 36% 63% 5-Year
Mount Morris Township, Genesee County 20,960 8,036 26% 26% 48% 18.3% 89% 31% 70% 5-Year
Mundy Township, Genesee County 14,819 6,076 8% 17% 75% 5.6% 94% 26% 40% 5-Year
Richfield Township, Genesee County 8,499 3,092 7% 16% 77% 9.2% 94% 22% 15% 5-Year
Swartz Creek City, Genesee County 5,632 2,325 11% 23% 66% 11.5% 95% 26% 43% 5-Year
Thetford Township, Genesee County 6,850 2,674 14% 18% 68% 15.3% 87% 28% 49% 5-Year
Vienna Charter Township, Genesee County 12,952 4,969 9% 20% 71% 10.0% 90% 23% 53% 5-Year
Beaverton City, Gladwin County 1,019 504 33% 31% 36% 13.8% 90% 36% 50% 5-Year
Beaverton Township, Gladwin County 1,956 766 16% 27% 57% 7.6% 90% 26% 37% 5-Year
Bentley Township, Gladwin County 826 344 8% 27% 65% 4.1% 89% 23% 0% 5-Year
Billings Township, Gladwin County 2,210 1,087 17% 36% 47% 11.2% 95% 28% 48% 5-Year
Bourret Township, Gladwin County 413 191 9% 35% 56% 6.5% 92% 31% 57% 5-Year
Buckeye Township, Gladwin County 1,467 562 26% 24% 50% 13.3% 83% 31% 71% 5-Year
Butman Township, Gladwin County 1,805 894 14% 26% 60% 14.1% 94% 23% 39% 5-Year
Clement Township, Gladwin County 823 399 13% 31% 56% 7.2% 94% 25% 46% 5-Year
Gladwin City, Gladwin County 2,904 1,298 29% 35% 36% 7.5% 93% 35% 48% 5-Year
Gladwin Township, Gladwin County 1,287 433 22% 25% 53% 15.7% 64% 31% 18% 5-Year
Grout Township, Gladwin County 1,971 660 16% 19% 65% 11.8% 70% 18% 28% 5-Year
Hay Township, Gladwin County 1,229 581 25% 31% 44% 18.3% 85% 36% 41% 5-Year
Sage Township, Gladwin County 2,772 1,035 16% 26% 58% 13.2% 77% 26% 21% 5-Year
Secord Township, Gladwin County 1,136 592 8% 30% 62% 6.0% 96% 33% 26% 5-Year
Sherman Township, Gladwin County 1,001 468 24% 28% 48% 11.4% 92% 29% 57% 5-Year
Tobacco Township, Gladwin County 2,551 1,094 10% 25% 65% 10.4% 94% 20% 44% 5-Year
Bessemer City, Gogebic County 1,935 857 18% 32% 50% 7.6% 86% 14% 38% 5-Year
Bessemer Township, Gogebic County 1,084 501 11% 29% 60% 10.4% 85% 24% 34% 5-Year
Erwin Township, Gogebic County 366 153 10% 26% 64% 5.6% 88% 17% 38% 5-Year
Ironwood Charter Township, Gogebic County 2,240 950 16% 17% 67% 7.8% 90% 16% 48% 5-Year
Ironwood City, Gogebic County 5,153 2,490 25% 36% 39% 12.1% 84% 23% 42% 5-Year
Marenisco Township, Gogebic County 1,747 250 11% 29% 60% 4.7% 90% 23% 31% 5-Year
Wakefield City, Gogebic County 1,729 771 22% 20% 58% 8.0% 89% 20% 49% 5-Year
Wakefield Township, Gogebic County 295 149 15% 36% 49% 8.3% 88% 28% 11% 5-Year
Watersmeet Township, Gogebic County 1,275 620 10% 21% 69% 8.5% 90% 24% 33% 5-Year
Acme Township, Grand Traverse County 4,557 1,875 6% 15% 79% 3.6% 93% 17% 35% 5-Year
Blair Township, Grand Traverse County 8,489 2,944 11% 39% 50% 10.1% 87% 31% 47% 5-Year
East Bay Township, Grand Traverse County 11,115 4,318 6% 25% 69% 9.3% 88% 24% 33% 5-Year
Fife Lake Township, Grand Traverse County 2,822 529 11% 32% 57% 2.6% 90% 24% 57% 5-Year
Garfield Charter Township, Grand Traverse County 16,673 7,033 13% 32% 55% 5.6% 91% 26% 51% 5-Year
Grant Township, Grand Traverse County 1,071 427 7% 32% 61% 5.6% 90% 32% 34% 5-Year
Green Lake Township, Grand Traverse County 6,016 2,107 9% 22% 69% 4.9% 83% 20% 34% 5-Year
Long Lake Township, Grand Traverse County 9,023 3,529 9% 20% 71% 5.2% 91% 29% 47% 5-Year
Key Facts and ALICE Statistics for Michigan Municipalities

UNIT
ED W
AY A
LICE
REP
ORT
– 20
17 U
PDAT
E FO
R M
ICHI
GAN
– EX
HIBI
T VI
Municipality by County Population Households Poverty % ALICE % Above ALICE Threshold %
Unemployment Rate
Health Insurance
Coverage %
Housing Burden: Owner Over 30%
Housing Burden: Renter Over 30%
Source, American Community
Survey Estimate
Mayfield Township, Grand Traverse County 1,733 534 13% 22% 65% 9.4% 87% 32% 38% 5-Year
Paradise Township, Grand Traverse County 4,880 1,689 8% 32% 60% 8.0% 92% 17% 65% 5-Year
Peninsula Township, Grand Traverse County 5,658 2,603 7% 14% 79% 4.8% 98% 29% 39% 5-Year
Traverse City, Grand Traverse County 14,820 6,375 15% 29% 56% 6.5% 91% 31% 47% 5-Year
Union Township, Grand Traverse County 342 143 13% 20% 67% 9.4% 86% 26% 33% 5-Year
Whitewater Township, Grand Traverse County 2,708 976 5% 16% 79% 5.1% 91% 31% 24% 5-Year
Alma City, Gratiot County 9,264 3,423 27% 32% 41% 11.7% 91% 23% 55% 5-Year
Arcada Township, Gratiot County 1,821 748 21% 20% 59% 8.9% 89% 19% 58% 5-Year
Bethany Township, Gratiot County 1,252 514 15% 20% 65% 4.7% 91% 22% 66% 5-Year
Elba Township, Gratiot County 1,254 483 12% 32% 56% 12.3% 89% 26% 24% 5-Year
Emerson Township, Gratiot County 961 354 9% 28% 63% 3.8% 91% 26% 28% 5-Year
Fulton Township, Gratiot County 2,529 901 10% 23% 67% 4.2% 90% 16% 34% 5-Year
Hamilton Township, Gratiot County 399 185 15% 33% 52% 6.3% 91% 23% 23% 5-Year
Ithaca City, Gratiot County 2,856 1,210 13% 38% 49% 6.5% 93% 22% 49% 5-Year
Lafayette Township, Gratiot County 502 216 8% 22% 70% 6.4% 90% 22% 26% 5-Year
New Haven Township, Gratiot County 1,026 413 8% 35% 57% 5.5% 93% 23% 28% 5-Year
Newark Township, Gratiot County 1,251 435 9% 26% 65% 1.5% 83% 14% 33% 5-Year
North Shade Township, Gratiot County 577 238 15% 21% 64% 6.6% 89% 23% 16% 5-Year
North Star Township, Gratiot County 952 360 11% 28% 61% 5.4% 88% 22% 39% 5-Year
Pine River Township, Gratiot County 2,140 878 13% 31% 56% 13.4% 94% 17% 50% 5-Year
Seville Township, Gratiot County 2,153 812 24% 20% 56% 4.5% 92% 31% 21% 5-Year
St. Louis City, Gratiot County 7,355 1,310 20% 38% 42% 8.0% 91% 13% 49% 5-Year
Sumner Township, Gratiot County 1,922 738 16% 31% 53% 12.2% 84% 23% 62% 5-Year
Washington Township, Gratiot County 915 354 11% 27% 62% 8.8% 94% 20% 43% 5-Year
Wheeler Township, Gratiot County 2,749 1,144 20% 31% 49% 9.4% 93% 29% 48% 5-Year
Adams Township, Hillsdale County 2,290 972 13% 31% 56% 9.3% 91% 22% 32% 5-Year
Allen Township, Hillsdale County 1,528 609 14% 26% 60% 10.0% 86% 23% 32% 5-Year
Amboy Township, Hillsdale County 1,027 444 14% 22% 64% 3.2% 91% 34% 25% 5-Year
Cambria Township, Hillsdale County 2,463 989 18% 18% 64% 6.3% 78% 17% 41% 5-Year
Camden Township, Hillsdale County 2,180 716 18% 23% 59% 7.4% 77% 27% 49% 5-Year
Fayette Township, Hillsdale County 902 341 10% 30% 60% 0.0% 90% 33% 0% 5-Year
Hillsdale City, Hillsdale County 8,203 2,930 27% 32% 41% 10.4% 92% 26% 43% 5-Year
Hillsdale Township, Hillsdale County 2,030 812 11% 13% 76% 5.4% 93% 18% 18% 5-Year
Jefferson Township, Hillsdale County 3,015 1,217 17% 23% 60% 4.4% 91% 29% 58% 5-Year
Litchfield City, Hillsdale County 1,281 529 27% 23% 50% 13.9% 91% 21% 44% 5-Year
Litchfield Township, Hillsdale County 1,047 402 9% 27% 64% 5.2% 90% 28% 48% 5-Year
Moscow Township, Hillsdale County 1,298 547 12% 25% 63% 10.0% 89% 26% 61% 5-Year
Pittsford Township, Hillsdale County 1,415 580 7% 26% 67% 7.9% 88% 20% 48% 5-Year
Ransom Township, Hillsdale County 933 328 17% 18% 65% 9.4% 79% 21% 34% 5-Year
Reading City, Hillsdale County 1,215 412 33% 24% 43% 21.1% 84% 28% 58% 5-Year
Reading Township, Hillsdale County 1,862 732 14% 21% 65% 12.5% 77% 25% 12% 5-Year
Scipio Township, Hillsdale County 1,757 633 13% 26% 61% 6.9% 91% 24% 30% 5-Year
Somerset Township, Hillsdale County 4,592 2,108 12% 20% 68% 10.0% 91% 27% 38% 5-Year
Wheatland Township, Hillsdale County 1,423 522 11% 21% 68% 8.2% 89% 38% 42% 5-Year
Woodbridge Township, Hillsdale County 1,671 439 27% 21% 52% 10.3% 56% 33% 55% 5-Year
Wright Township, Hillsdale County 1,873 656 25% 22% 53% 15.4% 85% 23% 44% 5-Year
Adams Township, Houghton County 2,548 898 11% 35% 54% 8.3% 92% 18% 51% 5-Year
Calumet Charter Township, Houghton County 6,442 2,602 21% 38% 41% 10.9% 89% 17% 54% 5-Year

UNIT
ED W
AY A
LICE
REP
ORT
– 20
17 U
PDAT
E FO
R M
ICHI
GAN
– EX
HIBI
T VI
Municipality by County Population Households Poverty % ALICE % Above ALICE Threshold %
Unemployment Rate
Health Insurance
Coverage %
Housing Burden: Owner Over 30%
Housing Burden: Renter Over 30%
Source, American Community
Survey Estimate
Chassell Township, Houghton County 1,848 715 14% 25% 61% 5.5% 94% 20% 53% 5-Year
Duncan Township, Houghton County 245 129 16% 37% 47% 15.9% 90% 10% 17% 5-Year
Franklin Township, Houghton County 1,326 498 17% 27% 56% 5.0% 90% 19% 41% 5-Year
Hancock City, Houghton County 4,601 1,825 24% 33% 43% 7.9% 87% 17% 47% 5-Year
Hancock Township, Houghton County 529 192 8% 30% 62% 7.4% 94% 19% 0% 5-Year
Houghton City, Houghton County 7,942 2,650 32% 31% 37% 4.2% 92% 20% 56% 5-Year
Laird Township, Houghton County 439 180 16% 31% 53% 9.5% 93% 20% 21% 5-Year
Osceola Township, Houghton County 1,797 666 17% 28% 55% 4.6% 89% 13% 41% 5-Year
Portage Charter Township, Houghton County 3,188 1,202 12% 26% 62% 5.2% 95% 19% 55% 5-Year
Quincy Township, Houghton County 303 108 15% 28% 57% 2.8% 89% 18% 38% 5-Year
Schoolcraft Township, Houghton County 1,783 725 19% 30% 51% 7.6% 92% 19% 36% 5-Year
Stanton Township, Houghton County 1,502 471 10% 27% 63% 8.8% 90% 19% 23% 5-Year
Torch Lake Township, Houghton County 2,037 837 13% 30% 57% 12.4% 89% 21% 14% 5-Year
Bad Axe City, Huron County 3,052 1,299 18% 34% 48% 6.5% 90% 24% 62% 5-Year
Bingham Township, Huron County 1,487 616 9% 34% 57% 6.5% 92% 17% 27% 5-Year
Bloomfield Township, Huron County 448 180 11% 28% 61% 6.8% 88% 25% 44% 5-Year
Brookfield Township, Huron County 682 291 11% 24% 65% 8.5% 93% 19% 10% 5-Year
Caseville City, Huron County 773 408 12% 45% 43% 12.4% 88% 32% 33% 5-Year
Caseville Township, Huron County 1,779 823 18% 24% 58% 9.3% 90% 25% 21% 5-Year
Chandler Township, Huron County 536 186 9% 26% 65% 5.9% 93% 31% 20% 5-Year
Colfax Township, Huron County 1,815 689 12% 27% 61% 10.3% 86% 24% 38% 5-Year
Dwight Township, Huron County 802 333 22% 26% 52% 6.0% 87% 29% 51% 5-Year
Fairhaven Township, Huron County 999 459 20% 34% 46% 9.8% 87% 33% 52% 5-Year
Grant Township, Huron County 1,005 350 14% 18% 68% 6.2% 85% 21% 30% 5-Year
Harbor Beach City, Huron County 1,802 807 22% 33% 45% 10.2% 90% 16% 43% 5-Year
Hume Township, Huron County 738 327 11% 21% 68% 7.0% 89% 14% 44% 5-Year
Huron Township, Huron County 384 176 15% 35% 50% 8.3% 88% 25% 22% 5-Year
Lake Township, Huron County 699 350 11% 31% 58% 7.8% 91% 25% 50% 5-Year
Lincoln Township, Huron County 750 319 12% 37% 51% 9.5% 89% 25% 33% 5-Year
Mckinley Township, Huron County 459 206 17% 18% 65% 8.2% 98% 17% 64% 5-Year
Meade Township, Huron County 767 317 9% 21% 70% 7.3% 94% 14% 36% 5-Year
Oliver Township, Huron County 1,530 586 22% 28% 50% 8.3% 89% 27% 38% 5-Year
Paris Township, Huron County 478 190 11% 29% 60% 6.1% 92% 27% 10% 5-Year
Port Austin Township, Huron County 1,472 725 15% 28% 57% 14.7% 89% 31% 44% 5-Year
Rubicon Township, Huron County 730 346 10% 32% 58% 12.4% 93% 23% 57% 5-Year
Sand Beach Township, Huron County 1,033 429 14% 23% 63% 5.8% 91% 24% 38% 5-Year
Sebewaing Township, Huron County 2,654 1,117 9% 21% 70% 7.1% 91% 11% 29% 5-Year
Sheridan Township, Huron County 677 247 8% 22% 70% 3.6% 86% 11% 0% 5-Year
Sherman Township, Huron County 947 415 13% 30% 57% 6.8% 94% 22% 7% 5-Year
Sigel Township, Huron County 456 184 10% 17% 73% 3.6% 91% 23% 14% 5-Year
Verona Township, Huron County 1,153 454 8% 21% 71% 6.7% 92% 15% 42% 5-Year
Winsor Township, Huron County 1,968 876 11% 32% 57% 4.8% 95% 20% 44% 5-Year
Alaiedon Township, Ingham County 2,900 1,072 4% 13% 83% 2.4% 94% 20% 19% 5-Year
Aurelius Township, Ingham County 4,081 1,381 6% 10% 84% 7.2% 93% 21% 55% 5-Year
Bunker Hill Township, Ingham County 2,115 740 11% 17% 72% 6.7% 89% 25% 38% 5-Year
Delhi Charter Township, Ingham County 26,199 10,515 8% 21% 71% 7.4% 94% 21% 51% 5-Year
East Lansing City, Ingham County 46,527 13,169 40% 17% 43% 9.7% 94% 18% 67% 5-Year
Key Facts and ALICE Statistics for Michigan Municipalities

UNIT
ED W
AY A
LICE
REP
ORT
– 20
17 U
PDAT
E FO
R M
ICHI
GAN
– EX
HIBI
T VI
Municipality by County Population Households Poverty % ALICE % Above ALICE Threshold %
Unemployment Rate
Health Insurance
Coverage %
Housing Burden: Owner Over 30%
Housing Burden: Renter Over 30%
Source, American Community
Survey Estimate
Ingham Township, Ingham County 2,492 835 7% 15% 78% 5.2% 98% 32% 24% 5-Year
Lansing Charter Township, Ingham County 8,116 3,671 16% 30% 54% 9.9% 93% 21% 49% 5-Year
Lansing City, Ingham County 109,757 46,291 25% 31% 44% 11.4% 89% 27% 54% 5-Year
Leroy Township, Ingham County 3,515 1,331 11% 30% 59% 8.1% 91% 27% 59% 5-Year
Leslie City, Ingham County 1,720 630 13% 32% 55% 12.9% 91% 22% 39% 5-Year
Leslie Township, Ingham County 2,490 920 5% 23% 72% 6.1% 93% 24% 23% 5-Year
Locke Township, Ingham County 1,625 573 7% 11% 82% 8.8% 93% 16% 16% 5-Year
Mason City, Ingham County 8,317 3,201 7% 29% 64% 5.2% 95% 19% 44% 5-Year
Meridian Charter Township, Ingham County 41,139 17,607 14% 17% 69% 6.2% 92% 20% 45% 5-Year
Onondaga Township, Ingham County 3,149 1,098 10% 24% 66% 11.3% 91% 25% 51% 5-Year
Stockbridge Township, Ingham County 3,913 1,425 11% 27% 62% 11.2% 90% 35% 34% 5-Year
Vevay Township, Ingham County 3,531 1,269 2% 10% 88% 3.7% 94% 12% 8% 5-Year
Wheatfield Township, Ingham County 1,808 648 9% 9% 82% 4.3% 98% 20% 62% 5-Year
White Oak Township, Ingham County 1,209 470 4% 22% 74% 6.4% 94% 20% 24% 5-Year
Williamston City, Ingham County 3,855 1,579 12% 20% 68% 3.8% 92% 21% 27% 5-Year
Williamstown Township, Ingham County 5,033 1,993 6% 10% 84% 4.2% 95% 22% 57% 5-Year
Belding City, Ionia County 5,771 2,086 23% 36% 41% 14.3% 88% 21% 58% 5-Year
Berlin Township, Ionia County 2,430 882 13% 28% 59% 15.6% 92% 27% 49% 5-Year
Boston Township, Ionia County 5,724 2,092 16% 27% 57% 8.5% 90% 26% 36% 5-Year
Campbell Township, Ionia County 2,363 887 11% 23% 66% 6.9% 93% 28% 39% 5-Year
Danby Township, Ionia County 2,991 1,047 7% 20% 73% 4.0% 92% 23% 14% 5-Year
Easton Township, Ionia County 3,098 1,210 9% 28% 63% 10.2% 93% 28% 15% 5-Year
Ionia City, Ionia County 11,384 2,784 25% 40% 35% 20.3% 90% 29% 62% 5-Year
Ionia Township, Ionia County 3,778 1,261 15% 39% 46% 10.5% 94% 14% 62% 5-Year
Keene Township, Ionia County 1,956 689 9% 24% 67% 7.8% 92% 26% 29% 5-Year
Lyons Township, Ionia County 3,465 1,350 13% 28% 59% 7.5% 90% 25% 27% 5-Year
North Plains Township, Ionia County 1,359 461 12% 33% 55% 18.7% 85% 22% 33% 5-Year
Odessa Township, Ionia County 3,790 1,453 12% 34% 54% 2.4% 94% 20% 45% 5-Year
Orange Township, Ionia County 925 358 7% 30% 63% 4.4% 85% 20% 23% 5-Year
Orleans Township, Ionia County 2,747 962 20% 35% 45% 14.9% 91% 25% 49% 5-Year
Otisco Township, Ionia County 2,171 791 11% 31% 58% 9.1% 92% 27% 17% 5-Year
Portland City, Ionia County 3,910 1,389 6% 35% 59% 6.6% 96% 22% 56% 5-Year
Portland Township, Ionia County 3,414 1,323 2% 13% 85% 8.4% 91% 11% 20% 5-Year
Ronald Township, Ionia County 1,544 614 18% 27% 55% 8.3% 86% 31% 29% 5-Year
Sebewa Township, Ionia County 1,244 453 4% 27% 69% 7.0% 92% 26% 7% 5-Year
Alabaster Township, Iosco County 441 220 7% 19% 74% 5.4% 93% 20% 56% 5-Year
Au Sable Charter Township, Iosco County 1,913 894 13% 33% 54% 16.3% 88% 16% 50% 5-Year
Baldwin Township, Iosco County 1,526 708 10% 29% 61% 15.0% 92% 17% 22% 5-Year
Burleigh Township, Iosco County 716 273 21% 30% 49% 9.4% 83% 31% 35% 5-Year
East Tawas City, Iosco County 2,761 1,245 17% 30% 53% 8.8% 94% 20% 28% 5-Year
Grant Township, Iosco County 1,534 720 19% 30% 51% 14.7% 91% 26% 23% 5-Year
Oscoda Charter Township, Iosco County 6,867 3,224 17% 32% 51% 13.9% 88% 26% 38% 5-Year
Plainfield Township, Iosco County 3,708 1,753 21% 30% 49% 15.0% 86% 25% 46% 5-Year
Reno Township, Iosco County 630 243 22% 27% 51% 12.1% 81% 30% 42% 5-Year
Sherman Township, Iosco County 439 186 10% 40% 50% 9.9% 92% 16% 63% 5-Year
Tawas City, Iosco County 1,888 717 12% 35% 53% 10.0% 86% 21% 43% 5-Year
Tawas Township, Iosco County 1,897 688 8% 29% 63% 4.8% 93% 20% 54% 5-Year
Whittemore City, Iosco County 444 188 34% 31% 35% 12.0% 82% 22% 48% 5-Year
Wilber Township, Iosco County 637 284 12% 27% 61% 5.1% 92% 19% 23% 5-Year

UNIT
ED W
AY A
LICE
REP
ORT
– 20
17 U
PDAT
E FO
R M
ICHI
GAN
– EX
HIBI
T VI
Municipality by County Population Households Poverty % ALICE % Above ALICE Threshold %
Unemployment Rate
Health Insurance
Coverage %
Housing Burden: Owner Over 30%
Housing Burden: Renter Over 30%
Source, American Community
Survey Estimate
Bates Township, Iron County 1,005 442 8% 24% 68% 2.6% 91% 24% 50% 5-Year
Caspian City, Iron County 723 373 15% 49% 36% 7.5% 86% 28% 58% 5-Year
Crystal Falls City, Iron County 1,683 713 17% 30% 53% 4.9% 90% 25% 53% 5-Year
Crystal Falls Township, Iron County 1,623 649 8% 27% 65% 7.3% 92% 22% 43% 5-Year
Gaastra City, Iron County 352 149 15% 42% 43% 1.8% 91% 13% 35% 5-Year
Hematite Township, Iron County 326 164 20% 35% 45% 17.5% 86% 15% 48% 5-Year
Iron River City, Iron County 2,944 1,529 27% 36% 37% 14.9% 87% 28% 47% 5-Year
Iron River Township, Iron County 973 471 15% 37% 48% 11.5% 88% 36% 0% 5-Year
Mansfield Township, Iron County 240 105 10% 28% 62% 1.0% 93% 22% 0% 5-Year
Mastodon Township, Iron County 514 276 7% 34% 59% 13.9% 95% 23% 0% 5-Year
Stambaugh Township, Iron County 1,124 521 7% 26% 67% 7.7% 94% 27% 0% 5-Year
Broomfield Township, Isabella County 1,751 686 10% 21% 69% 9.6% 92% 22% 48% 5-Year
Chippewa Township, Isabella County 4,648 1,762 18% 24% 58% 13.7% 82% 27% 55% 5-Year
Coe Township, Isabella County 3,084 1,188 11% 30% 59% 10.4% 88% 21% 42% 5-Year
Coldwater Township, Isabella County 767 301 22% 33% 45% 15.2% 86% 33% 53% 5-Year
Deerfield Township, Isabella County 3,225 1,188 7% 15% 78% 4.1% 95% 18% 19% 5-Year
Denver Township, Isabella County 1,149 408 18% 28% 54% 12.2% 90% 30% 29% 5-Year
Fremont Township, Isabella County 1,503 541 15% 32% 53% 11.0% 87% 27% 32% 5-Year
Gilmore Township, Isabella County 1,330 538 16% 32% 52% 5.1% 88% 33% 41% 5-Year
Isabella Township, Isabella County 1,920 785 11% 32% 57% 10.4% 87% 19% 27% 5-Year
Lincoln Township, Isabella County 2,098 751 13% 20% 67% 6.8% 94% 26% 66% 5-Year
Mount Pleasant City, Isabella County 26,134 8,188 35% 26% 39% 12.4% 91% 16% 65% 5-Year
Nottawa Township, Isabella County 2,406 859 9% 26% 65% 9.3% 91% 19% 60% 5-Year
Rolland Township, Isabella County 1,757 500 9% 26% 65% 6.3% 91% 21% 37% 5-Year
Sherman Township, Isabella County 2,977 1,163 24% 20% 56% 16.3% 89% 28% 62% 5-Year
Union Charter Township, Isabella County 13,197 4,804 39% 23% 38% 10.4% 85% 22% 64% 5-Year
Vernon Township, Isabella County 1,283 469 10% 22% 68% 14.1% 85% 20% 7% 5-Year
Wise Township, Isabella County 1,440 530 12% 31% 57% 19.1% 81% 23% 34% 5-Year
Blackman Charter Township, Jackson County 23,982 7,929 16% 34% 50% 9.9% 90% 22% 51% 5-Year
Columbia Township, Jackson County 7,413 2,962 6% 18% 76% 7.6% 92% 19% 53% 5-Year
Concord Township, Jackson County 2,714 1,005 8% 17% 75% 4.9% 94% 19% 40% 5-Year
Grass Lake Charter Township, Jackson County 5,799 2,200 5% 18% 77% 9.5% 96% 25% 46% 5-Year
Hanover Township, Jackson County 3,692 1,303 7% 18% 75% 6.9% 95% 26% 24% 5-Year
Henrietta Township, Jackson County 4,696 1,739 13% 19% 68% 7.1% 92% 28% 67% 5-Year
Jackson City, Jackson County 33,255 12,650 33% 28% 39% 15.6% 84% 28% 57% 5-Year
Leoni Township, Jackson County 13,764 5,724 12% 27% 61% 12.1% 91% 22% 47% 5-Year
Liberty Township, Jackson County 2,959 1,195 5% 16% 79% 5.2% 94% 19% 19% 5-Year
Napoleon Township, Jackson County 6,766 2,802 9% 20% 71% 7.5% 91% 20% 56% 5-Year
Norvell Township, Jackson County 2,956 1,234 16% 30% 54% 16.6% 89% 29% 54% 5-Year
Parma Township, Jackson County 2,718 1,063 16% 26% 58% 9.2% 92% 26% 54% 5-Year
Pulaski Township, Jackson County 2,038 770 12% 26% 62% 9.1% 84% 30% 22% 5-Year
Rives Township, Jackson County 4,658 1,640 6% 19% 75% 8.5% 94% 19% 14% 5-Year
Sandstone Township, Jackson County 3,986 1,408 9% 26% 65% 16.8% 95% 21% 22% 5-Year
Spring Arbor Township, Jackson County 8,206 2,579 12% 17% 71% 8.9% 93% 24% 57% 5-Year
Springport Township, Jackson County 2,188 858 15% 22% 63% 9.4% 91% 25% 46% 5-Year
Summit Township, Jackson County 22,468 9,323 9% 20% 71% 6.4% 93% 21% 48% 5-Year
Tompkins Township, Jackson County 2,659 1,075 9% 24% 67% 9.8% 94% 18% 24% 5-Year
Key Facts and ALICE Statistics for Michigan Municipalities

UNIT
ED W
AY A
LICE
REP
ORT
– 20
17 U
PDAT
E FO
R M
ICHI
GAN
– EX
HIBI
T VI
Municipality by County Population Households Poverty % ALICE % Above ALICE Threshold %
Unemployment Rate
Health Insurance
Coverage %
Housing Burden: Owner Over 30%
Housing Burden: Renter Over 30%
Source, American Community
Survey Estimate
Waterloo Township, Jackson County 2,842 1,132 8% 15% 77% 7.4% 93% 25% 30% 5-Year
Alamo Township, Kalamazoo County 3,838 1,474 9% 21% 70% 9.5% 93% 23% 13% 5-Year
Brady Township, Kalamazoo County 4,393 1,606 8% 22% 70% 6.4% 92% 18% 46% 5-Year
Charleston Township, Kalamazoo County 1,845 747 14% 16% 70% 5.6% 94% 24% 26% 5-Year
Climax Township, Kalamazoo County 2,503 918 7% 17% 76% 8.3% 95% 20% 41% 5-Year
Comstock Charter Township, Kalamazoo County 15,227 6,312 12% 25% 63% 8.3% 94% 22% 38% 5-Year
Cooper Charter Township, Kalamazoo County 10,365 3,831 9% 21% 70% 6.3% 93% 19% 32% 5-Year
Galesburg City, Kalamazoo County 1,953 748 26% 35% 39% 16.0% 89% 31% 56% 5-Year
Kalamazoo Charter Township, Kalamazoo County 22,350 9,370 16% 29% 55% 10.7% 88% 26% 46% 5-Year
Kalamazoo City, Kalamazoo County 75,499 28,025 30% 29% 41% 11.5% 89% 24% 54% 5-Year
Oshtemo Charter Township, Kalamazoo County 22,294 9,948 19% 26% 55% 9.3% 91% 23% 51% 5-Year
Parchment City, Kalamazoo County 2,016 847 18% 33% 49% 12.9% 91% 23% 66% 5-Year
Pavilion Township, Kalamazoo County 6,309 2,295 12% 24% 64% 11.7% 92% 33% 57% 5-Year
Portage City, Kalamazoo County 47,496 19,492 12% 24% 64% 6.6% 93% 22% 47% 5-Year
Prairie Ronde Township, Kalamazoo County 2,378 848 7% 14% 79% 7.6% 93% 23% 25% 5-Year
Richland Township, Kalamazoo County 7,852 2,873 5% 16% 79% 4.5% 95% 16% 43% 5-Year
Ross Township, Kalamazoo County 4,784 1,874 6% 15% 79% 8.7% 89% 23% 39% 5-Year
Schoolcraft Township, Kalamazoo County 8,508 3,239 11% 21% 68% 8.4% 93% 18% 40% 5-Year
Texas Charter Township, Kalamazoo County 15,796 5,385 3% 13% 84% 7.0% 97% 21% 40% 5-Year
Wakeshma Township, Kalamazoo County 1,346 509 8% 25% 67% 9.9% 92% 27% 46% 5-Year
Bear Lake Township, Kalkaska County 618 299 10% 28% 62% 12.9% 92% 30% 18% 5-Year
Blue Lake Township, Kalkaska County 398 227 8% 23% 69% 8.5% 93% 25% 11% 5-Year
Boardman Township, Kalkaska County 1,434 542 14% 23% 63% 15.5% 86% 24% 36% 5-Year
Clearwater Township, Kalkaska County 2,440 1,029 14% 30% 56% 4.9% 87% 26% 35% 5-Year
Coldsprings Township, Kalkaska County 1,457 661 14% 28% 58% 9.2% 91% 30% 15% 5-Year
Excelsior Township, Kalkaska County 889 335 15% 18% 67% 16.9% 87% 24% 47% 5-Year
Garfield Township, Kalkaska County 842 383 19% 27% 54% 7.5% 85% 28% 53% 5-Year
Kalkaska Township, Kalkaska County 4,757 2,015 14% 33% 53% 9.0% 84% 23% 41% 5-Year
Oliver Township, Kalkaska County 307 131 12% 23% 65% 7.8% 90% 20% 63% 5-Year
Orange Township, Kalkaska County 1,477 493 25% 15% 60% 12.8% 89% 35% 45% 5-Year
Rapid River Township, Kalkaska County 1,243 509 22% 21% 57% 11.3% 87% 26% 55% 5-Year
Springfield Township, Kalkaska County 1,368 561 21% 26% 53% 15.0% 85% 35% 22% 5-Year
Ada Township, Kent County 13,823 4,626 2% 5% 93% 3.9% 99% 14% 19% 5-Year
Algoma Township, Kent County 10,563 3,500 7% 15% 78% 4.4% 96% 19% 20% 5-Year
Alpine Township, Kent County 13,658 5,338 16% 33% 51% 8.0% 86% 18% 38% 5-Year
Bowne Township, Kent County 3,224 1,076 7% 19% 74% 4.8% 93% 23% 49% 5-Year
Byron Township, Kent County 21,576 7,829 7% 23% 70% 6.8% 93% 20% 25% 5-Year
Caledonia Township, Kent County 13,144 4,432 6% 18% 76% 4.1% 95% 20% 33% 5-Year
Cannon Township, Kent County 13,932 4,752 5% 10% 85% 6.0% 96% 18% 33% 5-Year
Cascade Charter Township, Kent County 18,043 6,515 2% 11% 87% 5.5% 97% 21% 45% 5-Year
Cedar Springs City, Kent County 3,570 1,247 21% 36% 43% 20.6% 87% 26% 55% 5-Year
Courtland Township, Kent County 8,083 2,701 6% 10% 84% 7.8% 96% 20% 5% 5-Year
East Grand Rapids City, Kent County 11,128 3,974 3% 10% 87% 4.3% 98% 17% 43% 5-Year
Gaines Charter Township, Kent County 25,885 9,800 9% 26% 65% 7.1% 92% 22% 42% 5-Year
Grand Rapids Charter Township, Kent County 17,510 6,198 4% 14% 82% 3.0% 96% 18% 39% 5-Year
Grand Rapids City, Kent County 192,416 73,026 22% 29% 49% 10.4% 87% 22% 54% 5-Year

UNIT
ED W
AY A
LICE
REP
ORT
– 20
17 U
PDAT
E FO
R M
ICHI
GAN
– EX
HIBI
T VI
Municipality by County Population Households Poverty % ALICE % Above ALICE Threshold %
Unemployment Rate
Health Insurance
Coverage %
Housing Burden: Owner Over 30%
Housing Burden: Renter Over 30%
Source, American Community
Survey Estimate
Grandville City, Kent County 15,739 6,149 9% 26% 65% 4.3% 90% 17% 31% 5-Year
Grattan Township, Kent County 3,757 1,459 5% 17% 78% 5.7% 94% 24% 76% 5-Year
Kentwood City, Kent County 50,286 19,860 14% 29% 57% 7.2% 90% 24% 44% 5-Year
Lowell Charter Township, Kent County 6,235 2,292 12% 13% 75% 6.7% 92% 24% 29% 5-Year
Lowell City, Kent County 3,859 1,428 6% 23% 71% 6.7% 93% 14% 20% 5-Year
Nelson Township, Kent County 4,909 1,713 9% 17% 74% 5.6% 92% 14% 31% 5-Year
Oakfield Township, Kent County 5,965 2,036 7% 16% 77% 4.3% 98% 22% 0% 5-Year
Plainfield Charter Township, Kent County 32,121 12,665 8% 23% 69% 6.3% 94% 21% 56% 5-Year
Rockford City, Kent County 5,956 2,255 11% 30% 59% 5.0% 96% 20% 41% 5-Year
Solon Township, Kent County 6,250 2,351 8% 23% 69% 4.5% 95% 18% 29% 5-Year
Sparta Township, Kent County 9,292 3,482 12% 30% 58% 10.8% 92% 23% 38% 5-Year
Spencer Township, Kent County 4,053 1,644 14% 25% 61% 8.4% 93% 28% 84% 5-Year
Tyrone Township, Kent County 4,862 1,658 12% 28% 60% 13.4% 87% 30% 53% 5-Year
Vergennes Township, Kent County 4,404 1,431 9% 18% 73% 7.8% 94% 21% 59% 5-Year
Walker City, Kent County 24,242 9,922 13% 26% 61% 5.9% 91% 18% 40% 5-Year
Wyoming City, Kent County 74,105 27,602 14% 31% 55% 7.2% 87% 22% 43% 5-Year
Allouez Township, Keweenaw County 1,516 675 19% 33% 48% 6.8% 89% 27% 63% 5-Year
Eagle Harbor Township, Keweenaw County 319 162 6% 16% 78% 2.8% 99% 20% 0% 5-Year
Grant Township, Keweenaw County 177 104 7% 42% 51% 12.4% 82% 43% 0% 5-Year
Chase Township, Lake County 1,144 382 16% 37% 47% 9.6% 85% 22% 16% 5-Year
Cherry Valley Township, Lake County 459 177 29% 28% 43% 19.4% 88% 26% 68% 5-Year
Dover Township, Lake County 444 152 13% 26% 61% 10.5% 87% 20% 33% 5-Year
Eden Township, Lake County 606 217 23% 47% 30% 10.9% 89% 40% 40% 5-Year
Elk Township, Lake County 896 408 15% 28% 57% 11.7% 90% 22% 50% 5-Year
Ellsworth Township, Lake County 761 249 19% 27% 54% 3.2% 90% 27% 21% 5-Year
Lake Township, Lake County 715 319 13% 31% 56% 12.6% 93% 27% 43% 5-Year
Newkirk Township, Lake County 772 288 26% 34% 40% 19.4% 87% 32% 46% 5-Year
Peacock Township, Lake County 316 171 23% 33% 44% 14.1% 87% 35% 38% 5-Year
Pinora Township, Lake County 761 261 20% 35% 45% 7.2% 80% 29% 61% 5-Year
Pleasant Plains Township, Lake County 1,763 677 39% 29% 32% 17.9% 88% 38% 52% 5-Year
Sauble Township, Lake County 330 157 12% 36% 52% 9.5% 94% 38% 15% 5-Year
Webber Township, Lake County 1,485 539 35% 42% 23% 13.7% 90% 34% 61% 5-Year
Yates Township, Lake County 733 275 40% 36% 24% 25.0% 90% 40% 39% 5-Year
Almont Township, Lapeer County 6,638 2,442 5% 31% 64% 8.5% 92% 29% 54% 5-Year
Arcadia Township, Lapeer County 3,117 1,168 6% 31% 63% 12.7% 90% 29% 55% 5-Year
Attica Township, Lapeer County 4,746 1,676 10% 30% 60% 9.2% 89% 33% 45% 5-Year
Burlington Township, Lapeer County 1,601 555 12% 36% 52% 13.5% 89% 27% 49% 5-Year
Burnside Township, Lapeer County 1,945 659 6% 34% 60% 9.6% 91% 23% 15% 5-Year
Deerfield Township, Lapeer County 5,721 1,958 7% 31% 62% 14.3% 85% 20% 43% 5-Year
Dryden Township, Lapeer County 4,771 1,786 10% 24% 66% 9.8% 93% 28% 52% 5-Year
Elba Township, Lapeer County 5,250 2,071 6% 17% 77% 5.9% 96% 21% 19% 5-Year
Goodland Township, Lapeer County 1,679 574 13% 23% 64% 6.6% 93% 28% 21% 5-Year
Hadley Township, Lapeer County 4,534 1,684 5% 24% 71% 12.6% 92% 31% 52% 5-Year
Imlay City, Lapeer County 3,582 1,427 19% 41% 40% 6.9% 78% 19% 44% 5-Year
Imlay Township, Lapeer County 3,128 1,020 9% 26% 65% 10.5% 86% 32% 23% 5-Year
Lapeer City, Lapeer County 8,790 3,391 25% 41% 34% 15.9% 88% 24% 57% 5-Year
Lapeer Township, Lapeer County 5,048 2,003 6% 29% 65% 9.6% 92% 20% 62% 5-Year
Marathon Township, Lapeer County 4,551 1,655 11% 28% 61% 17.3% 92% 22% 43% 5-Year
Key Facts and ALICE Statistics for Michigan Municipalities

UNIT
ED W
AY A
LICE
REP
ORT
– 20
17 U
PDAT
E FO
R M
ICHI
GAN
– EX
HIBI
T VI
Municipality by County Population Households Poverty % ALICE % Above ALICE Threshold %
Unemployment Rate
Health Insurance
Coverage %
Housing Burden: Owner Over 30%
Housing Burden: Renter Over 30%
Source, American Community
Survey Estimate
Mayfield Township, Lapeer County 7,920 3,029 12% 31% 57% 9.7% 91% 23% 44% 5-Year
Metamora Township, Lapeer County 4,236 1,582 5% 26% 69% 8.8% 95% 25% 32% 5-Year
North Branch Township, Lapeer County 3,634 1,377 12% 36% 52% 8.5% 93% 28% 49% 5-Year
Oregon Township, Lapeer County 5,783 2,077 4% 23% 73% 8.2% 92% 20% 22% 5-Year
Rich Township, Lapeer County 1,539 537 12% 23% 65% 8.6% 93% 30% 15% 5-Year
Bingham Township, Leelanau County 2,508 1,053 6% 20% 74% 6.4% 94% 32% 40% 5-Year
Centerville Township, Leelanau County 1,331 512 6% 26% 68% 9.0% 93% 27% 17% 5-Year
Cleveland Township, Leelanau County 1,123 496 12% 21% 67% 7.6% 92% 33% 20% 5-Year
Elmwood Charter Township, Leelanau County 4,515 1,892 4% 18% 78% 5.4% 92% 28% 42% 5-Year
Empire Township, Leelanau County 1,198 614 10% 16% 74% 4.0% 94% 22% 31% 5-Year
Glen Arbor Township, Leelanau County 702 343 8% 15% 77% 5.5% 91% 39% 82% 5-Year
Kasson Township, Leelanau County 1,426 544 7% 29% 64% 9.6% 83% 33% 54% 5-Year
Leelanau Township, Leelanau County 2,234 998 9% 21% 70% 7.3% 92% 31% 30% 5-Year
Leland Township, Leelanau County 2,001 876 7% 22% 71% 6.2% 92% 34% 41% 5-Year
Solon Township, Leelanau County 1,400 573 10% 21% 69% 9.5% 91% 31% 28% 5-Year
Suttons Bay Township, Leelanau County 2,986 1,241 17% 17% 66% 9.5% 86% 34% 49% 5-Year
Adrian City, Lenawee County 20,878 7,869 27% 34% 39% 13.5% 89% 27% 56% 5-Year
Adrian Township, Lenawee County 6,171 2,591 5% 32% 63% 2.8% 93% 30% 27% 5-Year
Blissfield Township, Lenawee County 3,895 1,669 14% 29% 57% 6.0% 91% 28% 36% 5-Year
Cambridge Township, Lenawee County 5,678 2,362 8% 26% 66% 5.2% 94% 20% 32% 5-Year
Clinton Township, Lenawee County 3,545 1,344 9% 29% 62% 8.0% 91% 24% 50% 5-Year
Deerfield Township, Lenawee County 1,514 578 9% 24% 67% 4.0% 91% 28% 30% 5-Year
Dover Township, Lenawee County 1,956 711 14% 34% 52% 8.9% 87% 28% 37% 5-Year
Fairfield Township, Lenawee County 1,688 652 17% 33% 50% 9.0% 89% 30% 56% 5-Year
Franklin Township, Lenawee County 3,172 1,243 6% 27% 67% 5.0% 96% 35% 44% 5-Year
Hudson City, Lenawee County 2,413 851 19% 26% 55% 11.1% 86% 20% 42% 5-Year
Hudson Township, Lenawee County 1,424 623 8% 41% 51% 11.4% 92% 30% 31% 5-Year
Macon Township, Lenawee County 1,404 515 7% 20% 73% 3.7% 92% 26% 59% 5-Year
Madison Charter Township, Lenawee County 8,519 2,232 6% 39% 55% 11.3% 93% 25% 57% 5-Year
Medina Township, Lenawee County 1,096 415 9% 29% 62% 8.0% 89% 18% 57% 5-Year
Morenci City, Lenawee County 2,512 922 22% 31% 47% 13.3% 88% 30% 51% 5-Year
Ogden Township, Lenawee County 1,092 390 12% 23% 65% 4.0% 91% 22% 45% 5-Year
Palmyra Township, Lenawee County 1,964 787 11% 35% 54% 9.7% 89% 37% 33% 5-Year
Raisin Township, Lenawee County 7,538 2,608 5% 23% 72% 10.9% 96% 24% 9% 5-Year
Ridgeway Township, Lenawee County 1,661 642 11% 26% 63% 5.9% 91% 22% 42% 5-Year
Riga Township, Lenawee County 1,233 463 5% 28% 67% 5.7% 93% 27% 28% 5-Year
Rollin Township, Lenawee County 3,249 1,504 8% 33% 59% 10.6% 89% 22% 46% 5-Year
Rome Township, Lenawee County 1,522 639 9% 35% 56% 3.4% 92% 28% 54% 5-Year
Seneca Township, Lenawee County 1,113 450 5% 31% 64% 5.2% 94% 24% 40% 5-Year
Tecumseh City, Lenawee County 8,393 3,731 9% 28% 63% 6.6% 92% 21% 38% 5-Year
Tecumseh Township, Lenawee County 1,817 723 7% 18% 75% 5.3% 94% 18% 62% 5-Year
Woodstock Township, Lenawee County 3,455 1,450 12% 28% 60% 4.7% 87% 23% 34% 5-Year
Brighton City, Livingston County 7,555 3,705 8% 30% 62% 3.7% 94% 19% 42% 5-Year
Brighton Township, Livingston County 18,193 6,521 3% 14% 83% 4.8% 94% 18% 33% 5-Year
Cohoctah Township, Livingston County 3,349 1,238 7% 21% 72% 10.0% 88% 34% 16% 5-Year
Conway Township, Livingston County 3,570 1,092 10% 19% 71% 7.3% 90% 27% 21% 5-Year
Deerfield Township, Livingston County 4,202 1,538 6% 17% 77% 3.1% 94% 29% 10% 5-Year
Genoa Township, Livingston County 19,950 7,886 5% 23% 72% 6.6% 93% 23% 51% 5-Year

UNIT
ED W
AY A
LICE
REP
ORT
– 20
17 U
PDAT
E FO
R M
ICHI
GAN
– EX
HIBI
T VI
Municipality by County Population Households Poverty % ALICE % Above ALICE Threshold %
Unemployment Rate
Health Insurance
Coverage %
Housing Burden: Owner Over 30%
Housing Burden: Renter Over 30%
Source, American Community
Survey Estimate
Green Oak Township, Livingston County 18,007 6,870 7% 21% 72% 6.1% 94% 26% 38% 5-Year
Hamburg Township, Livingston County 21,409 8,184 4% 19% 77% 6.1% 94% 23% 42% 5-Year
Handy Township, Livingston County 8,106 3,006 11% 29% 60% 7.0% 90% 24% 48% 5-Year
Hartland Township, Livingston County 14,781 5,139 5% 17% 78% 6.5% 95% 24% 47% 5-Year
Howell City, Livingston County 9,502 4,085 18% 36% 46% 6.2% 91% 31% 50% 5-Year
Howell Township, Livingston County 6,846 2,565 7% 27% 66% 6.4% 91% 26% 35% 5-Year
Iosco Township, Livingston County 3,828 1,263 2% 14% 84% 4.3% 94% 23% 0% 5-Year
Marion Township, Livingston County 10,432 3,565 3% 16% 81% 5.6% 93% 21% 58% 5-Year
Oceola Township, Livingston County 12,905 4,415 3% 13% 84% 4.4% 96% 23% 41% 5-Year
Putnam Township, Livingston County 8,348 3,183 6% 23% 71% 5.3% 92% 24% 38% 5-Year
Tyrone Township, Livingston County 10,219 3,457 5% 18% 77% 6.8% 93% 25% 30% 5-Year
Unadilla Township, Livingston County 3,389 1,268 6% 28% 66% 5.5% 93% 31% 39% 5-Year
Lakefield Township, Luce County 1,087 449 11% 38% 51% 23.6% 89% 23% 38% 5-Year
Mcmillan Township, Luce County 2,562 1,193 26% 38% 36% 10.3% 86% 22% 43% 5-Year
Pentland Township, Luce County 2,626 641 13% 31% 56% 6.3% 95% 19% 40% 5-Year
Brevort Township, Mackinac County 480 222 11% 20% 69% 20.2% 84% 24% 100% 5-Year
Clark Township, Mackinac County 2,016 974 13% 17% 70% 10.9% 86% 30% 25% 5-Year
Garfield Township, Mackinac County 1,122 517 10% 24% 66% 12.5% 82% 19% 36% 5-Year
Mackinac Island City, Mackinac County 710 296 9% 14% 77% 7.4% 70% 23% 13% 5-Year
Marquette Township, Mackinac County 674 327 13% 15% 72% 10.8% 94% 23% 40% 5-Year
Moran Township, Mackinac County 935 410 8% 15% 77% 13.5% 89% 21% 22% 5-Year
Newton Township, Mackinac County 465 204 29% 23% 48% 12.6% 93% 35% 53% 5-Year
Portage Township, Mackinac County 774 405 20% 11% 69% 8.5% 95% 26% 46% 5-Year
St. Ignace City, Mackinac County 2,548 1,205 17% 22% 61% 14.3% 83% 19% 45% 5-Year
St. Ignace Township, Mackinac County 925 420 15% 21% 64% 8.7% 88% 26% 24% 5-Year
Armada Township, Macomb County 5,433 1,980 3% 25% 72% 7.2% 94% 21% 53% 5-Year
Bruce Township, Macomb County 8,881 3,075 7% 16% 77% 5.5% 94% 23% 52% 5-Year
Center Line City, Macomb County 8,306 3,694 21% 40% 39% 8.8% 88% 23% 43% 5-Year
Chesterfield Township, Macomb County 44,079 16,710 8% 23% 69% 8.9% 92% 19% 53% 5-Year
Clinton Charter Township, Macomb County 98,543 42,792 12% 32% 56% 10.2% 90% 25% 51% 5-Year
Eastpointe City, Macomb County 32,585 12,305 21% 33% 46% 13.8% 89% 31% 57% 5-Year
Fraser City, Macomb County 14,582 6,181 11% 30% 59% 8.5% 93% 21% 40% 5-Year
Harrison Charter Township, Macomb County 24,801 11,076 10% 29% 61% 8.4% 92% 25% 49% 5-Year
Lenox Township, Macomb County 10,605 3,175 11% 21% 68% 8.0% 91% 21% 41% 5-Year
Macomb Township, Macomb County 83,742 27,989 4% 14% 82% 4.9% 96% 22% 34% 5-Year
Memphis City, Macomb County 793 340 17% 34% 49% 17.3% 89% 26% 47% 5-Year
Mount Clemens City, Macomb County 16,381 6,645 22% 36% 42% 14.6% 87% 30% 52% 5-Year
New Baltimore City, Macomb County 12,212 4,523 7% 20% 73% 4.0% 94% 18% 46% 5-Year
Ray Township, Macomb County 3,923 1,556 6% 24% 70% 6.2% 91% 25% 10% 5-Year
Richmond City, Macomb County 5,820 2,262 17% 33% 50% 6.8% 93% 30% 52% 5-Year
Richmond Township, Macomb County 3,653 1,251 5% 19% 76% 6.7% 94% 23% 9% 5-Year
Roseville City, Macomb County 47,529 19,772 17% 37% 46% 11.1% 88% 25% 52% 5-Year
Shelby Charter Township, Macomb County 75,986 29,464 8% 22% 70% 7.3% 92% 22% 43% 5-Year
St. Clair Shores City, Macomb County 59,888 26,808 9% 30% 61% 8.9% 92% 22% 42% 5-Year
Sterling Heights City, Macomb County 131,139 49,444 11% 25% 64% 8.1% 90% 23% 45% 5-Year
Utica City, Macomb County 4,794 2,191 10% 32% 58% 7.0% 89% 20% 46% 5-Year
Warren City, Macomb County 134,857 53,493 17% 32% 51% 11.8% 88% 26% 56% 5-Year
Key Facts and ALICE Statistics for Michigan Municipalities

UNIT
ED W
AY A
LICE
REP
ORT
– 20
17 U
PDAT
E FO
R M
ICHI
GAN
– EX
HIBI
T VI
Municipality by County Population Households Poverty % ALICE % Above ALICE Threshold %
Unemployment Rate
Health Insurance
Coverage %
Housing Burden: Owner Over 30%
Housing Burden: Renter Over 30%
Source, American Community
Survey Estimate
Washington Township, Macomb County 26,047 9,602 7% 19% 74% 7.0% 91% 22% 46% 5-Year
Arcadia Township, Manistee County 613 284 11% 16% 73% 16.4% 88% 22% 9% 5-Year
Bear Lake Township, Manistee County 1,841 721 14% 17% 69% 6.7% 84% 22% 49% 5-Year
Brown Township, Manistee County 616 277 11% 20% 69% 6.2% 93% 22% 22% 5-Year
Cleon Township, Manistee County 907 409 19% 21% 60% 17.9% 85% 28% 57% 5-Year
Dickson Township, Manistee County 976 432 14% 31% 55% 17.8% 84% 22% 40% 5-Year
Filer Charter Township, Manistee County 2,500 1,043 7% 22% 71% 8.5% 92% 14% 49% 5-Year
Manistee City, Manistee County 6,136 2,807 17% 28% 55% 12.2% 91% 24% 43% 5-Year
Manistee Township, Manistee County 4,117 1,234 9% 22% 69% 10.4% 89% 23% 23% 5-Year
Maple Grove Township, Manistee County 1,242 542 16% 31% 53% 23.9% 78% 35% 48% 5-Year
Marilla Township, Manistee County 308 137 16% 22% 62% 17.6% 87% 31% 24% 5-Year
Norman Township, Manistee County 1,470 655 23% 32% 45% 13.3% 88% 36% 37% 5-Year
Onekama Township, Manistee County 1,469 615 8% 24% 68% 5.5% 94% 27% 59% 5-Year
Pleasanton Township, Manistee County 754 334 11% 17% 72% 5.4% 88% 29% 46% 5-Year
Springdale Township, Manistee County 804 309 24% 25% 51% 9.2% 83% 31% 43% 5-Year
Stronach Township, Manistee County 783 343 13% 28% 59% 9.6% 90% 30% 33% 5-Year
Champion Township, Marquette County 331 129 21% 29% 50% 14.6% 91% 15% 62% 5-Year
Chocolay Charter Township, Marquette County 5,976 2,341 7% 29% 64% 5.8% 91% 17% 45% 5-Year
Ely Township, Marquette County 2,054 778 9% 21% 70% 6.7% 96% 16% 16% 5-Year
Forsyth Township, Marquette County 6,217 2,496 15% 34% 51% 15.1% 86% 18% 46% 5-Year
Humboldt Township, Marquette County 481 206 13% 26% 61% 9.1% 90% 21% 30% 5-Year
Ishpeming City, Marquette County 6,517 2,747 24% 30% 46% 6.3% 89% 25% 55% 5-Year
Ishpeming Township, Marquette County 3,542 1,429 10% 25% 65% 6.7% 93% 10% 51% 5-Year
Marquette Charter Township, Marquette County 3,948 1,695 9% 25% 66% 5.8% 90% 15% 37% 5-Year
Marquette City, Marquette County 21,444 7,852 27% 28% 45% 8.9% 86% 17% 47% 5-Year
Michigamme Township, Marquette County 304 145 14% 27% 59% 5.5% 99% 34% 14% 5-Year
Negaunee City, Marquette County 4,609 1,858 13% 29% 58% 8.3% 92% 16% 41% 5-Year
Negaunee Township, Marquette County 3,106 1,097 9% 15% 76% 6.5% 95% 14% 49% 5-Year
Powell Township, Marquette County 388 215 19% 19% 62% 7.4% 91% 30% 0% 5-Year
Republic Township, Marquette County 853 432 18% 31% 51% 9.1% 89% 28% 69% 5-Year
Richmond Township, Marquette County 838 335 13% 35% 52% 6.2% 85% 18% 10% 5-Year
Sands Township, Marquette County 2,817 987 12% 18% 70% 6.1% 93% 21% 57% 5-Year
Skandia Township, Marquette County 848 377 17% 32% 51% 9.8% 92% 19% 37% 5-Year
Tilden Township, Marquette County 1,192 456 8% 18% 74% 8.4% 94% 8% 38% 5-Year
Wells Township, Marquette County 215 104 20% 39% 41% 3.1% 97% 42% 0% 5-Year
West Branch Township, Marquette County 1,659 655 24% 31% 45% 6.3% 88% 19% 42% 5-Year
Amber Township, Mason County 2,530 1,092 14% 22% 64% 11.4% 88% 27% 54% 5-Year
Branch Township, Mason County 1,418 591 25% 28% 47% 11.0% 87% 40% 75% 5-Year
Custer Township, Mason County 1,312 531 12% 26% 62% 15.1% 81% 27% 24% 5-Year
Eden Township, Mason County 598 226 10% 33% 57% 16.2% 76% 33% 20% 5-Year
Free Soil Township, Mason County 836 361 12% 28% 60% 9.1% 92% 23% 20% 5-Year
Grant Township, Mason County 799 355 12% 21% 67% 7.2% 90% 30% 37% 5-Year
Hamlin Township, Mason County 3,408 1,542 11% 16% 73% 8.2% 92% 26% 31% 5-Year
Logan Township, Mason County 294 149 11% 26% 63% 15.9% 90% 31% 10% 5-Year
Ludington City, Mason County 8,055 3,668 17% 32% 51% 14.7% 88% 30% 48% 5-Year
Pere Marquette Charter Township, Mason County 2,392 933 12% 18% 70% 6.5% 93% 23% 31% 5-Year
Riverton Township, Mason County 1,347 450 16% 16% 68% 3.2% 88% 19% 37% 5-Year

UNIT
ED W
AY A
LICE
REP
ORT
– 20
17 U
PDAT
E FO
R M
ICHI
GAN
– EX
HIBI
T VI
Municipality by County Population Households Poverty % ALICE % Above ALICE Threshold %
Unemployment Rate
Health Insurance
Coverage %
Housing Burden: Owner Over 30%
Housing Burden: Renter Over 30%
Source, American Community
Survey Estimate
Scottville City, Mason County 1,283 450 27% 21% 52% 9.3% 88% 33% 61% 5-Year
Sheridan Township, Mason County 985 490 12% 31% 57% 9.2% 85% 34% 30% 5-Year
Sherman Township, Mason County 1,103 448 15% 27% 58% 10.2% 89% 25% 35% 5-Year
Summit Township, Mason County 797 398 10% 24% 66% 6.9% 91% 29% 18% 5-Year
Victory Township, Mason County 1,377 494 13% 17% 70% 5.9% 87% 31% 19% 5-Year
Aetna Township, Mecosta County 2,448 861 20% 36% 44% 16.5% 82% 29% 50% 5-Year
Austin Township, Mecosta County 1,506 525 8% 28% 64% 6.8% 89% 26% 39% 5-Year
Big Rapids Charter Township, Mecosta County 4,498 1,715 22% 24% 54% 10.7% 94% 19% 59% 5-Year
Big Rapids City, Mecosta County 10,532 2,966 38% 24% 38% 17.1% 89% 20% 55% 5-Year
Chippewa Township, Mecosta County 1,164 511 9% 27% 64% 6.6% 91% 20% 51% 5-Year
Colfax Township, Mecosta County 2,183 799 9% 26% 65% 11.6% 90% 20% 24% 5-Year
Deerfield Township, Mecosta County 2,022 594 18% 33% 49% 11.0% 80% 32% 26% 5-Year
Fork Township, Mecosta County 1,522 636 22% 40% 38% 13.2% 87% 28% 55% 5-Year
Grant Township, Mecosta County 629 261 16% 26% 58% 11.6% 91% 24% 11% 5-Year
Green Charter Township, Mecosta County 3,330 1,162 12% 32% 56% 7.9% 87% 23% 50% 5-Year
Hinton Township, Mecosta County 963 360 18% 20% 62% 14.2% 90% 20% 30% 5-Year
Martiny Township, Mecosta County 1,549 649 19% 29% 52% 9.9% 93% 26% 57% 5-Year
Mecosta Township, Mecosta County 2,646 1,076 13% 34% 53% 3.8% 85% 26% 53% 5-Year
Millbrook Township, Mecosta County 1,043 387 22% 37% 41% 8.6% 90% 38% 22% 5-Year
Morton Township, Mecosta County 4,401 1,897 9% 26% 65% 11.0% 92% 23% 66% 5-Year
Sheridan Township, Mecosta County 1,498 550 13% 26% 61% 17.9% 88% 24% 37% 5-Year
Wheatland Township, Mecosta County 1,367 529 13% 33% 54% 6.6% 90% 21% 30% 5-Year
Cedarville Township, Menominee County 201 114 5% 34% 61% 4.8% 94% 20% 0% 5-Year
Daggett Township, Menominee County 609 257 9% 14% 77% 2.4% 93% 15% 27% 5-Year
Faithorn Township, Menominee County 263 108 5% 12% 83% 4.1% 92% 13% 100% 5-Year
Gourley Township, Menominee County 416 162 15% 27% 58% 12.8% 90% 28% 35% 5-Year
Harris Township, Menominee County 1,814 670 20% 22% 58% 12.5% 85% 26% 39% 5-Year
Holmes Township, Menominee County 420 191 12% 23% 65% 8.6% 97% 24% 14% 5-Year
Ingallston Township, Menominee County 973 465 6% 17% 77% 1.8% 96% 26% 7% 5-Year
Lake Township, Menominee County 585 279 15% 27% 58% 15.4% 93% 33% 20% 5-Year
Mellen Township, Menominee County 1,041 489 12% 24% 64% 7.2% 89% 18% 15% 5-Year
Menominee City, Menominee County 8,456 3,992 21% 25% 54% 11.3% 89% 21% 43% 5-Year
Menominee Township, Menominee County 3,448 1,685 8% 18% 74% 4.3% 95% 17% 68% 5-Year
Meyer Township, Menominee County 940 407 14% 24% 62% 4.6% 87% 20% 40% 5-Year
Nadeau Township, Menominee County 1,164 510 18% 25% 57% 7.5% 90% 22% 26% 5-Year
Spalding Township, Menominee County 1,847 727 15% 29% 56% 6.6% 89% 23% 43% 5-Year
Stephenson City, Menominee County 964 364 17% 32% 51% 13.0% 89% 23% 51% 5-Year
Stephenson Township, Menominee County 576 259 14% 22% 64% 8.3% 92% 23% 28% 5-Year
Coleman City, Midland County 1,291 591 27% 43% 30% 10.9% 89% 24% 52% 5-Year
Edenville Township, Midland County 2,538 989 13% 29% 58% 9.0% 94% 28% 34% 5-Year
Geneva Township, Midland County 1,125 451 17% 20% 63% 7.6% 93% 28% 71% 5-Year
Greendale Township, Midland County 1,724 650 15% 34% 51% 16.9% 85% 24% 38% 5-Year
Homer Township, Midland County 4,005 1,502 5% 25% 70% 3.4% 95% 18% 43% 5-Year
Hope Township, Midland County 1,407 556 10% 31% 59% 6.6% 91% 27% 45% 5-Year
Ingersoll Township, Midland County 2,744 1,048 5% 26% 69% 7.0% 91% 14% 50% 5-Year
Jasper Township, Midland County 1,072 441 15% 33% 52% 10.7% 88% 32% 17% 5-Year
Key Facts and ALICE Statistics for Michigan Municipalities

UNIT
ED W
AY A
LICE
REP
ORT
– 20
17 U
PDAT
E FO
R M
ICHI
GAN
– EX
HIBI
T VI
Municipality by County Population Households Poverty % ALICE % Above ALICE Threshold %
Unemployment Rate
Health Insurance
Coverage %
Housing Burden: Owner Over 30%
Housing Burden: Renter Over 30%
Source, American Community
Survey Estimate
Jerome Township, Midland County 4,754 1,978 12% 28% 60% 9.1% 92% 19% 29% 5-Year
Larkin Charter Township, Midland County 5,261 1,896 3% 11% 86% 8.8% 97% 14% 51% 5-Year
Lee Township, Midland County 4,257 1,555 10% 26% 64% 11.3% 93% 26% 37% 5-Year
Lincoln Township, Midland County 2,358 1,058 7% 27% 66% 8.6% 95% 20% 37% 5-Year
Midland Charter Township, Midland County 2,296 844 9% 25% 66% 8.2% 94% 19% 29% 5-Year
Midland City, Midland County 41,862 17,429 16% 25% 59% 8.1% 91% 16% 45% 5-Year
Mills Township, Midland County 1,808 693 13% 31% 56% 9.9% 86% 28% 11% 5-Year
Mount Haley Township, Midland County 1,906 708 17% 25% 58% 6.8% 92% 27% 50% 5-Year
Porter Township, Midland County 1,179 445 12% 31% 57% 10.1% 88% 20% 6% 5-Year
Warren Township, Midland County 2,037 783 13% 35% 52% 14.3% 91% 29% 35% 5-Year
Aetna Township, Missaukee County 443 167 7% 23% 70% 10.9% 76% 15% 27% 5-Year
Bloomfield Township, Missaukee County 457 191 18% 24% 58% 20.2% 90% 24% 23% 5-Year
Butterfield Township, Missaukee County 437 200 21% 38% 41% 11.8% 81% 32% 30% 5-Year
Caldwell Township, Missaukee County 1,446 550 13% 33% 54% 9.4% 91% 21% 69% 5-Year
Clam Union Township, Missaukee County 968 408 11% 36% 53% 7.2% 89% 26% 25% 5-Year
Forest Township, Missaukee County 919 385 21% 33% 46% 11.0% 86% 28% 64% 5-Year
Holland Township, Missaukee County 259 110 26% 23% 51% 10.8% 95% 34% 70% 5-Year
Lake City, Missaukee County 1,071 355 29% 26% 45% 16.4% 87% 36% 65% 5-Year
Lake Township, Missaukee County 2,819 1,174 12% 22% 66% 13.7% 93% 21% 18% 5-Year
Mcbain City, Missaukee County 671 265 22% 37% 41% 15.4% 85% 19% 36% 5-Year
Norwich Township, Missaukee County 632 286 21% 35% 44% 11.4% 86% 36% 30% 5-Year
Pioneer Township, Missaukee County 577 211 20% 34% 46% 16.8% 88% 31% 50% 5-Year
Reeder Township, Missaukee County 1,138 387 14% 24% 62% 8.0% 92% 25% 42% 5-Year
Richland Township, Missaukee County 1,336 573 6% 28% 66% 2.5% 92% 24% 17% 5-Year
Riverside Township, Missaukee County 1,162 355 5% 28% 67% 5.8% 78% 22% 11% 5-Year
West Branch Township, Missaukee County 511 193 17% 34% 49% 25.8% 85% 27% 58% 5-Year
Ash Township, Monroe County 7,733 2,925 9% 22% 69% 7.4% 93% 24% 28% 5-Year
Bedford Township, Monroe County 31,004 12,509 7% 21% 72% 6.5% 95% 22% 51% 5-Year
Berlin Charter Township, Monroe County 9,242 3,453 7% 20% 73% 7.8% 93% 20% 25% 5-Year
Dundee Township, Monroe County 6,742 2,896 11% 23% 66% 9.2% 92% 19% 46% 5-Year
Erie Township, Monroe County 4,448 1,702 7% 20% 73% 10.0% 84% 25% 27% 5-Year
Exeter Township, Monroe County 3,938 1,339 6% 19% 75% 9.0% 93% 24% 18% 5-Year
Frenchtown Township, Monroe County 20,134 7,723 13% 27% 60% 10.4% 92% 25% 47% 5-Year
Ida Township, Monroe County 4,894 1,866 3% 16% 81% 6.0% 96% 18% 44% 5-Year
La Salle Township, Monroe County 4,832 1,818 5% 14% 81% 6.6% 92% 20% 18% 5-Year
London Township, Monroe County 2,987 1,074 11% 17% 72% 9.0% 92% 24% 54% 5-Year
Luna Pier City, Monroe County 1,341 652 13% 25% 62% 11.1% 90% 19% 36% 5-Year
Milan City, Monroe County 2,066 790 8% 16% 76% 10.1% 93% 23% 33% 5-Year
Milan Township, Monroe County 1,434 580 5% 13% 82% 4.5% 96% 19% 9% 5-Year
Monroe Charter Township, Monroe County 14,387 5,708 15% 24% 61% 8.4% 91% 25% 43% 5-Year
Monroe City, Monroe County 20,335 8,175 21% 23% 56% 9.2% 93% 23% 50% 5-Year
Petersburg City, Monroe County 1,315 509 5% 31% 64% 8.3% 90% 20% 33% 5-Year
Raisinville Township, Monroe County 5,806 1,962 6% 20% 74% 10.0% 95% 27% 59% 5-Year
Summerfield Township, Monroe County 3,262 1,145 7% 18% 75% 7.2% 92% 22% 54% 5-Year
Whiteford Township, Monroe County 4,536 1,740 6% 22% 72% 8.9% 92% 20% 24% 5-Year
Belvidere Township, Montcalm County 1,955 884 15% 41% 44% 12.9% 83% 25% 45% 5-Year
Bloomer Township, Montcalm County 3,738 553 12% 26% 62% 7.1% 87% 26% 43% 5-Year
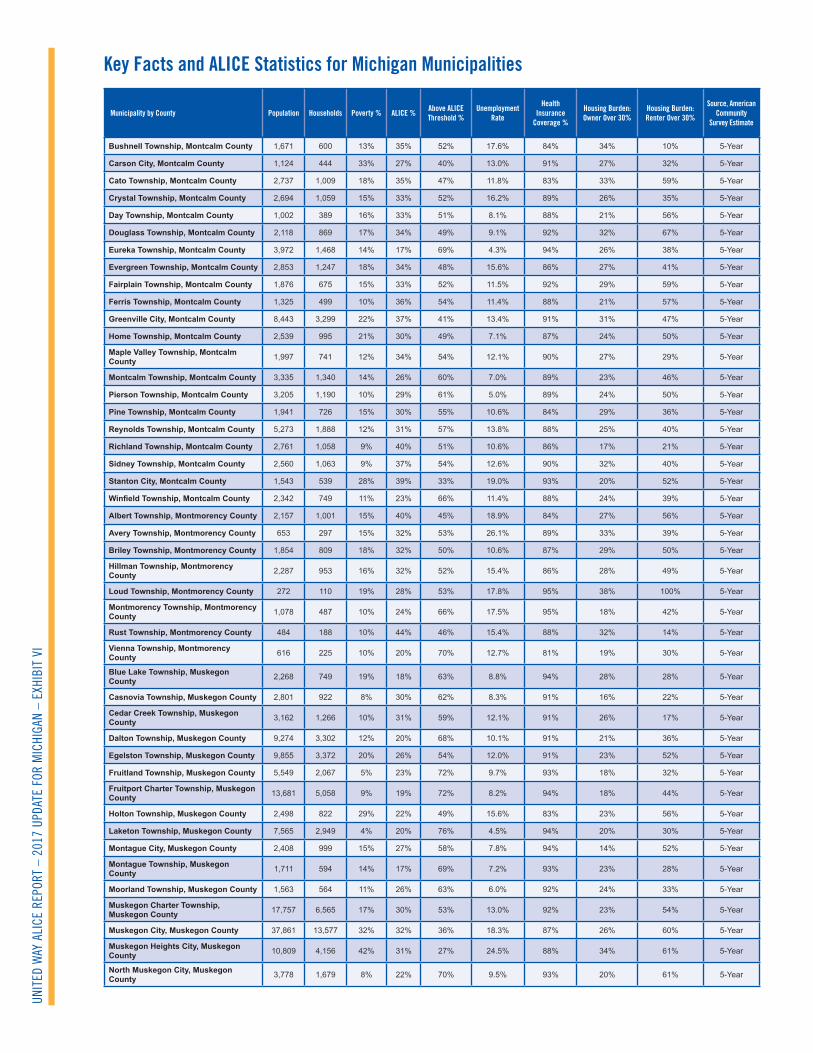
UNIT
ED W
AY A
LICE
REP
ORT
– 20
17 U
PDAT
E FO
R M
ICHI
GAN
– EX
HIBI
T VI
Municipality by County Population Households Poverty % ALICE % Above ALICE Threshold %
Unemployment Rate
Health Insurance
Coverage %
Housing Burden: Owner Over 30%
Housing Burden: Renter Over 30%
Source, American Community
Survey Estimate
Bushnell Township, Montcalm County 1,671 600 13% 35% 52% 17.6% 84% 34% 10% 5-Year
Carson City, Montcalm County 1,124 444 33% 27% 40% 13.0% 91% 27% 32% 5-Year
Cato Township, Montcalm County 2,737 1,009 18% 35% 47% 11.8% 83% 33% 59% 5-Year
Crystal Township, Montcalm County 2,694 1,059 15% 33% 52% 16.2% 89% 26% 35% 5-Year
Day Township, Montcalm County 1,002 389 16% 33% 51% 8.1% 88% 21% 56% 5-Year
Douglass Township, Montcalm County 2,118 869 17% 34% 49% 9.1% 92% 32% 67% 5-Year
Eureka Township, Montcalm County 3,972 1,468 14% 17% 69% 4.3% 94% 26% 38% 5-Year
Evergreen Township, Montcalm County 2,853 1,247 18% 34% 48% 15.6% 86% 27% 41% 5-Year
Fairplain Township, Montcalm County 1,876 675 15% 33% 52% 11.5% 92% 29% 59% 5-Year
Ferris Township, Montcalm County 1,325 499 10% 36% 54% 11.4% 88% 21% 57% 5-Year
Greenville City, Montcalm County 8,443 3,299 22% 37% 41% 13.4% 91% 31% 47% 5-Year
Home Township, Montcalm County 2,539 995 21% 30% 49% 7.1% 87% 24% 50% 5-Year
Maple Valley Township, Montcalm County 1,997 741 12% 34% 54% 12.1% 90% 27% 29% 5-Year
Montcalm Township, Montcalm County 3,335 1,340 14% 26% 60% 7.0% 89% 23% 46% 5-Year
Pierson Township, Montcalm County 3,205 1,190 10% 29% 61% 5.0% 89% 24% 50% 5-Year
Pine Township, Montcalm County 1,941 726 15% 30% 55% 10.6% 84% 29% 36% 5-Year
Reynolds Township, Montcalm County 5,273 1,888 12% 31% 57% 13.8% 88% 25% 40% 5-Year
Richland Township, Montcalm County 2,761 1,058 9% 40% 51% 10.6% 86% 17% 21% 5-Year
Sidney Township, Montcalm County 2,560 1,063 9% 37% 54% 12.6% 90% 32% 40% 5-Year
Stanton City, Montcalm County 1,543 539 28% 39% 33% 19.0% 93% 20% 52% 5-Year
Winfield Township, Montcalm County 2,342 749 11% 23% 66% 11.4% 88% 24% 39% 5-Year
Albert Township, Montmorency County 2,157 1,001 15% 40% 45% 18.9% 84% 27% 56% 5-Year
Avery Township, Montmorency County 653 297 15% 32% 53% 26.1% 89% 33% 39% 5-Year
Briley Township, Montmorency County 1,854 809 18% 32% 50% 10.6% 87% 29% 50% 5-Year
Hillman Township, Montmorency County 2,287 953 16% 32% 52% 15.4% 86% 28% 49% 5-Year
Loud Township, Montmorency County 272 110 19% 28% 53% 17.8% 95% 38% 100% 5-Year
Montmorency Township, Montmorency County 1,078 487 10% 24% 66% 17.5% 95% 18% 42% 5-Year
Rust Township, Montmorency County 484 188 10% 44% 46% 15.4% 88% 32% 14% 5-Year
Vienna Township, Montmorency County 616 225 10% 20% 70% 12.7% 81% 19% 30% 5-Year
Blue Lake Township, Muskegon County 2,268 749 19% 18% 63% 8.8% 94% 28% 28% 5-Year
Casnovia Township, Muskegon County 2,801 922 8% 30% 62% 8.3% 91% 16% 22% 5-Year
Cedar Creek Township, Muskegon County 3,162 1,266 10% 31% 59% 12.1% 91% 26% 17% 5-Year
Dalton Township, Muskegon County 9,274 3,302 12% 20% 68% 10.1% 91% 21% 36% 5-Year
Egelston Township, Muskegon County 9,855 3,372 20% 26% 54% 12.0% 91% 23% 52% 5-Year
Fruitland Township, Muskegon County 5,549 2,067 5% 23% 72% 9.7% 93% 18% 32% 5-Year
Fruitport Charter Township, Muskegon County 13,681 5,058 9% 19% 72% 8.2% 94% 18% 44% 5-Year
Holton Township, Muskegon County 2,498 822 29% 22% 49% 15.6% 83% 23% 56% 5-Year
Laketon Township, Muskegon County 7,565 2,949 4% 20% 76% 4.5% 94% 20% 30% 5-Year
Montague City, Muskegon County 2,408 999 15% 27% 58% 7.8% 94% 14% 52% 5-Year
Montague Township, Muskegon County 1,711 594 14% 17% 69% 7.2% 93% 23% 28% 5-Year
Moorland Township, Muskegon County 1,563 564 11% 26% 63% 6.0% 92% 24% 33% 5-Year
Muskegon Charter Township, Muskegon County 17,757 6,565 17% 30% 53% 13.0% 92% 23% 54% 5-Year
Muskegon City, Muskegon County 37,861 13,577 32% 32% 36% 18.3% 87% 26% 60% 5-Year
Muskegon Heights City, Muskegon County 10,809 4,156 42% 31% 27% 24.5% 88% 34% 61% 5-Year
North Muskegon City, Muskegon County 3,778 1,679 8% 22% 70% 9.5% 93% 20% 61% 5-Year
Key Facts and ALICE Statistics for Michigan Municipalities

UNIT
ED W
AY A
LICE
REP
ORT
– 20
17 U
PDAT
E FO
R M
ICHI
GAN
– EX
HIBI
T VI
Municipality by County Population Households Poverty % ALICE % Above ALICE Threshold %
Unemployment Rate
Health Insurance
Coverage %
Housing Burden: Owner Over 30%
Housing Burden: Renter Over 30%
Source, American Community
Survey Estimate
Norton Shores City, Muskegon County 23,982 10,020 9% 25% 66% 8.6% 93% 19% 45% 5-Year
Ravenna Township, Muskegon County 2,916 997 9% 23% 68% 6.0% 93% 22% 34% 5-Year
Roosevelt Park City, Muskegon County 3,819 1,681 15% 33% 52% 11.7% 92% 19% 59% 5-Year
Sullivan Township, Muskegon County 2,327 842 4% 20% 76% 9.8% 93% 20% 28% 5-Year
White River Township, Muskegon County 1,252 502 6% 22% 72% 3.9% 94% 18% 32% 5-Year
Whitehall City, Muskegon County 2,701 1,115 17% 26% 57% 8.8% 93% 16% 40% 5-Year
Whitehall Township, Muskegon County 1,946 692 5% 23% 72% 4.7% 94% 19% 19% 5-Year
Ashland Township, Newaygo County 2,743 868 13% 22% 65% 8.3% 90% 24% 24% 5-Year
Barton Township, Newaygo County 592 281 11% 25% 64% 12.7% 92% 16% 11% 5-Year
Beaver Township, Newaygo County 422 178 25% 22% 53% 10.9% 88% 25% 12% 5-Year
Big Prairie Township, Newaygo County 2,526 997 31% 25% 44% 17.6% 91% 43% 48% 5-Year
Bridgeton Township, Newaygo County 2,050 804 15% 27% 58% 8.4% 87% 29% 44% 5-Year
Brooks Township, Newaygo County 3,483 1,661 8% 32% 60% 9.7% 91% 22% 74% 5-Year
Croton Township, Newaygo County 3,213 1,263 12% 24% 64% 17.9% 88% 25% 43% 5-Year
Dayton Township, Newaygo County 2,095 711 10% 12% 78% 7.0% 90% 13% 57% 5-Year
Denver Township, Newaygo County 2,030 740 28% 21% 51% 10.1% 85% 35% 41% 5-Year
Ensley Township, Newaygo County 2,621 903 11% 19% 70% 8.6% 93% 25% 7% 5-Year
Everett Township, Newaygo County 1,764 685 20% 27% 53% 12.1% 89% 27% 46% 5-Year
Fremont City, Newaygo County 4,051 1,674 17% 21% 62% 7.7% 94% 13% 47% 5-Year
Garfield Township, Newaygo County 2,503 871 16% 23% 61% 12.9% 87% 25% 41% 5-Year
Goodwell Township, Newaygo County 607 213 12% 19% 69% 8.6% 90% 30% 50% 5-Year
Grant City, Newaygo County 859 385 24% 39% 37% 10.4% 91% 28% 61% 5-Year
Grant Township, Newaygo County 3,293 1,074 13% 21% 66% 7.2% 90% 26% 41% 5-Year
Lilley Township, Newaygo County 680 329 21% 34% 45% 6.2% 91% 29% 32% 5-Year
Lincoln Township, Newaygo County 1,492 579 10% 22% 68% 12.6% 93% 15% 56% 5-Year
Merrill Township, Newaygo County 607 260 35% 28% 37% 10.6% 84% 33% 65% 5-Year
Monroe Township, Newaygo County 343 149 9% 39% 52% 13.7% 92% 29% 46% 5-Year
Newaygo City, Newaygo County 1,870 769 28% 32% 40% 12.5% 91% 30% 46% 5-Year
Norwich Township, Newaygo County 666 227 9% 25% 66% 12.7% 85% 23% 50% 5-Year
Sheridan Charter Township, Newaygo County 2,538 946 14% 18% 68% 5.4% 89% 22% 56% 5-Year
Sherman Township, Newaygo County 2,056 730 14% 21% 65% 8.2% 88% 22% 59% 5-Year
White Cloud City, Newaygo County 1,351 452 35% 32% 33% 12.9% 90% 32% 55% 5-Year
Wilcox Township, Newaygo County 1,121 411 20% 23% 57% 8.2% 89% 24% 80% 5-Year
Addison Township, Oakland County 6,465 2,257 7% 16% 77% 12.0% 94% 26% 41% 5-Year
Auburn Hills City, Oakland County 22,085 8,988 10% 30% 60% 8.9% 89% 24% 42% 5-Year
Berkley City, Oakland County 15,178 6,573 5% 20% 75% 6.1% 95% 18% 35% 5-Year
Birmingham City, Oakland County 20,489 8,835 4% 13% 83% 3.7% 96% 29% 31% 5-Year
Bloomfield Charter Township, Oakland County 41,836 16,648 6% 11% 83% 4.8% 97% 25% 35% 5-Year
Bloomfield Hills City, Oakland County 3,956 1,277 3% 6% 91% 4.5% 99% 31% 23% 5-Year
Brandon Charter Township, Oakland County 15,457 5,467 11% 14% 75% 8.9% 92% 29% 40% 5-Year
Clawson City, Oakland County 11,988 5,481 7% 26% 67% 6.1% 90% 20% 27% 5-Year
Commerce Charter Township, Oakland County 41,495 15,405 8% 14% 78% 6.1% 93% 24% 43% 5-Year
Farmington City, Oakland County 10,509 4,671 8% 23% 69% 5.8% 95% 18% 33% 5-Year
Farmington Hills City, Oakland County 80,971 34,013 8% 21% 71% 5.1% 93% 25% 44% 5-Year
Ferndale City, Oakland County 20,160 9,479 13% 29% 58% 9.3% 83% 23% 42% 5-Year
Groveland Township, Oakland County 5,556 1,894 7% 13% 80% 9.8% 93% 26% 35% 5-Year
Hazel Park City, Oakland County 16,600 6,958 25% 34% 41% 12.3% 85% 27% 57% 5-Year
Highland Charter Township, Oakland County 19,550 7,306 9% 20% 71% 7.2% 93% 24% 38% 5-Year

UNIT
ED W
AY A
LICE
REP
ORT
– 20
17 U
PDAT
E FO
R M
ICHI
GAN
– EX
HIBI
T VI
Municipality by County Population Households Poverty % ALICE % Above ALICE Threshold %
Unemployment Rate
Health Insurance
Coverage %
Housing Burden: Owner Over 30%
Housing Burden: Renter Over 30%
Source, American Community
Survey Estimate
Holly Township, Oakland County 11,523 4,272 10% 22% 68% 8.6% 92% 22% 29% 5-Year
Huntington Woods City, Oakland County 6,333 2,457 3% 8% 89% 3.5% 98% 19% 14% 5-Year
Independence Charter Township, Oakland County 35,657 13,377 6% 17% 77% 7.5% 95% 20% 42% 5-Year
Keego Harbor City, Oakland County 3,016 1,409 20% 32% 48% 10.1% 80% 30% 55% 5-Year
Lake Angelus City, Oakland County 269 134 0% 7% 93% 0.9% 99% 42% 0% 5-Year
Lathrup Village City, Oakland County 4,137 1,553 2% 10% 88% 7.6% 96% 21% 11% 5-Year
Lyon Charter Township, Oakland County 16,466 5,907 5% 20% 75% 4.4% 96% 21% 52% 5-Year
Madison Heights City, Oakland County 30,123 12,855 19% 32% 49% 9.8% 88% 29% 49% 5-Year
Milford Charter Township, Oakland County 16,263 6,219 7% 16% 77% 7.0% 92% 20% 45% 5-Year
Northville City, Oakland County 3,291 1,350 5% 10% 85% 6.4% 97% 18% 16% 5-Year
Novi City, Oakland County 57,577 23,077 7% 17% 76% 4.8% 94% 20% 37% 5-Year
Oak Park City, Oakland County 29,727 11,494 16% 28% 56% 12.3% 87% 30% 50% 5-Year
Oakland Charter Township, Oakland County 18,174 6,298 4% 12% 84% 5.4% 97% 21% 38% 5-Year
Orchard Lake Village City, Oakland County 2,488 805 3% 2% 95% 10.6% 97% 32% 26% 5-Year
Orion Charter Township, Oakland County 36,870 13,249 7% 17% 76% 7.2% 93% 19% 42% 5-Year
Oxford Charter Township, Oakland County 21,072 7,868 8% 19% 73% 7.7% 93% 24% 39% 5-Year
Pleasant Ridge City, Oakland County 2,555 1,109 4% 13% 83% 4.0% 96% 23% 65% 5-Year
Pontiac City, Oakland County 59,928 23,566 33% 33% 34% 18.9% 83% 31% 51% 5-Year
Rochester City, Oakland County 12,909 5,544 6% 21% 73% 5.7% 95% 19% 44% 5-Year
Rochester Hills City, Oakland County 72,643 28,046 6% 18% 76% 5.6% 94% 19% 40% 5-Year
Rose Township, Oakland County 6,363 2,587 4% 25% 71% 14.7% 94% 27% 16% 5-Year
Royal Oak Charter Township, Oakland County 2,438 1,052 32% 41% 27% 20.2% 92% 39% 56% 5-Year
Royal Oak City, Oakland County 58,689 28,371 8% 24% 68% 5.1% 92% 21% 32% 5-Year
South Lyon City, Oakland County 11,616 4,805 8% 26% 66% 5.4% 92% 21% 38% 5-Year
Southfield City, Oakland County 72,859 32,219 14% 28% 58% 11.4% 90% 31% 53% 5-Year
Southfield Township, Oakland County 14,759 5,720 5% 10% 85% 4.6% 97% 25% 36% 5-Year
Springfield Charter Township, Oakland County 14,255 5,107 6% 16% 78% 8.9% 94% 22% 35% 5-Year
Sylvan Lake City, Oakland County 1,701 811 4% 21% 75% 7.7% 95% 25% 31% 5-Year
Troy City, Oakland County 82,542 30,812 7% 15% 78% 6.2% 92% 20% 36% 5-Year
Village Of Clarkston City, Oakland County 922 408 5% 24% 71% 7.9% 95% 22% 45% 5-Year
Walled Lake City, Oakland County 7,091 3,372 10% 34% 56% 7.0% 90% 23% 38% 5-Year
Waterford Charter Township, Oakland County 72,756 30,127 12% 25% 63% 8.4% 88% 24% 46% 5-Year
West Bloomfield Charter Township, Oakland County 65,646 24,453 6% 13% 81% 6.8% 94% 26% 51% 5-Year
White Lake Charter Township, Oakland County 30,731 11,602 6% 21% 73% 6.2% 93% 24% 45% 5-Year
Wixom City, Oakland County 13,690 6,153 14% 32% 54% 5.2% 90% 20% 40% 5-Year
Benona Township, Oceana County 1,445 623 12% 30% 58% 8.7% 89% 27% 41% 5-Year
Claybanks Township, Oceana County 795 350 13% 26% 61% 7.9% 92% 23% 7% 5-Year
Colfax Township, Oceana County 366 157 13% 22% 65% 6.3% 78% 28% 23% 5-Year
Crystal Township, Oceana County 841 273 27% 34% 39% 7.3% 77% 34% 13% 5-Year
Elbridge Township, Oceana County 1,234 359 14% 38% 48% 10.0% 79% 18% 49% 5-Year
Ferry Township, Oceana County 1,056 458 16% 31% 53% 10.7% 89% 28% 0% 5-Year
Golden Township, Oceana County 1,707 720 18% 28% 54% 8.4% 92% 26% 45% 5-Year
Grant Township, Oceana County 2,939 1,051 14% 26% 60% 6.8% 85% 26% 41% 5-Year
Greenwood Township, Oceana County 1,200 414 13% 32% 55% 10.1% 80% 25% 14% 5-Year
Key Facts and ALICE Statistics for Michigan Municipalities

UNIT
ED W
AY A
LICE
REP
ORT
– 20
17 U
PDAT
E FO
R M
ICHI
GAN
– EX
HIBI
T VI
Municipality by County Population Households Poverty % ALICE % Above ALICE Threshold %
Unemployment Rate
Health Insurance
Coverage %
Housing Burden: Owner Over 30%
Housing Burden: Renter Over 30%
Source, American Community
Survey Estimate
Hart City, Oceana County 2,105 701 24% 41% 35% 7.1% 90% 30% 52% 5-Year
Hart Township, Oceana County 1,938 700 15% 31% 54% 7.2% 87% 22% 28% 5-Year
Leavitt Township, Oceana County 822 292 20% 36% 44% 13.0% 88% 20% 53% 5-Year
Newfield Township, Oceana County 2,295 909 16% 29% 55% 11.7% 90% 21% 64% 5-Year
Otto Township, Oceana County 831 317 15% 36% 49% 7.9% 91% 36% 8% 5-Year
Pentwater Township, Oceana County 1,454 695 15% 23% 62% 5.3% 93% 29% 54% 5-Year
Shelby Township, Oceana County 4,009 1,361 18% 33% 49% 10.6% 86% 20% 49% 5-Year
Weare Township, Oceana County 1,192 442 14% 32% 54% 7.2% 87% 27% 31% 5-Year
Churchill Township, Ogemaw County 1,559 700 9% 22% 69% 9.0% 92% 22% 11% 5-Year
Cumming Township, Ogemaw County 662 291 22% 26% 52% 8.5% 90% 29% 37% 5-Year
Edwards Township, Ogemaw County 1,408 608 14% 27% 59% 9.4% 91% 32% 39% 5-Year
Foster Township, Ogemaw County 758 373 12% 26% 62% 11.1% 92% 26% 29% 5-Year
Goodar Township, Ogemaw County 440 211 18% 20% 62% 18.5% 91% 24% 67% 5-Year
Hill Township, Ogemaw County 1,388 687 11% 24% 65% 3.5% 92% 30% 47% 5-Year
Horton Township, Ogemaw County 1,127 443 18% 22% 60% 8.4% 88% 29% 67% 5-Year
Klacking Township, Ogemaw County 531 254 15% 19% 66% 12.9% 88% 30% 29% 5-Year
Logan Township, Ogemaw County 520 232 17% 28% 55% 10.3% 86% 31% 50% 5-Year
Mills Township, Ogemaw County 4,189 1,902 35% 26% 39% 23.3% 84% 32% 63% 5-Year
Ogemaw Township, Ogemaw County 1,025 412 9% 25% 66% 9.4% 92% 21% 40% 5-Year
Richland Township, Ogemaw County 989 400 14% 23% 63% 9.4% 88% 27% 71% 5-Year
Rose City, Ogemaw County 612 216 52% 17% 31% 22.8% 89% 37% 55% 5-Year
Rose Township, Ogemaw County 1,178 568 11% 27% 62% 13.1% 89% 26% 53% 5-Year
West Branch City, Ogemaw County 2,300 1,063 26% 35% 39% 10.0% 88% 43% 66% 5-Year
West Branch Township, Ogemaw County 2,536 1,074 9% 28% 63% 10.8% 93% 25% 38% 5-Year
Bergland Township, Ontonagon County 470 233 15% 33% 52% 7.6% 91% 25% 71% 5-Year
Carp Lake Township, Ontonagon County 632 300 7% 35% 58% 16.1% 92% 20% 0% 5-Year
Greenland Township, Ontonagon County 756 349 15% 31% 54% 20.8% 84% 20% 29% 5-Year
Haight Township, Ontonagon County 202 100 17% 21% 62% 8.3% 82% 37% 0% 5-Year
Interior Township, Ontonagon County 388 166 24% 31% 45% 10.9% 84% 36% 22% 5-Year
Mcmillan Township, Ontonagon County 407 198 14% 21% 65% 5.9% 88% 12% 31% 5-Year
Ontonagon Township, Ontonagon County 2,425 1,226 15% 33% 52% 14.8% 87% 26% 47% 5-Year
Stannard Township, Ontonagon County 667 336 18% 38% 44% 9.6% 88% 29% 54% 5-Year
Burdell Township, Osceola County 1,193 466 8% 29% 63% 6.8% 85% 18% 38% 5-Year
Cedar Township, Osceola County 453 178 21% 22% 57% 7.0% 94% 29% 48% 5-Year
Evart City, Osceola County 1,515 644 41% 31% 28% 14.7% 92% 34% 52% 5-Year
Evart Township, Osceola County 1,429 557 14% 21% 65% 11.9% 88% 24% 42% 5-Year
Hartwick Township, Osceola County 578 238 14% 34% 52% 5.7% 83% 25% 54% 5-Year
Hersey Township, Osceola County 1,837 695 12% 32% 56% 8.7% 88% 22% 38% 5-Year
Highland Township, Osceola County 1,318 459 16% 22% 62% 8.6% 81% 21% 7% 5-Year
Le Roy Township, Osceola County 1,308 432 14% 26% 60% 10.7% 82% 23% 54% 5-Year
Lincoln Township, Osceola County 1,564 618 17% 33% 50% 11.1% 91% 16% 51% 5-Year
Marion Township, Osceola County 1,509 593 23% 31% 46% 14.7% 84% 29% 51% 5-Year
Middle Branch Township, Osceola County 810 310 27% 25% 48% 10.5% 87% 34% 51% 5-Year
Orient Township, Osceola County 854 300 17% 27% 56% 11.0% 81% 28% 69% 5-Year
Osceola Township, Osceola County 1,233 393 9% 32% 59% 9.2% 86% 38% 35% 5-Year
Reed City, Osceola County 2,828 1,060 37% 20% 43% 14.0% 84% 21% 42% 5-Year
Richmond Township, Osceola County 1,578 604 7% 28% 65% 6.3% 93% 16% 7% 5-Year
Rose Lake Township, Osceola County 1,294 492 16% 30% 54% 9.6% 79% 30% 21% 5-Year

UNIT
ED W
AY A
LICE
REP
ORT
– 20
17 U
PDAT
E FO
R M
ICHI
GAN
– EX
HIBI
T VI
Municipality by County Population Households Poverty % ALICE % Above ALICE Threshold %
Unemployment Rate
Health Insurance
Coverage %
Housing Burden: Owner Over 30%
Housing Burden: Renter Over 30%
Source, American Community
Survey Estimate
Sherman Township, Osceola County 1,010 374 14% 27% 59% 6.6% 90% 26% 22% 5-Year
Sylvan Township, Osceola County 923 344 10% 29% 61% 10.8% 79% 23% 51% 5-Year
Big Creek Township, Oscoda County 2,755 1,270 16% 35% 49% 13.4% 88% 28% 56% 5-Year
Clinton Township, Oscoda County 463 241 18% 26% 56% 13.8% 93% 25% 0% 5-Year
Comins Township, Oscoda County 1,824 727 24% 22% 54% 10.4% 83% 28% 36% 5-Year
Elmer Township, Oscoda County 1,127 395 15% 22% 63% 17.7% 58% 31% 27% 5-Year
Greenwood Township, Oscoda County 1,168 560 19% 23% 58% 12.5% 86% 26% 39% 5-Year
Mentor Township, Oscoda County 1,107 493 22% 31% 47% 12.5% 89% 31% 40% 5-Year
Bagley Township, Otsego County 5,878 2,312 15% 18% 67% 8.7% 91% 15% 63% 5-Year
Charlton Township, Otsego County 1,377 647 7% 29% 64% 7.2% 91% 23% 18% 5-Year
Chester Township, Otsego County 1,233 505 6% 25% 69% 8.9% 84% 31% 38% 5-Year
Corwith Township, Otsego County 1,872 781 20% 35% 45% 10.6% 83% 19% 65% 5-Year
Dover Township, Otsego County 485 192 6% 17% 77% 3.2% 94% 18% 37% 5-Year
Elmira Township, Otsego County 1,669 684 9% 13% 78% 6.2% 91% 21% 33% 5-Year
Gaylord City, Otsego County 3,640 1,709 19% 35% 46% 2.2% 89% 21% 52% 5-Year
Hayes Township, Otsego County 2,616 972 8% 19% 73% 11.8% 92% 26% 35% 5-Year
Livingston Township, Otsego County 2,535 972 8% 27% 65% 8.3% 92% 23% 41% 5-Year
Otsego Lake Township, Otsego County 2,836 1,182 7% 16% 77% 11.1% 91% 25% 11% 5-Year
Allendale Charter Township, Ottawa County 21,586 5,807 27% 24% 49% 8.2% 93% 22% 66% 5-Year
Blendon Township, Ottawa County 6,043 2,020 6% 28% 66% 6.3% 98% 19% 55% 5-Year
Chester Township, Ottawa County 1,902 743 5% 28% 67% 6.2% 92% 18% 25% 5-Year
Coopersville City, Ottawa County 4,329 1,671 15% 35% 50% 4.8% 87% 22% 43% 5-Year
Crockery Township, Ottawa County 4,208 1,525 15% 38% 47% 10.5% 89% 27% 47% 5-Year
Ferrysburg City, Ottawa County 2,955 1,363 6% 22% 72% 7.1% 89% 24% 30% 5-Year
Georgetown Charter Township, Ottawa County 48,911 17,272 7% 25% 68% 4.2% 97% 17% 48% 5-Year
Grand Haven Charter Township, Ottawa County 15,757 5,658 5% 25% 70% 6.5% 94% 17% 26% 5-Year
Grand Haven City, Ottawa County 10,819 4,988 10% 40% 50% 10.2% 88% 24% 42% 5-Year
Holland Charter Township, Ottawa County 36,918 13,056 11% 27% 62% 5.1% 92% 16% 44% 5-Year
Holland City, Ottawa County 26,493 8,679 15% 34% 51% 6.8% 92% 24% 48% 5-Year
Hudsonville City, Ottawa County 7,271 2,519 10% 33% 57% 8.6% 92% 18% 29% 5-Year
Jamestown Charter Township, Ottawa County 7,537 2,463 4% 15% 81% 3.1% 97% 18% 14% 5-Year
Olive Township, Ottawa County 4,903 1,501 4% 33% 63% 4.1% 92% 17% 61% 5-Year
Park Township, Ottawa County 18,315 6,635 5% 20% 75% 5.6% 95% 17% 40% 5-Year
Polkton Charter Township, Ottawa County 2,643 926 6% 25% 69% 5.3% 93% 14% 30% 5-Year
Port Sheldon Township, Ottawa County 4,394 1,710 3% 33% 64% 6.6% 95% 29% 52% 5-Year
Robinson Township, Ottawa County 6,288 2,127 3% 26% 71% 3.6% 94% 22% 10% 5-Year
Spring Lake Township, Ottawa County 14,726 5,994 8% 31% 61% 7.8% 91% 20% 44% 5-Year
Tallmadge Charter Township, Ottawa County 7,829 2,798 5% 29% 66% 6.4% 96% 14% 41% 5-Year
Wright Township, Ottawa County 3,212 1,082 5% 35% 60% 7.6% 93% 19% 17% 5-Year
Zeeland Charter Township, Ottawa County 10,506 3,350 7% 26% 67% 8.1% 92% 23% 23% 5-Year
Zeeland City, Ottawa County 5,591 2,396 11% 48% 41% 3.9% 95% 13% 43% 5-Year
Allis Township, Presque Isle County 969 424 20% 28% 52% 19.3% 85% 26% 39% 5-Year
Bearinger Township, Presque Isle County 324 171 6% 23% 71% 19.5% 94% 28% 75% 5-Year
Belknap Township, Presque Isle County 771 307 14% 27% 59% 10.2% 86% 22% 11% 5-Year
Bismarck Township, Presque Isle County 364 179 21% 25% 54% 11.6% 88% 37% 38% 5-Year
Key Facts and ALICE Statistics for Michigan Municipalities

UNIT
ED W
AY A
LICE
REP
ORT
– 20
17 U
PDAT
E FO
R M
ICHI
GAN
– EX
HIBI
T VI
Municipality by County Population Households Poverty % ALICE % Above ALICE Threshold %
Unemployment Rate
Health Insurance
Coverage %
Housing Burden: Owner Over 30%
Housing Burden: Renter Over 30%
Source, American Community
Survey Estimate
Case Township, Presque Isle County 791 364 15% 28% 57% 19.1% 89% 23% 58% 5-Year
Krakow Township, Presque Isle County 734 356 17% 21% 62% 7.3% 84% 26% 0% 5-Year
Metz Township, Presque Isle County 234 124 19% 29% 52% 21.0% 86% 23% 25% 5-Year
Moltke Township, Presque Isle County 287 126 11% 20% 69% 6.8% 88% 22% 0% 5-Year
North Allis Township, Presque Isle County 398 198 5% 20% 75% 21.4% 92% 21% 0% 5-Year
Ocqueoc Township, Presque Isle County 588 305 14% 23% 63% 9.6% 95% 25% 27% 5-Year
Onaway City, Presque Isle County 791 344 28% 33% 39% 15.9% 86% 38% 26% 5-Year
Posen Township, Presque Isle County 788 349 15% 23% 62% 6.7% 89% 14% 35% 5-Year
Presque Isle Township, Presque Isle County 1,790 828 6% 10% 84% 9.0% 93% 20% 40% 5-Year
Pulawski Township, Presque Isle County 352 146 10% 31% 59% 6.5% 84% 21% 0% 5-Year
Rogers City, Presque Isle County 2,751 1,325 16% 26% 58% 16.4% 89% 10% 43% 5-Year
Rogers Township, Presque Isle County 1,105 453 9% 18% 73% 9.6% 94% 20% 36% 5-Year
Au Sable Township, Roscommon County 290 133 28% 26% 46% 28.8% 90% 36% 33% 5-Year
Backus Township, Roscommon County 429 161 16% 20% 64% 11.5% 88% 30% 83% 5-Year
Denton Township, Roscommon County 5,443 2,832 20% 27% 53% 11.2% 88% 29% 55% 5-Year
Gerrish Township, Roscommon County 2,952 1,387 11% 19% 70% 8.6% 87% 26% 64% 5-Year
Higgins Township, Roscommon County 1,899 796 31% 16% 53% 16.7% 94% 22% 58% 5-Year
Lake Township, Roscommon County 1,035 520 14% 18% 68% 15.8% 87% 28% 45% 5-Year
Lyon Township, Roscommon County 1,261 601 17% 18% 65% 11.4% 89% 22% 63% 5-Year
Markey Township, Roscommon County 2,459 1,215 16% 25% 59% 13.5% 93% 29% 52% 5-Year
Nester Township, Roscommon County 293 123 14% 20% 66% 6.4% 89% 28% 0% 5-Year
Richfield Township, Roscommon County 3,673 1,770 25% 22% 53% 21.4% 87% 26% 66% 5-Year
Roscommon Township, Roscommon County 4,334 2,005 19% 31% 50% 15.0% 87% 38% 53% 5-Year
Albee Township, Saginaw County 1,999 781 12% 22% 66% 10.7% 92% 31% 19% 5-Year
Birch Run Township, Saginaw County 5,909 2,361 7% 20% 73% 8.2% 89% 20% 37% 5-Year
Blumfield Township, Saginaw County 1,846 746 6% 14% 80% 3.2% 96% 21% 14% 5-Year
Brady Township, Saginaw County 2,137 814 10% 22% 68% 5.7% 92% 27% 40% 5-Year
Brant Township, Saginaw County 2,012 749 12% 14% 74% 6.8% 92% 24% 51% 5-Year
Bridgeport Charter Township, Saginaw County 10,270 4,387 16% 25% 59% 10.9% 91% 24% 50% 5-Year
Buena Vista Charter Township, Saginaw County 8,416 3,502 30% 37% 33% 16.8% 92% 34% 74% 5-Year
Carrollton Township, Saginaw County 5,957 2,203 22% 22% 56% 14.1% 88% 19% 71% 5-Year
Chapin Township, Saginaw County 939 370 22% 23% 55% 10.7% 87% 34% 72% 5-Year
Chesaning Township, Saginaw County 4,556 1,901 10% 31% 59% 11.0% 94% 23% 43% 5-Year
Frankenmuth City, Saginaw County 4,947 2,269 7% 20% 73% 3.9% 96% 17% 48% 5-Year
Frankenmuth Township, Saginaw County 2,176 770 3% 12% 85% 5.3% 96% 18% 6% 5-Year
Fremont Township, Saginaw County 2,061 795 5% 16% 79% 6.3% 93% 23% 35% 5-Year
James Township, Saginaw County 1,766 727 4% 18% 78% 6.1% 94% 15% 34% 5-Year
Jonesfield Township, Saginaw County 1,549 602 10% 25% 65% 8.3% 92% 23% 39% 5-Year
Kochville Township, Saginaw County 5,029 1,249 25% 16% 59% 11.9% 95% 19% 70% 5-Year
Lakefield Township, Saginaw County 953 371 9% 20% 71% 7.0% 97% 25% 37% 5-Year
Maple Grove Township, Saginaw County 2,614 954 7% 17% 76% 8.3% 96% 29% 39% 5-Year
Marion Township, Saginaw County 913 350 18% 24% 58% 11.1% 82% 29% 41% 5-Year
Richland Township, Saginaw County 4,058 1,583 5% 16% 79% 5.2% 94% 21% 41% 5-Year
Saginaw Charter Township, Saginaw County 40,264 17,844 11% 21% 68% 6.3% 93% 18% 37% 5-Year
Saginaw City, Saginaw County 50,288 19,286 33% 28% 39% 21.1% 87% 29% 60% 5-Year
Spaulding Township, Saginaw County 2,113 787 8% 21% 71% 12.8% 91% 19% 35% 5-Year
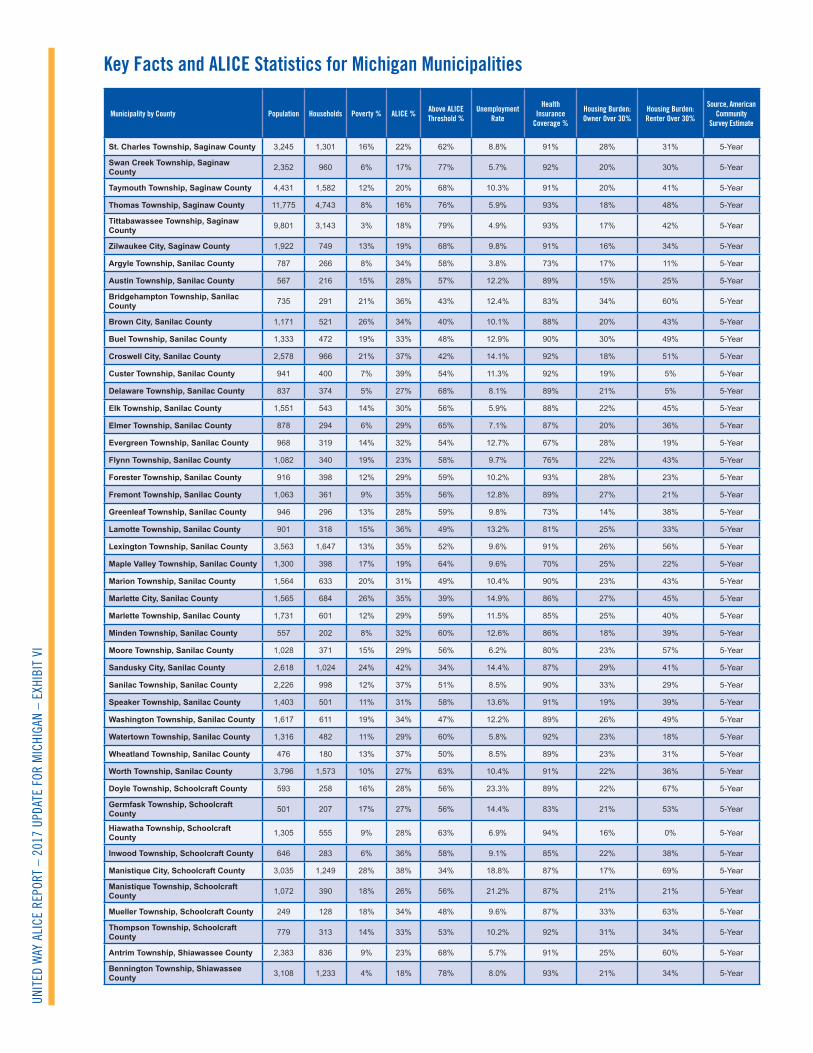
UNIT
ED W
AY A
LICE
REP
ORT
– 20
17 U
PDAT
E FO
R M
ICHI
GAN
– EX
HIBI
T VI
Municipality by County Population Households Poverty % ALICE % Above ALICE Threshold %
Unemployment Rate
Health Insurance
Coverage %
Housing Burden: Owner Over 30%
Housing Burden: Renter Over 30%
Source, American Community
Survey Estimate
St. Charles Township, Saginaw County 3,245 1,301 16% 22% 62% 8.8% 91% 28% 31% 5-Year
Swan Creek Township, Saginaw County 2,352 960 6% 17% 77% 5.7% 92% 20% 30% 5-Year
Taymouth Township, Saginaw County 4,431 1,582 12% 20% 68% 10.3% 91% 20% 41% 5-Year
Thomas Township, Saginaw County 11,775 4,743 8% 16% 76% 5.9% 93% 18% 48% 5-Year
Tittabawassee Township, Saginaw County 9,801 3,143 3% 18% 79% 4.9% 93% 17% 42% 5-Year
Zilwaukee City, Saginaw County 1,922 749 13% 19% 68% 9.8% 91% 16% 34% 5-Year
Argyle Township, Sanilac County 787 266 8% 34% 58% 3.8% 73% 17% 11% 5-Year
Austin Township, Sanilac County 567 216 15% 28% 57% 12.2% 89% 15% 25% 5-Year
Bridgehampton Township, Sanilac County 735 291 21% 36% 43% 12.4% 83% 34% 60% 5-Year
Brown City, Sanilac County 1,171 521 26% 34% 40% 10.1% 88% 20% 43% 5-Year
Buel Township, Sanilac County 1,333 472 19% 33% 48% 12.9% 90% 30% 49% 5-Year
Croswell City, Sanilac County 2,578 966 21% 37% 42% 14.1% 92% 18% 51% 5-Year
Custer Township, Sanilac County 941 400 7% 39% 54% 11.3% 92% 19% 5% 5-Year
Delaware Township, Sanilac County 837 374 5% 27% 68% 8.1% 89% 21% 5% 5-Year
Elk Township, Sanilac County 1,551 543 14% 30% 56% 5.9% 88% 22% 45% 5-Year
Elmer Township, Sanilac County 878 294 6% 29% 65% 7.1% 87% 20% 36% 5-Year
Evergreen Township, Sanilac County 968 319 14% 32% 54% 12.7% 67% 28% 19% 5-Year
Flynn Township, Sanilac County 1,082 340 19% 23% 58% 9.7% 76% 22% 43% 5-Year
Forester Township, Sanilac County 916 398 12% 29% 59% 10.2% 93% 28% 23% 5-Year
Fremont Township, Sanilac County 1,063 361 9% 35% 56% 12.8% 89% 27% 21% 5-Year
Greenleaf Township, Sanilac County 946 296 13% 28% 59% 9.8% 73% 14% 38% 5-Year
Lamotte Township, Sanilac County 901 318 15% 36% 49% 13.2% 81% 25% 33% 5-Year
Lexington Township, Sanilac County 3,563 1,647 13% 35% 52% 9.6% 91% 26% 56% 5-Year
Maple Valley Township, Sanilac County 1,300 398 17% 19% 64% 9.6% 70% 25% 22% 5-Year
Marion Township, Sanilac County 1,564 633 20% 31% 49% 10.4% 90% 23% 43% 5-Year
Marlette City, Sanilac County 1,565 684 26% 35% 39% 14.9% 86% 27% 45% 5-Year
Marlette Township, Sanilac County 1,731 601 12% 29% 59% 11.5% 85% 25% 40% 5-Year
Minden Township, Sanilac County 557 202 8% 32% 60% 12.6% 86% 18% 39% 5-Year
Moore Township, Sanilac County 1,028 371 15% 29% 56% 6.2% 80% 23% 57% 5-Year
Sandusky City, Sanilac County 2,618 1,024 24% 42% 34% 14.4% 87% 29% 41% 5-Year
Sanilac Township, Sanilac County 2,226 998 12% 37% 51% 8.5% 90% 33% 29% 5-Year
Speaker Township, Sanilac County 1,403 501 11% 31% 58% 13.6% 91% 19% 39% 5-Year
Washington Township, Sanilac County 1,617 611 19% 34% 47% 12.2% 89% 26% 49% 5-Year
Watertown Township, Sanilac County 1,316 482 11% 29% 60% 5.8% 92% 23% 18% 5-Year
Wheatland Township, Sanilac County 476 180 13% 37% 50% 8.5% 89% 23% 31% 5-Year
Worth Township, Sanilac County 3,796 1,573 10% 27% 63% 10.4% 91% 22% 36% 5-Year
Doyle Township, Schoolcraft County 593 258 16% 28% 56% 23.3% 89% 22% 67% 5-Year
Germfask Township, Schoolcraft County 501 207 17% 27% 56% 14.4% 83% 21% 53% 5-Year
Hiawatha Township, Schoolcraft County 1,305 555 9% 28% 63% 6.9% 94% 16% 0% 5-Year
Inwood Township, Schoolcraft County 646 283 6% 36% 58% 9.1% 85% 22% 38% 5-Year
Manistique City, Schoolcraft County 3,035 1,249 28% 38% 34% 18.8% 87% 17% 69% 5-Year
Manistique Township, Schoolcraft County 1,072 390 18% 26% 56% 21.2% 87% 21% 21% 5-Year
Mueller Township, Schoolcraft County 249 128 18% 34% 48% 9.6% 87% 33% 63% 5-Year
Thompson Township, Schoolcraft County 779 313 14% 33% 53% 10.2% 92% 31% 34% 5-Year
Antrim Township, Shiawassee County 2,383 836 9% 23% 68% 5.7% 91% 25% 60% 5-Year
Bennington Township, Shiawassee County 3,108 1,233 4% 18% 78% 8.0% 93% 21% 34% 5-Year
Key Facts and ALICE Statistics for Michigan Municipalities

UNIT
ED W
AY A
LICE
REP
ORT
– 20
17 U
PDAT
E FO
R M
ICHI
GAN
– EX
HIBI
T VI
Municipality by County Population Households Poverty % ALICE % Above ALICE Threshold %
Unemployment Rate
Health Insurance
Coverage %
Housing Burden: Owner Over 30%
Housing Burden: Renter Over 30%
Source, American Community
Survey Estimate
Burns Township, Shiawassee County 3,386 1,219 7% 18% 75% 10.9% 92% 24% 26% 5-Year
Caledonia Charter Township, Shiawassee County 4,395 1,759 16% 20% 64% 11.7% 93% 16% 55% 5-Year
Corunna City, Shiawassee County 3,415 1,381 23% 28% 49% 18.7% 85% 14% 51% 5-Year
Durand City, Shiawassee County 3,369 1,450 15% 29% 56% 13.4% 83% 21% 46% 5-Year
Fairfield Township, Shiawassee County 756 270 11% 29% 60% 6.5% 92% 32% 44% 5-Year
Hazelton Township, Shiawassee County 1,923 752 6% 14% 80% 4.0% 97% 18% 41% 5-Year
Laingsburg City, Shiawassee County 1,296 468 6% 16% 78% 8.2% 94% 20% 22% 5-Year
Middlebury Township, Shiawassee County 1,634 629 7% 17% 76% 8.3% 91% 28% 11% 5-Year
New Haven Township, Shiawassee County 1,303 486 7% 18% 75% 10.4% 94% 18% 53% 5-Year
Owosso Charter Township, Shiawassee County 4,732 1,819 14% 24% 62% 12.5% 93% 17% 43% 5-Year
Owosso City, Shiawassee County 14,826 6,181 20% 30% 50% 12.0% 86% 25% 43% 5-Year
Perry City, Shiawassee County 1,994 901 13% 32% 55% 12.5% 91% 22% 34% 5-Year
Perry Township, Shiawassee County 4,256 1,541 10% 16% 74% 10.9% 91% 24% 32% 5-Year
Rush Township, Shiawassee County 1,271 507 11% 18% 71% 10.5% 87% 20% 61% 5-Year
Sciota Township, Shiawassee County 1,545 658 8% 20% 72% 7.5% 90% 28% 64% 5-Year
Shiawassee Township, Shiawassee County 2,778 1,059 12% 15% 73% 5.7% 92% 23% 37% 5-Year
Venice Township, Shiawassee County 2,529 952 9% 20% 71% 10.8% 91% 17% 28% 5-Year
Vernon Township, Shiawassee County 4,482 1,843 14% 24% 62% 7.8% 92% 31% 52% 5-Year
Woodhull Township, Shiawassee County 3,732 1,465 6% 15% 79% 5.2% 88% 26% 58% 5-Year
Algonac City, St Clair County 4,063 1,956 15% 38% 47% 10.4% 86% 32% 49% 5-Year
Berlin Township, St Clair County 3,231 1,233 8% 16% 76% 8.2% 93% 28% 34% 5-Year
Brockway Township, St Clair County 1,782 644 8% 23% 69% 8.8% 94% 24% 18% 5-Year
Burtchville Township, St Clair County 3,945 1,577 13% 29% 58% 11.9% 92% 28% 32% 5-Year
Casco Township, St Clair County 4,043 1,401 9% 21% 70% 8.4% 87% 23% 28% 5-Year
China Township, St Clair County 3,494 1,242 4% 17% 79% 12.2% 93% 23% 56% 5-Year
Clay Township, St Clair County 8,898 3,905 8% 27% 65% 9.0% 90% 26% 45% 5-Year
Clyde Township, St Clair County 5,490 2,083 4% 34% 62% 9.2% 91% 19% 53% 5-Year
Columbus Township, St Clair County 4,009 1,450 3% 26% 71% 11.9% 94% 26% 37% 5-Year
Cottrellville Township, St Clair County 3,507 1,332 13% 27% 60% 9.8% 91% 36% 27% 5-Year
East China Township, St Clair County 3,737 1,588 10% 27% 63% 8.4% 92% 28% 65% 5-Year
Emmett Township, St Clair County 2,618 933 12% 23% 65% 8.2% 90% 31% 28% 5-Year
Fort Gratiot Charter Township, St Clair County 11,075 4,479 10% 30% 60% 6.7% 93% 15% 55% 5-Year
Grant Township, St Clair County 1,932 679 6% 26% 68% 11.5% 87% 28% 13% 5-Year
Greenwood Township, St Clair County 1,439 525 9% 24% 67% 8.4% 94% 24% 27% 5-Year
Ira Township, St Clair County 5,087 1,975 13% 22% 65% 13.8% 88% 26% 35% 5-Year
Kenockee Township, St Clair County 2,474 952 7% 28% 65% 9.5% 92% 30% 44% 5-Year
Kimball Township, St Clair County 9,202 3,665 12% 33% 55% 9.5% 92% 25% 42% 5-Year
Lynn Township, St Clair County 1,306 461 10% 28% 62% 13.0% 95% 35% 46% 5-Year
Marine City, St Clair County 4,172 1,837 17% 34% 49% 9.1% 88% 30% 36% 5-Year
Marysville City, St Clair County 9,797 4,208 11% 29% 60% 6.0% 95% 22% 35% 5-Year
Memphis City, St Clair County 437 149 5% 36% 59% 19.8% 93% 34% 81% 5-Year
Mussey Township, St Clair County 4,142 1,431 13% 25% 62% 13.0% 86% 32% 35% 5-Year
Port Huron Charter Township, St Clair County 10,467 3,980 20% 28% 52% 14.8% 91% 24% 60% 5-Year
Port Huron City, St Clair County 29,508 12,354 26% 34% 40% 14.7% 88% 27% 55% 5-Year
Riley Township, St Clair County 3,308 1,167 7% 23% 70% 3.6% 95% 30% 41% 5-Year
St. Clair City, St Clair County 5,394 2,309 13% 27% 60% 7.3% 90% 22% 55% 5-Year
St. Clair Township, St Clair County 6,728 2,555 4% 20% 76% 6.7% 95% 18% 38% 5-Year

UNIT
ED W
AY A
LICE
REP
ORT
– 20
17 U
PDAT
E FO
R M
ICHI
GAN
– EX
HIBI
T VI
Municipality by County Population Households Poverty % ALICE % Above ALICE Threshold %
Unemployment Rate
Health Insurance
Coverage %
Housing Burden: Owner Over 30%
Housing Burden: Renter Over 30%
Source, American Community
Survey Estimate
Wales Township, St Clair County 3,208 1,281 7% 23% 70% 9.8% 92% 33% 39% 5-Year
Yale City, St Clair County 1,931 790 22% 37% 41% 9.3% 89% 23% 51% 5-Year
Burr Oak Township, St Joseph County 2,614 925 11% 27% 62% 5.2% 80% 17% 46% 5-Year
Colon Township, St Joseph County 3,313 1,315 13% 31% 56% 12.7% 82% 28% 38% 5-Year
Constantine Township, St Joseph County 4,204 1,596 17% 25% 58% 8.3% 92% 25% 45% 5-Year
Fabius Township, St Joseph County 3,241 1,276 9% 20% 71% 6.1% 92% 13% 41% 5-Year
Fawn River Township, St Joseph County 1,461 548 13% 23% 64% 7.1% 89% 26% 63% 5-Year
Florence Township, St Joseph County 1,201 507 9% 31% 60% 5.8% 94% 23% 16% 5-Year
Flowerfield Township, St Joseph County 1,349 560 13% 23% 64% 4.2% 92% 20% 43% 5-Year
Leonidas Township, St Joseph County 1,087 414 11% 23% 66% 5.3% 94% 30% 36% 5-Year
Lockport Township, St Joseph County 3,768 1,526 7% 21% 72% 5.0% 93% 14% 50% 5-Year
Mendon Township, St Joseph County 2,685 1,023 12% 26% 62% 8.3% 92% 24% 56% 5-Year
Mottville Township, St Joseph County 1,667 612 12% 26% 62% 12.5% 89% 30% 42% 5-Year
Nottawa Township, St Joseph County 3,859 1,381 10% 22% 68% 8.2% 82% 19% 31% 5-Year
Park Township, St Joseph County 2,589 960 8% 18% 74% 6.8% 91% 23% 48% 5-Year
Sherman Township, St Joseph County 3,219 1,272 5% 20% 75% 6.8% 92% 23% 0% 5-Year
Sturgis City, St Joseph County 10,916 4,150 19% 33% 48% 10.5% 88% 24% 47% 5-Year
Sturgis Township, St Joseph County 2,323 884 19% 31% 50% 7.8% 91% 31% 51% 5-Year
Three Rivers City, St Joseph County 7,787 2,942 24% 28% 48% 11.7% 89% 20% 42% 5-Year
White Pigeon Township, St Joseph County 3,739 1,379 14% 25% 61% 9.1% 89% 13% 32% 5-Year
Akron Township, Tuscola County 1,537 605 12% 27% 61% 14.2% 90% 18% 39% 5-Year
Almer Township, Tuscola County 2,034 828 16% 16% 68% 3.4% 91% 18% 40% 5-Year
Arbela Township, Tuscola County 2,998 1,130 13% 16% 71% 12.3% 88% 23% 42% 5-Year
Caro City, Tuscola County 4,142 1,775 20% 31% 49% 14.2% 91% 22% 50% 5-Year
Columbia Township, Tuscola County 1,106 476 10% 25% 65% 4.4% 95% 19% 23% 5-Year
Dayton Township, Tuscola County 1,664 645 13% 24% 63% 7.5% 90% 33% 49% 5-Year
Denmark Township, Tuscola County 3,000 1,329 10% 25% 65% 1.4% 96% 15% 45% 5-Year
Elkland Township, Tuscola County 3,463 1,336 14% 20% 66% 8.0% 91% 20% 41% 5-Year
Ellington Township, Tuscola County 1,415 507 13% 17% 70% 7.1% 89% 22% 19% 5-Year
Elmwood Township, Tuscola County 963 411 13% 25% 62% 7.7% 90% 20% 40% 5-Year
Fairgrove Township, Tuscola County 1,561 620 11% 28% 61% 6.7% 91% 27% 47% 5-Year
Fremont Township, Tuscola County 3,246 1,386 16% 25% 59% 8.9% 85% 25% 55% 5-Year
Gilford Township, Tuscola County 803 294 10% 16% 74% 3.6% 91% 25% 33% 5-Year
Indianfields Township, Tuscola County 2,642 1,005 15% 22% 63% 5.1% 95% 22% 77% 5-Year
Juniata Township, Tuscola County 1,692 653 12% 23% 65% 8.4% 89% 28% 32% 5-Year
Kingston Township, Tuscola County 1,597 558 16% 30% 54% 18.6% 83% 31% 39% 5-Year
Koylton Township, Tuscola County 1,515 572 19% 21% 60% 7.4% 90% 36% 62% 5-Year
Millington Township, Tuscola County 4,260 1,603 13% 22% 65% 9.9% 93% 23% 65% 5-Year
Novesta Township, Tuscola County 1,468 565 12% 25% 63% 10.7% 87% 18% 54% 5-Year
Tuscola Township, Tuscola County 2,204 873 6% 15% 79% 11.0% 87% 18% 33% 5-Year
Vassar City, Tuscola County 2,648 1,013 21% 25% 54% 10.0% 90% 29% 53% 5-Year
Vassar Township, Tuscola County 3,980 1,394 21% 20% 59% 7.9% 87% 33% 41% 5-Year
Watertown Township, Tuscola County 2,118 798 10% 26% 64% 15.8% 88% 27% 33% 5-Year
Wells Township, Tuscola County 1,783 641 12% 24% 64% 13.3% 91% 28% 25% 5-Year
Wisner Township, Tuscola County 581 287 11% 28% 61% 9.5% 90% 24% 31% 5-Year
Almena Township, Van Buren County 4,957 1,737 8% 17% 75% 4.3% 97% 23% 71% 5-Year
Antwerp Township, Van Buren County 12,101 4,299 9% 22% 69% 5.8% 92% 20% 42% 5-Year
Key Facts and ALICE Statistics for Michigan Municipalities

UNIT
ED W
AY A
LICE
REP
ORT
– 20
17 U
PDAT
E FO
R M
ICHI
GAN
– EX
HIBI
T VI
Municipality by County Population Households Poverty % ALICE % Above ALICE Threshold %
Unemployment Rate
Health Insurance
Coverage %
Housing Burden: Owner Over 30%
Housing Burden: Renter Over 30%
Source, American Community
Survey Estimate
Arlington Township, Van Buren County 2,325 755 22% 30% 48% 10.6% 83% 36% 55% 5-Year
Bangor City, Van Buren County 1,849 716 24% 35% 41% 10.2% 85% 33% 47% 5-Year
Bangor Township, Van Buren County 2,111 773 15% 36% 49% 11.2% 90% 21% 24% 5-Year
Bloomingdale Township, Van Buren County 3,054 1,366 12% 32% 56% 6.8% 84% 31% 27% 5-Year
Columbia Township, Van Buren County 2,560 923 18% 27% 55% 6.7% 84% 30% 62% 5-Year
Covert Township, Van Buren County 2,837 994 34% 30% 36% 18.0% 83% 39% 58% 5-Year
Decatur Township, Van Buren County 3,652 1,343 29% 27% 44% 14.0% 87% 21% 58% 5-Year
Geneva Township, Van Buren County 3,506 1,185 19% 31% 50% 4.6% 84% 20% 49% 5-Year
Gobles City, Van Buren County 816 303 22% 31% 47% 8.2% 85% 24% 40% 5-Year
Hamilton Township, Van Buren County 1,314 506 12% 29% 59% 8.3% 89% 25% 55% 5-Year
Hartford City, Van Buren County 2,634 887 28% 34% 38% 15.8% 85% 21% 41% 5-Year
Hartford Township, Van Buren County 3,224 1,075 16% 27% 57% 14.6% 85% 21% 41% 5-Year
Keeler Township, Van Buren County 2,090 781 13% 33% 54% 10.8% 78% 28% 18% 5-Year
Lawrence Township, Van Buren County 3,232 1,219 20% 23% 57% 9.1% 86% 27% 40% 5-Year
Paw Paw Township, Van Buren County 6,942 2,748 22% 26% 52% 10.1% 89% 27% 38% 5-Year
Pine Grove Township, Van Buren County 2,932 1,075 9% 22% 69% 5.4% 92% 21% 36% 5-Year
Porter Township, Van Buren County 2,406 973 8% 21% 71% 4.3% 93% 26% 46% 5-Year
South Haven Charter Township, Van Buren County 3,930 1,714 15% 34% 51% 8.6% 90% 27% 46% 5-Year
South Haven City, Van Buren County 4,357 2,035 21% 29% 50% 7.1% 89% 29% 53% 5-Year
Waverly Township, Van Buren County 2,522 960 11% 32% 57% 5.8% 87% 30% 36% 5-Year
Ann Arbor Charter Township, Washtenaw County 4,445 1,786 6% 13% 81% 4.2% 98% 23% 41% 5-Year
Ann Arbor City, Washtenaw County 116,194 47,179 20% 23% 57% 6.5% 95% 22% 51% 5-Year
Augusta Charter Township, Washtenaw County 6,909 2,191 3% 27% 70% 9.3% 92% 26% 37% 5-Year
Bridgewater Township, Washtenaw County 1,561 597 7% 27% 66% 8.3% 95% 29% 82% 5-Year
Chelsea City, Washtenaw County 5,126 2,307 2% 28% 70% 10.3% 91% 22% 46% 5-Year
Dexter Township, Washtenaw County 6,299 2,252 2% 17% 81% 6.7% 97% 28% 53% 5-Year
Freedom Township, Washtenaw County 1,380 611 6% 21% 73% 5.5% 92% 28% 17% 5-Year
Lima Township, Washtenaw County 3,587 1,341 3% 17% 80% 2.8% 97% 24% 14% 5-Year
Lodi Township, Washtenaw County 6,284 2,275 3% 14% 83% 3.5% 95% 20% 9% 5-Year
Lyndon Township, Washtenaw County 2,733 987 6% 13% 81% 3.7% 95% 28% 7% 5-Year
Manchester Township, Washtenaw County 4,671 1,826 10% 26% 64% 6.5% 94% 23% 49% 5-Year
Milan City, Washtenaw County 3,863 1,482 5% 24% 71% 7.6% 95% 15% 33% 5-Year
Northfield Township, Washtenaw County 8,447 3,303 6% 34% 60% 5.2% 94% 34% 28% 5-Year
Pittsfield Charter Township, Washtenaw County 36,564 13,991 11% 25% 64% 5.5% 94% 22% 48% 5-Year
Salem Township, Washtenaw County 5,818 2,122 2% 21% 77% 13.3% 91% 25% 43% 5-Year
Saline City, Washtenaw County 9,020 3,831 5% 30% 65% 4.6% 97% 22% 44% 5-Year
Saline Township, Washtenaw County 1,892 766 9% 24% 67% 5.2% 93% 26% 44% 5-Year
Scio Township, Washtenaw County 20,918 7,704 8% 16% 76% 4.7% 97% 23% 36% 5-Year
Sharon Township, Washtenaw County 2,129 723 2% 22% 76% 3.8% 95% 34% 56% 5-Year
Superior Charter Township, Washtenaw County 13,376 4,890 13% 21% 66% 10.4% 94% 24% 51% 5-Year
Sylvan Township, Washtenaw County 2,891 1,169 4% 16% 80% 5.0% 96% 23% 5% 5-Year
Webster Township, Washtenaw County 7,006 2,445 3% 12% 85% 7.2% 98% 25% 36% 5-Year
York Charter Township, Washtenaw County 8,896 2,407 1% 13% 86% 6.4% 95% 12% 38% 5-Year
Ypsilanti Charter Township, Washtenaw County 54,209 22,071 16% 34% 50% 10.1% 91% 26% 53% 5-Year
Ypsilanti City, Washtenaw County 19,874 7,811 31% 34% 35% 12.4% 87% 31% 55% 5-Year
Allen Park City, Wayne County 27,676 10,592 6% 25% 69% 7.7% 94% 19% 41% 5-Year

UNIT
ED W
AY A
LICE
REP
ORT
– 20
17 U
PDAT
E FO
R M
ICHI
GAN
– EX
HIBI
T VI
Municipality by County Population Households Poverty % ALICE % Above ALICE Threshold %
Unemployment Rate
Health Insurance
Coverage %
Housing Burden: Owner Over 30%
Housing Burden: Renter Over 30%
Source, American Community
Survey Estimate
Belleville City, Wayne County 3,919 1,617 14% 33% 53% 7.7% 94% 34% 41% 5-Year
Brownstown Charter Township, Wayne County 30,607 11,119 8% 24% 68% 6.5% 94% 22% 44% 5-Year
Canton Charter Township, Wayne County 89,517 31,505 5% 16% 79% 6.6% 94% 21% 36% 5-Year
Dearborn City, Wayne County 96,069 31,502 22% 24% 54% 9.9% 87% 28% 55% 5-Year
Dearborn Heights City, Wayne County 56,656 20,646 17% 31% 52% 11.4% 87% 30% 52% 5-Year
Detroit City, Wayne County 690,074 255,740 37% 33% 30% 24.9% 83% 34% 58% 5-Year
Ecorse City, Wayne County 9,338 3,438 33% 36% 31% 24.6% 86% 28% 58% 5-Year
Flat Rock City, Wayne County 9,879 3,664 13% 28% 59% 8.6% 92% 22% 59% 5-Year
Garden City, Wayne County 27,161 10,326 10% 34% 56% 9.0% 89% 25% 49% 5-Year
Gibraltar City, Wayne County 4,566 1,739 11% 25% 64% 10.7% 95% 23% 54% 5-Year
Grosse Ile Township, Wayne County 10,209 4,035 3% 17% 80% 4.3% 97% 24% 42% 5-Year
Grosse Pointe City, Wayne County 5,295 2,155 3% 14% 83% 6.5% 95% 25% 45% 5-Year
Grosse Pointe Farms City, Wayne County 9,307 3,373 4% 8% 88% 5.1% 98% 24% 41% 5-Year
Grosse Pointe Park City, Wayne County 11,343 4,303 7% 18% 75% 5.4% 95% 26% 41% 5-Year
Grosse Pointe Woods City, Wayne County 15,859 6,089 6% 14% 80% 5.7% 96% 22% 25% 5-Year
Hamtramck City, Wayne County 22,150 6,241 42% 33% 25% 17.4% 78% 32% 51% 5-Year
Harper Woods City, Wayne County 13,964 5,283 14% 32% 54% 12.2% 86% 21% 47% 5-Year
Highland Park City, Wayne County 11,102 4,499 48% 30% 22% 32.0% 86% 36% 56% 5-Year
Huron Charter Township, Wayne County 15,716 5,472 10% 18% 72% 9.3% 93% 23% 35% 5-Year
Inkster City, Wayne County 24,897 9,451 33% 31% 36% 16.8% 87% 31% 58% 5-Year
Lincoln Park City, Wayne County 37,362 14,401 20% 32% 48% 12.0% 86% 23% 51% 5-Year
Livonia City, Wayne County 95,312 37,199 6% 20% 74% 6.3% 95% 19% 37% 5-Year
Melvindale City, Wayne County 10,510 4,124 27% 37% 36% 11.6% 89% 32% 53% 5-Year
Northville City, Wayne County 2,699 1,195 9% 18% 73% 9.3% 94% 18% 37% 5-Year
Northville Township, Wayne County 28,707 10,975 4% 16% 80% 4.2% 96% 22% 35% 5-Year
Plymouth Charter Township, Wayne County 27,109 10,622 5% 20% 75% 4.9% 95% 23% 36% 5-Year
Plymouth City, Wayne County 8,952 4,083 6% 25% 69% 4.7% 92% 20% 32% 5-Year
Redford Charter Township, Wayne County 47,652 18,057 13% 31% 56% 12.9% 88% 25% 50% 5-Year
River Rouge City, Wayne County 7,673 2,769 40% 30% 30% 26.0% 86% 22% 55% 5-Year
Riverview City, Wayne County 12,266 4,930 13% 29% 58% 7.1% 92% 22% 47% 5-Year
Rockwood City, Wayne County 3,227 1,318 7% 36% 57% 7.5% 91% 27% 25% 5-Year
Romulus City, Wayne County 23,557 8,506 18% 35% 47% 15.3% 87% 33% 49% 5-Year
Southgate City, Wayne County 29,518 12,499 12% 31% 57% 9.2% 92% 22% 38% 5-Year
Sumpter Township, Wayne County 9,386 3,533 17% 25% 58% 8.0% 92% 33% 33% 5-Year
Taylor City, Wayne County 62,021 23,742 20% 33% 47% 14.4% 89% 25% 50% 5-Year
Trenton City, Wayne County 18,522 7,798 9% 26% 65% 5.7% 95% 20% 43% 5-Year
Van Buren Charter Township, Wayne County 28,393 11,275 10% 31% 59% 8.7% 91% 22% 38% 5-Year
Village Of Grosse Pointe Shores City, Wayne County 2,885 1,163 2% 7% 91% 4.6% 99% 23% 21% 5-Year
Wayne City, Wayne County 17,251 6,792 20% 38% 42% 10.1% 87% 31% 56% 5-Year
Westland City, Wayne County 82,642 33,717 15% 34% 51% 9.2% 89% 23% 49% 5-Year
Woodhaven City, Wayne County 12,645 5,163 8% 29% 63% 8.4% 94% 26% 45% 5-Year
Wyandotte City, Wayne County 25,376 10,625 12% 31% 57% 10.3% 91% 21% 53% 5-Year
Antioch Township, Wexford County 932 353 14% 27% 59% 10.8% 88% 33% 35% 5-Year
Boon Township, Wexford County 751 277 17% 34% 49% 10.9% 93% 33% 65% 5-Year
Cadillac City, Wexford County 10,327 4,226 16% 33% 51% 9.3% 91% 22% 46% 5-Year
Key Facts and ALICE Statistics for Michigan Municipalities

UNIT
ED W
AY A
LICE
REP
ORT
– 20
17 U
PDAT
E FO
R M
ICHI
GAN
– EX
HIBI
T VI
Municipality by County Population Households Poverty % ALICE % Above ALICE Threshold %
Unemployment Rate
Health Insurance
Coverage %
Housing Burden: Owner Over 30%
Housing Burden: Renter Over 30%
Source, American Community
Survey Estimate
Cedar Creek Township, Wexford County 1,870 638 14% 24% 62% 7.3% 82% 34% 30% 5-Year
Cherry Grove Township, Wexford County 2,035 821 13% 24% 63% 6.9% 95% 26% 25% 5-Year
Clam Lake Township, Wexford County 2,389 859 5% 17% 78% 7.2% 95% 18% 19% 5-Year
Colfax Township, Wexford County 931 345 15% 23% 62% 8.6% 81% 30% 22% 5-Year
Greenwood Township, Wexford County 623 205 19% 26% 55% 13.8% 82% 32% 31% 5-Year
Hanover Township, Wexford County 1,536 538 15% 24% 61% 9.2% 84% 23% 65% 5-Year
Haring Charter Township, Wexford County 3,354 1,208 17% 19% 64% 11.0% 83% 16% 63% 5-Year
Liberty Township, Wexford County 951 351 19% 18% 63% 9.4% 87% 26% 44% 5-Year
Manton City, Wexford County 1,240 496 17% 38% 45% 15.3% 80% 18% 37% 5-Year
Selma Township, Wexford County 2,102 899 16% 30% 54% 7.5% 92% 24% 50% 5-Year
Slagle Township, Wexford County 549 245 18% 34% 48% 6.2% 90% 24% 44% 5-Year
South Branch Township, Wexford County 322 142 15% 26% 59% 5.1% 85% 34% 27% 5-Year
Springville Township, Wexford County 1,765 637 31% 27% 42% 14.2% 86% 35% 49% 5-Year
Wexford Township, Wexford County 905 339 19% 20% 61% 9.8% 85% 31% 54% 5-Year

UNIT
ED W
AY A
LICE
REP
ORT
– 20
17 U
PDAT
E FO
R M
ICHI
GAN
– EX
HIBI
T VI
I
ALICE HOUSEHOLDS BY INCOME, 2007 TO 2015ALICE, an acronym for Asset Limited, Income Constrained, Employed, represents the growing number of individuals and families who are working, but are unable to afford the basic necessities of housing, food, child care, health care, and transportation.
The United Way ALICE Report uses standardized measurements to quantify the cost of a basic household budget in each county in Michigan, and to show how many households are struggling to afford it.
This table presents the total number of households in each county in 2007, 2010, 2012, and 2015, as well as the percent of households in poverty and ALICE.
Source: American Community Survey, 2007-2015; Missing data for 2007 is due to the fact that in that year the American Community Survey did not report data for counties with populations of less than 20,000
ALICE Households, Michigan, 2007 to 2015
2007 2010 2012 2015 2015
County Total Households
Poverty %
ALICE %
Total Households
Poverty %
ALICE %
Total Households
Poverty %
ALICE %
Total Households
Poverty %
ALICE %
Source, American Community Survey Estimate
Alcona N/A N/A N/A 4,608 13% 29% 4,740 14% 24% 5,001 15% 27% 5-Year
Alger N/A N/A N/A 3,688 13% 30% 3,558 13% 29% 3,470 14% 36% 5-Year
Allegan 41,008 11% 20% 41,724 16% 25% 42,930 14% 21% 42,079 11% 26% 1-Year
Alpena 12,996 14% 22% 13,490 17% 23% 12,862 17% 25% 12,722 18% 21% 5-Year
Antrim 9,878 12% 21% 9,770 13% 27% 9,536 13% 23% 9,689 13% 28% 5-Year
Arenac N/A N/A N/A 6,686 16% 26% 6,435 17% 24% 6,447 18% 28% 5-Year
Baraga N/A N/A N/A 3,336 13% 28% 3,161 14% 31% 2,974 16% 36% 5-Year
Barry 22,525 8% 20% 22,416 9% 20% 22,355 9% 21% 22,836 10% 26% 5-Year
Bay 43,987 11% 24% 44,064 15% 19% 43,967 13% 21% 42,799 14% 23% 1-Year
Benzie N/A N/A N/A 7,366 10% 30% 7,520 11% 21% 7,225 10% 27% 5-Year
Berrien 63,645 15% 24% 59,915 15% 29% 60,223 18% 23% 64,279 15% 22% 1-Year
Branch 16,578 13% 24% 16,054 15% 27% 15,640 15% 27% 16,022 15% 31% 5-Year
Calhoun 54,146 16% 21% 52,600 15% 26% 53,182 17% 29% 53,076 15% 26% 1-Year
Cass 20,897 12% 18% 19,757 14% 21% 19,742 12% 27% 20,101 13% 29% 5-Year
Charlevoix 11,707 9% 17% 10,973 12% 21% 10,191 13% 28% 10,794 12% 27% 5-Year
Cheboygan 11,744 14% 23% 11,560 15% 24% 11,201 17% 24% 11,223 18% 23% 5-Year
Chippewa 14,663 18% 23% 14,783 18% 22% 14,597 19% 28% 13,997 17% 31% 5-Year
Clare 12,766 18% 23% 13,208 19% 25% 13,436 26% 24% 13,255 24% 29% 5-Year
Clinton 28,572 8% 18% 27,753 12% 16% 29,443 10% 22% 29,072 12% 18% 1-Year
Crawford N/A N/A N/A 5,761 15% 24% 5,921 16% 22% 5,954 13% 25% 5-Year
Delta 16,571 13% 23% 16,145 14% 22% 15,973 17% 24% 15,685 17% 27% 5-Year
Dickinson 11,415 11% 26% 11,422 14% 23% 11,405 12% 25% 11,059 14% 25% 5-Year
Eaton 42,374 9% 21% 42,810 11% 21% 42,811 9% 22% 43,551 10% 19% 1-Year
Emmet 13,790 7% 21% 13,731 13% 21% 13,140 11% 23% 13,948 11% 26% 5-Year
Genesee 170,767 15% 22% 166,539 19% 26% 166,225 19% 24% 163,488 19% 21% 1-Year
Gladwin 11,537 19% 19% 11,338 18% 19% 10,721 18% 23% 10,960 18% 29% 5-Year
Gogebic N/A N/A N/A 7,302 16% 27% 7,234 19% 27% 6,741 19% 29% 5-Year
Grand Traverse 34,900 9% 29% 35,273 12% 27% 35,018 12% 27% 36,952 10% 25% 1-Year
Gratiot 14,317 15% 28% 14,720 15% 33% 14,754 18% 32% 14,716 18% 30% 5-Year
Hillsdale 18,206 14% 16% 17,074 16% 21% 17,784 17% 21% 17,810 17% 24% 5-Year

UNIT
ED W
AY A
LICE
REP
ORT
– 20
17 U
PDAT
E FO
R M
ICHI
GAN
– EX
HIBI
T VI
I
2007 2010 2012 2015 2015
CountyTotal
HouseholdsPoverty
%ALICE
%Total
HouseholdsPoverty
%ALICE
%Total
HouseholdsPoverty
%ALICE
%Total
HouseholdsPoverty
%ALICE
% Source, American Community
Survey Estimate
Houghton 14,086 23% 25% 13,737 22% 29% 13,987 21% 28% 13,765 20% 31% 5-Year
Huron 15,062 13% 23% 14,273 14% 26% 13,957 14% 23% 13,805 14% 28% 5-Year
Ingham 107,111 18% 20% 108,234 19% 23% 109,008 23% 19% 111,265 20% 23% 1-Year
Ionia 21,847 12% 26% 22,728 15% 24% 22,464 15% 23% 22,092 14% 31% 5-Year
Iosco 12,216 14% 29% 10,508 16% 34% 11,256 16% 30% 11,343 16% 31% 5-Year
Iron N/A N/A N/A 5,386 13% 31% 5,276 13% 29% 5,392 16% 33% 5-Year
Isabella 24,671 27% 16% 25,139 29% 26% 24,663 26% 26% 24,246 25% 25% 1-Year
Jackson 60,965 14% 23% 58,388 18% 23% 60,420 18% 23% 59,292 15% 21% 1-Year
Kalamazoo 98,668 16% 21% 99,256 18% 24% 100,789 17% 26% 101,228 15% 21% 1-Year
Kalkaska N/A N/A N/A 7,232 15% 24% 7,276 15% 27% 7,185 16% 27% 5-Year
Kent 225,921 12% 25% 227,443 14% 26% 231,171 15% 22% 237,259 13% 25% 1-Year
Keweenaw N/A N/A N/A 957 16% 19% 1,012 15% 16% 1,040 15% 32% 5-Year
Lake N/A N/A N/A 4,078 19% 39% 4,139 22% 36% 4,365 25% 34% 5-Year
Lapeer 32,505 10% 22% 32,145 14% 25% 32,790 9% 27% 32,708 11% 26% 1-Year
Leelanau 9,559 8% 20% 9,294 10% 21% 9,267 10% 20% 9,234 8% 20% 5-Year
Lenawee 38,000 10% 18% 36,341 13% 25% 37,998 12% 25% 37,016 12% 31% 1-Year
Livingston 67,027 5% 23% 68,756 7% 24% 66,808 7% 21% 71,100 6% 21% 1-Year
Luce N/A N/A N/A 2,473 15% 26% 2,404 14% 27% 2,377 19% 36% 5-Year
Mackinac N/A N/A N/A 4,927 13% 21% 4,940 14% 19% 5,209 14% 19% 5-Year
Macomb 327,470 8% 28% 332,628 12% 29% 330,541 12% 27% 341,532 11% 27% 1-Year
Manistee 10,373 13% 23% 10,768 14% 26% 10,729 15% 25% 10,142 14% 25% 5-Year
Marquette 24,940 17% 18% 27,094 16% 21% 27,203 20% 17% 25,498 15% 26% 1-Year
Mason 12,328 15% 19% 12,156 15% 20% 12,242 14% 26% 12,248 15% 25% 5-Year
Mecosta 16,360 21% 23% 15,949 20% 25% 15,376 19% 26% 15,478 19% 28% 5-Year
Menominee 10,692 12% 22% 11,037 14% 19% 10,622 14% 24% 10,679 16% 23% 5-Year
Midland 32,571 11% 22% 33,843 9% 24% 33,235 13% 19% 32,977 11% 23% 1-Year
Missaukee N/A N/A N/A 5,809 13% 25% 5,855 13% 28% 5,866 15% 29% 5-Year
Monroe 57,333 7% 25% 58,596 12% 24% 57,506 12% 27% 58,886 11% 22% 1-Year
Montcalm 22,779 15% 26% 23,326 18% 28% 23,285 16% 28% 23,284 16% 32% 5-Year
Montmorency N/A N/A N/A 4,335 16% 26% 4,312 18% 25% 4,070 15% 33% 5-Year
Muskegon 64,455 16% 25% 65,892 19% 25% 63,860 20% 23% 63,215 15% 25% 1-Year
Newaygo 18,950 15% 22% 18,692 16% 23% 18,074 16% 27% 18,339 17% 24% 5-Year
Oakland 480,262 8% 22% 482,286 10% 24% 489,897 10% 22% 497,819 10% 20% 1-Year
Oceana 10,364 17% 24% 9,619 13% 31% 9,466 17% 28% 9,822 16% 31% 5-Year
Ogemaw 8,479 18% 26% 8,074 18% 30% 9,031 20% 22% 9,434 20% 26% 5-Year
Ontonagon N/A N/A N/A 3,410 14% 26% 3,333 16% 23% 3,084 15% 32% 5-Year
Osceola 8,665 17% 27% 9,076 17% 23% 8,877 19% 26% 8,757 19% 28% 5-Year
Oscoda N/A N/A N/A 4,052 19% 24% 3,842 17% 28% 3,686 19% 28% 5-Year
Otsego 9,508 13% 24% 9,817 12% 24% 9,803 11% 19% 9,956 12% 24% 5-Year
Ottawa 92,845 6% 25% 91,334 11% 25% 95,048 9% 27% 98,598 8% 28% 1-Year
Presque Isle N/A N/A N/A 6,332 13% 19% 6,123 13% 24% 5,999 14% 23% 5-Year
Roscommon 11,987 20% 24% 11,028 18% 25% 11,723 19% 21% 11,543 19% 24% 5-Year
Saginaw 76,003 16% 24% 75,609 15% 26% 78,010 17% 26% 77,211 18% 21% 1-Year
St Clair 65,343 11% 30% 64,501 13% 28% 65,075 15% 26% 63,571 12% 28% 1-Year
St Joseph 22,810 14% 26% 21,832 14% 25% 22,577 16% 24% 23,270 14% 26% 5-Year
Sanilac 17,173 13% 26% 16,985 15% 25% 16,011 15% 32% 16,280 15% 32% 5-Year
Schoolcraft N/A N/A N/A 3,621 17% 25% 3,651 17% 25% 3,419 19% 33% 5-Year
Shiawassee 28,256 16% 21% 27,134 13% 20% 27,132 17% 21% 27,036 10% 21% 1-Year
Tuscola 21,716 12% 22% 21,635 15% 23% 21,180 14% 25% 21,304 14% 23% 5-Year
Van Buren 30,482 17% 23% 27,779 14% 28% 27,740 17% 26% 28,564 15% 25% 1-Year
Washtenaw 133,075 12% 24% 132,028 12% 26% 137,565 15% 23% 138,099 14% 23% 1-Year
Wayne 706,198 18% 30% 675,079 21% 31% 660,724 23% 27% 667,521 23% 29% 1-Year
Wexford 12,877 15% 20% 12,314 17% 22% 12,271 18% 28% 12,673 16% 28% 5-Year

UNIT
ED W
AY A
LICE
REP
ORT
– 20
17 U
PDAT
E FO
R M
ICHI
GAN
– EX
HIBI
T VI
II
STRATEGIES THAT CAN MAKE A DIFFERENCE FOR ALICEALICE, an acronym for Asset Limited, Income Constrained, Employed, represents the growing number of individuals and families who are working, but are unable to afford the basic necessities of housing, food, child care, health care, and transportation.
The United Way ALICE Report presents a range of strategies and broad changes Michigan stakeholders – whether family, friends, nonprofits or the government – can consider for their own communities. These are current and innovative ideas collected from research and practitioners. These are not policy prescriptions, but rather a collection of options that could help ALICE families in the short-, medium-, and long-term.
The chart below allocates strategies to different stakeholders, though there is often overlap. Research shows that there are layers of support for financially fragile families. Often the first place low-income people or those without emergency savings seek help are from friends and family, followed by private nonprofits and government.
Michigan is a diverse state, and there is no one-size-fits-all solution. Different communities can assess which strategies make the most sense for them as they assimilate the ALICE data laid out in this Report. Ultimately, strategies that put more money in the pockets of ALICE families – either by increasing their income or reducing their expenses – are needed now and in the future.
Short-, Medium-, and Long-Term Strategies to Assist Households with Income below the ALICE Threshold
Strategies to Assist ALICE Families
SHORT-TERM MEDIUM- AND LONG-TERMFriends and Family • Temporary housing
• Meals and food• Rides to work and errands• Child care• Caregiving for ill/elderly relatives• Tool and trade sharing
• Loans• Access to good employers
Nonprofits • Temporary housing• Food pantries• Utility assistance• Home repair• Tax preparation• Caregiver respite• Subsidized child care• Tool and trade sharing• Financial counseling, debt repair and credit building
• Loans and affordable financial products• Support to find good employers• Job training and educational assistance• Affordable housing

UNIT
ED W
AY A
LICE
REP
ORT
– 20
17 U
PDAT
E FO
R M
ICHI
GAN
– EX
HIBI
T VI
II
Strategies to Assist ALICE Families
Employers • Paid days off• Transportation assistance• Flex-time• Telecommuting options
• Regular work schedules• Full-time opportunities• Higher wages• Benefits• HR resources for caregivers• On-site health services, wellness incentives• Career paths• Mentoring• Employer sponsored training• Apprentice programs
Government • Temporary assistance• Child care vouchers• Housing subsidies• Educational vouchers and charter school options• Social Security credit for caregivers• Tax credit for caregivers, workers, parents and
students• Financial counseling, debt repair and credit building
• Quality, affordable housing, child care, education, health care, transportation, and financial products
• Reduced student loan burden• Attract higher-skilled jobs• Strengthen infrastructure • Job training and educational assistance• Integrated public services

UNIT
ED W
AY A
LICE
REP
ORT
– 20
17 U
PDAT
E FO
R M
ICHI
GAN
– EX
HIBI
T IX
METHODOLOGY OVERVIEW & RATIONALELAST UPDATED JANUARY 2017
ALICE, an acronym for Asset Limited, Income Constrained, Employed, represents the growing number of individuals and families who are working, but are unable to afford the basic necessities of housing, food, child care, health care, and transportation.
The United Way ALICE Report uses standardized measurements to quantify the cost of a basic household budget in each county in Michigan, and to show how many households are struggling to afford it.
This methodology overview describes the rationale for developing ALICE, an alternative to the Federal Poverty Level; the guiding parameters for development of new measures; four resultant measures; and the methodology and data sources used for each.
BACKGROUND: SHORTCOMINGS OF THE FEDERAL POVERTY LEVELAn accurate and comprehensive measure of the scope, causes, and consequences of poverty forms the basis for identifying problems, planning policy solutions, and allocating resources. Since the War on Poverty began in 1965, the Federal Poverty Level (FPL) has provided a standard by which to determine the number and proportion of people living in poverty in the U.S. Despite the FPL’s benefit of providing a nationally recognized income threshold for determining who is poor, its shortcomings are well documented (Citro & Michael, 1995; O’Brien & Pedulla, 2010; Uchitelle, 2001).
Primarily, the measure is not based on the current cost of basic contemporary household necessities, and except for Alaska and Hawaii, it is not adjusted to reflect cost of living differences across the U.S. The net effect is an undercount of households living in economic hardship. The official poverty level is so understated that many government and nonprofit agencies use multiples of the FPL to determine eligibility for assistance programs. For example, New Jersey’s Low Income Home Energy Assistance Program (LIHEAP) uses 200 percent of the FPL and Louisiana’s Women, Infants & Children Program (WIC) uses 185 percent of the FPL (New Jersey Energy Assistance Programs, 2013; U.S. Department of Agriculture, 2015). Even Medicaid and the Children’s Health Insurance Program (CHIP) use multiples of the FPL to determine eligibility across the country (National Conference of State Legislatures, 2014; Roberts, Povich, & Mather, 2012).
In light of the FPL’s weaknesses, other measures of financial hardship have been developed. The federal government produces two alternatives to the FPL: the Supplemental Poverty Measure (SPM) from the U.S. Census at the state level, and the Area Median Income (AMI) from the Department of Housing and Urban Development (HUD) for sub-state geographies. Other sub-state geography alternatives to the FPL include Kids Count (Annie E. Casey Foundation), the Self-Sufficiency Standard (Center for Women’s Welfare, School of Social Work, University of Washington), the Basic Needs Budget (National Center for Children in Poverty), the Family Budget Calculator (Economic Policy Institute), the Economic Security Index (Institution for Social and Policy Studies), the Living Wage Calculator (MIT), and the Assets and Opportunity Scorecard (Corporation for Enterprise Development). While the plethora of alternatives demonstrates the lack of satisfaction with the FPL, none comprehensively measure the number of households who are struggling in each county in a state and describe the conditions they face.
Beyond measurement concerns, the FPL suffers from language issues common to assessments of poverty. For one, the term “poverty” is vague, lacking any measure of the depth, duration, or household and societal consequences of financial hardship. In addition, the term has gained negative connotations and is often and inaccurately associated only with a lack of employment.

UNIT
ED W
AY A
LICE
REP
ORT
– 20
17 U
PDAT
E FO
R M
ICHI
GAN
– EX
HIBI
T IX
PARAMETERSTo meet the United Way ALICE Project goals that new measures be transparent and provide data that is easily updated on a regular basis and replicable across all states, the ALICE tools were developed based on the following parameters:
1. Make a household the unit of analysis: Because people live in a variety of economic units (families, roommates, etc.), the ALICE tools measure households. ALICE households do not include those living in institutional group quarters, such as college dorms, nursing homes, homeless shelters, or prisons.
2. Define the basic cost of living: The goal is to define the basic elements needed to participate in the modern economy. Other measures are either unrealistically low, where a household earning the Threshold still cannot afford basic necessities, or they create an income benchmark that is too high and financially unsustainable. The ALICE measures provide a conservative estimate for the costs of five essentials: housing, child care, food, transportation, and health care, plus miscellaneous expenses and taxes.
3. Measure the number of households unable to afford the basic cost of living: In addition to capturing the basic cost of living, it is important to know the number and proportion of households unable to afford it. Where possible, it is also important to understand their demographic characteristics and geographic distribution.
4. Provide data at the local level: Counties serve as the base geographic unit of analysis because they are the smallest geography for which we can obtain reliable data across the country. Where possible, we also measure ALICE indicators at the Census Bureau’s municipal, county subdivision, and Public Use Microdata Area (PUMA) level. State-level data, while available for a broader set of economic indicators, masks significant inter-county variation.
5. Make new measures transparent and easy to understand: To ensure that measures are transparent and easily understandable, all data come from official and publicly available sources, including the U.S. Census Bureau, the Department of Housing and Urban Development (HUD), the U. S. Department of Agriculture (USDA), and the Bureau of Labor Statistics (BLS). In particular, using readily available data from the American Community Survey’s tabulated data as the basis for estimates ensures that calculations are transparent and easily verifiable.
6. Ensure that measures can be easily updated on a regular basis: ALICE measures are standardized using regularly collected, publicly available data to ensure that they can be applied across every county and updated regularly.
7. Make new measures replicable across all states: The ALICE measures quantify financial hardship across geographic jurisdictions and over time. The standard measures enable comparison and common understanding.
8. Identify important contextual conditions: Because economic hardship does not occur in a vacuum, the ALICE tools provide the means to understand the conditions that struggling households face (such as few job opportunities), as well as the consequences of those struggles for the wider community (such as more traffic and longer commutes as workers find lower cost homes further away, or stress on emergency rooms overused for primary care).
9. Use neutral language: Because the term “poverty” carries negative connotations, a more neutral descriptive acronym is offered. The term “ALICE” describes a household that is Asset Limited, Income Constrained, Employed.

UNIT
ED W
AY A
LICE
REP
ORT
– 20
17 U
PDAT
E FO
R M
ICHI
GAN
– EX
HIBI
T IX
THE ALICE MEASURESThe United Way ALICE Project developed the four ALICE measures, described below, to identify and assess financial hardship at a local level and to enhance existing local, state, and national poverty measures.
Household Survival Budget: The Household Survival Budget is a minimal estimate of the total cost of five household essentials – housing, child care, food, transportation, and health care, plus taxes and a 10 percent contingency. It is calculated separately for each county, and for different household types. The budget can be updated as costs and the items considered necessary change over time. For comparison, a Household Stability Budget provides an estimate of a more sustainable budget, including a 10 percent savings category.
ALICE Threshold: The ALICE Threshold represents the minimum income level necessary for survival for a household. Derived from the Household Survival Budget, the Threshold is rounded to American Community Survey income category and adjusted for household size and composition for each county, as described below.
ALICE Income Assessment: The ALICE Income Assessment is a tool that measures: 1) how much income households need to reach the ALICE Threshold; 2) how much they actually earn; 3) how much public and nonprofit assistance is provided to help these households meet their basic needs; and 4) the Unfilled Gap – how far these households remain from reaching the ALICE Threshold despite both income and assistance.
Economic Viability Dashboard: The Economic Viability Dashboard is an Index designed to measure the economic conditions that ALICE households face in each county in a given state. The Dashboard measures three indicators of local economic conditions: Housing Affordability, Job Opportunities, and Community Resources. The Index score for each county ranges from 1 to 100, where 1 indicates the worst economic conditions for ALICE and 100 indicates the best conditions.
ADDITIONAL ANALYSIS: ALICE HOUSING STOCK ASSESSMENTEach ALICE Report includes the ALICE Housing Stock assessment, an analysis that measures the number of housing units in a county that ALICE and poverty households can afford compared with the demand for affordable units. These include rental and owner-occupied units, both government subsidized and market rate.
METHODOLOGY: HOUSEHOLD SURVIVAL AND STABILITY BUDGETS The Household Budgets are a means to understand the cost of living on a local scale. To evaluate the minimal amount needed to survive in a particular geographic area, the Household Survival Budget includes the cost of five household essentials – housing, child care, food, transportation, and health care, plus taxes and a 10 percent contingency – priced at the most basic level for each county in a state. The Household Survival Budget is calculated for different household types, including a single adult and a family of four (two adults, one infant, and one preschooler). For comparison, the Household Stability Budget provides an estimate of a more sustainable budget for the same household types.
UNIT
ED W
AY A
LICE
REP
ORT
– 20
17 U
PDAT
E FO
R M
ICHI
GAN
– EX
HIBI
T IX
Household Survival BudgetThe Household Survival Budget is comprised of conservative estimates of the cost of five household essentials – housing, child care, food, transportation, and health care, plus taxes and a 10 percent contingency – in each county. The data definitions and sources are as follows:
1. Housing: The housing budget is based on HUD’s Fair Market Rent (usually 40th percentile of gross rents, but in some locations HUD reports the 50th percentile) for an efficiency apartment for a single person, a one-bedroom apartment for a head of household with a child, and a two-bedroom apartment for a family of three or more. The rent includes the sum of the rent paid to the owner plus any utility costs incurred by the tenant. Utilities include electricity, gas, water/sewer, and trash removal services, but not telephone service. If the owner pays for all utilities, then the gross rent equals the rent paid to the owner. Data Source: http://www.huduser.org/portal/datasets/fmr.html
2. Child Care: The child care budget is based on the average annual cost of care for one infant and one preschooler in registered family child care homes (the least expensive child care option). Data are compiled by local child care resource and referral agencies and reported to the national organization, Child Care Aware. When data are missing, state averages are used, though missing data may mean that child care facilities are not available in those counties and residents may be forced to use facilities in neighboring counties. The source for county breakdowns varies by state. Data Source: State totals http://www.usa.childcareaware.org/costofcare
3. Food: The food budget is based on the Thrifty Level (lowest of four levels) of the USDA Food Plans. The household food budget is adjusted for six select household compositions including: single adult male 19-50 years old; family of two adults (male and female) 19-50 years old; one adult female and one child 2-3 years old; one adult female and one child 9-11 years old; family of four with two adults (male and female) and children 2-3 and 4-5 years old; and family of four with two adults (male and female as specified by the USDA) and children 6-8 and 9-11 years old. Data for June is used as that is considered by USDA to be the annual average. Data Sources: http://www.cnpp.usda.gov/sites/default/files/usda_food_plans_cost_of_food/CostofFoodJun2015.pdf State food budget numbers are adjusted for regional price variation. http://www.ers.usda.gov/media/176139/page19.pdf
4. Transportation: The transportation budget is calculated using average annual expenditures for transportation by car and by public transportation from the Bureau of Labor Statistics’ Consumer Expenditure Survey (CES). Since the CES is reported by metropolitan statistical areas and regions, counties are matched with the most local level possible. Costs are adjusted for household size (divided by CES household size except for single-adult households, which are divided by two). Building on work by the Institute of Urban and Regional Development, we suggest that in counties where 8 percent or more of the population uses public transportation, the cost for public transportation is used; in those counties where less than 8 percent of the population uses public transportation, the cost for auto transportation is used instead (Porter & Deakin, 1995; Pearce, 2015). Public transportation includes bus, trolley, subway, elevated train, railroad, and ferryboat. Car expenses include gas, oil, and other vehicle maintenance expenses, but not lease payments, car loan payments, or major repairs. Data Sources: Bureau of Labor Statistics (CES): http://www.bls.gov/cex/csxmsa.htm#y1112 CES Region definitions: http://www.bls.gov/cex/csxgloss.htm American Community Survey: http://www.census.gov/acs/www/
5. Health Care: The health care budget includes the nominal out-of-pocket health care spending, medical services, prescription drugs, and medical supplies using the average annual health expenditure reported in the CES. Since the CES is reported by metropolitan areas and regions, counties were matched with the most local level possible. Costs are adjusted for household size (divided by CES household size

UNIT
ED W
AY A
LICE
REP
ORT
– 20
17 U
PDAT
E FO
R M
ICHI
GAN
– EX
HIBI
T IX
except for single-adult households, which are divided by two). The health care budget does not include the cost of health insurance. Starting with the 2016 ALICE Reports, the health care cost will incorporate changes from the Affordable Care Act (ACA). Because ALICE does not qualify for Medicaid but in many cases cannot afford even the Bronze Marketplace premiums and deductibles, we add the cost of the “shared responsibility payment” – the penalty for not having coverage – to the current out-of-pocket health care spending. The penalty for 2015 was $325 for an adult and $975 for a family. Data Sources: Bureau of Labor Statistics (CES): http://www.bls.gov/cex/csxmsa.htm#y1112 CES Region definitions: http://www.bls.gov/cex/csxgloss.htm Shared responsibility payment: https://www.medicaid.gov/medicaid-chip-program-information/ program-information/medicaid-and-chip-eligibility-levels/medicaid-chip-eligibility-levels.html
6. Taxes: The tax budget includes both federal and state income taxes where applicable, as well as Social Security and Medicare taxes. These rates include standard federal and state deductions and exemptions, as well as the federal Child Tax Credit and the Child and Dependent Care Credit as defined in the Internal Revenue Service 1040: Individual Income Tax, Forms and Instructions. They also include state tax deductions and exemptions such as the Personal Tax Credit and renter’s credit as defined in each state Treasury’s 1040: Individual Income Tax, Forms and Instructions. Local taxes are incorporated as applicable. Data Sources: Internal Revenue Service 1040: Individual Income Tax, Forms and Instructions for relevant years, such as: http://www.irs.gov/pub/irs-prior/i1040--2012.pdf State Income Tax, Forms and Instructions for relevant years, such as: http://www.state.nj.us/treasury/taxation/pdf/other_forms/tgi-ee/2010/10_1040i.pdf
7. Miscellaneous: The Miscellaneous category includes 10 percent of the budget total (including taxes) to cover cost overruns.
Household Stability Budget The Household Stability Budget represents a more financially stable, less austere standard of living compared to the Household Survival Budget. The Household Stability Budget is comprised of the actual cost of five household essentials plus a 10 percent savings item and a 10 percent contingency item, as well as taxes for each county. The data builds on the sources from the Household Survival Budget; differences are outlined below.
1. Housing: The housing budget for a single adult is based on HUD’s median rent for a one-bedroom apartment, rather than an efficiency at the Fair Market Rent of 40th percentile; for a head of household with children, the basis is a two-bedroom apartment at the median rent; and housing for a family is based on the American Community Survey’s median monthly owner costs for those with a mortgage, instead of rent for a two-bedroom apartment at the 40th percentile. Real estate taxes are included in the tax category below for households with a mortgage.
2. Child Care: The child care budget is based on the cost of a fully licensed and accredited child care center. These costs are typically more than 30 percent higher than the cost of registered home-based child care used in the Household Survival Budget. Data is compiled by local child care resource and referral agencies and reported to the national organization, Child Care Aware.
3. Food: The food budget is based on the USDA’s Moderate Level Food Plan for cost of food at home (second of four levels), adjusted for regional variation, plus the average cost of food away from home as reported by the CES.
4. Transportation: Where there is public transportation, family transportation expenses include public transportation for one adult and gas and maintenance for one car; costs for a single adult include public transportation for one, and half the cost of gas and maintenance for one car. Where there is no public transportation, family expenses include costs for leasing one car and for gas and maintenance for two cars, and single-adult costs are for leasing, gas and maintenance for one car as reported by the CES.

UNIT
ED W
AY A
LICE
REP
ORT
– 20
17 U
PDAT
E FO
R M
ICHI
GAN
– EX
HIBI
T IX
5. Health Care: The health care costs are based on employer-sponsored health insurance at a low-wage firm as reported by the U.S. Department of Health and Human Services in the Medical Expenditure Panel Survey (MEPS). Also included is out-of-pocket health care spending as reported in the CES.Data Source: U.S. Department of Health and Human Services in the Medical Expenditure Panel Survey (MEPS) for relevant years (note: 2007 data not available, 2008 was used instead). For example: Table II.C.2 Average total employee contribution http://meps.ahrq.gov/mepsweb/data_stats/summ_tables/insr/state/series_2/2014/tiic2.htm Table VII.C.2. Average total employee contribution (in dollars) per enrolled employee for single coverage at establishments that offer health insurance http://meps.ahrq.gov/mepsweb/data_stats/summ_tables/insr/state/series_7/2014/tviic2.htm Table VII.D.2. Average total employee contribution (in dollars) per enrolled employee for family coverage at establishments that offer health insurance where percent of low-wage employee contribution is 50 percent or more http://meps.ahrq.gov/mepsweb/data_stats/summ_tables/insr/state/series_7/2014/tviid2.htm
6. Technology: Most jobs now require access to the internet and a smartphone. These are necessary to receive work schedules, changes in start time or location, access to work support services, and customer follow-up. The Stability Budget includes the cost of a smartphone for each adult in the family. Data Source: Consumer Reports, Cell Phone Plan Comparison, 2014 http://www.consumerreports.org/cro/news/2014/01/best-phone-plans-for-your-family-save-money/index.htm
7. Miscellaneous and Savings: As in the Household Survival Budget, there is a miscellaneous category to cover cost overruns. In addition, there is a savings category. They are each 10 percent of the budget total (not including taxes).
8. Taxes: Taxes are calculated in the same manner as the Household Survival Budget, but the amounts are much larger as the size of credits and exemptions does not increase with income.
METHODOLOGY: THE ALICE THRESHOLDIn addition to understanding the basic cost of living, it is important to know the number and proportion of households not able to afford it and, where possible, their demographic features and geographic distribution. To do so, we calculate ALICE Thresholds for each county based on the Household Survival Budget to match the American Community Survey income categories allowing analysis of American Community Survey demographics. Data are from the American Community Survey: http://www.census.gov/acs/www/.
1. Two Thresholds: Because there are significant differences between households by age, there are two separate ALICE Thresholds: one for households headed by someone under 65 years old, and another for households headed by someone 65 years and older. They are calculated separately for each county in a state.
• Threshold for under 65: The Threshold for households headed by someone under 65 years old is based on the average of the least expensive Household Survival Budget (Single Adult) and the most expensive Household Survival Budget (Family of Four), reflecting the wide range of types of households in this age group. The average budget is then adjusted to the average household size of the location. (HHSB Single Adult + HHSB Family of 4)/5 * Ave HH size under65
• Threshold for 65 and over: Households headed by someone 65 years and older are less likely to include children. Therefore, the Threshold is based on the Household Survival Budget for a Single Adult. HHSB Single Adult * Ave HH size 65over

UNIT
ED W
AY A
LICE
REP
ORT
– 20
17 U
PDAT
E FO
R M
ICHI
GAN
– EX
HIBI
T IX
2. Household Income: The average budgets are rounded to the tabulated American Community Survey estimates for household income in the following categories: $30,000, $35,000, $40,000, $45,000, $50,000, $60,000, or $75,000.
3. Average Household Size: The average household size for households headed by someone under 65 is calculated as: the number of households headed by someone under 65 divided by the total population under 65. The average household size for households headed by someone 65 and older is calculated as: the number of households headed by someone 65 and older divided by the population 65 and older. To ensure that results reflect local conditions as closely as possible, averages are calculated at the county level.
4. Number of ALICE households: The number of ALICE households is derived by subtracting the number of households in poverty from the ALICE Threshold. Poverty numbers are provided by the American Community Survey for most demographic groups. Because the Survey does not provide the poverty numbers for race/ethnicity, the income category of less than $15,000 per year is used as a proxy.
Note: To correct from rounding, Above ALICE Threshold is adjusted so total of the three income categories equals 100 percent.
METHODOLOGY: ALICE INCOME ASSESSMENTThe ALICE Income Assessment looks at the impact of public and nonprofit resources on the needs of ALICE households. The tool measures the “Unfilled Gap” between the total amount that households receive in income, cash government assistance, and in-kind public assistance and the total needed to reach the ALICE Threshold. Household income includes wages, dividends, and Social Security.
There are many resources available to low-income families. Public assistance used in this analysis includes only programs directed specifically at low-income households that directly help them meet the basic Household Survival Budget, such as TANF and Medicaid. It does not include programs that assist low-income households in broader ways, such as to attend college, or that assist communities, like community policing. The analysis is only of funds spent, not an evaluation of the efficacy of the programs or efficacy of meeting household needs.
1. Federal Spending: This figure includes a wide array of programs:
• Social Services – Temporary Assistance for Needy Families (TANF), Supplemental Security Income (SSI), and Social Services Block Grant (SSBG).
• Child Care and Education – Only programs that help children meet their basic needs or are necessary to enable their parents to work are included. They are Head Start, Neglected and Delinquent Children and Youth Education, Rural and Low-Income Schools Program, and Homeless Children and Youth Education. Though post-secondary education is vital to future economic success, it is not a component of the basic Household Survival Budget, so programs such as Pell grants are not included.
• Food – Supplemental Nutrition Assistance Program (SNAP), School Lunch Program, School Breakfast Program, Child and Adult Care Food Program (CACFP), and Special Supplemental Nutrition Program for Women, Infants, and Children (WIC).
• Housing – Section 8 Housing Choice Vouchers (including Fair Share Vouchers and Welfare-to-Work Vouchers, the Section 8 Rental Voucher program (14.855), or the former Section 8 Certificate program (14.857)), Low-Income Home Energy Assistance Program (LIHEAP), and Community Development Block Grants (CDBG).
• EITC – Earned Income Tax Credit

UNIT
ED W
AY A
LICE
REP
ORT
– 20
17 U
PDAT
E FO
R M
ICHI
GAN
– EX
HIBI
T IX
2. Health Care: This figure includes:
• Medicaid – Provides money to states, which they must match, to offer health insurance for low-income residents. Also known as the Medical Assistance Program.
• Children’s Health Insurance Program (CHIP) – Provides funds to states to enable them to maintain and expand child health assistance to uninsured, low-income children and, at a state’s discretion, to low-income pregnant women and authorized immigrants.
• Community Health Benefits – Spending by hospitals on low-income patients that includes charity care and means-tested expenses, including Unreimbursed Medicaid minus direct offsetting revenue as reported on the 990 c3 Report.
3. State and Local Government Spending: This figure includes funds from state and local government, not pass-throughs from the federal government, in the areas of health, social services, transportation, and workforce development. Spending on ALICE was estimated from the National Association of State Budget Officers (NASBO), “State Expenditure Report: Examining Fiscal 2012-2014 State Spending,” 2014.
4. Nonprofit Assistance: This figure includes spending by nonprofit organizations identified as Human Services organizations. Human Services nonprofit programs are those reported on Form 990EZc3 and 990c3 minus program service revenue, dues, and government grants as reported to the Internal Revenue Service.
Data Sources:
Community Health Benefits – NCCS Data Web Report Builder, Statistics of Income 990 c3 Report for 2010 and 2012, Urban Institute.
Department of Treasury, “USAspending.gov Data Download,” Bureau of the Fiscal Service, accessed 9/1/15. https://www.usaspending.gov/DownloadCenter/Pages/DataDownload.aspx
Earned income Tax Credit – Federal spending retrieved from https://www.eitc.irs.gov/EITC-Central/eitcstats
Federal spending data was gathered from Office of Management and Budget, “Fiscal Year 2016 Analytical Perspectives Budget of the U.S. Government,” U.S. Government Printing Office, Washington, DC. 2016. https://www.gpo.gov/fdsys/browse/collectionGPO.action?collectionCode=BUDGET
Non-Profit Revenue for Human Services, registered charity – NCCS Data Web Report Builder, Statistics of Income 990EZc3 Report and 990 c3 Report, Urban Institute, 2012
State spending data was gathered from: National Association of State Budget Officers (NASBO), “State Expenditure Report: Examining Fiscal 2014-2016 State Spending,” 2016. https://higherlogicdownload.s3.amazonaws.com/NASBO/9d2d2db1-c943-4f1b-b750-0fca152d64c2/UploadedImages/SER%20Archive/State%20Expenditure%20Report%20(Fiscal%202014-2016)%20-%20S.pdf
Supplemental Nutrition Assistance Program (SNAP) data from U.S. Department of Agriculture (USDA), Data and Statistics website. http://www.fns.usda.gov/pd/supplemental-nutrition-assistance-program-snap
Supplemental Social Insurance, B19066 – Aggregate Supplemental Security Income (SSI) in the Past 12 Months For Households, American Community Survey, 2012 and 2015.
UNIT
ED W
AY A
LICE
REP
ORT
– 20
17 U
PDAT
E FO
R M
ICHI
GAN
– EX
HIBI
T IX
METHODOLOGY: ECONOMIC VIABILITY DASHBOARDWhile there are many measures of general economic conditions, there is a gap in the understanding of the conditions that most affect ALICE households. The Economic Viability Dashboard presents the conditions that underlie the economic hardship faced by ALICE households at the local level: Housing Affordability, Job Opportunities, and Community Resources. Each of these sets of conditions is reflected in an Index that allows comparison across different kinds of measures.
1. Index: Each Index in the Dashboard creates a common scale across rates, percentages, and other scores by measuring from the average. Raw indicator scores are converted to “z-scores”, which measure how far any value falls from the mean of the set, measured in standard deviations. The general formula for normalizing indicator scores is: z = (x – μ)/ σ where x is the indicator’s value, μ is the unweighted average, σ the standard deviation for that indicator and z is the resulting z-score. All scores must move in a positive direction, so for variables with an inverse relationship, i.e., the unemployment rate, the scores are multiplied by -1. In order to make the resulting scores more accessible, they are translated from a scale of -3 to 3 to 1 to 100, with higher scores reflecting better conditions. Data from 2010 is used as the baseline for comparison over time. Each county’s score is relative to other counties in the state and compared to prior years. A score of 100 does not necessarily mean that conditions are very good; it means that they are better than in other counties in the state. These indices are used only for comparison within the state, not for comparison to other states.
2. Dashboard: The conditions are displayed as a dashboard reflecting the economic reality of an area. This format ensures that poor conditions are not concealed by better results in another category, thus enabling the identification of gaps.
3. Local Conditions: The Index variables reflect the locality, rather than resources or conditions that are the same in all communities across the country. Index scores range from 1 to 100, Economic conditions are reported for each county in a state for 2007, 2010, 2012, and the most current year available.
4. Data Definitions and Sources: The variables noted below for each index are the best proxies for the indicators that are available in all counties and updated on a regular basis:
Housing Affordability Index:
• Affordable Housing Gap – The number of available units ALICE and poverty households can afford while spending no more than one-third of their income on housing (ALICE Housing Stock assessment) compared to the number of renter and owner households below the ALICE Threshold. Source: American Community Survey and ALICE Threshold calculations
• Housing Burden – Households spending more than 30 percent of income on housing. Source: American Community Survey, Table PD04
• Real Estate Taxes – Median real estate taxes. Source: American Community Survey
Job Opportunities Index:
• Income Distribution – Share of Income in the Lowest Two Quintiles Source: American Community Survey, Table B19082

UNIT
ED W
AY A
LICE
REP
ORT
– 20
17 U
PDAT
E FO
R M
ICHI
GAN
– EX
HIBI
T IX
• Unemployment Rate – Employment Status Source: American Community Survey, Table S2301
• New Hire Wages (4th quarter) – Quarterly Workforce Indicators (QWI), U.S. Census Source: LED Extraction Tool: http://ledextract.ces.census.gov/
Community Resources Index:
• Education Resources – 3- and 4-year-olds enrolled in preschool Source: American Community Survey, Table S2301
• Health Resources – Percent of population under 65 years old with health insurance. For consistency with data sets, for 2007 we used 2008 data. Prior to 2008, data was only available through the SAHIE Estimates using the Current Population Survey (CPS) which does not match the American Community Survey, where data from 2008 to date has been collected. Source: American Community Survey, Table S2701 for 2010 and 2013; and B27001 for 2008
• Social Capital – Percent of population 18 and older who voted in the most recent election Sources: Election Administration and Voting Survey and Data Sets, Section F, 2010, 2012 and 2015 http://www.eac.gov/research/election_administration_and_voting_survey.aspx Election Administration and Voting Survey and Data Sets, Appendix C: 2006 Election Administration and Voting Survey. http://www.eac.gov/research/uocava_survey.aspx#2006eavsdata
ADDITIONAL ANALYSIS: ALICE HOUSING STOCK ASSESSMENTOne of the most difficult conditions that most ALICE households face is the high cost of housing. Ultimately, housing cost is determined by what someone is willing to pay. However, the housing stock in an area can become out of sync when it is slow to adjust to demographic and economic changes. A mismatch occurs when the types of housing units residents want at certain price levels do not match the types of housing that exist, and a limited supply pushes up prices for all units.
An analysis of the number of units that are affordable for ALICE families reveals that there is indeed a mismatch between the number of households with income below the ALICE Threshold and the number of housing units in a given county that they can afford. Because there has been no accurate assessment of the number of rental and owner-occupied units that includes both government-subsidized and market-rate housing that ALICE families can afford, we developed the ALICE Housing Stock assessment.
The demographic and economic changes discussed above are causing significant shifts in housing demand. At the same time, there are many constraints on the housing market that prevent it from adjusting quickly. They include limited land availability for new housing, zoning regulations on the type of housing that can be built, and the cost of construction.
The ALICE Housing Stock assessment relies on the actual cost of housing and a county-level, cost-based threshold, whereas other mismatch approaches use either the Area Median Income (which takes into account county variation but does not necessarily have a relation to the actual cost in the area) or the bottom quintile or a flat rate (such as $500) across all areas (Apgar, 1990; Goodman, 2001; Quigley & Raphael, 2001; U.S. Department of Housing and Urban Development, 2015). Also, these other approaches do not take into account the distribution of income below their thresholds, while the ALICE Housing Stock assessment does so along the Census breaks.

UNIT
ED W
AY A
LICE
REP
ORT
– 20
17 U
PDAT
E FO
R M
ICHI
GAN
– EX
HIBI
T IX
1. Housing Affordability: Defined as spending no more than one-third of income on housing.
• Rental Affordability is based on the cost of rent.
• Ownership Affordability is based on the cost of mortgage payments plus real estate taxes.
2. Number of Affordable Units: The number of affordable units is calculated by totaling the number of units where the housing cost is below one-third of the ALICE Threshold.
• Renter-occupied: Based on the gross rent as reported in the tabulated American Community Survey estimates in the following categories: Less than $200, $200 to $299, $300 to $499, $500-$749, $750 to $999, $1,000 to $1,499, and $1,500 or more.
• Owner-occupied: Based on the real estate taxes and mortgage of housing value as reported in the tabulated American Community Survey estimates in the following categories: Less than $50,000, $50,000 to $99,999, $100,000 to $149,999, $150,000 to $199,999, $200,000 to $299,999, $300,000 to $499,999, $500,000 to $999,999, and $1,000,000 and over.
3. Comparison: Comparison between the number of affordable units and the number of ALICE households provides some insight into the additional number of units needed to house all ALICE households affordably. Such a comparison is bound to underestimate the need, as it assumes that all ALICE and poverty households are currently living in units that they can afford. The number of households that are housing burdened reveals that existing units are not perfectly allocated by income.
ADDITIONAL INFORMATIONFor questions, contact Stephanie Hoopes, national director, United Way ALICE Project. [email protected]
REFERENCESApgar, W. J. (1990). The Nation’s Housing: A Review of Past Trends and Future Prospects for Housing in America. In D. DiPasquale & L. C. Keyes (Eds.), Building Foundations (pp. 25–59). University of Pennsylvania.
Citro, C. F., & Michael, R. T. (1995). Measuring Poverty: A New Approach. Washington, DC: National Academy Press.
Goodman, J. (2001). Housing Affordability in the United States: Trends, Interpretations and Outlook. Consulting report for Millenial Housing Commission.
National Conference of State Legislatures. (2014). Medicaid and CHIP Eligibility Table by State. Retrieved January 20, 2016, from http://www.ncsl.org/research/health/medicaid-eligibility-table-by-state-state-activit.aspx
New Jersey Energy Assistance Programs. (2013). New Jersey Community Resources. Retrieved February 6, 2014, from http://www.njcommunityresources.info/njenergy.htm
O’Brien, R. L., & Pedulla, D. S. (2010). Beyond the Poverty Line. Stanford Social Innovation Review, 8(4), 30–35.
Pearce, D. (2015). Methodology of the Standard. Center for Women’s Welfare, University of Washington, 2015. http://www.selfsufficiencystandard.org/methodology-standard

UNIT
ED W
AY A
LICE
REP
ORT
– 20
17 U
PDAT
E FO
R M
ICHI
GAN
– EX
HIBI
T IX
Porter, C., & Deakin, E. (1995). Socioeconomic and Journey-to-Work Data: A Compendium for the 35 Largest U.S. Metropolitan Areas. Berkeley: Institute of Urban and Regional Development, University of California.
Quigley, J. M., & Raphael, S. (2001). The economics of homelessness: The evidence from North America. European Journal of Housing Policy, 1(3), 323–336.
Roberts, B., Povich, D., & Mather, M. (2012). Low-Income Working Families: The Growing Economic Gap.
Uchitelle, L. (2001, May 26). How to Define Poverty? Let Us Count the Ways. New York Times. Retrieved from http://www.nytimes.com/2001/05/26/arts/how-to-define-poverty-let-us-count-the-ways.html?pagewanted=all&src=pm
U.S. Department of Agriculture. (2015). WIC Eligibility Requirements. Retrieved January 20, 2016, from http://www.fns.usda.gov/wic/wic-eligibility-requirements
U.S. Department of Housing and Urban Development. (2015). CHAS: Background; Dataset.

ALICE is a registered trademark of the United Way of Northern New Jersey.
© Copyright 2009–2017 United Way of Northern New Jersey. All rights reserved. No further use, copying, dissemination, distribution, or publication is permitted without the express written permission
of United Way of Northern New Jersey.