alin pohoata: "multiple characterizations of urban air pollution time series using a wavelet...
TRANSCRIPT
DANIEL DUNEA, ȘTEFANIA IORDACHE , ALIN POHOAŢĂ
Air quality and population health are closely interrelated. Poor air conditions proved to be harmful for human health.
Of particular concern are particulate matter (PM), especially fine and ultrafine dusts, ground-level ozone (O3) and nitrogen dioxide (NO2).
At present, over a third of European Union's Air Quality Management Zones exceed the limit values for particulate matter (PM10) and a quarter for nitrogen dioxide (NO2).
Environmental monitoring and early warning systems have been improving the quality of life in many urban areas.
Automated monitoring networks perform detailed measurements of emissions contributing to the development of time series database, which feeds the specific algorithms or models that are able to predict air pollution evolution and spatiotemporal trends [3].
Data processing and forecasting techniques have an important role in providing the updated status of airborne pollutants' load in a monitored area.
The paper presents the results of screening various Daubechies wavelet–feedforward artificial neural networks (FANN) configurations applied to time series of ground-level ozone (O3), nitrogen dioxide (NO2), and PM10 fraction, hourly recorded at 4 automated monitoring stations of the Romanian Air Quality National Network located in different urban areas of Oltenia South-Vest Region (no. 4) from Romania.
statistical methods
artificial intelligence (AI) techniques
hybrid algorithms
ARIMA
spectrum analysis
regressive models
applied successfully for real-time control of emissions showing good short-term forecasting capabilities for several air pollutants [3,4,5,6,7]. However, their exclusive use showed some shortcomings and limitations.
artificial neural networks (ANN)
adaptive neuro-fuzzy inference systems (ANFIS)
fuzzy logic
predictive data mining (DM)
A well-known forecasting method is employing feedforward artificial neural networks using improved training algorithms with variable learning rates.
The performances of the ANN in air pollution time series were studied for several types of training algorithms as well as for different neural network architectures (i.e. number of hidden layers and hidden nodes) [12,13,14,15].
However, ANN algorithms encountered difficulties in predicting extreme concentrations (pollutant peaks) and limitations due to limited continuous observations and large local-scale variations of concentrations [16].
Wavelet neural networks (WNNs) have been an alternative to overcome these drawbacks related to time series predictions by integrating various wavelets (e.g. Mexican Hat, Gaussian wavelet, Morlet, Daubechies etc.) in the hidden nodes of WNNs or as a pre-processing step [17,18,19].
The results of numerical experiments [20] have shown that application of wavelet transformation is the most important factor in improving the accuracy of forecasting.
In general, many studies recommend pre-processing steps (e.g. smoothing, filtering, etc.) in which the initial data is transformed such that new data series eliminates some outliers on the consideration that the use of raw data may rarely give satisfactory results, when feeding directly raw data in neural networks.
This technique may facilitate the learning success, but the new data series eliminates some initial characteristics from the analysis, which are important in the field of air pollution surveillance and forecasting.
These filtered data are often associated with high concentrations of pollutants that are of interest in the early warning process.
In the first modeling step, the time series of each pollutant were used as inputs in various configurations of neural networks.
RNA–Aer system [12] was used for testing different learning algorithms (i.e. Rprop, Quickprop, and Standard Backpropagation), learning rates, and various topologies to find the most suitable network architectures.
The training data have consisted of 70-75% from each pollutant series, while the remaining data have been used in the validation process.
The simulations were repeated 10 times using random learning and testing data, due to sensitivity of the training to the initial values of the weights.
In the second modeling step, each air pollutant series was decomposed using MATLAB Wavelet Toolbox [21] into corresponding components using various wavelets of 3rd order (i.e. Daubechies, Morlet, and Mexican Hat, which were recommended in previous studies [17],[19]).
Each decomposed component of a pollutant time series was used as input in the optimal FANN architecture established in the first step.
The output of each component was re-included to form the modeled series of the original pollutant time series. The model performance was assessed using MAE, MAPE, RMSE and r.
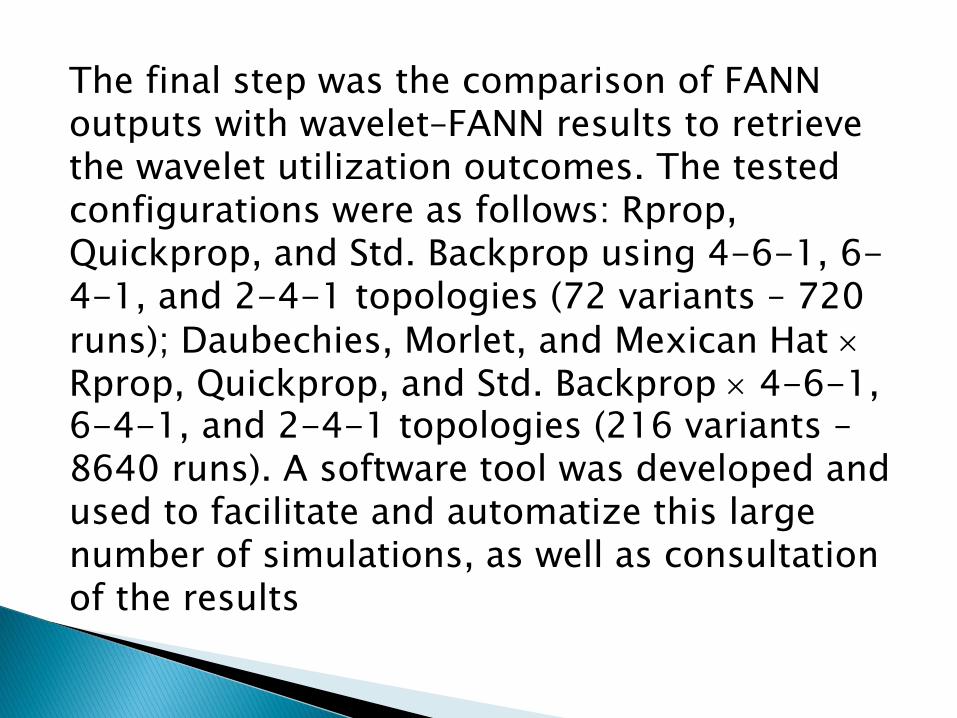
The final step was the comparison of FANN outputs with wavelet–FANN results to retrieve the wavelet utilization outcomes. The tested configurations were as follows: Rprop, Quickprop, and Std. Backprop using 4-6-1, 6-4-1, and 2-4-1 topologies (72 variants – 720 runs); Daubechies, Morlet, and Mexican Hat Rprop, Quickprop, and Std. Backprop 4-6-1, 6-4-1, and 2-4-1 topologies (216 variants – 8640 runs). A software tool was developed and used to facilitate and automatize this large number of simulations, as well as consultation of the results
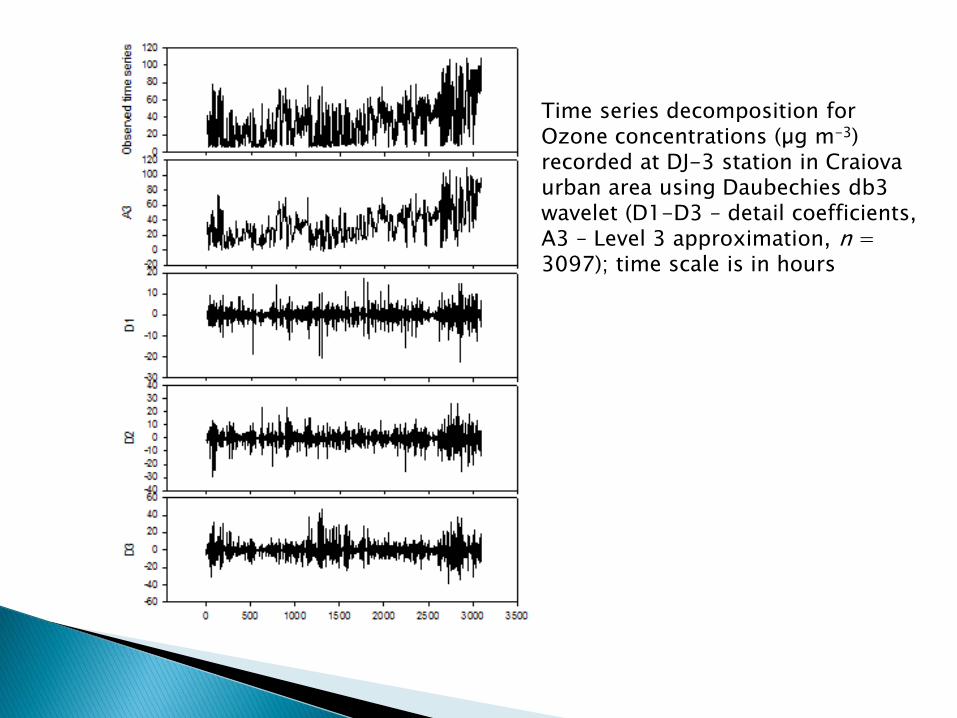
Time series decomposition for Ozone concentrations (µg m-3) recorded at DJ-3 station in Craiova urban area using Daubechies db3 wavelet (D1-D3 – detail coefficients, A3 – Level 3 approximation, n = 3097); time scale is in hours
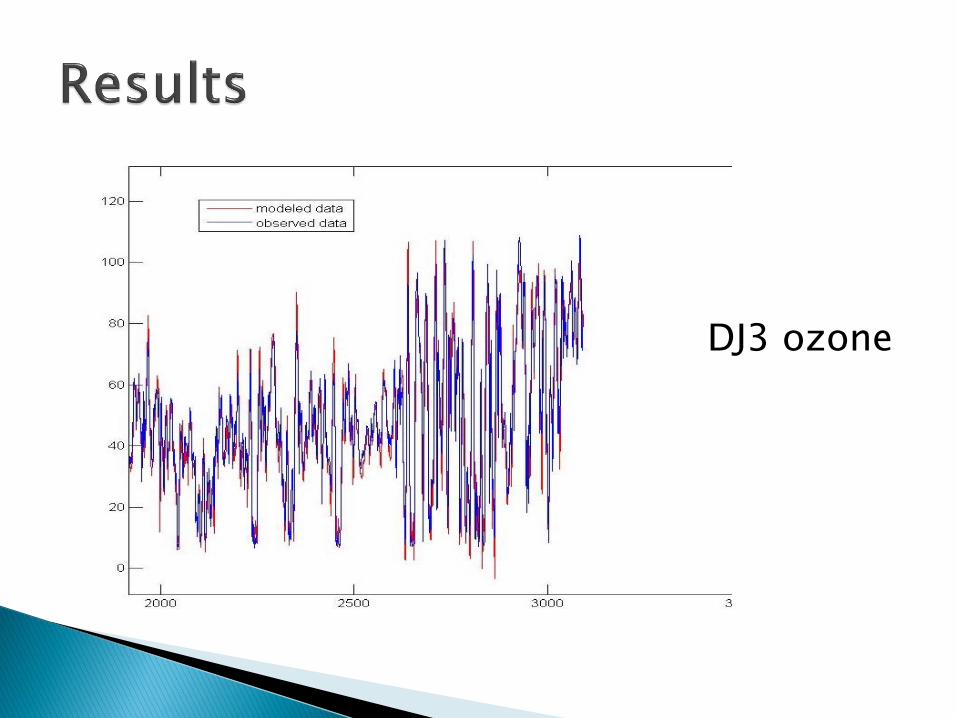
DJ3 ozone
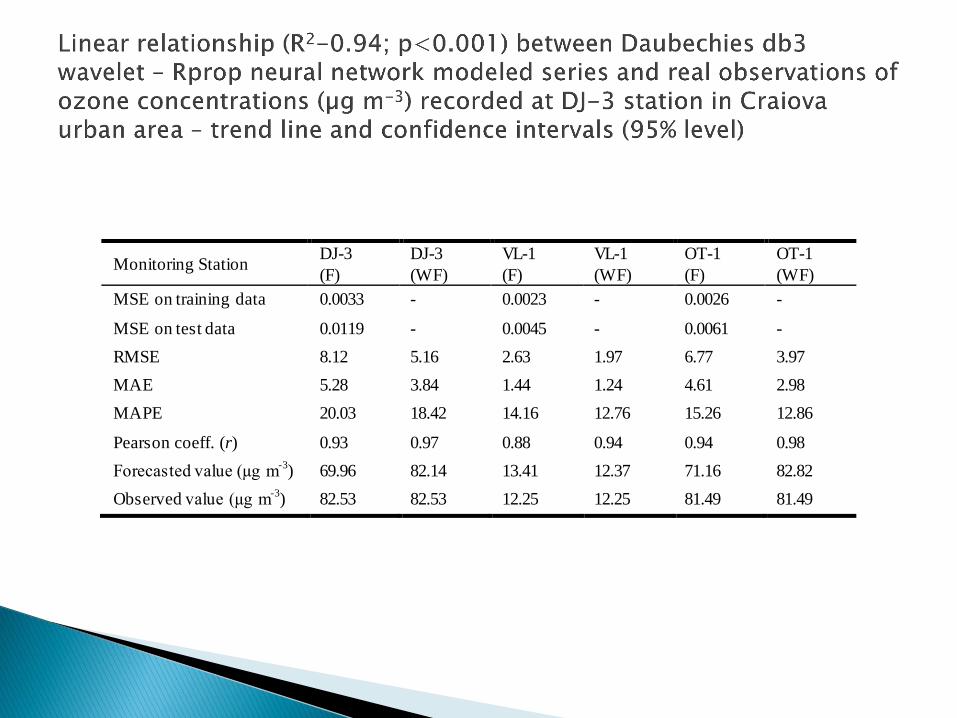
Monitoring Station DJ-3
(F)
DJ-3
(WF)
VL-1
(F)
VL-1
(WF)
OT-1
(F)
OT-1
(WF)
MSE on training data 0.0033 - 0.0023 - 0.0026 -
MSE on test data 0.0119 - 0.0045 - 0.0061 -
RMSE 8.12 5.16 2.63 1.97 6.77 3.97
MAE 5.28 3.84 1.44 1.24 4.61 2.98
MAPE 20.03 18.42 14.16 12.76 15.26 12.86
Pearson coeff. (r) 0.93 0.97 0.88 0.94 0.94 0.98
Forecasted value (µg m-3
) 69.96 82.14 13.41 12.37 71.16 82.82
Observed value (µg m-3
) 82.53 82.53 12.25 12.25 81.49 81.49
The wavelet utilization has improved significantly the neural network model results for out of sample forecast in terms of model performance parameters such as RMSE, MAE, and MAPE (12.86-18.42%), which have recorded smaller values (table 5).
Pearson coefficients have been improved with 0.04 to 0.06 showing also strong statistical significance (p<0.001).
The most important improvement was at the forecasted value level. Table 5 presents the out of sample values (n+1 = 3098) forecasted for each time series, which are close to the corresponding real observations.
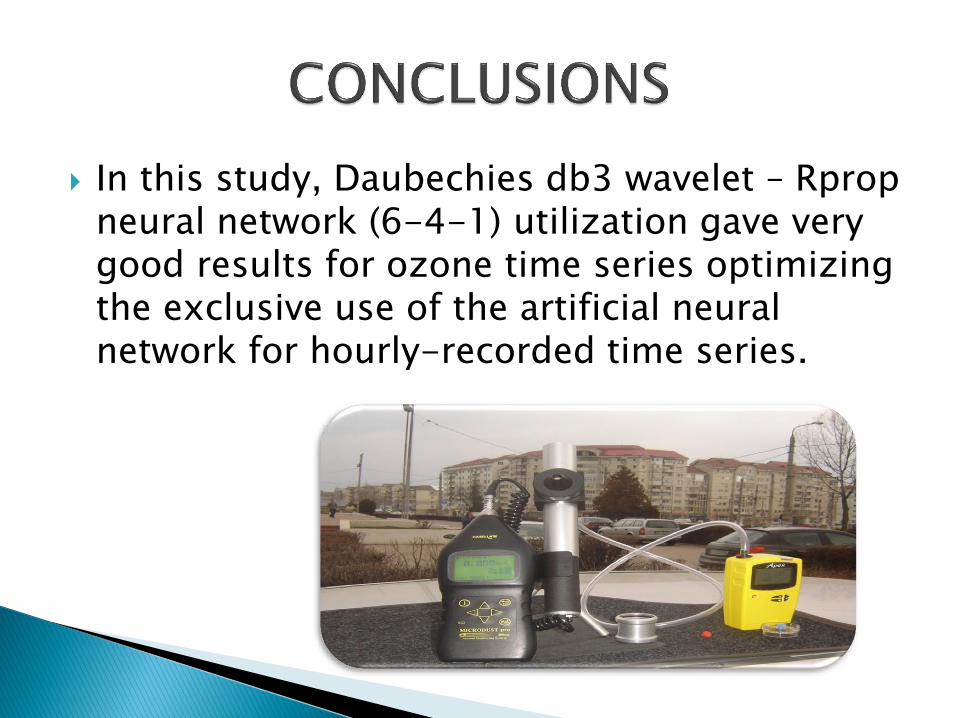
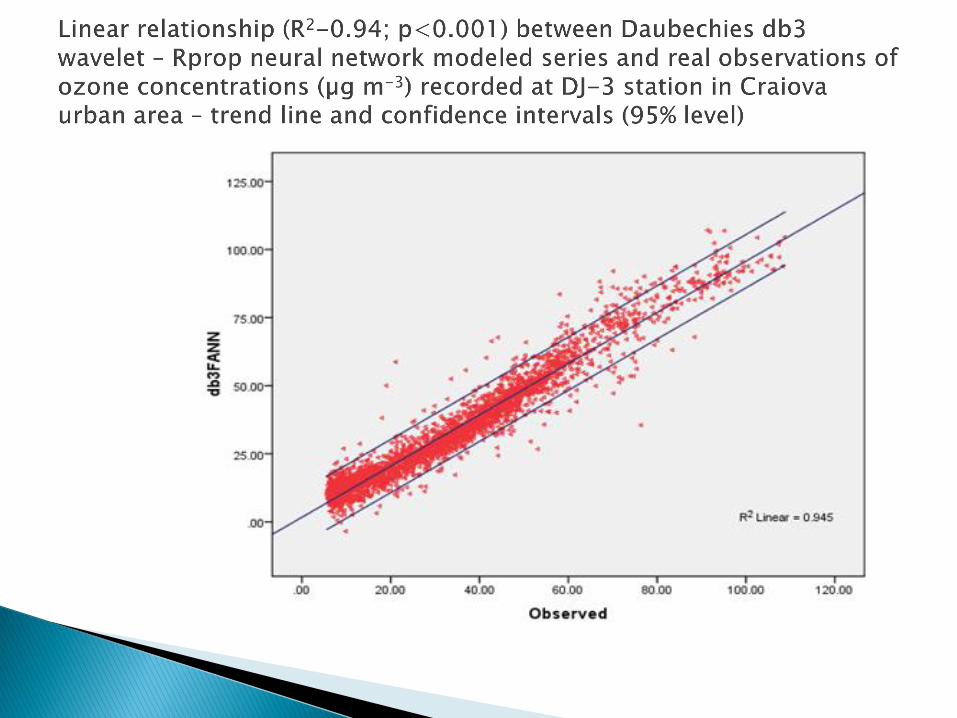
In this study, Daubechies db3 wavelet – Rprop neural network (6-4-1) utilization gave very good results for ozone time series optimizing the exclusive use of the artificial neural network for hourly-recorded time series.
When using wavelet – artificial neural network approaches for successful development of air pollution prediction tools is necessary to assess:
Firstly, the specificity of pollutant species according to pollutant's type, emission sources, trends, time series patterns and their influencing factors.
Secondly, spatial variability of pollutant concentrations based on the comparison of time series patterns of the same pollutant recorded in various locations to test model's homogeneity and generalization level for the identified wavelet – neural network configurations.
1. European Commission: Communication from the Commission to the European Parliament, the Council, the European Economic and Social Committee and the Committee of the regions, A Clean Air Programme for Europe, http://eur-lex.europa.eu/LexUriServ/LexUriServ.do?uri=COM:2013:0918:FIN:EN:PDF
2. OECD: The OECD Environment Outlook 2050: The Consequences of Inaction, http://www.oecd.org/environment/oecdenvironmentaloutlookto2050theconsequencesofinaction.htm
3. Dunea, D., Oprea, M., Lungu, E.: Comparing statistical and neural network approaches for urban air pollution time series analysis. In: Bruzzone, L. (ed.), MIC '08 Proceedings of the 27th IASTED International Conference on Modelling, Identification and Control, pp.93-98. Acta Press, Anaheim (2008)
4. Modarres, R., Khosravi Dehkordi, A.: Daily air pollution time series analysis of Isfahan City. Int. J. Enviro. Sci. Tech. 2 (3), 259-267 (2005)
5. Nicolescu, C.L., Dunea, D., Moise, V., Gorghiu, G.: Time series analysis of the pollutants imissions in urban areas. Bulletin UASVM Agriculture Cluj-Napoca 66 (2), 155-162 (2009)
6. Nunnari, G., Dorling, S., Schlink, U., Cawley, G., Foxall, R., Chatterton, T.: Modelling SO2 concentration at a point with statistical approaches. Environmental Modelling & Software 19 (10), 887–905 (2004)
7. Iordache, Ş., Dunea, D.: Cross-spectrum analysis applied to air pollution time series from several urban areas of Romania. Environmental Engineering and Management Journal 12 (4), 677-684 (2013)
8. Rahman, S.M., Khondaker, A.N., Abdel-Aal, R.: Self organizing ozone model for Empty Quarter of Saudi Arabia: Group method data handling based modeling approach. Atmospheric Environment 59, 398-407 (2012)
9. Dunea, D., Pohoata, A.A., Lungu, E.: Fuzzy inference systems for estimation of air quality index. ROMAI Journal 7(2), 63-70 (2011)
10. Han, J., Kamber, M.: Data mining: Concepts and techniques. Elsevier Inc.-Morgan Kaufman, San Francisco (2006)
11. Sotomayor-Olmedo, A., Aceves-Fernández, M.A., Gorrostieta-Hurtado, E., Pedraza-Ortega, C., Ramos-Arreguín, J.M., Vargas-Soto, J.E.: Forecast urban air pollution in Mexico City by using support vector machines: a kernel performance approach. International Journal of Intelligence Science 3, 126-135 (2013)
12. Lungu, E., Oprea, M., Dunea, D.: An application of artificial neural networks in environmental pollution forecasting. In: Gammerman, A. (ed.): AIA '08 Proceedings of the 26th IASTED International Conference on Artificial Intelligence and Applications, pp. 187-193, Acta Press Anaheim (2008)
13. Caselli, M., Trizio, L., de Gennaro, G., Ielpo, P.: A simple feedforward neural network for the PM10 forecasting: comparison with a radial basis function network and a multivariate linear regression model. Water, Air & Soil Pollution 201 (1-4), 365-377 (2009)
14. Moustris, K.P., Ziomas, I.C., Paliatsos, A.G.: 3-day-ahead forecasting of regional pollution index for the pollutants NO2, CO, SO2, and O3 using artificial neural networks in Athens, Greece. Water, Air & Soil Pollution 209 (1-4), 29-43 (2010)
15. Oprea, M.: INTELLEnvQ-Air: An Intelligent System for Air Quality Analysis in Urban Regions. International Journal of Artificial Intelligence 9, A12, 106-122 (2012)
16. Zhang, Y., Seigneur, C., Bocquet, M., Mallet, V., Baklanov, A.: Real-time air quality forecasting, Part I: History, techniques, and current status. Atmospheric Environment 60, 632-655 (2012)
17. Zainuddin, Z., Pauline, O.: Modified wavelet neural network in function approximation and its application in prediction of time-series pollution data. Applied Soft Computing 11, 4866–4874 (2011)
18. Prakash, A., Kumar, U., Kumar, K., Jain, V.K.: A wavelet-based neural network model to predict ambient air pollutants’ concentration. Environmental Modeling & Assessment 16 (5), 503-517 (2011)
19. Stolojescu, C., Railean, I., Moga, S., Lenca, Ph., Isar, A.: A wavelet based prediction method for time series, Proceedings of Stochastic Modeling Techniques and Data Analysis (SMTDA2010) International Conference, Chania, Greece (2010)
20. Siwek, K., Osowski, S.: Improving the accuracy of prediction of PM10 pollution by the wavelet transformation and an ensemble of neural predictors. Engineering Applications of Artificial Intelligence 25, 1246–1258 (2012)
21. Misiti, M., Misiti, Y., Oppenheim, G., Poggi, J.-M.: Matlab Wavelet Toolbox™ User’s Guide. The MathWorks, Inc. (2013)
22. Romanian Air Quality Monitoring National Network, http://www.calitateaer.ro (Accessed on 28 February 2014)