allegheny county mortality report: 2016...2015 allegheny county mortality report september 2018 ii...
TRANSCRIPT
2015 Allegheny County Mortality Report September 2018
Allegheny County Mortality Report: 2016
Updated December 2019
A publication of the
Allegheny County Health Department
Bureau of Assessment, Statistics & Epidemiology
542 Fourth Avenue, Pittsburgh, PA 15219
Karen Hacker, MD, MPH, Director
Report prepared by:
Kristin Selker, MPH, Statistical Administrator
2015 Allegheny County Mortality Report September 2018
i
TABLE OF CONTENTS
Executive Summary…………………………………………………………………………………………………………………………………...1
Mortality Report Summary and Illustrations……………………………………………………………………………………….…2-21
Total Deaths…………………………………………………………………………………………………………………………………..3
Leading Causes of Deaths……………………………………………………………………………………………………………….3
Mortality by Sex……………………………………………………………………………………………………………………………..4
Mortality by Race……………………………………………………………………………………………………………………..…4-5
Mortality by Sex and Race……………………………………………………………………………………………………………5-6
Infant Mortality………………………………………………………………………………………………………………………..…6-7
Neonatal Mortality…………………………………………………………………………………………………………………………7
Post-Neonatal Mortality…………………………………………………………………………………………………………………7
Mortality Illustrations……………………………………………………….………………………………………………………8-21
Technical Notes…………………………………………………………………………………………………………………………………..22-24
2015 Allegheny County Mortality Report September 2018
ii
LIST OF TABLES
TABLE 1. Number of total deaths, percent of total deaths, age-adjusted mortality rates, 95% confidence intervals, and percent change for leading causes of death: Allegheny County, 2015 and 2016…………………………………………………………………..…………………10
TABLE 2. Age-adjusted mortality rate for leading causes of death: Allegheny County, 1970-2016…………………………………………………………………………………...………10
TABLE 3. Leading causes of death rank, number of deaths, age-adjusted mortality rates, and 95%
confidence intervals for county leading cause of death: Allegheny County, 2015 and 2016………………………………………………………………………………………………………………..……….……...12
TABLE 4. Median age (in years) at death for county leading causes of death by sex:
Allegheny County, 2015 and 2016……………………….…………………………………………………………….12 TABLE 5. Male-to-female age-adjusted mortality rate ratios: Allegheny County, 2014-2016……………….12 TABLE 6. Leading causes of death rank, number of deaths, age-adjusted mortality rates, and 95%
confidence intervals for county leading cause of death by race: Allegheny County, 2015 and 2016...................................................................................................................................................................................14
TABLE 7. Black-to-White age-adjusted mortality rate ratios: Allegheny County, 2014-2016……………….14 TABLE 8. Median age (in years) at death for county leading causes of death by race:
Allegheny County, 2015 and 2016……………………………………………………………………………………..14 TABLE 9. Leading causes of death rank, number of deaths, age-adjusted mortality rates, and 95%
confidence intervals for county leading cause of death for females: Allegheny County, 2015 and 2016…………………………………………………………………………………………………………………16
TABLE 10. Leading causes of death rank, number of deaths, age-adjusted mortality rates, and 95%
confidence intervals for county leading cause of death for males: Allegheny County, 2015 and 2016……………………………………………………………………………………………………………..….16
TABLE 11. Black-to-White age-adjusted mortality rate ratios by sex: Allegheny County, 2014-2016…….17 TABLE 12. Median age (in years) at death for county leading causes of death by sex and race:
Allegheny County, 2015 and 2016……………………………......………………………………………….……….17 TABLE 13. Neonatal mortality number and rate by race: Allegheny County, 1990-2016……..………………..19 TABLE 14. Post-Neonatal mortality number and rate by race: Allegheny County, 1990-2016……..………...21

2015 Allegheny County Mortality Report September 2018
iii
LIST OF FIGURES
FIGURE 1. All-cause age-adjusted mortality rate: Allegheny County, 1970-2016……………………………………8 FIGURE 2. All-cause age-adjusted mortality rate: Allegheny County, Pennsylvania,
and the United States, 2000-2016…………………………………………………………………………………….....8 FIGURE 3. Change in number of deaths for leading causes: Allegheny County, 2015 and 2016………….……9 FIGURE 4. Age-adjusted mortality rate for leading causes of death:
Allegheny County, 2015 and 2016……………………………………………………………………………………….9 FIGURE 5. All-cause age-adjusted mortality rate by sex: Allegheny County, 1970-2016………………………11 FIGURE 6. All-cause age-adjusted mortality rate by race: Allegheny County, 1970-2016….….………………13 FIGURE 7. Age-adjusted mortality rate for leading causes of death by race:
Allegheny County, 2016…………………………………………………………………………………………………….13 FIGURE 8. All-cause age-adjusted mortality rate by race: Allegheny County, 1970-2016…...…………………15 FIGURE 9. Infant mortality rate by race and geography: Allegheny County and Pennsylvania,
1999-2016………………………………………………………………………………………………………………………18 FIGURE 10. Neonatal mortality rate by race and geography: Allegheny County and Pennsylvania,
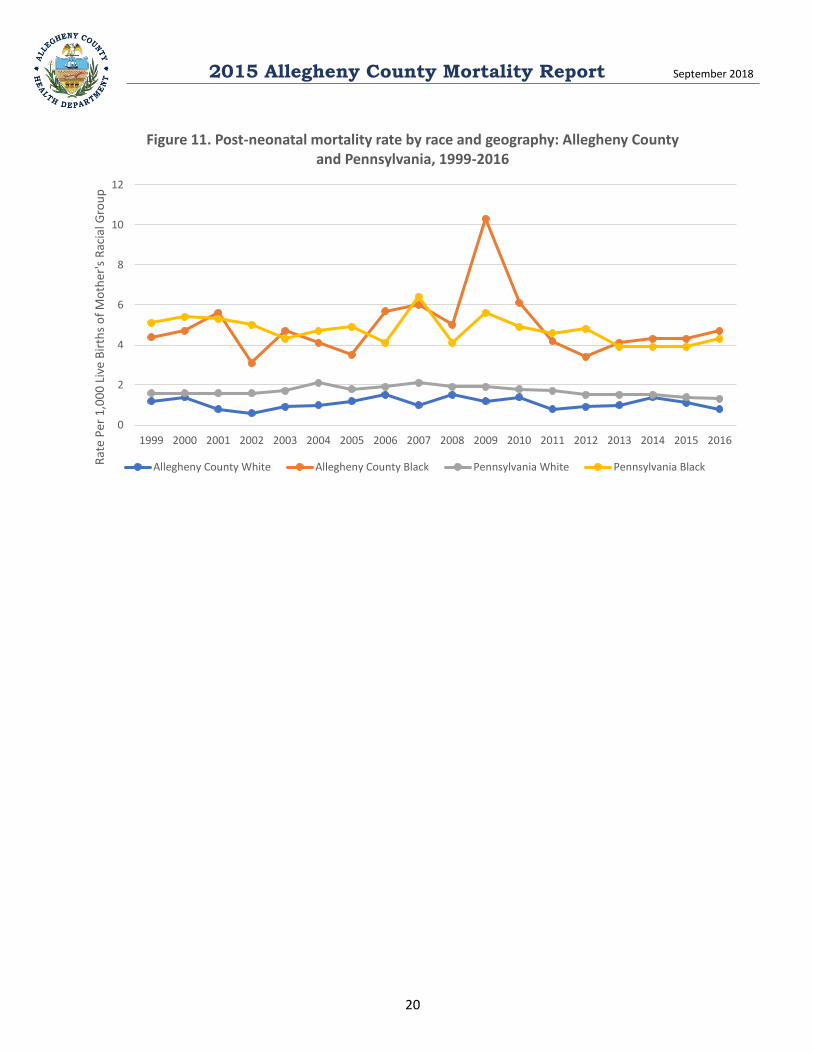
1999-2016……………………………………………………………………………………………………………………….18 FIGURE 11. Post-neonatal mortality rate by race and geography: Allegheny County and Pennsylvania,
1999-2016……………………………………………………………………………………………………………………….20

2015 Allegheny County Mortality Report September 2018
1
EXECUTIVE SUMMARY
The 2016 Allegheny County Mortality Report contains final 2016 mortality data including: age-adjusted
mortality rates from leading causes of death examined by sex and race, as well as infant, neonatal, and post-
neonatal mortality rates. Where possible, data were compared between Allegheny County and Pennsylvania,
as well as examined for trends through 2016. Relevant data were compared to the Healthy People 2020 goals
set forth by the U.S. Department of Health and Human Services.
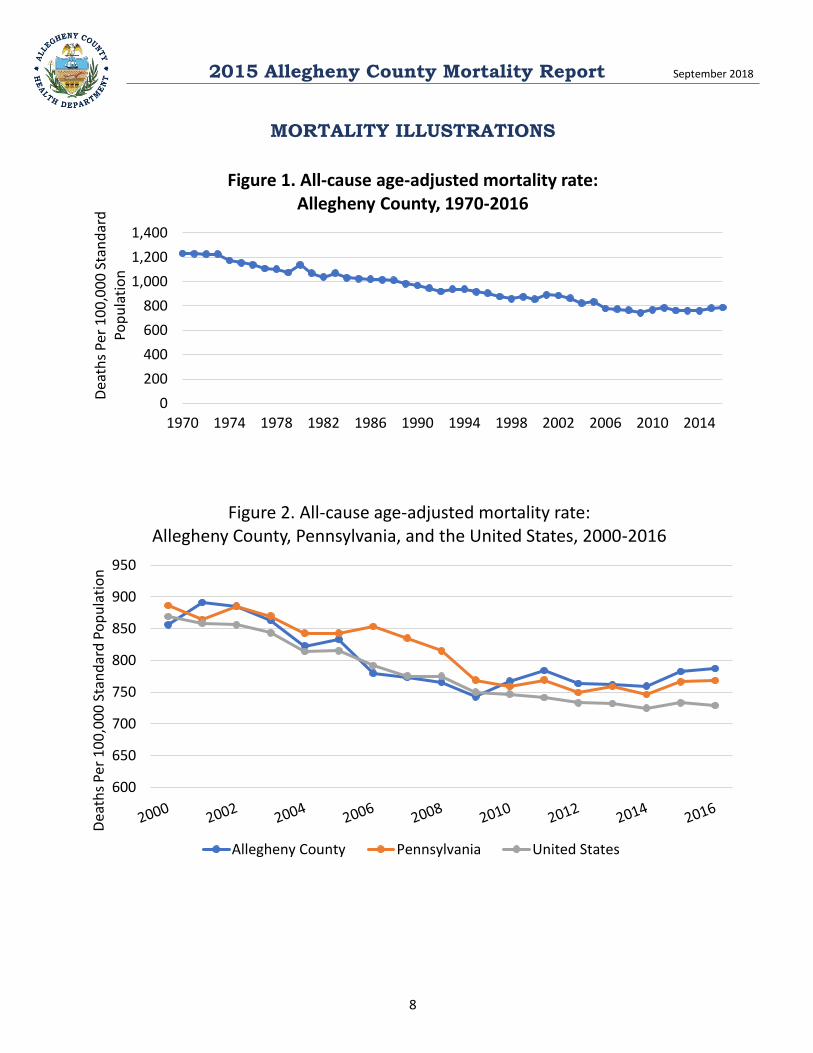
In 2016, there were 13,804 deaths in Allegheny County, resulting in an age-adjusted mortality rate for all
causes of 787.1 per 100,000. This rate was higher than that of Pennsylvania (768.4 per 100,000) and the
United States (728.8 per 100,000) in the same year.
Major findings of the 2016 Allegheny County Mortality Report include:
• Diseases of the heart and malignant neoplasms were the first and second leading causes of death,
respectively, in 2016. These two diseases accounted for 45.6% of all deaths in 2016.
• The number of deaths due to diseases of the heart and malignant neoplasms decreased in 2016.
• The age adjusted rate due to unintentional injuries significantly increased from 2015 (56.6 per
100,000) to 2016 (75.0 per 100,000).
• From 1970 through 2016, the county age-adjusted rate for intentional self-harm increased to the
highest rate in recent history (13.9 per 100,000).
• Gender disparities have remained consistent for Allegheny County, with a male-to-female age-
adjusted mortality ratio of 1.5 since 2014.
• The largest male-to-female disparities by cause in 2016 were for deaths due to assault (5.2), suicide
(3.0), Parkinson’s disease (2.4), and unintentional injuries (2.2); males had a higher age-adjusted
mortality rate for all causes except Alzheimer’s disease (0.7).
• The median age of death was older for females for all causes of mortality except for chronic liver
disease and cirrhosis.
• The largest racial disparities by cause of death include: assault (19.6), nephritis, nephrotic syndrome
and nephrosis (3.0), diabetes mellitus (1.9), cerebrovascular disease (1.7), and diseases of the heart
(1.5).
• The largest differences in median age at death by race were: influenza and pneumonia (18 yrs.),
suicide (15 yrs.), diseases of the heart (12 yrs.), and cerebrovascular disease (12yrs.).
• The mortality rate from Alzheimer’s disease decreased among black population from 273.8 per
100,000 in 2016 to 15.5 per 100,000. Alzheimer’s disease was the only cause of death which the black
population had an older median age at death.
• In 2016, there was a significant increase in all-cause mortality for black males. This increase was
driven by the significant rise in the rate of unintentional injury deaths for the population.
• The mortality rate for cancer decreased for black females to 159.2 per 100,000 in 2016. The
decreased rate reduced the racial disparity between black and white females from 1.4 in 2015 to 1.1
in 2016.
• The infant mortality rate in the county decreased to 5.96 per 1,000 live births. However, racial
disparities persisted with a rate for black infants 4.5 times higher than that of white infants.
• Neonatal and post-neonatal mortality have remained relatively stable with a rate of 4.4 per 1,000 and
1.5 per 1,000 respectively.

2015 Allegheny County Mortality Report September 2018
2
2016 ALLEGHENY COUNTY
MORTALITY REPORT
SUMMARY AND ILLUSTRATIONS

2015 Allegheny County Mortality Report September 2018
3
MORTALITY SUMMARY
Deaths
The 2016 the Allegheny County age-adjusted mortality rate of 787.1 per100,000 from all causes was larger
than the rate for Pennsylvania (768.4 per 100,000 standard population) and for the United States (728.8 per
100,000 standard population). While this rate has decreased overall for the county, state, and nation since
2000, Pennsylvania and Allegheny County saw an increase in 2016.
Leading Causes
There were 15 leading causes of death evaluated in Allegheny County: 1) diseases of the heart, 2) malignant
neoplasms (cancers), 3) accidents (unintentional injuries) 4) chronic lower respiratory diseases, 5)
cerebrovascular diseases, 6) Alzheimer’s disease, 7) diabetes mellitus, 8) influenza and pneumonia, 9)
nephritis, nephrotic syndrome and nephrosis, 10) septicemia, 11) chronic liver disease and cirrhosis, 12)
intentional self-harm (suicide), 13) Parkinson’s disease, 14) pneumonitis due to solids and liquids, and 15)
assault (homicide).
Diseases of the heart and malignant neoplasms are the first and second leading causes of death, respectively,
in Allegheny County. These two diseases accounted for 45.6% of all deaths in 2016. There were 121 fewer
deaths from diseases of the heart and 36 fewer deaths due to malignant neoplasms in 2016 compared to
2015. Other notable changes in number of deaths by cause from 2015 to 2016 include:
• An additional 207 deaths due to unintentional injuries in 2016.
• 61 more deaths due to chronic lower respiratory diseases and 34 more deaths from cerebrovascular
disease.
• A decrease of 74 deaths due to influenza and pneumonia in 2016.
The age-adjusted mortality rate decreased for deaths due to diseases of the heart and malignant neoplasms
in 2016 compared to 2015. Other important changes in age-adjusted mortality rates include:
• The age-adjusted mortality rate due to unintentional injuries significantly increased by 32.5%, from
56.6 per 100,00 in 2015 to 75.0 per 100,000 in 2016.
• The age-adjusted mortality rate due to influenza and pneumonia fell by 20.5%, from 17.1 per 100,000
to 13.6 per 100,000 in 2016.
• Age-adjusted rates for chronic lower respiratory diseases, cerebrovascular disease, diabetes mellitus,
intentional self-harm, Parkinson’s disease, and pneumonitis due to solids and liquids slightly
increased.
• Age-adjusted rates slightly decreased for Alzheimer’s disease, assault, and nephritis, nephrotic
syndrome and nephrosis.
• Rates for intentional self-harm (suicide) and unintentional injuries have continued to climb since
1970 reaching their highest rates since yearly calculations began at the county level.
• Age-adjusted rates for malignant neoplasms and influenza and pneumonia have declined since 1970
reaching a county low since yearly calculations began.

2015 Allegheny County Mortality Report September 2018
4
Mortality by Sex
From 1970 through 2016, the all-cause age-adjusted mortality rate for both males and females has trended
downward. In 2016, the number of deaths due to all causes was 7,051 for females and 6,753 for males. The
age-adjusted rate for females slightly decreased to 651.6 per 100,000 from 652.9 per 100,000 in 2015. Males
experienced an increase in the age-adjusted rate reaching 960.1 deaths per 100,000, compared to 947.4 per
100,000 in 2015. The rate for males has been consistently higher than that of females with the age-adjusted
male-to-female mortality rate ratio remaining at 1.5 since 2014.
• In 2016, the age-adjusted mortality rate due to unintentional injuries among males significantly
increased to 103.2 per 100,000 from 75.2 per 100,000. The rate for males was 2.2 times that of
females (47.8 per 100,000). Females had a notable but not a significant increase in the rate of
accidental deaths, their median age of death from unintentional injuries decreased by 12.5 years to
55 years of age.
• In 2016 the mortality ratio for the rate of deaths due to suicides decreased from 4 in 2015, to 3.
However, this decrease was due to a rise in the rate for females to 7.1 deaths per 100,000. Compared
to 2015, the median age of death from suicides in females decreased from 53 years to 48 years of age.
• The age-adjusted mortality rate from homicides for males was 14.8 deaths per 100,000 in 2016. This
was a slight decrease from the 2015 rate of 17.3 per 100,000. Rates for females slightly increased to
2.9 deaths per 100,000 in 2016. The ratio decreased from 9.6 in 2015 to 5.2 in 2016.
• The rate of death from cancers was 1.7 times higher for males with a rate of 202.2 per 100,000
compared to 142.5 per 100,000 for females.
• Age-adjusted rates for Alzheimer’s disease decreased for males and increased for females.
• Median age at death for septicemia, Parkinson’s disease, and chronic liver disease and cirrhosis
increased for males and females indicating residents dying at an older age from these causes.
Mortality by Race
From 1970 through 2016, the all-cause age-adjusted mortality rate for both the white and black populations
have decreased. The mortality rate has been consistently higher for the black population compared to the
white population. In 2016, the age-adjusted rate for all-cause mortality was 1073.6 per 100,000 for the black
population and 750.8 per 100,000 for the white population.
• The rate of homicides in the county was the largest mortality disparity by race. The rate for the black
population was 19.6 times higher than the rate for the white population at 46.4 per 100,000
compared to 2.4 per 100,000. However, the rate decreased for the black population from 51.8 per
100,000 in 2015.
• Death due to nephritis, nephrotic syndrome and nephrosis also presented as a disparity in the county
with the black population experiencing mortality at a rate 3 times that of the white population. The
disparity has been growing from 2014 with rates increasing in the black population to 37.3 per
100,000 and decreasing in the white population to a rate of 13.5 per 100,000.
• Deaths due to diabetes affected the black population at a rate 1.9 times that of the white population.
The black population had a rate of 34.7 per 100,000 with a median age of death from diabetes of 69
years compared to the white population that had a rate of 18.2 per 100,000 and median age of 78.

2015 Allegheny County Mortality Report September 2018
5
• The black population had a 12-year younger median age at death from cerebrovascular disease of 73
years, with a rate 1.7 times higher than the rate of the white population who had a median age of 85
years.
• The black population had a higher rate of death due to diseases of the heart (1.5 times the rate for the
white population) with a median age of 72 years, 12 years younger than white population.
• The rate of death from cancers in 2016 for the black population was 202.9 per 100,000, 1.2 times that
of the white population at 162.7 per 100,000. African Americans also had a median age of death from
cancer at 69 years compared to 75 for whites.
• The rate of death due to Alzheimer’s disease decreased among the black population from 27.8 per
100,000 in 2015 to 15.5 per 100,000 in 2016. In 2016 the black population had a rate 40% lower
than the white population. The median age for death in the black population also increased from 87
to 89.5 years of age in 2016. Mortality due to Alzheimer’s disease was the only cause which African
Americans had an older median age at death than the white population.
• While the age-adjusted rate due to suicides in the black population remains 10% less than that of the
white population, the number of deaths has been increasing.
• Other disparities include septicemia (1.4), chronic liver disease and cirrhosis (1.2), and pneumonitis
due to solids and liquids (1.3).
• Additional median ages at death to note include: septicemia 69.5 years for the black population
compared to 81 years for the white population, and unintentional injuries 51 years for both the black
and white populations.
Mortality by Sex and Race
Since 1970, the all-cause mortality rate has been trending downward for black and white females and males.
However, in 2016 there was a significant increase in the all-cause mortality rate for black males. In 2016
black males had an all-cause mortality rate of 1433.3 per 100,000. This rate was 1.6 times higher than the
rate for white males, 905.0 per 100,000. Black females had an age-adjusted mortality rate of 830.5 per
100,000, while white females had a rate of 628.7 per 100,000. Black females have consistently had an all-
cause mortality rate that is 1.3 times higher than that of white females since 2014. Across races, males had a
higher age-adjusted mortality rate and lower median age of death than their female counterparts. Across
sexes, black males and females had a higher age-adjusted mortality rate and lower median age of death than
their white counterparts.
• Death due to nephritis, nephrotic syndrome, and nephrosis increased for black females in 2016 to a
rate of 28.2 per 100,000 and decreased for white females to 10.2 per 100,000. This cause had the
largest ratio of 2.8 between races for females. Despite the increased rate for black females, the
median age of death increased to 80 years. The rate also increased for black males to 52.8 per
100,000, 3.2 times the rate for white males (16.7 per 100,000) and 1.8 times the rate of black females.
• Rates of unintentional injuries significantly increased for black males in 2016, from 79.3 per 100,000
in 2015 to 139.6 per 100,000. While in 2015 males had similar rates across the races, in 2016 black
males had a rate 1.4 times that of white males, who also had a significant increase (102.4 per
100,000). Due to the increase in deaths due to unintentional injuries, its rank as a leading cause of
death among black males rose from 4th to 3rd in 2016. Rates for males were significantly higher than
their female counterparts. Black females had a decrease in the rate from 2015 to 38.4 per 100,000

2015 Allegheny County Mortality Report September 2018
6
and had a rate 10% lower than white females who had a significantly increased rate of 50.8 per
100,000. Median ages at death also decreased.
• Rates of death due to cancers have decreased for black females from a rate of 199.1 per 100,000 to
159.2 per 100,000 in 2016. This decrease has driven down the black to white mortality ratio for
cancer in females from 1.4 to 1.1, with white females having a rate of 140.2 per 100,000 in 2016.
While cancer was the number one cause of death for black females in 2015, in 2016 it dropped to
number two, aligning with the causes of death rankings for the county and white females. However,
the rate for black males increased to 276.6 per 100,000, driving their ratio from 1.1 to 1.4, while
white males had rate of 195.2 per 100,000. Despite these changes, the median age of death remained
consistent at 69 years for black females, 77 years for white females, 69 for black males, and 74 for
white males
• Black and white females had an increase in the rate of death due to cerebrovascular disease. The
increase from 41.3 per 100,000 to 50.4 per 100,000 for black females and 30.5 per 100,000 to 32.3
per 100,000 for white females resulted in a ratio of 1.6 between the races. It was the third leading
cause of death for both races of females, and fifth for males.
• The mortality rate for chronic lower respiratory diseases almost doubled for black males from 2015
(35.4 per 100,000) to 2016 (62.5 per 100,000). White males had a rate of 41.8 per 100,000. Chronic
lower respiratory diseases were the fourth leading cause of death for white males and was not a top
five cause for black males.
• Black females and black males had a 1.5 times higher mortality rate for diseases of the heart than
their white counterparts. Rates slightly increased for black females and males and decreased for
white females and males from 2015 to 2016.
• Homicide was the fourth leading cause of death among black males in 2016, however it was not
among the top five leading causes for white males. The rate decreased from 101.5 per 100,000 in
2015 to 83.9 per 100,000 in 2016. However, the rate remains disproportionately higher for black
males (22.1 times higher) than that of white males who had a rate of 3.8 per 100,000. The median
age of death for a black male due to homicide was 27 years.
• The rate for death due to chronic liver disease and cirrhosis among black males was 1.3 times the rate
of white males. This disparity increased from 2015 when black males had a rate 10% lower than
white males.
• The mortality rate due to diabetes among black females, 37.1 per 100,000, was 2.4 times higher than
the rate for white females, 15.2 per 100,000. The disparity is also evident in the median age at death
for black females of 68 years compared to 81 years for white females. While the rate increased for
black females, black males saw a decrease to 32.3 per 100,000. This decrease lowered the ratio for
males from 2.1 in 2015 to 1.4 in 2016. The median age at death for black males also increased by 4
years to 70.
Infant Mortality
Infant mortality is defined as death occurring within the first year of life. In 2016 there were 78 infant deaths
in Allegheny County with a rate of 5.9 per 1,000 live births. This rate decreased from 6.2 per 1,000 births in
2015 when there were 83 infant deaths. In 2016 Allegheny County had a lower infant mortality rate than
Pennsylvania’s (6.1 per 1,000).

2015 Allegheny County Mortality Report September 2018
7
There are racial disparities between black and white populations in Allegheny County and at the state level.
In Allegheny County the mortality rate for black infants increased in 2016 to 14.9 deaths per 1,000 births.
This rate was 4.5 times higher than the rate for white infants (3.3 per 1,000 births,) and higher than
Pennsylvania's black infant mortality rate (14.6 per 1,000). The Healthy People 2020 goal of reaching an
infant mortality rate of 6 deaths per 1,000 births was met for the County’s white population and overall rate,
but was not attained for the black population.
Neonatal Mortality
Neonatal mortality is a death that occurs within the first 28 days of life. In 2016, there were 58 neonatal
deaths, one fewer than 2015. The neonatal mortality rate has remained stable for the county since 2014 at
4.4 per 1,000 births. Allegheny County had the same neonatal mortality rate as Pennsylvania. In 2016 the
neonatal mortality rate for white neonates decreased from 3 per 1,000 in 2015 to 2.5 per 1,000. However,
the rate increased for black neonates from 8.2 per 1,000 in 2015 to 10.2 per 1,000 in 2016. The Healthy
People 2020 goal of reaching the rate of 4.1 deaths per 1,000 has only been met in the county's white
population.
Post Neonatal Mortality
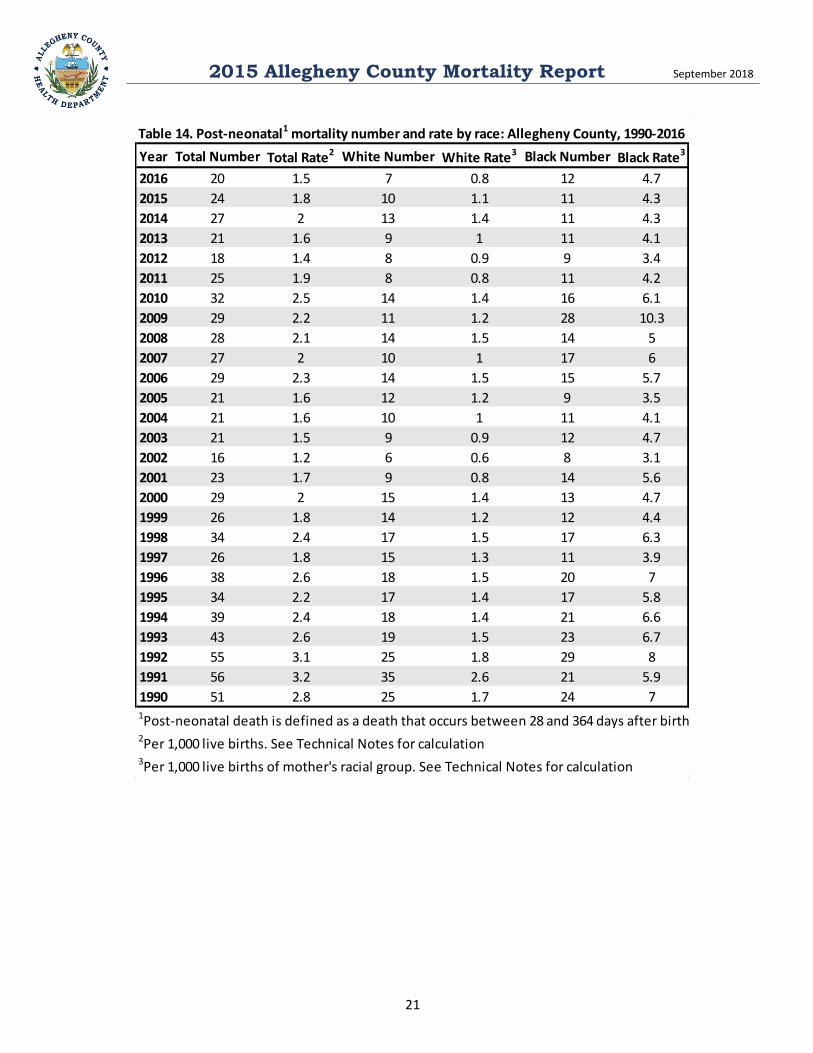
Post neonatal death occurs between the 28th and 364th day of life. In 2016 there were 20 post neonatal deaths
in Allegheny County with a rate of 1.5 per 1,000 births. This is the lowest rate the county has had since 2012.
The County rate was lower than Pennsylvania’s rate of 1.7 per 1,000. However, the rate for post neonatal
deaths in the black population increased to 4.7 per 1,000 births while the rate for the white population
decreased to 0.8 per 1,000. The rate for black post-neonatal mortality in the county has remained
consistently above the state’s rate since 2013. The disparity in rates by race is larger in Allegheny County at
5.9 compared to 3.3 at the state level. The Healthy People 2020 goal of 2.0 deaths per 1,000 has been met for
the county's white post-neonatal rate (0.8 per 1,000) and for the overall county rate but has not been
reached for the black population.
2015 Allegheny County Mortality Report September 2018
8
MORTALITY ILLUSTRATIONS
0
200
400
600
800
1,000
1,200
1,400
1970 1974 1978 1982 1986 1990 1994 1998 2002 2006 2010 2014
Dea
ths
Per
10
0,0
00
Sta
nd
ard
Po
pu
lati
on
Figure 1. All-cause age-adjusted mortality rate: Allegheny County, 1970-2016
600
650
700
750
800
850
900
950
Dea
ths
Per
10
0,0
00
Sta
nd
ard
Po
pu
lati
on
Figure 2. All-cause age-adjusted mortality rate:Allegheny County, Pennsylvania, and the United States, 2000-2016
Allegheny County Pennsylvania United States

2015 Allegheny County Mortality Report September 2018
9
-150 -100 -50 0 50 100 150 200 250
Assault (homicide)
Pneumonitis due to solids and liquids
Parkinson's disease
Intentional self-harm (suicide)
Chronic liver disease and cirrhosis
Septicemia
Influenza and pneumonia
Nephritis, nephrotic syndrome and nephrosis
Diabetes mellitus
Alzheimer's disease
Cerebrovascular disease
Chronic lower respiratory diseases
Accidents (unintentional injuries)
Malignant neoplasms
Diseases of heart
All Cause
Figure 3. Change in number of deaths by cause:Allegheny County, 2015 to 2016
0 50 100 150 200 250
Assault (homicide)
Pneumonitis due to solids and liquids
Parkinson's disease
Intentional self-harm (suicide)
Chronic liver disease and cirrhosis
Septicemia
Influenza and pneumonia
Nephritis, nephrotic syndrome and nephrosis
Diabetes mellitus
Alzheimer's disease
Cerebrovascular disease
Chronic lower respiratory diseases
Accidents (unintentional injuries)
Malignant neoplasms
Diseases of heart
Figure 4. Age-adjusted mortality rate for leading causes of death:Allegheny County, 2015 and 2016
2016 2015
*Error bars indicate 95% confidence intervals

2015 Allegheny County Mortality Report September 2018
10
Table 1: Number of total deaths, percent of total deaths, age-adjusted mortality rate, 95% confidence intervals, and percent change for leading causes of death: Allegheny County, 2015 and 2016
Age-
Adjusted
Age-
Adjusted
Ratea Ratea
All causes 13,844 100% 782.5 (769.5, 795.6) 13,804 100% 787.1 (774.0, 800.2) 0.6%
Diseases of heart 3,534 26% 188.4 (182.2, 194.6) 3,413 25% 183.0 (176.9, 189.2) -2.9%
Malignant neoplasms 2,929 21% 169.0 (162.9, 175.2) 2,893 21% 166.7 (160.6, 172.8) -1.4%
Accidents (unintentional injuries) 798 6% 56.6 (52.6, 60.5) 1004 7% 75.0 (70.3, 79.6) 32.5%
Chronic lower respiratory diseases 640 5% 35.9 (33.1, 38.7) 701 5% 39.0 (36.1, 41.8) 8.4%
Cerebrovascular disease 639 5% 34.2 (31.5, 36.8) 673 5% 36.0 (33.3, 38.7) 5.3%
Alzheimer's disease 503 4% 24.2 (22.1, 26.3) 485 4% 23.1 (21.1, 25.2) -4.3%
Diabetes mellitus 341 2% 19.9 (17.8, 22.0) 353 3% 20.1 (18.0, 22.2) 1.0%
Nephritis, nephrotic syndrome and nephrosis 298 2% 16.3 (14.4, 18.1) 271 2% 14.8 (13.1, 16.6) -9.0%
Influenza and pneumonia 327 2% 17.1 (15.3, 19.0) 253 2% 13.6 (11.9, 15.3) -20.5%
Septicemia 210 2% 11.8 (10.2, 13.4) 198 1% 11.2 (9.6, 12.8) -5.2%
Chronic liver disease and cirrhosis 173 1% 11.5 (9.8, 13.2) 185 1% 11.3 (9.7, 13.0) -1.5%
Intentional self-harm (suicide) 174 1% 12.9 (11.0, 14.9) 178 1% 14.0 (11.9, 16.0) 8.0%
Parkinson's disease 129 1% 7.3 (6.0, 8.5) 140 1% 7.5 (6.3, 8.7) 3.1%
Pneumonitis due to solids and liquids 130 1% 6.6 (5.5, 7.8) 133 1% 6.8 (5.7, 8.0) 3.5%
Assault (homicide) 113 1% 9.6 (7.8, 11.3) 106 1% 8.8 (7.2, 10.5) -7.6%
Percent Change
in Rates
aRate is deaths per 100,000 standard population
2015 2016
Cause of Death Number Percent
95%
Confidence
Interval
Number Percent
95%
Confidence
Interval
Cause of Death 1970 1975 1980 1985 1990 1995 2000 2005 2010 2012 2013 2014 2015 2016
All causes 1230.9 1152.9 1197.1 1022.6 968.5 915.5 855.7 833.3 767 763.6 761.5 759.6 782.5 787.1
Diseases of heart 545.8 213.5 497.7 427.9 345.7 308.3 256.2 228.3 183.6 181.4 185.7 185.9 188.4 183
Malignant neoplasms 214.9 224.9 237.5 228.3 242.1 228.1 214.2 203.5 184.8 184.2 174.4 173.6 169 166.7
Accidents (unintentional injuries) 38.1 36 35.3 27.8 25.9 25.6 29.3 36.7 43.2 45.6 46.3 47.3 56.6 74.97
Chronic lower respiratory diseases 12.5 21.5 25.8 31.3 35 36.3 37.8 37.9 36.6 36.4 38.5 37.3 35.9 38.96
Cerebrovascular disease 128.8 110.3 89.2 69 61.2 28.9 53.2 43.7 38.9 34.5 37.1 34.7 34.2 35.9
Alzheimer's disease NAb NA 0.5 2.7 5.3 5.3 12.4 20 17.9 18.6 16.6 21 24.2 23.1
Diabetes mellitus 23 20.7 25.4 22.9 23.7 23.3 24.8 20.5 17.2 20.7 20 16.8 19.9 20.1
Influenza and Pneumonia 39.8 33.5 28.6 30.2 33.2 30.8 18.9 18.8 17 15.2 17.8 16.3 17.1 13.6
Nephritis, nephrotic syndrome and nephrosis 6.9 10.1 11.6 13.2 13.7 12.7 17.8 19.3 18.4 15.3 15 14.4 16.3 14.8
Septicemia 2.4 4.4 7.4 9.6 11.1 11.3 16.2 14.7 14 11.6 13 13.2 11.8 11.2
Parkinson's disease NA NA 2.9 3 3.1 4.7 6.5 7.3 7.4 7.9 7.5 7.2 7.3 7.5
Intentional self-harm 13.5 12.7 11.1 11.5 11.1 10.2 10.8 11.4 9.8 11.7 12.9 11.3 12.9 13.9
Chronic liver disease and cirrhosis 21.3 19.1 20.5 11 10.3 9.4 9.3 9.4 10.6 9 10.1 12.6 11.5 11.3
Pneumonitis due to solids and liquids NA NA NA NA NA NA 8.3 13.7 7.9 6.4 6.3 6 6.6 6.8
Assault (homicide) 5.1 6.9 5.7 3.8 5.3 6.8 5.8 7.5 8.6 8 7.3 9.6 9.6 8.8
Table 2: Age-adjusted mortality ratea for leading causes of death: Allegheny County, 1970-2016
aRate is deaths per 100,000 standard populationbNA = Data are not available

2015 Allegheny County Mortality Report September 2018
11
0
200
400
600
800
1000
1200
1400
1600
1800
1970 1975 1980 1985 1990 1995 2000 2005 2010 2012 2013 2014 2015 2016
Rat
e p
er 1
00
,00
0 S
tan
dar
d P
op
ula
tio
n
Figure 5. All-cause age-adjusted death rate by sex: Allegheny County, 1970-2016
Males Females
2015 Allegheny County Mortality Report September 2018
12
Age-
AdjustedAge-Adjusted
Age-
Adjusted
Age-
Adjusted
Ratea Ratea Ratea Ratea
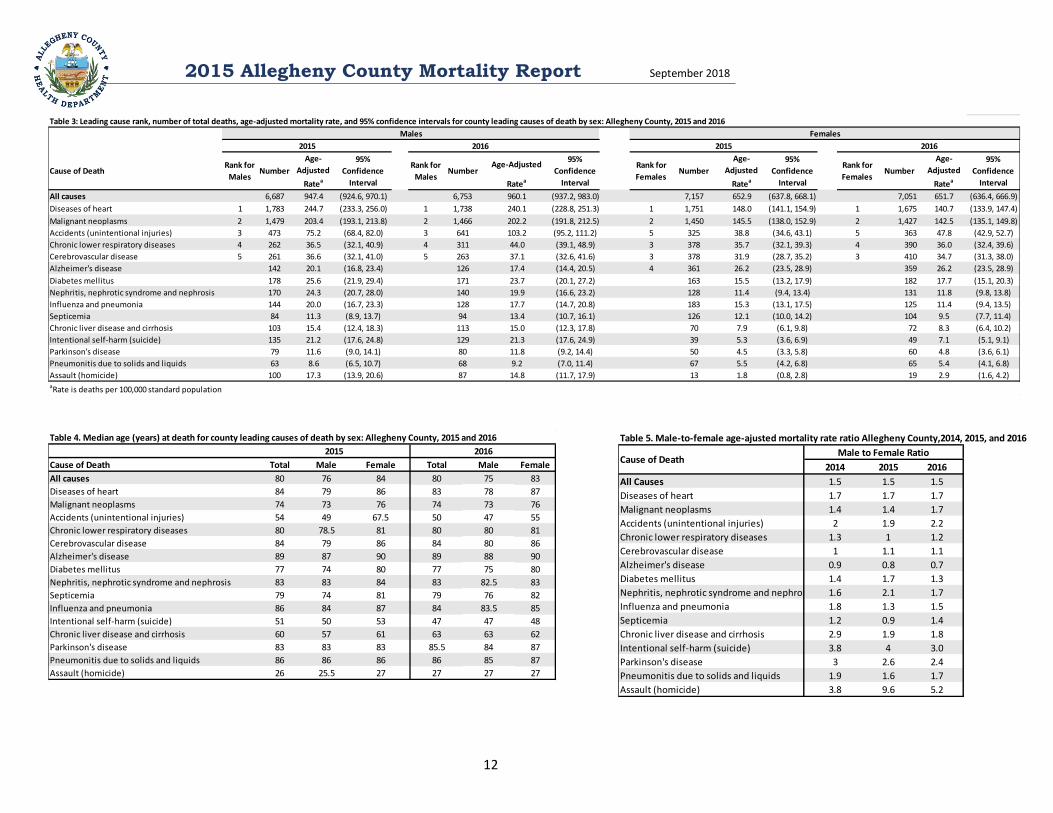
All causes 6,687 947.4 (924.6, 970.1) 6,753 960.1 (937.2, 983.0) 7,157 652.9 (637.8, 668.1) 7,051 651.7 (636.4, 666.9)
Diseases of heart 1 1,783 244.7 (233.3, 256.0) 1 1,738 240.1 (228.8, 251.3) 1 1,751 148.0 (141.1, 154.9) 1 1,675 140.7 (133.9, 147.4)
Malignant neoplasms 2 1,479 203.4 (193.1, 213.8) 2 1,466 202.2 (191.8, 212.5) 2 1,450 145.5 (138.0, 152.9) 2 1,427 142.5 (135.1, 149.8)
Accidents (unintentional injuries) 3 473 75.2 (68.4, 82.0) 3 641 103.2 (95.2, 111.2) 5 325 38.8 (34.6, 43.1) 5 363 47.8 (42.9, 52.7)
Chronic lower respiratory diseases 4 262 36.5 (32.1, 40.9) 4 311 44.0 (39.1, 48.9) 3 378 35.7 (32.1, 39.3) 4 390 36.0 (32.4, 39.6)
Cerebrovascular disease 5 261 36.6 (32.1, 41.0) 5 263 37.1 (32.6, 41.6) 3 378 31.9 (28.7, 35.2) 3 410 34.7 (31.3, 38.0)
Alzheimer's disease 142 20.1 (16.8, 23.4) 126 17.4 (14.4, 20.5) 4 361 26.2 (23.5, 28.9) 359 26.2 (23.5, 28.9)
Diabetes mellitus 178 25.6 (21.9, 29.4) 171 23.7 (20.1, 27.2) 163 15.5 (13.2, 17.9) 182 17.7 (15.1, 20.3)
Nephritis, nephrotic syndrome and nephrosis 170 24.3 (20.7, 28.0) 140 19.9 (16.6, 23.2) 128 11.4 (9.4, 13.4) 131 11.8 (9.8, 13.8)
Influenza and pneumonia 144 20.0 (16.7, 23.3) 128 17.7 (14.7, 20.8) 183 15.3 (13.1, 17.5) 125 11.4 (9.4, 13.5)
Septicemia 84 11.3 (8.9, 13.7) 94 13.4 (10.7, 16.1) 126 12.1 (10.0, 14.2) 104 9.5 (7.7, 11.4)
Chronic liver disease and cirrhosis 103 15.4 (12.4, 18.3) 113 15.0 (12.3, 17.8) 70 7.9 (6.1, 9.8) 72 8.3 (6.4, 10.2)
Intentional self-harm (suicide) 135 21.2 (17.6, 24.8) 129 21.3 (17.6, 24.9) 39 5.3 (3.6, 6.9) 49 7.1 (5.1, 9.1)
Parkinson's disease 79 11.6 (9.0, 14.1) 80 11.8 (9.2, 14.4) 50 4.5 (3.3, 5.8) 60 4.8 (3.6, 6.1)
Pneumonitis due to solids and liquids 63 8.6 (6.5, 10.7) 68 9.2 (7.0, 11.4) 67 5.5 (4.2, 6.8) 65 5.4 (4.1, 6.8)
Assault (homicide) 100 17.3 (13.9, 20.6) 87 14.8 (11.7, 17.9) 13 1.8 (0.8, 2.8) 19 2.9 (1.6, 4.2)
2015 2015
Rank for
Males
Females
2016
Males
95%
Confidence
Interval
aRate is deaths per 100,000 standard population
Table 3: Leading cause rank, number of total deaths, age-adjusted mortality rate, and 95% confidence intervals for county leading causes of death by sex: Allegheny County, 2015 and 2016
2016
95%
Confidence
Interval
Rank for
FemalesNumber
95%
Confidence
Interval
NumberCause of DeathRank for
MalesNumber
95%
Confidence
Interval
NumberRank for
Females
2014 2015 2016
All Causes 1.5 1.5 1.5
Diseases of heart 1.7 1.7 1.7
Malignant neoplasms 1.4 1.4 1.7
Accidents (unintentional injuries) 2 1.9 2.2
Chronic lower respiratory diseases 1.3 1 1.2
Cerebrovascular disease 1 1.1 1.1
Alzheimer's disease 0.9 0.8 0.7
Diabetes mellitus 1.4 1.7 1.3
Nephritis, nephrotic syndrome and nephrosis 1.6 2.1 1.7
Influenza and pneumonia 1.8 1.3 1.5
Septicemia 1.2 0.9 1.4
Chronic liver disease and cirrhosis 2.9 1.9 1.8
Intentional self-harm (suicide) 3.8 4 3.0
Parkinson's disease 3 2.6 2.4
Pneumonitis due to solids and liquids 1.9 1.6 1.7
Assault (homicide) 3.8 9.6 5.2
Male to Female Ratio
Table 5. Male-to-female age-ajusted mortality rate ratio Allegheny County,2014, 2015, and 2016
Cause of Death
Table 4. Median age (years) at death for county leading causes of death by sex: Allegheny County, 2015 and 2016
Cause of Death Total Male Female Total Male Female
All causes 80 76 84 80 75 83
Diseases of heart 84 79 86 83 78 87
Malignant neoplasms 74 73 76 74 73 76
Accidents (unintentional injuries) 54 49 67.5 50 47 55
Chronic lower respiratory diseases 80 78.5 81 80 80 81
Cerebrovascular disease 84 79 86 84 80 86
Alzheimer's disease 89 87 90 89 88 90
Diabetes mellitus 77 74 80 77 75 80
Nephritis, nephrotic syndrome and nephrosis 83 83 84 83 82.5 83
Septicemia 79 74 81 79 76 82
Influenza and pneumonia 86 84 87 84 83.5 85
Intentional self-harm (suicide) 51 50 53 47 47 48
Chronic liver disease and cirrhosis 60 57 61 63 63 62
Parkinson's disease 83 83 83 85.5 84 87
Pneumonitis due to solids and liquids 86 86 86 86 85 87
Assault (homicide) 26 25.5 27 27 27 27
20162015

2015 Allegheny County Mortality Report September 2018
13
0
200
400
600
800
1000
1200
1400
1600
1800
1970 1975 1980 1985 1990 1995 2000 2005 2010 2012 2013 2014 2015 2016Rat
e P
er 1
00
,00
0 S
tan
dar
d P
op
ula
tio
n
Figure 6. All-cause age-adjusted mortality rate by race: Allegheny County, 1970-2016
White Black
0 50 100 150 200 250 300
Assault (homicide)
Pneumonitis due to solids and liquids
Parkinson's disease
Intentional self-harm (suicide)
Chronic liver disease and cirrhosis
Septicemia
Influenza and pneumonia
Nephritis, nephrotic syndrome and nephrosis
Diabetes mellitus
Alzheimer's disease
Cerebrovascular disease
Chronic lower respiratory diseases
Accidents (unintentional injuries)
Malignant neoplasms
Diseases of heart
Figure 7. Age-adjusted mortality rates and confidence intervala by race for county leading causes of death: Allegheny County 2016
Black White*Error bars indicate 95% confidence intervals

2015 Allegheny County Mortality Report September 2018
14
Age-
Adjusted
Age-
Adjusted
Age-
Adjusted
Age-
Adjusted
Ratea Ratea Ratea Ratea
All causes 1,675 998.8 (950.9, 1046.6) 1,787 1073.6 (1023.8, 1123.4) 11,904 752.7 (739.1, 766.2) 11,770 750.8 (737.2, 764.4)
Diseases of heart 1 391 231.2 (208.3, 254.1) 1 429 256.4 (232.2, 280.7) 1 3,086 182.8 (176.3, 189.2) 1 2,925 173.7 (167.4, 180.0)
Malignant neoplasms 2 352 208.9 (187.0, 230.7) 2 343 202.9 (181.4, 224.4) 2 2,520 164.8 (158.4, 171.2) 2 2,498 162.7 (156.3, 169.1)
Accidents (unintentional injuries) 3 101 59.6 (48.0, 71.2) 3 130 83.3 (69.0, 97.6) 3 674 57.7 (53.3, 62.0) 3 852 76.6 (71.4, 81.7)
Chronic lower respiratory diseases 56 34.4 (25.4, 43.4) 73 43.3 (33.4, 53.3) 4 577 36.3 (33.3, 39.2) 4 618 38.3 (35.3, 41.3)
Cerebrovascular disease 4 81 49.3 (38.6, 60.1) 4 91 55.5 (44.1, 66.9) 5 545 32.1 (29.4, 34.8) 5 569 33.3 (30.6, 36.1)
Alzheimer's disease 46 27.8 (19.7, 35.8) 26 15.5 (9.6, 21.5) 452 24.0 (21.8, 26.2) 455 23.9 (21.7, 26.1)
Diabetes mellitus 59 37.7 (28.1, 47.3) 59 34.7 (25.8, 43.6) 271 17.5 (15.4, 19.5) 285 18.2 (16.1, 20.4)
Nephritis, nephrotic syndrome and nephrosis 52 31.5 (23.0, 40.1) 59 37.3 (27.8, 46.8) 288 14.4 (12.5, 16.2) 230 12.5 (10.8, 14.2)
Influenza and pneumonia 32 19.0 (12.4, 25.5) 19 12.5 (6.9, 18.1) 239 16.8 (14.9, 18.7) 210 13.5 (11.8, 15.2)
Septicemia 33 19.6 (12.9, 26.3) 26 15.2 (9.4, 21.0) 174 11.0 (9.3, 12.6) 167 10.6 (9.0, 12.2)
Chronic liver disease and cirrhosis 23 12.9 (7.6, 18.1) 25 13.1 (8.0, 18.3) 148 11.6 (9.7, 13.4) 159 11.4 (9.6, 13.2)
Intentional self-harm (suicide) 7 NA NA 19 12.1 (6.7, 17.6) 158 14.2 (12.0, 16.4) 150 14.2 (11.9, 16.5)
Parkinson's disease 2 NA NA 6 NA NA 125 7.8 (6.5, 9.2) 133 7.9 (6.5, 9.2)
Pneumonitis due to solids and liquids 14 9.0 (4.3, 13.6) 15 8.4 (4.2, 12.7) 113 6.3 (5.1, 7.4) 114 6.6 (5.4, 7.8)
Assault (homicide) 5 89 51.8 (41.1, 62.6) 5 80 46.4 (36.3, 56.6) 23 2.2 (1.3, 3.1) 23 2.4 (1.4, 3.3)
NA is censored due to low number of events
Table 6: Leading cause rank, number of total deaths, age-adjusted mortality rate, and 95% confidence intervals for leading causes of death by race: Allegheny County, 2015 and 2016
95%
Confidence
Interval
aRate is deaths per 100,000 standard population
95%
Confidence
Interval
Rank for
WhitesNumber
95%
Confidence
Interval
NumberCause of DeathRank for
BlacksNumber
95%
Confidence
Interval
NumberRank for
Blacks
Rank for
Whites
2016
Black White
201520162015
Cause of Death 2014 2015 2016
All Causes 1.4 1.3 1.4
Diseases of heart 1.3 1.3 1.5
Malignant neoplasms 1.3 1.3 1.2
Accidents (unintentional injuries) 0.7 1 1.1
Chronic lower respiratory diseases 1 0.9 1.1
Cerebrovascular disease 1.8 1.5 1.7
Alzheimer's disease 1.3 1.2 0.6
Diabetes mellitus 2.6 2.2 1.9
Nephritis, nephrotic syndrome and nephrosis 2 2.2 3.0
Influenza and pneumonia 1.3 1.1 0.9
Septicemia 2.1 1.8 1.4
Chronic liver disease and cirrhosis 0.8 1.1 1.2
Intentional self-harm (suicide) 0.4 0.3 0.9
Parkinson's disease 0.9 0.2 NA
Pneumonitis due to solids and liquids 0.9 1.4 1.3
Assault (homicide) 19.4 23.2 19.6
Black to White Ratio
NA not available due to low number of events
Table 7. Black to white age-ajusted mortality rate ratio: Allegheny County 2014-2016 Table 8. Median age (years) at death for county leading causes of death by race: Allegheny County, 2015 and 2016
Cause of Death White Black White Black
All causes 82 69 81 68
Diseases of heart 84.5 73 84 72
Malignant neoplasms 75 71 75 69
Accidents (unintentional injuries) 54 55 51 51
Chronic lower respiratory diseases 80 76 81 71
Cerebrovascular disease 84 75 85 73
Alzheimer's disease 89 87 89 89.5
Diabetes mellitus 78 71 78 69
Nephritis, nephrotic syndrome and nephrosis 84 76 84.5 78
Septicemia 81 72 81 69.5
Influenza and pneumonia 86 73 86 68
Intentional self-harm (suicide) 51 35 49 34
Chronic liver disease and cirrhosis 60 60 63 62
Parkinson's disease 83 80.5 86 83
Pneumonitis due to solids and liquids 87 78 86 79
Assault (homicide) 28 25 38 26.5
20162015

2015 Allegheny County Mortality Report September 2018
15
0
200
400
600
800
1000
1200
1400
1600
1800
2000
1970 1975 1980 1985 1990 1995 2000 2005 2010 2014 2015 2016
Rat
e P
er 1
00
,00
0 S
tan
dar
d P
op
ula
tio
n
Figure 8. All-cause age-adjusted mortality rate by sex and race: Allegheny County, 1970-2016
White Males White Females Black Males Black Females

2015 Allegheny County Mortality Report September 2018
16
Age-
Adjusted
Age-
Adjusted
Age-
Adjusted
Age-
Adjusted
Ratea Ratea Ratea Ratea
All Causes 828 1234.8 (1150.7, 1318.9) 947 1433.3 (1342.0, 1524.6) 5,695 906.8 (883.3, 930.4) 5,657 905.0 (881.4, 928.5)
Diseases of heart 1 189 290.5 (249.1, 332.0) 1 221 347.3 (301.5, 393.1) 1 1,554 237.9 (226.1, 249.7) 1 1,481 228.3 (216.7, 239.9)
Malignant neoplasms 2 148 229.0 (192.1, 265.9) 2 182 276.6 (236.4, 316.8) 2 1,300 201.3 (190.4, 212.3) 2 1,257 195.2 (184.4, 206.0)
Accidents (unintentional injuries) 5 59 79.3 (59.0, 99.5) 3 96 139.6 (111.7, 167.6) 3 401 76.9 (69.4, 84.5) 3 530 102.4 (93.7, 111.2)
Chronic lower respiratory diseases 23 35.4 (20.9, 49.9) 39 62.5 (42.9, 82.1) 4 234 36.5 (31.8 , 41.2) 4 265 41.8 (36.8, 46.9)
Cerebrovascular disease 4 38 61.5 (42.0, 81.1) 5 40 65.1 (44.9, 85.3) 5 218 33.8 (29.3, 38.3) 5 215 33.7 (29.2, 38.2)
Alzheimer's disease 13 24.9 (11.4, 38.5) 8 NA NA 129 20.1 (16.6, 23.6) 116 17.6 (14.4, 20.8)
Diabetes mellitus 31 47.6 (30.8, 64.3) 22 32.3 (18.8, 45.8) 139 22.4 (18.7, 26.1) 144 22.4 (18.7, 26.1)
Nephritis, nephrotic syndrome and
nephrosis25 41.4 (25.2, 57.6) 31 52.8 (34.2, 71.3) 140 22.3 (18.6, 26.0) 107 16.7 (13.5, 19.8)
Influenza and pneumonia 16 24.9 (12.7, 37.1) 7 NA NA 125 19.4 (16.0, 22.8) 120 18.5 (15.1, 21.8)
Septicemia 17 24.0 (12.6, 35.5) 15 23.8 (11.7, 35.8) 66 10.0 (7.6, 12.4) 77 12.3 (9.6 , 15.1)
Chronic liver disease and cirrhosis 11 14.8 (6.0, 23.5) 17 19.5 (10.2, 28.7) 91 15.8 (12.5, 19.0) 96 14.9 (12.0 , 17.9)
Intentional self-harm (suicide) 5 NA NA 15 22.1 (10.9, 33.2) 123 23.1 (19.0, 27.2) 106 20.8 (16.9 , 24.8)
Parkinson's disease 1 NA NA 4 NA NA 76 12.4 (9.6, 15.1) 75 12.2 (9.5 , 15.0)
Pneumonitis due to solids and liquids 5 NA NA 7 NA NA 55 8.2 (6.0, 10.4) 57 8.7 (6.4 , 10.9)
Assault (homicide) 3 82 101.5 (79.6, 123.5) 4 68 83.9 (64.0 , 103.9) 18 3.7 (2.0, 5.4) 17 3.8 (2.0 , 5.6)
2016
NA is censored due to low number of events
aRate is deaths per 100,000 standard population
Black Males
Table 10: Leading cause rank, number of total deaths, age-adjusted mortality rate, and 95% confidence intervals for county leading causes of death for males by race: Allegheny County, 2015 and 2016
95%
Confidence
Interval
Cause of DeathRank for
Black MalesNumber
95%
Confidence
Interval
NumberRank for
Black Males
White Males
201620152015
95%
Confidence
Interval
Rank for
White MalesNumber
95%
Confidence
Interval
NumberRank for
White Males
Age-
Adjusted
Age-
Adjusted
Age-
Adjusted
Age-
Adjusted
Ratea Ratea Ratea Ratea
All causes 847 827.7 (772.0, 883.5) 840 830.5 (774.4, 886.7) 6,209 630.9 (615.2, 646.5) 6,113 628.7 (612.9, 644.4)
Diseases of heart 2 202 191.9 (165.5, 218.4) 1 208 201.3 (173.9, 228.7) 1 1,532 142.8 (135.7, 150.0) 1 1,444 132.4 (125.6, 139.2)
Malignant neoplasms 1 204 199.1 (171.7, 226.4) 2 161 159.2 (134.6, 183.8) 2 1,220 139.1 (131.3, 146.9) 2 1,241 140.2 (132.4, 148.0)
Accidents (unintentional injuries) 4 42 43.9 (30.6, 57.1) 5 34 38.4 (25.5, 51.3) 273 38.6 (34.0, 43.2) 322 50.8 (45.2, 56.3)
Chronic lower respiratory diseases 5 33 33.7 (22.2, 45.2) 5 34 33.7 (22.4 , 45.0) 3 343 36.3 (32.4, 40.1) 4 353 36.3 (32.5, 40.0)
Cerebrovascular disease 3 43 41.3 (29.0, 53.6) 3 51 50.4 (36.6, 64.3) 4 327 30.5 (27.2, 33.8) 3 354 32.3 (29.0, 35.7)
Alzheimer's disease 5 33 29.2 (19.2, 39.2) 18 15.9 (8.6, 23.3) 5 323 25.8 (23.0, 28.7) 5 339 27.4 (24.5, 30.3)
Diabetes mellitus 28 30.3 (19.1, 41.5) 4 37 37.1 (25.1, 49.1) 132 13.7 (11.3, 16.0) 141 15.2 (12.7, 17.8)
Nephritis, nephrotic syndrome and nephrosis 27 26.7 (16.6, 36.7) 28 28.2 (17.8, 38.7) 99 9.5 (7.6, 11.4) 103 10.2 (8.2, 12.1)
Influenza and pneumonia 16 15.7 (8.0, 23.5) 12 14.5 (6.3, 22.7) 163 15.1 (12.8, 17.4) 110 10.6 (8.6, 12.5)
Septicemia 16 15.9 (8.1, 23.7) 11 10.3 (4.2, 16.4) 108 11.7 (9.5, 13.9) 90 9.3 (7.3, 11.2)
Chronic liver disease and cirrhosis 12 11.2 (4.9, 17.5) 8 NA NA 57 7.7 (5.7, 9.7) 63 8.5 (6.4, 10.6)
Intentional self-harm (suicide) 2 NA NA 4 NA NA 35 5.7 (3.8, 7.6) 44 7.8 (5.5, 10.1)
Parkinson's disease 1 NA NA 2 NA NA 49 4.9 (3.6, 6.3) 58 5.2 (3.8, 6.5)
Pneumonitis due to solids and liquids 9 NA NA 8 NA NA 58 5.2 (3.8, 6.5) 57 5.4 (4.0, 6.8)
Assault (homicide) 7 NA NA 12 12.9 (5.6, 20.2) 5 NA NA 6 NA NA
NA is censored due to low number of events
Table 9: Leading cause rank, number of total deaths, age-adjusted mortality rate, and 95% confidence intervals for county leading causes of death for Females by race: Allegheny County, 2015 and 2016
95%
Confidence
Interval
95%
Confidence
Interval
Rank for
White
Females
Number
95%
Confidence
Interval
NumberCause of Death
Rank for
Black
Females
Number
95%
Confidence
Interval
Number
aRate is deaths per 100,000 standard population
Rank for
Black
Females
Rank for
White
Females
Black Females White Females
2015 20162015 2016

2015 Allegheny County Mortality Report September 2018
17
Cause of Death 2014 2015 2016 2014 2015 2016
All causes 1.3 1.3 1.3 1.4 1.4 1.6
Diseases of heart 1.3 1.3 1.5 1.4 1.2 1.5
Malignant neoplasms 1.4 1.4 1.1 1.2 1.1 1.4
Accidents (unintentional injuries) 0.8 1.1 0.8 0.6 1.0 1.4
Chronic lower respiratory diseases 1 0.9 0.9 1.1 1.0 1.5
Cerebrovascular disease 1.8 1.4 1.6 1.8 1.8 1.9
Alzheimer's disease 0.9 1.1 0.6 1.9 1.2 NA
Diabetes mellitus 2.7 2.2 2.4 2.2 2.1 1.4
Nephritis, nephrotic syndrome and nephrosis 3.2 2.8 2.8 1 1.9 3.2
Influenza and pneumonia 1.1 1.0 1.4 1.4 1.3 NA
Septicemia 2 1.4 1.1 2.1 2.4 1.9
Chronic liver disease and cirrhosis 0.9 1.5 NA 0.7 0.9 1.3
Intentional self-harm (suicide) 0.4 NA NA 0.4 NA 1.1
Parkinson's disease 0.6 NA NA 1.1 NA NA
Pneumonitis due to solids and liquids 0.6 NA NA 1.1 NA NA
Assault (homicide) 13.2 NA NA 41.8 27.6 22.1
Black to White Females
NA not available due to low number of events
Black to White Males
Table 11. Black to white age-ajusted mortality rate ratio by sex: Allegheny County,2014-2016
Table 12. Median age (years) at death for county leading causes of death by race and sex: Allegheny County, 2015 and 2016
Black White Black White Black White Black White
All causes 74 85 72 84 65 77 65 76
Diseases of heart 78.5 87 75 87.5 69 81 69 80
Malignant neoplasms 71 76.5 69 77 70.5 73 69 74
Accidents (unintentional injuries) 55.5 75 52 56 53 48 50 47
Chronic lower respiratory diseases 80 81 68.5 81 72 79 73 80
Cerebrovascular disease 79 87 74 87 70 81.5 70.5 82
Alzheimer's disease 87 90 90 90 86 87 89.5 88
Diabetes mellitus 75.5 81 68 81 66 76 70 75
Nephritis, nephrotic syndrome and nephrosis 76 86 80 86 77 84 77 84
Septicemia 75.5 81.5 69 83.5 68 77.5 70 76
Influenza and pneumonia 75 87 58.5 87.5 71 84 70 84.5
Intentional self-harm (suicide) 44.5 53 37.5 51.5 35 50 34 48.5
Chronic liver disease and cirrhosis 60.5 62 59.5 62 58 57 62 63.5
Parkinson's disease 76 83 82 87.5 85 82.5 83 84
Pneumonitis due to solids and liquids 78 86.5 85.8 87 74 88 78 85
Assault (homicide) 25 55 25.5 47.5 25 28 27 38
Cause of Death 2015 2016 2015 2016
Females Males

2015 Allegheny County Mortality Report September 2018
18
0
5
10
15
20
25
1999 2000 2001 2002 2003 2004 2005 2006 2007 2008 2009 2010 2011 2012 2013 2014 2015 2016
Rat
e P
er 1
,00
0 L
ive
Bir
ths
Figure 9. Infant mortality rate by race and geography: Allegheny County and Pennsylvania, 1999-2016
Allegheny County White Allegheny County Black Pennsylvania White Pennsylvania Black
0
2
4
6
8
10
12
14
16
18
1999 2000 2001 2002 2003 2004 2005 2006 2007 2008 2009 2010 2011 2012 2013 2014 2015 2016Rat
e P
er 1
,00
0 L
ive
Bir
ths
of
Mo
ther
's R
acia
l Gro
up
Figure 10. Neonatal mortality rate by race and geography: Allegheny County and Pennsylvania, 1999-2016
Allegheny County White Allegheny County Black Pennsylvania White Pennsylvania Black

2015 Allegheny County Mortality Report September 2018
19
Year Total Number Total Rate White Number White Rate Black Number Black Rate
2016 58 4.4 23 2.5 26 10.2
2015 59 4.4 28 3 21 8.2
2014 48 3.6 13 1.4 19 7.4
2013 67 5 32 3.4 21 7.9
2012 59 4.5 27 2.9 18 6.9
2011 55 4.2 27 2.9 24 9.2
2010 65 5 40 4.3 22 8.4
2009 64 4.9 25 2.6 36 13.2
2008 79 6 46 4.8 30 10.8
2007 69 5.2 32 3.3 33 11.7
2006 62 4.9 23 2.4 37 13.9
2005 76 5.8 39 4 35 13.6
2004 76 5.8 40 4.1 34 12.8
2003 99 7.3 57 5.5 42 16.6
2002 83 6.2 40 3.9 40 15.4
2001 78 5.6 41 3.9 32 12.2
2000 91 6.4 47 4.3 44 16
1999 91 6.3 49 4.4 39 14.2
1998 67 4.7 41 3.6 25 9.3
1997 76 5.2 34 3 42 15.1
1996 79 5.3 45 3.9 34 12
1995 103 6.6 62 5.1 41 13.9
1994 91 5.6 51 4 38 12
1993 118 7.1 60 4.7 54 15.8
1992 116 6.6 56 4.1 58 16
1991 112 6.4 56 4.1 55 15.5
1990 117 6.5 58 4 57 16.6
Neonatal death is defined as a death that occurs between 0 and 27 days after birth
Per 1,000 live births of mother's racial group. See Technical Notes for calculation
Table 13. Neonatal mortality number and rate by race: Allegheny County, 1990-2016
Per 1,000 live births. See Technical Notes for calculation
2015 Allegheny County Mortality Report September 2018
20
0
2
4
6
8
10
12
1999 2000 2001 2002 2003 2004 2005 2006 2007 2008 2009 2010 2011 2012 2013 2014 2015 2016
Rat
e P
er 1
,00
0 L
ive
Bir
ths
of
Mo
ther
's R
acia
l Gro
up
Figure 11. Post-neonatal mortality rate by race and geography: Allegheny County and Pennsylvania, 1999-2016
Allegheny County White Allegheny County Black Pennsylvania White Pennsylvania Black
2015 Allegheny County Mortality Report September 2018
21
Year Total Number Total Rate2 White Number White Rate3 Black Number Black Rate3
2016 20 1.5 7 0.8 12 4.7
2015 24 1.8 10 1.1 11 4.3
2014 27 2 13 1.4 11 4.3
2013 21 1.6 9 1 11 4.1
2012 18 1.4 8 0.9 9 3.4
2011 25 1.9 8 0.8 11 4.2
2010 32 2.5 14 1.4 16 6.1
2009 29 2.2 11 1.2 28 10.3
2008 28 2.1 14 1.5 14 5
2007 27 2 10 1 17 6
2006 29 2.3 14 1.5 15 5.7
2005 21 1.6 12 1.2 9 3.5
2004 21 1.6 10 1 11 4.1
2003 21 1.5 9 0.9 12 4.7
2002 16 1.2 6 0.6 8 3.1
2001 23 1.7 9 0.8 14 5.6
2000 29 2 15 1.4 13 4.7
1999 26 1.8 14 1.2 12 4.4
1998 34 2.4 17 1.5 17 6.3
1997 26 1.8 15 1.3 11 3.9
1996 38 2.6 18 1.5 20 7
1995 34 2.2 17 1.4 17 5.8
1994 39 2.4 18 1.4 21 6.6
1993 43 2.6 19 1.5 23 6.7
1992 55 3.1 25 1.8 29 8
1991 56 3.2 35 2.6 21 5.9
1990 51 2.8 25 1.7 24 71Post-neonatal death is defined as a death that occurs between 28 and 364 days after birth
Table 14. Post-neonatal1 mortality number and rate by race: Allegheny County, 1990-2016
2Per 1,000 live births. See Technical Notes for calculation3Per 1,000 live births of mother's racial group. See Technical Notes for calculation

2015 Allegheny County Mortality Report September 2018
22
TECHNICAL NOTES
A. SOURCES OF DATA
DEATH RECORDS The registration of death records is the responsibility of the Pennsylvania Department of Health.
Birth record information is shared with the Allegheny County Health Department through a
cooperative agreement which requires the following disclaimer: “These data were supplied by the
State Health Data Center, Pennsylvania Department of health, Harrisburg, Pennsylvania. The
Pennsylvania Department of Health specifically disclaims responsibility for any analyses,
interpretations or conclusions.”
The latest revision of the U.S. Standard Certificate of Death was implemented by Pennsylvania in
2006. These revisions were based upon changes made by the Centers for Disease Control and
Prevention, and consisted of three new data items added to the certificate. These three questions
pertained to tobacco use contributing to death, pregnancy at the time of death, and type of
transportation injury death if a transportation-related injury death occurred.
Beginning in 2013, race was derived from multiple race selections, when previously it was derived
from a single race designation field. From 2013, “multirace” was a new race designation assigned to
people who chose more than one race out of the possible selections. When only one race was
selected, the individual would be designated as that race only.
POPULATION DATA Population estimates for the state and county were provided by the Division of Health Informatics,
Pennsylvania Department of Health. These data were used to compute standard population rates, and
were produced jointly by the United States Bureau of the census and the Pennsylvania State Data
Center of the Pennsylvania State University at Harrisburg under the Federal-State Cooperative
Program for Local Population Estimates.
B. DEFINITIONS OF TERMS
CAUSE OF DEATH: Cause of death is determined to be the most proximal or causal condition or action resulting in an individual’s death. The International Classification of Disease, Tenth Revision (ICD-10) acts as a means of categorizing such causes using an alpha-numeric system, which is set forth by the World Health Organization. INFANT DEATH: The death of a child within the first year of life.
NEONATAL DEATH: The death of a child within the first 28 days of life.
POST-NEONATAL DEATH: The death of a child between 28 and 364 days of life.

2015 Allegheny County Mortality Report September 2018
23
MEDIAN AGE: The age that falls exactly in the middle of the entire range of ages ranked in order from
low to high such that 50% of the ages fall above it and 50% fall below it.
RACE: Mortality counts for all races besides White and Black were too small to be considered
statistically reliable, and therefore only data for these two races are presented in this report.
STATISTICALLY SIGNIFICANT: The use of confidence intervals to determine significance without
additional statistical testing may underestimate the number of significant changes in rates detected.
LEADING CAUSES OF DEATH: Leading causes of death are defined using the Centers for Disease
Control and Prevention/ National Center for Health Statistics Instruction Manual Part 9, “ICD-10
Cause-of-Death Lists for Tabulating Mortality Statistics”, Table B.
C. FORMULAS
Formulas were used to calculate several rates in this report allowing for comparable examination across
populations of different sizes.
Infant Mortality Rate =
Race-Specific Infant Mortality Rate =
Neonatal Mortality Rate =
Post-Neonatal Mortality Rate =
Crude Death Rate =
Age-Specific Mortality Rate =
Race-Specific Mortality Rate =
Number of deaths under 1 year of age Number of live births
X 1,000
Number of infant deaths of a specific race Number of live births of a specific race
X 1,000
Number of infant deaths under 28 days of age Number of live births
X 1,000
Number of infant deaths 28 to 364 days Number of live births
X 1,000
Number of total deaths Total Population
X 1,000
Number of deaths in a specific age group Population in a specific age group
X 1,000
Number of deaths of a specific race Population of a specific race
X 1,000

2015 Allegheny County Mortality Report September 2018
24
Cause-Specific Mortality Rate =
Age-Adjusted Mortality Rate =
Sum of (age specific mortality rates per 100,000 for
selected population x standard population in corresponding age groups)
Sum of standard population
Standard Error= Age−adjusted rate
√Number of deaths
95% Confidence Interval= Age − adjusted rate ± (1.96 × standard error)
All age-adjusted rates found within this report are adjusted by the direct method using the 2000 U.S.
Standard Million Population. The 2000 U.S. standard million population and age distributions used in
calculating age-adjusted mortality rates are as follows:
All Ages……………………..… 1,000,000 Under 1……………………….…… 13,818 1-4…………………………….………55,317 5-14………………………….……..145,565 15-24………………………………138,646 25-34………………………………135,573 35-44………………………………162,613 45-54………………………………134,834 55-64…………………………………87,247 65-74…………………………………66,037 75-84…………………………………44,842 85+…………………………………….15,508
Number of deaths from a specific cause Total population X 1,000