allegheny county, pennsylvania - rampp … · allegheny county, pennsylvania (all jurisdictions)...
TRANSCRIPT

ALLEGHENY COUNTY, PENNSYLVANIA (ALL JURISDICTIONS)
COMMUNITY COMMUNITY
NAME NUMBER ALEPPO, TOWNSHIP OF 421266
ASPINWALL, BOROUGH OF 420005
AVALON, BOROUGH OF 420006
BALDWIN, BOROUGH OF 420007
BALDWIN, TOWNSHIP OF 422650
BELL ACRES, BOROUGH OF 420008
BELLEVUE, BOROUGH OF 420009
BEN AVON, BOROUGH OF 420010
*BEN AVON HEIGHTS, BOROUGH OF 420011
BETHEL PARK, MUNICIPALITY OF 420012
BLAWNOX, BOROUGH OF 420013
BRACKENRIDGE, BOROUGH OF 420014
BRADDOCK, BOROUGH OF 420015
*BRADDOCK HILLS, BOROUGH OF 420016
BRADFORD WOODS, BOROUGH OF 421262
BRENTWOOD, BOROUGH OF 420017
BRIDGEVILLE, BOROUGH OF 420018
CARNEGIE, BOROUGH OF 420019
CASTLE SHANNON, BOROUGH OF 420020
*CHALFANT, BOROUGH OF 420021
CHESWICK, BOROUGH OF 420022
CHURCHILL, BOROUGH OF 420023
CLAIRTON, CITY OF 420024
COLLIER, TOWNSHIP OF 421058
CORAOPOLIS, BOROUGH OF 420025
CRAFTON, BOROUGH OF 420026
CRESCENT, TOWNSHIP OF 421060
*DORMONT, BOROUGH OF 422630
DRAVOSBURG, BOROUGH OF 420027
DUQUESNE, CITY OF 420028
EAST DEER, TOWNSHIP OF 421061
*No special flood hazard areas identified
COMMUNITY COMMUNITY
NAME NUMBER
*EAST McKEESPORT, BOROUGH OF 420029
EAST PITTSBURGH, BOROUGH OF 422662
*EDGEWOOD, BOROUGH OF 422663
EDGEWORTH, BOROUGH OF 420032
ELIZABETH, BOROUGH OF 421263
ELIZABETH, TOWNSHIP OF 420033
EMSWORTH, BOROUGH OF 420034
ETNA, BOROUGH OF 421062
FAWN, TOWNSHIP OF 421285
FINDLAY, TOWNSHIP OF 421286
*FOREST HILLS, BOROUGH OF 420035
FORWARD, TOWNSHIP OF 421064
FOX CHAPEL, BOROUGH OF 420036
FRANKLIN PARK, BOROUGH OF 420037
FRAZER, TOWNSHIP OF 421288
GLASSPORT, BOROUGH OF 420038
GLEN OSBORNE, BOROUGH OF 420061
GLENFIELD, BOROUGH OF 420039
GREEN TREE, BOROUGH OF 420040
HAMPTON, TOWNSHIP OF 420978
HARMAR, TOWNSHIP OF 421068
HARRISON, TOWNSHIP OF 420041
HAYSVILLE, BOROUGH OF 420042
HEIDELBURG, BOROUGH OF 420043
HOMESTEAD, BOROUGH OF 420044
INDIANA, TOWNSHIP OF 421070
*INGRAM, BOROUGH OF 420045
JEFFERSON HILLS, BOROUGH OF 420046
KENNEDY, TOWNSHIP OF 421072
KILBUCK, TOWNSHIP OF 421073
LEET, TOWNSHIP OF 421075
LEETSDALE, BOROUGH OF 420047
LIBERTY, BOROUGH OF 420048
COMMUNITY COMMUNITY
NAME NUMBER LINCOLN, BOROUGH OF 420049
MARSHALL, TOWNSHIP OF 421080
MCCANDLESS, TOWN OF 421081
MCDONALD, BOROUGH OF 420855
MCKEESPORT, CITY OF 420051
MCKEES ROCKS, BOROUGH OF 420052
MILLVALE, BOROUGH OF 420053
MONROEVILLE, MUNICIPALITY OF 420054
MOON, TOWNSHIP OF 421082
*MOUNT OLIVER, BOROUGH OF 420055
MT. LEBANON, MUNICIPALITY OF 421272
MUNHALL, BOROUGH OF 420056
NEVILLE, TOWNSHIP OF 425385
NORTH BRADDOCK, BOROUGH OF 420058
NORTH FAYETTE, TOWNSHIP OF 421085
NORTH VERSAILLES, TOWNSHIP OF 421231
OAKDALE, BOROUGH OF 420059
OAKMONT, BOROUGH OF 420060
O’HARA, TOWNSHIP OF 421088
OHIO, TOWNSHIP OF 421089
PENN HILLS, MUNICIPALITY OF 421092
*PENNSBURY VILLAGE, BOROUGH OF 422665
PINE, TOWNSHIP OF 421094
PITCAIRN, BOROUGH OF 420062
PITTSBURGH, CITY OF 420063
PLEASANT HILLS, BOROUGH OF 420064
PLUM, BOROUGH OF 420065
PORT VUE, BOROUGH OF 420066
RANKIN, BOROUGH OF 420067
RESERVE, TOWNSHIP OF 420068
RICHLAND, TOWNSHIP OF 421199
ROBINSON, TOWNSHIP OF 421097
ROSS, TOWNSHIP OF 420979
COMMUNITY COMMUNITY
NAME NUMBER ROSSLYN FARMS, BOROUGH OF 420069
SCOTT, TOWNSHIP OF 421100
SEWICKLEY, BOROUGH OF 420070
SEWICKLEY HEIGHTS, BOROUGH OF 420071
SEWICKLEY HILLS, BOROUGH OF 420072
SHALER, TOWNSHIP OF 421101
SHARPSBURG, BOROUGH OF 420073
SOUTH FAYETTE, TOWNSHIP OF 421106
SOUTH PARK, TOWNSHIP OF 421165
SOUTH VERSAILLES, TOWNSHIP OF 421281
SPRINGDALE, BOROUGH OF 421282
SPRINGDALE, TOWNSHIP OF 420074
STOWE, TOWNSHIP OF 421110
SWISSVALE, BOROUGH OF 420075
TARENTUM, BOROUGH OF 420076
THORNBURG, BOROUGH OF 420077
TRAFFORD, BOROUGH OF 420903
TURTLE CREEK, BOROUGH OF 420079
UPPER ST. CLAIR, TOWNSHIP OF 421119
VERONA, BOROUGH OF 422611
VERSAILLES, BOROUGH OF 420081
WALL, BOROUGH OF 420082
WEST DEER, TOWNSHIP OF 421299
WEST ELIZABETH, BOROUGH OF 420083
WEST HOMESTEAD, BOROUGH OF 420084
WEST MIFFLIN, BOROUGH OF 420085
*WEST VIEW, BOROUGH OF 420086
WHITEHALL, BOROUGH OF 420088
WHITAKER, BOROUGH OF 420087
WHITE OAK, BOROUGH OF 420089
WILKINS, TOWNSHIP OF 420090
*WILKINSBURG, BOROUGH OF 422667
WILMERDING, BOROUGH OF 420091
REVISED:
Federal Emergency Management Agency
FLOOD INSURANCE STUDY NUMBER
42003CV001B
VOLUME 1 OF 6
NOTICE TO FLOOD INSURANCE STUDY USERS
Communities participating in the National Flood Insurance Program have established repositories of flood hazard data for floodplain management and flood insurance purposes. This Flood Insurance Study (FIS) may not contain all data available within the repository. It is advisable to contact the community repository for any additional data. Part or all of this FIS may be revised and republished at any time. In addition, part of this FIS may be revised by the Letter of Map Revision process, which does not involve republication or redistribution of the FIS. It is, therefore, the responsibility of the user to consult with community officials and to check the community repository to obtain the most current FIS components.
Initial Countywide FIS Effective Date: October 4, 1995
Revised Countywide FIS Dates: August 5, 1997
March 16, 1998
July 5, 2000
September 21, 2001
May 15, 2003

i
TABLE OF CONTENTS – Volume 1
Page
1.0 INTRODUCTION 1
1.1 Purpose of Study 1
1.2 Authority and Acknowledgments 2
1.3 Coordination 19
2.0 AREA STUDIED 22
2.1 Scope of Study 22
2.2 Community Description 26
2.3 Principal Flood Problems 27
2.4 Flood Protection Measures 42
3.0 ENGINEERING METHODS 46
3.1 Hydrologic Analyses 46
3.2 Hydraulic Analyses 72
3.3 Vertical Datum 85
4.0 FLOODPLAIN MANAGEMENT APPLICATIONS 86
4.1 Floodplain Boundaries 86
4.2 Floodways 86
5.0 INSURANCE APPLICATIONS 89
6.0 FLOOD INSURANCE RATE MAP 89
7.0 OTHER STUDIES 90
8.0 LOCATION OF DATA 90
9.0 BIBLIOGRAPHY AND REFERENCES 102

ii
TABLE OF CONTENTS- Volume 1- continued
Page
TABLES
Table 1 Initial and Final CCO Dates 19-21
Table 2 Detailed Studied Streams 22-23
Table 3 Scope of Study 25
Table 4 Incorporated Letters of Map Revision 26
Table 5 Flood Control Dams and Reservoirs 42
Table 6 Summary of Discharges 53-72
Table 7 Manning’s “n” Values 82-84
Table 9 Community Map History 91-101
FIGURES
Figure 1 - Floodway Schematic 88
Table of Contents - Volume 2
TABLES
Table 8 Floodway Data 1-94

iii
Table of Contents - Volume 3 EXHIBITS Exhibit 1 - Flood Profiles Abers Creek Panels 01P-05P Allegheny River Panels 06P-17P Allegheny River (Herrs Island Back Channel) Panel 18P Allegheny River (Twelve Mile Island Back Channel) Panel 19P Allegheny River (Fourteen Mile Island Back Channel) Panel 20P Bear Run Panels 21P-22P Becks Run Panels 23P-24P Big Sewickley Creek Panels 25P-33P Boston Hollow Run Panels 34P-46P Boyds Hollow Run Panels 37P-38P Breakneck Creek Panel 39P Brush Creek 1 Panel 40P Brush Creek 2 Panels 41P-42P Bull Creek Panels 43P-46P Campbells Run Panels 47P-56P Chalfant Run Panels 57P-58P Chartiers Creek Panels 59P-67P Chartiers Creek-Diversion Channel Panels 68P-70P Crooked Run Panels 71P-72P Crouse Run Panels 73P-74P Crouse Run Tributary Panel 75P Deer Creek Panels 76P-77P Dirty Camp Run Panels 78P-81P Douglass Run Panels 82P-88P Douglass Run Tributary No. 1 Panels 89P-91P Douglass Run Tributary No. 2 Panel 92P East Thompson Run Panels 93P-94P Table of Contents - Volume 4
EXHIBITS - continued
Exhibit 1 - Flood Profiles - continued Fallen Timber Run Panels 95P-96P Georges Run Panels 97P-101P Gillespie Run Panels 102P-106P Girty’s Run Panels 107P-114P Gourdhead Run Panels 115P-118P Graesers Run Panels 119P-120P Happy Hollow Run Panels 121P-123P Harts Run Panels 124P-127P Hoffman Run Panels 128P-129P Humms Run Panels 130P-133P Jacks Run Panels 134P-136P Leak Run Panels 137P-139P Lewis Run Panels 140P-142P

iv
Table of Contents - Volume 4 - continued
EXHIBITS - continued Exhibit 1 -Flood Profiles - continued Lick Run Panels 143P-147P Little Bull Creek Panels 148P-150P Little Deer Creek Panels 151P-153P Little Pine Creek East Panels 154P-157P Little Pine Creek West Panels 158P-164P Little Plum Creek Panels 165P-166P Lobbs Run Panels 167P-168P Long Run Panels 169P-172P Lowries Run Panels 173P-178P McCaslin Run Panel 179P McClarens Run Panels 180P-181P McLaughlin Run Panels 182P-186P Table of Contents - Volume 5
EXHIBITS - continued
Exhibit 1 - Flood Profiles - continued Millers Run Panels 187P-189P Monongahela River Panels 190P-197P Montour Run Panels 198P-206P Montour Run No. 1 Panels 207P-208P Moon Run Panels 209P-211P North Branch Robinson Run Panels 212P-213P North Fork Montour Run Panels 214P-215P Ohio River Panels 216P-222P Ohio River Back Channel Panels 223P-225P Painters Run Panel 226P Peters Creek Panels 227P-229P Pidgeon Hollow Run Panels 230P-231P Piersons Run Panel 232P Pine Creek Panels 233P-247P Piney Fork Panels 248P-249P Pitt Street Tributary Panel 250P Plum Creek Panels 251P-257P Pucketa Creek Panels 258P-261P Robinson Run Panels 262P-269P Rochester Run Panel 270P Sandy Creek Panels 271P-273P Saw Mill Run Panels 274P-279P

v
Table of Contents - Volume 6
EXHIBITS - continued
Exhibit 1 -Flood Profiles - continued Sawmill Run Panels 280P-282P Scrubgrass Run Panels 283P-289P South Fork Montour Run Panel 290P Spring Garden Run Panels 291P-296P Squaw Run Panels 297P-303P Squaw Run Tributary No. 1 Panel 304P Squaw Run Tributary No. 2 Panel 309P Squaw Run Tributary No. 4 Panels 306P-307P Streets Run Panels 308P-311P Thompson Run Panels 312P-316P Tributary 1 to Piney Fork Panels 317P-319P Tributary A Panels 320P-321P Tributary to Bull Creek Panels 322P-326P Turtle Creek Panels 327P-332P Unnamed Stream Along Moss Side Boulevard Panel 333P West Branch Deer Creek Panel 334P Whiskey Run Panels 335P-337P Whittmer Run Panel 338P Wildcat Run Panels 339P-345P Wylie Run Panels 346P-356P Youghiogheny River Panels 357P-360P
Exhibit 2 - Flood Insurance Rate Map Index Flood Insurance Rate Map

1
FLOOD INSURANCE STUDY ALLEGHENY COUNTY ALL JURISDICTIONS
1.0 INTRODUCTION
1.1 Purpose of Study
This Flood Insurance Study (FIS) revises and updates information on the
existence and severity of flood hazards in the geographic area of Allegheny
County, including the Cities of Clairton, Duquesne, McKeesport, and Pittsburgh.;
the Boroughs of Aspinwall, Avalon, Baldwin, Bell Acres, Bellevue, Ben Avon,
Ben Avon Heights, Blawnox, Brackenridge, Braddock, Braddock Hills, Bradford
Woods, Brentwood, Bridgeville, Carnegie, Castle Shannon, Chalfant, Cheswick,
Churchill, Coraopolis, Crafton, Dormont, Dravosburg, East McKeesport, East
Pittsburgh, Edgewood, Edgeworth, Elizabeth, Emsworth, Etna, Forest Hills, Fox
Chapel, Franklin Park, Glassport, Glen Osborne, Glenfield, Green Tree,
Haysville, Heidelberg, Homestead, Ingram, Jefferson Hills, Leetsdale, Liberty,
Lincoln, McDonald, McKees Rocks, Millvale, Mount Oliver, Munhall, North
Braddock, Oakdale, Oakmont, Pennsbury Village, Pitcairn, Pleasant Hills, Plum,
Port Vue, Rankin, Rosslyn Farms, Sewickley, Sewickley Heights, Sewickley
Hills, Sharpsburg, Springdale, Swissvale, Tarentum, Thornburg, Trafford, Turtle
Creek, Verona, Versailles, Wall, West Elizabeth, West Homestead, West Mifflin,
West View, Whitaker, White Oak, Whitehall, Wilkensburg, and Wilmerding; the
Municipalities of Bethel Park, Monroeville, Mt. Lebanon, and Penn Hills; and the
Townships of Aleppo, Baldwin, Collier, Crescent, East Deer, Elizabeth, Fawn,
Findlay, Forward, Frazer, Hampton, Harmar, Harrison, Indiana, Kennedy,
Kilbuck, Leet, Marshall, McCandless, Moon, Neville, North Fayette, North
Versailles, O’Hara, Ohio, Pine, Reserve, Richland, Robinson, Ross, Scott, Shaler,
South Fayette, South Park, South Versailles, Springdale, Stowe, Upper St. Clair,
West Deer, and Wilkins (referred to collectively herein as Allegheny County),
and aids in the administration of the National Flood Insurance Act of 1968 and
the Flood Disaster Protection Act of 1973. This study has developed flood-risk
data for various areas of the community that will be used to establish actuarial
flood insurance rates and to assist the community in its efforts to promote sound
floodplain management. Minimum floodplain management requirements for
participation in the National Flood Insurance Program (NFIP) are set forth in the
Code of Federal Regulations at 44 CFR, 60.3.
Please note that the Borough of McDonald is geographically located in
Allegheny, and Washington Counties. The Borough of McDonald is included in
its entirety in this FIS report. Please note that the Borough of Trafford is located
in Allegheny and Westmoreland Counties. Only the portion of Borough of
Trafford located in Allegheny County is included in this FIS. See the separately
published FIS reports and Flood Insurance Rate Maps (FIRMs) for countywide
map dates and flood hazard information outside of Allegheny County.

2
Please note that on the effective date of this study, the Boroughs of Ben Avon
Heights, Braddock Hills, Chalfant, Dormont, East McKeesport, Edgewood,
Forest Hills, Ingram, Mount Oliver, Pennsburry Village, West View, and
Wilkinsburg have no mapped Special Flood Hazard Areas (SFHAs). This does
not preclude future determinations of SFHAs that could be necessitated by
changed conditions affecting the community (i.e. annexation of new lands) or the
availability of new scientific or technical data about flood hazards.
In some States or communities, floodplain management criteria or regulations
may exist that are more restrictive or comprehensive than the minimum Federal
requirements. In such cases, the more restrictive criteria take precedence and the
State (or other jurisdictional agency) will be able to explain them.
1.2 Authority and Acknowledgments
The sources of authority for this FIS are the National Flood Insurance Act of
1968 and the Flood Disaster Protection Act of 1973.
The original October 4, 1995, countywide FIS was prepared to include all
jurisdictions within Allegheny County into a countywide format FIS.
Information on the authority and acknowledgments for each jurisdiction with a
previously printed FIS report included in this countywide FIS is shown below.
Aspinwall, Borough of: The hydrologic and hydraulic analyses for
the FIS report dated June 1979 were
prepared by the U.S. Army Corps of
Engineers (USACE), Pittsburgh District, for
the Federal Insurance Administration (FIA),
under Inter-Agency Agreement No. IAA-H-
7-76, Project Order No. 25 and No. IAA-H-
10-77, Project Order No. 4. That work was
completed in June 1978.
Baldwin, Borough of: The hydrologic and hydraulic analyses for
the Monongahela River in the FIS report
dated February 1978 were prepared by the
USACE, Pittsburgh District. The hydraulic
and hydrologic analyses for the remainder
of the study were prepared by Michael
Baker, Jr., Inc., for the FIA, under Contract
No. H-3812. That work was completed in
February 1977.
Bell Acres, Borough of: The hydrologic and hydraulic analyses for
the FIS report dated November 1, 1984,
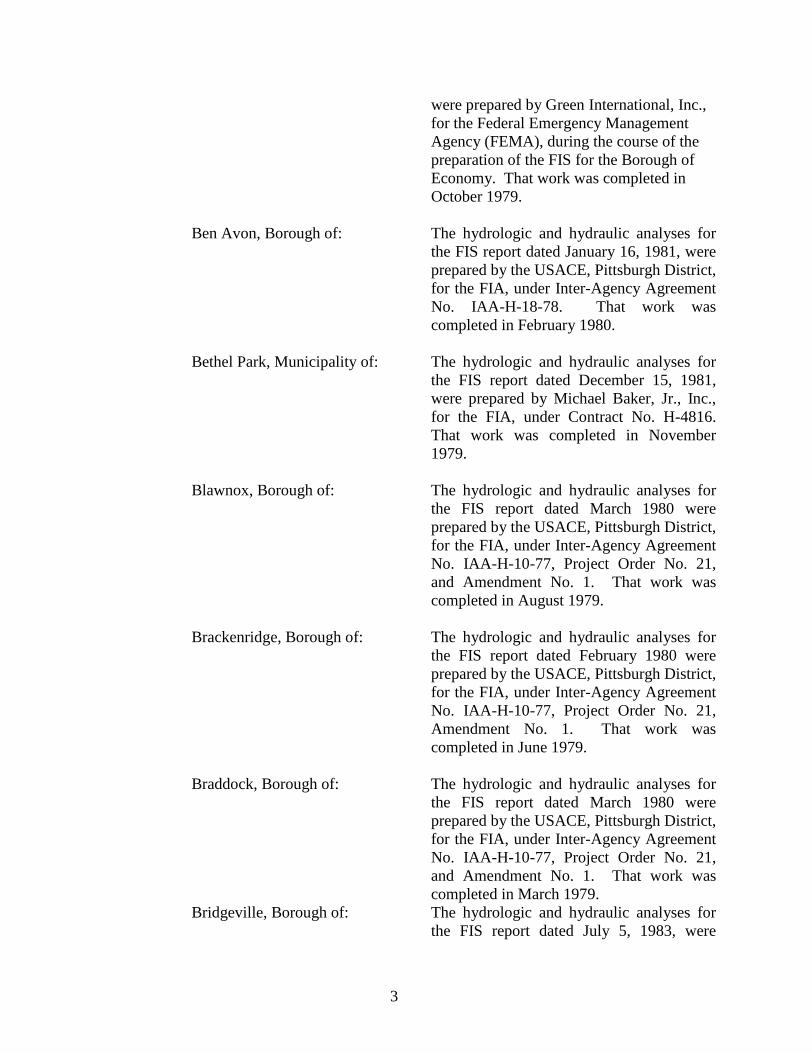
3
were prepared by Green International, Inc.,
for the Federal Emergency Management
Agency (FEMA), during the course of the
preparation of the FIS for the Borough of
Economy. That work was completed in
October 1979.
Ben Avon, Borough of: The hydrologic and hydraulic analyses for
the FIS report dated January 16, 1981, were
prepared by the USACE, Pittsburgh District,
for the FIA, under Inter-Agency Agreement
No. IAA-H-18-78. That work was
completed in February 1980.
Bethel Park, Municipality of: The hydrologic and hydraulic analyses for
the FIS report dated December 15, 1981,
were prepared by Michael Baker, Jr., Inc.,
for the FIA, under Contract No. H-4816.
That work was completed in November
1979.
Blawnox, Borough of: The hydrologic and hydraulic analyses for
the FIS report dated March 1980 were
prepared by the USACE, Pittsburgh District,
for the FIA, under Inter-Agency Agreement
No. IAA-H-10-77, Project Order No. 21,
and Amendment No. 1. That work was
completed in August 1979.
Brackenridge, Borough of: The hydrologic and hydraulic analyses for
the FIS report dated February 1980 were
prepared by the USACE, Pittsburgh District,
for the FIA, under Inter-Agency Agreement
No. IAA-H-10-77, Project Order No. 21,
Amendment No. 1. That work was
completed in June 1979.
Braddock, Borough of: The hydrologic and hydraulic analyses for
the FIS report dated March 1980 were
prepared by the USACE, Pittsburgh District,
for the FIA, under Inter-Agency Agreement
No. IAA-H-10-77, Project Order No. 21,
and Amendment No. 1. That work was
completed in March 1979.
Bridgeville, Borough of: The hydrologic and hydraulic analyses for
the FIS report dated July 5, 1983, were

4
prepared by the USACE, Pittsburgh District,
for FEMA, under Inter-Agency Agreement
No. IAA-H-9-79, Project Order No. 40.
That work was completed in March 1982.
Carnegie, Borough of: The hydrologic and hydraulic analyses for
the FIS report dated November 1977 were
prepared by Michael Baker, Jr., Inc., for the
FIA, under Contract No. H-3812. That
work was completed in February 1977.
Cheswick, Borough of: The hydrologic and hydraulic analyses for
the FIS report dated December 1979 were
prepared by the USACE, Pittsburgh District,
for the FIA, under Inter-Agency Agreement
No. IAA-H-10-77, Project Order No. 21,
and Amendment No. 1. That work was
completed in June 1979.
Clairton, City of: The hydrologic and hydraulic analyses for
the FIS report dated April 1979 were
prepared by Michael Baker, Jr., Inc., for the
FIA, under Contract No. H-4553. That
work was completed in June 1978.
Collier, Township of: The hydrologic and hydraulic analyses for
the FIS report dated September 15, 1981,
were prepared by GAI Consultants, Inc., for
FEMA, under Contract No. H-4762. That
work was completed in February 1980.
Coraopolis, Borough of: The hydrologic and hydraulic analyses for
the FIS report dated December 1978 were
prepared by Michael Baker, Jr., Inc., for the
FIA, under Contract No. H-3812. That
work was completed in November 1977.
The hydraulic and hydrologic analyses for
the Ohio River were prepared by the
USACE.
Crescent, Township of: The hydrologic and hydraulic analyses for
the FIS report dated January 16, 1981, were
prepared by the USACE, Pittsburgh District,
for the FIA, under Inter-Agency Agreement
No. IAA-H-18-78, Project Order No. 29.
That work was completed in February 1980.
5
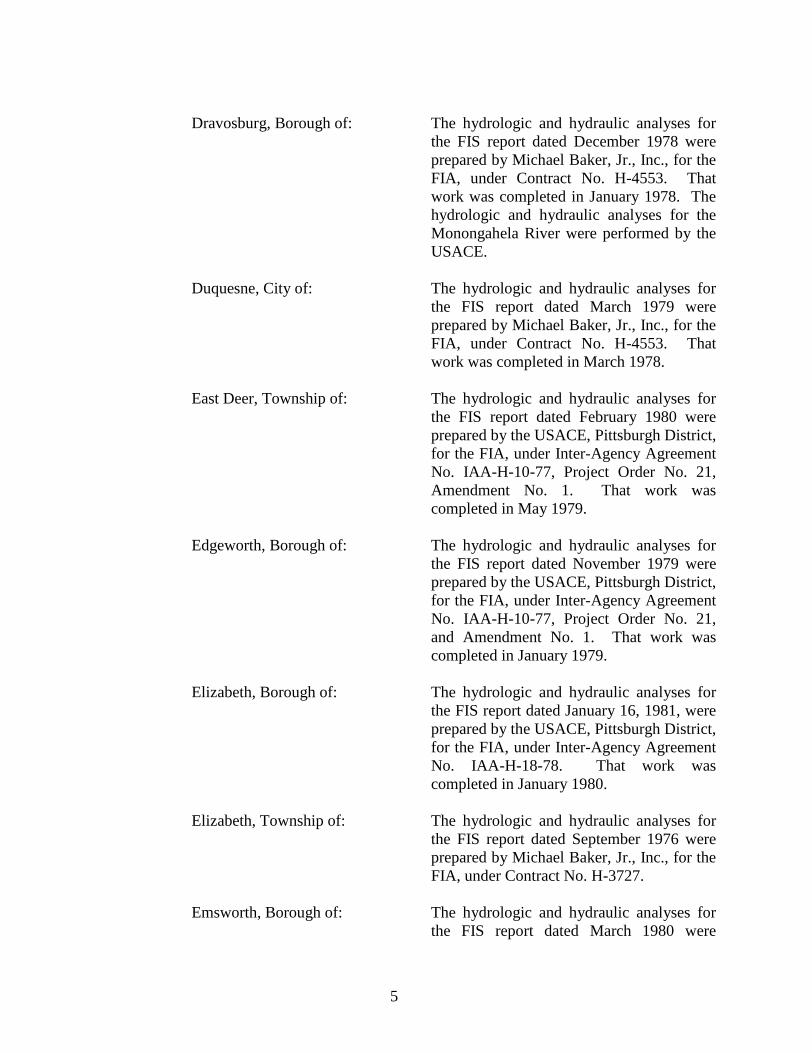
Dravosburg, Borough of: The hydrologic and hydraulic analyses for
the FIS report dated December 1978 were
prepared by Michael Baker, Jr., Inc., for the
FIA, under Contract No. H-4553. That
work was completed in January 1978. The
hydrologic and hydraulic analyses for the
Monongahela River were performed by the
USACE.
Duquesne, City of: The hydrologic and hydraulic analyses for
the FIS report dated March 1979 were
prepared by Michael Baker, Jr., Inc., for the
FIA, under Contract No. H-4553. That
work was completed in March 1978.
East Deer, Township of: The hydrologic and hydraulic analyses for
the FIS report dated February 1980 were
prepared by the USACE, Pittsburgh District,
for the FIA, under Inter-Agency Agreement
No. IAA-H-10-77, Project Order No. 21,
Amendment No. 1. That work was
completed in May 1979.
Edgeworth, Borough of: The hydrologic and hydraulic analyses for
the FIS report dated November 1979 were
prepared by the USACE, Pittsburgh District,
for the FIA, under Inter-Agency Agreement
No. IAA-H-10-77, Project Order No. 21,
and Amendment No. 1. That work was
completed in January 1979.
Elizabeth, Borough of: The hydrologic and hydraulic analyses for
the FIS report dated January 16, 1981, were
prepared by the USACE, Pittsburgh District,
for the FIA, under Inter-Agency Agreement
No. IAA-H-18-78. That work was
completed in January 1980.
Elizabeth, Township of: The hydrologic and hydraulic analyses for
the FIS report dated September 1976 were
prepared by Michael Baker, Jr., Inc., for the
FIA, under Contract No. H-3727.
Emsworth, Borough of: The hydrologic and hydraulic analyses for
the FIS report dated March 1980 were

6
prepared by the USACE, Pittsburgh District,
for the FIA, under Inter-Agency Agreement
No. IAA-H-7-76, Project Order No. 25, and
Inter-Agency Agreement No. IAA-H-10-77,
Project Order No. 4. That work was
completed in January 1978.
Etna, Borough of: The hydrologic and hydraulic analyses for
the FIS report dated March 1978 were
prepared by Michael Baker, Jr., Inc., for the
FIA, under Contract No. H-3812. That
work was completed in March 1977. The
hydrologic and hydraulic analyses for the
Allegheny River were prepared by the
USACE, Pittsburgh District.
Fawn, Township of: The hydrologic and hydraulic analyses for
the FIS report dated July 18, 1983, were
prepared by the USACE, Pittsburgh District,
for FEMA, under Inter-Agency Agreement
No. IAA-H-9-79, Project Order No. 40.
That work was completed in August 1982.
Findlay, Township of: The hydrologic and hydraulic analyses for
the FIS report dated November 18, 1988,
were prepared by the USACE, Pittsburgh
District, for FEMA, under Inter-Agency
Agreement No. EMW-85-E-1822, Project
Order No. 1, Amendment No. 25. That
work was completed in April 1987.
Forward, Township of: The hydrologic and hydraulic analyses for
the FIS report dated August 1979 were
prepared by Michael Baker, Jr., Inc., for the
FIA, under Contract No. H-4553. That
work was completed in September 1978.
The hydrologic and hydraulic analyses for
the Township of Forward were previously
prepared by the USACE, Pittsburgh District.
Fox Chapel, Borough of: The hydrologic and hydraulic analyses for
the FIS report dated October 15, 1976, were
prepared by Michael Baker, Jr., Inc., for the
FIA, under Contract No. H-3727.
7
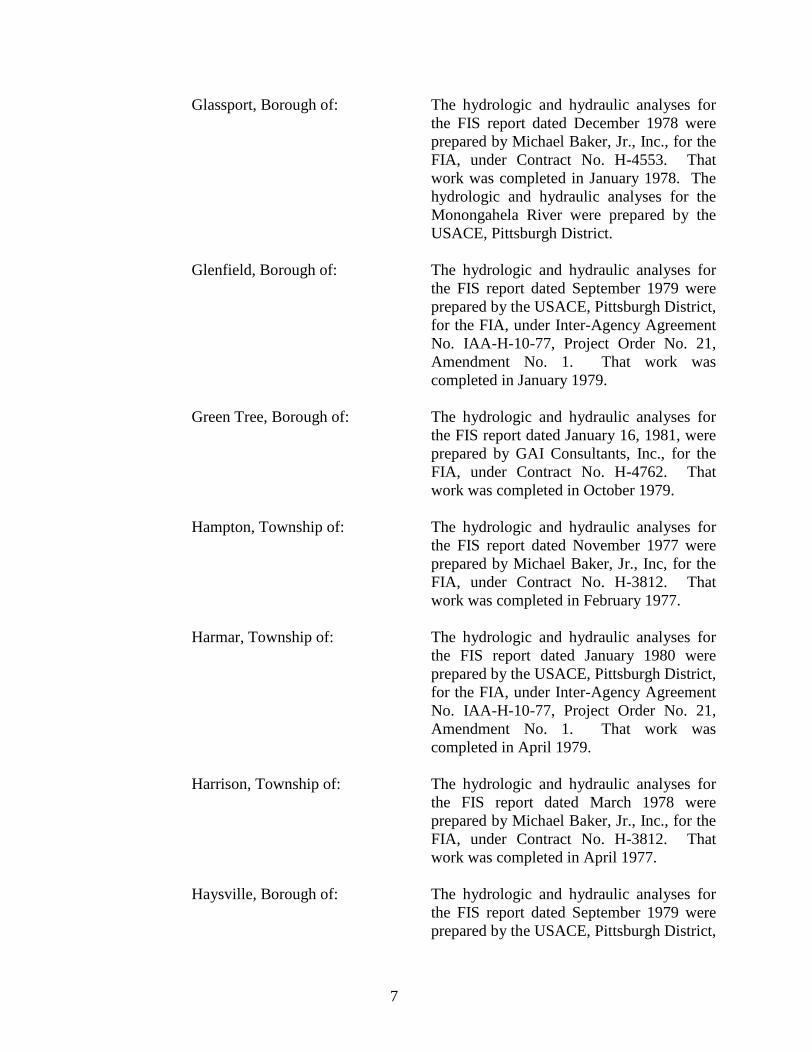
Glassport, Borough of: The hydrologic and hydraulic analyses for
the FIS report dated December 1978 were
prepared by Michael Baker, Jr., Inc., for the
FIA, under Contract No. H-4553. That
work was completed in January 1978. The
hydrologic and hydraulic analyses for the
Monongahela River were prepared by the
USACE, Pittsburgh District.
Glenfield, Borough of: The hydrologic and hydraulic analyses for
the FIS report dated September 1979 were
prepared by the USACE, Pittsburgh District,
for the FIA, under Inter-Agency Agreement
No. IAA-H-10-77, Project Order No. 21,
Amendment No. 1. That work was
completed in January 1979.
Green Tree, Borough of: The hydrologic and hydraulic analyses for
the FIS report dated January 16, 1981, were
prepared by GAI Consultants, Inc., for the
FIA, under Contract No. H-4762. That
work was completed in October 1979.
Hampton, Township of: The hydrologic and hydraulic analyses for
the FIS report dated November 1977 were
prepared by Michael Baker, Jr., Inc, for the
FIA, under Contract No. H-3812. That
work was completed in February 1977.
Harmar, Township of: The hydrologic and hydraulic analyses for
the FIS report dated January 1980 were
prepared by the USACE, Pittsburgh District,
for the FIA, under Inter-Agency Agreement
No. IAA-H-10-77, Project Order No. 21,
Amendment No. 1. That work was
completed in April 1979.
Harrison, Township of: The hydrologic and hydraulic analyses for
the FIS report dated March 1978 were
prepared by Michael Baker, Jr., Inc., for the
FIA, under Contract No. H-3812. That
work was completed in April 1977.
Haysville, Borough of: The hydrologic and hydraulic analyses for
the FIS report dated September 1979 were
prepared by the USACE, Pittsburgh District,

8
for the FIA, under Inter-Agency Agreement
No. IAA-H-10-77, Project Order No. 21,
Amendment No. 1. That work was
completed in January 1979.
Heidelberg, Borough of: The hydrologic and hydraulic analyses for
the FIS report dated December 15, 1980,
were prepared by GAI Consultants, Inc., for
the FIA, under Contract No. H-4762. That
work was completed in October 1979.
Indiana, Township of: The hydrologic and hydraulic analyses for
the FIS report dated April 18, 1983, were
prepared by the USACE, Pittsburgh District,
for FEMA, under Inter-Agency Agreement
No. IAA-H-9-79, Project Order No. 40,
Amendment No. 1. That work was
completed in May 1982.
Jefferson, Borough of: The hydrologic and hydraulic analyses for
the FIS report dated October 1979 were
prepared by Michael Baker, Jr., Inc., for the
FIA, under Contract No. H-4553. That
work was completed in September 1978.
Kennedy, Township of: The hydrologic and hydraulic analyses for
the FIS report dated August 1979 were
prepared by Michael Baker, Jr., Inc., for the
FIA, under Contract No. H-4553. That
work was completed in July 1978.
Kilbuck, Township of: The hydrologic and hydraulic analyses for
the FIS report dated August 1979 were
prepared by Michael Baker, Jr., Inc., for the
FIA, under Contract No. H-4553. That
work was completed in April 1978.
Leet, Township of: The hydrologic and hydraulic analyses for
the FIS report dated March 1979 were
prepared by Michael Baker, Jr., Inc., for the
FIA, under Contract No. H-4553. That
work was completed in January 1978.
Leetsdale, Borough of: The hydrologic and hydraulic analyses for
the FIS report dated May 1980 were
prepared by the USACE, Pittsburgh District,

9
for FEMA, under Inter-Agency Agreement
No. IAA-H-10-77, Project Order No. 21,
Amendment No. 1. That work was
completed in January 1979.
Liberty, Borough of: The hydrologic and hydraulic analyses for
the FIS report dated May 1979 were
prepared by Michael Baker, Jr., Inc., for the
FIA, under Contract No. H-4553. That
work was completed in March 1978. For
the Youghiogheny River, the hydrologic
analysis was prepared by the USACE, and
the hydraulic analysis was prepared by
Michael Baker, Jr., Inc., and completed in
December 1976.
Lincoln, Borough of: The hydrologic and hydraulic analyses for
the FIS report dated March 1979 were
prepared by Michael Baker, Jr., Inc., for the
FIA, under Contract No. H-4553. That
work was completed in March 1978. The
hydrologic and hydraulic analyses for the
Monongahela River were prepared by the
USACE.
Marshall, Township of: The hydrologic and hydraulic analyses for
the FIS report dated May 4, 1981, were
prepared by Michael Baker, Jr., Inc., for the
FIA, under Contract No. H-4553. That
work was completed in October 1978.
McCandless, Town of: The hydrologic and hydraulic analyses for
the FIS report dated December 1979 were
prepared by Michael Baker, Jr., Inc., for the
FIA, under Contract No. H-4553. That
work was completed in December 1978.
McDonald, Borough of: The hydrologic and hydraulic analyses for
the FIS report dated February 15, 1983,
were prepared by the USACE, Pittsburgh
District, for FEMA, under Inter-Agency
Agreement No. IAA-H-9-79, Project Order
No. 40, Amendment No. 1. That work was
completed in March 1982.

10
McKeesport, City of: The hydrologic and hydraulic analyses for
the FIS report dated July 1978 were
prepared by Michael Baker, Jr., Inc., for the
FIA, under Contract No. H-3812. That
work was completed in July 1977. The
hydrologic analyses for the Youghiogheny
and Monongahela Rivers were prepared by
the USACE. That work was prepared in
December 1976.
McKees Rocks, Borough of: The hydrologic and hydraulic analyses for
the FIS report dated May 16, 1977, were
prepared by the USACE, Pittsburgh District,
for the FIA, under Inter-Agency Agreement
Nos. IAA-H-19-74 and IAA-H-16-75,
Project Order Nos. 18 and 6, respectively.
Millvale, Borough of: The hydrologic and hydraulic analyses for
the FIS report dated January 1979 were
prepared by Michael Baker, Jr., Inc., for the
FIA, under Contract No. H-3812. That
work was completed in November 1977.
The hydrologic and hydraulic analyses for
the Allegheny River and Girty’s Run were
prepared by the USACE.
Monroeville, Municipality of: The hydrologic and hydraulic analyses for
the FIS report dated February 1979 were
prepared by Michael Baker, Jr., Inc., for the
FIA, under Contract No. H-3812. That
work was completed in November 1977.
Moon, Township of: The hydrologic and hydraulic analyses for
the FIS report dated February 1979 were
prepared by Michael Baker, Jr., Inc., for the
FIA, under Contract No. H-4553. That
work was completed in March 1978. The
hydrologic and hydraulic analyses for the
Ohio River were prepared by the USACE.
Neville, Township of: The hydrologic and hydraulic analyses for
the FIS report dated September 5, 1975,
were prepared by the USACE, Pittsburgh
District, for FEMA, under Inter-Agency
Agreement No. IAA-H-8-71, Contract No.
8610147. That work was completed in
11
1975. The hydrologic and hydraulic
analyses for the revised FIS report dated
September 30, 1988, were prepared by the
USACE, Pittsburgh District, for FEMA,
under Inter-Agency Agreement No. EMW-
85-E-1822, Project Order No. 1,
Amendment No. 4. That work was
completed in January 1987.
North Fayette, Township of: The hydrologic and hydraulic analyses for
the FIS report dated April 18, 1983, were
prepared by the USACE, Pittsburgh District,
for FEMA, under Inter-Agency Agreement
No. IAA-H-9-79, Project Order No. 40,
Amendment No. 1. That work was
completed in March 1982.
North Versailles, Township of: The hydrologic and hydraulic analyses for
the FIS report dated October 1, 1980, were
prepared by Michael Baker, Jr., Inc., for the
FIA, under Contract No. H-4553. That
work was completed in September 1978.
The hydrologic analyses for the
Monongahela River were previously
prepared by the USACE, Pittsburgh District.
Oakdale, Borough of: The hydrologic and hydraulic analyses for
the FIS report dated August 15, 1983, were
prepared by the USACE, Pittsburgh District,
for FEMA, under Inter-Agency Agreement
No. IAA-H-9-79, Project Order No. 40,
Amendment No. 1. That work was
completed in March 1982.
Oakmont, Borough of: The hydrologic and hydraulic analyses for
the FIS report dated July 16, 1980, were
prepared by GAI Consultants, Inc., for the
FIA, under Contract No. H-4762. That
work was completed in July 1979.
O’Hara, Township of: The hydrologic and hydraulic analyses for
the FIS report dated January 1980 were
prepared by the USACE, Pittsburgh District,
for the FIA, under Inter-Agency Agreement
No. IAA-H-10-77, Project Order No. 21,

12
Amendment No. 1. That work was
completed in April 1979.
Ohio, Township of: The hydrologic and hydraulic analyses for
the FIS report dated November 4, 1988,
were prepared by the USACE, Pittsburgh
District, for FEMA, under Inter-Agency
Agreement No. EMW-85-E-1822, Project
Order No. 1, Amendment No. 25. That
work was completed in March 1987.
Osborne, Borough of: The hydrologic and hydraulic analyses for
the FIS report dated May 1979 were
prepared by Michael Baker, Jr., Inc., for the
FIA, under Contract No. H-3812. That
work was completed in November 1977.
The hydrologic and hydraulic analyses for
the Ohio River were prepared by the
USACE.
Penn Hills, Municipality of: The hydrologic and hydraulic analyses for
the FIS report dated December 15, 1980,
were prepared by GAI Consultants, Inc., for
the FIA, under Contract No. H-4762. That
work was completed in August 1979.
Pitcairn, Borough of: The hydrologic and hydraulic analyses for
the FIS report dated October 1979 were
prepared by Michael Baker, Jr., Inc., for the
FIA, under Contract No. H-4553. That
work was completed in October 1978.
Pittsburgh, City of: The hydrologic and hydraulic analyses for
the FIS report dated June 15, 1981, were
prepared by the USACE, Pittsburgh District,
for FEMA, under Inter-Agency Agreement
No. IAA-H-16-75, Project Order No. 17,
and Inter-Agency Agreement No. IAA-H-7-
76, Project Order No. 1. That work was
completed in June 1977.
Plum, Borough of: The hydrologic and hydraulic analyses for
the FIS report dated March 16, 1981, were
prepared by GAI Consultants, Inc., for the
FIA, under Contract No. H-4762. That
work was completed in September 1979.

13
Port Vue, Borough of: The hydrologic and hydraulic analyses for
the FIS report dated March 1979 were
prepared by Michael Baker, Jr., Inc., for the
FIA, under Contract No. H-4553. That
work was completed in March 1978. The
hydrologic analysis for the Youghiogheny
River was prepared by the USACE. That
work was completed in December 1976.
Rankin, Borough of: The hydrologic and hydraulic analyses for
the FIS report dated January 1980 were
prepared by the USACE, Pittsburgh District,
for the FIA, under Inter-Agency Agreement
No. IAA-H-10-77, Project Order No. 21,
Amendment No. 1. That work was
completed in March 1979.
Reserve, Township of: The hydrologic and hydraulic analyses for
the FIS report dated October 1976 were
prepared by Michael Baker, Jr., Inc., for the
FIA, under Contract No. H-3727.
Robinson, Township of: The hydrologic and hydraulic analyses for
the FIS report dated August 3, 1981, were
prepared by GAI Consultants, Inc., for
FEMA, under Contract No. H-4762. That
work was completed in March 1980.
Ross, Township of: The hydrologic and hydraulic analyses for
the FIS report dated June 1979 were
prepared by the USACE, Pittsburgh District,
for the FIA, under Inter-Agency Agreement
No. IAA-H-7-76, Project Order No. 16,
Amendment No. 2. That work was
completed in February 1978.
Rosslyn Farms, Borough of: The hydrologic and hydraulic analyses for
the FIS report dated November 19, 1980,
were prepared by GAI Consultants, Inc., for
the FIA, under Contract No. H-4762. That
work was completed in October 1979. The
hydrologic and hydraulic analyses for
Chartiers Creek were prepared by the
USACE.

14
Scott, Township of: The hydrologic and hydraulic analyses for
the FIS report dated November 3, 1981,
were prepared by GAI Consultants, Inc., for
FEMA, under Contract No. H-4762. That
work was completed in January 1980. A
portion of the hydrologic and hydraulic
analyses for Chartiers Creek was prepared
by Michael Baker, Jr., Inc.
Sewickley, Borough of: The hydrologic and hydraulic analyses for
the FIS report dated March 1979 were
prepared by the USACE, Pittsburgh District,
for the FIA, under Inter-Agency Agreement
No. IAA-H-7-76, Project Order No. 25, and
Inter-Agency Agreement No. IAA-H-10-77,
Project Order No. 4. That work was
completed in October 1977.
Shaler, Township of: The hydrologic and hydraulic analyses for
the FIS report dated September 1979 were
prepared by Michael Baker, Jr., Inc., for the
FIA, under Contract No. H-4553. That
work was completed in November 1978.
Sharpsburg, Borough of: The hydrologic and hydraulic analyses for
the FIS report dated March 1978 were
prepared by Michael Baker, Jr., Inc., for the
FIA, under Contract No. H-3812. The
hydrologic and hydraulic analyses for the
Allegheny River were prepared by the
USACE. That work was completed in
March 1977.
South Fayette, Township: The hydrologic and hydraulic analyses for
the original FIS report were prepared by
Michael Baker, Jr., Inc., for the FIA, under
Contract No. H-4816. That work was
completed in February 1980. The
hydrologic and hydraulic analyses for the
FIS report dated April 3, 1989, were
prepared by Kozel and Associates, for
FEMA. That work was completed in
December 1987.
South Park, Township of: The hydrologic and hydraulic analyses for
the FIS report dated May 1980 were
15
prepared by Michael Baker, Jr., Inc., for the
FIA, under Contract No. H-4553. That
work was completed in May 1979.
South Versailles, Township of: The hydrologic and hydraulic analyses for
the FIS report dated February 1979 were
prepared by Michael Baker, Jr., Inc., for the
FIA, under Contract No. H-4553. That
work was completed in January 1978.
Springdale, Borough of: The hydrologic and hydraulic analyses for
the FIS report dated January 1980 were
prepared by the USACE, Pittsburgh District,
for the FIA, under Inter-Agency Agreement
No. IAA-H-10-77, Project Order No. 21,
Amendment No. 1. That work was
completed in May 1979.
Springdale, Township of: The hydrologic and hydraulic analyses for
the FIS report dated January 1980 were
prepared by the USACE, Pittsburgh District,
for the FIA, under Inter-Agency Agreement
No. IAA-H-10-77, Project Order No. 21,
Amendment No. 1. That work was
completed in May 1979.
Stowe, Township of: The hydrologic and hydraulic analyses for
the FIS report dated August 1979 were
prepared by Michael Baker, Jr., Inc., for the
FIA, under Contract No. H-4553. That
work was completed in July 1978. The
hydrologic and hydraulic analyses for the
Ohio River were prepared by the USACE,
Pittsburgh District.
Tarentum, Borough of: The hydrologic and hydraulic analyses for
the FIS report dated February 1980 were
prepared by the USACE, Pittsburgh District,
for the FIA, under Inter-Agency Agreement
No. IAA-H-10-77, Project Order No. 21,
Amendment No. 1. That work was
completed in June 1979.
Trafford, Borough of: The hydrologic and hydraulic analyses for
the FIS report dated March 1979 were
prepared by Michael Baker, Jr., Inc., for the

16
FIA, under Contract No. H-4553. That
work was completed in March 1978.
Turtle Creek, Borough of: The hydrologic and hydraulic analyses for
the FIS report dated May 1980 were
prepared by Michael Baker, Jr., Inc., for the
FIA, under Contract No. H-4553. That
work was completed in December 1978.
The USACE, Pittsburgh District, provided
hydrologic and hydraulic design data for
detailed study streams.
Upper St. Clair, Township of: The hydrologic and hydraulic analyses for
the FIS report dated September 15, 1983,
were prepared by the USACE, Pittsburgh
District, for the FIA, under Inter-Agency
Agreement No. IAA-H-9-79, Project Order
No. 40. That work was completed in March
1982. The hydraulic analysis for Chartiers
Creek in the FIS report dated April 17,
1989, was prepared by Kozel and
Associates for FEMA. That work was
completed in December 1987.
Verona, Borough of: The hydrologic and hydraulic analyses for
the FIS report dated July 16, 1980, were
prepared by GAI Consultants, Inc., for the
FIA, under Contract No. H-4762. That
work was completed in July 1979.
Versailles, Borough of: The hydrologic and hydraulic analyses for
the FIS report dated October 18, 1988, were
prepared by the USACE, Pittsburgh District,
for FEMA, under Contract No. EMW-85-E-
1822, Project Order No. 1, Amendment No.
25. That work was completed in January
1987.
West Deer, Township of: The hydrologic and hydraulic analyses for
the FIS report dated April 18, 1983, were
prepared by the USACE, Pittsburgh District,
for FEMA, under Inter-Agency Agreement
No. IAA-H-9-79, Project Order No. 40,
Amendment No. 1. That work was
completed in May 1982.
17
West Elizabeth, Borough of: The hydrologic and hydraulic analyses for the FIS report dated March 1978 were prepared by Michael Baker, Jr., Inc., for the FIA, under Contract No. H-3812. The hydrologic and hydraulic analyses for the Monongahela River were prepared by the USACE, Pittsburgh District. That work was completed in June 1977.
West Homestead, Borough of: The hydrologic and hydraulic analyses for
the FIS report dated February 1980 were prepared by the USACE, Pittsburgh District, for the FIA, under Inter-Agency Agreement No. IAA-H-10-77, Project Order No. 21, Amendment No. 1. That work was completed in March 1979.
West Mifflin, Borough of: The hydrologic and hydraulic analyses for
the FIS report dated August 1979 were prepared by Michael Baker, Jr., Inc., for the FIA, under Contract No. H-4553. That work was completed in July 1978. The hydrologic and hydraulic analyses for the Monongahela River were prepared by the USACE, Pittsburgh District.
White Oak, Borough of: The hydrologic and hydraulic analyses for
the FIS report dated March 1979 were prepared by Michael Baker, Jr., Inc., for the FIA, under Contract No. H-4553. That work was completed in April 1978.
Wilkins, Township of: The hydrologic and hydraulic analyses for
the FIS report dated March 1978 were prepared by Michael Baker, Jr., Inc., for the FIA, under Contract No. H-3812. That work was completed in April 1977.
Wilmerding, Borough of: The hydrologic and hydraulic analyses for
the FIS report dated February 1979 were prepared by Michael Baker, Jr., Inc., for the FIA, under Contract No. H-3812. That work was completed in November 1977.
There are no previous FISs or FIRMs for the boroughs of Ben Avon Heights,
Brentwood, Chalfant, Dormont, East McKeesport, East Pittsburg, Edgewood,
Homestead, Ingram, Mount Oliver, Pleasant Hills, Whitaker, Whitehall, and
Wilkinsburg therefore, the previous authority and acknowledgments for these
communities are not included in this FIS. These communities will not appear in
the Community Map History Table.

18
For the October 4, 1995, countywide FIS, revised hydrologic and hydraulic
analyses for the Monongahela River were prepared by the USACE, Pittsburgh
District, for FEMA, under Inter-Agency Agreement No. EMW-90-E-3263,
Project Order No. 4. That work was completed in October 1992.
For the August 5, 1997, countywide revision, the community disclaimer note for
the Borough of Trafford was removed. The borough is now included in this FIS.
For the March 16, 1998, countywide revision, revised hydrologic and hydraulic
analyses for Gourdhead Run, Harts Run, Little Pine Creek East, Little Pine Creek
West, McCaslin Run, Montour Run No. 1, and Pine Creek were prepared by
Pinto Engineering, for FEMA, under Contract No. EMW-93-C-4123. That work
was completed in October 1993. The Boroughs of Etna and Franklin Park; the
Town of McCandless; and the Townships of Hampton, Indiana, O’Hara, Ross,
and Shaler were affected by that revision.
For the July 5, 2000, countywide revision, revised hydrologic and hydraulic
analyses for the Allegheny River were prepared by the USACE, Pittsburgh
District, for FEMA, under Inter-Agency Agreement No. EMW-94-E-4371. This
work was completed in October 1997. The Boroughs of Aspinwall, Blawnox,
Brackenridge, Cheswick, Etna, Fox Chapel, Millvale, Oakmont, Plum,
Sharpsburg, Springdale, Tarentum, and Verona; the Townships of East Deer,
Harmar, Harrison, O’Hara, Shaler, and Springdale; the Municipality of Penn Hills
and the City of Pittsburgh are affected by the July 5, 2000, revision.
For the September 21, 2001, countywide revision, revised topographic
information was prepared by Chester Engineers, Inc., for the Borough of Fox
Chapel. The Township of O’Hara was also affected by this revision.
For the May 15, 2003 revision, the hydraulic and hydrologic analyses for
Chartiers Creek were performed by the USACE, Pittsburgh District, for FEMA
under Inter-Agency Agreement No. (IAA) H-9-79, Project Order No. 40 and
Amendment No. 1. This work was completed in October 1982. This revision
affects the Boroughs of Crafton, Rosslyn Farms, and Thornburg, and the
Township of Robinson.
The hydrologic and hydraulic analyses for this countywide revision were
performed by RAMPP, a joint venture of Dewberry, URS Corporation, and ESP,
for FEMA, under Contract No. HSFEHQ-09-D-0369, Project Order No.
HSFE03-09-J-003B. This study was completed in September 2010. This revision
affects all jurisdictions in Allegheny County.
Base map information shown on the FIRM dated 2004 was provided in digital
format by Allegheny County Geographic Information Systems Group.
19
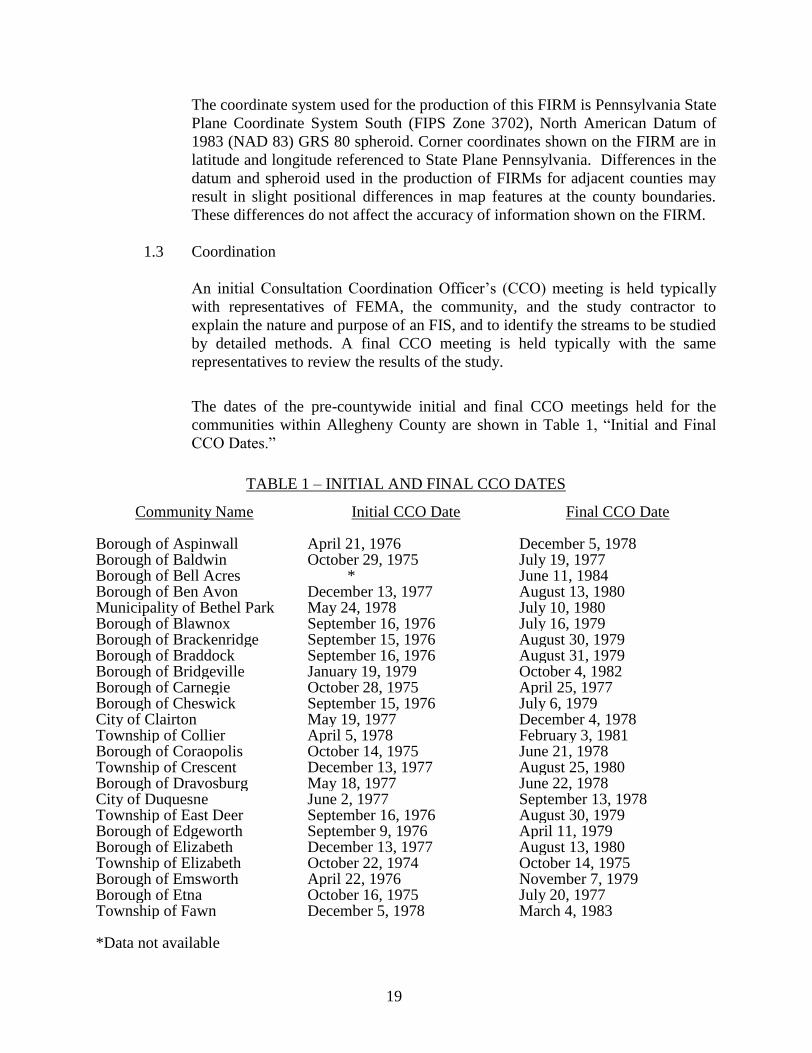
The coordinate system used for the production of this FIRM is Pennsylvania State
Plane Coordinate System South (FIPS Zone 3702), North American Datum of
1983 (NAD 83) GRS 80 spheroid. Corner coordinates shown on the FIRM are in
latitude and longitude referenced to State Plane Pennsylvania. Differences in the
datum and spheroid used in the production of FIRMs for adjacent counties may
result in slight positional differences in map features at the county boundaries.
These differences do not affect the accuracy of information shown on the FIRM.
1.3 Coordination
An initial Consultation Coordination Officer’s (CCO) meeting is held typically
with representatives of FEMA, the community, and the study contractor to
explain the nature and purpose of an FIS, and to identify the streams to be studied
by detailed methods. A final CCO meeting is held typically with the same
representatives to review the results of the study.
The dates of the pre-countywide initial and final CCO meetings held for the
communities within Allegheny County are shown in Table 1, “Initial and Final
CCO Dates.”
TABLE 1 – INITIAL AND FINAL CCO DATES
Community Name Initial CCO Date Final CCO Date Borough of Aspinwall April 21, 1976 December 5, 1978 Borough of Baldwin October 29, 1975 July 19, 1977 Borough of Bell Acres * June 11, 1984 Borough of Ben Avon December 13, 1977 August 13, 1980 Municipality of Bethel Park May 24, 1978 July 10, 1980 Borough of Blawnox September 16, 1976 July 16, 1979 Borough of Brackenridge September 15, 1976 August 30, 1979 Borough of Braddock September 16, 1976 August 31, 1979 Borough of Bridgeville January 19, 1979 October 4, 1982 Borough of Carnegie October 28, 1975 April 25, 1977 Borough of Cheswick September 15, 1976 July 6, 1979 City of Clairton May 19, 1977 December 4, 1978 Township of Collier April 5, 1978 February 3, 1981 Borough of Coraopolis October 14, 1975 June 21, 1978 Township of Crescent December 13, 1977 August 25, 1980 Borough of Dravosburg May 18, 1977 June 22, 1978 City of Duquesne June 2, 1977 September 13, 1978 Township of East Deer September 16, 1976 August 30, 1979 Borough of Edgeworth September 9, 1976 April 11, 1979 Borough of Elizabeth December 13, 1977 August 13, 1980 Township of Elizabeth October 22, 1974 October 14, 1975 Borough of Emsworth April 22, 1976 November 7, 1979 Borough of Etna October 16, 1975 July 20, 1977 Township of Fawn December 5, 1978 March 4, 1983
*Data not available

20
TABLE 1 – INITIAL AND FINAL CCO DATES - continued
Community Name Initial CCO Date Final CCO Date Township of Findlay May 22, 1985 November 30, 1987 Borough of Fox Chapel October 23, 1974 October 16, 1975 Borough of Glassport May 19, 1977 June 22, 1978 Borough of Glenfield September 9, 1976 April 11, 1979 Borough of Green Tree April 5, 1978 August 12, 1980 Township of Hampton September 16, 1975 April 6, 1977 Township of Harmar September 16, 1976 July 27, 1979 Township of Harrison October 14, 1975 July 21, 1977 Borough of Haysville September 9, 1976 April 11, 1979 Borough of Heidelberg April 5, 1978 May 13, 1980 Township of Indiana December 5, 1978 December 1, 1982 Borough of Jefferson June 1, 1977 May 16, 1979 Township of Kennedy May 16, 1977 March 15, 1979 Township of Kilbuck May 16, 1977 October 16, 1978 Township of Leet May 16, 1977 August 3, 1978 Borough of Leetsdale September 9, 1976 April 11, 1979 Borough of Liberty May 19, 1977 October 24, 1978 Borough of Lincoln May 17, 1977 October 24, 1978 Township of Marshall May 17, 1977 April 10, 1979 Town of McCandless May 17, 1977 May 24, 1979 Borough of McDonald January 17, 1979 October 4, 1982 City of McKeesport September 18, 1975 September 28, 1977 Borough of McKees Rocks October 16, 1974 * Borough of Millvale October 16, 1975 February 5, 1978 Municipality of Monroeville October 15, 1975 August 2, 1978 Township of Moon May 16, 1977 September 11, 1978 Township of Neville December 14, 1984 November 30, 1987 Township of North Fayette January 17, 1979 December 2, 1982 Township of North Versailles May 18, 1977 March 7, 1979 Borough of Oakdale January 17, 1979 October 4, 1982 Borough of Oakmont April 5, 1978 March 7, 1980 Township of O’Hara September 16, 1976 July 16, 1979 Township of Ohio May 22, 1985 November 30, 1987 Borough of Osborne October 14, 1975 June 21, 1978 Municipality of Penn Hills April 4, 1978 May 13, 1980 Borough of Pitcairn May 18, 1977 May 16, 1979 City of Pittsburgh May 22, 1975 November 9, 1979 Borough of Plum April 5, 1978 October 21, 1980 Borough of Port Vue May 19, 1977 September 12, 1979 Borough of Rankin September 16, 1976 July 17, 1979 Township of Reserve October 23, 1974 October 16, 1975 Township of Robinson April 5, 1978 February 3, 1981 Township of Ross November 18, 1975 December 5, 1978 Borough of Rosslyn Farms April 5, 1978 May 13, 1980 Township of Scott April 5, 1978 February 4, 1981
* Data not available

21
TABLE 1 – INITIAL AND FINAL CCO DATES - continued Community Name Initial CCO Date Final CCO Date Borough of Sewickley April 22, 1976 September 11, 1978 Township of Shaler May 17, 1977 April 12, 1979 Borough of Sharpsburg October 21, 1975 July 20, 1977 Township of South Fayette May 25, 1978 February 6, 1981 Township of South Park May 23, 1978 November 8, 1979 Town of South Versailles May 18, 1977 August 2, 1978 Borough of Springdale September 15, 1976 July 18, 1979 Township of Springdale September 15, 1976 July 18, 1979 Township of Stowe May 16, 1977 March 6, 1979 Borough of Tarentum September 15, 1976 August 30, 1979 Borough of Trafford May 18, 1977 October 24, 1978 Borough of Turtle Creek May 17, 1977 April 10, 1979 Township of Upper St. Clair January 19, 1979 March 3, 1983 Borough of Verona April 5, 1978 March 7, 1980 Borough of Versailles May 22, 1985 November 30, 1987 Township of West Deer December 5, 1978 December 1, 1982 Borough of West Elizabeth September 18, 1975 August 10, 1977 Borough of West Homestead September 16, 1976 July 17, 1979 Borough of West Mifflin July 1, 1977 March 7, 1979 Borough of White Oak May 19, 1977 October 3, 1978 Township of Wilkins October 15, 1975 August 10, 1977 Borough of Wilmerding October 21, 1975 August 2, 1978
For the original October 4, 1995, countywide FIS, initial CCO meetings were held during September 1989 and were attended by representatives of the USACE, all jurisdictions within Allegheny County, and FEMA. A final CCO meeting was held on May 23, 1994, and was attended by representatives of the USACE, FEMA, and the Boroughs of Avalon, Bellevue, Crafton, Franklin Park, Homestead, Munhall, North Braddock, and Whitaker. For the March 16, 1998, countywide revision, initial CCO meetings were held for the communities shown in the following tabulation and were attended by representatives of the respective communities, Pinto Engineering, and FEMA. Community Initial CCO Borough of Etna April 21, 1993 Borough of Franklin Park July 26, 1996 Township of Hampton April 22, 1993 Township of Indiana July 26, 1996 Town of McCandless May 6, 1993 Township of O’Hara July 26, 1996 Township of Ross July 26, 1996 Township of Shaler April 22, 1993
For the July 5, 2000, countywide revision, an initial CCO meeting was held in September 1993 and was attended by representatives of the affected communities,
22
the county, the USACE, and FEMA, and a final CCO meeting was held on April 21, 1998. For the May 15, 2003 revision, the final CCO meeting was held on April 29, 2002, and was attended by representatives of the Borough of Thornburg and FEMA. For this countywide revision an initial CCO meeting was held on January 26, 2010, and attended by representatives of FEMA Region III, the City of Pittsburgh, Allegheny County, USACE, and RAMPP. The final CCO meetings were held on September 6 and 7, 2011 and were attended by representatives of FEMA Region III, RAMPP, and representatives of numerous affected communities.
2.0 AREA STUDIED
2.1 Scope of Study
This FIS covers the geographic area of Allegheny County, Pennsylvania.
All or portions of the flooding sources listed in Table 2, “Detailed Studied
Streams,” were studied by detailed methods. Limits of detailed study are
indicated on the Flood Profiles (Exhibit 1) and on the FIRM (Exhibit 2).
TABLE 2 – DETAILED STUDIED STREAMS
Abers Creek Allegheny River Bear Run Becks Run Big Sewickley Creek Boston Hollow Run Boyds Hollow Run Brush Creek 1 Brush Creek 2 Bull Creek Campbells Run Chalfant Run Chartiers Creek Chartiers Creek-Diversion Channel Crooked Run Crouse Run Crouse Run Tributary Deer Creek Dirty Camp Run Douglass Run Douglass Run Tributary No. 1 Douglass Run Tributary No. 2 East Thompson Run Fallen Timber Run Georges Run Gillespie Run Girty’s Run Gourdhead Run Graesers Run Happy Hollow Run Harts Run Hoffman Run Humms Run Jacks Run Leak Run Lewis Run Lick Run Little Bull Creek Little Deer Creek Little Pine Creek East Little Pine Creek West Little Plum Creek Lobbs Run Long Run Lowries Run McCaslin Run McClarens Run McLaughlin Run Millers Run Monongahela River Montour Run Montour Run No. 1 Moon Run North Branch Robinson Run North Fork Montour Run Ohio River Ohio River Back Channel Painters Run Peters Creek Pidgeon Hollow Run Piersons Run Pine Creek Piney Fork Pitt Street Tributary Plum Creek
23
TABLE 2 – DETAILED STUDIED STREAMS - continued
Pucketa Creek Robinson Run Rochester Run Sandy Creek Saw Mill Run Sawmill Run Sandy Creek Saw Mill Run Sawmill Run Scrubgrass Run South Fork Montour Run Spring Garden Run Squaw Run Squaw Run Tributary No. 1 Squaw Run Tributary No. 2 Squaw Run Tributary No. 4 Streets Run Thompson Run Tributary A Tributary to Bull Creek Tributary 1 to Piney Fork Turtle Creek Unnamed Stream Along Moss Side Boulevard West Branch Deer Creek Whiskey Run Whittmer Run Wildcat Run Wylie Run Youghiogheny River
The following tabulation lists streams that have names in this countywide FIS other than those
used in the previously printed pre-countywide FISs for the communities in which they are
located:
Community Old Name New Name
Borough of Bridgeville Chartiers Creek
Auxiliary Channel
Chartiers Creek
Township of Elizabeth Hayden Run Fallen Timber Run
Borough of Emsworth Ohio River-Main
Channel
Ohio River
Borough of Etna Little Pine Creek Little Pine Creek West
Township of Findlay North Fork Montour Run Montour Run
Township of Hampton Montour Run Montour Run No. 1
Township of Marshall Brush Creek Brush Creek 2
Town of McCandless Little Pine Creek Little Pine Creek West
Municipality of
Monroeville
Turtle Creek at Abers
Creek
Turtle Creek
West Thompson Run Thompson Run
Township of Richland Montour Run Montour Run No. 1
Township of Ross West Little Pine Creek Little Pine Creek West
Borough of Trafford Brush Creek Brush Creek 1
As part of the October 4, 1995, countywide FIS, updated analyses were included
for the Monongahela River for its entire length within the county.
For the March 16, 1998, countywide revision, limits of detailed study for the
newly studied or revised streams are shown in the following tabulation.

24
Stream Name Limits of Detailed Study
Gourdhead Run From confluence with Pine Creek to a point
approximately 0.6 mile upstream of Harts Run
Road
Harts Run From confluence with Gourdhead Run to a point
approximately 350 feet upstream of Harts Run
Road
Little Pine Creek East From confluence with Pine Creek to a point
approximately 1,850 feet upstream of Klein Road
Little Pine Creek West From confluence with Pine Creek to a point
approximately 40 feet upstream of Babcock
Boulevard
McCaslin Run From confluence with Gourdhead Run to a point
approximately 300 feet upstream of McCully Road
Montour Run No. 1 From confluence with Pine Creek to a point
approximately 1.6 mile upstream of Wildwood
Road
Pine Creek From confluence with the Allegheny River to a
point approximately 150 feet upstream of
Wildwood Road and from a point approximately
0.4 mile downstream of Kummer Road to a point
approximately 900 feet upstream of confluence of
Fish Run
The March 16, 1998, countywide revision also incorporated changes to the
backwater effects of Pine Creek on Crouse Run.
For the July 5, 2000, countywide revision, the Allegheny River was restudied, by
detailed methods for its entire length within the county. In addition to backwater
effects from the Allegheny River on Herrs Island Back Channel, Fourteen Mile
Island Back Channel, and Twelve Mile Island Back Channel, side channels along
the Allegheny River were also studied by detailed methods. Girty’s Run, Pine
Creek, Sandy Creek, Plum Creek, and Pucketa Creek were also studied.
The July 5, 2000, revision also incorporates the determinations of letters issued
by FEMA resulting in map changes (Letter of Map Revision [LOMR]), as shown
in the following tabulation.

25
Community Flooding Source and Project Identifier Date Issued
City of Pittsburg Allegheny River
Updated analyses reflecting the
construction of the Garrison Place sewer
flap gate, bounded by 9th
and 10th
Streets, Fort Duquesne Boulevard, and
Penn Avenue
March 12, 1997
Borough of Oakmont Tributary to Plum Creek
Updated analyses to reflect the
channelization of the tributary in the
vicinity of Oakmont Common
May 30, 1996
Borough of Oakmont Plum Creek
Updated topographic information from
1,000 feet upstream of CONRAIL
bridge to the corporate limit
January 19, 1996
For the September 21, 2001, countywide revision, topographic information was updated for Squaw Run, Squaw Run Tributary Nos. 1, 2, and 4, Glade Run, and Stony Camp Run along their entire lengths. Detailed information was removed along Squaw Run Tributary No. 3. For May 15, 2003 revision, Chartiers Creek was studied by detailed methods from just upstream of Ingram Boulevard to approximately 300 feet downstream of Chartiers Avenue. This revision affected the Boroughs of Crafton, Rosslyn Farms, and Thornburg, and the Township of Robinson. For this countywide revision, updated analyses were included for the flooding
sources shown in Table 3, “Scope of Study.”
TABLE 3 - SCOPE OF STUDY
Stream Name Limits of Revised Detailed Study Streams
Graesers Run From the confluence with McLaughlin Run to a point
approximately 1,720 feet upstream of Brookside Boulevard. McLaughlin Run From the confluence with Chartiers Creek to a point
approximately 1,330 feet upstream of Bethel Church Road.
Plum Creek From the confluence with Allegheny River to a point
approximately 260 feet upstream of Saltsburg Road.
The areas studied by detailed methods were selected with priority given to all
known flood hazard areas and areas of projected development and proposed
construction through Allegheny County.

26
Numerous streams were studied by approximate analyses. Approximate analyses
were used to study those areas having a low development potential or minimal
flood hazards. The scope and methods of study were proposed to, and agreed
upon, by FEMA and Allegheny County.
For this countywide revision, floodplain boundaries for the streams that had been
previously studied by detailed methods were redelineated based on more up-to-
date topographic data.
This countywide revision incorporates the following Letters of Map Revision
(LOMRs) which are listed in Table 4 below.
TABLE 4 – INCORPORATED LETTERS OF MAP REVISION
Case Number Effective Date Flooding Source
00-03-119P 08/07/2000 Peters Creek
02-03-009P 09/04/2002 Lowries Run
02-03-029P 10/15/2002 Sawmill Run
02-03-043P 01/14/2003 Montour Run
02-03-097P 05/17/2002 Montour Run
03-03-011P 02/13/2003 Jacks Run & Long Run
04-03-097P 08/25/2004 Sawmill Run
04-03-113P 12/29/2004 Graesers Run Tributary 1
09-03-0036P 12/31/2008 Unnamed Tributary Along Moss
Side Boulevard
2.2 Community Description
Allegheny County is located in southwestern Pennsylvania. It is bordered by
Butler County to the north, Beaver County to the northwest, Washington County
to the southwest, Fayette County to the south, and Westmoreland County to the
east. The 2000 population of the county was 1,218,494 a decrease of 9 percent
from the 1990 population of 1,336,449, with the largest concentration in the City
of Pittsburgh (Reference 1). The climate of Allegheny County is temperate with seasonal variation in temperature. Temperatures range from an average of 31 degrees Fahrenheit (F) in January to 74F in July. The county is geographically located in a region of variable air mass activity, being subject to both polar and tropical continental and maritime air mass invasion. Measurable precipitation occurs approximately 149 days per year and averages 37 inches annually. Allegheny County lies within the Allegheny Plateau physiographic region. The watersheds are characterized by V-shaped valleys and steep hillsides. Soils are

27
generally silt and silty clay loams and exhibit low infiltration capacities (References 2 and 3). The Allegheny River, with a total drainage area of 11,778 square miles at its confluence, joins the Monongahela River to form the Ohio River at Pittsburgh, Pennsylvania. The headwaters of the Allegheny River are in the northwestern slopes of the Appalachian Mountain Range in Potter County in northwestern Pennsylvania. It flows in a northwestern direction from its source until it reaches Portville, New York, near the New York-Pennsylvania border. It then flows west to Salamanca, New York, and southward into Pennsylvania to its confluence at Pittsburgh. The Allegheny River measures a total distance of 322 miles. The average bed slope of the Allegheny River is 1.0 foot per mile, and valley floor widths range from 550 to 2,200 feet. Local relief above the stream valley varies from approximately 300 to 400 feet to an average hilltop elevation of approximately 1,200 feet National Geodetic Vertical Datum of 1929 (NGVD 29).
2.3 Principal Flood Problems
Flooding on Abers Creek and its tributary, Humms Run, has been documented extensively in the study titled Urban Development and Small Watershed Flooding prepared by the Turtle Creek Watershed Association, Inc. (Reference 4). Major floods on Abers Creek since 1949, recorded at the USGS gaging station No. 840 near Murrysville, are listed in the following tabulation. Discharges are expressed in cubic feet per second (cfs).
ABERS CREEK AT STATION NO. 840
Recurrence Stage Elevation Discharge Interval Date (feet) (feet) (cfs) (years) July 1950 6.09 942.82 1,600 31 August 1976 7.21 943.94 1,230 15 August 1959 6.98 943.71 1,100 10 June 1952 6.59 943.32 1,000 8 October 1954 6.68 943.41 950 6 June 1972 5.78 942.51 720 Overbank flooding of the Allegheny River, including the backwater flooding from the Monongahela River, is the principal flooding problem within the study area. The Allegheny and Monongahela Rivers have a history of flooding dating from the 1800s. The highest flood of record occurred in March 1936, the result of flooding on the Allegheny River and backwater flooding from the Monongahela River. This flood was caused by heavy rain and snowmelt from the 16
th to the 18
th of March. Although the main flood season is normally late winter
to early spring, major floods have occurred during the summer or early fall months from the remnants of hurricanes.

28
The following tabulation shows the most significant floods of record recorded at the Pittsburgh “Point” gage, located at the confluence of the Allegheny and Monongahela Rivers. The stages shown reflect the reductions that were provided by the USACE upstream dams and reservoirs that were in existence at the time of the flood.
FLOODS OF RECORD ON THE ALLEGHENY RIVER
(PITTSBURGH “POINT” GAGE)
Date Stage1
(feet) Elevation
(feet) Discharge (cfs)
March 18, 1936 46.0
2 740.2
3 557,000
March 15, 1907 38.52 732.7
3 440,000
December 31, 1942 36.62 730.8
3 396,000
February 6, 1884 36.32 730.5
3 403,000
June 23, 1972 35.82 730.0
3 384,000
March 1, 1902 35.42 729.6
3 387,000
April 27, 1937 35.12 729.3
3 351,000
January 20, 1996 34.62 728.83 * January 26, 1937 34.52 728.73 338,000 March 19, 1865 34.4
2 728.6
3 370,000
September 28, 1861 34.32 728.5
3 369,000
February 18, 1891 34.32 728.5
3 369,000
January 9, 1913 34.32 728.5
3 369,000
1Flood stage = 25.0 feet
2Stages prior to operation of all upstream dams
3Gage zero elevation = 694.2 feet, NGVD 29.
4Stages after operation of all presently operating dams
*Data not computed
The following tabulations list the most significant floods of record for the Allegheny River at Lock and Dam No. 2 (at Pittsburgh, River Mile 6.7), Lock and Dam No. 3 (at Acmetonia, River Mile 14.5), and Lock and Dam No. 4 (at Natrona, River Mile 24.2), showing the crest stages and elevations that were actually experienced. The recurrence interval at Lock and Dam Nos. 2 and 3 is based on data recorded at Pittsburgh and reflects the natural frequency of each flood, assuming no reductions from any flood control projects; however, the June 1972 crest was estimated to be about 12.1 feet lower than it would have been without the 9 upstream flood-control projects (Reference 5).

29
ALLEGHENY RIVER AT LOCK AND DAM NO. 2
Date
Stage1
(feet)
Elevation
(feet)
Discharge2
(cfs)
Recurrence
Interval
(years) March 18, 1936 38.2
3 748.1
4 360,500 150
December 30, 1942 29.03 738.9
4 251,000 30
January 22, 1959 25.33 735.2
4 224,000 8
March 10, 1964 26.33 736.2
4 218,700 20
January 25, 1937 26.83 736.7
4 214,000 9
April 26, 1937 26.93 736.8
4 210,000 9
March 7, 1945 25.73 735.6
4 207,000 10
June 23, 1972 27.33 737.2
4 207,000 300
January 20, 1996 22.95 734.9
6 * *
March 31, 1940 23.03 732.9
4 187,000 2
January 27, 1952 24.43 733.3
4 185,000 6
March 9, 1956 22.33 732.2
4 179,000 4
1Stage heights may be slightly higher for lower discharges on the Allegheny River due to the backwater effects from coincident flows on the Monongahela River
2Discharges are computed at Lock and Dam No. 4
3Flood stage (upper gage) = 23.0 feet
4Upper gage zero elevation = 709.85 feet
5Flood stage (upper gage) = 20.85 feet
6Upper gage zero elevation = 712.0 feet
*Data not computed
ALLEGHENY RIVER AT LOCK AND DAM NO. 3
Date Stage (feet)
Elevation1
(feet) Discharge
2
(cfs)
Recurrence Interval (years)
March 18, 1936 33.9
3 756.6
4 360,500 1,000
December 30, 1942 26.13 748.8
4 251,000 100
January 22, 1959 23.93 746.6
4 224,000 50
March 10, 1964 24.23 746.9
4 218,700 45
January 25, 1937 24.33 747.0
4 214,000 35
April 26, 1937 24.43 747.1
4 210,000 *
March 7, 1945 23.53 746.2
4 207,000 *
June 23, 1972 23.73 746.4
4 207,000 30
January 20, 1996 19.15
744.96 * *
March 31, 1940 22.03 744.7
4 187,000 *
January 27, 1952 22.03 744.7
4 185,000 *
March 9, 1956 21.73 744.4
4 179,000 *
1At Borough of Cheswick
2Discharges are computed at Lock and Dam No. 4
3Flood stage (upper gage) = 20.0 feet

30
4Upper gage zero elevation = 722.72 feet
5Flood Stage (upper gage) = 16.92 feet
6Upper gage zero elevation = 725.8 feet
*Data not available
ALLEGHENY RIVER AT LOCK AND DAM NO. 4
Date Stage (feet)
Elevation1
(feet) Discharge
2
(cfs)
Recurrence Interval (years)
March 17, 1936 34.0
3,4 770.7
4 360,500 1,000
December 30, 1942 27.73 764.4
4 251,000 100
January 22, 1959 26.03 762.7
4 224,000 50
March 10, 1964 25.73 762.4
4 218,700 45
January 25, 1937 25.33 762.0
4 214,000 35
April 26, 1937 25.13 761.8
4 210,000 *
March 7, 1945 25.03 761.7
4 207,000 *
June 23, 1972 25.03 761.7
4 207,000 30
March 31, 1940 23.63 760.3
4 187,000 *
January 27, 1952 23.43 760.1
4 185,000 *
March 9, 1956 23.03 759.7
4 179,000 *
January 20, 1996 23.15 759.5
6 * *
1At Township of East Deer
2Discharges are computed at Lock and Dam No. 4
3Flood stage (upper gage) = 20.0 feet
4Upper gage zero elevation = 722.72 feet
5Flood stage (upper gage) = 20.3 feet
6Upper gage zero elevation = 736.4 feet
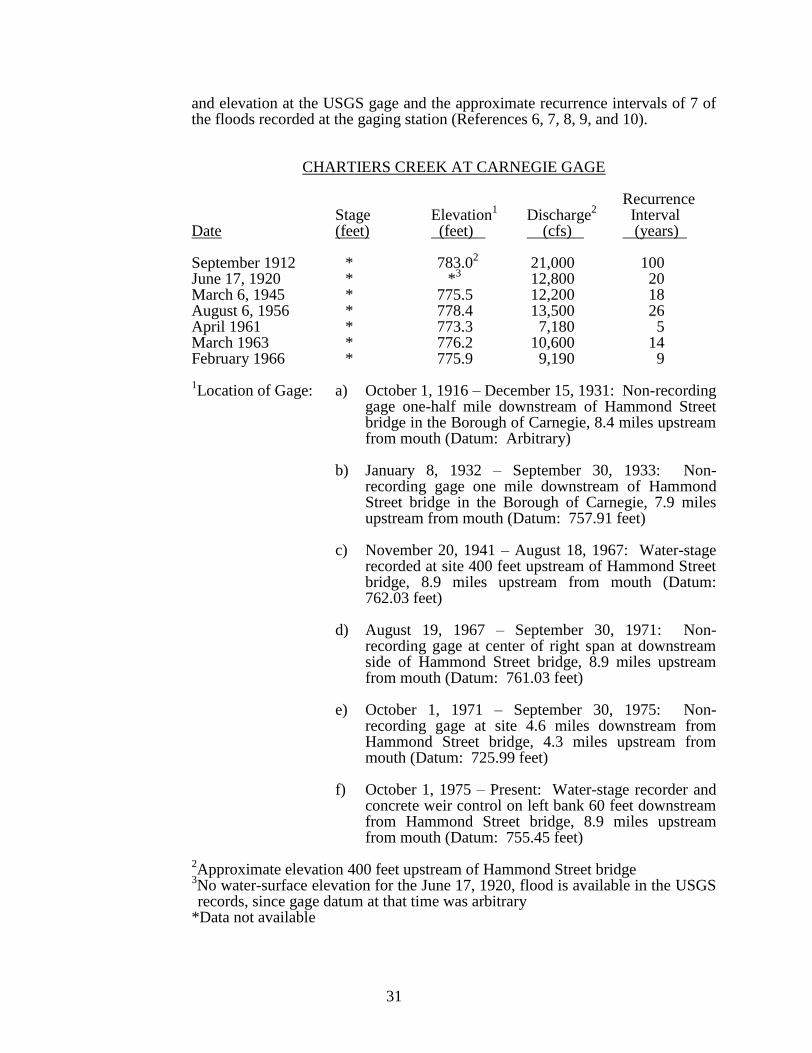
*Data not available Jacks Island, adjacent to the Township of Harrison; Twelvemile Island, located in the Township of Harmar; Sycamore Island, located in the Township of O’Hara; Ninemile Island, located in the Municipality of Penn Hills; Sixmile Island, located in the Borough of Sharpsburg; and Herrs Island, located in the City of Pittsburgh are the only potential obstructions to flow on the Allegheny River. Neville Island, located in the Township of Neville; Davis Island, located in the Township of Stowe; and Brunot Island, located in the City of Pittsburgh are the only potential obstructions to flow on the Ohio River. Major floods occurred on Chartiers Creek in 1912, 1915, 1920, 1922, 1936, 1945, 1956, 1961, 1963, and 1966. The flood of record occurred in September 1912 and was estimated by high-water mark comparison by the USACE to have a flow of 21,000 cfs. Since 1916, discharges on Chartiers Creek have been recorded at the U.S. Geological Survey (USGS) gaging station located in Carnegie. The largest discharges recorded at the gaging station were on June 17, 1920; March 6, 1945; and August 6, 1956. The following tabulation shows the peak discharges
31
and elevation at the USGS gage and the approximate recurrence intervals of 7 of the floods recorded at the gaging station (References 6, 7, 8, 9, and 10).
CHARTIERS CREEK AT CARNEGIE GAGE
Recurrence Stage Elevation
1 Discharge
2 Interval
Date (feet) (feet) (cfs) (years) September 1912 * 783.0
2 21,000 100
June 17, 1920 * *3 12,800 20
March 6, 1945 * 775.5 12,200 18 August 6, 1956 * 778.4 13,500 26 April 1961 * 773.3 7,180 5 March 1963 * 776.2 10,600 14 February 1966 * 775.9 9,190 9 1Location of Gage: a) October 1, 1916 – December 15, 1931: Non-recording
gage one-half mile downstream of Hammond Street bridge in the Borough of Carnegie, 8.4 miles upstream from mouth (Datum: Arbitrary)
b) January 8, 1932 – September 30, 1933: Non-
recording gage one mile downstream of Hammond Street bridge in the Borough of Carnegie, 7.9 miles upstream from mouth (Datum: 757.91 feet)
c) November 20, 1941 – August 18, 1967: Water-stage
recorded at site 400 feet upstream of Hammond Street bridge, 8.9 miles upstream from mouth (Datum: 762.03 feet)
d) August 19, 1967 – September 30, 1971: Non-
recording gage at center of right span at downstream side of Hammond Street bridge, 8.9 miles upstream from mouth (Datum: 761.03 feet)
e) October 1, 1971 – September 30, 1975: Non-
recording gage at site 4.6 miles downstream from Hammond Street bridge, 4.3 miles upstream from mouth (Datum: 725.99 feet)
f) October 1, 1975 – Present: Water-stage recorder and
concrete weir control on left bank 60 feet downstream from Hammond Street bridge, 8.9 miles upstream from mouth (Datum: 755.45 feet)
2Approximate elevation 400 feet upstream of Hammond Street bridge
3No water-surface elevation for the June 17, 1920, flood is available in the USGS records, since gage datum at that time was arbitrary
*Data not available

32
The following tabulation shows major floods of record on the Monongahela River as measured at Lock and Dam No. 2 lower gage located in the Borough of Braddock, river mile 11.2, and Lock and Dam No. 3 located just upstream of the Borough of West Elizabeth, at river mile 23.8.
MONONGAHELA RIVER AT LOCK AND DAM NO. 2
Recurrence Stage Elevation Discharge Interval Date (feet) (feet) (cfs) (years) March 1936 * * 210,000 60 March 16, 1936 46.0 745.3 200,000 * June 24, 1972 40.8 738.8
1 180,000 20
October 16, 1954 41.7 735.72 204,000 40
December 30, 1942 36.3 735.62 150,000 *
November 6, 1985 41.3 735.31 208,000 *
June 5, 1941 35.7 735.02 201,000 40
April 27, 1937 34.6 733.9 166,000 * March 7, 1967 39.2 733.2
1 178,000 *
October 29, 1937 33.6 732.9 182,000 * March 7, 1945 33.5 732.8
2 138,000 *
August 6, 1956 38.6 732.62 105,000 *
Note: Zero datum at the lower gage was 699.25 feet until November 1951 Zero datum at the lower gage was 694.0 feet from November 1951 to November 1967 Zero datum at the lower gage was 698.0 feet from November 1967 to October 1988 Zero datum at the lower gage was 694.0 feet from October 1988 to present Lower gage heights are affected by backwater from the Ohio River at Pittsburgh 1Actual elevations are modified by present reservoir system
2Actual elevations are modified by existing reservoirs at time of flood
*Data not available

33
MONONGAHELA RIVER AT LOCK AND DAM NO. 3
Recurrence Stage
1 Elevation Discharge Interval
Date (feet) (feet) (cfs) (years) March 18, 1936 32.5
2 750.8
3 153,000
4 23
5
June 23, 1972 29.02 746.9
3 137,000 11
October 16, 1954 28.52 746.4
3 141,000 14
March 7, 1967 28.32 746.2
3 158,000 30
June 5, 1941 27.92 745.8
3 143,000 15
March 5, 1963 26.52 744.4
3 154,000 25
August 6, 1956 26.12 744.0
3 133,000 10
October 29, 1937 25.92 743.8
3 130,500 9
5
May 25, 1968 25.62 743.5
3 127,000 7
March 25, 1936 25.02 742.9
3 133,000 10
4
December 30, 1942 24.82 742.7
3 111,000 4
1Stages prior to November 1967 were adjusted to present gage zero
2Upper gage zero elevation = 717.9 feet
3Flood stage (upper gage) = 20.0 feet
4Before construction of Tygart Dam and lake
5Recurrence intervals for floods occurring prior to flood control measures
Ice jams and/or debris collection at hydraulic structures often aggravate flooding along the Monongahela River. The following tabulations list major floods experienced on the Ohio River.
OHIO RIVER AT EMSWORTH
Recurrence Stage Elevation Discharge Interval Date (feet) (feet) (cfs) (years) March 19, 1936 44.4
1 723.0
2 557,000 150
December 31, 1942 37.31 715.9
2 396,000
3 30
June 23, 1972 34.41 713.0
2 372,000
3 230
April 27, 1937 34.01 712.6
2 351,000 10
March 7, 1945 33.51 712.1
2 343,000
3 11
January 26, 1937 32.91 711.5
2 338,000 9
October 16, 1954 32.81 711.4
2 327,000
3 45
March 11, 1964 31.41 710.0
2 313,000
3 20
January 23, 1937 31.01 709.6
2 310,000 6
January 28, 1952 30.41 709.0
2 283,000
3 6
January 23, 1959 30.21 708.8
2 275,000
3 8
1Flood stage (upper gage) = 26.0 feet
2Upper gage zero elevation = 678.6 feet
3Discharges affected by flood control project

34
OHIO RIVER AT EMSWORTH
Recurrence Stage
1 Elevation
2 Discharge Interval
Date (feet) (feet) (cfs) (years) March 19, 1936 43.0 723.0 557,000 150 December 31, 1942 35.9 715.9 396,000
3 30
June 23, 1972 33.0 713.0 372,000 230 April 27, 1937 32.6 712.6 351,000 10 March 7, 1945 32.1 712.1 343,000 11 January 26, 1937 31.5 711.5 338,000
3 9
October 16, 1954 31.4 711.4 327,0003 45
March 11, 1964 30.0 710.0 313,0003 20
January 23, 1937 31.0 709.8 310,000 6 January 28, 1952 29.0 709.0 283,000
3 7
January 23, 1959 28.8 708.8 275,000 8 1Flood stage (upper gage) = 24.6 feet
2Upper gage zero elevation = 680.0 feet
3Discharges affected by flood control projects
OHIO RIVER AT PITTSBURGH GAGE
Recurrence Stage
1 Elevation
2 Discharge Interval
Date (feet) (feet) (cfs) (years) March 18, 1936 46.0
3 740.2 557,000 *
March 15, 1907 38.53 732.7 440,000 *
December 31, 1942 36.63 730.8 396,000 *
February 6, 1884 36.33 730.5 403,000 *
June 23, 1972 35.83 730.0 384,000 *
March 1, 1902 35.44 729.6 387,000 *
April 27, 1937 35.13 729.3 351,000 *
January 26, 1937 34.53 728.7 338,000 *
March 19, 1865 34.43 728.6 370,000 *
September 28, 1851 34.33 728.5 369,000 *
February 18, 1891 34.33 728.5 369,000 *
January 9, 1913 34.33 728.5 369,000 *
1Flood stage = 25.0 feet
2Gage zero elevation = 694.2 feet
3Stages prior to the operation of all the upstream dams
4Stage after the operation of all presently operating upstream dams
*Data not available The following tabulation lists the five largest floods on record for Turtle Creek.

35
TURTLE CREEK AT EAST PITTSBURGH GAGE
Recurrence Stage Elevation
1 Discharge Interval
2
Date (feet) (feet) (cfs) (years) December 30, 1942 * 739.5 9,100 10 May 27, 1946 * 738.6 8,200 8 August 3, 1958 * 735.3 10,500 15 October 15, 1954 * 741.8 12,300 30 June 23, 1972 * 737.1 13,200 45 1Crest elevations at Cable Avenue (initial damage stage 735.0 feet)
2Determined by flow comparison
*Data not available
Flooding from the Youghiogheny River can occur at any time during the year. From December to April, it is usually the result of snowmelt or spring rains. Flooding from summer storms is also a frequent occurrence on the river. River flooding usually has a duration of several days (Reference 6). There were three major floods on the Youghiogheny River: March 1936, October 1954, and June 1972. The October 1954 flood was the largest, with a recurrence interval of approximately 100 years and a discharge of 108,000 cfs. The March 1936 flood was approximately a 60-year flood with a discharge of 100,000 cfs. The June 1972 flood had a recurrence interval of approximately 30 years and a discharge of 91,500 cfs. These recurrence intervals are based on the log-Pearson Type III flow-frequency analysis of the flow records at the Sutersville gage, located approximately 12 miles upstream. The actual flow of the 1936 flood was compared to the flow-frequency analysis of the presently regulated watershed. High-water marks for the three major floods of the Youghiogheny River in the Borough of Liberty are as follows: March 1936 downstream corporate limits, 748.9 feet, upstream corporate limits, 750.3 feet; October 1954 downstream corporate limits, 744.8 feet, upstream corporate limits 747.6 feet; and June 1972 downstream corporate limits, 744.4 feet, upstream corporate limits, 746.7 feet. High-water marks in the Borough of Port View are as follows: March 1936 downstream corporate limits, 747.6 feet, upstream corporate limits, 748.9 feet; October 1954 downstream corporate limits, 742.5 feet, upstream corporate limits 744.8 feet; and June 1972 downstream corporate limits, 742.8 feet, upstream corporate limits, 744.4 feet (References 6 and 11). Small streams, such as the following, are sensitive to short storms of high intensity: Abers Creek, Campbells Run, Georges Run, Gourdhead Run, Humms Run, Little Plum Creek, Long Run, Montour Run, Moon Run, Painters Run, Plum Creek, Pucketa Creek, Sandy Creek, Scrubgrass Run, Whiskey Run, and their tributaries. These storms generally occur during the summer months and may result in overbank flooding along the entire stream. Occasionally, erratic hurricane movement such as that associated with Tropical Storm Agnes, can cause flooding. Local flooding conditions may be worsened by channel constrictions caused by debris, ice, or man-made structures.
36
Becks Run has overflowed its banks during heavy storms upstream of the Bajo Street bridge in the Borough of Baldwin. Several commercial and residential structures have been affected. Becks Run also affects some residential structures below Bajo Street near the terminus of Somerset Street. Floods on Big Sewickley Creek are caused primarily by high-intensity storms of short duration. As a result of the short period of record, the only flood on record at the Big Sewickley Creek gage occurred in 1975. The flood had a discharge of 2,540 cfs and a recurrence interval of approximately 10 years. The flood of June 30, 1974, is the highest known flood to occur on Bull Creek, and caused considerable damage through the basin in the Township of Fawn. Several high-water marks were obtained from this flood. Damage from Bull Creek in the Township of Harrison is relatively minor. Debris clogging in a bridge about a half mile downstream, in the Borough of Tarentum, can cause higher flood elevations in the Township of Harrison. Damage from overflow from Chalfant Run occurs mainly near its confluence with Thompson Run. The Pennsylvania Department of Environmental Resources has issued a survey which includes damages caused by flooding from Chalfant Run during the flood of August 1956 (Reference 8). Eighteen residences were affected, and the total damage was $27,300 (1969 dollars). Also, hazardous velocities degrade channel banks, especially along several commercial establishments upstream of Baker Street. On Crooked Run, the worst flood in recent years took place in 1956. Many houses along the stream were heavily damaged by the floodwaters. Crooked Run floods periodically as a result of heavy rains, and these floods can be expected to increase in frequency and severity, because the channel area is gradually being reduced by siltation. Crooked Run flows through a storm culvert along 5
th
Avenue, in the City of McKeesport, from its inlet at the intersection of Lincoln Way and 5
th Avenue to its outlet at the Monongahela River. The entrance to this
culvert frequently clogs with debris during storms and, as a result, the flood waters flow down 5
th Avenue instead of entering the culvert. This creates a sheet
flow problem along 5th
Avenue. High-water marks provided by the USACE on Crouse Run indicate that the July 1974 flood had approximately a 50-year recurrence interval on Crouse Run. Davis Run enters a culvert at the upstream side of Ohio River Boulevard (State Route 65) in the Borough of Osborne, between McKown Avenue and the Osborne-Sewickley corporate limits, and flows through it to the Ohio River. As a result of the small size of its opening under Ohio River Boulevard (State Route 65), this culvert clogs easily with debris. The highest known flood on Deer Creek, West Branch Deer Creek, and Little Deer Creek occurred on June 30, 1974. According to several high-water marks obtained from this flood, the estimated recurrence interval was approximately 50 years. Another high flood in the Deer Creek basin occurred on October 16, 1954.

37
Flooding on Dirty Camp Run has occurred periodically. The primary problems include basement flooding of approximately 30 commercial buildings and approximately 50 residential properties in the Borough of Pitcairn. The highest known flood for Girty’s Run and Lowries Run occurred in July 1950. The flood was caused by the saturation of ground by preceding rains and the downpour of a storm on the day of the flood (Reference 4). At that time, the discharge recorded for Girty’s Run was 6,900 cfs. Damages along Lowries Run occurred mainly to basements, garages, vehicles, and livestock. No high-water marks are available for Lowries Run. The Township of Hampton experienced one of its first major floods on August 13, 1896, when five people were killed by flooding from Gourdhead Run. Destruction was largely caused by the narrowness of the valley in the area where the Old State Route 8 bridge is now located (Reference 12). The floodplain, because of the construction of the highway, bridges, and buildings, has been altered significantly since this flood. In the Township of Reserve, Hoffman Run and Spring Garden Run flow through many culverts, some of which constrict flow due to siltation and lack of regular maintenance. Flooding in the streets has occurred many times during periods of intense rainfall. The most recent occurrence of flooding was on February 24, 1975. Spring Garden Road was closed due to flooding, and many homes had flooded basements. Except for a few scattered residences and residential concentrations, development in the floodplains of Lick Run and Lobbs Run has been minimal in the Borough of Jefferson, resulting in only minor flood problems in the past. There is, however, considerable development along Lewis Run. Damages along this stream could be fairly heavy in the event of a severe flood. The other streams in the borough generally have drainage areas less than five square miles and therefore present only minor flood problems. Except for a few scattered residences and residential concentrations, development in the floodplains of Lick Run and Lobbs Run has been minimal in the Borough of Jefferson, resulting in only minor flood problems in the past. There is, however, considerable development along Lewis Run. Damages along this stream could be fairly heavy in the event of a severe flood. The other streams in the borough generally have drainage areas less than five square miles and therefore present only minor flood problems. The Norfolk and Western Railway culvert causes considerable constriction of the flow on Lick Run in the Borough of Baldwin. This constriction creates serious backwater effects on both Lick Run and Lick Run Tributary upstream of the railroad. Lick Run has also flooded the area immediately downstream of the railroad culvert between Curry Road and Sixth Avenue extending south to North Way. Residential structures on both sides of Sixth Avenue in this area have experienced flooding problems (Reference 13).

38
Flooding on Little Bull Creek has occurred in October 1954, during Hurricane Hazel, and in July 1974. Although no detailed high-water marks were available for the 1954 flood, local residents stated that the depth of flow was approximately 8 feet, which is approximately bank-full flow (Reference 14). The USACE provided a detailed list of high-water marks on the July 1974 flood. According to these high-water marks, the flood has approximately a 35-year return. Floodplain development has increased the elevations of large floods in the Birdville section of Little Bull Creek. In the Borough of Bridgeville and the Township of Upper St. Clair, there are no high-water marks on McLaughlin Run for the September 1912 or August 1956 floods. It is probable that backwater flooding from Chartiers Creek was responsible for considerable damage along McLaughlin Run. The most recent flood on McLaughlin Run occurred on August 18, 1980. The flood caused some damage to the community and was the result of a short duration, high-intensity storm with rainfall of approximately 3 inches. There is also no high-water information pertaining to this flood. Major floods occurred on Peters Creek in September 1912, July 1943, October 1954, August 1956, and March 1963. Accurate records for these floods are not available. The August 1969 flood had a recorded discharge of 4,400 cfs and an estimated recurrence interval of 10 years (Reference 15). High-water marks for the August 1969 flood on Peters Creek were recorded at the CONRAIL bridge (739.0 feet), the Ravensburg Boulevard bridge (742.8 feet), and the downstream Borough of Jefferson corporate limits (743.2 feet) (Reference 15). Flood damages have been relatively minimal as very little development has occurred within the floodplain (Reference 15). The constrictive nature of the railroad culvert located just downstream from the State Route 837 bridge results in storage of part of the flood flow in the channel and overbank areas upstream of the culvert. During a flood with a recurrence interval of 100 years or more, flood elevations in this area could reach as high as 758 feet (Reference 15). However, since development in this area has been minimal, damages occurring as a result of such a flood would be relatively minor. Flooding on Pine Creek occurred in June 1972 during Tropical Storm Agnes, and in July 1974. The July 1974 flood is estimated to be a 10-year flood, according to high-water marks provided by the USACE. The majority of flooding along Little Pine Creek East has occurred in the area of the confluence with Pine Creek. Minimal flooding in recent years has occurred on Girty’s Run and Little Pine Creek West. According to residents in the Township of Shaler, damage is to contents rather than structures. The Penn Hills Community Park, located along Plum Creek, was inundated during Tropical Storm Agnes. Other locations along Plum Creek were also damaged by this flood. Tropical Storm Agnes also caused flooding on Sandy Creek. The bridge for the James Volk Water Pollution Control Plant was overtopped. Sandy Creek Road between the bridge and Allegheny River Boulevard (State Route 130) was inundated.

39
Backwater flooding from large flows on the Allegheny River has affected the downstream reaches of Plum Creek. The storms producing the high river flows, however, do not necessarily cause flooding in the upper portions of Plum Creek. The downstream reach of Pucketa Creek is also subject to backwater flooding from the Allegheny River. Floods on Plum Creek or Pucketa Creek are not systematically recorded. However, high-water marks at 16 locations along Pucketa Creek, for the June 30, 1974, flood were measured by the Pittsburgh District of the USACE. This flood was caused by a localized convection storm. Precipitation for this storm, measured at Pittsburgh, totaled 1.47 inches in three hours. Based on the high-water marks and the results of this study, the discharge was estimated to be 4,500 cfs which corresponds to a recurrence interval of approximately 50 years. Flooding on Robinson Run occurred on August 18, 1980. Several high-water marks obtained from this flood indicate it may have been greater than a 10-year flood. Based on high-water data for the Borough of Oakdale, the highest flood on Robinson Run probably occurred in June 1904. Other floods on Robinson Run occurred in July and September 1912, June 1928, and August 1956. There are no high-water data available for Montour Run and its tributaries. According to local residents, however, the highest known flood was that of either July 1943 or July 1950. It is probable that flooding occurred on Montour Run during flooding on Robinson Run. Several culverts located under commercial establishments on Sawmill Run can clog with debris, causing flow onto Allegheny River Boulevard (State Route 130), which runs along the stream for most of its length. Hazardous velocities caused by the extremely steep bottom slope of this mountain stream cause rapid deterioration during high flow of the channel banks along parts of the stream. Bank degradation is especially significant along Wilbur Avenue near the downstream boundary of the Township of Wilkins. In May 1950, a flood flow was recorded for Streets Run. This was the only flow ever recorded for that stream and its recurrence interval was less than one in 10 years (Reference 6). The area near the intersection of Streets Run Road and Brentwood Road is susceptible to flooding from Streets Run in the Borough of Baldwin. There are several commercial and residential structures there that have been affected by flooding. Downstream of this area, to the City of Pittsburgh corporate limits, floods have also flowed out-of-banks. Although the stream is out of the Borough of Baldwin’s corporate limits in part of this area, the floodplain is wide enough that it extends into the borough (Reference 10). A tributary to Streets Run that originates in Elm Leaf Park and flows in an easterly direction frequently causes problems at the culverts under CSX Transportation and Streets Run Road. Logs, brush, and debris swept downstream from Elm Leaf Park often block up these two culverts and cause both the railroad tracks and Streets Run Road to be inundated. The stream along Brentwood Road that flows easterly to Streets Run occasionally causes problems at the Brentwood Road bridge. The opening to that bridge is sufficiently constricting to cause backup behind the bridge and sheet flooding on Brentwood Road and adjacent areas below the bridge (Reference 13).

40
The major flooding problem on Thompson Run occurs in the vicinity of the wastewater treatment plant on the upstream side of the CONRAIL tracks. During the flood of June 1972, high flows on the Monongahela River contributed to significant backwater effects on Thompson Run and flooding of the treatment plant. The water-surface elevation during June 1972 was approximately 741 feet at the wastewater plant and there was severe stream bank erosion and inundation of the area around the plant; a monetary estimate of damages is not available. Flooding in the Municipality of Bethel Park is caused primarily by local, intense, spring and summer thunderstorms. The steep slopes and high degree of urbanization which characterize the area, allow for rapid runoff from these thunderstorms. The resultant flash flooding is compounded by some inadequate storm drainage systems. Debris blockage of small culverts, catch basins, and stream channels causes some impoundment. While these flash floods can cause high channel velocities with resulting scour and bank erosion, the major problems are property and basement flooding (Reference 16). Flooding damage in Bethel Park is usually minor although widespread. It primarily affects landscape and basement contents rather than structures and roadways. Principal flood problems in the Borough of Coraopolis are caused by overbank flooding from the Ohio River, Montour Run, and McCabe Run, inadequate drainage of McCabe Run Tributary at Maple Street, and storm sewer backup in the low-lying areas. Throughout the Township of Marshall, local intense summer thunderstorms can cause occasional flash floods. The accompanying high channel velocities result in scouring and erosion. Overbank flooding is primarily the result of debris blockage of the bridge openings and constrictive culverts. The ponding areas created behind these obstructions and floodwaters are usually shallow and can affect areas normally not subject to flooding. This type of flooding affects shallow property and results in basement flooding. Damages from this type of flooding tend to be to property and contents, rather than structural damages. According to local residents, areas prone to this type of flooding are along Brush Creek 2 at Northgate Drive, along Big Sewickley Creek at Warrendale and Ambridge Road, and along Dutihl Road. In general, watersheds of the Municipality of Monroeville have experienced flood flows which have been increased because of development or denudation in their watersheds. The principal flood problem in the Townships of Ohio and Ross is the potential for flash flooding. Flooding is not systematically recorded on Montour Run, Moon Run, Campbells Run, or the smaller streams within the Township of Robinson. However, a flow of 1,170 cfs in July 1974 was recorded by the USGS for Campbells Run through high-water mark comparison (Reference 7). This discharge corresponds to a recurrence interval of approximately 10 years. A discharge measurement

41
of,4,500 cfs was also recorded on Montour Run near Coraopolis on July 5, 1950 (Reference 6). This corresponds to a recurrence interval of approximately five years. The Borough of Turtle Creek has a history of recorded flooding dating from the early 1900s. The clearing of land because of coal mining, manufacturing, and home-building in the area caused increased storm runoff and siltation of the stream channels. Each spring, the melting of snow and ice combined with heavy rains caused streams to top their banks and flood businesses, industries, and nearby residences. In the spring of 1907, a devastating flood inundated the entire valley, causing extensive flood damages (Reference 17). In March 1936, the worst flood in the history of the Borough of Turtle Creek occurred, resulting in damages estimated at $329,000 (1969 dollars) (Reference 11). Another serious flood occurred in October 1954.
The current effective study provided description of historic flood events up to the
year 1980. This section provides descriptions of major floods since 1980. There
were several flooding occurrences including January 1996, September 2004, and
June 2009 with flash flooding and property damages. In recent years flooding
has been reported on Bull Creek, Big Sewickley Creek, Brush Creek, Catfish
Run, Chartiers Creek, Deer Creek, Fall Run, Flaugherty Run, Girtys Run,
Lowries Run, McLaughlin Run, Little Pine Creek and Pine Creek, Plum Creek,
Sawmill Run, Flaugherty Run, Piney Fork, Thompson Run and Thorn Run.
Flaugherty Run and Thorn Run reported 12 large storm events in last 17 years.
High flow events were observed on Chartiers Creek in November 1985, July
1990, January 1994, September 2004 and January 2005. In September 2004 the
highest recorded peak discharge of 27,400 cfs was seen on Chartiers Creek.
On the Youghiogheny River at Sutersville, Pennsylvania the high flooding
occurrence was recorded on January 1996. High flood events were recorded on
Monongahela River at Elizabeth, Pennsylvania and Braddock, Pennsylvania in
January 1986, January 1996 and February 2000.
The USGS gaging station on Little Pine Creek near Etna, Pennsylvania reported
high flooding events in May 1986 and September 2004. In May 1986 the highest
peak discharge recorded on Little Pine Creek was 7,190 cfs.
At the USGS gaging station on the Allegheny River near Natorna, Pennsylvania
high flooding events were recorded in January 1996 and September 2004. Along
the Ohio River September 2004 was one of the highest flow events in recent
years.
There was also flooding in June 2009 flooding along Chalfont Run, Sawmill Run
and Thompson Run which caused flooding damages in Wilkins Township.

42
2.4 Flood Protection Measures
There are twelve upstream flood-control dams and reservoirs operated by the USACE that are effective in reducing flood levels in Allegheny County. Nine of these are in the Allegheny River basin and three are in the Monongahela River basin. Table-5 below, “Flood Control Dams and Reservoirs,” presents pertinent data for the dams and reservoirs.
TABLE 5 - FLOOD CONTROL DAMS AND RESERVOIRS Miles Upstream Drainage Area Date Placed Dam and Reservoir From Pittsburgh (sq. miles) in Operation ALLEGHENY RIVER BASIN Crooked Creek Dam, Crooked Creek Lake 47 277 June 1940 Tionesta Creek Dam, Tionesta Lake 152 478 December 1940 Mahoning Creek Dam, Mahoning Creek Lake 79 340 June 1941 Loyalhanna Creek Dam, Loyalhanna Creek Lake 62 290 June 1942 East Branch Dam, East Branch Clarion River Lake 190 72 June 1952 Conemaugh River Dam, Conemaugh River Lake 65 1,351 November 1953 Kinzua Dam, Allegheny Reservoir 198 2,180 January 1967 Union City Dam, Union City Reservoir 197 222 October 1970 Woodcock Dam, Woodcock Creek Lake 165 46 February 1974 MONONGAHELA RIVER BASIN Tygart Dam, Tygart River Lake 152 1,184 February 1938 Youghiogheny River Dam, Youghiogheny River Lake 90 434 March 1948 Stonewall Jackson Dam, Stonewall Jackson Lake 203 102 January 1990
Flood impoundments in the Allegheny River Basin reduce major flood peaks on the Allegheny River at Natrona (Locks and Dam No. 4) by an average of 4 to 8 feet. Together, the dams in the Allegheny River Basin control approximately 5,250 square miles of drainage area or about 45% of the total watershed. These flood impoundments plus those in the Monongahela River Basin reduce major flood peaks at Pittsburgh by an average of 5 to 8 feet. At Monongahela River Lock and Dam No. 2, the Monongahela Reservoirs provide an average reduction of approximately 4 to 5 feet. During the flood of June 23, 1972, this system of

43
reservoirs reduced the flood crest at Pittsburgh by 12.1 feet, preventing a flood almost 2 feet higher than the flood of March 1936, the highest on record. The effects of the flood flows in the lower part of Becks Run are lessened due to the concrete-lined channel between cross sections A and B. Although this channel has a significant amount of sedimentation in it, it is still sufficient to contain even the most severe flood flow within its walls. The advantages of this channel are somewhat lessened, however, due to the backwater flooding caused by the Monongahela River. Chalfant Run is periodically dredged in the reach between the Larimer Avenue intersection with Rodi Road and Baker Street in the Township of Wilkins. This has served to deepen the channel and to clear it of debris. Upstream of this section retaining walls have been constructed in the area of the commercial establishments. The Chartiers Creek Flood Protection Project was built by the USACE along Chartiers Creek in the vicinity of Carnegie, Heidelberg, and Bridgeville. Flood protection was provided by widening, deepening, and aligning approximately 59,000 feet of Chartiers Creek, deepening approximately 10,700 feet of Chartiers Creek-Diversion Channel, constructing concrete walls and drop structures, and protecting bank slopes with stone riprap. The project was designed to carry the maximum flood of record which occurred on September 2, 1912, with an estimated peak flow of 20,000 cubic feet per second (cfs). If the project had been constructed prior to the 1912 flood, flood elevations would have been approximately 8.5 feet lower within the portions of the studied streams. The USACE also has installed the Campbells Run flood protection measures as part of the Chartiers Creek Flood Protection Project. In the Borough of Carnegie, a rectangular, concrete channel was constructed from the confluence with Chartiers Creek to the Railroad Street bridge. Upstream of this bridge, to the Morrow Street bridge, the channel sides were riprapped. In 1936 and 1937, the Work Progress Administration constructed retaining walls along the banks of Girty’s Run within the Borough of Millvale. In 1952, the Pennsylvania Department of Environmental Resources (formerly Department of Forest and Waters) dredged Girty’s Run within the Borough of Millvale. Portions of Graesers Run, Piney Fork, and Tributary 1 to Piney Fork were cleaned and repaired in 1974 as a flood protection measure (Reference 16). Lick Run underwent a stream improvement project that was completed in the summer of 1977. The channel was dredged and the overbank areas were altered in the reach of stream below the Norfolk and Western Railway culvert. This project lessened the extent of flooding in the area between Curry Road and Sixth Avenue. The previous edition of the countywide FIS showed a floodwall located on the west bank of the Monongahela River from river mile 19.61 to 20.61. Also, the

44
previous edition of the countywide FIS showed a floodwall located along the west bank of the Monongahela River from mile 12.63 to mile 13.97. U.S. Steel has since informed FEMA that these structures are not levees designed for flood control and they are not shown as protecting from the base flood on this edition of the FIS. A man-made structure that affects the flood flows of Pine Creek is the North Park Lake Dam. This forms a recreation reservoir located in the Town of McCandless near the border with the Township of Hampton. Since it was designed as a recreation reservoir and controls only about 40 percent of the total drainage area, the attenuation, or lessening, effects on the peak flood flows in the Borough of Etna are small; they amount to approximately a 15-percent reduction on each of the floods considered in this study. Near the State Route 28 overpass, Pine Creek has been channelized for several thousand feet. This project included a concrete channel and new bridges in this area. The channel provides an efficient conduit for flood flows, and lessens flood heights in this area considerably. Little Pine Creek West has been periodically dredged to provide a larger channel because of siltation problems that have been experienced. Also, a concrete retaining wall, which reduces bank scour, has been constructed in the Borough of Etna, extending from Dewey Street downstream for several hundred feet. Rapid flood flows on Sawmill Run have necessitated retaining walls at points along the stream to protect the land along the channel. A concrete apron has been constructed near the downstream Township of Wilkins corporate limit at Wilbur Avenue. This serves to reduce channel scour and bank degradation. Also, several debris catches have been constructed to reduce bridge clogging and damage. From October 1962 to November 1967, the USACE constructed the Turtle Creek Flood Protection Project. This project consists of a concrete channel from the mouth at the Monongahela River to a point approximately 860 feet upstream of the bridge to the Borough of Wall and a dredged, uniformly sloped channel from this point to the confluence with Brush Creek. The design flow of the concrete channel is 20,000 cfs while that of the dredged, uniformly sloped channel is 12,300 cfs, the approximate flow of the flood caused by Tropical Storm Hazel. The construction of the concrete channel lowered the flood peak elevation of the design flood for Turtle Creek by approximately 10 feet in the Borough of Wilmerding. Turtle Creek has been periodically dredged in sections downstream of the Municipality of Monroeville; however, these periodic silt removals have had minimal effect on flood levels in Monroeville. In 1974, the Allegheny County Department of Planning and Development issued the Turtle Creek Watershed Erosion and Sedimentation Control Study (Reference

45
19). The buildup of sediments represents a continual problem for the Turtle Creek Valley, and this study was intended to serve as a guide for future actions to control soil erosion and sedimentation. A floodgate is located on Turtle Creek at a point 1.03 miles upstream of its confluence with the Monongahela River. Owned and operated by Westinghouse Corporation, the gate is used to control backwater effects from the Monongahela River. Designed on the 1936 flood and suspended over Turtle Creek and the adjoining access road, the gate, when lowered, has an elevation of 746 feet with 4 feet of freeboard. This enables it to control river backwater effectively up to an elevation of 750 feet. Since the floodgate is used to control river backwater only, it is closed only after the peak discharge on Turtle Creek has passed, and before the Monongahela River peaks. The remaining Turtle Creek flow is then pumped around the gate to reduce its backwater elevations. Flooding problems on Thompson Run have been alleviated by the construction of a concrete channel on the lower reaches of the stream. This channel construction, done in conjunction with the Turtle Creek Flood Protection Project, contains both the 500-year flood from Thompson Run and the 500-year backwater from Turtle Creek. Extensive channel improvements were made on Thompson Run downstream of the Municipality of Monroeville. These improvements, however, will have no effect on flood damage in Monroeville. The Youghiogheny River is regulated by two reservoirs. Deep Creek Reservoir was constructed in 1925 and controls 65 square miles. It is an earthfill embankment, owned and operated by the Pennsylvania Electric Company, used primarily to produce hydroelectric power. In 1948, the USACE built the Youghiogheny River Dam to regulate the upper 434 square miles of the Youghiogheny River. The dam is a rock-faced earth embankment. Its primary use is flood control and low flow augmentation. Together these dams control 28 percent of the watershed upstream of the Borough of Versailles. During the flood of June 1972, these dams reduced the peak flood elevations in the Borough of Versailles by approximately 1 foot. In February 1976, the Municipality of Penn Hills enacted a floodplain management ordinance setting forth an administrative procedure for controlling activities in the floodplain (Reference 20). The ordinance establishes standards and provides for legal enforcement of these standards. The standards set forth in the ordinance cover the types of construction materials to be used in flood-prone areas. The installation of electrical and mechanical systems in flood-prone areas is also regulated. Structures to be placed in flood-prone areas are required to have minimal effect on flow. Potential obstructions to flow and/or debris are prohibited.

46
A flood forecasting and warning system is provided by the National Oceanic and Atmospheric Administration’s (NOAA) National Weather Service and the USACE to monitor weather conditions and flows in the Allegheny River basin. Emergency operations are coordinated through the Allegheny County Civil Defense Office. A streambank restoration and stabilization project was undertaken by Allegheny County on Little Pine Creek East in the Township of Shaler, on Gourdhead Run and Harts Run in the Township of Hampton, and on Little Pine Creek West in the Township of McCandless. Little Pine Creek West Floodwall (Upstream), in the Borough of Etna, has been
provisionally accredited and mapped as providing protection from Little Pine
Creek West for the 1-percent–annual-chance flood event. To maintain
accreditation, the levee owner or community is required to submit documentation
necessary to comply with 44 CFR Section 65.10. Because of the risk of
overtopping or failure of the structure, communities should take proper
precautions to protect lives and minimize damages in these areas, such as issuing
an evacuation plan and encouraging property owners to purchase flood insurance. FEMA specifies that all levees must have a minimum of 3 foot freeboard against 1-percent annual chance flooding to be considered a safe flood protection structure.
3.0 ENGINEERING METHODS
For the flooding sources studied in detail in the county, standard hydrologic and
hydraulic study methods were used to determine the flood hazard data required
for this FIS. Flood events of a magnitude which are expected to be equaled or
exceeded once on the average during any 10-, 50-, 100-, or 500-year period
(recurrence interval) have been selected as having special significance for
floodplain management and for flood insurance rates. These events, commonly
termed the 10-, 50-, 100-, and 500-year floods, have a 10-, 2-, 1-, and 0.2-percent
chance, respectively, of being equaled or exceeded during any year. Although the
recurrence interval represents the long term average period between floods of a
specific magnitude, rare floods could occur at short intervals or even within the
same year. The risk of experiencing a rare flood increases when periods greater
than 1 year are considered. For example, the risk of having a flood which equals
or exceeds the 1-percent annual chance flood (1-percent chance of annual
exceedance) in any 50-year period is approximately 40 percent (4 in 10), and, for
any 90-year period, the risk increases to approximately 60 percent (6 in 10). The
analyses reported herein reflect flooding potentials based on conditions existing
in the county at the time of completion of this FIS. Maps and flood elevations
will be amended periodically to reflect future changes.
3.1 Hydrologic Analyses
Hydrologic analyses were carried out to establish the peak discharge-frequency

47
relationships for each flooding source studied in detail affecting Allegheny,
County.
Information on the methods used to determine peak discharge-frequency
relationships for the streams studied by detailed methods is shown below.
Pre-countywide Analyses
This FIS was prepared by compiling flooding information for communities within
Allegheny County. For approximate and detailed study streams, revised
hydrologic analyses will be prepared as a part of this study however, for streams
which will be redelineated, no hydrologic analysis will be performed.
Each community within Allegheny County, with the exception of the Boroughs of Avalon, Bellevue, Braddock Hills, Bradford Woods, Churchill, Crafton, Forest Hills, Franklin Park, Munhall, North Braddock, Sewickley Heights, Sewickley Hills, Swissvale, Wall, and West View; the Townships of Aleppo, Frazer, Pine, and Richland; and the Municipality of Mt. Lebanon, has a previously printed FIS report. The hydrologic analyses described in those reports have been compiled and are summarized below. For streams that flow through two or more communities, each methodology described applies only to that portion of the stream studied by detailed methods within that particular community. Hydrology for the following streams was developed using the log-Pearson Type III method as outlined by the Water Resources Council’s Bulletins 15, 17, 17A, and 17B (References 16, 21 – 24). Borough of Aspinwall: Allegheny River Borough of Baldwin: Becks Run Borough of Blawnox: Allegheny River Borough of Brackenridge: Allegheny River Borough of Bridgeville: Chartiers Creek, Chartiers Creek -
Diversion Channel Borough of Carnegie: Campbells Run, Chartiers Creek Borough of Cheswick: Allegheny River City of Clairton: Peters Creek Township of Collier: Campbells Run, Chartiers Creek, Chartiers
Creek - Diversion Channel, Robinson Run Township of East Deer: Allegheny River Township of Elizabeth: Boston Hollow Run, Boyds Hollow Run,
Douglass Run, Douglass Run Tributary No. 1, Douglass Run Tributary No. 2, Fallen Timber Run, Gillespie Run, Happy Hollow Run, Pidgeon Hollow Run, Pitt Street Tributary, Wildcat Run, Wylie Run, Youghiogheny River
Borough of Emsworth: Lowries Run

48
Borough of Etna: Allegheny River Township of Hampton: Crouse Run, Crouse Run Tributary Township of Harmar: Allegheny River Township of Harrison: Allegheny River, Bull Creek Borough of Heidelberg: Chartiers Creek Borough of Jefferson: Lewis Run, Lobbs Run, Peters Creek Township of Kennedy: Chartiers Creek, Ohio River Back Channel Township of Kilbuck: Lowries Run Township of Leet: Big Sewickley Creek Borough of Liberty: Youghiogheny River Borough of Lincoln: Wylie Run, Youghiogheny River Town of McCandless: Lowries Run, Whittmer Run Borough of McDonald: Robinson Run City of McKeesport: Crooked Run, Long Run, Youghiogheny
River Borough of McKees Rocks: Chartiers Creek Borough of Millvale: Allegheny River, Girty’s Run Municipality of Monroeville: Abers Creek, Dirty Camp Run, East
Thompson Run, Leak Run, Piersons Run, Turtle Creek, Unnamed Stream along Moss Side Boulevard
Township of North Fayette: North Branch Robinson Run, Robinson Run Township of North Versailles: Crooked Run, Thompson Run, Turtle Creek Borough of Oakdale: North Branch Robinson Run, Robinson Run Borough of Oakmont: Allegheny River Township of O’Hara: Allegheny River Township of Ohio: Lowries Run Municipality of Penn Hills: Allegheny River Borough of Pitcairn: Dirty Camp Run City of Pittsburgh: Allegheny River, Chartiers Creek Borough of Plum: Abers Creek, Allegheny River, Humms Run Borough of Port Vue: Youghiogheny River Township of Robinson: Campbells Run, Chartiers Creek Borough of Rosslyn Farms: Chartiers Creek Township of Scott: Chartiers Creek Township of Shaler: Allegheny River, Girty’s Run Borough of Sharpsburg: Allegheny River Township of South Fayette: Chartiers Creek, Millers Run, Robinson Run Township of South Park: Peters Creek Township of South Versailles: Youghiogheny River Borough of Springdale: Allegheny River Township of Springdale: Allegheny River Borough of Tarentum: Allegheny River Borough of Trafford: Turtle Creek Borough of Turtle Creek: Turtle Creek Township of Upper St. Clair: Chartiers Creek Borough of Verona: Allegheny River Borough of Versailles: Long Run, Youghiogheny River Borough of White Oak: Youghiogheny River

49
Township of Wilkins: Chalfant Run, Sawmill Run Borough of Wilmerding: Turtle Creek Hydrology for the following streams was developed using the regional frequency method PSU III, which assumes flows for the selected recurrence intervals using data obtained from other streams in the same hydrologic region (Reference 25). The flows are then adjusted in accordance with the method outlined in this analysis. PSU III was judged to be the most applicable method to analyze these streams on the basis of the accuracy of its predictions in watersheds of this size. Borough of Baldwin: Streets Run Municipality of Bethel Park: Graesers Run, Piney Fork, Tributary 1 to
Piney Fork Borough of Coraopolis: Montour Run Township of Elizabeth: Boston Hollow Run, Boyds Hollow Run,
Douglass Run, Douglass Run Tributary No. 1, Douglass Run Tributary No. 2, Gillespie Run, Happy Hollow Run, Pidgeon Hollow Run, Pitt Street Tributary, Wildcat Run, Wylie Run
Township of Forward: Fallen Timber Run Borough of Fox Chapel: Squaw Run, Squaw Run Tributary No. 1,
Squaw Run Tributary No. 2, Squaw Run Tributary No. 4
Borough of Lincoln: Wylie Run Borough of Plum: Pucketa Creek Hydrology for the Ohio River was developed using natural discharge-frequency curves developed in accordance with methods presented in a publication by Leo R. Beard, Statistical Methods in Hydrology, in the following communities: Boroughs of Ben Avon, Coraopolis, Edgeworth, Emsworth, Glenfield, Haysville, Leetsdale, McKees Rocks, Osborne, and Sewickley; the Townships of Crescent, Kilbuck, Moon, Neville, and Stowe; and the City of Pittsburgh (Reference 26). For the Ohio River Back Channel, natural discharge-frequency curves were used for the Townships of Kennedy, Neville, Robinson, and Stowe. Hydrology for the following streams was developed using multiple regression formulae for rural watersheds with drainage areas between 0 and 25 square miles (Reference 27). Borough of Bell Acres: Big Sewickley Creek Municipality of Bethel Park: Graesers Run, Piney Fork, Tributary 1 to
Piney Fork Borough of Bridgeville: McLaughlin Run Township of Fawn: Bull Creek, Tributary to Bull Creek Township of Findlay: Montour Run, McClarens Run, North Fork
Montour Run, South Fork Montour Run

50
Township of Harrison: Little Bull Creek Township of Indiana: Little Deer Creek Borough of Jefferson: Lick Run Borough of Leetsdale: Big Sewickley Creek Township of Marshall: Brush Creek 2 Township of North Fayette: Montour Run, South Fork Montour Run Township of North Versailles: Thompson Run Township of Ohio: Bear Run Township of Ross: Girty’s Run, Lowries Run, Rochester Run Township of South Park: Lick Run Borough of Turtle Creek: Thompson Run Township of Upper St. Clair: McLaughlin Run Township of West Deer: Deer Creek, Little Deer Creek, West Branch
Deer Creek Borough of White Oak: Jacks Run, Long Run Township of Wilkins: Thompson Run
Hydrology for the following streams was developed using Technical Release No. 55 (Reference 28). The procedure outlined in this release provides a systematic method for evaluating essential drainage and climatologic data for small watersheds. The variables that this method incorporated include daily rainfall data, soil permeability, degree of urbanization, channel velocity and slope, swampy and ponding areas, and the geometry of the watershed. Borough of Baldwin: Lick Run Municipality of Bethel Park: Graesers Run, Piney Fork, Tributary 1 to
Piney Fork In the Township of Reserve, hydrology for Hoffman Run and Spring Garden Run was developed using the rational method (Reference 29). Hydrology for the following streams was developed using regional flood-flow frequency equations, developed by the USACE (Reference 30). This set of equations relates discharge to drainage area, channel slope, and watershed shape and is applicable to rural watersheds with drainage areas between 0 and 25 square miles. Borough of Green Tree: Whiskey Run Borough of Oakmont: Plum Creek Municipality of Penn Hills: Plum Creek, Sandy Creek City of Pittsburgh: Saw Mill Run Borough of Plum: Little Plum Creek, Plum Creek Township of Robinson: Montour Run, Moon Run, Tributary A Township of Scott: Georges Run, Painters Run, Scrubgrass
Run, Whiskey Run Borough of Verona: Plum Creek
The following standard equation was used to transform the flows from the Abers Creek watershed to predict peak flows for the Becks Run, Big Sewickley Creek,
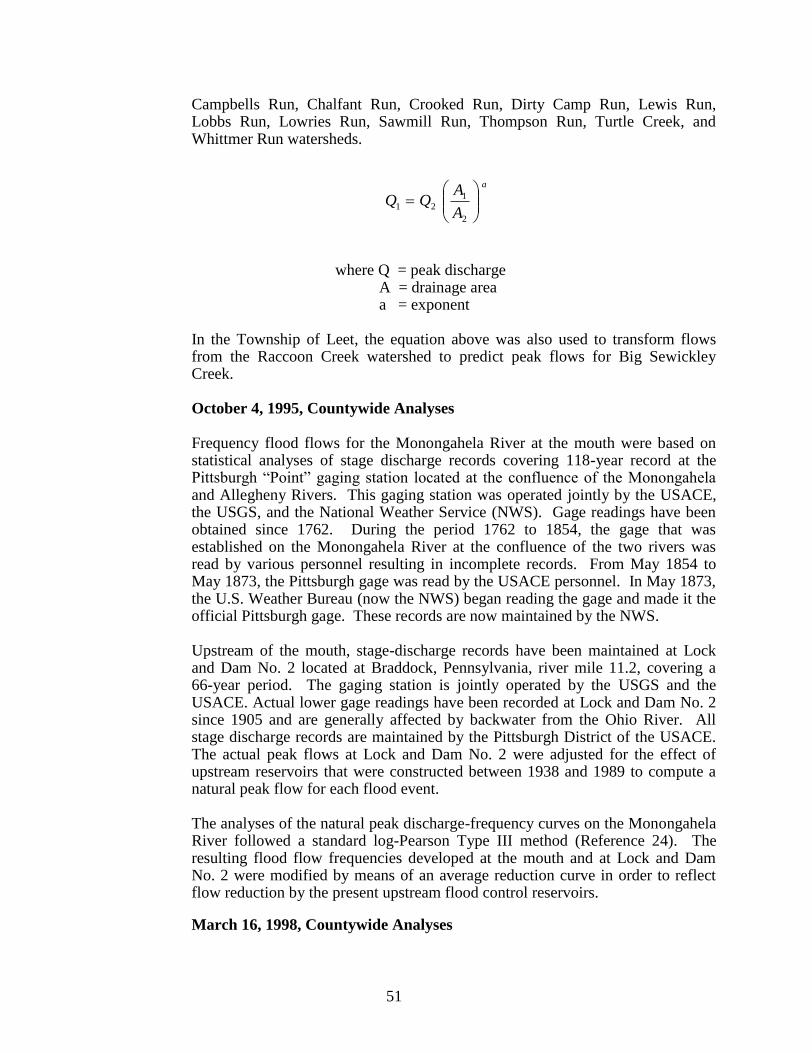
51
Campbells Run, Chalfant Run, Crooked Run, Dirty Camp Run, Lewis Run, Lobbs Run, Lowries Run, Sawmill Run, Thompson Run, Turtle Creek, and Whittmer Run watersheds.
where Q = peak discharge A = drainage area a = exponent In the Township of Leet, the equation above was also used to transform flows from the Raccoon Creek watershed to predict peak flows for Big Sewickley Creek. October 4, 1995, Countywide Analyses
Frequency flood flows for the Monongahela River at the mouth were based on statistical analyses of stage discharge records covering 118-year record at the Pittsburgh “Point” gaging station located at the confluence of the Monongahela and Allegheny Rivers. This gaging station was operated jointly by the USACE, the USGS, and the National Weather Service (NWS). Gage readings have been obtained since 1762. During the period 1762 to 1854, the gage that was established on the Monongahela River at the confluence of the two rivers was read by various personnel resulting in incomplete records. From May 1854 to May 1873, the Pittsburgh gage was read by the USACE personnel. In May 1873, the U.S. Weather Bureau (now the NWS) began reading the gage and made it the official Pittsburgh gage. These records are now maintained by the NWS. Upstream of the mouth, stage-discharge records have been maintained at Lock and Dam No. 2 located at Braddock, Pennsylvania, river mile 11.2, covering a 66-year period. The gaging station is jointly operated by the USGS and the USACE. Actual lower gage readings have been recorded at Lock and Dam No. 2 since 1905 and are generally affected by backwater from the Ohio River. All stage discharge records are maintained by the Pittsburgh District of the USACE. The actual peak flows at Lock and Dam No. 2 were adjusted for the effect of upstream reservoirs that were constructed between 1938 and 1989 to compute a natural peak flow for each flood event. The analyses of the natural peak discharge-frequency curves on the Monongahela River followed a standard log-Pearson Type III method (Reference 24). The resulting flood flow frequencies developed at the mouth and at Lock and Dam No. 2 were modified by means of an average reduction curve in order to reflect flow reduction by the present upstream flood control reservoirs.
March 16, 1998, Countywide Analyses
a
A
AQQ
2
121
52
Hydrology for the following streams was developed using the Penn State Runoff Model (Reference 31). Borough of Etna: Pine Creek, Little Pine Creek West Borough of Franklin Park: Pine Creek Township of Hampton: Pine Creek, Harts Run, Gourdhead Run,
McCaslin Run, Montour Run No. 1 Township of Indiana: Little Pine Creek East Town of McCandless: Pine Creek, Little Pine Creek West Township of O’Hara: Little Pine Creek East Township of Ross: Little Pine Creek West Township of Shaler: Pine Creek, Little Pine Creek East, Little
Pine Creek West
July 5, 2000, Countywide Analyses
The Allegheny River was restudied through water year 1995 for the peak discharge-frequency relationships for the selected recurrence intervals. The flood frequency program was developed by the USACE based on a log-Pearson Type III analysis of the peak flood event partial series flow records. The program follows the methods outlined by the USGS Bulletin 17B (Reference 24). Natural flows were calculated using the Reservoir Reduction Program for the Allegheny River and used to develop the peak-discharge frequencies. Average reduction curves were then developed from the difference between the natural flow and actual flow. The natural flood-flow frequencies developed were modified by means of the average reduction curves to reflect the reduction caused by existing upstream flood control reservoirs.
May 15, 2003, Countywide Analyses Peak flows for Chartiers Creek were obtained from the FIS for the City of Pittsburgh (Reference 32). A standard log-Pearson Type III analysis, using the recorded data at the USGS gaging station in Carnegie and estimates of the major floods prior to the installation of the gage, was employed to establish the discharge-frequency relationship. This Countywide Revision
Hydrologic analyses prepared for approximate and detailed study streams within
Allegheny County were performed using Pennsylvania Regression Equations and
the National Urban Regression Equations.
The peak discharge computation procedure for using Pennsylvania Regression Equations is presented in the publication ‘Regression Equations for Estimating Flood Flows at selected Recurrence Intervals for Ungaged Streams in Pennsylvania (Reference 33). Based on physiography, elevation, and geologic characteristics, the publication divided the state of Pennsylvania into four hydrologic regions. The eastern half of Allegheny County falls under hydrologic Region Four and western half of the county falls under Region Three. A summary of the drainage area-peak discharge relationships for all the streams studied by detailed methods is shown in Table 6.

53
No discharge info is available for the following streams: Boston Hollow Run,
Breakneck Creek, Boyds Hollow Run, Douglas Run, Douglas Run Tributary 1,
Douglas Run Tributary 2, Fourteen Mile Island Back Channel, Gillespie Run,
Happy Hollow Run, Herrs Island Back Channel, Hoffman Run, Pidgeon Hollow
Run, Pitt Street, Spring Garden Run, Squaw Run Tributary 1, Squaw Run
Tributary 2, Squaw Run Tributary 4, Twelve Mile Island Back Channel, Wildcat
Run.
TABLE 6 - SUMMARY OF DISCHARGES
DRAINAGE PEAK DISCHARGES (cfs) FLOODING SOURCE AREA 10-percent 2-percent 1- percent 0.2-percent AND LOCATION (sq. miles) annual chance annual chance annual chance annual chance ABERS CREEK At confluence with Turtle Creek 10.60 2,150 3,700 4,450 6,500 At confluence of East Thompson Run 7.94 1,670 2,900 3,500 5,100 At confluence of Piersons Run 4.86 1,060 1,830 2,200 3,200 At Borough of Plum downstream corporate limits 4.60 1,050 1,800 2,150 3,200 At the confluence of Humms Run 1.70 450 800 950 1,450 ALLEGHENY RIVER At Borough of Verona upstream corporate limits 11,620 162,500 232,000 258,000 320,000 At Municipality of Penn Hills upstream corporate limit 11,560 162,500 232,000 258,000 320,000 At Lock and Dam No. 4, Natrona, Pennsylvania 11,410 170,000 227,000 253,000 317,000 BEAR RUN At confluence with Lowries Run 5.37 * * 1,740 * BECKS RUN At mouth 2.60 690 1,165 1,190 1,250 Approximately 0.18 mile upstream of confluence with the Monongahela River
1 2.50 690 1,185 1,290 1,485
*Data not available 1Discharges lowered due to flow on Becks Run Road

54
TABLE 6 - SUMMARY OF DISCHARGES - continued
DRAINAGE PEAK DISCHARGES (cfs) FLOODING SOURCE AREA 10-percent 2-percent 1- percent 0.2-percent AND LOCATION (sq. miles) annual chance annual chance annual chance annual chance BECKS RUN (continued) At upstream side of bridge near junction of Becks Run Road and Susquehanna Street 2.40 690 1,200 1,430 2,090 Approximately 0.12 mile upstream from centerline of Bajo Street bridge 1.80 525 905 1,080 1,600 BIG SEWICKLEY CREEK At confluence with the Ohio River 30.20 2,670 4,570 5,630 8,780 At Borough of Bell Acres downstream corporate limits 29.80 2,590 4,325 5,360 8,575 At Borough of Bell Acres upstream corporate limits 13.20 1,400 2,560 3,365 5,950 Breakneck Creek At downstream Corporate limits 4.1 * * * 900 BRUSH CREEK 1 At confluence with Turtle Creek 57.20 5,400 8,500 10,100 15,000 BRUSH CREEK 2 At Township of Marshall downstream corporate limits 8.30 1,490 2,320 2,790 3,950 At confluence of Tributary No. 1 to Brush Creek 2 6.30 1,350 2,100 2,500 3,560 At Interstate Route 79 culvert 5.00 1,250 1,930 2,300 3,270 At Northgate Drive 3.40 1,070 1,680 2,000 2,850 BULL CREEK At Township of Harrison downstream corporate limits 48.80 4,060 5,890 6,700 8,600
*Data not available

55
TABLE 6 - SUMMARY OF DISCHARGES - continued DRAINAGE PEAK DISCHARGES (cfs) FLOODING SOURCE AREA 10-percent 2-percent 1- percent 0.2-percent AND LOCATION (sq. miles) annual chance annual chance annual chance annual chance BULL CREEK (continued) Above confluence of Little Bull Creek 37.20 3,460 5,010 5,700 7,540 At confluence of McDowell Run * 3,300 5,570 6,900 10,650 At confluence of Lardintown Run * 2,220 3,750 4,660 6,580 At confluence of Tributary to Bull Creek * 2,070 3,500 4,360 6,580 CAMPBELLS RUN At confluence with Chartiers Creek 5.62 1,300 2,230 2,700 3,990 At Township of Robinson downstream corporate limits 5.40 1,260 2,170 2,620 3,875 At upstream end of culvert under Interstate Route 79 2.80 725 1,250 1,510 2,230 Upstream of parkway exit of Campbells Run Road 1.70 485 830 1,010 1,490 At intersection of McMichael Road and Campbells Run Road 0.90 300 510 615 910 CHARTIERS CREEK At Township of Robinson downstream corporate limits 269.00 9,800 17,000 21,500 37,000 At Borough of Rosslyn Farms downstream corporate limits 268.00 9,800 17,000 21,500 37,000 At Township of Scott downstream corporate limits 264.00 9,800 17,000 21,500 37,000 At Borough of Carnegie downstream corporate limits 263.00 9,800 17,000 21,500 37,000 At Township of Collier downstream corporate limits 257.00 9,800 17,000 21,500 37,000 At confluence of Robinson Run 216.00 8,800 16,800 21,200 33,600 At confluence of Thoms Run 192.00 8,600 16,100 20,000 31,500 *Data not available
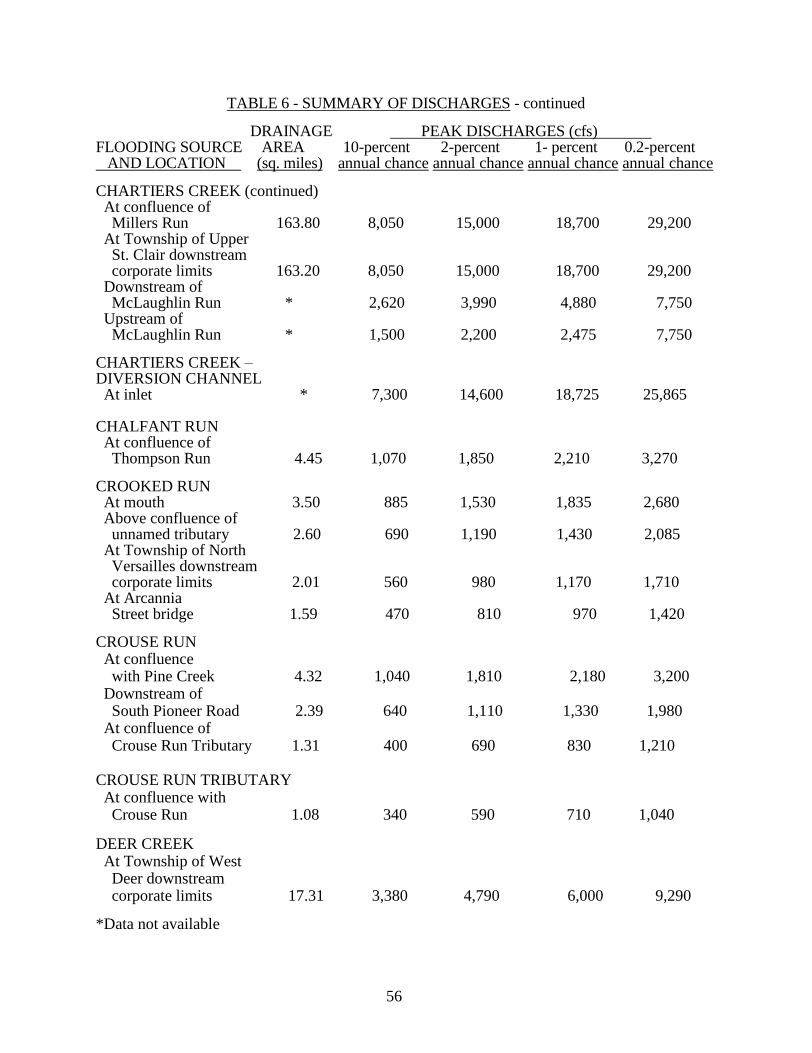
56
TABLE 6 - SUMMARY OF DISCHARGES - continued DRAINAGE PEAK DISCHARGES (cfs) FLOODING SOURCE AREA 10-percent 2-percent 1- percent 0.2-percent AND LOCATION (sq. miles) annual chance annual chance annual chance annual chance CHARTIERS CREEK (continued) At confluence of Millers Run 163.80 8,050 15,000 18,700 29,200 At Township of Upper St. Clair downstream corporate limits 163.20 8,050 15,000 18,700 29,200 Downstream of McLaughlin Run * 2,620 3,990 4,880 7,750 Upstream of McLaughlin Run * 1,500 2,200 2,475 7,750
CHARTIERS CREEK – DIVERSION CHANNEL At inlet * 7,300 14,600 18,725 25,865 CHALFANT RUN At confluence of Thompson Run 4.45 1,070 1,850 2,210 3,270 CROOKED RUN At mouth 3.50 885 1,530 1,835 2,680 Above confluence of unnamed tributary 2.60 690 1,190 1,430 2,085 At Township of North Versailles downstream corporate limits 2.01 560 980 1,170 1,710 At Arcannia Street bridge 1.59 470 810 970 1,420 CROUSE RUN At confluence with Pine Creek 4.32 1,040 1,810 2,180 3,200 Downstream of South Pioneer Road 2.39 640 1,110 1,330 1,980 At confluence of Crouse Run Tributary 1.31 400 690 830 1,210 CROUSE RUN TRIBUTARY At confluence with Crouse Run 1.08 340 590 710 1,040 DEER CREEK At Township of West Deer downstream corporate limits 17.31 3,380 4,790 6,000 9,290 *Data not available
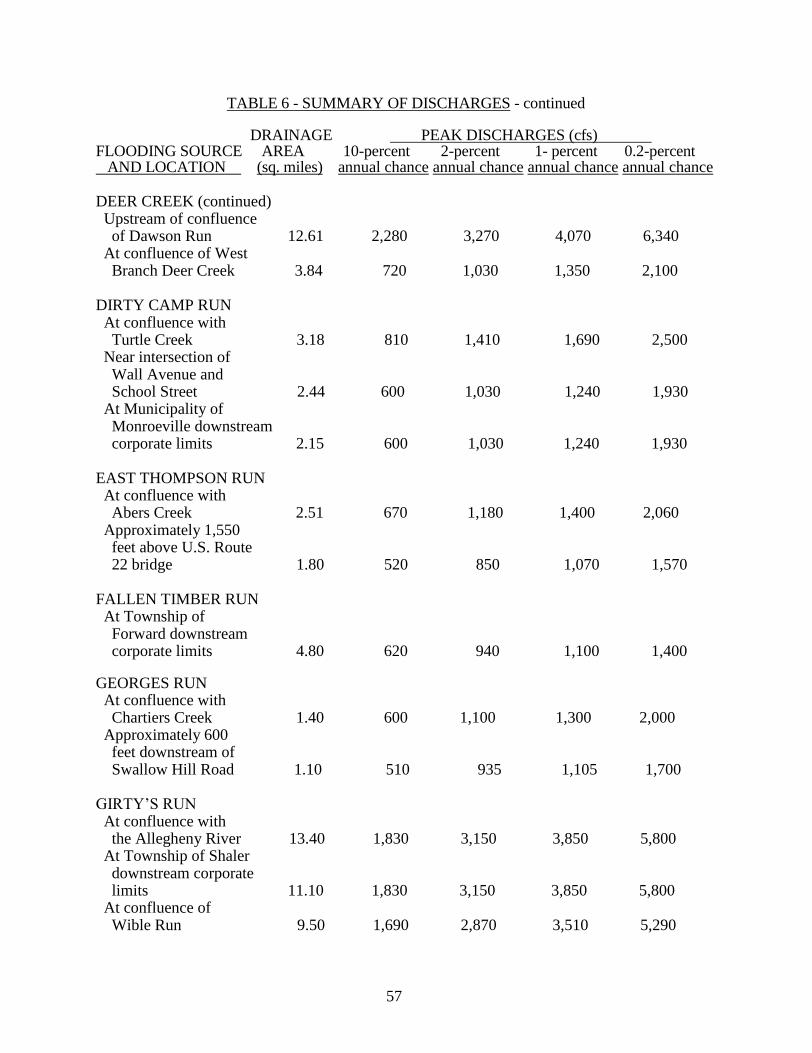
57
TABLE 6 - SUMMARY OF DISCHARGES - continued DRAINAGE PEAK DISCHARGES (cfs) FLOODING SOURCE AREA 10-percent 2-percent 1- percent 0.2-percent AND LOCATION (sq. miles) annual chance annual chance annual chance annual chance DEER CREEK (continued) Upstream of confluence of Dawson Run 12.61 2,280 3,270 4,070 6,340 At confluence of West Branch Deer Creek 3.84 720 1,030 1,350 2,100 DIRTY CAMP RUN At confluence with Turtle Creek 3.18 810 1,410 1,690 2,500 Near intersection of Wall Avenue and School Street 2.44 600 1,030 1,240 1,930 At Municipality of Monroeville downstream corporate limits 2.15 600 1,030 1,240 1,930 EAST THOMPSON RUN At confluence with Abers Creek 2.51 670 1,180 1,400 2,060 Approximately 1,550 feet above U.S. Route 22 bridge 1.80 520 850 1,070 1,570 FALLEN TIMBER RUN At Township of Forward downstream corporate limits 4.80 620 940 1,100 1,400 GEORGES RUN At confluence with Chartiers Creek 1.40 600 1,100 1,300 2,000 Approximately 600 feet downstream of Swallow Hill Road 1.10 510 935 1,105 1,700 GIRTY’S RUN At confluence with the Allegheny River 13.40 1,830 3,150 3,850 5,800 At Township of Shaler downstream corporate limits 11.10 1,830 3,150 3,850 5,800 At confluence of Wible Run 9.50 1,690 2,870 3,510 5,290

58
TABLE 6 - SUMMARY OF DISCHARGES - continued DRAINAGE PEAK DISCHARGES (cfs) FLOODING SOURCE AREA 10-percent 2-percent 1- percent 0.2-percent AND LOCATION (sq. miles) annual chance annual chance annual chance annual chance GIRTY’S RUN (continued) Upstream of confluence of Nelson Run 7.68 1,560 2,650 3,240 4,880 Upstream of confluence of Thompson Run 6.27 1,250 2,120 2,590 3,900 Upstream of confluence of McKnight Run 4.43 790 1,350 1,650 2,490 Upstream of confluence of Cemetery Run 3.66 640 1,090 1,330 2,000 Upstream of confluence of Rochester Run 2.15 390 660 810 1,220 Upstream of Three Degree Road 0.66 210 360 440 660 GOURDHEAD RUN At confluence with Pine Creek
1 4.03 1,122 1,911 2,342 3,357
Upstream of confluence of McCaslin Run 2.46 694 1,168 1,433 2,064 GRAESERS RUN At confluence with McLaughlin Run 2.02 335 566 680 994 Approximately 50 feet upstream of Walther Lane 1.95 325 550 661 966 Approximately 570 feet downstream of Brookside Blvd 0.77 157 270 327 485 HARTS RUN At confluence with Gourdhead Run 1.16 374 659 817 1,194 HUMMS RUN At confluence with Abers Creek 2.50 650 1,100 1,350 2,000 Approximately 0.5 mile upstream of confluence with Abers Creek 2.20 570 965 1,185 1,755 Approximately 0.9 mile upstream of confluence with Abers Creek 2.00 530 890 1,100 1,625 Approximately 1.2 miles upstream of confluence with Abers Creek 1.60 440 745 915 1,355 1Discharges reduced due to flow on State Route 8
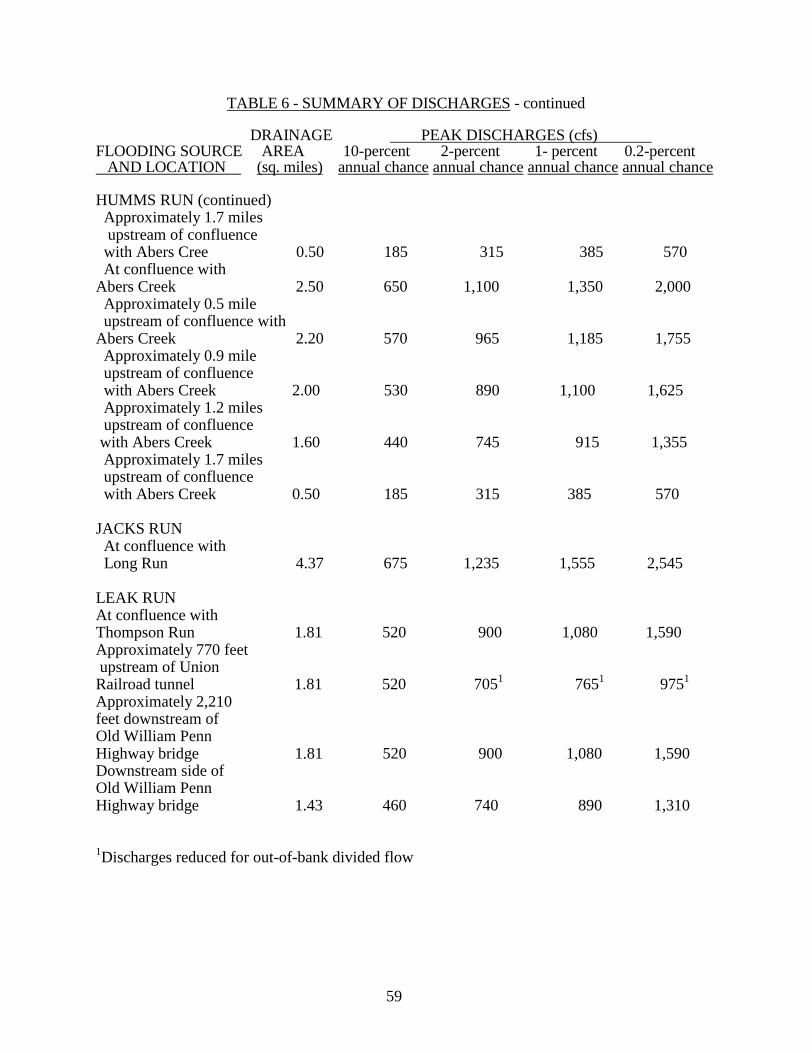
59
TABLE 6 - SUMMARY OF DISCHARGES - continued DRAINAGE PEAK DISCHARGES (cfs) FLOODING SOURCE AREA 10-percent 2-percent 1- percent 0.2-percent AND LOCATION (sq. miles) annual chance annual chance annual chance annual chance HUMMS RUN (continued) Approximately 1.7 miles upstream of confluence with Abers Cree 0.50 185 315 385 570 At confluence with Abers Creek 2.50 650 1,100 1,350 2,000 Approximately 0.5 mile upstream of confluence with Abers Creek 2.20 570 965 1,185 1,755 Approximately 0.9 mile upstream of confluence with Abers Creek 2.00 530 890 1,100 1,625 Approximately 1.2 miles upstream of confluence with Abers Creek 1.60 440 745 915 1,355 Approximately 1.7 miles upstream of confluence with Abers Creek 0.50 185 315 385 570 JACKS RUN At confluence with Long Run 4.37 675 1,235 1,555 2,545 LEAK RUN At confluence with Thompson Run 1.81 520 900 1,080 1,590 Approximately 770 feet upstream of Union Railroad tunnel 1.81 520 705
1 765
1 975
1
Approximately 2,210 feet downstream of Old William Penn Highway bridge 1.81 520 900 1,080 1,590 Downstream side of Old William Penn Highway bridge 1.43 460 740 890 1,310 1Discharges reduced for out-of-bank divided flow

60
TABLE 6 - SUMMARY OF DISCHARGES – continued
DRAINAGE PEAK DISCHARGES (cfs) FLOODING SOURCE AREA 10-percent 2-percent 1- percent 0.2-percent AND LOCATION (sq. miles) annual chance annual chance annual chance annual chance LEWIS RUN At confluence with Peters Creek 5.87 1,030 1,790 2,180 3,200 Approximately 1.51 miles upstream of confluence with Peters Creek 4.09 790 1,360 1,660 2,490 LICK RUN At confluence with Peters Creek 8.59 1,890 2,780 3,160 4,220 At McElhaney Road 7.46 1,760 2,610 2,920 3,870 At 2
nd crossing of
CSX Transportation 5.47 1,510 2,200 2,450 3,160 At Wilson Road 3.84 1,260 1,810 1,950 2,490 At Borough of Baldwin downstream corporate limits
1 2.40 990 1,380 1,490 1,780
At upstream side of Norfolk and Western Railway bridge 2.20 1,080 1,610 1,780 2,360 At confluence of Lick Run Tributary 1.40 550 840 930 1,260 LITTLE BULL CREEK At confluence with Bull Creek 11.60 1,490 2,520 3,070 4,670 At limit of detailed study near Birdville 8.90 1,170 2,040 2,500 3,740 LITTLE DEER CREEK At Township of Indiana downstream corporate limits 13.40 2,120 2,950 3,555 5,850 At Township of West Deer downstream corporate limits 9.11 1,730 2,350 2,900 4,690 At confluence of unnamed tributary at stream mile 5.3 6.87 1,520 2,050 2,460 3,970 1Discharges reduced due to regulation by Norfolk and Western Railway culvert
2Flows downstream of the Bessemer and Lake Erie Railroad bridge are less than upstream flows
due to bridge acting as a dam

61
TABLE 6 - SUMMARY OF DISCHARGES – continued
DRAINAGE PEAK DISCHARGES (cfs) FLOODING SOURCE AREA 10-percent 2-percent 1- percent 0.2-percent AND LOCATION (sq. miles) annual chance annual chance annual chance annual chance LITTLE DEER CREEK (continued) Upstream of Bessemer and Lake Erie Railroad bridge 4.48 1,520 2,400
2 2,970
2 4,200
2
LITTLE PINE CREEK EAST At confluence with Pine Creek 6.10 1,611 2,780 3,400 4,869 At Township of O’Hara downstream corporate limits 5.63 1,562 2,628 3,189 4,580
LITTLE PINE CREEK EAST continued At Township of Indiana downstream corporate limit 3.89 1,047 1,902 2,339 3,371 LITTLE PINE CREEK WEST At confluence with Pine Cree 6.81 1,545 2,533 3,076 4,352 At Township of Shaler downstream corporate limits 6.60 1,532 2,512 3,048 4,327 Upstream of Vilsack Road 5.10 1,271 2,105 2,570 3,668 At Township of Ross downstream corporate limits 4.22 1,166 1,929 2,355 3,356 At confluence with Tributary No. 3 1.90 384 655 812 1,212 At Remington Drive 0.80 268 459 568 854 LITTLE PLUM CREEK At confluence of Plum Creek 8.0 1,100 1,800 2,200 3,350 Approximately 1.0 mile upstream of confluence with Plum Creek 7.1 1,000 1,650 2,025 3,075 LOBBS RUN At confluence with Monongahela River 3.92 760 1,320 1,610 2,410

62
TABLE 6 - SUMMARY OF DISCHARGES - continued DRAINAGE PEAK DISCHARGES (cfs) FLOODING SOURCE AREA 10-percent 2-percent 1- percent 0.2-percent AND LOCATION (sq. miles) annual chance annual chance annual chance annual chance LONG RUN At confluence with Youghiogheny River 13.20 1,690 2,805 3,395 4,960 Above confluence of unnamed tributary 12.40 1,625 2,705 3,280 4,805 At Borough of White Oak downstream corporate limits 11.63 1,540 2,625 3,210 4,625 At confluence of Jacks Run 6.03 920 1,575 1,910 2,870 At a point approximately 0.23 mile upstream of Rankin Road 3.8 660 1,145 1,395 2,095 LOWRIES RUN At USACE gage in Emsworth, at mile 0.571 16.96 2,250 4,400 5,780 10,300 At Township of Ohio downstream corporate limits 14.80 * * 5,780 * Upstream of confluence of Bear Run 7.83 * * 2,440 * At Township of Ross downstream corporate limits 7.00 910 1,870 2,440 4,440 At Town of McCandless corporate limits 3.10 400 830 1,080 1,970 At confluence of Whittmer Run 1.90 250 510 660 1,190 McCASLIN RUN At confluence with Gourdhead Run * 326 547 678 978 McCLARENS RUN At confluence with Montour Run 6.50 * * 2,020 * *Data not available

63
TABLE 6 - SUMMARY OF DISCHARGES - continued DRAINAGE PEAK DISCHARGES (cfs) FLOODING SOURCE AREA 10-percent 2-percent 1- percent 0.2-percent AND LOCATION (sq. miles) annual chance annual chance annual chance annual chance McLAUGHLIN RUN At the confluence with Chartiers Creek 7.53 955 1,567 1,866 2,677 Approximately 610 feet downstream of Baldwin Street 7.30 937 1,540 1,835 2,635 Approximately 0.6 mile upstream of Baldwin St 6.90 892 1,467 1,748 2,511 Approximately 0.6 miles downstream of Lesnett Road 6.50 842 1,387 1,653 2,376 Approximately 250 feet downstream of Lesnett Road 5.51 742 1,225 1,462 2,106 Approximately 0.3 miles upstream of Morrow Road 4.61 644 1,068 1,276 1,842 Approximately 30 feet upstream of Old Washington Road 4.40 619 1,027 1,227 1,774 Approximately 0.20 miles downstream of Bethel Church Road 1.55 275 467 563 827 Approximately 0.1 miles upstream of Bethel Church Road 1.02 198 339 410 606 MILLERS RUN At confluence with Chartiers Creek 28.1 2,400 4,300 5,300 8,100 Above confluence with Tributary at Morgan Hill Road 24.6 2,130 3,800 4,700 7,100 Above confluence with Fishing Run 1.9 1,750 3,100 3,850 5,800 MONONGAHELA RIVER At confluence to Lock and Dam No. 2, at river mile 11.2 7,388 168,500 212,000 231,000 275,000 5,668
1
1Reduced due to the Tygart, Stonewall Jackson, and Youghiogheny Dams

64
TABLE 6 - SUMMARY OF DISCHARGES - continued DRAINAGE PEAK DISCHARGES (cfs) FLOODING SOURCE AREA 10-percent 2-percent 1- percent 0.2-percent AND LOCATION (sq. miles) annual chance annual chance annual chance annual chance MONTOUR RUN At confluence with the Ohio River 36.5 6,000 9,100 10,700 14,900 Approximately 0.1 mile downstream of Beaver Grade Road 29.6 5,100 7,700 9,050 12,600 At Township of North Fayette downstream corporate limits 25.9 4,470 7,180 8,580 12,600 Upstream of confluence of McClarens Run 17.9 3,160 4,890 5,740 8,120 MONTOUR RUN NO. 1 At confluence with Pine Creek * 1,039 1,925 2,421 3,627 MOON RUN At confluence with the Ohio River 5.4 1,050 1 ,800 2,200 3,350 NORTH BRANCH ROBINSON RUN At Township of North Fayette downstream corporate limits 12.9 1,170 2,200 2,700 4,200 NORTH FORK MONTOUR RUN Upstream of confluence with South Fork Montour Run 2.30 * * 1,010 * OHIO RIVER At Dashields Lock and Dam, at river mile 13.3 19,522 282,000 362,000 394,000 480,000 At river mile 11.23 19,550 282,000 362,000 394,000 480,000 At river mile 10.0 19,480 186,120 238,920 260,000 316,800 At Emsworth Lock and Dam 19,428 186,000 242,000 262,000 324,000 186,120
1 238,900
1 260,000
1 316,800
1
*Data not available 1Computation includes modified upstream reservoirs

65
TABLE 6 - SUMMARY OF DISCHARGES - continued DRAINAGE PEAK DISCHARGES (cfs) FLOODING SOURCE AREA 10-percent 2-percent 1- percent 0.2-percent AND LOCATION (sq. miles) annual chance annual chance annual chance annual chance OHIO RIVER (continued) At river mile 4.25 19,400 282,000 362,000 394,000 480,000 At confluence of Allegheny and Monongahela Rivers 19,132 282,000 362,000 394,000 480,000 OHIO RIVER-BACK CHANNEL At Township of Robinson downstream corporate limits 19,500 95,880 123,080 134,000 163,200 At river mile 10.0 19,480 96,000 123,100 134,000 163,200 At Emsworth Dam, river 19,435 96,000 122,000 132,000 156,000 At Township of Stowe downstream corporate limits, river mile 6.5 19,430 96,000 122,000 132,000 156,000 At Emsworth Back Channel Dam 19,428 96,000 122,000 132,000 156,000 95,880
1 123,100
1 134,000
1 163,200
1
PAINTERS RUN At Township of Scott corporate limits 4.2 1,350 2,300 2,800 4,300 PETERS CREEK At downstream limit of detailed study in City of Clairton 50.82 4,200 7,400 9,300 14,000 Above confluence with Lewis Run 44.81 3,700 6,500 8,100 12,600 Above confluence with Beam Run 41.89 3,400 6,000 7,500 11,700 At confluence of Lick Run 31.84 2,700 4,800 6,000 9,100 At confluence of Piney Fork 17.60 1,600 2,850 3,450 5,200 PIERSONS RUN At confluence with Abers Creek 2.04 570 990 1,190 1,730 1Computation includes modified upstream reservoirs

66
TABLE 6 - SUMMARY OF DISCHARGES - continued
DRAINAGE PEAK DISCHARGES (cfs) FLOODING SOURCE AREA 10-percent 2-percent 1- percent 0.2-percent AND LOCATION (sq. miles) annual chance annual chance annual chance annual chance PINE CREEK At confluence with Allegheny River 67.30 4,750 8,245 10,104 14,477 At Township of Shaler downstream corporate limits 59.60 4,346 7,548 9,274 13,332 At confluence of Little Pine Creek East 53.30 4,263 7,317 8,957 12,813 At Township of Hampton downstream corporate limits 47.44 4,060 6,959 8,521 12,204 Upstream of confluence of Gourdhead Run 43.06 3,636 6,289 7,719 11,114 Upstream of confluence of Crouse Run 37.10 2,855 4,96 16,261 9,690 At Town of McCandless downstream corporate limits 14.00 1,992 3,661 4,799 7,391 Upstream of confluence of Wexford Run 5.40 1,209 2,116 2,628 3,849 PINEY FORK At Municipality of Bethel Park downstream 4.3 1,020 1,480 1,690 2,190 corporate limits At confluence of Tributary 1 to Piney Fork 2.00 350 520 600 800 PLUM CREEK At confluence with Allegheny River 20.66 1,936 3,266 ,956 5,916 Approximately 0.30 miles Downstream of Allegheny River Blvd 20.32 1,910 3,225 3,906 5,843 Approximately 0.3 miles downstream of Plum Street 19.03 1,812 3,065 3,714 5,561 Approximately 0.7 miles downstream of Plum St 18.70 1,786 3,022 3,663 5,487 Approximately 1.6 miles downstream of Hulton Road 18.00 1,734 2,937 3,561 5,337

67
TABLE 6- SUMMARY OF DISCHARGES - continued
DRAINAGE PEAK DISCHARGES (cfs) FLOODING SOURCE AREA 10-percent 2-percent 1- percent 0.2-percent AND LOCATION (sq. miles) annual chance annual chance annual chance annual chance PLUM CREEK (continued) Approximately 0.7 miles downstream of Hulton Run 16.91 1,650 2,799 3,395 5,093 Approximately 0.4 miles downstream of Steurnagel Lane 16.66 1,631 2,767 3,357 5,037 Approximately 400 feet upstream of Boda Road 14.29 1,443 2,459 2,986 4,490 Approximately 0.31 feet upstream of Boda Road 13.99 1,419 2,419 2,938 4,420 Approximately of 0.4 miles downstream Mary Street 13.49 1,378 2,352 2,858 4,301 Approximately 60 feet downstream of Mary Street 12.31 1,281 2,191 2,655 4,016 Approximately 0.2 miles downstream of Leechburg 3.52 472 835 1,026 1,574 Approximately 310 feet downstream of Universal Road 2.39 347 620 763 1,178 Approximately 0.4 miles upstream of Millers Lane 1.61 253 457 565 877 Approximately 1.2 mile upstream of Millers Lane 0.77 141 259 322 505 PUCKETA CREEK At confluence with Allegheny River 36.50 3,400 5,160 6,000 8,100 At confluence of Little Pucketa Creek 25.60 2,700 4,050 4,725 5,940 ROBINSON RUN At confluence with Chartiers Creek 40.00 3,350 6,100 7,500 11,500 At confluence of Scotts Run 37.60 3,100 5,600 7,000 10,800 Approximately 0.2 mile downstream of confluence of Pinkertons Run 33.90 2,900 5,100 6,300 9,900 At confluence of Pinkertons Run 30.30 2,600 4,700 5,800 8,800 Above confluence of Fink Run 13.80 1,350 2,370 2,900 4,330

68
TABLE 6 - SUMMARY OF DISCHARGES - continued DRAINAGE PEAK DISCHARGES (cfs) FLOODING SOURCE AREA 10-percent 2-percent 1- percent 0.2-percent AND LOCATION (sq. miles) annual chance annual chance annual chance annual chance ROBINSON RUN (continued) Above confluence with unnamed tributary at Sturgeon Road 11.20 1,170 2,050 2,500 3,750 At downstream Borough of McDonald corporate limits 10.40 1,170 2,050 2,500 3,750 ROCHESTER RUN At confluence with Girty’s Run 1.42 250 430 520 780 SANDY CREEK At confluence with Allegheny River 3.40 1,000 1,750 2,250 3,850 Approximately 0.8 mile upstream of confluence with Allegheny River 2.90 885 1,500 1,990 3,405 Approximately 1.1 miles upstream of confluence with Allegheny River 1.20 440 775 995 1,700 SAW MILL RUN At Alexander Street bridge 19.20 5,680 8,650 10,100 14,600 SAWMILL RUN At downstream Township of Wilkins corporate limits 1.89 540 930 1,110 1,640 Approximately 50 feet upstream of Moss Street 1.64 480 830 1,000 1,460 Approximately 200 feet upstream of second private road bridge 1.40 440 730 880 1,290 Approximately 150 feet Downstream of intersection Of Kingsdale road and Beulah Road 0.91 * * 652 * At the intersection of Thornbury Drive and Beulah Road 0.80 * * 584 *

69
TABLE 6 - SUMMARY OF DISCHARGES - continued DRAINAGE PEAK DISCHARGES (cfs) FLOODING SOURCE AREA 10-percent 2-percent 1- percent 0.2-percent AND LOCATION (sq. miles) annual chance annual chance annual chance annual chance SAWMILL RUN (continued) Upstream of the Intersection Of Lewin Lane with Beulah Road 0.22 * * 141 * SCRUBGRASS RUN At confluence with Chartiers Creek 1.50 700 1,150 1,400 2,150 At confluence with tributary near intersection of Scrubgrass Road and Old Scrubgrass Road 0.8 430 700 850 1,310 SOUTH FORK MONTOUR RUN Upstream of confluence of North Fork Montour Run 2.6 930 1,320 1,480 2,020 STREETS RUN Approximately 0.23 mile downstream from downstream Borough of Baldwin corporate limits 6.2 1,220 1,830 2,130 2,680 Approximately 0.07 mile downstream from confluence of Streets Run with stream along Brentwood Road 4.8 965 1,450 1,690 2,125 Approximately 0.17 mile upstream from confluence of Streets Run with stream along Brentwood Road 3.2 670 1,010 1,175 1,480 Approximately 0.26 mile downstream from centerline of bridge near junction of Streets Run Road and Prospect Road 2.4 530 800 930 1,170 THOMPSON RUN At confluence with Turtle Creek 17.9 2,890 5,000 6,000 8,820 1Discharges reduced for out-of-bank divided flow
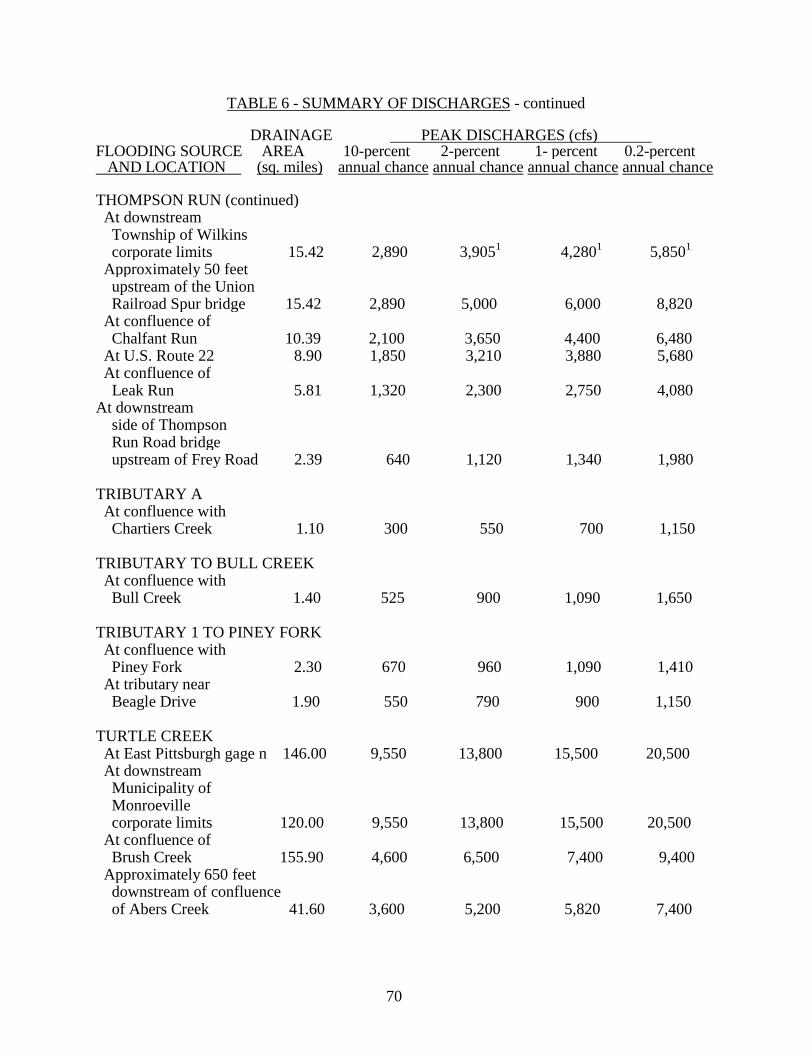
70
TABLE 6 - SUMMARY OF DISCHARGES - continued DRAINAGE PEAK DISCHARGES (cfs) FLOODING SOURCE AREA 10-percent 2-percent 1- percent 0.2-percent AND LOCATION (sq. miles) annual chance annual chance annual chance annual chance THOMPSON RUN (continued) At downstream Township of Wilkins corporate limits 15.42 2,890 3,905
1 4,280
1 5,850
1
Approximately 50 feet upstream of the Union Railroad Spur bridge 15.42 2,890 5,000 6,000 8,820 At confluence of Chalfant Run 10.39 2,100 3,650 4,400 6,480 At U.S. Route 22 8.90 1,850 3,210 3,880 5,680 At confluence of Leak Run 5.81 1,320 2,300 2,750 4,080 At downstream side of Thompson Run Road bridge upstream of Frey Road 2.39 640 1,120 1,340 1,980 TRIBUTARY A At confluence with Chartiers Creek 1.10 300 550 700 1,150 TRIBUTARY TO BULL CREEK At confluence with Bull Creek 1.40 525 900 1,090 1,650 TRIBUTARY 1 TO PINEY FORK At confluence with Piney Fork 2.30 670 960 1,090 1,410 At tributary near Beagle Drive 1.90 550 790 900 1,150 TURTLE CREEK At East Pittsburgh gage n 146.00 9,550 13,800 15,500 20,500 At downstream Municipality of Monroeville corporate limits 120.00 9,550 13,800 15,500 20,500 At confluence of Brush Creek 155.90 4,600 6,500 7,400 9,400 Approximately 650 feet downstream of confluence of Abers Creek 41.60 3,600 5,200 5,820 7,400

71
TABLE 6 - SUMMARY OF DISCHARGES - continued DRAINAGE PEAK DISCHARGES (cfs) FLOODING SOURCE AREA 10-percent 2-percent 1- percent 0.2-percent AND LOCATION (sq. miles) annual chance annual chance annual chance annual chance TURTLE CREEK (continued) At confluence of Abers Creek 31.20 2,920 4,140 4,700 5,880 UNNAMED STREAM ALONG MOSS SIDE BOULEVARD At confluence with Turtle Creek 1.34 410 710 850 1,250 WEST BRANCH DEER CREEK At confluence with Deer Creek 7.54 1,570 2,130 2,730 4,230 WHISKEY RUN At downstream Township of Scott corporate limits 1.60 650 1,150 1,400 2,150 At downstream Borough of Green Tree corporate limits 1.20 650 1,150 1,400 2,150 Approximately 0.27 mile upstream of downstream Borough of Green Tree corporate limits 1.00 460 820 990 1,520 Approximately 0.45 mile upstream of downstream Borough of Green Tree corporate limits 0.60 280 500 610 930 WHITTMER RUN At confluence with Lowries Run 1.10 140 290 380 690 WYLIE RUN At confluence with Monongahela River 3.97 580 860 1,000 1,250 Approximately 1,400 feet upstream from McKeesport-Glassport Road 3.80 550 830 960 1,200 At confluence of Happy Hollow Run 3.75 380 560 660 840

72
TABLE 6 - SUMMARY OF DISCHARGES - continued DRAINAGE PEAK DISCHARGES (cfs) FLOODING SOURCE AREA 10-percent 2-percent 1- percent 0.2-percent AND LOCATION (sq. miles) annual chance annual chance annual chance annual chance WYLIE RUN (continued) Approximately 400 feet downstream from Mill Hill Road 2.17 290 430 510 640 At Lovedale Road 1.59 280 420 490 620 YOUGHIOGHENY RIVER At confluence with Monongahela River 1,763.00 65,000 93,000 108,000 145,000 At downstream Township of South Versailles corporate limits 1,735.00 65,000 93,000 108,000 145,000 At Sutersville gage in the City of McKeesport 1,715.00 65,000 93,000 108,000 145,000
Additional peak discharge data is presented on the following pages in graphic format in Figure 2, “Frequency-Discharge, Drainage Area Curves,” for the Borough of Fox Chapel and the Townships of Elizabeth and Reserve.
3.2 Hydraulic Analyses
Analyses of the hydraulic characteristics of flooding from the source studied were carried out to provide estimates of the elevations of floods of the selected recurrence intervals. Users should be aware that flood elevations shown on the FIRM represent rounded whole-foot elevations and may not exactly reflect the elevations shown on the Flood Profiles or in the Floodway Data tables in the FIS report. For construction and/or floodplain management purposes, users are encouraged to use the flood elevation data presented in this FIS in conjunction with the data shown on the FIRM. Locations of selected cross sections used in the hydraulic analyses are shown on
the Flood Profiles (Exhibit 1). For stream segments for which a floodway was
computed (Section 4.2), selected cross-section locations are also shown on the
FIRM (Exhibit 2).
The hydraulic analyses for this countywide study were based on unobstructed
flow. The flood elevations shown on the profiles are thus considered valid only if
hydraulic structures remain unobstructed, operate properly, and do not fail.

73
Pre-countywide Analyses Each community within Allegheny County, with the exception of the Boroughs of Avalon, Bellevue, Braddock Hills, Bradford Woods, Churchill, Crafton, Forest Hills, Franklin Park, Munhall, North Braddock, Sewickley Heights, Sewickley Hills, Swissvale, Wall, and West View; the Townships of Aleppo, Frazer, Pine and Richland; and the Municipality of Mt. Lebanon, has a previously printed FIS report. The hydraulic analyses described in those reports have been compiled and are summarized below. Cross section and bridge data for the following streams were obtained by field survey and aerial photogrammetry: Abers Creek in the Borough of Plum; Campbells Run and Robinson Run in the Township of Collier; Humms Run, Little Plum Creek, Painters Run, Plum Creek, and Pucketa Creek in the Borough of Plum; Sandy Creek in the Municipality of Penn Hills; Georges Run and Scrubgrass Run in the Township of Scott; and Whiskey Run in the Township of Scott and the Borough of Green Tree. Cross sections for Bear Run were obtained from field checks and topographic maps at a scale of 1:1,200 (References 34 and 35). In the Borough of Bell Acres, cross sections were obtained from topographic maps compiled from aerial photographs (Reference 36). Cross sections for Bull Creek and Tributary to Bull Creek in the Township of Fawn were obtained from topographic maps compiled from aerial photographs (Reference 37). Cross section and bridge data for the following streams were obtained from field measurement and aerial photographs compiled by photogrammetric methods at a scale of 1:2,400 (Reference 36): Campbells Run, Chartiers Creek, Moon Run, Montour Run, and Tributary A in the Township of Robinson. The channel cross section and bridge data for Chartiers Creek in the Boroughs of Carnegie, Crafton, Heidelberg, Rosslyn Farms, and Thornburg, and the Townships of Collier, Scott, and South Fayette; and Chartiers Creek-Diversion Channel in the Township of Collier were obtained from construction drawings for the Chartiers Creek Flood Protection Project (Reference 38). The overbank stations and elevations of the cross sections were determined by aerial photogrammetry. For the following streams, cross-section data were obtained from aerial photographs (Reference 39). Chartiers Creek, in the Borough of Bridgeville and the Townships of South Fayette and Upper St. Clair; and Millers Run and Robinson Run in the Township of South Fayette. For the following streams, cross sections were obtained from field surveys and topographic maps: Crooked Run, Thompson Run, and Turtle Creek in the

74
Township of North Versailles; and Brush Creek and Turtle Creek in the Borough of Trafford. Cross sections for Deer Creek, Little Deer Creek, and West Branch Deer Creek in the Township of West Deer were taken from soundings and topographic maps (Reference 40). For Dirty Camp Run in the Borough of Pitcairn, cross sections were obtained using field surveys and topographic maps at a scale of 1:1,200 (Reference 41). Cross-section data for Girty’s Run in the Borough of Millvale were supplied by the USACE by use of design drawings, and by field survey. For Graesers Run, Piney Fork, and Tributary 1 to Piney Fork, cross-section data were obtained from aerial photography flown in December 1978 at a scale of 1:800. Cross sections for Little Deer Creek were obtained from soundings, topographic maps, and field checks (Reference 40). Cross-section data for Lowries Run in the Township of Ohio were obtained from USACE field surveys and topographic maps at a scale of 1:1,200 (Reference 34). For McLaughlin Run, cross-section data were taken from maps compiled from aerial photographs flown in September 1981 (Reference 42). Cross-section data for the following streams were obtained from soundings, topographic maps, and field checks (References 42 and 43): Montour Run in the Townships of Findlay and North Fayette, South Fork Montour Run, North Branch Robinson Run, and Robinson Run in the Township of North Fayette, and South Fork Montour Run in the Township of Findlay. In the Borough of Coraopolis, cross sections for Montour Run were obtained from field surveys and topographic maps at a scale of 1:2,400 with a contour interval of 5 feet (Reference 44). Cross sections for the following streams were taken from soundings and topographic maps prepared by the USACE dated March 1964 (Reference 43): the Ohio River in the Boroughs of Ben Avon, Emsworth, Glenfield, Haysville, Leetsdale, Sewickley, and the Township of Crescent, Neville, and Stowe; Ohio River Back Channel in the Township of Neville. Cross sections for the Ohio River in the Townships of Kilbuck and Moon and the Boroughs of Coraopolis and Osborne, and cross sections for Montour Run in the Borough of Coraopolis were determined using topographic maps at a scale of 1:2,400 with a contour interval of 5 feet (Reference 44).
75
For the Ohio River in the City of Pittsburgh and Saw Mill Run, cross sections were obtained from USACE maps, City of Pittsburgh maps, USGS maps, and plane-table surveys conducted by the USACE (References 44, 45, 46, and 47). Cross sections for the Ohio River Back Channel in the Townships of Robinson, Kennedy, and Stowe were taken from USACE topographic maps dated March 1964 (Reference 44). Cross-section data for Peters Creek were taken from the USACE Floodplain Information Report (Reference 15). In the City of Clairton and the Township of South Park, cross sections for Peters Creek were obtained from field surveys and the USACE. Dimensions for the Milltown Road bridge over Plum Creek, in Milltown, were obtained from construction drawings furnished by the Bridge Division of the Pennsylvania Department of Transportation. Cross-section data for Robinson Run in the Borough of McDonald were taken from soundings and aerial photographs (Reference 43). Cross sections for the following streams were obtained from field surveys, topographic maps at a scale of 1:1,200 with a contour interval of 2 feet, and USACE channel plans at a scale of 1:3,600 (References 41 and 48): Thompson Run in the Borough of Turtle Creek, and Turtle Creek in the Boroughs of Turtle Creek and Wilmerding and the Municipality of Monroeville. Cross sections for the Youghiogheny River were obtained from the USACE and from topographic maps furnished by the USACE (Reference 49). Cross-section data for all other flooding sources and for the backwater analyses were field surveyed. Cross sections for all the streams were located at close intervals above or below bridges and culverts in order to compute the significant backwater effects of these structures. All bridges and culverts were surveyed to obtain elevation data and structural geometry. Water-surface elevations of floods of the selected recurrence intervals were computed using the USACE HEC-2 step-backwater computer program (Reference 50). There is one reach on Campbells Run, three reaches on Unnamed Stream along Moss Side Boulevard, one reach on Leak Run, two reaches on Sawmill Run, and one reach on Turtle Creek where supercritical flow occurs. This is s a rapid flow (a high velocity) which is sometimes highly turbulent, and usually occurs in steep parts of a stream. Subcritical flow, the more common type, has a relatively low velocity, as it usually occurs on streams with low slopes. The supercritical reach on Campbells Run occurs where the channel’s hydraulic efficiency and steep slope enable the water to flow into Chartiers Creek quickly,

76
thus reducing flood levels on Campbells Run. The supercritical reaches on Unnamed Stream along Moss Side Boulevard are: 1. From approximately 1,000 feet upstream of the CONRAIL bridge to the
downstream side of State Route 130 bridge; 2. From approximately 250 feet upstream of the State Route 130 bridge to
the downstream side of the private drive bridge; and 3. From approximately 50 feet upstream of the private drive bridge to the
limit of detailed study. The supercritical reach on Leak Run extends from approximately 200 feet upstream of the Union Railroad tunnel to the downstream side of the Old William Penn Highway culvert. The supercritical reaches on Sawmill Run are: 1. From the downstream side of the Ivy Street bridge to the downstream
corporate limit; and 2. From approximately 200 feet upstream of the culvert under State Route
130, between Sections D and E to the next private road bridge. The supercritical reach on Turtle Creek occurs from approximately 1,560 feet upstream of the CONRAIL spur bridge to approximately 2,540 feet upstream of the CONRAIL spur bridge. The flow transition between a supercritical and a subcritical region usually involves turbulence with an accompanying loss of energy. Furthermore, the length of this turbulent transition, called a hydraulic jump, is unpredictable, and is different for each flow. An effort has been made to define this transition length according to known lengths (Reference 51). However, an in-depth study of the length, position, and depths of this transition are, especially in a natural channel with a non-uniform shape, appears fruitless, and outside the scope of this report. According to an accepted engineering procedure involving the velocity and depth of the upstream supercritical section, the hydraulic jumps that occur during the four floods for these streams are either the undular or weak type, which involve a relatively small turbulent energy loss, and represent a somewhat gradual transition between the two regimes (Reference 52). Therefore, a linear assumption between the subcritical elevation and the supercritical elevation of the next section upstream is a reasonable one. In some of the more violent hydraulic jumps, the water-surface elevation decreases going upstream. In general, even though these decreases may occur in the channel, the elevations of the water surface of any overbank flow would be relatively unaffected; therefore, the elevations shown in the flood profiles in these areas have been adjusted to represent a more gradual transition.

77
Out-of-bank subcritical flow occurs only at two places on Sawmill Run for the 1% annual chance flood. This occurs at the second and the fourth private road bridges. Otherwise, sheet flow less than one foot deep will flow as out-of-bank flow, since there are no downstream controls to create subcritical flow. This situation is caused by the steepness of the stream and the valley, the presence of State Route 130 which runs along the stream for its entire length within the township, and the presence of three long culverts and a bridge on the stream. The elevations of the 1% and 0.2% annual chance floods on the first long culvert (between Cross Sections D and E) reflect that sheet flow will occur. These elevations have been calculated by assuming normal flow down the road, and the profile elevations have been used in the calculation of reaches. The elevations of the second long culvert (between Cross Sections J and K) for the 2% and 1% annual chance floods have been assumed to be at the top of the opening of the culvert. The lower part of this culvert cannot carry the full 1% chance annual flow as determined by a backwater analysis, but the depth of the sheet flow over the top of the culvert would not exceed one foot. Therefore, the 1% annual chance floodplain of this culvert is non-applicable, and the 0.2% annual chance floodplain on top of the culvert has been delineated by the use of field surveys and field experience. This culvert has not been treated in the same manner as the first long culvert because the cross sections over the top of the second culvert are not uniform, and the depth of the sheet flow over the top will not be the same across the whole cross section. Sheet flow areas along Sawmill Run will occur when the water overtops culverts and a bridge. There will be no appreciable depths generated because of the steep slope of the valley and because there is insufficient flow over the culverts and the bridge, provided they are unobstructed. Much of this sheet flow area is on State Route 130, but there are other areas upstream and downstream of the Moss Street bridge and over the first, second, and third culverts where sheet flow occurs. A shallow flooding area occurs along the Old William Penn Highway near Leak Run because of overflow from that stream at a low bank area about 2,150 feet upstream of the Union Railroad tunnel. The channel contains about a 10% annual chance flood, but for flows greater than this, a significant amount of water escapes the channel and flows down the road. The depth on the road, as indicated by a supercritical flow analysis, is slightly less than one foot for the 1% annual chance flood. The flow which leaves the channel was computed by using the standard weir flow equation with a transverse weir flow coefficient (Reference 53). As part of the Chartiers Creek Flood Control Project, drop structures were constructed at the mouths of Georges Run and Scrubgrass Run. Flooding on Georges Run upstream of the CONRAIL embankment near its mouth was found to be controlled by the culvert beneath the railroads and State Route 50. However, the hydraulic analysis showed that only the 10% annual chance discharge would pass through the culvert, while the 2%, 1%, and 0.2% annual

78
chance flows overtopped the embankment. A backwater analysis was performed to establish flood elevations along the embankment. This analysis indicated that the average depth of flooding caused by the 10% annual chance flood was less than 2.0 feet. Therefore, this portion of the stream was identified as a shallow flooding area. A separate analysis was also required for Scrubgrass Run in order to determine the flood elevations above the culvert at Green Tree Road. Flooding on Chartiers Creek between the inlet and outlet of the Chartiers Creek-Diversion Channel has been significantly altered by the construction of the diversion channel. The HEC-2 analysis on Chartiers Creek-Diversion Channel show that the 0.2% annual chance flood is contained within the banks. The flooding adjacent to the Chartiers Creek-Diversion Channel at its inlet is caused by overflow from Chartiers Creek. The flood water empties into the diversion channel via the two culverts. The upstream junction of Chartiers Creek and the diversion channel, located approximately 850 feet downstream of Prestley Road, was designed to divide the flow as follows (Reference 38): Chartiers Creek- Total Chartiers Creek Diversion Channel Discharge (cfs) Discharge (cfs) Discharge (cfs) 21,200 2,475 18,725 18,500 2,200 16,300 12,500 1,800 10,700 6,200 1,200 5,000 1,500 500 1,000 120 120 0 These flow divisions were achieved by placing a small weir in the diversion channel to divert low flows into Chartiers Creek and constructing a large culvert in Chartiers Creek to divert high flows into the diversion channel. In the analysis for this study, the flow division for each flood (10%, 2%, 1%, and 0.2% annual chance) was determined by performing a backwater analysis for both the Chartiers Creek-Diversion Channel and Chartiers Creek. The resulting flow divisions at the upstream junction are: Chartiers Creek- Recurrence Interval Total Chartiers Creek Diversion Channel (Years) Discharge (cfs) Discharge (cfs) Discharge (cfs) 10 8,800 1,500 7,300 50 16,800 2,200 14,600 100 21,200 2,475 18,725 500 33,600 7,750 25,850 Hydraulic analyses determined that the 1% and 0.2% annual chance floods on Turtle Creek in the Borough of Turtle Creek are contained within the channel.

79
Flows for the Ohio River over Lock and Dam No. 3 were computed to obtain elevations on the upstream side for the continuation of the backwater profiles. Variable weir coefficients were based on head-breadth relationships and were corrected for submergence, when appropriate, using methods for “ungated” conditions (Reference 54). Reliable rating curves were also available for the Ohio River at the Dashields Lock and Dam and at the Emsworth Lock and Dam to ensure that all computed frequency profiles were reasonable and consistent with the calibrated historical floods mentioned. Aside from the exceptions noted below, starting water-surface elevations for the streams studied by detailed methods were determined using the slope/area method. Starting water-surface elevations for the following streams were based on the coincident flow of the receiving stream: Allegheny River in the City of Pittsburgh, Big Sewickley Creek in the Borough of Leetsdale, Chartiers Creek, Chartiers Creek-Diversion Channel, and Rochester Run in the Township of Ross, and Tributary to Bull Creek and West Branch Deer Creek in the Township of West Deer. Starting water-surface elevations for Campbells Run in the Borough of Carnegie were calculated assuming supercritical flow. For the following streams, starting water-surface elevations were determined using the standard backwater analysis: Crooked Run; Tributary 1 to Piney Fork; and the Youghiogheny River in the Boroughs of Liberty, Lincoln, Port Vue, and Versailles; and the City of McKeesport. Starting water-surface elevations for the following streams were based on stage-discharge rating curves, which were obtained from high-water marks and by a continuation of profile computations: the Allegheny River; Campbells Run in the Township of Collier; Girty’s Run; Little Plum Creek; Lowries Run in the Town of McCandless and the Township of Ross; the Ohio River, except in the Boroughs of Coraopolis and Osborne and the Township of Moon; Ohio River Back Channel, except in the Township of Robinson; Peters Creek; Plum Creek; and Tributary A. Starting water-surface elevations for the following streams were calculated assuming critical depth: Bear Run, Deer Creek, Little Deer Creek, McLaughlin Run, and Sawmill Run in the Township of Wilkins. In the Borough of Osborne and the Township of Moon, starting water-surface elevations for the Ohio River were determined using a discharge-frequency curve. For Lowries Run in the Borough of Emsworth and the Townships of Kilbuck and Ohio and Sawmill Run in the City of Pittsburgh, the starting water-surface

80
elevations were based on combined frequency analyses with the Ohio River (Reference 55). In the Township of Robinson, starting water-surface elevations for Ohio River Back Channel were taken from the FIS for the Borough of Coraopolis (Reference 56). Starting water-surface elevations for the Youghiogheny River in South Versailles were derived by interpolating the river elevation for each flood at the stream mouth. The stream analysis was then started by slope/area method below this elevation. October 4, 1995, Countywide Analyses
Cross sections for the Monongahela River were obtained from a digital 3-dimensional terrain model created by utilizing an Intergraph/Inroads (I/I) software design package with the digital design map files and hydrographic data developed in 1990 (Reference 57). Water-surface elevations of floods of the selected recurrence intervals were computed using the USACE HEC-2 step-backwater computer program (Reference 50). Starting water-surface elevations for the Monongahela River were obtained from the FIS for the City of Pittsburgh (Reference 32). The elevations at the head of the Ohio River for the same recurrence intervals were used. Roughness coefficients (Manning’s “n”) used in the hydraulic computations for the Monongahela River were chosen by calibration to high-water marks from actual floods. March 16, 1998, Countywide Revision Cross sections and bridge data for the following streams were determined from field measurement and use of a Digital Terrain Model (DTM) developed from aerial photographs compiled by photogrammetric methods at a scale of 1:6,000: Gourdhead Run in the Township of Hampton; Harts Run in the Township of Hampton; Little Pine Creek East in the Townships of Indiana, O’Hara, and Shaler; Little Pine Creek West in the Borough of Etna, Town of McCandless, and Townships of Ross and Shaler; McCaslin Run in the Township of Hampton; Montour Run No. 1 in the Township of Hampton; and Pine Creek in the Boroughs of Etna and Franklin Park, Town of McCandless, and Townships of Hampton and Shaler. Water-surface elevations of floods of the selected recurrence intervals were computed using the USACE HEC-2 step-backwater computer program (Reference 49).

81
Starting water-surface elevations for Pine Creek in the Borough of Etna were based on the coincident flow of the receiving stream, the Allegheny River. For Little Pine Creek East in the Township of Shaler; Little Pine Creek West in the Borough of Etna; and Gourdhead Run, Harts Run, McCaslin Run, and Montour Run No. 1 in the Township of Hampton, starting water-surface elevations were developed assuming critical depth. July 5, 2000, Countywide Revision Water-surface elevations of floods of the selected recurrence intervals were computed using the USACE HEC-2 computer program (Reference 30). The HEC-2 model for the Allegheny River included tributary stream profiles for Herrs Island Back Channel, Twelve Mile Island Back Channel, and Fourteen Mile Island Back Channel. Cross sections for the analyses of the Allegheny River were obtained from a digital 3-dimensional terrain model created by the aforementioned I/I software design package. The model used digital design map files and hydrographic data developed during 1995 and 1996 (Reference 57). Starting water-surface elevations for Emsworth pond of the Allegheny River at the “Point” in Pittsburgh were obtained from the FIS for the City of Pittsburgh (Reference 30). The starting water-surface elevations for Pool 2 of the Allegheny River were obtained from discharge ratings developed at Dam 2. The starting elevations for Pool 3 were obtained from discharge ratings developed at Dam 3. The elevations at the head of the Ohio River (mouth of the Allegheny River) for the same recurrence intervals were used. May 15, 2003 Countywide Revision Water-surface profiles of floods of the selected recurrence intervals were developed using the USACE HEC-2 computer program (Reference 50). Starting elevations on Chartiers Creek were based on coincidental flooding with the Ohio River. This Countywide Revision The analyses consisted of determining water surface elevations for the 50-, 20-,
10-, 2-, 1-, and 0.2-percent-annual-chance flood events and floodways for
detailed studies, and 1-percent-annual-chance flood events for approximate
studies within the County. The hydraulic methods used for this analysis include
steady flow analysis using HEC-RAS version 4.0.0 (Reference 58). Cross-
sections derived from state LiDAR data or field survey data were used to prepare
the hydraulic analyses using RAMPP’s GeoRAMPP software, for both detailed
and approximate streams within an ESRI ArcMap GIS platform (Reference 59).
Channel roughness factors (Manning’s “n”) used in the hydraulic computations
were chosen by engineering judgment and field inspection of the floodplain areas.
Roughness coefficients used in the hydraulic computations for all streams are
listed in Table 7, “Summary of Roughness Coefficients.”

82
TABLE 7 – SUMMARY OF ROUGHNESS COEFFICIENTS
Stream Channel “n” Overbank “n” Abers Creek 0.022-0.050 0.035-0.120 Allegheny River 0.023-0.027 0.045-0.060 Allegheny River-Herrs Island Back Channel * * Allegheny River- Fourteen Mile Island Back Channel * * Allegheny River- Twelve Mile Island Back Channel * * Bear Run 0.018-0.040 0.080 Becks Run 0.029-0.044 0.080 Big Sewickley Creek 0.035-0.040 0.045-0.120 Boston Hollow Run 0.040-0.050 0.080-0.100 Boyds Hollow Run 0.061 0.080-0.100 Breakneck Creek 0.045 0.080 Brush Creek 1 0.027-0.050 0.100-0.150 Brush Creek 2 0.018-0.045 0.050-0.100 Bull Creek 0.030-0.040 0.060-0.100 Campbells Run 0.011-0.045 0.035-0.090 Chalfant Run 0.030-0.052 0.023-0.100 Chartiers Creek 0.023-0.045 0.031-0.800 Chartiers Creek-Diversion Channel 0.030-0.036 0.045-0.080 Crooked Run 0.015-0.055 0.020-0.080 Crouse Run 0.020-0.050 0.060-0.120 Crouse Run Tributary 0.040 0.070-0.100 Deer Creek 0.035 0.080 Dirty Camp Run 0.025-0.045 0.020-0.150 Douglass Run 0.045-0.050 0.080-0.100 Douglass Run Tributary No. 1 0.045-0.050 0.080-0.100 Douglass Run Tributary No. 2 0.040-0.050 0.080-0.140 East Thompson Run 0.040-0.050 0.050-0.100 Fallen Timber Run 0.040 0.070-0.100 Georges Run 0.013-0.045 0.040-0.070 Gillespie Run 0.035-0.055 0.040-0.080 Girty’s Run 0.012-0.048 0.020-0.080 Gourdhead Run 0.020-0.060 0.040-0.120 Graesers Run 0.031-0.040 0.030-0.12 Happy Hollow Run 0.045-0.048 0.080-0.100 Harts Run 0.035-0.040 0.020-0.080 Hoffman Run 0.020-0.045 0.070-0.100 Humms Run 0.035-0.040 0.035-0.120 Jacks Run 0.040 0.050-0.100 Leak Run 0.028-0.050 0.020-0.300 Lewis Run 0.030-0.055 0.020-0.110 Lick Run 0.025-0.060 0.020-0.130 *Data Not Available

83
TABLE 7 – SUMMARY OF ROUGHNESS COEFFICIENTS - continued
Stream Channel “n” Overbank “n Little Bull Creek 0.045-0.055 0.060-0.100 Little Deer Creek 0.035-0.040 0.080 Little Pine Creek East 0.032-0.047 0.055-0.200 Little Pine Creek West 0.020-0.060 0.040-0.150 Little Plum Creek 0.025-0.035 0.035-0.065 Lobbs Run 0.020-0.060 0.016-0.150 Long Run 0.015-0.045 0.040-0.120 Lowries Run 0.025-0.050 0.040-0.10 McCaslin Run * * McClarens Run 0.035 0.080 McLaughlin Run 0.032-0.036 0.03-0.20 Millers Run 0.020-0.040 0.025-0.200 Monongahela River 0.025-0.028 0.060 Montour Run 0.025-0.045 0.050-0.100 South Fork Montour Run 0.035 0.080 Montour Run No. 1 0.05 0.1 Moon Run 0.013-0.040 0.040-0.075 North Branch Robinson Run 0.038 0.080 North Fork Montour Run 0.035 0.080 Ohio River 0.025-0.035 0.025-0.080 Ohio River Back Channel 0.025-0.035 0.025-0.160 Painters Run 0.037-0.040 0.050-0.085 Peters Creek 0.033-0.040 0.020-0.100 Pidgeon Hollow Run * * Piersons Run 0.035-0.040 0.015-0.060 Pine Creek 0.020-0.060 0.030-0.400 Piney Fork 0.035-0.055 0.060-0.100 Pitt Street Tributary * * Plum Creek 0.037-0.050 0.040-0.200 Pucketa Creek 0.030-0.035 0.055-0.150 Robinson Run 0.025-0.038 0.045-0.150 Rochester Run 0.040 0.080 Sandy Creek 0.025-0.038 0.030-0.150 Saw Mill Run 0.021-0.060 0.025-0.080 Sawmill Run 0.033-0.045 0.045-0.100 Scrubgrass Run 0.028-0.040 0.050-0.070 Spring Garden Run 0.012-0.050 0.070-0.100 Squaw Run 0.025-0.059 0.080-0.120 Squaw Run Tributary No. 1 0.055-0.059 0.070-0.120 Squaw Run Tributary No. 2 0.015-0.055 0.100-0.120 Squaw Run Tributary No. 4 0.055-0.059 0.070-0.120 Streets Run 0.046 0.120 Thompson Run 0.014-0.045 0.030-0.120 Tributary A 0.038 0.060-0.100
*Data not available

84
TABLE 7 – SUMMARY OF ROUGHNESS COEFFICIENTS - continued
Stream Channel “n” Overbank “n Tributary to Bull Creek 0.035-0.040 0.070-0.080 Tributary 1 to Piney Fork 0.035-0.040 0.050-0.080 Turtle Creek 0.014-0.055 0.022-0.150 Unnamed Stream Along Moss Side Boulevard 0.028-0.035 0.060-0.100 West Branch Deer Creek 0.035 0.080 Whiskey Run 0.028-0.040 0.030-0.150 Whittmer Run 0.045 0.110 Wildcat Run 0.045 0.100 Wylie Run 0.048 0.070-0.100 Youghiogheny River 0.035 0.060
For FIRM panels dated July 16, 2004, or later, qualifying bench marks within a
given jurisdiction that are cataloged by the National Geodetic Survey (NGS) and
entered into the National Spatial Reference System (NSRS) as First or Second
Order Vertical and have a vertical stability classification of A, B, or C are shown
and labeled on the FIRM with their 6-character NSRS Permanent Identifier.
Bench marks cataloged by the NGS and entered into the NSRS vary widely in
vertical stability classification. NSRS vertical stability classifications are as
follows:
Stability A: Monuments of the most reliable nature, expected to hold
position/elevation well (e.g., mounted in bedrock)
Stability B: Monuments which generally hold their position/elevation well
(e.g., concrete bridge abutment)
Stability C: Monuments which may be affected by surface ground movements
(e.g., concrete monument below the frost line)
Stability D: Mark of questionable or unknown vertical stability (e.g., concrete
monument above frost line, or steel witness post)
In addition to NSRS bench marks, the FIRM may also show vertical control
monuments established by a local jurisdiction; these monuments will be
shown on the FIRM with the appropriate designations. Local monuments will
only be placed on the FIRM if the community has requested that they be
included, and if the monuments meet the aforementioned NSRS inclusion
criteria.
To obtain elevation, description, and /or location information for bench marks
shown on the FIRM for this jurisdiction, please contact the Information
85
Services Branch of the NGS at (301) 713-3242, or visit their Web site at
www.ngs.noaa.gov.
It is important to note that temporary vertical monuments are often
established during the preparation of a flood hazard analysis for the purpose
of establishing local vertical control. Although these monuments are not
shown on the FIRM, they may be found in the Technical Support Data
Notebook associated with this FIS and FIRM. Interested individuals may
contact FEMA to access this data
3.3 Vertical Datum
All FISs and FIRMs are referenced to a specific vertical datum. The vertical
datum provides a starting point against which flood, ground, and structure
elevations can be referenced and compared. Until recently, the standard vertical
datum in use for newly created or revised FISs and FIRMs was NGVD 29. With
the finalization of the North American Vertical Datum of 1988 (NAVD 88),
many FIS reports and FIRMs are being prepared using NAVD 88 as the
referenced vertical datum.
All flood elevations shown in this FIS report and on the FIRM are referenced to
NAVD 88. Structure and ground elevations in the county must, therefore, be
referenced to NAVD 88. It is important to note that adjacent counties may be
referenced to NGVD 29. This may result in differences in base flood elevations
(BFEs) across the county boundaries between the counties.
The average datum shift from NGVD 29 to NAVD 88 for Allegheny County used
was -0.52 feet.
For information regarding conversion between the NGVD29 and NAVD88, visit
the National Geodetic Survey website at www.ngs.noaa.gov, or contact the
National Geodetic Survey at the following address:
NGS Information Services
NOAA, N/NGS12
National Geodetic Survey
SSMC-3, #9202
1315 East-West Highway
Silver Spring, Maryland 20910
(301) 713-3242
86
4.0 FLOODPLAIN MANAGEMENT APPLICATIONS
The NFIP encourages State and local governments to adopt sound floodplain
management programs. To assist in this endeavor, each FIS provides 1-percent annual
chance floodplain data, which may include a combination of the following: 10-, 2-, 1-,
and 0.2-percent-annual-chance flood elevations; delineations of the 1- and 0.2-percent
annual chance floodplains; and 1-percent annual chance floodway. This information is
presented on the FIRM and in many components of the FIS, including Flood Profiles,
and Floodway Data Tables. Users should reference the data presented in the FIS as well
as additional information that may be available at the local community map repository
before making flood elevation and/or floodplain boundary determinations.
4.1 Floodplain Boundaries
To provide a national standard without regional discrimination, the 1-percent
annual chance flood has been adopted by FEMA as the base flood for floodplain
management purposes. The 0.2-percent annual chance flood is employed to
indicate additional areas of flood risk in the community. For the streams studied
in detail, the 1-percent and 0.2-percent annual chance floodplains have been
delineated using the flood elevations determined at each cross section.
For this countywide FIS, flood boundaries were interpolated using LiDAR
acquired from Pennsylvania Map that was used to develop a DTM (Reference
56).
The 1- and 0.2-percent-annual-chance floodplain boundaries are shown on the
FIRM. On this map, the 1-percent-annual-chance floodplain boundary
corresponds to the boundary of the areas of special flood hazards (Zones A, AE,
X), and the 0.2-percent-annual-chance floodplain boundary corresponds to the
boundary of areas of moderate flood hazards. In cases where the 1- and
0.2-percent-annual-chance floodplain boundaries are close together, only the
1-percent-annual-chance floodplain boundary has been shown. Small areas
within the floodplain boundaries may lie above the flood elevations, but cannot
be shown due to limitations of the map scale and/or lack of detailed topographic
data.
For the streams studied by approximate methods, only the 1-percent-annual-
chance floodplain boundary is shown on the FIRM (Exhibit 2).
4.2 Floodways
Encroachment on floodplains, such as structures and fill, reduces flood-carrying
capacity, increases flood heights and velocities, and increases flood hazards in
areas beyond the encroachment itself. One aspect of floodplain management
involves balancing the economic gain from floodplain development against the
resulting increase in flood hazard. For purposes of the NFIP, a floodway is used

87
as a tool to assist local communities in this aspect of floodplain management.
Under this concept, the area of the 1-percent annual chance floodplain is divided
into a floodway and a floodway fringe. The floodway is the channel of a stream,
plus any adjacent floodplain areas, that must be kept free of encroachment so that
the 1-percent annual chance flood can be carried without substantial increases in
flood heights. Minimum Federal standards limit such increases to 1.0 foot,
provided that hazardous velocities are not produced. The floodways in this study
are presented to local agencies as a minimum standard that can be adopted
directly or that can be used as a basis for additional floodway studies.
The floodways presented in this study were computed for certain stream segments
on the basis of equal conveyance reduction from each side of the floodplain.
Floodway widths were computed at cross sections. Between cross sections, the
floodway boundaries were interpolated. The results of the floodway computations
are tabulated for selected cross sections in Table 8, “Floodway Data” (located in
Volume 2). The computed floodways are shown on the FIRM (Exhibit 2). In
cases where the floodway and 1-percent annual chance floodplain boundaries are
either close together or collinear, only the floodway boundary is shown. Portions
of the floodway widths for the Allegheny River, Big Sewickley Creek, the
Monongahela River, Pucketa Creek, Turtle Creek, and the Youghiogheny River
extend beyond the county boundary.
The floodway for all or portions of the following streams are contained within their
channel banks: the Allegheny River, Boston Hollow Run, Boyds Hollow Run,
Chartiers Creek, Dirty Camp Run, Douglass Run, Douglass Run Tributary No. 1,
Fallen Timber Run, Gillespie Run, Happy Hollow Run, Hoffman Run, Pidgeon
Hollow Run, Pitt Street Tributary, Pucketa Creek, Spring Garden Run, Squaw Run,
Squaw Run Tributary No. 1, Squaw Run Tributary No. 2, Squaw Run Tributary
No. 4, Turtle Creek, Wildcat Run, and Wylie Run.
Floodway data was not computed for all or portions of the Allegheny River, Squaw
Run, Chartiers Creek, Chartiers Creek-Diversion Channel, Lowries Run,
McClarens Run, North Fork Montour Run, and Bear Run.
No cross section data is available for the floodways along Allegheny River –
Twelve Mile Island Back Channel and Allegheny River – Fourteen Mile Island
Back Channel, therefore information for these flooding sources is not included in
Table 8, “Floodway Data” (located in Volume 2).
Encroachment into areas subject to inundation by floodwaters having hazardous
velocities aggravates the risk of flood damage, and heightens potential flood
hazards by further increasing velocities. A listing of stream velocities at selected
cross sections is provided in Table 8, "Floodway Data" (located in Volume 2). To
reduce the risk of property damage in areas where the stream velocities are high,
the community may wish to restrict development in areas outside the floodway.

88
Near the mouths of streams studied in detail, floodway computations are made
without regard to flood elevations on the receiving water body. Therefore,
"Without Floodway" elevations presented in Table 8 (located in Volume 2) for
certain downstream cross sections of the following streams are lower than the
regulatory flood elevations in that area, which must take into account the 1-percent
annual chance flooding due to backwater from other sources: Becks Run, Big
Sewickley Creek, Boston Hollow Run, Boyds Hollow Run, Campbells Run,
Gourdhead Run, Lewis Run, Little Pine
Creek East, Little Pine Creek West, Little Plum Creek, Lobbs Run, Long Run,
Millers Run, Montour Run, Montour Run No. 1, Moon Run, Piersons Run, Pine
Creek, Pucketa Creek, Robinson Run, Sandy Creek, Scrubgrass Run, Thompson
Run, Wylie Run, and the Youghiogheny River.
The area between the floodway and 1-percent annual chance floodplain
boundaries is termed the floodway fringe. The floodway fringe encompasses the
portion of the floodplain that could be completely obstructed without increasing
the water-surface elevation of the 1-percent annual chance flood by more than 1.0
foot at any point. Typical relationships between the floodway and the floodway
fringe and their significance to floodplain development are shown in Figure 1,
"Floodway Schematic.”
Figure 1: FLOODWAY SCHEMATIC

89
5.0 INSURANCE APPLICATIONS
For flood insurance rating purposes, flood insurance zone designations are assigned to a
community based on the results of the engineering analyses. These zones are as follows:
Zone A
Zone A is the flood insurance rate zone that corresponds to the 1-percent-annual-chance
floodplains that are determined in the FIS report by approximate methods. Because
detailed hydraulic analyses are not performed for such areas no BFEs, or depths are
shown within this zone.
Zone AE
Zone AE is the flood insurance rate zone that corresponds to the 1-percent-annual-chance
floodplains that are determined in the FIS report by detailed methods. Whole-foot BFEs
derived from the detailed hydraulic analyses are shown at selected intervals within this
zone.
Zone X
Zone X is the flood insurance rate zone that corresponds to areas outside the
0.2-percent-annual-chance floodplain, areas within the 0.2-percent-annual-chance
floodplain, areas of 1-percent-annual-chance flooding where average depths are less than
1 foot, areas of 1-percent-annual-chance flooding where the contributing drainage area is
less than 1 square mile (sq. mi.), and areas protected from the base flood by levees. No
BFEs or depths are shown within this zone.
6.0 FLOOD INSURANCE RATE MAP
The FIRM is designed for flood insurance and floodplain management applications.
For flood insurance applications, the map designates flood insurance rate zones as
described in Section 5.0 and, in the 1-percent-annual-chance floodplains that were
studied by detailed methods, shows selected whole-foot BFEs or average depths.
Insurance agents use zones and BFEs in conjunction with information on structures and
their contents to assign premium rates for flood insurance policies.
For floodplain management applications, the map shows by tints, screens, and symbols,
the 1- and 0.2-percent-annual-chance floodplains, floodways, and the locations of
selected cross sections used in the hydraulic analyses and floodway computations.

90
The current FIRM presents flooding information for the entire geographic area of
Allegheny County. Previously, separate Flood Hazard Boundary Maps, Flood Boundary
and Floodway Maps or FIRMs were prepared for each incorporated community with
identified flood hazards. Historical map dates relating to the maps prepared for each
community prior to the October 4, 1995 initial countywide FIS are presented in Table 9,
“Community Map History.”
7.0 OTHER STUDIES
Information pertaining to revised and unrevised flood hazards for each jurisdiction within
Allegheny County has been compiled into this FIS. Therefore, this FIS supersedes all
previously printed FIS reports, and FIRMs for all of the incorporated jurisdictions within
Allegheny County.
This is a multi-volume FIS. Each volume may be revised separately, in which case it
supersedes the previously printed volume. Users should refer to the Table of Contents in
Volume 1 for the current effective date of each volume; volumes bearing these dates
contain the most up-to-date flood hazard data.
8.0 LOCATION OF DATA
Information concerning the pertinent data used in the preparation of this study can be
obtained by contacting Federal Insurance and Mitigation Division, FEMA Region III,
One Independence Mall, Sixth Floor, 615 Chestnut Street, Philadelphia, PA 19106-4404.

91
COMMUNITY NAME
INITIAL IDENTIFICATION
FLOOD HAZARD BOUNDARY MAP REVISIONS DATE
FIRM EFFECTIVE DATE
FIRM REVISIONS DATE
Aleppo, Township of May 10, 1974 April 23, 1976 September 1, 1986
Aspinwall, Borough of December 28, 1973 May 14, 1976 December 18, 1979
Avalon, Borough of February 1, 1974 January 2, 1976 December 15, 1978
Baldwin, Borough of December 17, 1976 None August 15, 1978
Bell Acres, Borough of June 7, 1974 April 23, 1976 May 1, 1985
Bellevue, Borough of December 28, 1973 April 2, 1976 December 15, 1978
Ben Avon, Borough of December 28, 1973 June 4, 1976 July 16, 1981
Bethel Park, Municipality of December 10, 1976 None June 15, 1981
Blawnox, Borough of June 14, 1974 May 7, 1976 September 3, 1980
Brackenridge, Borough of February 15, 1974 June 4, 1976 August 15, 1980
TA
BL
E 9
FEDERAL EMERGENCY MANAGEMENT AGENCY
ALLEGHENY COUNTY, PA (ALL JURISDICTIONS)
COMMUNITY MAP HISTORY

92
COMMUNITY NAME
INITIAL IDENTIFICATION
FLOOD HAZARD BOUNDARY MAP REVISIONS DATE
FIRM EFFECTIVE DATE
FIRM REVISIONS DATE
Braddock, Borough of March 29, 1974 June 18, 1976 September 30, 1980
Braddock Hills, Borough of May 10, 1974 April 9, 1976 August 10, 1979
Bradford Woods, Borough of January 3, 1975 None November 6, 1981
Bridgeville, Borough of February 8, 1974 April 9, 1976 January 5, 1984
Carnegie, Borough of February 8, 1974 May 7, 1976 May 1, 1978
Cheswick, Borough of February 1, 1974 August 6, 1976 June 18, 1980
Churchill, Borough of December 10, 1976 None December 15, 1978
Clairton, City of January 4, 1974 January 16, 1976 October 16, 1979
Collier, Township of July 19, 1974 April 30, 1976 March 15, 1982
Coraopolis, Borough of March 8, 1974 April 9, 1976 June 15, 1979
Crafton, Borough of February 1, 1974 April 30, 1976 December 19, 1980
TA
BL
E 9
FEDERAL EMERGENCY MANAGEMENT AGENCY
ALLEGHENY COUNTY, PA (ALL JURISDICTIONS)
COMMUNITY MAP HISTORY

93
COMMUNITY
NAME
INITIAL
IDENTIFICATION
FLOOD HAZARD
BOUNDARY MAP
REVISIONS DATE
FIRM
EFFECTIVE DATE
FIRM
REVISIONS DATE
Crescent, Township of May 31, 1974 June 4, 1976 July 16, 1981
Dravosburg, Borough of December 28, 1973 June 18, 1976 June 15, 1979
Duquesne, City of April 12, 1974 April 16, 1976 September 14, 1979
East Deer, Township of September 20, 1974 May 14, 1976 August 15, 1980
Edgeworth, Borough of March 15, 1974 May 28, 1976 May 1, 1980
Elizabeth, Borough of January 9, 1974 April 16, 1976 July 16, 1981
Elizabeth, Township of March 29, 1974 June 18, 1976 March 15, 1977 March 16, 1979
Emsworth, Borough of February 8, 1974 None September 30, 1980
Etna, Borough of July 26, 1974 October 24, 1975 September 1, 1978
Fawn, Township of November 29, 1974 February 5, 1982 January 18, 1984
TA
BL
E 9
FEDERAL EMERGENCY MANAGEMENT AGENCY
ALLEGHENY COUNTY, PA (ALL JURISDICTIONS)
COMMUNITY MAP HISTORY

94
COMMUNITY
NAME
INITIAL
IDENTIFICATION
FLOOD HAZARD
BOUNDARY MAP
REVISIONS DATE
FIRM
EFFECTIVE DATE
FIRM
REVISIONS DATE
Findlay, Township of September 20, 1974 June 4, 1976 November 18, 1988
Forest Hills, Borough of May 10, 1974 September 10, 1976 September 1, 1986
Forward, Township of July 19, 1974 May 7, 1976 February 1, 1980
Fox Chapel, Borough of July 26, 1974 August 6, 1976 April 15, 1977
Franklin Park, Borough of July 30, 1976 None January 1, 1982
Frazer, Township of November 5, 1976 None December 19, 1980
Glassport, Borough of December 7, 1973 June 18, 1976 June 15, 1979
Glenfield, Borough of
March 29, 1974 May 7, 1976 March 18, 1980
Osborne, Borough of
June 1, 1973 May 21, 1976 November 15, 1979
Green Tree, Borough of June 21, 1974 May 14, 1976 July 16, 1981
Hampton, Township of March 15, 1974 May 28, 1976 May 1, 1978
Harmar, Township of September 6, 1974 July 30, 1976 July 2, 1980
TA
BL
E 9
FEDERAL EMERGENCY MANAGEMENT AGENCY
ALLEGHENY COUNTY, PA (ALL JURISDICTIONS)
COMMUNITY MAP HISTORY

95
COMMUNITY NAME
INITIAL IDENTIFICATION
FLOOD HAZARD BOUNDARY MAP REVISIONS DATE
FIRM EFFECTIVE DATE
FIRM REVISIONS DATE
Harrison, Township of November 2, 1973 June 4, 1976 September 29, 1978 July 2, 1982
Haysville, Borough of August 9, 1974 August 6, 1976 March 18, 1980
Heidelberg, Borough of February 1, 1974 June 4, 1976 June 15, 1981
Indiana, Township of September 6, 1974 May 14, 1976 October 18, 1983
Jefferson Hills, Borough of June 14, 1974 June 25, 1976 April 1, 1980
Kennedy, Township of September 20, 1974 May 21, 1976 February 15, 1980
Kilbuck, Township of September 13, 1974 July 16, 1976 February 1, 1980
Leet, Township of May 31, 1974 May 28, 1976 September 14, 1979
November 12, 1976
Leetsdale, Borough of June 21, 1974 May 7, 1976 November 19, 1980
Liberty, Borough of December 28, 1973 May 14, 1976 November 1, 1979
TA
BL
E 9
FEDERAL EMERGENCY MANAGEMENT AGENCY
ALLEGHENY COUNTY, PA (ALL JURISDICTIONS)
COMMUNITY MAP HISTORY

96
COMMUNITY
NAME
INITIAL
IDENTIFICATION
FLOOD HAZARD
BOUNDARY MAP
REVISIONS DATE
FIRM
EFFECTIVE DATE
FIRM
REVISIONS DATE
Lincoln, Borough of December 28, 1973 April 23, 1976 September 28, 1979
Marshall, Township of September 20, 1974 September 24, 1976 November 4, 1981
McCandless, Town of September 20, 1974 June 4, 1976 June 18, 1980
McDonald, Borough of July 26, 1974 May 7, 1976 August 15, 1983
McKeesport, City of December 28, 1973 May 28, 1976 January 3, 1979
McKees Rocks, Borough of August 31, 1973 June 18, 1976 May 16, 1977 January 1, 1982
Millvale, Borough of December 28, 1973 April 23, 1976 July 16, 1979
Monroeville, Municipality of July 26, 1974 May 28, 1976 August 1, 1979
Moon, Township of September 6, 1974 June 4, 1976 August 15, 1979
Mt. Lebanon, Municipality of September 6, 1974 January 2, 1976 June 30, 1976
Munhall, Borough of January 9, 1974 June 25, 1976 April 24, 1981
TA
BL
E 9
FEDERAL EMERGENCY MANAGEMENT AGENCY
ALLEGHENY COUNTY, PA (ALL JURISDICTIONS)
COMMUNITY MAP HISTORY
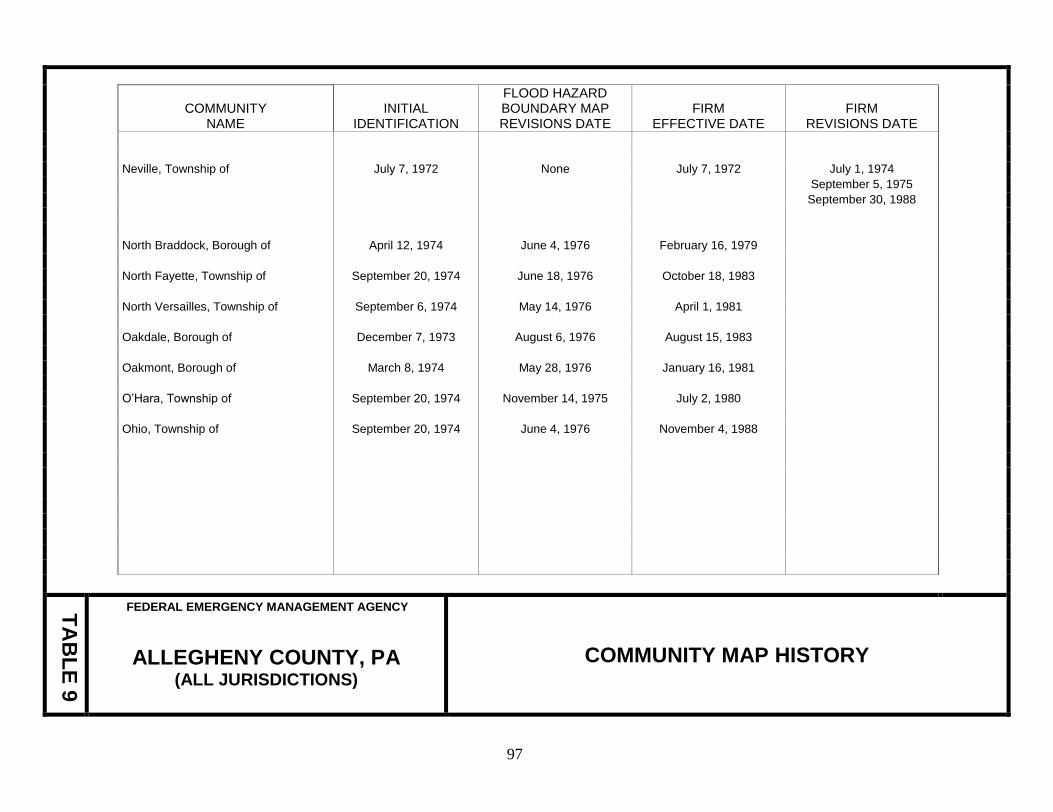
97
COMMUNITY NAME
INITIAL IDENTIFICATION
FLOOD HAZARD BOUNDARY MAP REVISIONS DATE
FIRM EFFECTIVE DATE
FIRM REVISIONS DATE
Neville, Township of July 7, 1972 None July 7, 1972 July 1, 1974
September 5, 1975
September 30, 1988
North Braddock, Borough of April 12, 1974 June 4, 1976 February 16, 1979
North Fayette, Township of September 20, 1974 June 18, 1976 October 18, 1983
North Versailles, Township of September 6, 1974 May 14, 1976 April 1, 1981
Oakdale, Borough of December 7, 1973 August 6, 1976 August 15, 1983
Oakmont, Borough of March 8, 1974 May 28, 1976 January 16, 1981
O’Hara, Township of September 20, 1974 November 14, 1975 July 2, 1980
Ohio, Township of September 20, 1974 June 4, 1976 November 4, 1988
TA
BL
E 9
FEDERAL EMERGENCY MANAGEMENT AGENCY
ALLEGHENY COUNTY, PA (ALL JURISDICTIONS)
COMMUNITY MAP HISTORY

98
COMMUNITY NAME
INITIAL IDENTIFICATION
FLOOD HAZARD BOUNDARY MAP REVISIONS DATE
FIRM EFFECTIVE DATE
FIRM REVISIONS DATE
Penn Hills, Municipality of September 20, 1974 December 26, 1975 June 15, 1981
Pennsbury Village, Borough of October 4, 1995 None October 4, 1995
Pine, Township of August 2, 1974 July 2, 1976 September 22, 1978
Pitcairn, Borough of July 30, 1976 None April 1, 1980
Pittsburgh, City of March 8, 1974 August 20, 1976 December 15, 1981
Plum, Borough of June 28, 1974 May 21, 1976 September 16, 1981
Port Vue, Borough of January 19, 1974 May 21, 1976 September 28, 1979
Rankin, Borough of March 15, 1974 June 18, 1976 July 2, 1980
Reserve, Township of April 15, 1977 None April 15, 1977
Richland, Township of August 2, 1974 May 28, 1976 September 22, 1978
Robinson, Township of September 20, 1974 August 20, 1976 February 3, 1982
Ross, Township of June 7, 1974 October 3, 1975 December 18, 1979
TA
BL
E 9
FEDERAL EMERGENCY MANAGEMENT AGENCY
ALLEGHENY COUNTY, PA (ALL JURISDICTIONS)
COMMUNITY MAP HISTORY
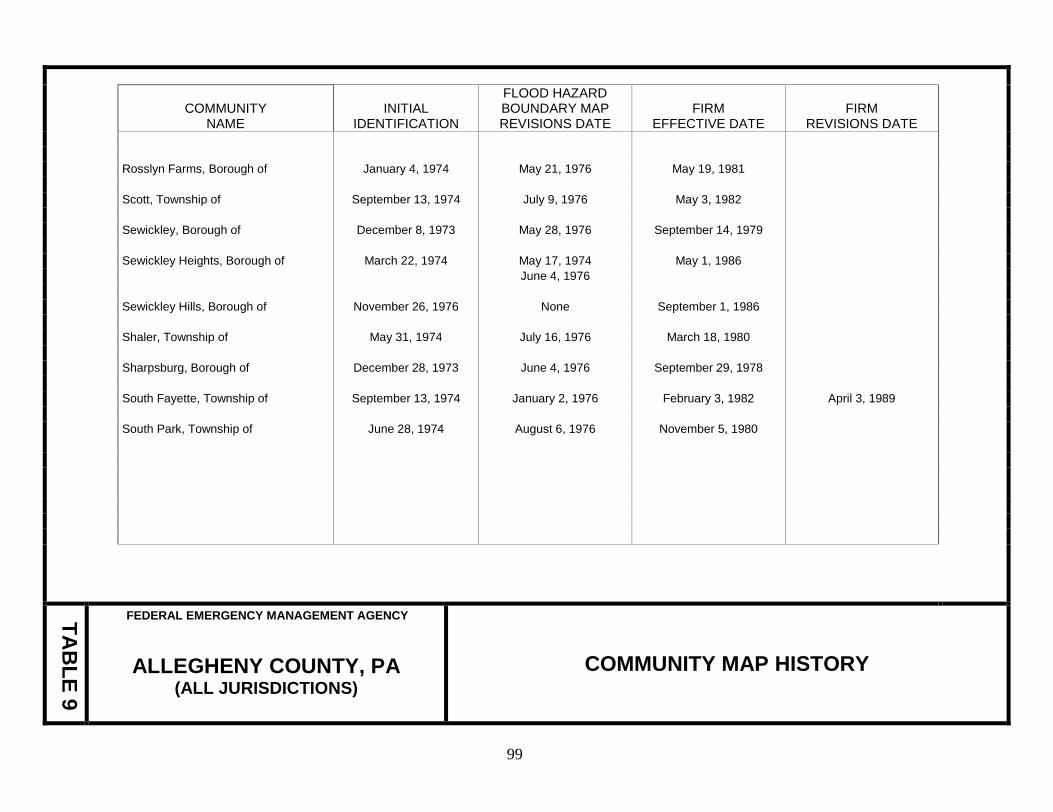
99
COMMUNITY NAME
INITIAL IDENTIFICATION
FLOOD HAZARD BOUNDARY MAP REVISIONS DATE
FIRM EFFECTIVE DATE
FIRM REVISIONS DATE
Rosslyn Farms, Borough of January 4, 1974 May 21, 1976 May 19, 1981
Scott, Township of September 13, 1974 July 9, 1976 May 3, 1982
Sewickley, Borough of December 8, 1973 May 28, 1976 September 14, 1979
Sewickley Heights, Borough of March 22, 1974 May 17, 1974 May 1, 1986
June 4, 1976
Sewickley Hills, Borough of November 26, 1976 None September 1, 1986
Shaler, Township of May 31, 1974 July 16, 1976 March 18, 1980
Sharpsburg, Borough of December 28, 1973 June 4, 1976 September 29, 1978
South Fayette, Township of September 13, 1974 January 2, 1976 February 3, 1982 April 3, 1989
South Park, Township of June 28, 1974 August 6, 1976 November 5, 1980
TA
BL
E 9
FEDERAL EMERGENCY MANAGEMENT AGENCY
ALLEGHENY COUNTY, PA (ALL JURISDICTIONS)
COMMUNITY MAP HISTORY

100
COMMUNITY NAME
INITIAL IDENTIFICATION
FLOOD HAZARD BOUNDARY MAP REVISIONS DATE
FIRM EFFECTIVE DATE
FIRM REVISIONS DATE
South Versailles, Township of August 2, 1974 July 2, 1976 August 1, 1979
Springdale, Borough of February 8, 1974 July 16, 1976 July 16, 1980
Springdale, Township of May 24, 1974 May 14, 1976 July 16, 1980
Stowe, Township of November 29, 1974 June 18, 1976 February 15, 1980
Swissvale, Borough of May 14, 1974 June 4, 1976 June 30, 1976
Tarentum, Borough of February 15, 1974 May 14, 1976 August 15, 1980
Thornburg, Borough of October 4, 1995 None October 4, 1995
Trafford, Borough of1 August 30, 1974 December 19, 1975 September 28, 1979
Turtle Creek, Borough of February 1, 1974 May 28, 1976 November 19, 1980
Upper St. Clair, Township of May 31, 1974 June 18, 1976 March 15, 1984 April 17, 1989
May 23, 1980
Verona, Borough of May 31, 1974 June 4, 1974 January 16, 1981
Versailles, Borough of March 29, 1974 May 28, 1976 October 18, 1988
1
This community was not part of the October 4, 1995, countywide Flood Insurance Study. It became part
of the countywide Flood Insurance Study in the August 5, 1997, revision.
TA
BL
E 9
FEDERAL EMERGENCY MANAGEMENT AGENCY
ALLEGHENY COUNTY, PA (ALL JURISDICTIONS)
COMMUNITY MAP HISTORY

101
COMMUNITY NAME
INITIAL IDENTIFICATION
FLOOD HAZARD BOUNDARY MAP REVISIONS DATE
FIRM EFFECTIVE DATE
FIRM REVISIONS DATE
Wall, Borough of April 25, 1975 None November 19, 1987
West Deer, Township of September 20, 1974 June 25, 1976 October 18, 1983
West Elizabeth, Borough of November 30, 1973 July 23, 1976 September 29, 1978 July 25, 1980
West Homestead, Borough of December 28, 1973 June 18, 1976 August 15, 1980
West Mifflin, Borough of March 22, 1974 July 16, 1976 February 15, 1980
West View, Borough of May 31, 1974 May 21, 1976 June 30, 1976
White Oak, Borough of January 16, 1974 September 10, 1976 September 14, 1979
Wilkins, Township of May 10, 1974 June 25, 1976 September 29, 1978
Wilmerding, Borough of May 3, 1974 May 21, 1976 August 1, 1979
TA
BL
E 9
FEDERAL EMERGENCY MANAGEMENT AGENCY
ALLEGHENY COUNTY, PA (ALL JURISDICTIONS)
COMMUNITY MAP HISTORY

102
9.0 BIBLIOGRAPHY AND REFERENCES
1. U.S. Census Bureau. “State and County QuickFacts.” Allegheny County, PA.
http://quickfacts.census.gov/qfd/states/42/42003.html.
2. U.S. Department of Agriculture, Soil Conservation Service, in cooperation with
College of Agriculture of the Pennsylvania State University and the Pennsylvania
Department of Environmental Resources, State Conservation Commission,
Beaver and Lawrence Counties, Interim Soil Survey Report, Soil Interpretations,
Volume I, Washington, D.C., 1973.
3. U.S. Department of Agriculture, Soil Conservation Service, in cooperation with
College of Agriculture of the Pennsylvania State University and the Pennsylvania
Department of Environmental Resources, State Conservation Commission,
Beaver and Lawrence Counties, Interim Soil Survey Report, Soil Interpretations,
Volume II, Washington, D.C., 1973.
4. Turtle Creek Watershed Association, Inc., Urban Development and Small
Watershed Flooding, A Case Study of the Upper Abers Creek Watershed Part of
the Turtle Creek System, Turtle Creek, Pennsylvania, 1975.
5. U.S. Army Corps of Engineers, Pittsburgh District, Tropical Storm Agnes June
1972 Post Flood Report, Volumes I and II, Pittsburgh, Pennsylvania, 1974.
6. U.S. Department of the Interior, Geological Survey, Magnitude and Frequency of
Floods in the United States, Part 3-A, Ohio River Except Cumberland and
Tennessee River Basins, Water Supply Paper, Washington, D.C., 1975, U.S.
Government Printing Office, 1965.
7. U.S. Department of the Interior, Geological Survey, Water Resources Data for
Pennsylvania, Part 1, Surface Water Records, Harrisburg, Pennsylvania, 1961 –
1975.
8. Commonwealth of Pennsylvania, Bureau of Resources Programming, Department
of Environmental Resources, Flood Damages Inventory, Harrisburg,
Pennsylvania, 1974.
9. Personal Communication, Joseph Lescinsky, Pittsburgh Office of the U.S.
Geological Survey, Pittsburgh, Pennsylvania, 1980.

103
10. U.S. Army Corps of Engineers, North Atlantic Division, Water Resources
Development in Pennsylvania, 1973.
11. Pennsylvania Department of Internal Affairs, Topographic and Geologic Survey,
Geologic Map of Pennsylvania, Harrisburg, Pennsylvania, 1960.
12. Pittsburgh, Pennsylvania, 1968, “Flood Brought 5 Deaths in 1896,” “The North
Hills News Record,” July 2, 1972, page 6.
13. The Gateway Engineers Inc., History of Flooding, Borough of Baldwin,
Allegheny County, Pennsylvania, Pittsburgh, Pennsylvania, October 1973.
14. Commonwealth of Pennsylvania, The Pennsylvania Department of
Transportation, Hydraulic and Hydrologic Report for Little Bull Creek,
Legislative Route 1037-5, August 1970
15. U.S. Army Corps of Engineers, Pittsburgh District, Floodplain Information,
Peters Creek, Jefferson, Pennsylvania, Pittsburgh, Pennsylvania, 1971.
16. Municipality of Bethel Park, Post Flood Reports, Operation Flood Watch, July
31, 1974; August 9, 1976; April 15, 1977; Municipality of Bethel Park,
Allegheny County, Pennsylvania.
17. Borough of Turtle Creek, Turtle Creek, 75th
Anniversary, 1892 – 1967, Turtle
Creek, Pennsylvania, 1967
18. Borough of Turtle Creek, Turtle Creek, 75th
Anniversary, 1892-1967, Turtle
Creek, Pennsylvania, 1967.
19. Allegheny County Department of Planning and Development, Turtle Creek
Watershed Erosion and Sedimentation Control Study, Allegheny County,
Pennsylvania, August 1974.
20. Municipality of Penn Hills, Allegheny County, Pennsylvania, The Penn Hills
Flood Control Ordinance, Ordinance No. 1451, February 1976.
21. Water Resources Council, “A Uniform Technique for Determining Flood Flow
Frequency,” Bulletin 15, Washington, D.C., December 1967.

104
22. Water Resources Council, “Guidelines for Determining Flood Flow Frequency,”
Bulletin 17, Washington, D.C., March 1976.
23. Water Resources Council, “Guidelines for Determining Flood Flow Frequency,”
Bulletin 17A, Washington, D.C., June 1977.
24. U.S. Department of the Interior, Geological Survey, Office of Water Data
Collection, Interagency Advisory Committee on Water Data,” Guidelines for
Determining Flood Flow Frequency,” Bulletin 17B, Reston, Virginia, Revised
September 1981, revised March 1982.
25. The Pennsylvania State University, Institute for Research on Land and Water
Resources, PSU III, Flood Peak Frequency Design Manual by B. M. Reich, Y. P.
King, and E. L. White, University Park, Pennsylvania, 1971.
26. Leo R. Beard, Statistical Methods in Hydrology, Sacramento, California, U.S.
Army Corps of Engineers, January 1962.
27. U.S. Army Corps of Engineers, Pittsburgh District, Flow frequency
Determination of Ungaged Streams in the Upper Ohio River Basin, Pittsburgh,
Pennsylvania, April 1977
28. U.S. Department of Agriculture, Soil Conservation Service, Technical Release
No. 55, Urban Hydrology for Small Watersheds, Washington, D.C., January
1975.
29. Ven Te Chow, ed., Handbook of Applied Hydrology, New York, McGraw-Hill,
1964.
30. Personal Communication, William Salesky, Hydrology Branch, U.S. Army Corps
of Engineers, Pittsburgh District, Pittsburgh, Pennsylvania, 1979.
31. Bert Aron and David F. Lakatos, Penn State Runoff Model for IBM-PC, User
Manual, October 1989.
32. Federal Emergency Management Agency, Federal Insurance Administration,
Flood Insurance Study, City of Pittsburgh, Allegheny County, Pennsylvania,
Washington, D.C., June 15, 1981 (Flood Insurance Study report), December 15,
1981 (Flood Insurance Rate Map).
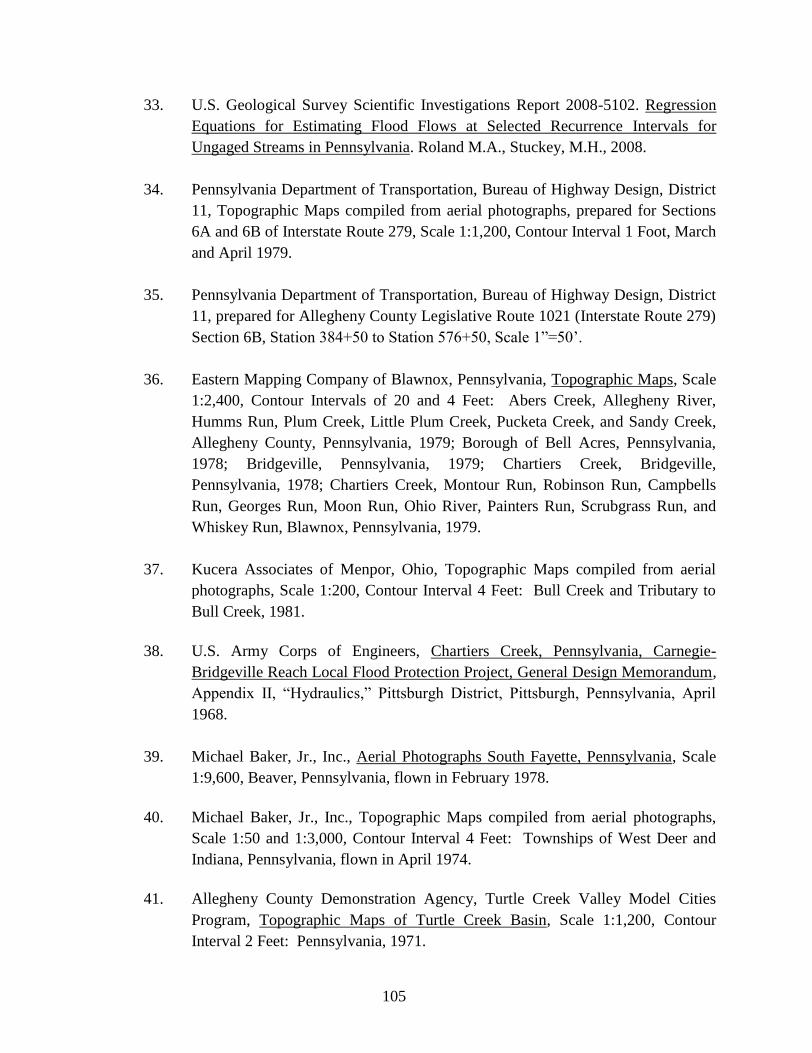
105
33. U.S. Geological Survey Scientific Investigations Report 2008-5102. Regression
Equations for Estimating Flood Flows at Selected Recurrence Intervals for
Ungaged Streams in Pennsylvania. Roland M.A., Stuckey, M.H., 2008.
34. Pennsylvania Department of Transportation, Bureau of Highway Design, District
11, Topographic Maps compiled from aerial photographs, prepared for Sections
6A and 6B of Interstate Route 279, Scale 1:1,200, Contour Interval 1 Foot, March
and April 1979.
35. Pennsylvania Department of Transportation, Bureau of Highway Design, District
11, prepared for Allegheny County Legislative Route 1021 (Interstate Route 279)
Section 6B, Station 384+50 to Station 576+50, Scale 1”=50’.
36. Eastern Mapping Company of Blawnox, Pennsylvania, Topographic Maps, Scale
1:2,400, Contour Intervals of 20 and 4 Feet: Abers Creek, Allegheny River,
Humms Run, Plum Creek, Little Plum Creek, Pucketa Creek, and Sandy Creek,
Allegheny County, Pennsylvania, 1979; Borough of Bell Acres, Pennsylvania,
1978; Bridgeville, Pennsylvania, 1979; Chartiers Creek, Bridgeville,
Pennsylvania, 1978; Chartiers Creek, Montour Run, Robinson Run, Campbells
Run, Georges Run, Moon Run, Ohio River, Painters Run, Scrubgrass Run, and
Whiskey Run, Blawnox, Pennsylvania, 1979.
37. Kucera Associates of Menpor, Ohio, Topographic Maps compiled from aerial
photographs, Scale 1:200, Contour Interval 4 Feet: Bull Creek and Tributary to
Bull Creek, 1981.
38. U.S. Army Corps of Engineers, Chartiers Creek, Pennsylvania, Carnegie-
Bridgeville Reach Local Flood Protection Project, General Design Memorandum,
Appendix II, “Hydraulics,” Pittsburgh District, Pittsburgh, Pennsylvania, April
1968.
39. Michael Baker, Jr., Inc., Aerial Photographs South Fayette, Pennsylvania, Scale
1:9,600, Beaver, Pennsylvania, flown in February 1978.
40. Michael Baker, Jr., Inc., Topographic Maps compiled from aerial photographs,
Scale 1:50 and 1:3,000, Contour Interval 4 Feet: Townships of West Deer and
Indiana, Pennsylvania, flown in April 1974.
41. Allegheny County Demonstration Agency, Turtle Creek Valley Model Cities
Program, Topographic Maps of Turtle Creek Basin, Scale 1:1,200, Contour
Interval 2 Feet: Pennsylvania, 1971.

106
42. Tallamy, Van Kuren, Gertes & Theilman, of Lanse, Pennsylvania, Topographic
Maps compiled from aerial photographs, Scale 1:150 and 1:1,800, Contour
Interval 4 Feet: Township of Bridgeville, Pennsylvania, September 1981;
Montour Run and South Fork Montour Run, Township of North Fayette,
Pennsylvania, October 30, 1981.
43. Michael Baker, Jr., Inc., of Beaver, Pennsylvania, Topographic Maps, Scale
1”=400’, Contour Interval 4 Feet: Robinson Run and North Branch Robinson
Run, Township of North Fayette, Pennsylvania; Borough of McDonald,
Pennsylvania, December 1978.
44. U.S. Army Corps of Engineers, Pittsburgh District, Ohio River Topography,
Pittsburgh to Mile 30.9, Scale 1:2,400, Contour Interval 5 Feet, March 1964.
45. U.S. Army Corps of Engineers, Pittsburgh District, Allegheny River Topographic
Maps, Scale 1:4,800, Contour Interval 5 Feet: Pittsburgh, Pennsylvania, 1967.
46. City of Pittsburgh Map, Scale 1:9,600, 1964.
47. U.S. Department of the Interior, Geological Survey, 7.5-Minute Series
Topographic Maps, Scale 1:24,000, Contour Intervals of 20, 10, and 5 Feet:
Aliquippa, Pennsylvania, 1954, Photorevised 1979; Ambridge, Pennsylvania,
1960, Photorevised 1979; Baden, Pennsylvania, 1953, Photorevised 1979;
Braddock, Pennsylvania, 1960, Photorevised 1979; Bridgeville, Pennsylvania,
1960, Photorevised 1979; Canonsburg, Pennsylvania, 1960, Photorevised 1979;
Clinton, Pennsylvania, 1954, Photorevised 1979; Curtisville, Pennsylvania, 1953,
Photorevised 1969; Donora, Pennsylvania, 1954, Photorevised 1979; Emsworth,
Pennsylvania, 1960, Photorevised 1979; Freeport, Pennsylvania, 1953,
Photorevised 1969; Glassport, Pennsylvania, 1960, Photorevised 1979;
Glenshaw, Pennsylvania, 1960, Photorevised 1979; Mars, Pennsylvania, 1953,
Photorevised 1969; McKeesport, Pennsylvania, 1960, Photorevised 1979;
Monongahela, Pennsylvania, 1954, Photorevised 1979; Murrysville,
Pennsylvania, 1953, Photorevised 1969; New Kensington East, Pennsylvania,
1953, Photorevised, 1979; New Kensington West, Pennsylvania, 1960,
Photorevised 1979; Oakdale, Pennsylvania, 1960, Photorevised 1979; Pittsburgh
East, Pennsylvania, 1960, Photorevised 1969; Pittsburgh West, Pennsylvania,
1960, Photorevised 1979; Valencia, Pennsylvania, 1950, Photorevised 1969.

107
48. U.S. Army Corps of Engineers, Pittsburgh District, Turtle Creek Flood Protection
Project, Turtle Creek Basin, Plan and Profile, Unit 4, Pittsburgh, Pennsylvania,
January 1967.
49. U.S. Army Corps of Engineers, Pittsburgh District, Youghiogheny River
Topographic Maps, Scale 1:4,800, Contour Interval 5 Feet: Pittsburgh,
Pennsylvania, February 1933.
50. U.S. Army Corps of Engineers, Hydrologic Engineering Center, HEC-2 Water-
Surface Profiles, Generalized Computer Program, Davis, California, May 1991.
51. U.S. Department of the Interior, Bureau of Reclamation, Design of Small Dams,
Washington, D.C., U.S. Government Printing Office, 1974.
52. Ven Te Chow, Open-Channel Hydraulics, New York, McGraw-Hill, 1959.
53. Henderson, F. M., Open-Channel Flow, New York, The MacMillan Company,
1966.
54. Proceedings, Thirteenth Congress of the International Association for Hydraulic
Research, Simulation of Flow Through Broad Crest Navigation Dams with Radial
Gates, Kyoto, Japan, March 1969.
55. U.S. Army Corps of Engineers, Pittsburgh District, Procedure for Determining
the Combined Effects of Tributary and Main Stream Floods on Flood Frequency
Elevations on and Near the Mouth of a Small Tributary, Pittsburgh, Pennsylvania,
1979.
56. Federal Emergency Management Agency, Federal Insurance Administration,
Flood Insurance Study, Borough of Coraopolis, Allegheny County, Pennsylvania,
Washington, D.C., December 1978 (Flood Insurance Study report), June 15, 1979
(Flood Insurance Rate Map).
57. Intergraph Corporation, Intergraph/Inroads Software Package, 1992.
58. U.S. Army Corps of Engineers, Hydrologic Engineering Center, HEC 4.0.0
Water Surface Profiles, Generalized Computer Program, Davis, California, March
2008.
59. Pennsylvania Department of Conservation and Natural Resources (DCNR).
PAMAP Program LiDAR. 2008. Online link: http://www.dcnr.state.pa.us/
topogeo/pamap/lidar.aspx.