allele-specific chromatin recruitment and therapeutic
TRANSCRIPT

Article
Allele-Specific Chromatin
Recruitment andTherapeutic Vulnerabilities of ESR1 ActivatingMutationsGraphical Abstract
Highlights
d Themutant ER cistromes are different from the E2-stimulated
WT ER cistrome
d The ER mutant-selective cistromes drive endocrine
resistance and metastases
d The ER Y537S and D538G mutants have distinct cistromes
and transcriptomes
d THZ1 blocks mutant ER phosphorylation at S118 and inhibits
mutant ER cell growth
Jeselsohn et al., 2018, Cancer Cell 33, 173–186February 12, 2018 ª 2018 Elsevier Inc.https://doi.org/10.1016/j.ccell.2018.01.004
Authors
Rinath Jeselsohn, Johann S. Bergholz,
Matthew Pun, ..., Eric P. Winer,
Jean Zhao, Myles Brown
In Brief
Jeselsohn et al. show that estrogen
receptor a (ER) mutations found in
endocrine treatment-resistant metastatic
breast cancers confer not only ligand-
independent ER functions, but also allele-
specific neomorphic properties.
Importantly, the authors identify potential
approaches for treating these breast
cancers.

Cancer Cell
Article
Allele-Specific Chromatin Recruitmentand Therapeutic Vulnerabilities of ESR1Activating MutationsRinath Jeselsohn,1,2,3 Johann S. Bergholz,4,5 Matthew Pun,1,2 MacIntosh Cornwell,1,2 Weihan Liu,1,2 Agostina Nardone,1,2
Tengfei Xiao,1,2 Wei Li,1,6 Xintao Qiu,1 Gilles Buchwalter,1,2 Ariel Feiglin,7 Kayley Abell-Hart,4,5 Teng Fei,1,2 Prakash Rao,1
Henry Long,1 Nicholas Kwiatkowski,4,5 Tinghu Zhang,4,5 Nathanael Gray,4,5 Diane Melchers,8 Rene Houtman,8
X. Shirley Liu,1,6 Ofir Cohen,2,9 Nikhil Wagle,2,3,9 Eric P. Winer,2,3 Jean Zhao,4,5 and Myles Brown1,2,3,10,*1Center for Functional Cancer Epigenetics, Dana Farber Cancer Institute, Boston, MA 02210, USA2Department of Medical Oncology, Dana Farber Cancer Institute, Boston, MA 02210, USA3Department of Medicine, Brigham and Women’s Hospital and Harvard Medical School, Boston, MA 02210, USA4Department of Cancer Biology, Dana Farber Cancer Institute, Boston, MA 02215, USA5Department of Biological Chemistry and Molecular Pharmacology, Harvard Medical School, Boston, MA 02215, USA6Department of Biostatistics and Computational Biology, Dana Farber Cancer Institute and Harvard School of Public Health, Boston,
MA 02215, USA7Department of Biomedical Informatics, Harvard Medical School, Boston, MA 02215, USA8PamGene International BV, Hertogenbosch 5211, the Netherlands9Broad Institute of MIT and Harvard, Cambridge, MA 02142, USA10Lead Contact
*Correspondence: [email protected]://doi.org/10.1016/j.ccell.2018.01.004
SUMMARY
Estrogen receptor a (ER) ligand-binding domain (LBD) mutations are found in a substantial number of endo-crine treatment-resistantmetastatic ER-positive (ER+) breast cancers.We investigated the chromatin recruit-ment, transcriptional network, and genetic vulnerabilities in breast cancer models harboring the clinicallyrelevant ERmutations. Thesemutants exhibit both ligand-independent functions that mimic estradiol-boundwild-type ER as well as allele-specific neomorphic properties that promote a pro-metastatic phenotype.Analysis of the genome-wide ER binding sites identified mutant ER unique recruitment mediating theallele-specific transcriptional program. Genetic screens identified genes that are essential for the ligand-independent growth driven by the mutants. These studies provide insights into the mechanism of endocrinetherapy resistance engendered by ER mutations and potential therapeutic targets.
INTRODUCTION
Estrogen receptor a (ER) plays a key role in normal breast devel-
opment and breast cancer. Inhibition of ER function by reducing
estrogen (E2) levels or by directly antagonizing E2 stimulation of
ER is the mainstay treatment for ER+ breast cancer. These treat-
ments reduce the risk of recurrence when given in the adjuvant
setting, and improve outcomes in metastatic disease; however,
Significance
Metastatic ER+ breast cancer is the leading cause of breast cLBD confer endocrine therapy resistance and poor outcomes ithat these mutations engender constitutive ER activity to prommutations also have allele-specific neomorphic properties thpromote a metastatic phenotype. Using genetic screens we hathe ER mutants and wild-type ER. We used these results to ddriven endocrine therapy resistance.
Ca
resistance to endocrine treatments remains a major clinical
problem (Early Breast Cancer Trialists’ Collaborative Group
et al., 2012).
A number of studies reported recurrent mutations in ESR1, the
gene encoding ER, in at least 20% of metastatic endocrine-
resistant ER+ breast cancers that are very rarely found in primary
tumors (Jeselsohn et al., 2014; Merenbakh-Lamin et al., 2013;
Robinson et al., 2013; Toy et al., 2013). The majority of the
ancer mortality in the developed world. Mutations in the ERn patients with metastatic disease. Prior studies have shownote estrogen-independent growth. Here we show that theseat, in addition to supporting estrogen-independent growth,ve identified vulnerabilities in breast cancer cells expressingevelop a therapeutic combination to overcome ER mutant-
ncer Cell 33, 173–186, February 12, 2018 ª 2018 Elsevier Inc. 173

Figure 1. Global Transcriptomic Analysis of the ERMutant Cell Lines
(A) Pairwise Spearman correlation of RNA-seq between the WT ER parental
and mutant cell lines in hormone-depleted (HD) conditions with vehicle (VEH)
treatment and HD conditions with estradiol (E2) treatment. Hierarchical clus-
tering shows the relatedness of each sample.
(B) Principal-component analysis of the transcriptomes of WT ER parental cell
lines and mutant cell lines in full medium (FM), HD, and HD + E2 conditions.
See also Figure S1 and Tables S1 and S2.
recurrent ESR1mutations were found to cluster in the ER ligand-
binding domain (LBD). Cell line studies showed that the LBD
mutations stimulate constitutive activity in the absence of E2,
and decreased sensitivity to ER antagonists such as tamoxifen
(TAM) and fulvestrant (FUL), indicating that these are gain-of-
function mutations and drivers of endocrine resistance (Harrod
et al., 2016; Jeselsohn et al., 2014; Toy et al., 2017).
The two most commonly mutated amino acids are Y537 and
D538, which are both within the C-terminal helix of the ER
174 Cancer Cell 33, 173–186, February 12, 2018
LBD, helix 12 (H12). Several mutant alleles of Y537 including
Y537S, Y537N, and Y537C have been found in endocrine-resis-
tant breast cancers, while only the D538G mutation appears to
be a common resistance allele. H12 is a key structural compo-
nent of the activating function-2 domain of ER that dictates the
agonist or antagonist state of the receptor. E2 binding to the
LBD leads to stabilization of H12 in an active conformation,
enabling the binding of co-activators, such as NCOA3, and re-
sults in activation of the receptor. Biophysical studies showed
that the Y537S mutation and, to a lesser degree the D538G mu-
tation, stabilize H12 in the agonist conformation, similar to wild-
type (WT) ER bound to E2 (Nettles et al., 2008; Fanning et al.,
2016). In addition, affinity studies and the crystal structure of
the mutant LBD indicate that these mutants have decreased af-
finity for TAM and E2, and confer an altered conformation facili-
tating resistance to antagonism. Finally, NCOA3 binding to
mutant ER compared with WT ER under ligand-independent
conditions, or in the presence of TAM, is enhanced (Fanning
et al., 2016; Toy et al., 2013). These findings provide a mecha-
nistic explanation for the ER mutant ligand-independent consti-
tutive-activity and relative resistance to ER antagonists.
The low frequency of theESR1 LBDmutations in primary treat-
ment-naive tumors, the correlation between tumor progression
and mutation frequency, and the variable allele frequencies sup-
port the clonal selection of these mutations under the selective
pressure of endocrine treatment. In addition, we showed that
the D538G mutation induces an increased migratory capacity
in MCF7 cell models in 2D cell culture (Merenbakh-Lamin
et al., 2013). Moreover, the ESR1 LBD mutations are prognostic
of poor outcomes in patients with metastatic disease (Chandar-
lapaty et al., 2016; Spoerke et al., 2016). These findings imply
that, in addition to stimulating E2-independent growth, the
ESR1 LBD mutations may also promote a more aggressive
phenotype. This led us to hypothesize that the functional conse-
quences of ER LBD mutations are not restricted to their consti-
tutive activity, but, in addition, lead to changes in the ER tran-
scriptional network that mediate cancer progression. In this
study we tested this hypothesis and searched for potential ther-
apeutic targets to overcome the drug resistance and poor out-
comes associated with these mutations.
RESULTS
The Mutant ER TranscriptomeTo study the global transcriptional changes induced by the ER
LBD mutations, we performed RNA sequencing (RNA-seq) of
doxycycline (DOX)-inducible mutant ER-expressing cell lines
and parental WT ER-expressing cells, in full medium (FM), hor-
mone-depleted (HD) conditions, and HD after stimulation with
1 nM E2 (HD + E2) (Figure 1). These cells expressed the hemag-
glutinin (HA)-tagged ER LBD mutants and included three of the
most common clinical mutations (Y537S, Y537N, and D538G)
(Figure S1A). The protein expression of mutant ER was well
controlled in these cells, and the combined relative expression
of WT and mutant ER protein after DOX induction was compara-
ble with WT ER in the parental cells prior to DOX induction (Table
S1). Pairwise correlation analysis of the RNA-seq in HD and HD +
E2 clustered the Y537N and Y537S mutant cells in HD and HD +
E2 conditions distinctly from the D538Gmutant cells and theWT

ER cells. Although the D538Gmutant cells clustered with theWT
ER cells, they formed a distinct subset. In addition, these data
showed that all the WT ER cells clustered together, but were
clearly separated by the treatment conditions (HD versus HD +
E2). In contrast, the mutant cells in HD and HD + E2 clustered
together and the first subclustering was dictated by the specific
mutation (Y537S versus Y537N) and not by the medium condi-
tions (Figure 1A). When applying a principal-component analysis
to all the samples, principal component 1 (PC1) correlated with
the ER mutational status, segregating the WT, the D538G
mutant, and the Y537S or Y537N mutant cells; again indicating
that the D538Gmutation is distinct from the mutations at residue
Y537. The medium conditions resolved along PC2 and distinctly
clustered the WT cells in FM, HD, and HD + E2 conditions. In the
mutant-expressing cells, the HD and HD + E2 conditions aggre-
gated together and segregated away from the FM conditions,
supporting the constitutive transcriptional activity of the mutants
in the absence of E2 and the difference between FM conditions
versus white medium + E2 (Figure 1B). In line with the transcrip-
tional data and prior studies, cell growth in HD and HD + E2 con-
ditions showed that mutant-expressing cells had a growth
advantage in HD conditions compared with WT ER-expressing
cells. In addition, while WT ER cells displayed marked growth
inhibition in HD compared with HD + E2, ER mutant cell growth
in HD was only mildly decreased compared with HD + E2 (Fig-
ure S1B). We next examined the efficacy of the ER antagonists
TAM and FUL in inhibiting mutant ER cell proliferation. While
the TAM half maximal inhibitory concentration (IC50) was signifi-
cantly higher in the MCF7 and T47D cells expressing the Y537S
mutant compared with the WT cells, the TAM IC50 for D538G ER
mutant cells was in the same range as the WT ER cells. Both the
Y537S and D538G mutants displayed relative resistance to FUL
compared with WT ER cells; however, the resistance was more
significant for Y537S compared with D538G. Likewise, the
Y537S ER mutant T47D cells had a 31-fold increase in the FUL
IC50 compared with WT ER T47D cells (Figure S1C; Table S2).
These results confirm the relative resistance of the ER LBD mu-
tants to ER antagonists, and also indicate that the Y537S and
D538G mutants may be different with respect to response to
TAM and FUL.
To further delineate the transcriptional changes induced by the
ER-LBD mutations, we performed differential gene expression
analyses (Figures S1D and S1E). First, focusing on the WT-ex-
pressing cells, comparison of the WT cells (D538G and Y537S
DOX-inducible parental cells without DOX treatment) in the
absence of E2 (HD) versus E2-stimulated conditions (HD + E2)
identified 689 and 814 E2 regulatedgenes for the D538G and
Y537S parental WT ER cell line models, respectively (log2 fold
change [FC] > 0.5, false discovery rate [FDR] < 0.01). As ex-
pected, the majority of the E2-regulated genes in the two WT
ER cell lines (parental to the D538G and Y537Smutants) overlap-
ped, and among these genes were known ER transcriptional
target genes, such as PGR, TFF1, GREB1, CA12, XBP1, and
MYC (Figure S1Ea). We next identified the genes that were
induced by the ER LBD mutants in HD conditions. We found
308 and 954 genes induced by D538G and Y537S mutants,
respectively. Comparison of the genes induced by the mutants
in the absence of E2 with the E2-induced genes in WT ER cells
revealed that only 33% of the D538G-induced genes and 18%
of the Y537S-induced genes overlapped with genes induced
by E2 in WT ER cells (Figure S1Eb). Thus, the majority of the
genes induced by the ER mutants in E2-deprived conditions
was unique and did not overlap with the WT ER E2-regulated
genes. In addition, when we examined the E2-regulated genes
in the ER mutant cells, only 12 genes were upregulated by E2
in the Y537S mutant cells, whereas, in the D538G mutant cells,
416 genes were E2 upregulated, and 64% of these genes over-
lapped with the WT ER E2-regulated genes (Figure S1Ec). Com-
parison of the D538G- to the Y537S-induced genes showed that
80% of the D538G-induced genes overlapped with the Y537S.
In contrast, 74% of the Y537S-induced genes were unique to
the Y537S mutation (Figure S1Ed). Taken together, these results
support the E2-independent transcriptional activity of the Y537S
and D538G mutants, and indicate that these mutations, particu-
larly Y537S, promote the transcription of a unique set of genes
that are not induced by E2 stimulation of WT ER. Notably, these
results show that the Y537S and D538G mutations induce
distinct transcriptional programs, with the D538G mutation
driving a transcriptional profile that is more similar to the WT
ER E2-dependent transcription compared with the Y537S muta-
tion. Like Y537S, the Y537N allele induced a high number of
genes that were not induced byWT ER stimulated by E2 (Figures
S1F and S1G).
To address the relevance of these model cell line findings, we
evaluated the transcriptome of 109 metastatic tumors from an
ongoing study of ER+ metastatic breast cancer at the Dana-
Farber Cancer Institute. In this study, metastatic tissue biopsies
are obtained from patients with ER+ disease for genomic and
molecular analysis. Global analysis of the RNA-seq data re-
vealed two large clusters of tumors that segregated primarily
by the site of metastasis (mets) (Figure 2A). The first cluster of
tumors consisted of 42 biopsies exclusively obtained from liver
mets and the second cluster included tumor samples from a
number of organ sites primarily consisting of tumors from
breast, skin, and lung. Hierarchical clustering and principal-
component analysis after exclusion of 2,864 genes upregulated
in normal liver and skin tissues compared with breast tissue
determined by the RNA-seq analysis of healthy liver, skin, and
breast tissues from women obtained from the Genotype-Tissue
Expression (GTEx) dataset (GTEx Consortium, 2013) (90 breast,
41 liver, and 217 skin samples, log2 FC > 2 and adjusted
p value < 0.001), resulted in the merging of the two clusters
(Figures S2A and S2B). This supports the conclusion that these
two clusters are driven primarily by gene expression of the
normal tissue from the site of the metastatic lesion. We therefore
analyzed these two clusters separately for the ensuing analyses.
Cluster A was composed of 35 WT ER tumors, 5 ER D538G
mutant tumors, 1 ER Y537N mutant tumor, and 1 ER E380Q
mutant tumor. Consistent with our previous study, mets
harboring the D538G were enriched in the liver mets compared
with other metastatic sites (Merenbakh-Lamin et al., 2013). In a
supervised analysis of this cluster, we detected a transcriptional
profile upregulated in tumors harboring the D538G mutations.
Furthermore, gene set enrichment analysis (GSEA) showed
that the gene sets of the 100 or 50 top-ranked genes upregu-
lated after induction of the D538G mutation in the MCF7 cell
line were enriched in the D538G metastatic tumors compared
with the WT ER metastatic tumors in this cluster (normalized
Cancer Cell 33, 173–186, February 12, 2018 175

Figure 2. Transcriptomic Analysis of Meta-
static Tumors Harboring the ESR1 LBD
Mutations
(A) Pairwise Spearman correlation of RNA-seq
between ER+ metastatic tumors.
(B) Heatmap of the top 1,000 genes differentially
expressed between D538G mutant and WT ER
metastatic samples and gene set enrichment
(GSEA) plot of the top-ranked 100 genes upregu-
lated with the induction of the D538G mutation in
MCF7 cells testing for enrichment in the D538G
metastatic tumor samples compared with the WT
ER metastatic samples within cluster (A).
(C). Heatmap of the top 1,000 genes differentially
expressed between Y537S mutant and WT ER
metastatic samples and gene set enrichment plot
testing the enrichment of the top-ranked 100
genes upregulated with the induction of the Y537S
mutation in MCF7 cells in the Y537S mutant met-
astatic tumor samples compared with the WT ER
metastatic samples within cluster (B).
See also Figure S2.
enrichment score [NES] = 1.44, p < 0.01 and NES = 1.5,
p <0.001 for the 100 and 50 top-ranked genes, respectively)
(Figure 2B). In contrast, the gene sets of the 100 or 50 top-
ranked genes upregulated with the induction of the Y537S
mutant in MCF7 cells were not enriched in the D538Gmetastatic
tumor samples (Figure S2C). This is consistent with the cell
model findings in which the majority of the Y537S-induced
genes did not overlap with the D538G-induced genes (Fig-
ure S1Ed). The second cluster of 67 cases included sites other
than liver predominantly. Of these 67 cases, 63 were found to
176 Cancer Cell 33, 173–186, February 12, 2018
harbor WT ER and 4 patients harbored
the Y537S mutation. Similar to the anal-
ysis of the first cluster, in a supervised
analysis of this cluster we detected a
transcriptional profile upregulated in tu-
mors harboring the Y537S mutations.
GSEA utilizing custom gene sets of the
100 or 50 top-ranked genes upregulated
after induction of the Y537S mutant
in the MCF7 cell line were enriched in
the Y537S metastatic tumors compared
with the WT ER metastatic tumors in
the second cluster (NES = 1.4, p < 0.01,
and NES = 1.7, p < 0.001, for 100 and
50 top-ranked genes, respectively) (Fig-
ure 2C). In addition, the gene sets of the
100 or 50 top-ranked genes upregulated
with the induction of the D538G mutant
in MCF7 cells were also enriched in
the Y537S metastatic tumor samples
(NES = 1.5, p < 0.01, and NES = 1.7,
p < 0.001, for 100 and 50 top-ranked
genes, respectively (Figure S2D). This is
highly consistent with the cell line tran-
scriptome analyses in which the majority
of D538G-induced genes were included
within the Y537S-induced genes. These
clinical data strongly support the importance of the findings in
the cell line models harboring the ER mutants.
We also performed RNA-seq in a series of ER+ patient-derived
xenografts (PDXs) that were established from four ER+ metasta-
tic breast cancer tissue samples. Two of these xenografts harbor
a Y537S mutation, as detected by directed droplet digital PCR
and RNA-seq. We confirmed ER expression in the xenografts
(Figure S2E). In an unsupervised analysis of the RNA-seq of tu-
mors harvested in the first and second passage of the PDX in
the presence of E2 supplementation, the Y537S mutant PDX

(legend on next page)
Cancer Cell 33, 173–186, February 12, 2018 177
models clustered distinctly from the WT ER PDX models (Fig-
ure S3F). GSEA showed that the gene signature of AKT1 activa-
tion was the top-ranked enriched signature in the mutant PDXs
compared with the WT ER PDXs (NES = 1.8, p < 0.01) (Fig-
ure S2G). To test for a correlation between the transcriptional
changes in the mutant PDX tumor tissues and the ER Y537S
mutant cell line models, we constructed a custom gene set for
use in GSEA. This gene set consisted of the 100 top-ranked
genes induced by the Y537S mutant selected by FC and an
FDR < 0.01. Notably, there was a significant enrichment of 94
of these 100 genes in the Y537S mutant PDX tumors compared
with the WT ER tumors (NES = 1.14, p < 0.01) (Figure S2H).
Mutant ER Cistromes Are E2 Independent and Distinctfrom the E2-Dependent WT ER CistromeAs we found that the transcriptional changes induced by the ER
mutants were not restricted to E2-dependent genes, we hypoth-
esized that the ERmutations lead to an altered ER cistrome, and
consequently to modulations in the ER transcriptional network.
To test this hypothesis and discern which genes are directly
regulated by the ER mutants we mapped ER binding globally
by performing ER chromatin immunoprecipitation sequencing
(ChIP-seq) of the DOX-induced mutant cells in HD conditions,
and the WT cells in HD conditions, and after E2 stimulation. As
expected from our prior work, the ER ChIP-seq for the WT cells
in HD conditions yielded a very low number of binding sites and
did not pass our quality control parameters (Carroll et al., 2005).
In contrast, the mutant ER was recruited to DNA binding sites in
the absence of E2 stimulation, resulting in a total of 35,000 bind-
ing sites in MCF7-Y537S mutant cells, 23,676 in Y537N mutant
cells, and 11,371 in D538G mutant cells. To confirm that we
were detecting the recruitment of mutant ER, we performed
HA-ChIP-seq in the presence of DOX, with and without E2 stim-
ulation, and saw a high correlation between the mutant ER cis-
tromes with HA and ER antibodies (Figure S3A). We next per-
formed a differential binding intensity analysis to define sites
with up- or downregulated binding intensity. We found that the
ER mutations led to the redistribution of ER binding profiles at
24% or more of all binding events. In the MCF7-Y537S cells,
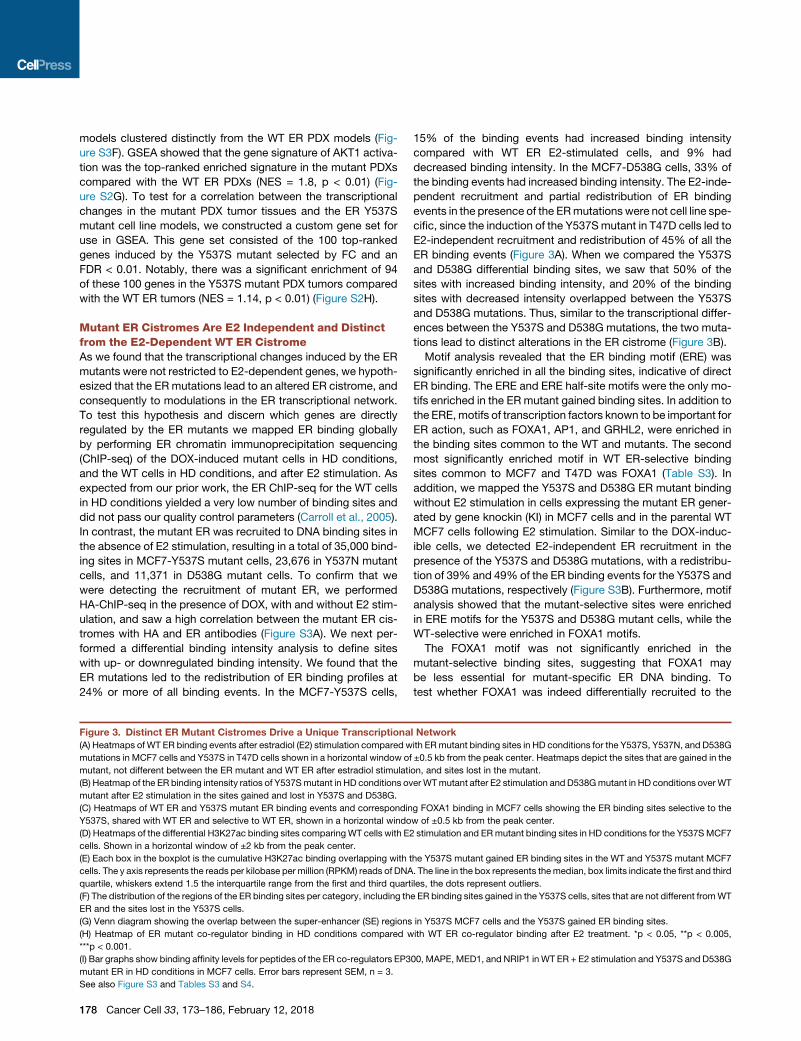
Figure 3. Distinct ER Mutant Cistromes Drive a Unique Transcriptiona
(A) Heatmaps ofWT ER binding events after estradiol (E2) stimulation compared w
mutations in MCF7 cells and Y537S in T47D cells shown in a horizontal window of
mutant, not different between the ER mutant and WT ER after estradiol stimulati
(B) Heatmap of the ER binding intensity ratios of Y537Smutant in HD conditions ov
mutant after E2 stimulation in the sites gained and lost in Y537S and D538G.
(C) Heatmaps of WT ER and Y537S mutant ER binding events and correspondin
Y537S, shared with WT ER and selective to WT ER, shown in a horizontal windo
(D) Heatmaps of the differential H3K27ac binding sites comparingWT cells with E2
cells. Shown in a horizontal window of ±2 kb from the peak center.
(E) Each box in the boxplot is the cumulative H3K27ac binding overlapping with t
cells. The y axis represents the reads per kilobase per million (RPKM) reads of DNA
quartile, whiskers extend 1.5 the interquartile range from the first and third quart
(F) The distribution of the regions of the ER binding sites per category, including th
ER and the sites lost in the Y537S cells.
(G) Venn diagram showing the overlap between the super-enhancer (SE) regions
(H) Heatmap of ER mutant co-regulator binding in HD conditions compared w
***p < 0.001.
(I) Bar graphs show binding affinity levels for peptides of the ER co-regulators EP3
mutant ER in HD conditions in MCF7 cells. Error bars represent SEM, n = 3.
See also Figure S3 and Tables S3 and S4.
178 Cancer Cell 33, 173–186, February 12, 2018
15% of the binding events had increased binding intensity
compared with WT ER E2-stimulated cells, and 9% had
decreased binding intensity. In the MCF7-D538G cells, 33% of
the binding events had increased binding intensity. The E2-inde-
pendent recruitment and partial redistribution of ER binding
events in the presence of the ERmutations were not cell line spe-
cific, since the induction of the Y537Smutant in T47D cells led to
E2-independent recruitment and redistribution of 45% of all the
ER binding events (Figure 3A). When we compared the Y537S
and D538G differential binding sites, we saw that 50% of the
sites with increased binding intensity, and 20% of the binding
sites with decreased intensity overlapped between the Y537S
and D538G mutations. Thus, similar to the transcriptional differ-
ences between the Y537S and D538G mutations, the two muta-
tions lead to distinct alterations in the ER cistrome (Figure 3B).
Motif analysis revealed that the ER binding motif (ERE) was
significantly enriched in all the binding sites, indicative of direct
ER binding. The ERE and ERE half-site motifs were the only mo-
tifs enriched in the ERmutant gained binding sites. In addition to
the ERE,motifs of transcription factors known to be important for
ER action, such as FOXA1, AP1, and GRHL2, were enriched in
the binding sites common to the WT and mutants. The second
most significantly enriched motif in WT ER-selective binding
sites common to MCF7 and T47D was FOXA1 (Table S3). In
addition, we mapped the Y537S and D538G ER mutant binding
without E2 stimulation in cells expressing the mutant ER gener-
ated by gene knockin (KI) in MCF7 cells and in the parental WT
MCF7 cells following E2 stimulation. Similar to the DOX-induc-
ible cells, we detected E2-independent ER recruitment in the
presence of the Y537S and D538G mutations, with a redistribu-
tion of 39% and 49% of the ER binding events for the Y537S and
D538G mutations, respectively (Figure S3B). Furthermore, motif
analysis showed that the mutant-selective sites were enriched
in ERE motifs for the Y537S and D538G mutant cells, while the
WT-selective were enriched in FOXA1 motifs.
The FOXA1 motif was not significantly enriched in the
mutant-selective binding sites, suggesting that FOXA1 may
be less essential for mutant-specific ER DNA binding. To
test whether FOXA1 was indeed differentially recruited to the
l Network
ith ERmutant binding sites in HD conditions for the Y537S, Y537N, and D538G
±0.5 kb from the peak center. Heatmaps depict the sites that are gained in the
on, and sites lost in the mutant.
er WTmutant after E2 stimulation and D538Gmutant in HD conditions overWT
g FOXA1 binding in MCF7 cells showing the ER binding sites selective to the
w of ±0.5 kb from the peak center.
stimulation and ERmutant binding sites in HD conditions for the Y537SMCF7
he Y537S mutant gained ER binding sites in the WT and Y537S mutant MCF7
. The line in the box represents themedian, box limits indicate the first and third
iles, the dots represent outliers.
e ER binding sites gained in the Y537S cells, sites that are not different fromWT
in Y537S MCF7 cells and the Y537S gained ER binding sites.
ith WT ER co-regulator binding after E2 treatment. *p < 0.05, **p < 0.005,
00, MAPE, MED1, and NRIP1 inWT ER + E2 stimulation and Y537S and D538G

(legend on next page)
Cancer Cell 33, 173–186, February 12, 2018 179

mutant-selective ER binding sites, we performed FOXA1 ChIP-
seq in WT ER cells with E2 stimulation and in the Y537S mutant
cell without E2 stimulation. Co-occupancy analyses showed a
significant enrichment of FOXA1 binding events within the WT
ER-specific cistrome, and significantly lower FOXA1 binding
events in the ER mutant-specific cistrome (p < 0.0005) (Fig-
ure 3C). Nonetheless, FOXA1, which is enriched in the non-dif-
ferential binding sites, and is also upregulated by the induction
of the ER mutants, remains essential for mutant and WT ER
cell proliferation, as demonstrated by silencing of FOXA1 (Fig-
ures S3C and S3D). Albeit in the presence of the Y537S mutant
in HD conditions, the effect of FOXA1 silencing on cell prolifera-
tion was not statistically significant.
To gain insight into the chromatin modifications at the ER
mutant gained binding sites, we performed ChIP-seq for the
active histone mark H3K27ac in WT ERMCF7 cells with E2 stim-
ulation cells and mutant ER cells in HD conditions. A substantial
number of H3K27ac binding sites were gained in themutant cells
(2,379 sites, log2 FC > 0.5), and these sites were enriched in ERE
motifs (p = 1 3 10�8) in addition to E2F (p = 1 3 10�16) and ETS
(p = 13 10�9) motifs (Figure 3D). The latter two were the top mo-
tifs. Moreover, the ER binding sites gained in the presence of the
mutations were more likely to be centered at regions of active
chromatin in the Y537Smutant cells compared with the WT cells
as indicated by the increased levels of H3K27ac at these sites in
the mutant cells compared with the WT cells (Figure 3E). In addi-
tion, the ER binding sites gained in the Y537S mutant cells are
more likely than those of the other categories to occur in pro-
moter regions and >30% of the super-enhancers detected in
the Y537S mutant cells overlapped with the mutant gained bind-
ing sites (Figures 3F and 3G).
Our results indicate that the ERbinding sites gained in the pres-
ence of the mutations occur at transcriptionally active regions.
However, we did not identify co-occupancy of a specific pioneer
factor in these sites. We therefore hypothesized that the altered
conformation of the ER mutants and unique co-regulator binding
might contribute to the enhanced mutant ER binding in these
sites. To test this hypothesis we screened mutant ER compared
with WT ER co-regulator interactions using the Microarray Assay
Figure 4. The Mutant-Specific Transcriptional Program Promotes a M
(A) Correlation of the Y537S mutant-specific cistrome and differential gene expre
unique peaks (log2 FC > 1; 3,491 peaks). The blue line represents the genes (9
(log2 FC < �1; 2,180 peaks). The black line represents the genes (5,250 genes) a
x axis is the log2 FC of the genes in mutant condition versus WT condition. The
(B) Overlap of the genes with a ranked product <0.001 determined by BETA usin
significantly enriched in the 344 overlapping genes using ranked gene set enrich
blue bars represent the NES.
(C) Tumor growth of orthotopic xenografts of MCF7 cells expressing the indica
supplements prior to the survival surgery. The y axis represents the tumor volu
statistically significant, *p < 0.05, for this comparison. **p < 0.005 in the compari
(D) Tumor growth of the orthotopic xenografts of MCF7 cells expressing the Y537
through the survival surgery and monitoring of local recurrence and distant meta
(E) Representative pictures of the mice with the Y537S xenografts. Survival surg
(F) Representative pictures of the mice with the D538G xenografts. The survival
(G) Tumor growth of the orthotopic xenografts of WTMCF7 cells with E2 (WT + E2
of the cells through the survival surgery and monitoring of local recurrence and d
(H) Representative pictures of the mice with WT MCF7 cells + E2 pellets. The su
(I) Representative pictures of the mice with WT MCF7 cells without E2 pellets. Su
SEM, six to eight mice were included in each arm.
See also Figure S4 and Table S5.
180 Cancer Cell 33, 173–186, February 12, 2018
for Real-time Co-regulator-Nuclear receptor interaction (Koppen
et al., 2009).We identified 58 E2dependent co-regulator peptides
in the presence of WT ER. The majority of these E2-dependent
co-regulators peptides interacted with similar binding levels to
the apo-mutant ER (55 for Y537S and 48 for D538G), consistent
with constitutive binding of multiple co-regulators (Figure S3E).
Among these co-regulators are known ER co-activators such
as NCOA3. Comparison of apo-mutant to E2-stimulated WT ER
co-regulator interactions revealed a number of significantly
enhanced apo-mutant interactions (24 for Y537S and 11 for
D538G). These include, among others, the ER co-activators
EP300, MED1, and NRIP1 (Rosell et al., 2014; Kornberg, 2005;
Yi et al., 2015) (Figures 3H and 3I; Table S4). Comparison of the
apo-Y537S versus apo-D538Gmutant revealedmutant-selective
co-regulator peptide interactions (Figure S3F). These results pro-
vide an indication that the co-regulator peptide-mutant ER inter-
action landscape is allele selective and differs from that ofWT ER.
However, studies to further investigate the effect of the mutant
structure on multiple co-regulator interactions are needed to
clarify whether this is simply an indication of subtle structural dif-
ferences between the alleles or the mediator of the differences in
cistromes and transcriptomes.
The Mutant ER Cistrome Mediates TranscriptionalChanges that Promote a Metastatic PhenotypeWe next applied the Binding and Expression Target Analysis
(BETA) algorithm, which assigns a BETA score for each gene
based on the distance between the transcription start site of a
gene and the peak of the transcription factor binding sites
(Wang et al., 2013), to test for a correlation between the redistri-
bution of the mutant ER recruitment and the transcriptional
differences between mutant ER and WT ER. We found a statisti-
cally significant correlation between the BETA scores for the
Y537S- and WT-selective binding sites and the differential
gene expression between E2-stimulated WT ER and non-stimu-
lated Y537S-ER. Whereas, for the shared binding sites there
was no significant correlation (Figure 4A). Similarly, we detected
a positive correlation between the D538G mutant-selective
binding site BETA scores and the differential gene expression
etastatic Phenotype
ssion. The red line represents the genes (2,598 genes) that have Y537S mutant
66 genes) that have peaks associated with them that were unique to WT ER
ssociated with peaks common to mutant and WT ER (�1<jlog2 FCj < 1). The
y axis is the average normalized BETA score per gene bin.
g the mutant (Y537S, Y537N, and D538G) unique binding sites and gene sets
ment analysis (GSEA). The red line in the graph represents the q value and the
ted ER mutants or WT MCF7 cells with estradiol (E2) pellets and without E2
me measured by calipers. Comparison of Y537S to D538G mutant cells was
son of the WT xenografts without E2 to all other conditions.
S or D538Gmutation from the time of the intra-mammary injections of the cells
stases (mets).
ery was performed on day 35 and the DOX diet was discontinued on day 98.
surgery was performed on day 70.
) or without E2 (WT) supplements from the time of the intra-mammary injections
istant mets.
rvival surgery performed on day 63.
rvival surgery was not performed in these mice. Error bars in (C–E) represent

between E2-stimulated WT ER and non-stimulated D538G ER
(Figure S4A). Since there was a limited number of WT-selective
binding sites in the D538G mutant cells we did not perform this
analysis for these binding sites. Taken together, these correla-
tions imply that the transcriptional changes induced by mutant
ER in HD conditions are driven by the ligand-independent redis-
tribution of mutant ER cistromes.
By integrating the BETA scores of the ER mutant-selective
binding sites and the differential gene expression between the
WT cells + E2 stimulation versus mutant cells in HD conditions
and selecting genes that have a rank product of <0.01, we iden-
tified the genes that are directly upregulated by the ER mutants.
We compared the genes upregulated by the three mutants
(Y537S, Y537N, and D538G) and found 344 overlapping genes
(Figure 4B) (genes listed in Table S5). GSEA identified genes up-
regulated in metastases driven by ERBB2 (NES = 2.3, q = 0.02)
as the top-ranked gene set enriched in the overlapping genes
upregulated by the ERmutants. Other gene sets that were signif-
icantly enriched consist of a number of gene sets important for
the metastatic process, including: gene sets of inflammatory
response (NES = 2.3, q = 0.01), genes downregulated by
CDH1 (NES = 2, q = 0.04), genes upregulated by BMP2
(NES = 2, q = 0.04), and genes upregulated in TAM resistance
(NES = 1.9, q = 0.06). The gene set of ER targets via AKT1 upre-
gulation was also significantly enriched in the ERmutant upregu-
lated genes and is in keeping with the top gene set enriched in
the Y537S PDX models.
To functionally test the mutant pro-metastatic phenotype we
generated orthotopic xenografts with the Y537S and D538G
DOX-inducible cells stably infected with luciferase in ovariecto-
mized mice treated with a DOX diet without E2 supplement. As
controls, we used MCF7 cells expressing WT ER in ovariecto-
mized mice with and without E2 pellets. The mice were moni-
tored for mets before and after survival surgery to remove the
primary tumor. The mammary tumor growth was significantly
greater in the Y537S mutant cells compared with the D538G
mutant cells. Growth of the WT ER-expressing tumors in the
presence of E2 was not significantly different from the mutant
ER-expressing tumors in the absence of E2 (Figure 4C),
whereas, growth of WT ER-expressing tumors in the absence
of E2 was significantly lower compared with the ER mutant
and WT + E2 tumor growth (Figure 4C). All six mice harboring
the Y537S ER-expressing xenografts grew primary tumors
within 2 weeks and developed mets within 70 days from the
injection of the cells and 25 days from the survival surgery. The
mets were dependent on the Y537S mutant, as removal of
the DOX diet led to rapid regression of the mets (Figures 4D,
4E, and S4B–S4D). The D538G tumors developed mets, but
with a longer latency (on day 147 from the injection of the cells
five of the eight mice were found to have metastases) (Figures
4D and 4F). Although four of the eight mice injected withWT cells
and treated with supplemental estrogen developed local recur-
rences after survival surgery, not one developed mets (WT
versus Y537S, p = 0.0002, and WT versus D538G, p = 0.007,
chi-square test) (Figures 4G and 4H). Survival surgery was not
performed in the mice with WT ER xenografts in the absence
of E2 since the tumors did not reach the predefined threshold
volume for surgery. Similar to the WT ER cells with E2 supple-
ment, these mice did not develop mets (Figures 4G and 4I).
Collectively, these results demonstrate that the ER mutations
lead to a reprogrammed transcriptional network that promotes
metastases, and this phenotype is more pronounced in the
Y537S compared with the D538G mutation.
CRISPR Knockout Screen Identifies Genes Essential forMutant ER GrowthTo investigate genes that are essential for mutant ER E2-inde-
pendent growth, we performed genome-wide CRISPR-Cas9
knockout screens in the T47D-Y537S cells in HD conditions
and control parental WT ER cells in FM conditions using two li-
braries targeting over 18,000 protein coding genes consisting
of over 180,000 guide RNAs (gRNAs). The negatively and posi-
tively selected genes were identified by calculating the gene es-
sentiality score, defined as the beta score, using MAGeCK-
VISPR (Li et al., 2015). Similar to our screens in WT ER breast
cancer cells, the top genes that were positively selected in the
ER mutant library screen are tumor suppressors, such as NF1,
TSC1, TSC2, PTEN, and CSK. In addition, MYH9 and CBFB,
two genes previously found as mutated in ER+ breast cancers,
were also among the top-ranked positively selected genes (Ellis
et al., 2012). As expected, among the top negatively selected
genes, i.e., the essential genes, were genes that are known driver
genes of ER+ breast cancer, such as GATA3 (beta = �2),
TFAP2C (beta = �1.8), MTOR (beta = �1.7), MYC (beta =
�1.3), and ESR1 itself (beta = �1.1) (Figure 5A). These genes
were also essential in the T47D WT cells in FM conditions (Fig-
ure 5B) In addition, CCND1 (beta = �1.6) and CDK4 (beta =
�1.8) remained essential genes in the mutant cells. This is
consistent with a retrospective clinical study in which patients
with ERmutations remained sensitive to CDK4/6 inhibitors (Frib-
bens et al., 2016). We confirmed that the ER mutant-expressing
cell lines retained sensitivity to palbociclib, a CDK4/6 inhibitor
(Figure S5A). In addition, a number of the ER co-regulators,
such as NCOA3, EP300, MED1, and MEN1, which we found to
interact with the apo-mutant ER, were essential in the mutant
cells. Notably, we observed increased apo-ER mutant binding
to EP300 and NCOA3 compared with E2-stimulated WT ER,
and both of these co-regulators were more essential in the
Y537S mutant cells compared with the WT cells (EP300: WT
beta =�0.1, mutant beta =�1; NCOA3: WT beta =�0.1, mutant
beta = �0.5).
To prioritize essential genes that are selective or retained in
cells expressing mutant ER and are directly upregulated by
mutant ER, we used a rank-product algorithm to aggregate rank-
ings of scores from the output of MAGeCK-VISPR and the geo-
metric mean of the gene rankings from four of the BETA analysis
results (D538G, Y537N, and Y537S from MCF7 cells and Y537S
from T47D cells) (Table S6; Figure 5C). TFAP2C was found to be
the top gene in this ranking (rank product FDR = 0.036). TFAP2C
was essential in theWT ERCRISPR screen in FM conditions, but
the essentiality score was more significant in the presence of the
Y537S mutant in HD conditions (WT ER beta =�0.9 FDR = 0.01,
Y537S beta = �1.8 FDR < 0.0001). In addition, the Y537S ER
binding site in the promoter region of TFAP2C overlapped with
a super-enhancer region (Figure 5D). TFAP2C is a regulator of
ER transcriptional activity and luminal differentiation (Cyr et al.,
2015). Moreover, we recently showed that TFAP2C expression
was highly associated with decreased progression free survival
Cancer Cell 33, 173–186, February 12, 2018 181

Figure 5. CRISPR Screen Identifies ER
Mutant Essential Genes
(A) Essentiality scores from the CRISPR screen in
T47D-Y537S mutant cells grown in HD conditions.
(B) Comparison of beta scores of CRISPR-Cas9
library screens in Y537S-ER mutant cells in HD
conditions versus library screen in WT ER cells in
FM conditions. Dark gray dots, genes that are
essential for both WT ER and mutant ER; green,
uniquely essential for mutant ER; orange, uniquely
positively selected in mutant ER; and light gray,
not significant in the mutant cells (FDR < 0.05).
(C) –log rank product values integrating the beta
essentiality scores and the geometric mean of
the gene rankings from at least three of four
BETA analysis results from the Y537S, D538G,
and Y537N MCF7 cells and T47D Y537S cells.
(D) ChIP-seq tracks showing ER, HA, and H3K27
acetylation binding at the TFAP2C promoter re-
gion inWT cells with E2 treatment andmutant cells
in HD conditions.
(E) Immunoblotting for AP2g in control (CON)
cells and cells with CRISPR-Cas9 suppression of
TFAP2C (KO).
(F) Cell proliferation studies in HD conditions ofWT
and Y537S or D538G mutant (DOX treated) con-
trol cells and after suppression of TFAP2C using
CRISPR-Cas9. Error bars represent ±SEM, n = 3.
See also Figure S5 and Table S6.
in metastatic ER+ breast cancer (Jeselsohn et al., 2016). To vali-
date that TFAP2C is an ER mutant transcriptional target, and an
essential gene for mutant cell growth in HD conditions, we first
confirmed mutant-induced upregulation of TFAP2C mRNA and
protein levels (Figures S5B and S5C). Next, we showed that
silencing of TFAP2C by CRISPR-gRNAs decreased E2-indepen-
dent proliferation of Y537S and D538G mutant cells (Figures 5E
and 5F).We also showed that TFAP2C suppression did not affect
ER expression (Figure S5D). Thus, TFAP2C is upregulated by the
ER mutants and is essential for E2-independent mutant ER cell
growth.
We next turned to validate the effects of essential genes
with available small-molecule inhibitors, as these are potential
drug targets. CDK7 was essential in both ER mutant and WT
ER-expressing cells (WT ER beta score = �0.8, FDR = 0.017;
182 Cancer Cell 33, 173–186, February 12, 2018
ER-Y537S beta score = �1.3, FDR <
0.0001), and a CDK7 small-molecule
inhibitor, THZ1, was well characterized
(Kwiatkowski et al., 2014). CDK7 is a
component of the general transcription
factor IIH complex, which phosphory-
lates the C-terminal domain of RNAP
polymerase II. In addition to its function
in transcriptional regulation, CDK7 func-
tions as a CDK-activating kinase (CAK)
for CDK1, 2, 4, and 6, and has also been
shown to modulate ER activity through
serine 118 (S118) phosphorylation (Chen
et al., 2000; Fisher and Morgan, 1994;
Glover-Cutter et al., 2009; Larochelle
et al., 2007). S118 is a major phosphory-
lation site within the N-terminal domain transcription activation
1, andmutations in this site were shown to impair transactivation
by ER (Ali et al., 1993). CDK7 silencing with CRISPR-Cas9
gRNAs resulted in suppressed proliferation in both WT ER cells
in FM and mutant ER cells in HD conditions (Figures 6A, S6A,
and S6B).
We next tested the effect of THZ1 on cell growth. WT and ER
mutant MCF7 and T47D cells were responsive to THZ1 treat-
ment, and the IC50 values were comparable between WT and
mutant ER cells (Figure S6C). THZ1 covalently modifies CDK7
at residue C312 outside of the kinase domain, and previous
studies have shown that THZ1 inhibits RNAPII CTD phosphory-
lation and CAK activity in leukemia cell lines (Kwiatkowski et al.,
2014). More recently, THZ1 was shown to inhibit RNAPII CTD
phosphorylation and ER phosphorylation at S118 in MCF7 cells

(legend on next page)
Cancer Cell 33, 173–186, February 12, 2018 183
withWT ER and an ER Y537S KI allele (Harrod et al., 2016). Here,
we examined the effect of THZ1 on E2-independent Y537S and
D538G mutant ER S118 phosphorylation. Since the mutant ER
is HA tagged in our cell line models we could differentiate be-
tween WT ER and mutant ER in a western blot, which allowed
us to discern selective E2-independent phosphorylation of the
Y537S and D538G ER mutants. As expected, we did not detect
WT ER S118 phosphorylation in E2-deprived conditions. Inter-
estingly, however, in the presence of the D538G mutant in E2-
deprived conditions we detected S118 phosphorylation of the
D538G mutant ER and WT ER (Figure 6B). Phosphorylation of
WT ER was not seen with the Y537S mutant, and may suggest
that the D538Gmutant has a higher propensity to heterodimerize
with WT ER. This could potentially explain some of the pheno-
typic differences between the Y537S and D538G mutations,
although further studies are needed to validate this hypothesis.
We next tested the effect of THZ1 on ERmutant E2-independent
S118 phosphorylation, and found dose- and time-dependent in-
hibition of Y537S and D538G S118 phosphorylation (Figure 6C).
Gene expression analysis of Y537S mutant cells treated with
THZ1 at 24 hr showed that the key pathways that were inhibited
were related to the ErbB/PI3K/MTOR pathway, which is in line
with the key pathways enriched in the genes upregulated by
the ER mutations, suggesting that THZ1 is targeting the ER
mutant transcriptional network (Figure S6D).
We next studied the combination of THZ1 with FUL in cell cul-
ture and in vivo. We detected significant synergism of this com-
bination in MCF7 and T47D WT ER and mutant Y537S in the
DOX-inducible cell lines as well as the Y537S KI cell line (Figures
6D and S6E). Orthotopic xenografts of MCF7 cells expressing
the Y537S mutant demonstrated that the combination of THZ1
with FUL had improved efficacy in inhibiting tumor growth
compared with either single agent (Figure 6E). These results sup-
port the potential of this combination as a therapeutic strategy to
overcome endocrine resistance caused by the ER mutants.
DISCUSSION
Constitutively active somatic mutants in the ER LBD have
emerged as a frequent mechanism of endocrine therapy resis-
tance in patients with metastatic ER+ breast cancers. Whether
thesemutant alleles simply mimic the actions of estrogen-bound
ER or express additional neomorphic or allele-specific proper-
ties could have important therapeutic implications for patients.
We undertook a systematic approach to answer these questions
and to identify potential targets for therapies in metastatic breast
cancers driven by these ER mutants.
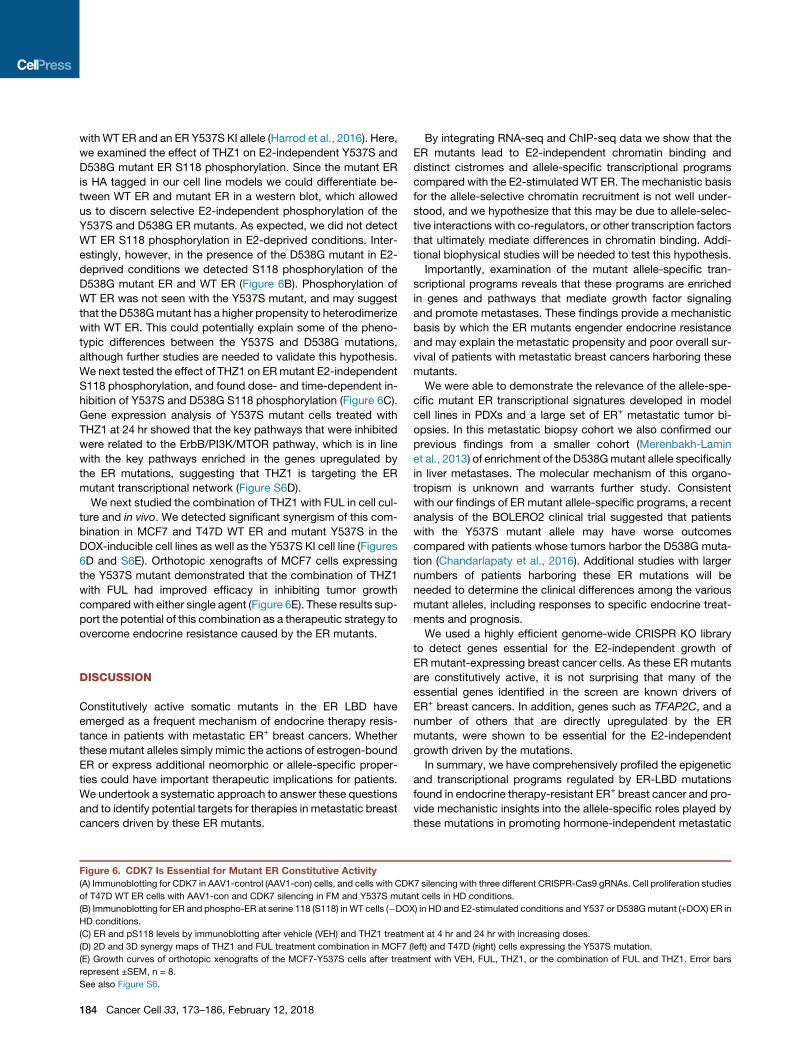
Figure 6. CDK7 Is Essential for Mutant ER Constitutive Activity
(A) Immunoblotting for CDK7 in AAV1-control (AAV1-con) cells, and cells with CDK
of T47D WT ER cells with AAV1-con and CDK7 silencing in FM and Y537S muta
(B) Immunoblotting for ER and phospho-ER at serine 118 (S118) in WT cells (�DOX
HD conditions.
(C) ER and pS118 levels by immunoblotting after vehicle (VEH) and THZ1 treatm
(D) 2D and 3D synergy maps of THZ1 and FUL treatment combination in MCF7 (
(E) Growth curves of orthotopic xenografts of the MCF7-Y537S cells after treat
represent ±SEM, n = 8.
See also Figure S6.
184 Cancer Cell 33, 173–186, February 12, 2018
By integrating RNA-seq and ChIP-seq data we show that the
ER mutants lead to E2-independent chromatin binding and
distinct cistromes and allele-specific transcriptional programs
compared with the E2-stimulated WT ER. The mechanistic basis
for the allele-selective chromatin recruitment is not well under-
stood, and we hypothesize that this may be due to allele-selec-
tive interactions with co-regulators, or other transcription factors
that ultimately mediate differences in chromatin binding. Addi-
tional biophysical studies will be needed to test this hypothesis.
Importantly, examination of the mutant allele-specific tran-
scriptional programs reveals that these programs are enriched
in genes and pathways that mediate growth factor signaling
and promote metastases. These findings provide a mechanistic
basis by which the ER mutants engender endocrine resistance
and may explain the metastatic propensity and poor overall sur-
vival of patients with metastatic breast cancers harboring these
mutants.
We were able to demonstrate the relevance of the allele-spe-
cific mutant ER transcriptional signatures developed in model
cell lines in PDXs and a large set of ER+ metastatic tumor bi-
opsies. In this metastatic biopsy cohort we also confirmed our
previous findings from a smaller cohort (Merenbakh-Lamin
et al., 2013) of enrichment of the D538Gmutant allele specifically
in liver metastases. The molecular mechanism of this organo-
tropism is unknown and warrants further study. Consistent
with our findings of ER mutant allele-specific programs, a recent
analysis of the BOLERO2 clinical trial suggested that patients
with the Y537S mutant allele may have worse outcomes
compared with patients whose tumors harbor the D538G muta-
tion (Chandarlapaty et al., 2016). Additional studies with larger
numbers of patients harboring these ER mutations will be
needed to determine the clinical differences among the various
mutant alleles, including responses to specific endocrine treat-
ments and prognosis.
We used a highly efficient genome-wide CRISPR KO library
to detect genes essential for the E2-independent growth of
ER mutant-expressing breast cancer cells. As these ER mutants
are constitutively active, it is not surprising that many of the
essential genes identified in the screen are known drivers of
ER+ breast cancers. In addition, genes such as TFAP2C, and a
number of others that are directly upregulated by the ER
mutants, were shown to be essential for the E2-independent
growth driven by the mutations.
In summary, we have comprehensively profiled the epigenetic
and transcriptional programs regulated by ER-LBD mutations
found in endocrine therapy-resistant ER+ breast cancer and pro-
vide mechanistic insights into the allele-specific roles played by
these mutations in promoting hormone-independent metastatic
7 silencing with three different CRISPR-Cas9 gRNAs. Cell proliferation studies
nt cells in HD conditions.
) in HD and E2-stimulated conditions and Y537 or D538Gmutant (+DOX) ER in
ent at 4 hr and 24 hr with increasing doses.
left) and T47D (right) cells expressing the Y537S mutation.
ment with VEH, FUL, THZ1, or the combination of FUL and THZ1. Error bars

growth. Our ability to validate these findings from cell culture
models in a large cohort of metastatic biopsies offers hope
that the therapeutic targets identified in the models will be able
to be translated to the clinic to improve outcomes for patients
with metastatic ER+ breast cancers harboring these mutations.
STAR+METHODS
Detailed methods are provided in the online version of this paper
and include the following:
d KEY RESOURCES TABLE
d CONTACT FOR REAGENT AND RESOURCE SHARING
d EXPERIMENTAL MODEL AND SUBJECT DETAILS
B Cell Lines
B In Vivo Animal Studies
B Human Tissue Studies
d METHOD DETAILS
B Generation of DOX-Inducible WT and Mutant ER Cells
B Generation of Transcription Activator Like Nucleases
(TALEN) Mediated Mutant Cells
B Proliferation Assays
B Western-Blotting
B Chromatin Immunoprecipitation (ChIP)-Sequencing
B RNA Sequencing
B Co-Regulator Interaction Profiling
B CRISPR Knock-Out Library Screen
B Generation of Single CRISPR/Cas9 Knock-Out Cells
B Drug Synergy Studies
d QUANTIFICATION AND STATISTICAL ANALYSIS
B RNA Sequenincg Analysis
B ChIP Sequencing Analysis
B CRISPR/CAS9 Library Screen Analysis
B Drug Synergy Analysis
d DATA AVAILABILITY
SUPPLEMENTAL INFORMATION
Supplemental Information includes six figures and six tables and can be found
with this article online at https://doi.org/10.1016/j.ccell.2018.01.004.
ACKNOWLEDGMENTS
This work was supported in part by grant from the NIH K08 CA191058-03 (to
R.J.), the Claudia Adams Barr Program for Innovative Cancer Research (to
R.J.), NCI grant P50 CA168504 (SPORE) Career Development Award (to R.J.),
a Susan Komen Leadership Grant (to M.B.), and NIH P01CA080111 (to M.B.).
AUTHOR CONTRIBUTIONS
Conceptualization, M.B., R.J., and G.B; Methodology, R.J., G.B., T.X., and
J.S.B.; Software, M.C., W. Li, A.F., X.Q., H.L., and X.S.L.; Formal Analysis,
M.B., R.J., M.C., M.P., W. Li, A.F., N.W., O.C., and R.H.; Investigation, R.J.,
M.P., M.C., J.S.B., T.X., W. Liu, A.N., K.A.H., G.B., P.R., D.M., and R.H.; Re-
sources, J.S.B., N.G., T.Z., N.W., E.P.W., and J.Z.; Data Curation, M.P. and
M.C.; Writing – Original Draft, R.J. and M.B.; Writing – Review & Editing, all au-
thors; Visualization, R.J., M.C., M.P., W. Li, and A.F.; Supervision, R.J., M.B.,
N.W., H.L., P.R., E.P.W., and J.Z.
DECLARATION OF INTERESTS
G.B. is an employee and shareholder of Celgene. R.H. is an employee of Pam-
gene International B.V. N.S.G., T.Z., and N.K. are inventors on a patent appli-
cation covering THZ1, which is licensed to a company co-founded by N.S.G.
N.W. is a shareholder of Foundation Medicine, is a consultant for Novartis and
receives research support from Novartis and Merck. All other authors have no
competing financial interests.
Received: July 18, 2017
Revised: November 2, 2017
Accepted: January 9, 2018
Published: February 12, 2018
REFERENCES
Ali, S., Metzger, D., Bornert, J.M., and Chambon, P. (1993). Modulation of tran-
scriptional activation by ligand-dependent phosphorylation of the human oes-
trogen receptor A/B region. EMBO J. 12, 1153–1160.
Bailey, T.L., Johnson, J., Grant, C.E., and Noble,W.S. (2015). TheMEME suite.
Nucleic Acids Res. 43, W39–W49.
Carroll, J.S., Liu, X.S., Brodsky, A.S., Li, W., Meyer, C.A., Szary, A.J.,
Eeckhoute, J., Shao, W., Hestermann, E.V., Geistlinger, T.R., et al. (2005).
Chromosome-wide mapping of estrogen receptor binding reveals long-range
regulation requiring the forkhead protein FoxA1. Cell 122, 33–43.
Chandarlapaty, S., Chen, D., He, W., Sung, P., Samoila, A., You, D., Bhatt, T.,
Patel, P., Voi, M., Gnant, M., et al. (2016). Prevalence of ESR1mutations in cell-
free DNA and outcomes in metastatic breast cancer: a secondary analysis of
the BOLERO-2 clinical trial. JAMA Oncol. 2, 1310–1315.
Chen, D., Riedl, T., Washbrook, E., Pace, P.E., Coombes, R.C., Egly, J.M., and
Ali, S. (2000). Activation of estrogen receptor alpha by S118 phosphorylation
involves a ligand-dependent interaction with TFIIH and participation of
CDK7. Mol. Cell 6, 127–137.
Cyr, A.R., Kulak, M.V., Park, J.M., Bogachek, M.V., Spanheimer, P.M.,
Woodfield, G.W., White-Baer, L.S., O’Malley, Y.Q., Sugg, S.L., Olivier, A.K.,
et al. (2015). TFAP2C governs the luminal epithelial phenotype in mammary
development and carcinogenesis. Oncogene 34, 436–444.
Dobin, A., Davis, C.A., Schlesinger, F., Drenkow, J., Zaleski, C., Jha, S., Batut,
P., Chaisson,M., andGingeras, T.R. (2013). STAR: ultrafast universal RNA-seq
aligner. Bioinformatics 29, 15–21.
Early Breast Cancer Trialists’ Collaborative Group, Peto, R., Davies, C.,
Godwin, J., Gray, R., Pan, H.C., Clarke, M., Cutter, D., Darby, S., McGale,
P., et al. (2012). Comparisons between different polychemotherapy regimens
for early breast cancer: meta-analyses of long-term outcome among 100,000
women in 123 randomised trials. Lancet 379, 432–444.
Ellis, M.J., Ding, L., Shen, D., Luo, J., Suman, V.J., Wallis, J.W., Van Tine, B.A.,
Hoog, J., Goiffon, R.J., Goldstein, T.C., et al. (2012). Whole-genome analysis
informs breast cancer response to aromatase inhibition. Nature 486, 353–360.
Fanning, S.W., Mayne, C.G., Dharmarajan, V., Carlson, K.E., Martin, T.A.,
Novick, S.J., Toy, W., Green, B., Panchamukhi, S., Katzenellenbogen, B.S.,
et al. (2016). Estrogen receptor alpha somatic mutations Y537S and D538G
confer breast cancer endocrine resistance by stabilizing the activating func-
tion-2 binding conformation. Elife 5, https://doi.org/10.7554/eLife.12792.
Feng, J., Liu, T., Qin, B., Zhang, Y., and Liu, X.S. (2012). Identifying ChIP-seq
enrichment using MACS. Nat. Protoc. 7, 1728–1740.
Fisher, R.P., and Morgan, D.O. (1994). A novel cyclin associates with MO15/
CDK7 to form the CDK-activating kinase. Cell 78, 713–724.
Fribbens, C., O’Leary, B., Kilburn, L., Hrebien, S., Garcia-Murillas, I., Beaney,
M., Cristofanilli, M., Andre, F., Loi, S., Loibl, S., et al. (2016). Plasma ESR1
mutations and the treatment of estrogen receptor-positive advanced breast
cancer. J. Clin. Oncol. 34, 2961–2968.
Glover-Cutter, K., Larochelle, S., Erickson, B., Zhang, C., Shokat, K., Fisher,
R.P., and Bentley, D.L. (2009). TFIIH-associated Cdk7 kinase functions in
phosphorylation of C-terminal domain Ser7 residues, promoter-proximal
pausing, and termination by RNA polymerase II. Mol. Cell. Biol. 29, 5455–5464.
GTEx Consortium (2013). The genotype-tissue expression (GTEx) project. Nat.
Genet. 45, 580–585.
Harrod, A., Fulton, J., Nguyen, V.T., Periyasamy, M., Ramos-Garcia, L., Lai,
C.F., Metodieva, G., de Giorgio, A., Williams, R.L., Santos, D.B., et al.
Cancer Cell 33, 173–186, February 12, 2018 185

(2016). Genomicmodelling of the ESR1Y537Smutation for evaluating function
and new therapeutic approaches for metastatic breast cancer. Oncogene 36,
2286–2296.
Ianevski, A., He, L., Aittokallio, T., and Tang, J. (2017). SynergyFinder: a web
application for analyzing drug combination dose-response matrix data.
Bioinformatics 33, 2413–2415.
Jeselsohn, R., Yelensky, R., Buchwalter, G., Frampton, G., Meric-Bernstam, F.,
Gonzalez-Angulo, A.M., Ferrer-Lozano, J., Perez-Fidalgo, J.A., Cristofanilli, M.,
Gomez, H., et al. (2014). Emergence of constitutively active estrogen receptor-
alpha mutations in pretreated advanced estrogen receptor-positive breast can-
cer. Clin. Cancer Res. 20, 1757–1767.
Jeselsohn, R., Barry, W.T., Migliaccio, I., Biagioni, C., Zhao, J., De Tribolet-
Hardy, J., Guarducci, C., Bonechi, M., Laing, N., Winer, E.P., et al. (2016).
TransCONFIRM: identification of a genetic signature of response to fulvestrant
in advanced hormone receptor-positive breast cancer. Clin. Cancer Res. 22,
5755–5764.
Koppen, A., Houtman, R., Pijnenburg, D., Jeninga, E.H., Ruijtenbeek, R., and
Kalkhoven, E. (2009). Nuclear receptor-coregulator interaction profiling iden-
tifies TRIP3 as a novel peroxisome proliferator-activated receptor gamma
cofactor. Mol. Cell Proteomics 8, 2212–2226.
Kornberg, R.D. (2005). Mediator and the mechanism of transcriptional activa-
tion. Trends Biochem. Sci. 30, 235–239.
Kwiatkowski, N., Zhang, T., Rahl, P.B., Abraham, B.J., Reddy, J., Ficarro, S.B.,
Dastur, A., Amzallag, A., Ramaswamy, S., Tesar, B., et al. (2014). Targeting
transcription regulation in cancer with a covalent CDK7 inhibitor. Nature 511,
616–620.
Langmead, B., Trapnell, C., Pop, M., and Salzberg, S.L. (2009). Ultrafast and
memory-efficient alignment of short DNA sequences to the human genome.
Genome Biol. 10, R25.
Larochelle, S., Merrick, K.A., Terret, M.E.,Wohlbold, L., Barboza, N.M., Zhang,
C., Shokat, K.M., Jallepalli, P.V., and Fisher, R.P. (2007). Requirements for
Cdk7 in the assembly of Cdk1/cyclin B and activation of Cdk2 revealed by
chemical genetics in human cells. Mol. Cell 25, 839–850.
Li, W., Koster, J., Xu, H., Chen, C.H., Xiao, T., Liu, J.S., Brown, M., and Liu, X.S.
(2015). Quality control, modeling, and visualization of CRISPR screens with
MAGeCK-VISPR. Genome Biol. 16, 281.
Loven, J., Hoke, H.A., Lin, C.Y., Lau, A., Orlando, D.A., Vakoc, C.R., Bradner,
J.E., Lee, T.I., and Young, R.A. (2013). Selective inhibition of tumor oncogenes
by disruption of super-enhancers. Cell 153, 320–334.
Meerbrey, K.L., Hu, G., Kessler, J.D., Roarty, K., Li, M.Z., Fang, J.E.,
Herschkowitz, J.I., Burrows, A.E., Ciccia, A., Sun, T., et al. (2011). The
pINDUCER lentiviral toolkit for inducible RNA interference in vitro and in vivo.
Proc. Natl. Acad. Sci. USA 108, 3665–3670.
Merenbakh-Lamin, K., Ben-Baruch, N., Yeheskel, A., Dvir, A., Soussan-
Gutman, L., Jeselsohn, R., Yelensky, R., Brown, M., Miller, V.A., Sarid, D.,
et al. (2013). D538G mutation in estrogen receptor-alpha: a novel mechanism
for acquired endocrine resistance in breast cancer. Cancer Res. 73, 6856–
6864.
Neph, S., Kuehn, M.S., Reynolds, A.P., Haugen, E., Thurman, R.E., Johnson,
A.K., Rynes, E., Maurano, M.T., Vierstra, J., Thomas, S., et al. (2012).
BEDOPS: high-performance genomic feature operations. Bioinformatics 28,
1919–1920.
Nettles, K.W., Bruning, J.B., Gil, G., Nowak, J., Sharma, S.K., Hahm, J.B.,
Kulp, K., Hochberg, R.B., Zhou, H., Katzenellenbogen, J.A., et al. (2008).
NFkappaB selectivity of estrogen receptor ligands revealed by comparative
crystallographic analyses. Nat. Chem. Biol. 4, 241–247.
186 Cancer Cell 33, 173–186, February 12, 2018
Robinson, D.R., Wu, Y.M., Vats, P., Su, F., Lonigro, R.J., Cao, X., Kalyana-
Sundaram, S., Wang, R., Ning, Y., Hodges, L., et al. (2013). Activating ESR1
mutations in hormone-resistant metastatic breast cancer. Nat. Genet. 45,
1446–1451.
Rosell, M., Nevedomskaya, E., Stelloo, S., Nautiyal, J., Poliandri, A., Steel,
J.H., Wessels, L.F., Carroll, J.S., Parker, M.G., and Zwart, W. (2014).
Complex formation and function of estrogen receptor alpha in transcription re-
quires RIP140. Cancer Res. 74, 5469–5479.
Shalem, O., Sanjana, N.E., Hartenian, E., Shi, X., Scott, D.A., Mikkelsen, T.S.,
Heckl, D., Ebert, B.L., Root, D.E., Doench, J.G., and Zhang, F. (2014).
Genome-scale CRISPR-Cas9 knockout screening in human cells. Science
343, 84–87.
Spoerke, J.M., Gendreau, S., Walter, K., Qiu, J., Wilson, T.R., Savage, H., Aimi,
J., Derynck, M.K., Chen, M., Chan, I.T., et al. (2016). Heterogeneity and clinical
significance of ESR1 mutations in ER-positive metastatic breast cancer pa-
tients receiving fulvestrant. Nat. Commun. 7, 11579.
Subramanian, A., Tamayo, P., Mootha, V.K., Mukherjee, S., Ebert, B.L.,
Gillette, M.A., Paulovich, A., Pomeroy, S.L., Golub, T.R., Lander, E.S., and
Mesirov, J.P. (2005). Gene set enrichment analysis: a knowledge-based
approach for interpreting genome-wide expression profiles. Proc. Natl.
Acad. Sci. USA 102, 15545–15550.
Toy, W., Shen, Y., Won, H., Green, B., Sakr, R.A., Will, M., Li, Z., Gala, K.,
Fanning, S., King, T.A., et al. (2013). ESR1 ligand-binding domain mutations
in hormone-resistant breast cancer. Nat. Genet. 45, 1439–1445.
Toy, W., Weir, H., Razavi, P., Lawson, M., Goeppert, A.U., Mazzola, A.M.,
Smith, A., Wilson, J., Morrow, C., Wong, W.L., et al. (2017). Activating ESR1
mutations differentially affect the efficacy of ER antagonists. Cancer Discov.
7, 277–287.
Trapnell, C., Williams, B.A., Pertea, G., Mortazavi, A., Kwan, G., van Baren,
M.J., Salzberg, S.L., Wold, B.J., and Pachter, L. (2010). Transcript assembly
and quantification by RNA-Seq reveals unannotated transcripts and isoform
switching during cell differentiation. Nat. Biotechnol. 28, 511–515.
Wang, Q., Li, W., Zhang, Y., Yuan, X., Xu, K., Yu, J., Chen, Z., Beroukhim, R.,
Wang, H., Lupien, M., et al. (2009). Androgen receptor regulates a distinct
transcription program in androgen-independent prostate cancer. Cell 138,
245–256.
Wang, L., Wang, S., and Li, W. (2012). RSeQC: quality control of RNA-seq ex-
periments. Bioinformatics 28, 2184–2185.
Wang, S., Sun, H., Ma, J., Zang, C., Wang, C., Wang, J., Tang, Q., Meyer, C.A.,
Zhang, Y., and Liu, X.S. (2013). Target analysis by integration of transcriptome
and ChIP-seq data with BETA. Nat. Protoc. 8, 2502–2515.
Whyte, W.A., Orlando, D.A., Hnisz, D., Abraham, B.J., Lin, C.Y., Kagey, M.H.,
Rahl, P.B., Lee, T.I., and Young, R.A. (2013). Master transcription factors and
mediator establish super-enhancers at key cell identity genes. Cell 153,
307–319.
Xu, H., Xiao, T., Chen, C.H., Li, W., Meyer, C.A., Wu, Q., Wu, D., Cong, L.,
Zhang, F., Liu, J.S., et al. (2015). Sequence determinants of improved
CRISPR sgRNA design. Genome Res. 25, 1147–1157.
Yi, P., Wang, Z., Feng, Q., Pintilie, G.D., Foulds, C.E., Lanz, R.B., Ludtke, S.J.,
Schmid, M.F., Chiu, W., and O’Malley, B.W. (2015). Structure of a biologically
active estrogen receptor-coactivator complex on DNA. Mol. Cell 57, 1047–
1058.
Zhang, Y., Liu, T., Meyer, C.A., Eeckhoute, J., Johnson, D.S., Bernstein, B.E.,
Nusbaum, C., Myers, R.M., Brown, M., Li, W., and Liu, X.S. (2008). Model-
based analysis of ChIP-seq (MACS). Genome Biol. 9, R137.

STAR+METHODS
KEY RESOURCES TABLE
REAGENT or RESOURCE SOURCE IDENTIFIER
Antibodies
Rabbit polyclonal anti-ERa Santa Cruz SC-543;RRID:AB_631471
Rabbit polyclonal anti-TFAP2C Santa Cruz H-77;RRID:AB-2286995
Mouse monoclonal anti-CDK7 Cell signaling 2916;RRID:AB-2077142
Rabbit polyclonal anti-HA Abcam Ab9110;RRID:AB_307019
Rabbit polyclonal anti H3K27Ac Diagenode C15410196;RRID:AB_2637079
Goat polyclonal anti-FOXA1 Abcam Ab5089;RRID: AB_304744
Biological Samples
Breast cancer metastatic tumors DFCI
Patient derived xenografts DFCI
Chemical, Peptides and Recombinant Proteins
Beta-Estradiol Sigma Aldrich E2758
Fulvestrant Sigma Aldrich I4409
4-hydroxy-tamoxifen Sigma Aldrich H7904
THZ1 DFCI
Critical Commercial Assays
ThruPLEX-FD Prep Kit Rubicon R40048
TruSeq RNA Sample Preparation Kit Illumina RS-122-2010
Deposited data
Raw RNAseq and ChIPseq data This paper GSE94493 and GSE106552
Experimental Models: Cell lines
Human: MCF7 ATCC HTB-22
Human: T47D ATCC HTB-133
Experimental Models: Organisms/strains
NOD-SCID-IL2Rgc–/– mice Jackson Lab 005557
Oligonucleotides
Mutagenesis primers This manuscript
Y537N: Forward,
5’- AACGTGGTGCCCCTCAATGACCTGCTGCTGGAGA T -3’
Y537N: Reverse,
5’- ATCTCCAGCAGCAGGTCATTGAGGGGCACCACGTT -3’
Y537S: Forward,
5’- AACGTGGTGCCCCTCTCTGACCTGCTGCTGGAGAT -3’
Y537S:Reverse,
5’- ATCTCCAGCAGCAGGTCAGAGAGGGGCACCACGTT -3’
D538G: Forward,
5’- AACGTGGTGCCCCTCTATGGCCTGCTGCTGGAGAT -3’
D538G:Reverse,
5’-ATCTCCAGCAGCAGGCCATAGAGGGGCACCACGTT -3’
TALEN sequences This manucript
XTN1:
5’TCCCAGCTCCCATCCTAAAGTGGGTCTTTAAACAGGAAGAAAGAAAGATTGCTA3’
XTN2:
5’TCAGCTTTCCCAGCTCCCATCCTAAAGTGGGTCTTTAAACAGGAAGAAAGAA3’
TFAP2C gRNAs:
gRNA1:F: 5’CACCGCGAATTTCCTAGTAAACCAG3’
gRNA1 R: 5’ AAACCTGGTTTACTAGGAAATTCG3’
gRNA2:F:5’CACCGCAGCTCCTTCTGACAGGGG3’
(Continued on next page)
Cancer Cell 33, 173–186.e1–e5, February 12, 2018 e1

Continued
REAGENT or RESOURCE SOURCE IDENTIFIER
gRNA2 R: 5’ AAACCCCCTGTCAGAAGGAGCTGC3’ This manuscript
CDK7 gRNAs:
gRNA1:F:5’CACCGGAAGCTGGACTTCCTTGGGG3’
gRNA1:R:5’AAACCCCCAAGGAAGTCCAGCTTCC3’
gRNA2:F:5’CACCGATCTCTGGCCTTGTAAACGG3’
gRNA2:R:5’AAACCCGTTTACAAGGCCAGAGATC3’
gRNA3:F:5’CACCGATGTGTATAAGCTCTATTG3’
gRNA3:R:5’AAACCAATAGAGCTTATACACATC3’ This manuscript
FOXA1 gRNAs:
gRNA1: F:5’ CACTACTACGCAGACACGCAGG3’
gRNA1: R: 5’AAA ATGATGCGTCTGTGCGTCC3’
gRNA2: F 5’CACGACATGTTGAAGGACGCCG3’
gRNA2: R: 5’AAACTGTACAACTTCCTGCGGC3’
Recombinant DNA
pInducer This manuscript
LentiCRISPR V2
Software and Algorithms
MACS 2.0 This manuscript
Bamliquidator
Binding and Expression Target Analysis (BETA)
MEME Meerbrey, et al Elledge lab
ROSE Addgene 49535
Feng et al
https://github.com/BradnerLab/
pipeline/wiki/bamliquidator
Cistrome. org
https://bitbucket.org/young_
computation/rose.git
CONTACT FOR REAGENT AND RESOURCE SHARING
Further information and requests for resources and reagents should be directed andwill be fulfilled by the Lead Contact Myles Brown
EXPERIMENTAL MODEL AND SUBJECT DETAILS
Cell LinesMCF7 and T47D cells were purchased from ATCC. All the cells were authenticated and regularly tested for mycoplasma contami-
nation. The MCF7 cells were maintained in DMEM and T47D cells in RPMI supplemented with 10% heat-inactivated fetal bovine
serum (FBS) and 1%penicillin/streptomycin (P/S). For hormone-depleted (HD) conditions, cells were kept in phenol-red freemedium
supplemented with 10% heat-inactivated charcoal-stripped (CS)-FBS and 1% PS. All cells were incubated at 37�C in 5% CO2.
In Vivo Animal StudiesAll mice were maintained in accordance with local guidelines and therapeutic interventions approved by the Animal Care and Use
Committees of Dana-Farber Cancer Institute. For the PDX studies, patient consent for tumor implantation in nudemice was obtained
under protocols approved by the IRB of the Dana-Farber/Harvard Cancer Center. ER+metastatic tumor samples were implanted into
the cleared fourth mammary fat pads of NOD-SCID-IL2Rgc–/– mice (Jackson Laboratories) treated with an E2 pellet. Mice were all
females and fiveweeks old. Similarly, for the orthtotopic xenografts derived fromcell lines,NOD-SCID-IL2Rgc–/–mice female 5weeks
old mice (Jackson Laboratories) were used.
e2 Cancer Cell 33, 173–186.e1–e5, February 12, 2018

Human Tissue StudiesAll patients provided written informed consent for research metastatic biopsies and genomic profiling of tumor RNA, as approved
by the Dana-Farber/Harvard Cancer Center Institutional Review Board (DF/HCC Protocol 05-246). Core biopsies were obtained
from patients with metastatic ER+ breast cancer. After the core biopsy, samples were immediately snap frozen in OCT and stored
in -80C freezer.
METHOD DETAILS
Generation of DOX-Inducible WT and Mutant ER CellsFor the DOX-inducible ER mutant and WT-ER cells, ER-HA tag cDNA (GeneCopoeia) was transferred to the pInducer 20 destination
vector(Meerbrey et al., 2011) using the Gateway system (Invitrogen). Lentivirus was produced in 293T cells to infect cells in media
containing polybrene (8mg/mL). Cells were selected after the infection with G418. The GeneArt Site-Directed mutagenesis system
(Life Technologies) was used to generate Y537N, Y537S and D538G mutations within the ER ligand-binding domain. The following
mutagenesis primers were used:
1. Y537N: Forward, 5’- AACGTGGTGCCCCTCAATGACCTGCTGCTGGAGA T -3’ Reverse, 5’- ATCTCCAGCAGCAGGTCATTGAG
GGGCACCACGTT -3’
2. Y537S: Forward, 5’- AACGTGGTGCCCCTCTCTGACCTGCTGCTGGAGAT -3’
Reverse, 5’- ATCTCCAGCAGCAGGTCAGAGAGGGGCACCACGTT -3’
3. D538G: Forward, 5’- AACGTGGTGCCCCTCTATGGCCTGCTGCTGGAGAT -3’
Reverse, 5’- ATCTCCAGCAGCAGGCCATAGAGGGGCACCACGTT -3’.
Sanger sequencing and RNA-sequencing confirmed the desired mutations.
Generation of Transcription Activator Like Nucleases (TALEN) Mediated Mutant CellsThe ESR1 Y537S and D538G knock-in mutant cells were generated in MCF7 cells. The TALENs were designed to target intron 7 and
the TALEN recognition sequences were:
XTN1: (bold=cut region, non-bold=TAL binding sites)
5’TCCCAGCTCCCATCCTAAAGTGGGTCTTTAAACAGGAAGAAAGAAAGATTGCTA3’
XTN2: (bold=cut region, non-bold=TAL binding sites)
5’TCAGCTTTCCCAGCTCCCATCCTAAAGTGGGTCTTTAAACAGGAAGAAAGAA3’
The sequences were synthesized and cloned into the SQT281 vector (Transposagen) that includes a Fok1 nuclease. For the
homologous recombination we used a donor vector that contained the targeting constructs of piggyBac transposon and the a pu-
romycin-thymidine kinase (TK) selection cassette flanked by 500 bp of ESR1 genomic sequence with the coding changes (TAT>TCT
for Y537S and GAC>GGC for G538G) in the 3’ end matching the exon 8 coding region. The MCF7 cells were transiently transfected
with the TALEN vector and donor vector using Lipofectamine 2000 (Invitrogen). After puromycin selection, clones with the desired
mutation were identified by Sanger sequencing and transiently transfected with transposase expression plasmids (Transposagen)
for removal of the selection cassettes followed by gancyclovir treatment for negative selection to enable a ‘‘foot-print free’’
knock-in cell lines. We confirmed the mutations by Sanger sequencing and RNA-sequencing.
Proliferation AssaysThe breast cancer cells were plated in 24 well plates. At indicated time points, the cells were counted using the Celigo image
Cytometer (Nexcelom). Hoescht was used for nuclear staining and propidium iodide was used for staining dead cells. For the
dose response studies and determination of the IC50’s 4-hydroxytamoxifen (Sigma-Aldrich, catalog # H7904), fulvestrant (Sigma
catalog #I4409) and THZ1 (Nathanael Gray’s lab, Dana Farber Cancer Institute) were used.
Western-BlottingFor Western blot analysis, cells were lysed in 50mM Tris-HCl pH 7.5, 150mMNaCl, 1mM EDTA, 1mM EGTA, 0.5%NP-40, 1% Triton
X-100 supplemented with protease inhibitors and subjected to SDS-PAGE. Antibodies used were: ERa (sc-543, Santa Cruz),
TFAP2C (Santa Cruz), CDK7 (Cell Signaling, 2916), ER-S118 (Cell Signaling, 2511), Beta-Actin (Sigma), GAPDH (Santa Cruz),
HA (Ab9110, Abcam).
Chromatin Immunoprecipitation (ChIP)-SequencingChIP experiments were conducted as described previously (Wang et al., 2009) and were done in triplicates. Chromatin from approx-
imately 13 107 fixed cells was sonicated to a size range of 200-300 bp. Solubilized chromatin was subjected to immunoprecipitation
with the ER antibody, Ab10 (Lab Vision corporation) and SC-543 (Santa cruz), HA antibody (Ab9110, Abcam), H3K27Ac antibody
(C15410196, Diagenode) or FOXA1 (ab5089,Abcam) bound to protein A and protein G beads (Life Technologies). A fraction of
the sample was not exposed to antibody to be used as control (input). The samples were reversed crosslinked, treated with
proteinase K, and DNA was extracted. DNA sequencing libraries were prepared using the ThruPLEX-FD Prep Kit (Rubicon
Genomics). Libraries were sequenced using 50 bp reads on the Illumina Nextseq500 at the Dana-Farber Cancer Institute.
Cancer Cell 33, 173–186.e1–e5, February 12, 2018 e3
RNA SequencingTotal RNA was isolated using an RNeasy Mini Kit (Qiagen). For all cell line studies samples were done in triplicates. RNA-seq libraries
were made using the TruSeq RNA Sample Preparation Kit (Illumina) adapted for use on the Sciclone (Perkin-Elmer) liquid handler.
Samples were sequenced on an Illumina Nextseq500.
Co-Regulator Interaction ProfilingThis method has been described previously (Koppen et al., 2009). Cell lysates of each clone were prepared and ERa was quantified
by ELISA (Active Motif, USA) to enable equimolar input. An array with a set of immobilized peptides representing coregulator-derived
NR-binding motifs is incubated with a reaction mixture of crude lysate, vehicle (2% DMSO) with or without 1 mM 17-b-estradiol (E2)
and anti-HIS-Alexa488 (Qiagen, USA). Incubationwas performed for 40minutes at 20�C, followed by removal of unbound receptor by
washing and generation of a tiff image of each array using a PamStation96 (PamGene International). Image processing and quanti-
fication of ERa binding to each peptide on the array was performed by Bionavigator software (PamGene International). The list of
protein peptides evaluated detailed in Table S4.
CRISPR Knock-Out Library ScreenTo design an efficient genome-wide CRISPR-Cas9 library for screening, we first scanned human genome to select gRNAs with an
‘‘NGG’’ PAM sequence motif adjacent to its 3’ end. Then we predicted efficiency score of each gRNA based on our Least Absolute
Shrinkage and Selection Operator (LASSO) model(Xu et al., 2015). We further selected the putative 19bp sgRNA targets that are
within the exons of the genes selected for screening, have the best predicted efficiency score and have no mutation relative to
the reference genome in any cancer cell line (COSMIC). Tominimize off-target effects, we aligned the 19bp sequences of the putative
targets against all exons in the genome. The gRNAs with fewer than 2 mismatches in the secondary match outside the target gene
were removed. In the library, we also included two types of negative controls: i) non-specific sgRNAs that are notmappable to human
genome; ii) sgRNAs targeting the AAVS1 integration locus where insertion or deletion does not affect cell function. Taken together,
the lentivirus library consisted of 183128 gRNAs for 18313 protein-coding genes, 730 gRNAs for ribosomes, 385 gRNAs for non-tar-
geting controls, and 136 gRNAs for AAVS1 controls. The sgRNA library synthesized at CustomArray and amplified by PCR as pre-
viously described(Shalem et al., 2014). The PCR products were subsequently ligated into lentiCRISPR V2 plasmid, followed by trans-
formation to competent cells for amplification according to the online protocol GeCKO library Amplification Protocol from Addgene.
After plasmid library was amplified, we isolated the plasmid and constructed a sequencing library forMiseq to ensure library diversity.
The DOX-inducible cells were infected at a low MOI (0.2) to ensure that most cells receive only one viral construct with high proba-
bility. Large-scale infection of 2x10⁸ cells was carried. After five days of puromycin selection, the surviving cells were divided into day
0 control cells and cells cultured for five weeks before genomic DNA extraction and library preparation. Each library was sequenced
at 25 million reads to achieve �300X average coverage over the CRISPR library. The 0 day sample library of each screen served as
controls to identify positively or negatively selected genes or pathways.
Generation of Single CRISPR/Cas9 Knock-Out CellsConstruction of lenti-CRISPR/Cas9 vectors targeting transcriptional CDK was performed following the protocol associated with the
backbone vector (49535, Addgene). The following sgRNA sequences were used:
TFAP2C Guides:
gRNA1:F:5’CACCGCGAATTTCCTAGTAAACCAG3’
gRNA1 R: 5’ AAACCTGGTTTACTAGGAAATTCG3’
gRNA2:F:5’CACCGCAGCTCCTTCTGACAGGGG3’
gRNA2 R: 5’ AAACCCCCTGTCAGAAGGAGCTGC 3’
CDK7 Guides:
gRNA1:F:5’CACCGGAAGCTGGACTTCCTTGGGG3’
gRNA1:R:5’AAACCCCCAAGGAAGTCCAGCTTCC3’
gRNA2:F:5’CACCGATCTCTGGCCTTGTAAACGG3’
gRNA2:R:5’AAACCCGTTTACAAGGCCAGAGATC3’
gRNA3:F:5’CACCGATGTGTATAAGCTCTATTG3’ rv: gRNA3:R:5’AAACCAATAGAGCTTATACACATC3’
FOXA1 Guides:
gRNA1: F:5’ CACTACTACGCAGACACGCAGG3’
gRNA1: R: 5’AAA ATGATGCGTCTGTGCGTCC3’
gRNA2: F 5’CACGACATGTTGAAGGACGCCG3’
gRNA2: R: 5’AAACTGTACAACTTCCTGCGGC3’
Drug Synergy StudiesCells were plated in 96 wells and treated with vehicle and 2 fold serial dilutions for 6 doses of THZ1(2.5, 5, 10, 20, 40 and 80 nM) and
fulvestrant(1.2, 2.5,5, 10, 20 and 40 nM) in a matrix format to include 49 different dose combinations. Viable cells were counted on
day 5 with the Celigo image Cytometer (Nexcelom).
e4 Cancer Cell 33, 173–186.e1–e5, February 12, 2018

QUANTIFICATION AND STATISTICAL ANALYSIS
Statistical analyses for cell proliferation studies were performed using two sided Student’s t-tests, and p values less than 0.05 were
considered statistically significant. Error bars represent the ±SEM. Cell line experiments testing cell proliferation were all performed in
triplicates.
RNA Sequenincg AnalysisAlignment to the hg19 human genome was done using STAR v2.5.1(Dobin et al., 2013) followed by Transcript assembly using
cufflinks v2.2.1(Trapnell et al., 2010) and quality control steps were done using STAR v2.5.1 and RseQC v2.6.2(Wang et al.,
2012). We assessed each sample onmetrics of mappable reads, percentage of rRNA reads, gene body coverage, and junction satu-
ration and insert_size for paired end, to determine samples that were of adequate quality. Differential Expression Analysis was done
using DEseq2 v1.1(Wang et al., 2012). GSEA analysis was performed using the Broad GSEA Application (Subramanian et al., 2005)
ChIP Sequencing AnalysisChIP-seq reads were aligned to the hg19 genome assembly using Bowtie(Langmead et al., 2009) and ChIP-seq peaks were called
using MACS 2.0 (Feng et al., 2012; Zhang et al., 2008). For differential binding analysis, bedfiles were merged using bedops (Neph
et al., 2012) and then Bamliquidator (https://github.com/BradnerLab/pipeline/wiki/bamliquidator) was used to assign a binding inten-
sity score to each region of the merged bed file. Differential binding was determined by filtering out insignificantly binding peaks
(Bamliquidator score < 0.1) and then determining log2FC values between samples for each region using a log2 FC >1 or <-1. For
the Binding and Expression Target Analysis (BETA) correlative analysis with RNA-seq differential expression the peaks were defined
into region bed files including upbound peaks (log2FC > 1), downbound peaks (log2FC < -1), and nodiff peaks (log2FC < 1 and >-1).
Each of these bed files was paired with the associated differential gene expression including only the differential genes with an
adjusted p-value of <0.1. We took the outputted BETA bed files, added up the BETA scores for each gene and normalized each
BETA score by dividing by the original number of peaks entered into BETA. Then for each of the three files, we binned the genes
by log2FC into bins of 100, and plotted out the average log2FC of gene expression, and the average normalized BETA score for
each bin.
The motif analysis was done using the MEME suite tool AME (Analysis of Motif Enrichment)(Bailey et al., 2015).
To identify super-enhancers, we employed the ROSE algorithm to rank the enhancers that were identified using MACS in which
peaks fromH3K27acChIPwithin 12.5 kb of one another were stitched together (Loven et al., 2013;Whyte et al., 2013). These stitched
enhancers were ranked by their difference in H3K27ac signal versus input signal.
A threshold separating super-enhancers from typical enhancers was identified by finding the point at which the line Y=X was
tangent to the curve formed by plotting the stitched enhancer rank versus H3K27ac signal subtracting the input signal.
CRISPR/CAS9 Library Screen AnalysisThe CRISPR/Cas9 screening data was processed and analyzed using theMAGeCK andMAGeCK-VISPR algorithms previously pub-
lished (Li et al., 2015). MAGeCK-VISPR uses ametric, ‘‘b score’’, tomeasure gene selections. The definition of b score is similar to the
term of ‘log FC’ in differential expression analysis, and b>0 (or <0)means the corresponding gene is positively (or negatively) selected,
respectively. We considered a b score of >0.5 or <-0.5 as significant. MAGeCK-VISPR models the gRNA read counts as a negative
binomial variable, whose mean value is determined by the sequencing depth of the sample, the efficiency of the gRNA, and a linear
combination of b scores of the genes. MAGeCK-VISPR then builds amaximum likelihood (MLE)model tomodel all gRNA read counts
of all samples, and iteratively estimate the gRNA efficiency and gene b scores using the Expectation-Maximization algorithm.
Drug Synergy AnalysisDrug synergy was calculated based on the Bliss independence model using the SynergyFinder R package (Ianevski et al., 2017).
DATA AVAILABILITY
The RNA-seq and ChIP-seq data have been deposited in the Gene Expression Omnibus database. The accession numbers for the
sequencing data reported in this paper are GSE94493 and GSE106552.
Cancer Cell 33, 173–186.e1–e5, February 12, 2018 e5