allen d. malony, kevin huck {malony,khuck}@cs.uoregon.edu department of computer and information...
TRANSCRIPT

Allen D. Malony, Kevin Huck {malony,khuck}@cs.uoregon.edu
http://www.cs.uoregon.edu/research/tau
Department of Computer and Information Science
Performance Research Laboratory
University of Oregon
Knowledge Support for MiningParallel Performance Data
APART, November 11, 2007 2Knowledge Support for Mining Parallel Performance Data
Outline
Why mine parallel performance data? Our first attempt
PerfDMF PerfExplorer
How did we do? Why knowledge-driven data mining? PerfExplorer v2
Analysis process automation Metadata encoding and incorporation Inference engine Object persistence and provenance
Analysis examples
APART, November 11, 2007 3Knowledge Support for Mining Parallel Performance Data
Motivation for Performance Data Mining
High-end parallel applications and systems evolution More sophisticated, integrated, heterogeneous operation Higher levels of abstraction Larger scales of execution
Evolution trends change performance landscape Parallel performance data becomes more complex
Multivariate, higher dimensionality, heterogeneous Greater scale and larger data size
Standard analysis techniques overwhelmed Need data management and analysis automation Provide foundation for performance analytics
APART, November 11, 2007 4Knowledge Support for Mining Parallel Performance Data
Performance Data Mining Objectives
Conduct parallel performance analysis in a systematic, collaborative and reusable manner Manage performance data and complexity Discover performance relationship and properties Automate performance investigation process
Multi-experiment performance analysis Large-scale performance data reduction
Summarize characteristics of large processor runs Implement extensible analysis framework
Abtraction / automation of data mining operations Interface to existing analysis and data mining tools
APART, November 11, 2007 5Knowledge Support for Mining Parallel Performance Data
Performance Data Management (PerfDMF)
K. Huck, A. Malony, R. Bell, A. Morris, “Design and Implementation of a Parallel Performance Data Management Framework,” ICPP 2005.
gprof cubempiP O|SSpsrun HPMToolkit…
APART, November 11, 2007 6Knowledge Support for Mining Parallel Performance Data
Analysis Framework (PerfExplorer)
Leverage existing TAU infrastructure Focus on parallel profiles Build on PerfDMF
Support large-scale performance analysis Multiple experiments Parametric studies
Apply data mining operations Comparative, clustering, correlation, dimension
reduction, … Interface to existing tools (Weka, R) Abstraction/automation
APART, November 11, 2007 7Knowledge Support for Mining Parallel Performance Data
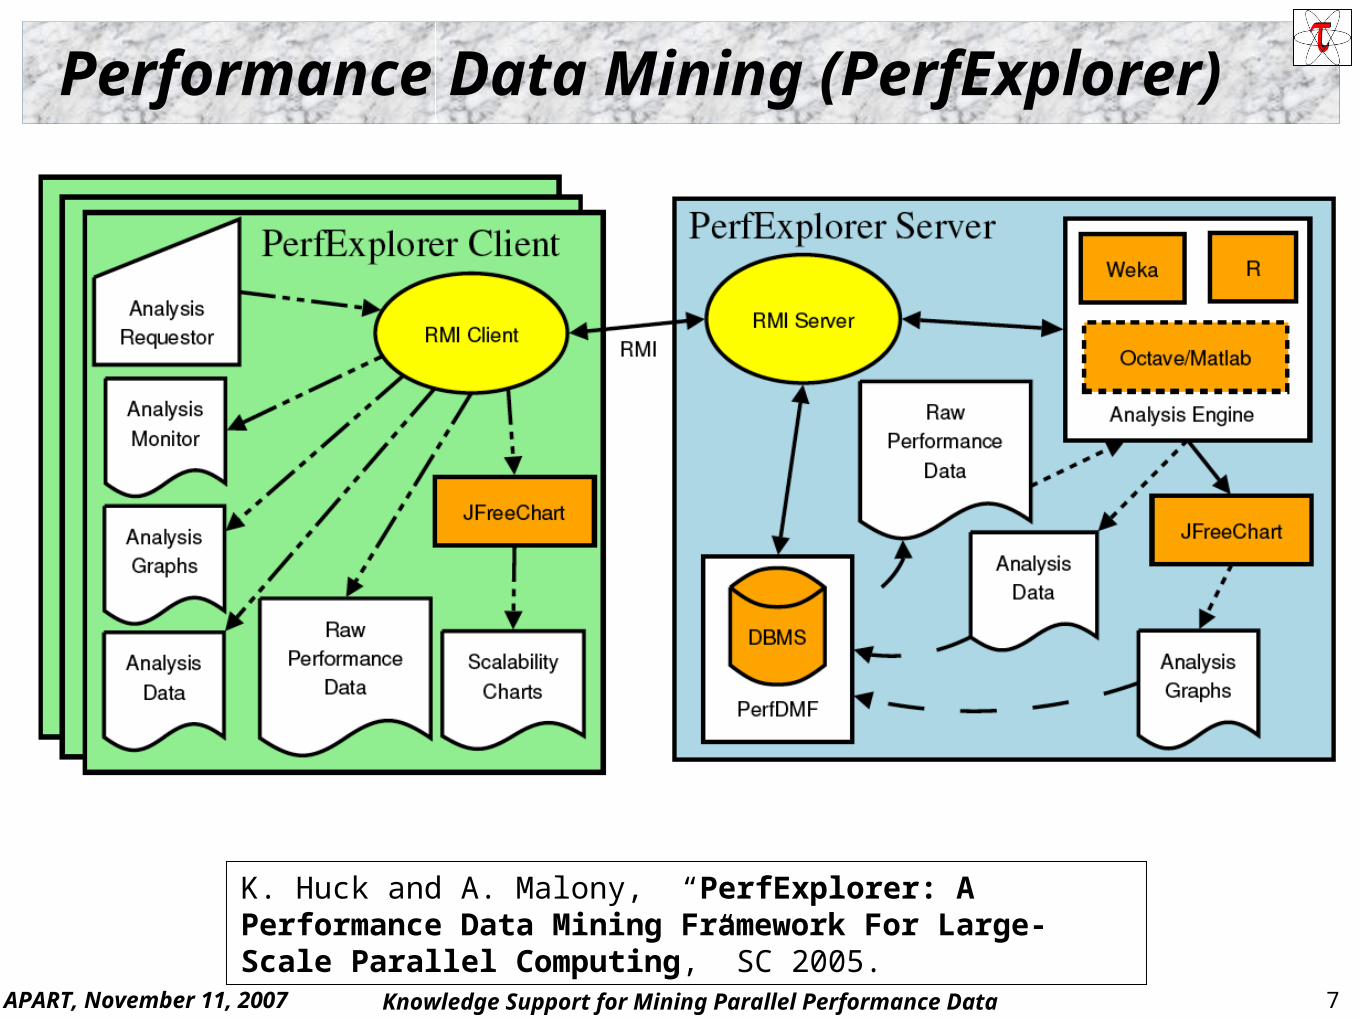
Performance Data Mining (PerfExplorer)
K. Huck and A. Malony, “PerfExplorer: A Performance Data Mining Framework For Large-Scale Parallel Computing,” SC 2005.
APART, November 11, 2007 8Knowledge Support for Mining Parallel Performance Data
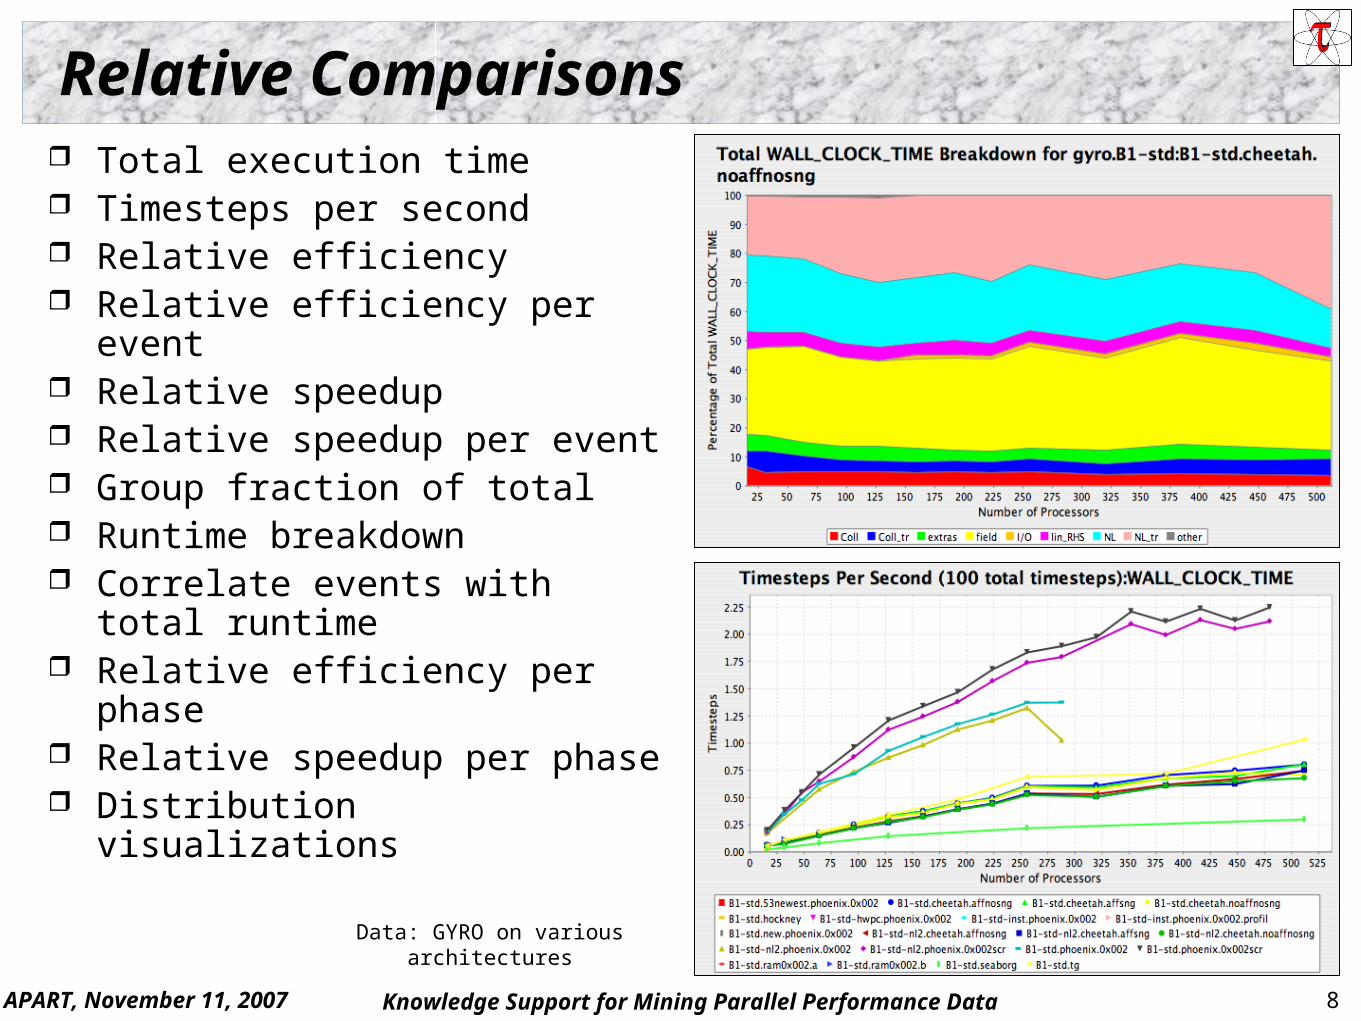
Data: GYRO on various architectures
Relative Comparisons Total execution time Timesteps per second Relative efficiency Relative efficiency per event Relative speedup Relative speedup per event Group fraction of total Runtime breakdown Correlate events with total
runtime Relative efficiency per phase Relative speedup per phase Distribution visualizations
APART, November 11, 2007 9Knowledge Support for Mining Parallel Performance Data
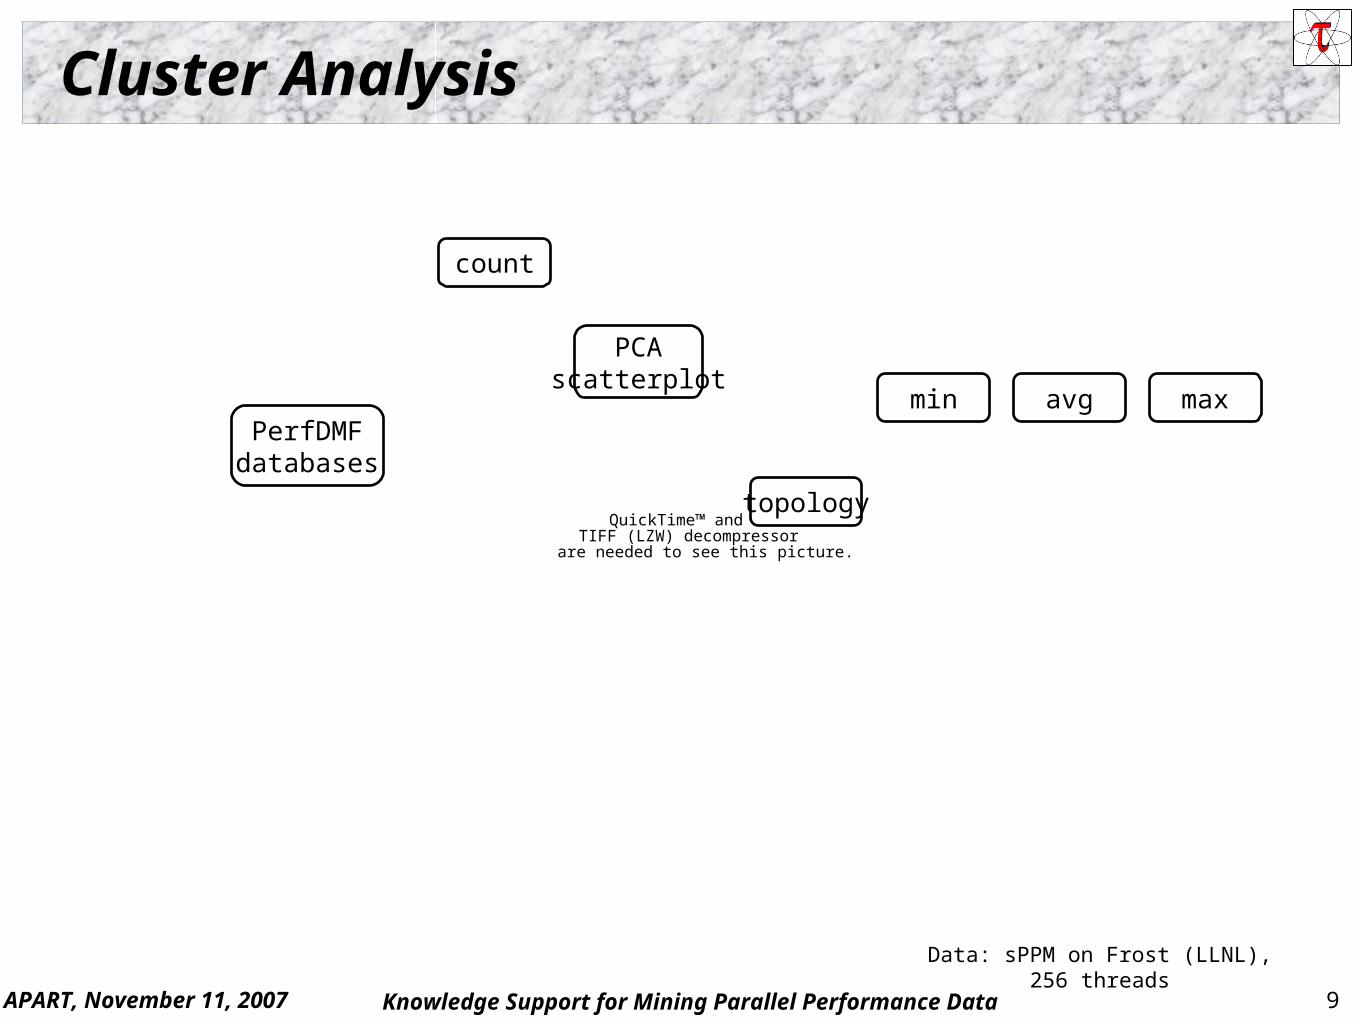
Cluster Analysis
Data: sPPM on Frost (LLNL), 256 threads
QuickTime™ and aTIFF (LZW) decompressor
are needed to see this picture.
count
PCAscatterplot
topology
min avg maxPerfDMF
databases
APART, November 11, 2007 10Knowledge Support for Mining Parallel Performance Data
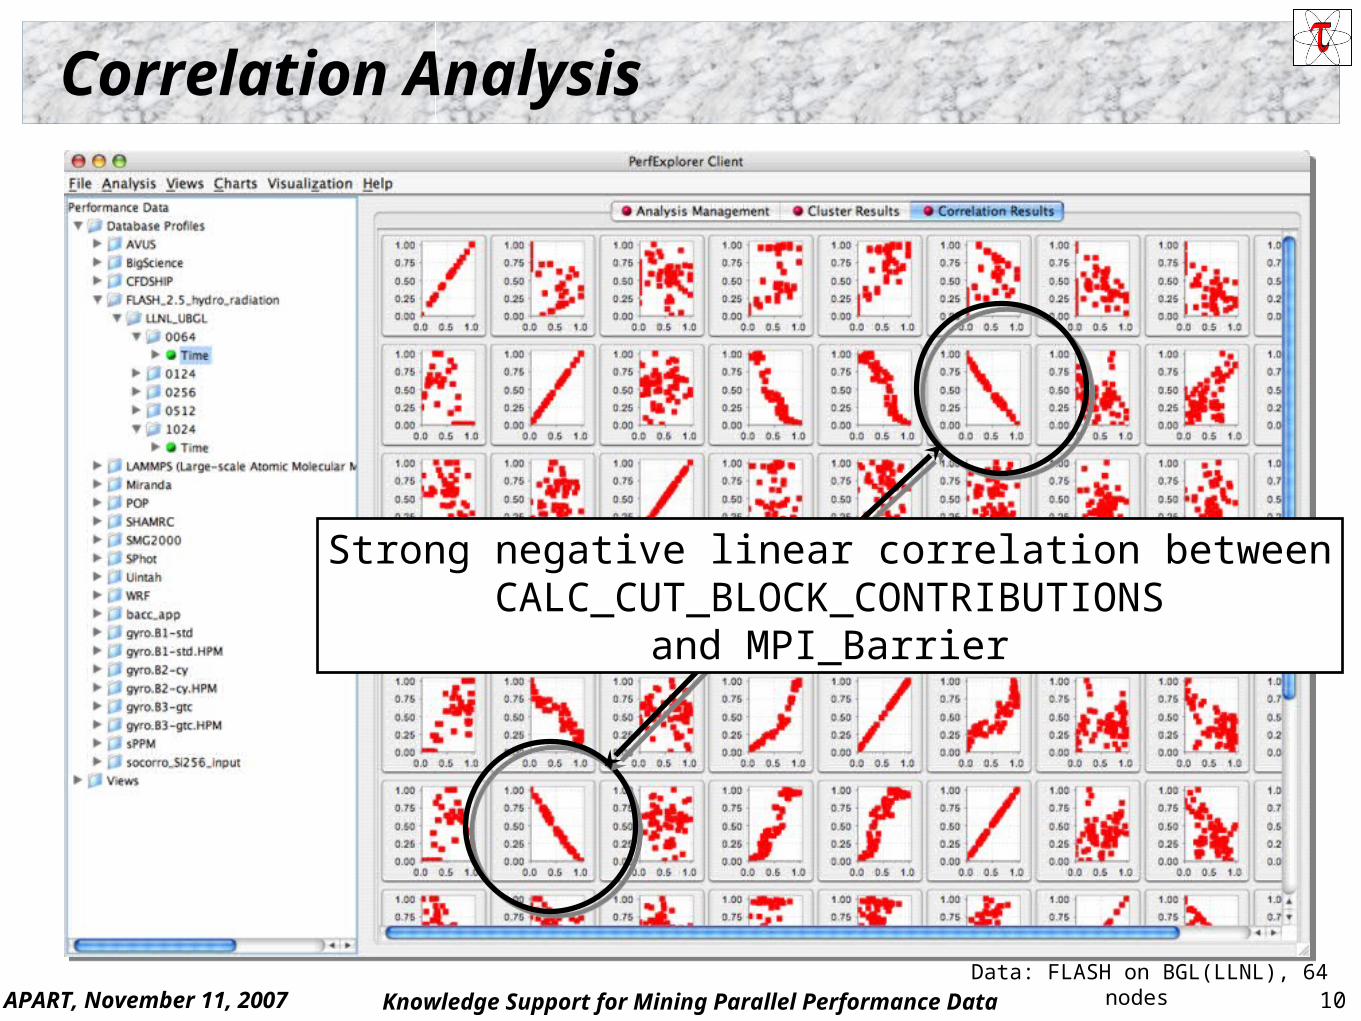
Correlation Analysis
Data: FLASH on BGL(LLNL), 64 nodes
Strong negative linear correlation betweenCALC_CUT_BLOCK_CONTRIBUTIONS
and MPI_Barrier
APART, November 11, 2007 11Knowledge Support for Mining Parallel Performance Data
QuickTime™ and aTIFF (LZW) decompressor
are needed to see this picture.
4-D Visualization
4 “significant” events areselected
clusters andcorrelations are
visible Data: FLASH on BG/L (LLNL), 1024 nodes
APART, November 11, 2007 12Knowledge Support for Mining Parallel Performance Data
PerfExplorer Critique (Describe vs. Explain)
Specific parametric study support (not general) No way to capture the analysis processes No analysis history - how were these results generated? PerfExplorer just redescribed the performance results PerfExplorer should explain performance phenomena
What are the causes for performance observed? What are the factors and how do they interrelate? Performance analytics, forensics, and decision support
Automated analysis needs good informed feedback Iterative tuning, performance regression testing
Performance model generation requires interpretation
APART, November 11, 2007 13Knowledge Support for Mining Parallel Performance Data
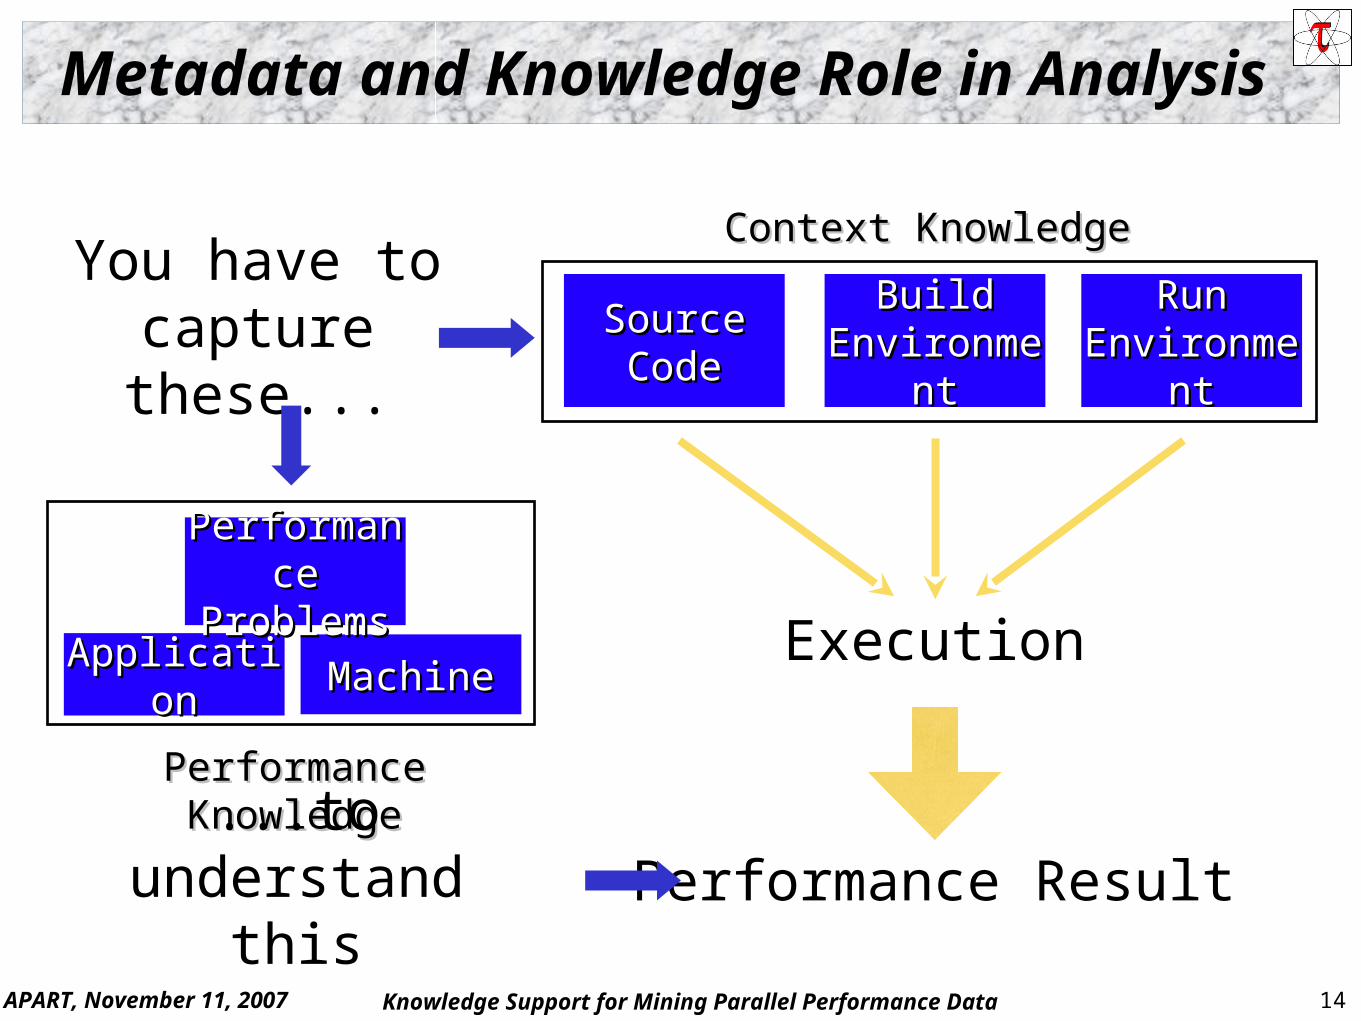
How to explain behavior? Add Knowledge!
Offline parallel performance tools should not have to treat the application and system as a “black box”
Need to add knowledge to do more intelligent things Where does it come from?
Experiment context Application-specific information System-specific performance General performance expertise
We need better methods and tools for Integrating meta-information Knowledge-based performance problem solving
APART, November 11, 2007 14Knowledge Support for Mining Parallel Performance Data
Performance KnowledgePerformance Knowledge
Metadata and Knowledge Role in Analysis
SourceSourceCodeCode
Build Build EnvironmeEnvironme
ntnt
Run Run EnvironmeEnvironme
ntnt
Performance Result
Execution
You have to capture these...
...to understand this
ApplicatioApplicationn
MachineMachine
PerformanPerformance ce
ProblemsProblems
Context KnowledgeContext Knowledge
APART, November 11, 2007 15Knowledge Support for Mining Parallel Performance Data
1212 1313 1414 1515
88 99 1010 1111
44 55 66 77
00 11 22 33
2 neighbors
3 neighbors
4 neighbors
4x4 example:
Center cells
Corner cellsData: Sweep3D on Linux Cluster, 16
processes
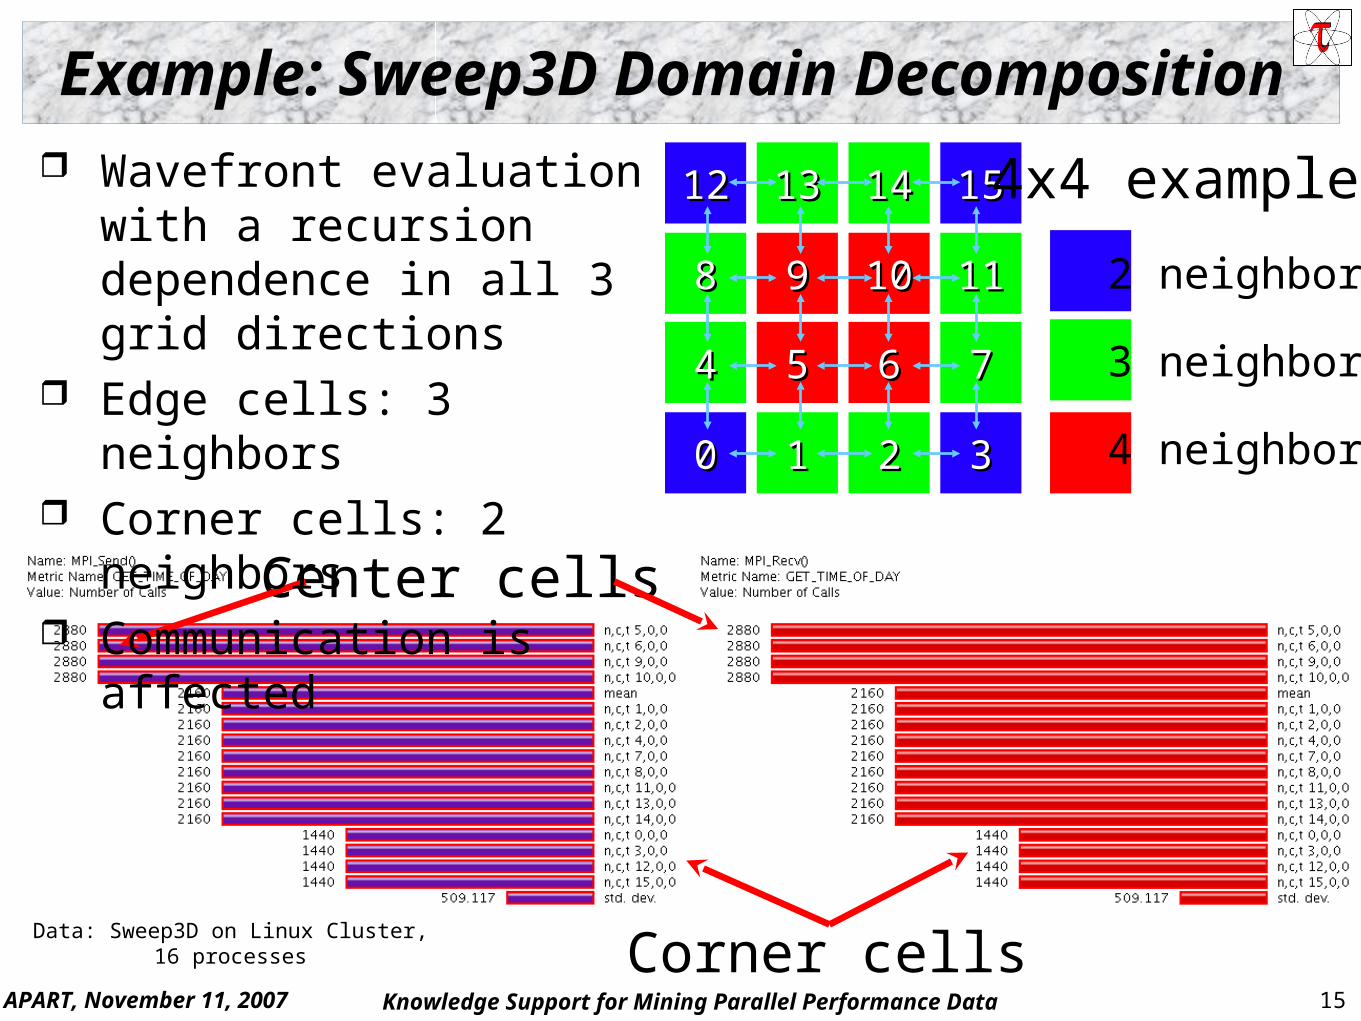
Example: Sweep3D Domain Decomposition Wavefront evaluation with a
recursion dependence in all 3 grid directions
Edge cells: 3 neighbors Corner cells: 2 neighbors Communication is affected
APART, November 11, 2007 16Knowledge Support for Mining Parallel Performance Data
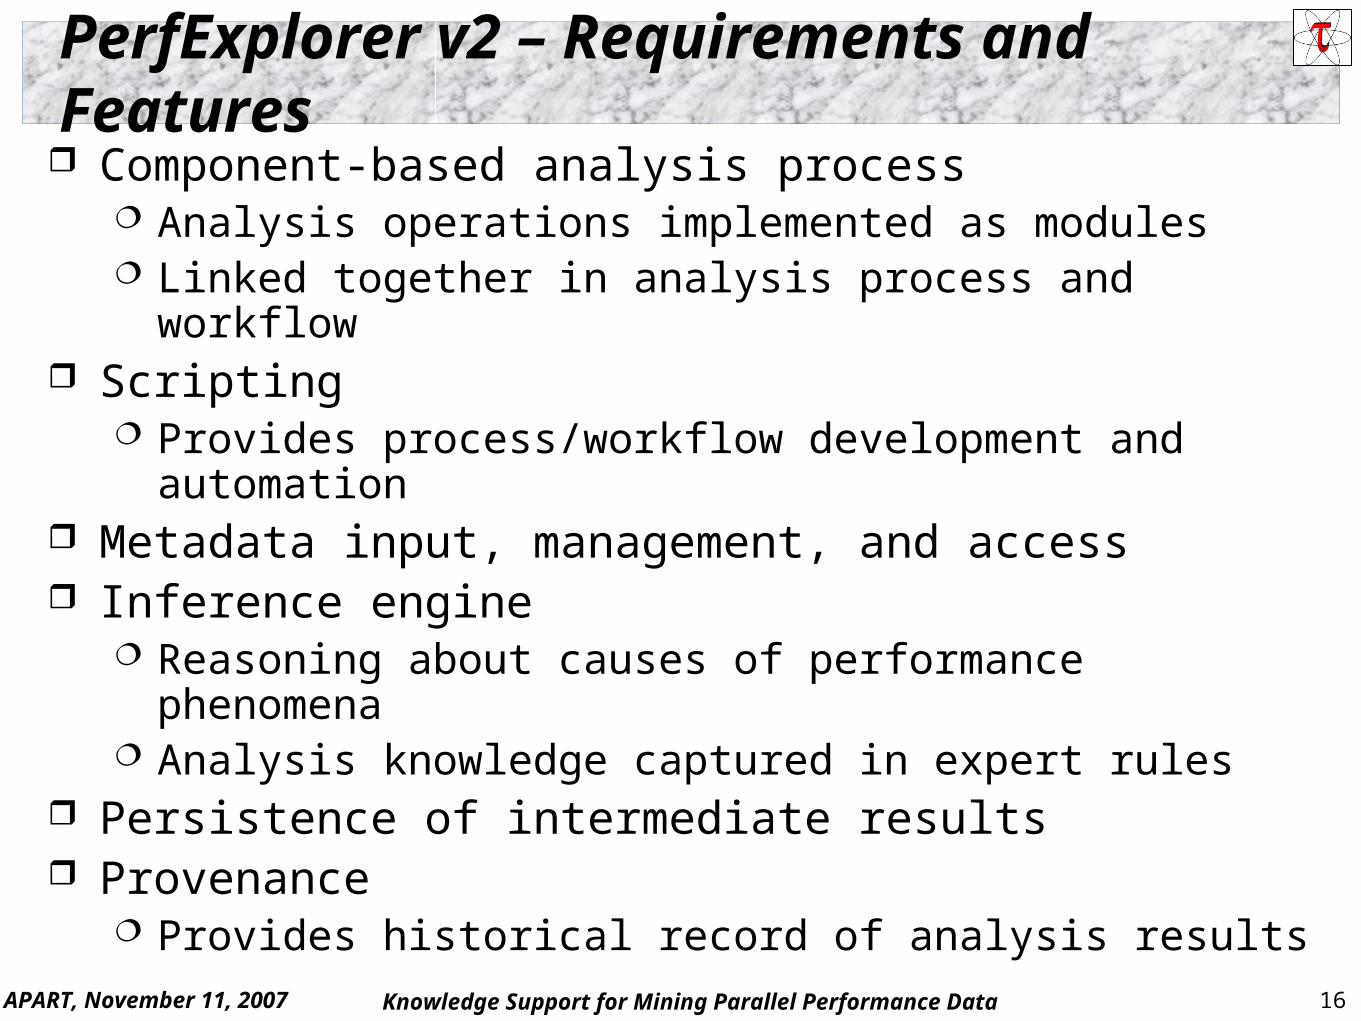
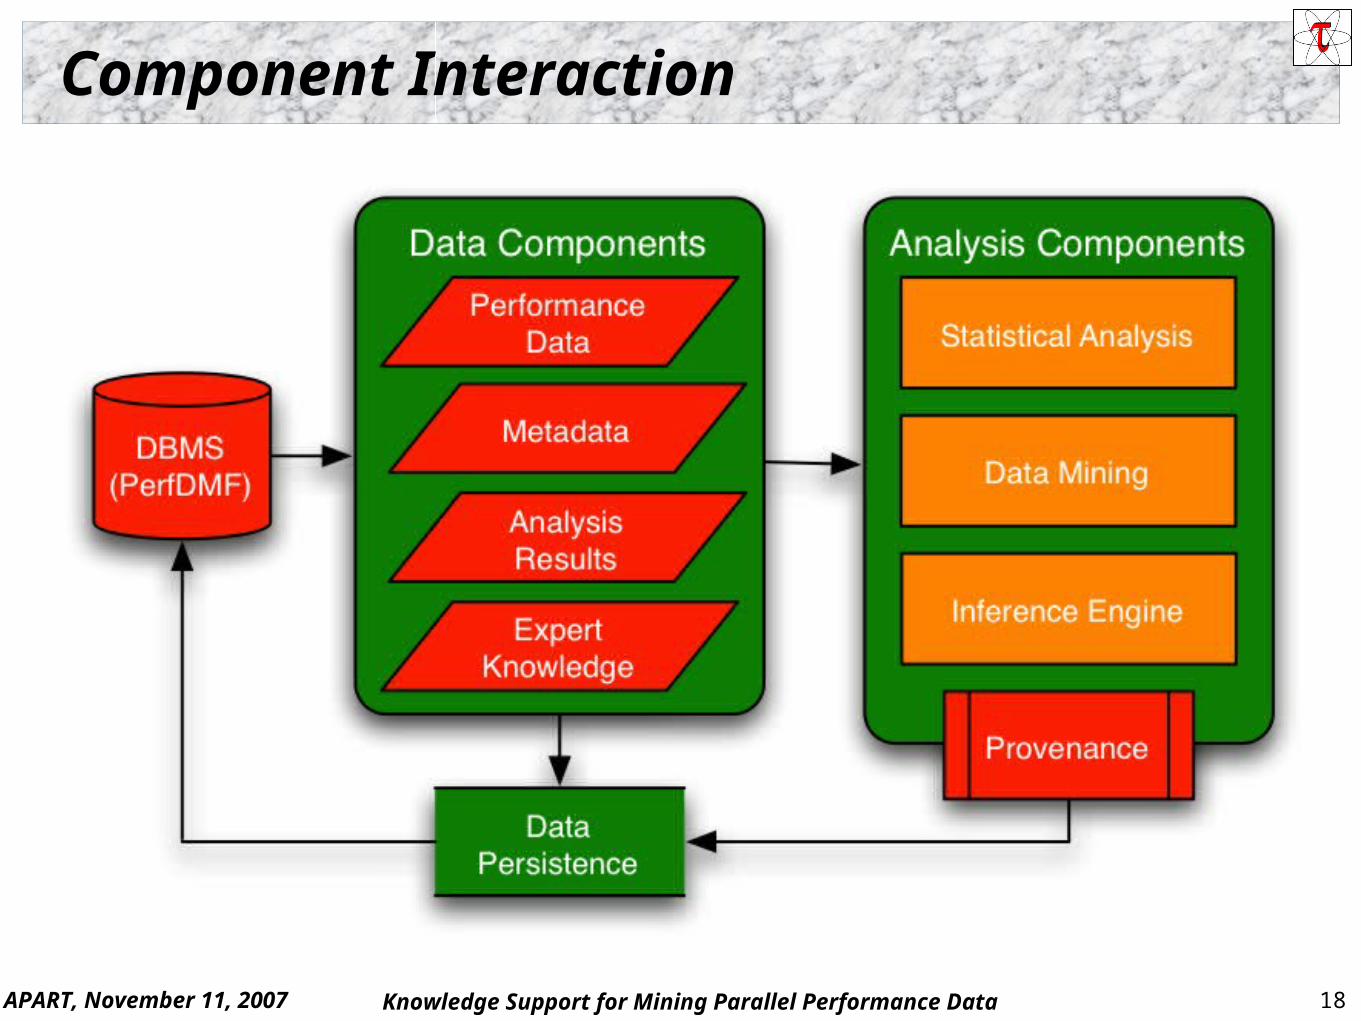
PerfExplorer v2 – Requirements and Features Component-based analysis process
Analysis operations implemented as modules Linked together in analysis process and workflow
Scripting Provides process/workflow development and automation
Metadata input, management, and access Inference engine
Reasoning about causes of performance phenomena Analysis knowledge captured in expert rules
Persistence of intermediate results Provenance
Provides historical record of analysis results
APART, November 11, 2007 17Knowledge Support for Mining Parallel Performance Data
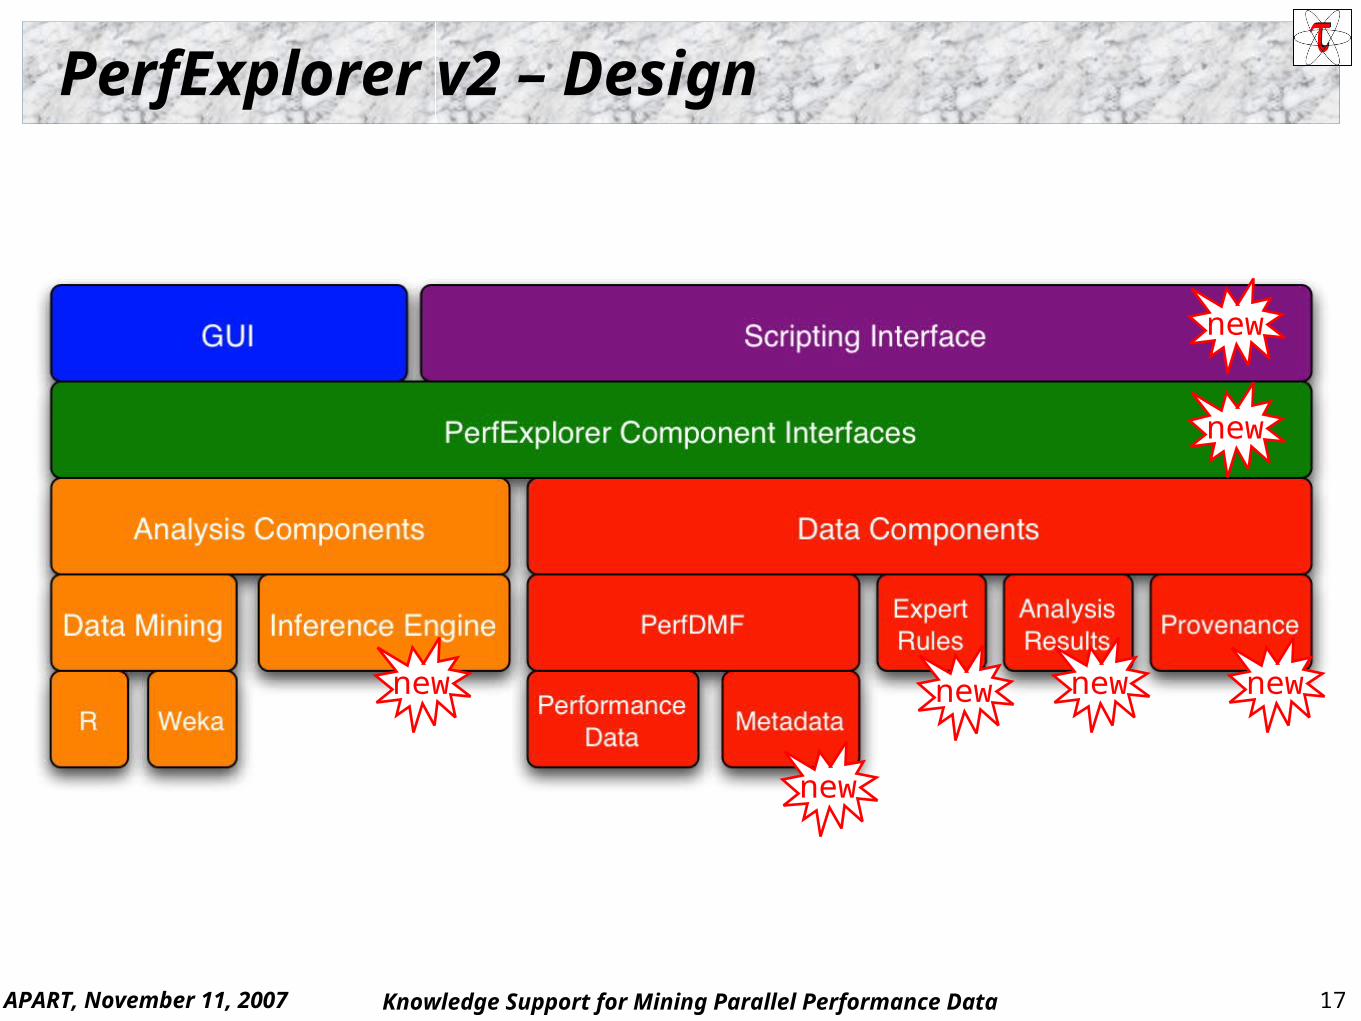
PerfExplorer v2 – Design
new
new
new
new new new
new
APART, November 11, 2007 18Knowledge Support for Mining Parallel Performance Data
Component Interaction
APART, November 11, 2007 19Knowledge Support for Mining Parallel Performance Data
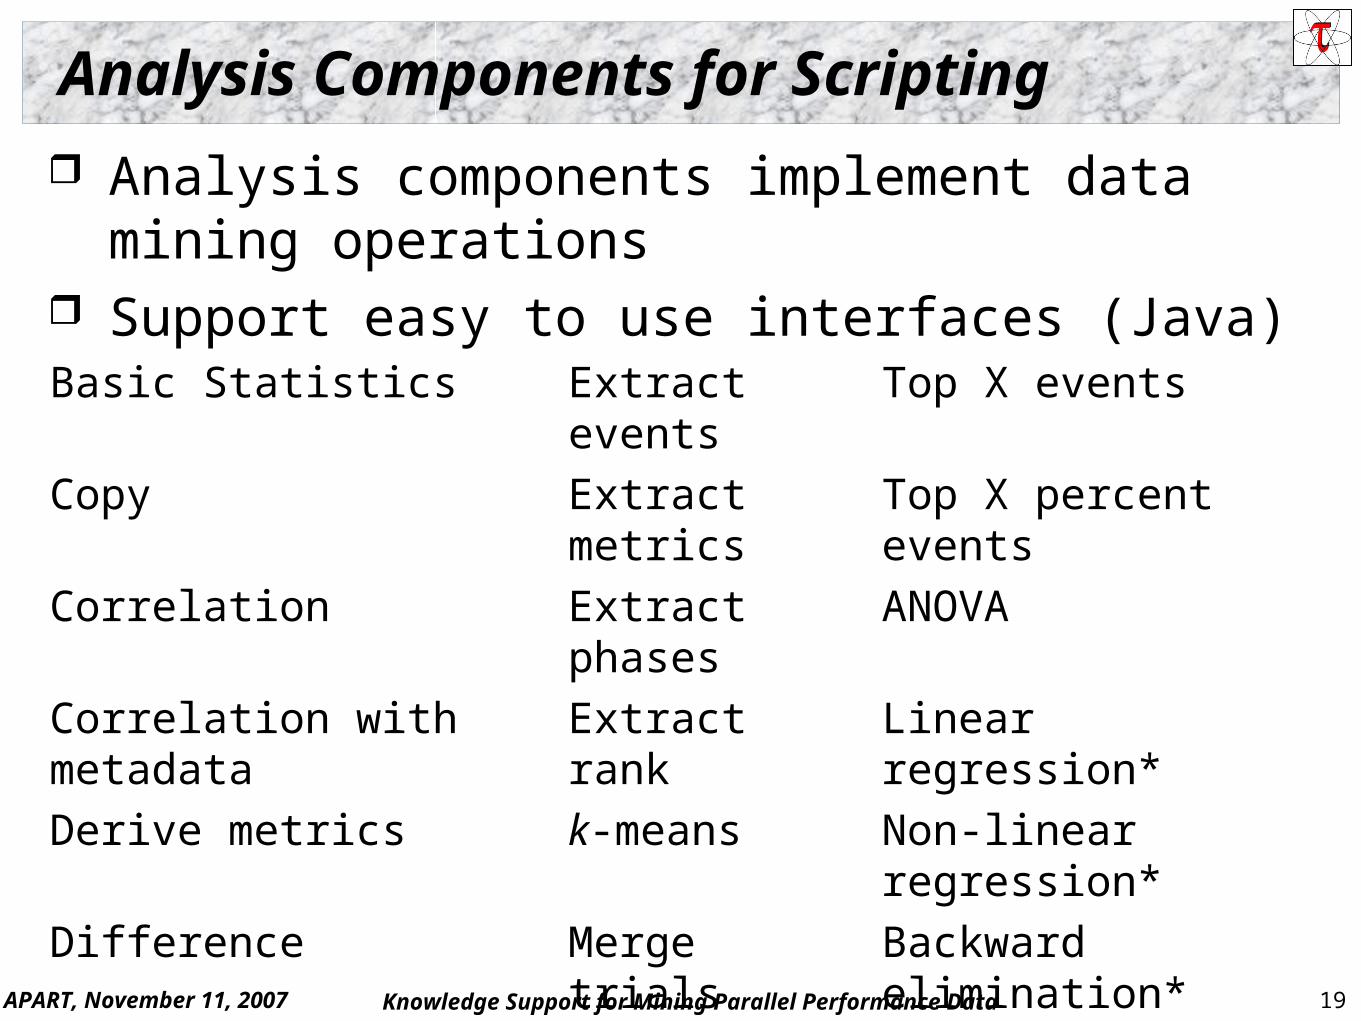
Analysis Components for Scripting
Analysis components implement data mining operations Support easy to use interfaces (Java)
Basic Statistics Extract events Top X events
Copy Extract metrics Top X percent events
Correlation Extract phases ANOVA
Correlation with metadata Extract rank Linear regression*
Derive metrics k-means Non-linear regression*
Difference Merge trials Backward elimination*
Extract callpath events PCA Correlation elimination*
Extract non-callpath events Scalability * future development
APART, November 11, 2007 20Knowledge Support for Mining Parallel Performance Data
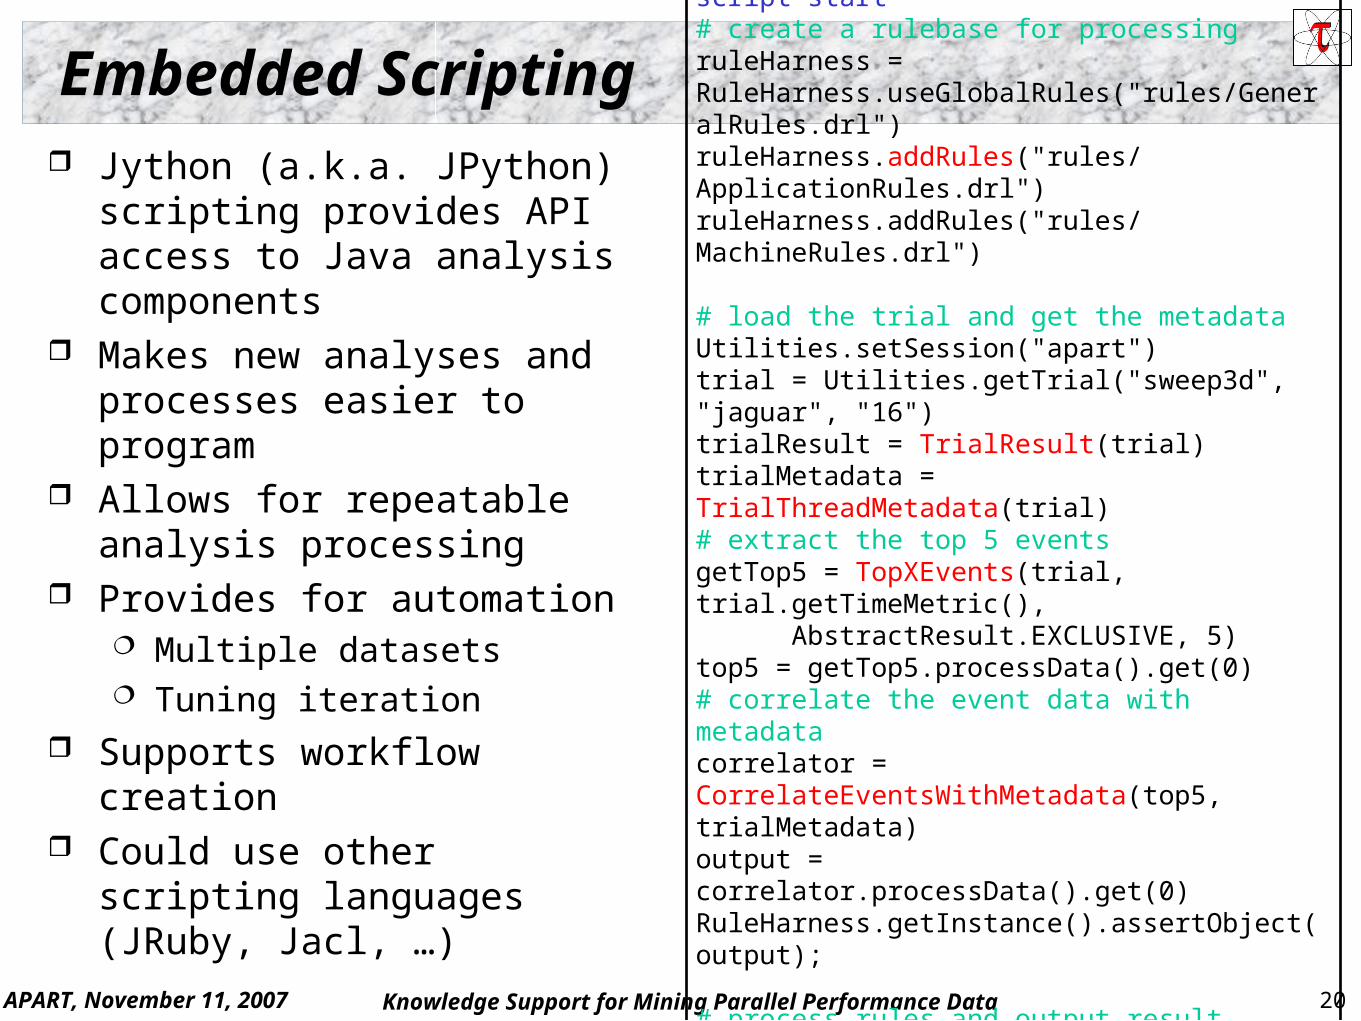
Embedded Scripting Jython (a.k.a. JPython)
scripting provides API access to Java analysis components
Makes new analyses and processes easier to program
Allows for repeatable analysis processing
Provides for automation Multiple datasets Tuning iteration
Supports workflow creation Could use other scripting
languages (JRuby, Jacl, …)
print "--------------- JPython test script start ------------"# create a rulebase for processingruleHarness = RuleHarness.useGlobalRules("rules/GeneralRules.drl")ruleHarness.addRules("rules/ApplicationRules.drl")ruleHarness.addRules("rules/MachineRules.drl")
# load the trial and get the metadataUtilities.setSession("apart")trial = Utilities.getTrial("sweep3d", "jaguar", "16")trialResult = TrialResult(trial)trialMetadata = TrialThreadMetadata(trial)# extract the top 5 eventsgetTop5 = TopXEvents(trial, trial.getTimeMetric(),
AbstractResult.EXCLUSIVE, 5)top5 = getTop5.processData().get(0)# correlate the event data with metadatacorrelator = CorrelateEventsWithMetadata(top5, trialMetadata)output = correlator.processData().get(0)RuleHarness.getInstance().assertObject(output);
# process rules and output resultRuleHarness.getInstance().processRules()print "---------------- JPython test script end -------------"
APART, November 11, 2007 21Knowledge Support for Mining Parallel Performance Data
Loading Metadata into PerfDMF
Three ways to incorporate metadata Measured hardware/system information (TAU, PERI-DB)
CPU speed, memory in GB, MPI node IDs, … Application instrumentation (application-specific)
TAU_METADATA() used to insert any name/value pair Application parameters, input data, domain decomposition
PerfDMF data management tools can incorporate an XML file of additional metadata Compiler flags, submission scripts, input files, …
Metadata can be imported from / exported to PERI-DB PERI SciDAC project (UTK, NERSC, UO, PSU, TAMU) Performance data and metadata integration
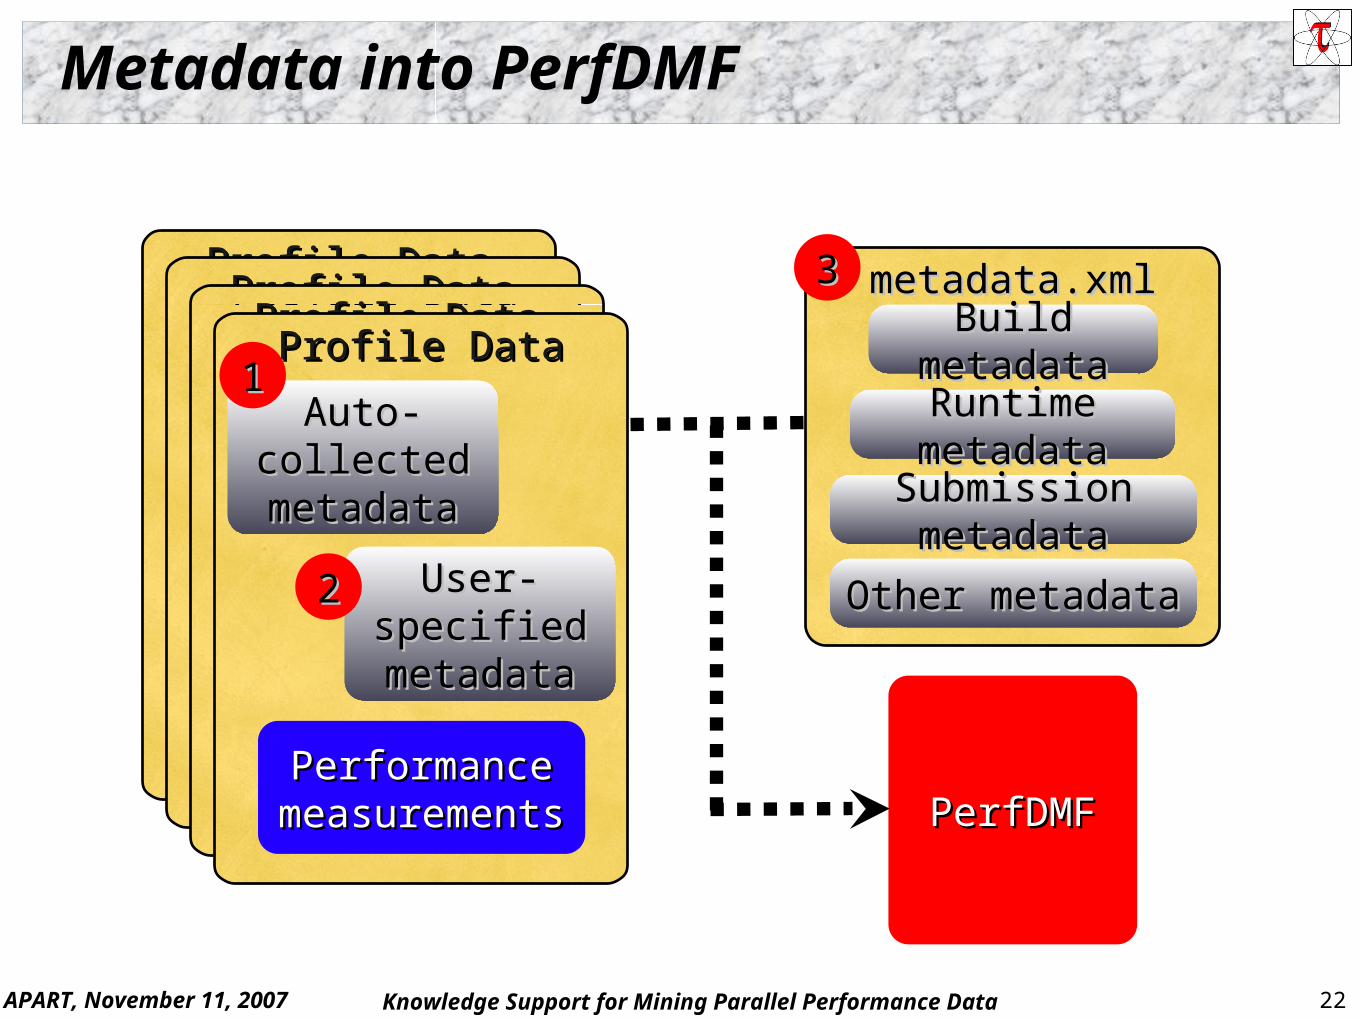
APART, November 11, 2007 22Knowledge Support for Mining Parallel Performance Data
Profile DataProfile DataProfile DataProfile DataProfile DataProfile Data
Metadata into PerfDMF
Profile DataProfile Data
Auto-Auto-collected collected metadatametadata
User-User-specified specified metadatametadata
metadata.xmlmetadata.xmlBuild Build
metadatametadataRuntime Runtime metadatametadata
Submission Submission metadatametadata
PerfDMFPerfDMF
Other metadataOther metadata
11
22
33
Performance Performance measurementsmeasurements
APART, November 11, 2007 23Knowledge Support for Mining Parallel Performance Data
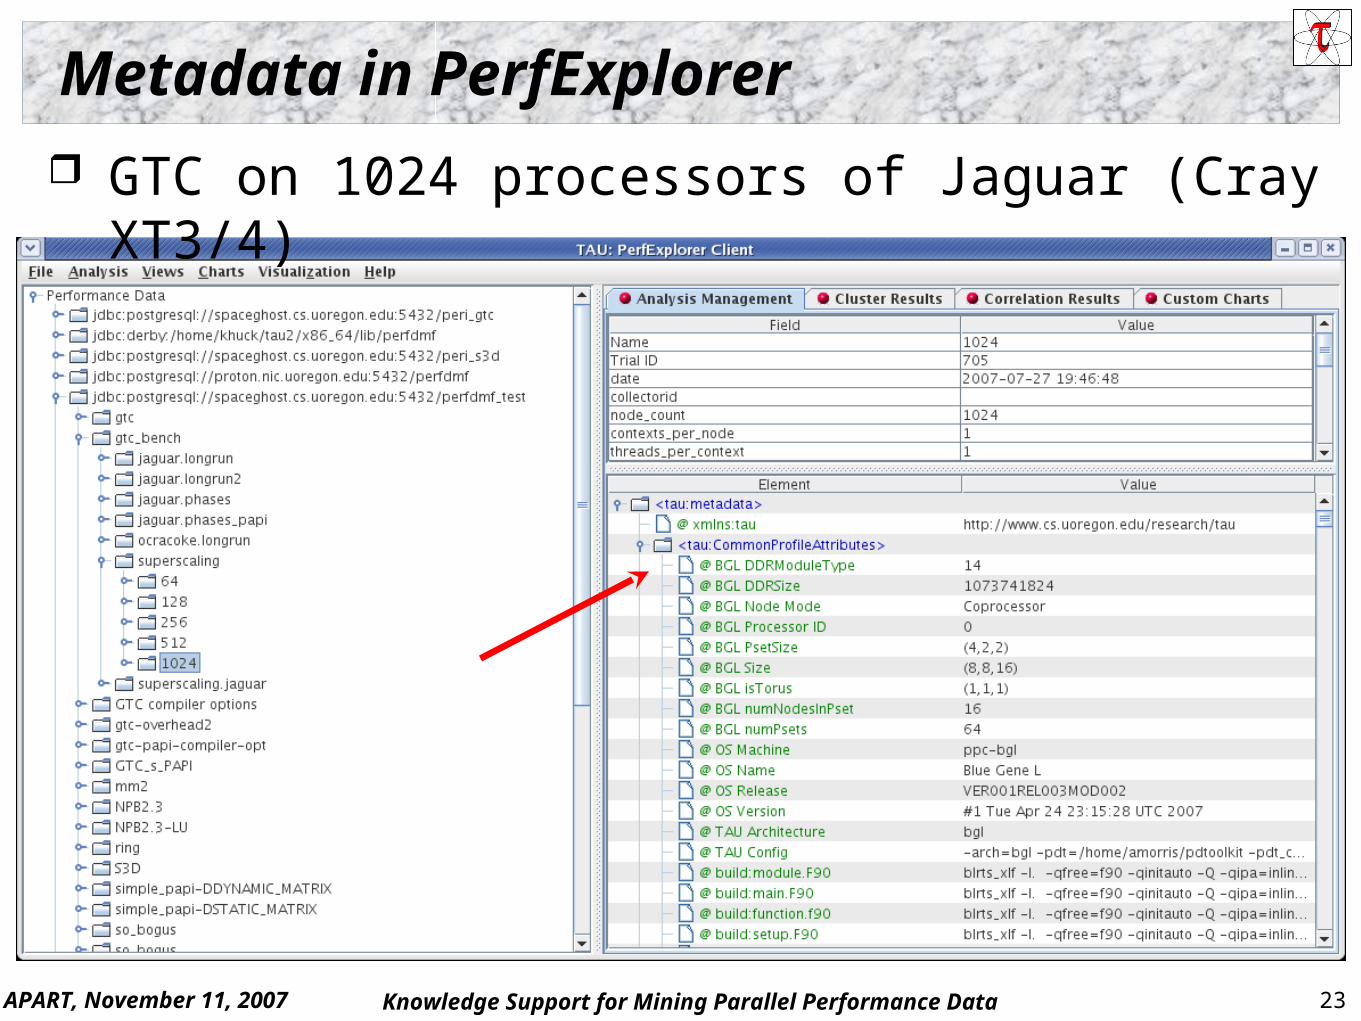
Metadata in PerfExplorer
GTC on 1024 processors of Jaguar (Cray XT3/4)
APART, November 11, 2007 24Knowledge Support for Mining Parallel Performance Data
Inference Engine Metadata and analysis results are asserted as facts
Examples: number of processors, an input parameter, a derived metric, a speedup measurement
Analysis rules with encoded “expert knowledge” of performance process the assertions Example: “When processor count increases by a factor of
X, runtime should reduce by a factor of Y” (expectation) Example: “When an event’s cache hit ratio is less than the
overall ratio, alert the user to the event” (criticality) Processed rules can assert new facts, which can fire new
rules - provides a declarative programming environment JBoss Rules rules engine for Java
Implements efficient Rete algorithm
APART, November 11, 2007 25Knowledge Support for Mining Parallel Performance Data
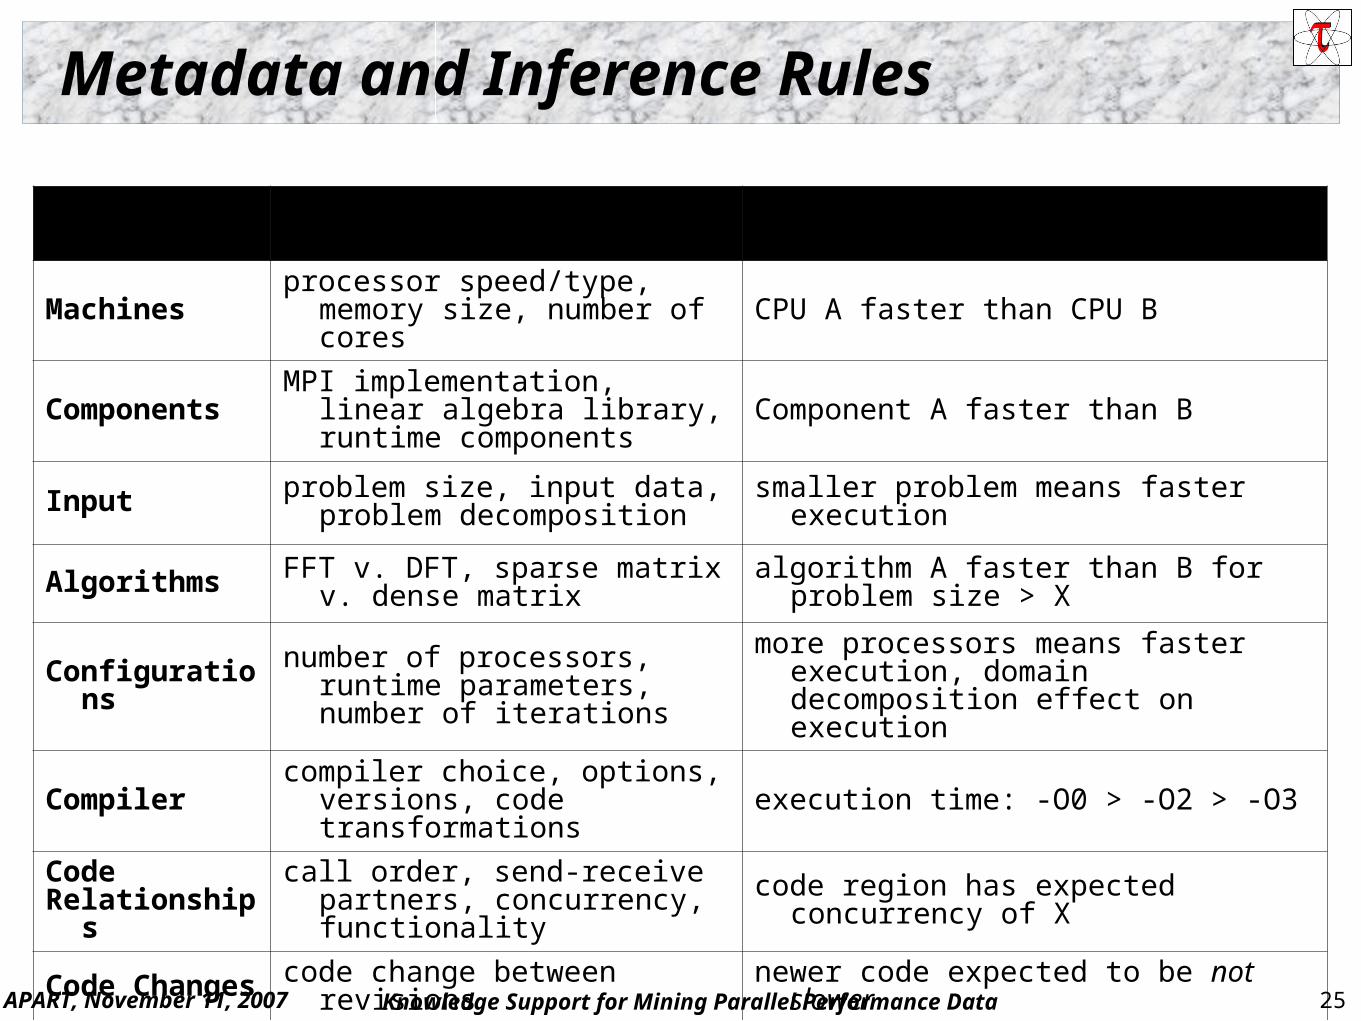
Metadata and Inference Rules
Category Metadata Examples Possible Rules
Machines processor speed/type, memory size, number of cores CPU A faster than CPU B
Components MPI implementation, linear algebra library, runtime components Component A faster than B
Input problem size, input data, problem decomposition smaller problem means faster execution
Algorithms FFT v. DFT, sparse matrix v. dense matrix algorithm A faster than B for problem size > X
Configurations number of processors, runtime parameters, number of iterations
more processors means faster execution, domain decomposition effect on execution
Compiler compiler choice, options, versions, code transformations execution time: -O0 > -O2 > -O3
CodeRelationships
call order, send-receive partners, concurrency, functionality code region has expected concurrency of X
Code Changes code change between revisions newer code expected to be not slower
APART, November 11, 2007 26Knowledge Support for Mining Parallel Performance Data
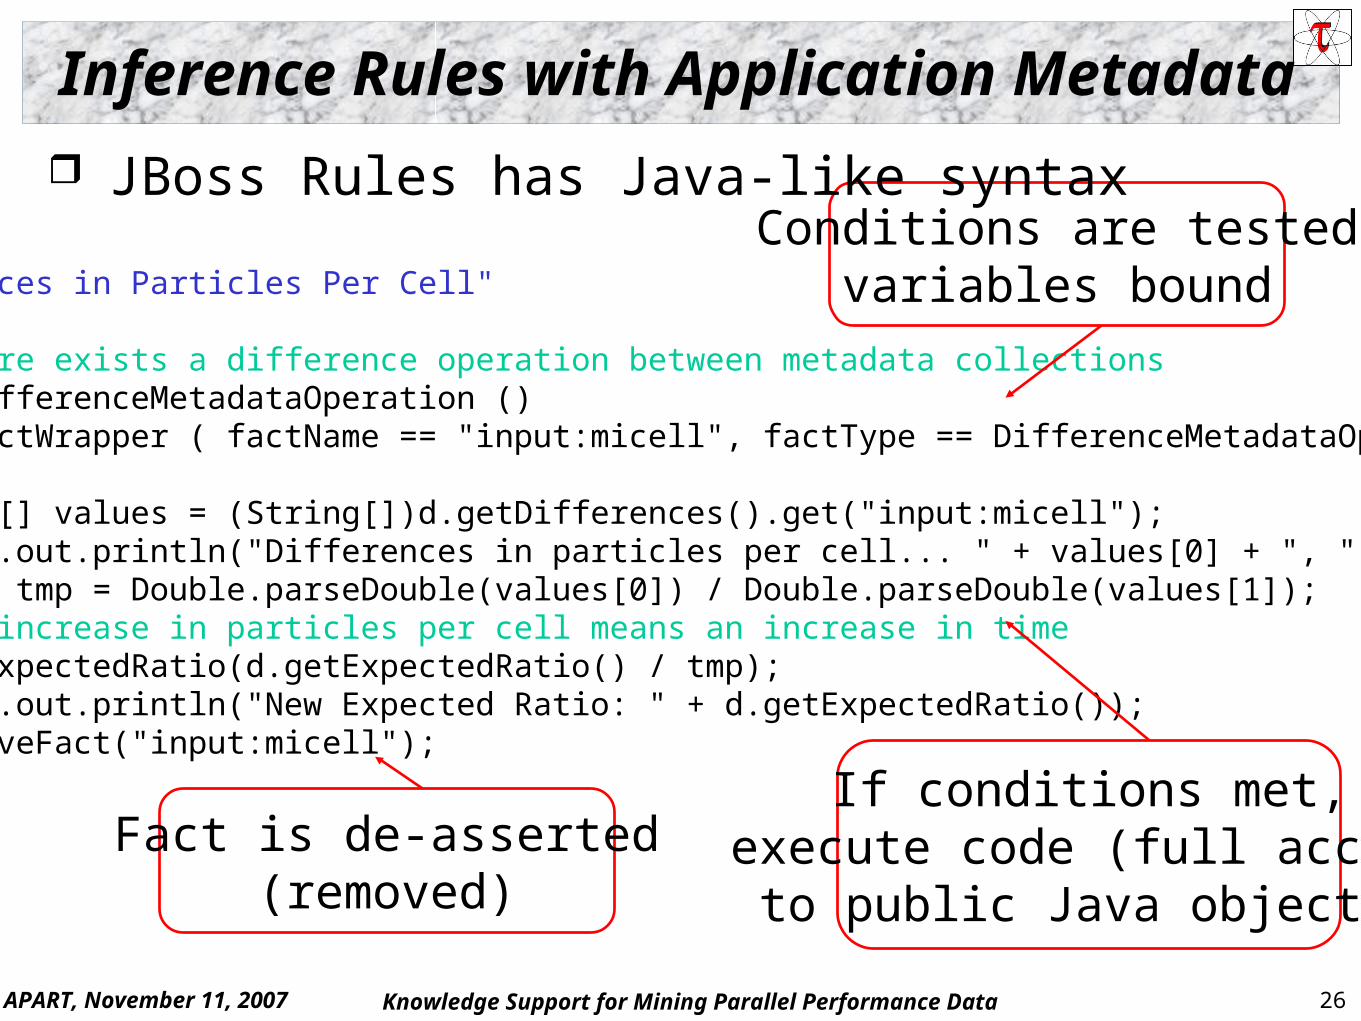
Inference Rules with Application Metadata
rule "Differences in Particles Per Cell" when // there exists a difference operation between metadata collections d : DifferenceMetadataOperation () f : FactWrapper ( factName == "input:micell", factType == DifferenceMetadataOperation.NAME ) then String[] values = (String[])d.getDifferences().get("input:micell"); System.out.println("Differences in particles per cell... " + values[0] + ", " + values[1]); double tmp = Double.parseDouble(values[0]) / Double.parseDouble(values[1]); // an increase in particles per cell means an increase in time d.setExpectedRatio(d.getExpectedRatio() / tmp); System.out.println("New Expected Ratio: " + d.getExpectedRatio()); d.removeFact("input:micell");end
Conditions are testedvariables bound
If conditions met,execute code (full access
to public Java objects)
Fact is de-asserted(removed)
JBoss Rules has Java-like syntax
APART, November 11, 2007 27Knowledge Support for Mining Parallel Performance Data
Data Persistence and Provenance
Analysis results should include where they came from Data persistence captures intermediate analysis results
and final results and saves for later access Persistence allows analysis results to be reused
Some analysis operations can take a long time Breadth-wise inference analysis and cross-workflow
Storing all operations in the analysis workflow generates full provenance of the intermediate and final results Supports confirmation and validation of analysis results
Inference engine may need as well Persistence/Provence used to create “chain of evidence”
APART, November 11, 2007 28Knowledge Support for Mining Parallel Performance Data
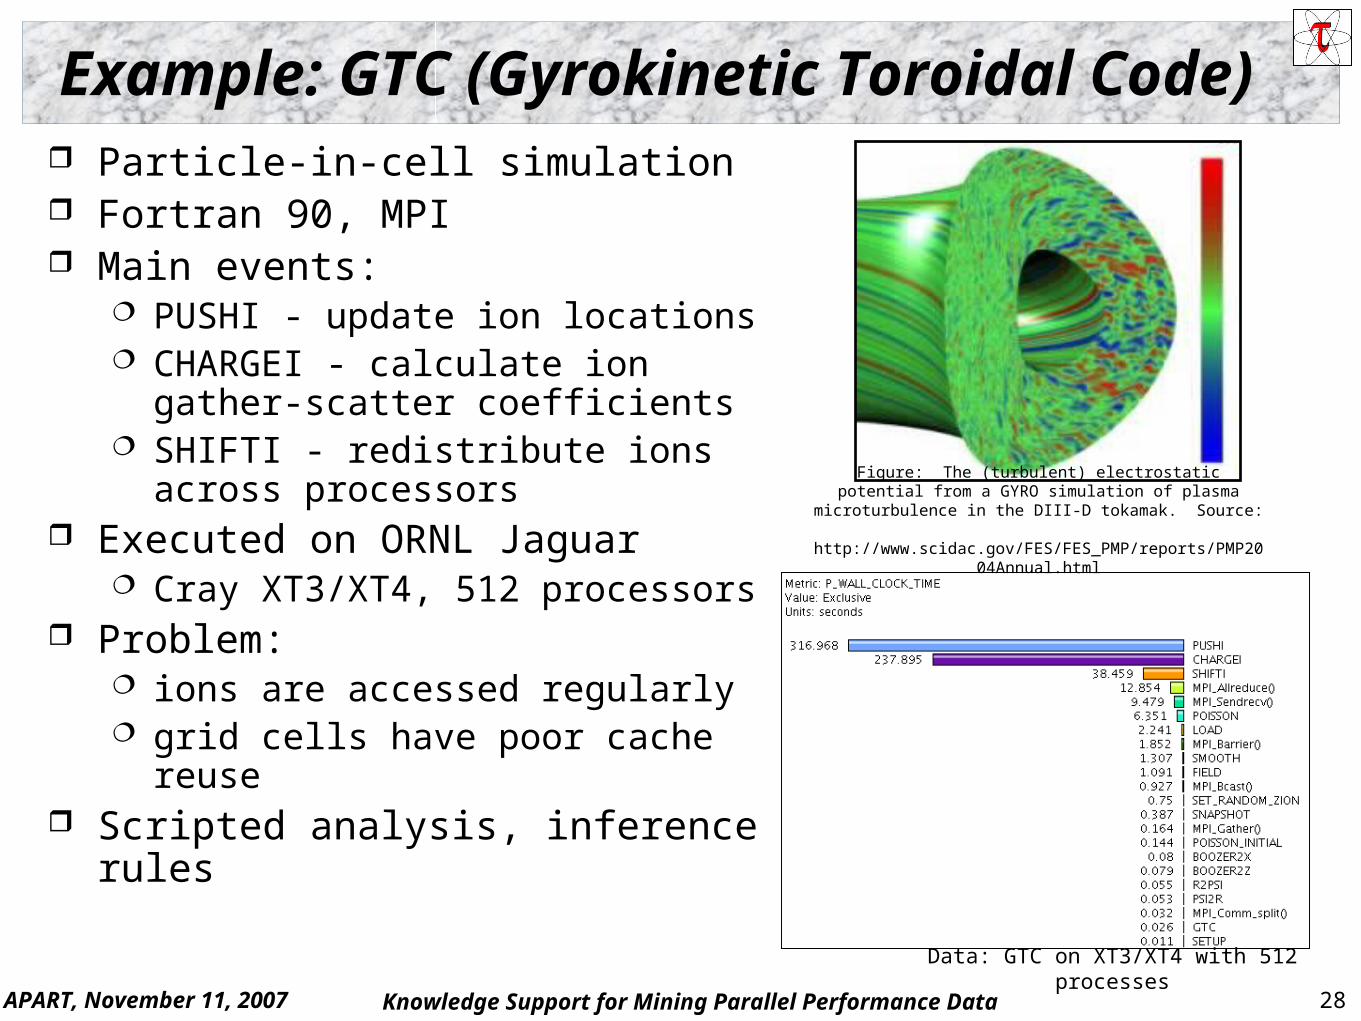
Figure: The (turbulent) electrostatic potential from a GYRO simulation of plasma microturbulence in the DIII-D
tokamak. Source: http://www.scidac.gov/FES/FES_PMP/reports/PMP2004An
nual.html
Data: GTC on XT3/XT4 with 512 processes
Example: GTC (Gyrokinetic Toroidal Code) Particle-in-cell simulation Fortran 90, MPI Main events:
PUSHI - update ion locations CHARGEI - calculate ion
gather-scatter coefficients SHIFTI - redistribute ions across
processors Executed on ORNL Jaguar
Cray XT3/XT4, 512 processors Problem:
ions are accessed regularly grid cells have poor cache reuse
Scripted analysis, inference rules
APART, November 11, 2007 29Knowledge Support for Mining Parallel Performance Data
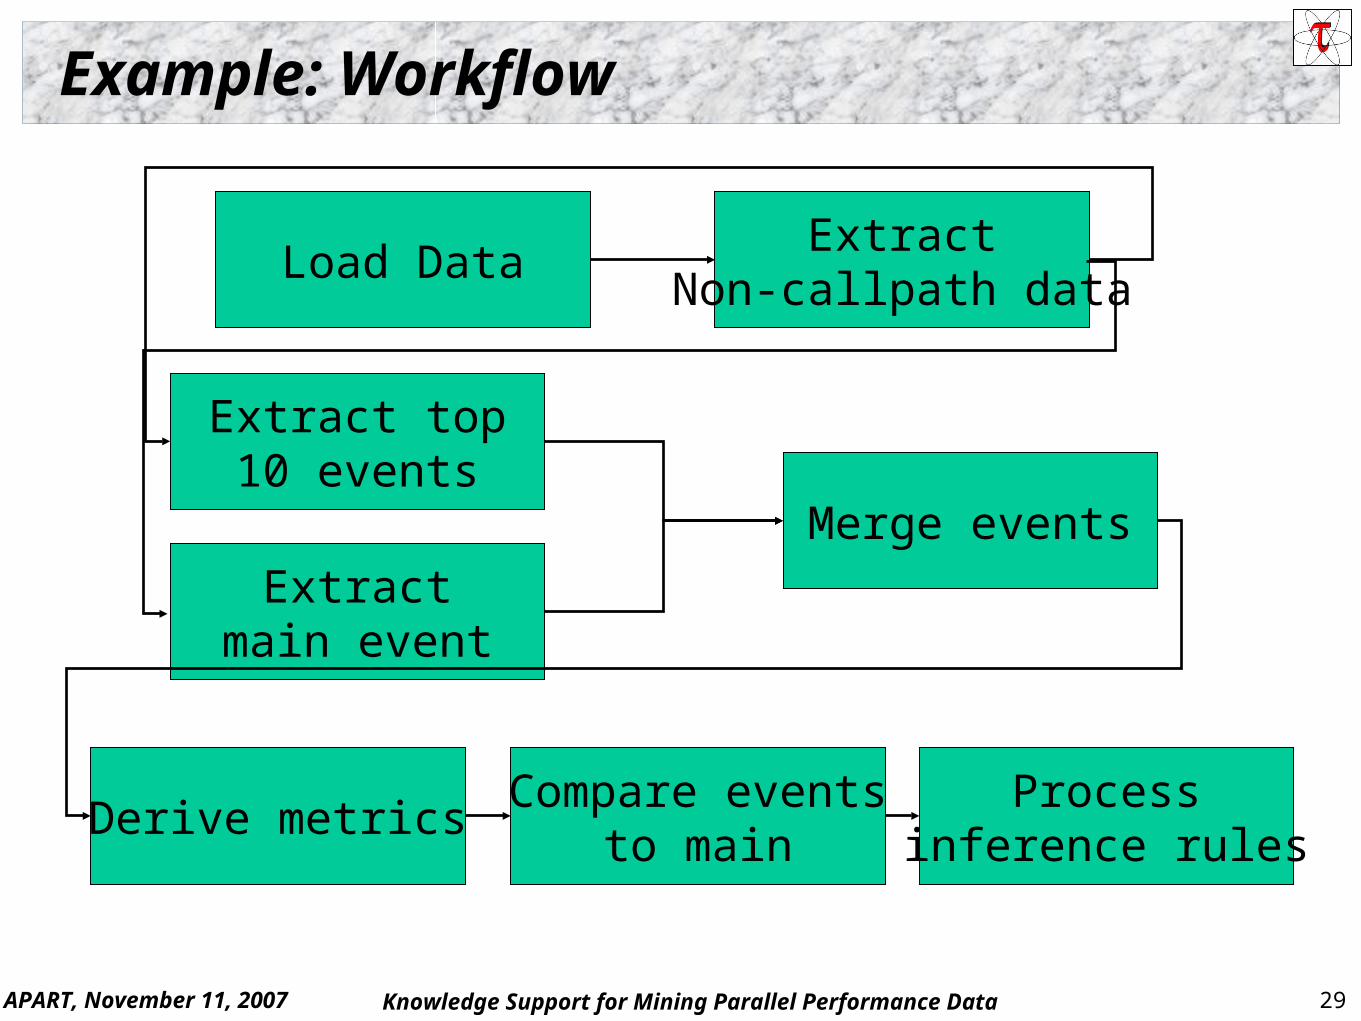
Example: Workflow
Load DataExtract
Non-callpath data
Extract top10 events
Extractmain event
Merge events
Derive metricsCompare events
to mainProcess
inference rules
APART, November 11, 2007 30Knowledge Support for Mining Parallel Performance Data
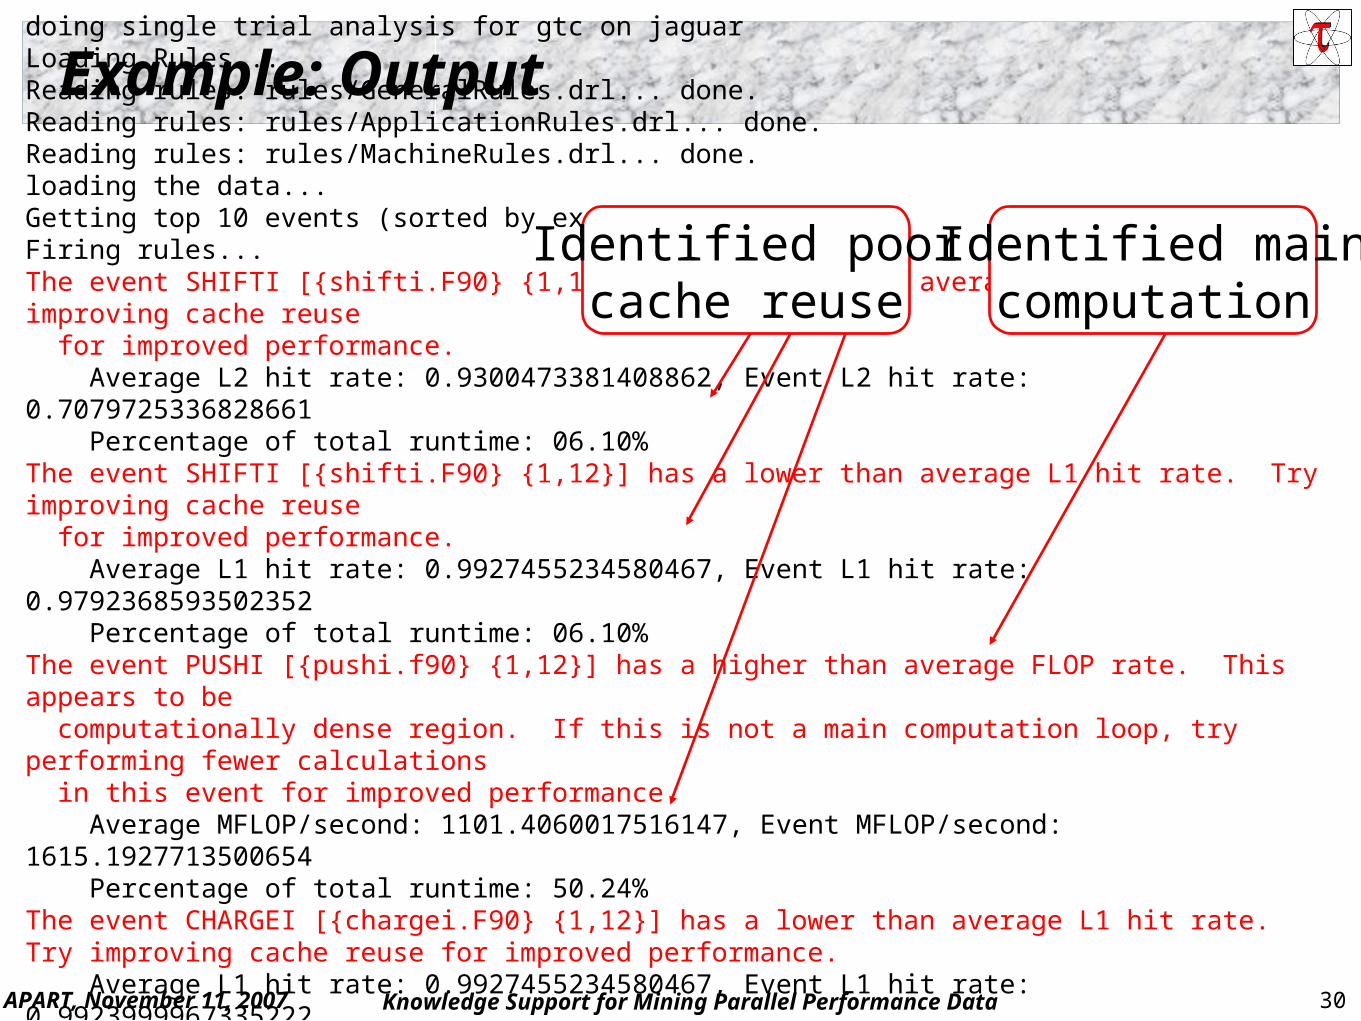
Example: Outputdoing single trial analysis for gtc on jaguarLoading Rules...Reading rules: rules/GeneralRules.drl... done.Reading rules: rules/ApplicationRules.drl... done.Reading rules: rules/MachineRules.drl... done.loading the data...Getting top 10 events (sorted by exclusive time)...Firing rules...The event SHIFTI [{shifti.F90} {1,12}] has a lower than average L2 hit rate. Try improving cache reuse for improved performance. Average L2 hit rate: 0.9300473381408862, Event L2 hit rate: 0.7079725336828661 Percentage of total runtime: 06.10%The event SHIFTI [{shifti.F90} {1,12}] has a lower than average L1 hit rate. Try improving cache reuse for improved performance. Average L1 hit rate: 0.9927455234580467, Event L1 hit rate: 0.9792368593502352 Percentage of total runtime: 06.10%The event PUSHI [{pushi.f90} {1,12}] has a higher than average FLOP rate. This appears to be computationally dense region. If this is not a main computation loop, try performing fewer calculations in this event for improved performance. Average MFLOP/second: 1101.4060017516147, Event MFLOP/second: 1615.1927713500654 Percentage of total runtime: 50.24%The event CHARGEI [{chargei.F90} {1,12}] has a lower than average L1 hit rate. Try improving cache reuse for improved performance. Average L1 hit rate: 0.9927455234580467, Event L1 hit rate: 0.9923999967335222 Percentage of total runtime: 37.70%...done with rules.
Identified poorcache reuse
Identified maincomputation
APART, November 11, 2007 31Knowledge Support for Mining Parallel Performance Data
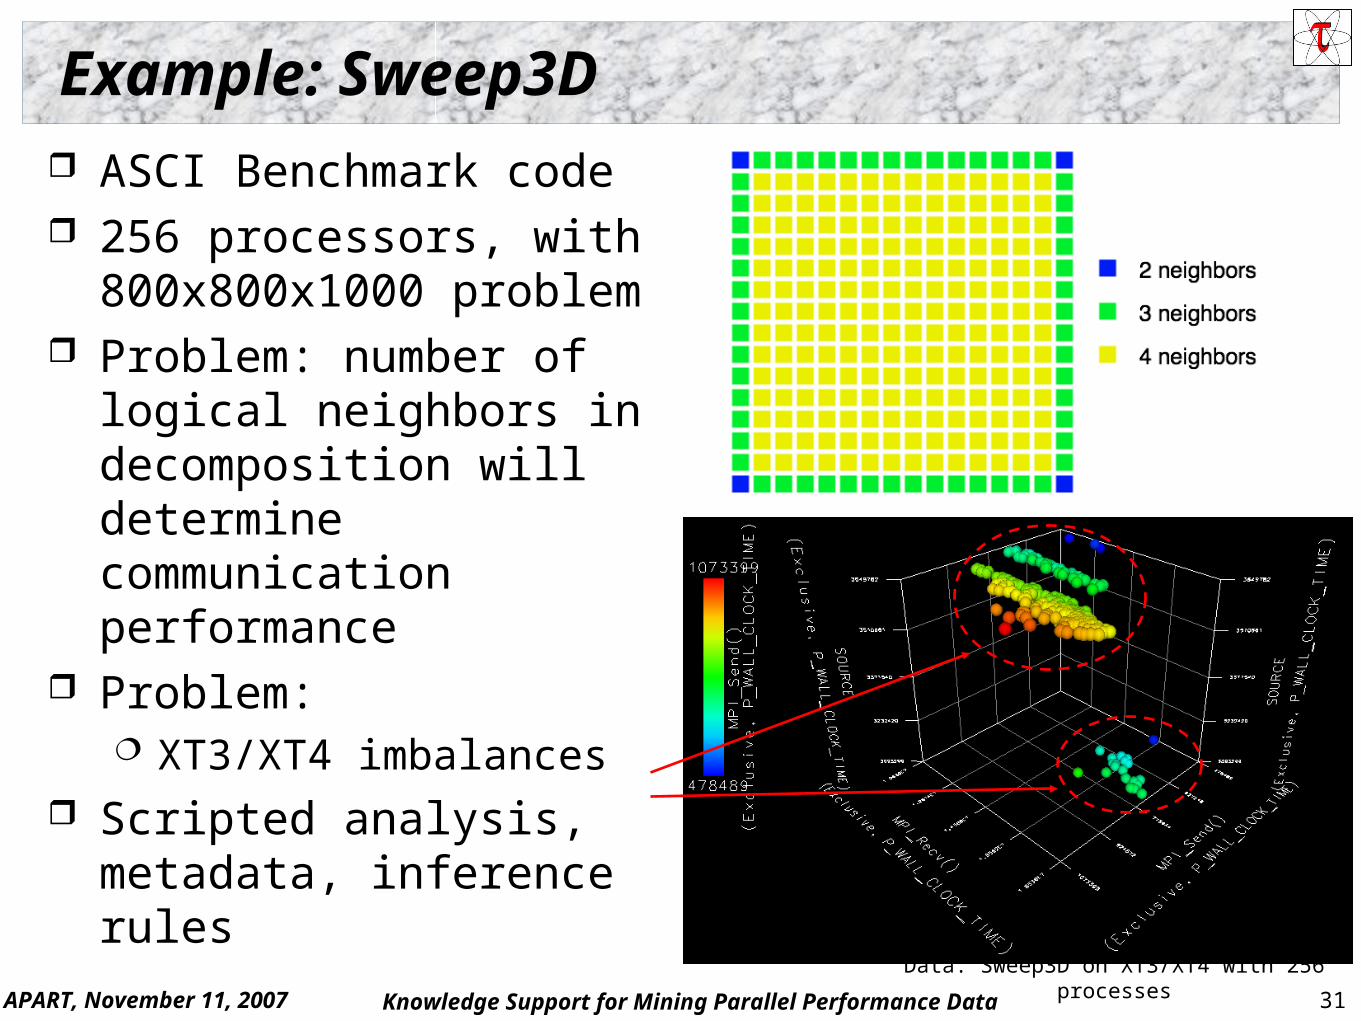
Data: Sweep3D on XT3/XT4 with 256 processes
Example: Sweep3D
ASCI Benchmark code 256 processors, with
800x800x1000 problem Problem: number of
logical neighbors in decomposition will determine communication performance
Problem: XT3/XT4 imbalances
Scripted analysis, metadata, inference rules
APART, November 11, 2007 32Knowledge Support for Mining Parallel Performance Data
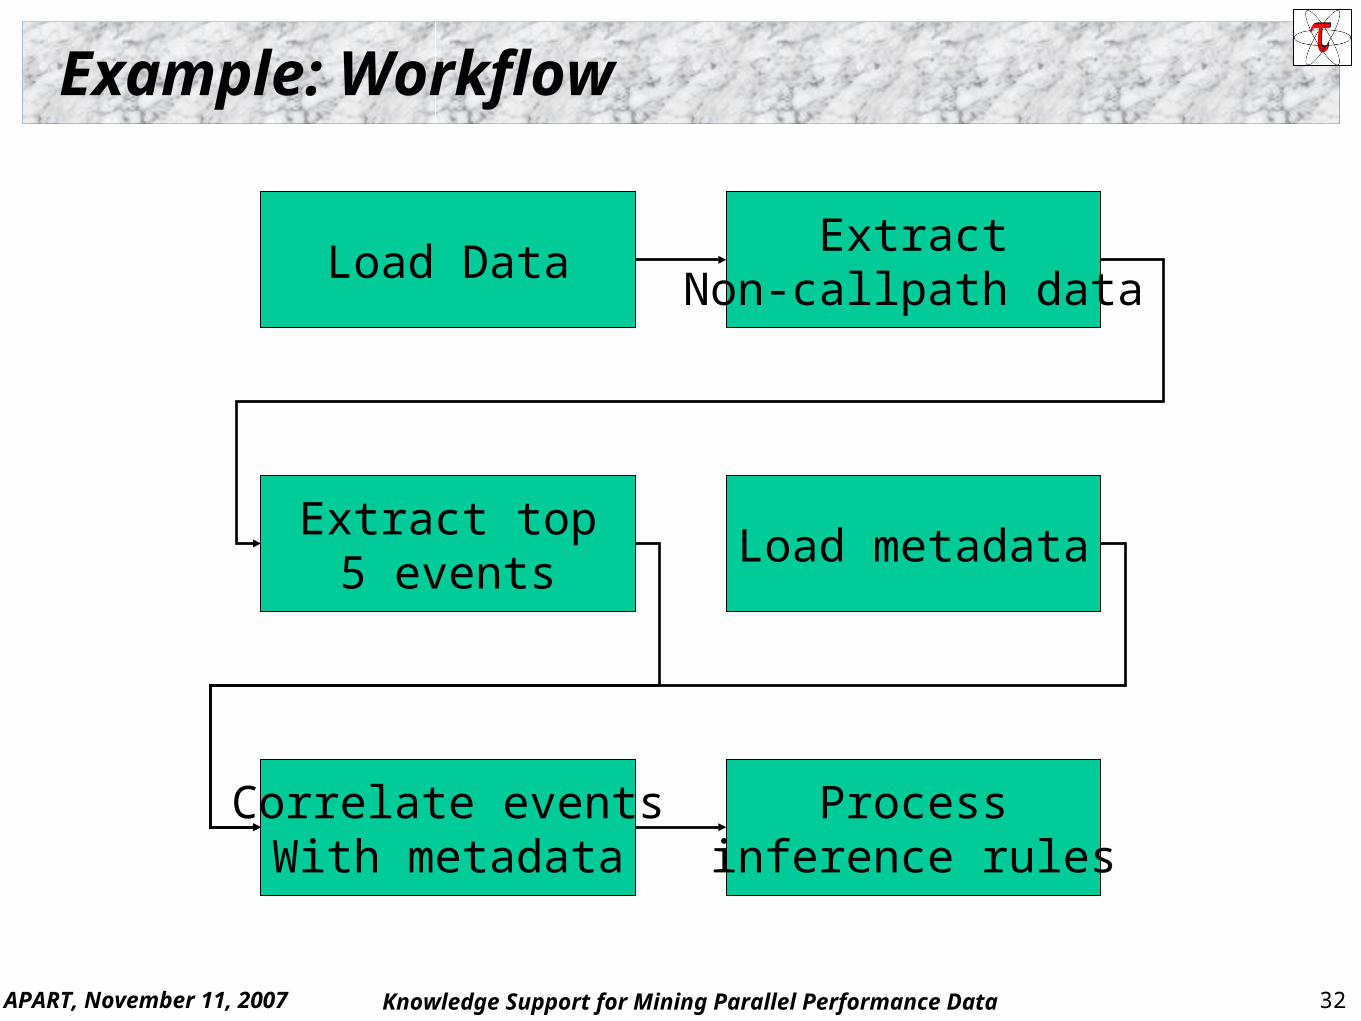
Example: Workflow
Load DataExtract
Non-callpath data
Extract top5 events
Load metadata
Correlate eventsWith metadata
Processinference rules
APART, November 11, 2007 33Knowledge Support for Mining Parallel Performance Data
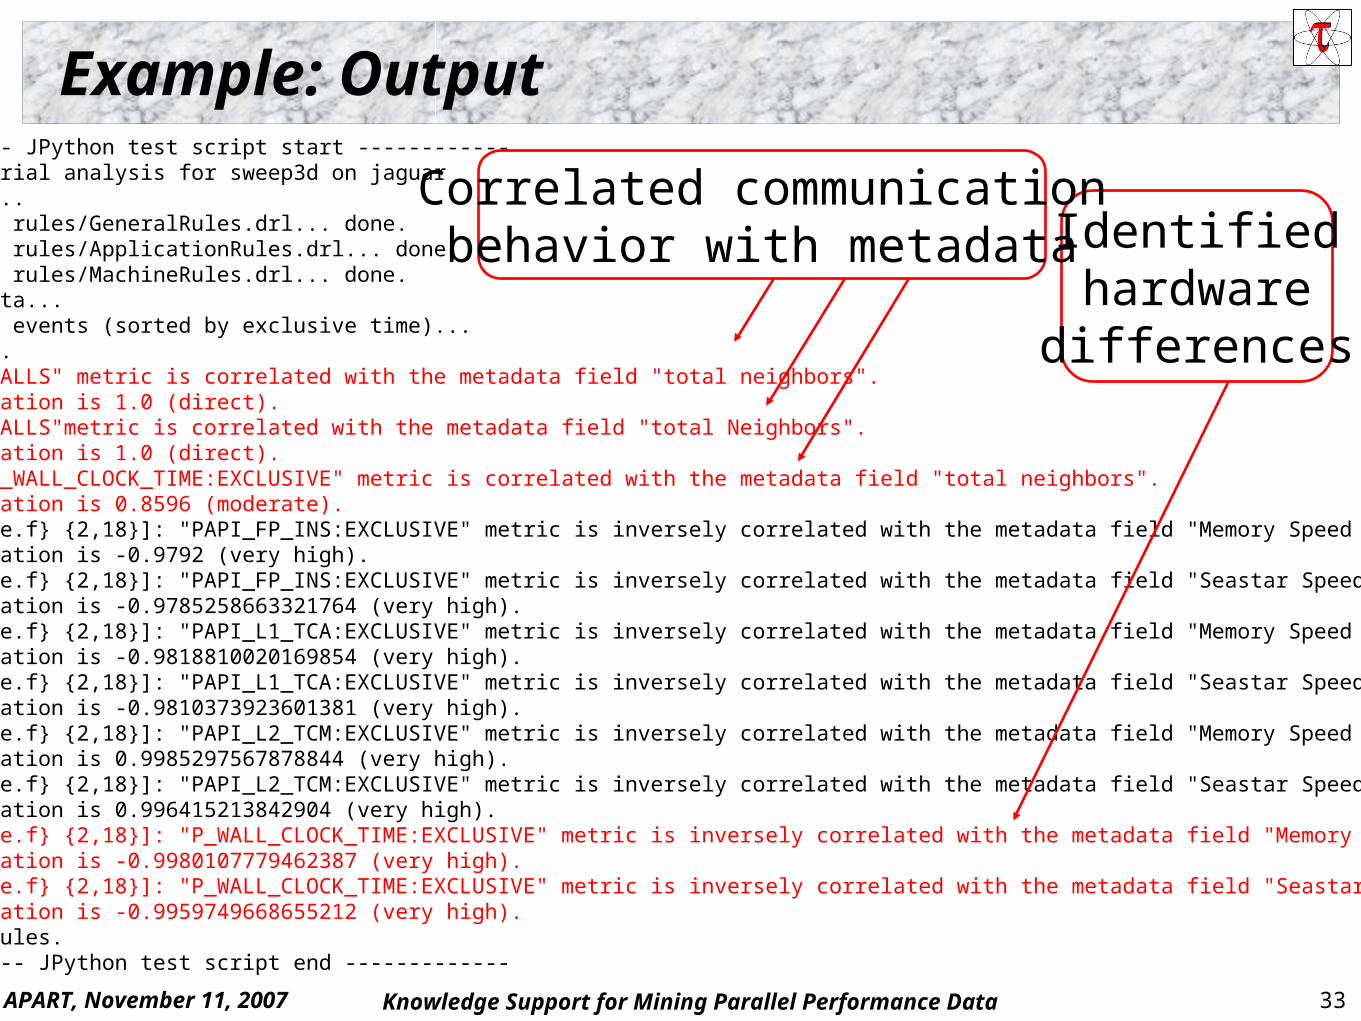
Example: Output--------------- JPython test script start ------------doing single trial analysis for sweep3d on jaguarLoading Rules...Reading rules: rules/GeneralRules.drl... done.Reading rules: rules/ApplicationRules.drl... done.Reading rules: rules/MachineRules.drl... done.loading the data...Getting top 10 events (sorted by exclusive time)...Firing rules...MPI_Recv(): "CALLS" metric is correlated with the metadata field "total neighbors". The correlation is 1.0 (direct).MPI_Send(): "CALLS"metric is correlated with the metadata field "total Neighbors". The correlation is 1.0 (direct).MPI_Send(): "P_WALL_CLOCK_TIME:EXCLUSIVE" metric is correlated with the metadata field "total neighbors". The correlation is 0.8596 (moderate).SOURCE [{source.f} {2,18}]: "PAPI_FP_INS:EXCLUSIVE" metric is inversely correlated with the metadata field "Memory Speed (MB/s)". The correlation is -0.9792 (very high).SOURCE [{source.f} {2,18}]: "PAPI_FP_INS:EXCLUSIVE" metric is inversely correlated with the metadata field "Seastar Speed (MB/s)". The correlation is -0.9785258663321764 (very high).SOURCE [{source.f} {2,18}]: "PAPI_L1_TCA:EXCLUSIVE" metric is inversely correlated with the metadata field "Memory Speed (MB/s)”. The correlation is -0.9818810020169854 (very high).SOURCE [{source.f} {2,18}]: "PAPI_L1_TCA:EXCLUSIVE" metric is inversely correlated with the metadata field "Seastar Speed (MB/s)”. The correlation is -0.9810373923601381 (very high).SOURCE [{source.f} {2,18}]: "PAPI_L2_TCM:EXCLUSIVE" metric is inversely correlated with the metadata field "Memory Speed (MB/s)”. The correlation is 0.9985297567878844 (very high).SOURCE [{source.f} {2,18}]: "PAPI_L2_TCM:EXCLUSIVE" metric is inversely correlated with the metadata field "Seastar Speed (MB/s)”. The correlation is 0.996415213842904 (very high).SOURCE [{source.f} {2,18}]: "P_WALL_CLOCK_TIME:EXCLUSIVE" metric is inversely correlated with the metadata field "Memory Speed (MB/s)”. The correlation is -0.9980107779462387 (very high).SOURCE [{source.f} {2,18}]: "P_WALL_CLOCK_TIME:EXCLUSIVE" metric is inversely correlated with the metadata field "Seastar Speed (MB/s)”. The correlation is -0.9959749668655212 (very high)....done with rules.---------------- JPython test script end -------------
Identifiedhardware
differences
Correlated communicationbehavior with metadata
APART, November 11, 2007 34Knowledge Support for Mining Parallel Performance Data
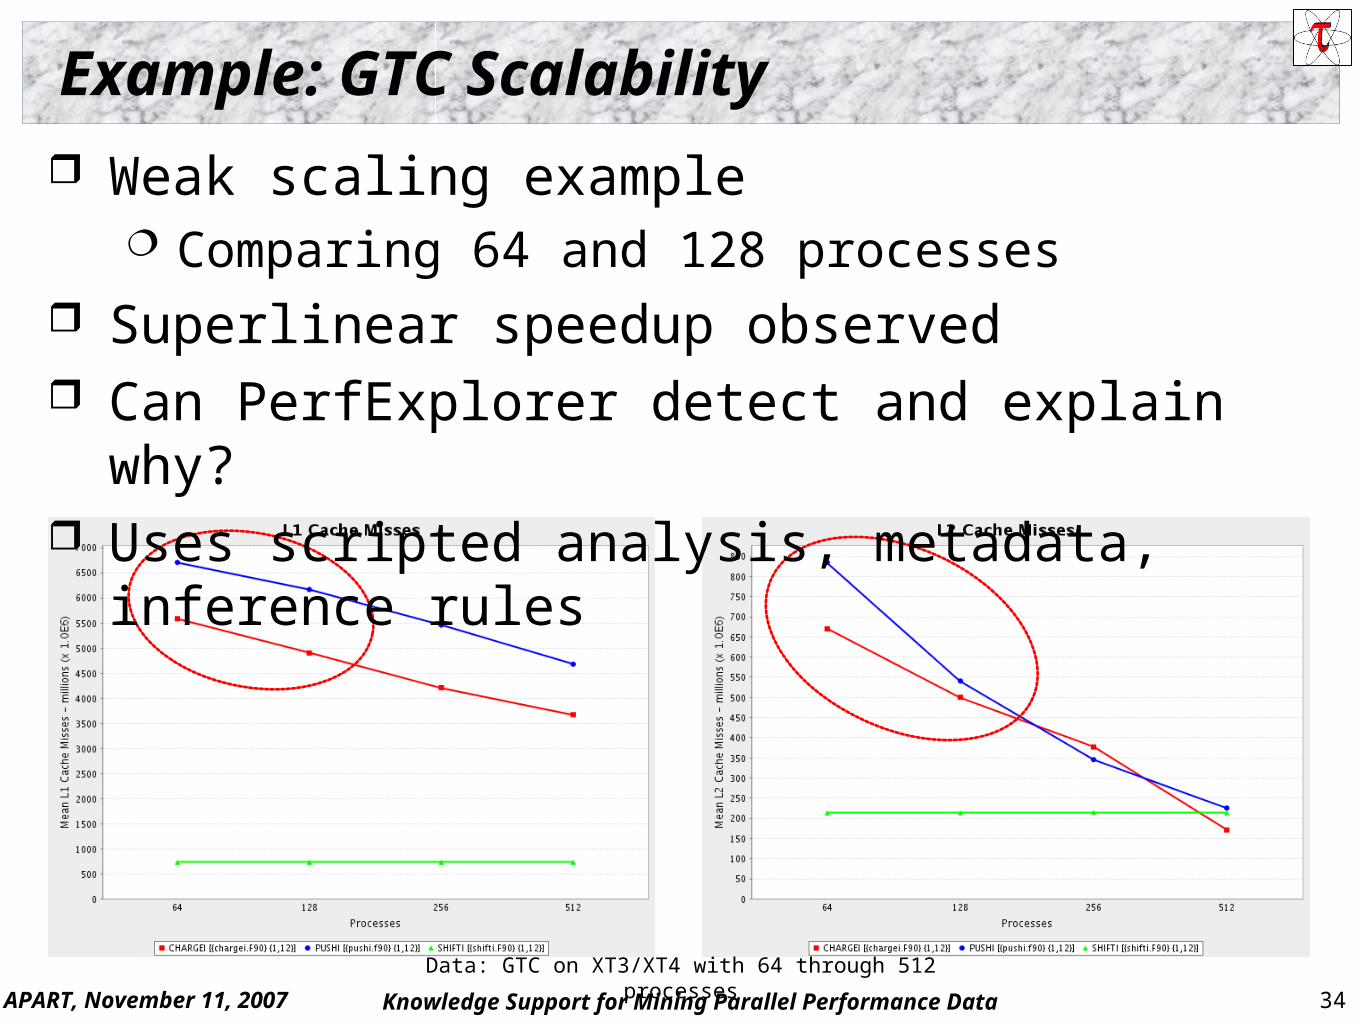
Data: GTC on XT3/XT4 with 64 through 512 processes
Example: GTC Scalability
Weak scaling example Comparing 64 and 128 processes
Superlinear speedup observed Can PerfExplorer detect and explain why? Uses scripted analysis, metadata, inference rules
APART, November 11, 2007 35Knowledge Support for Mining Parallel Performance Data
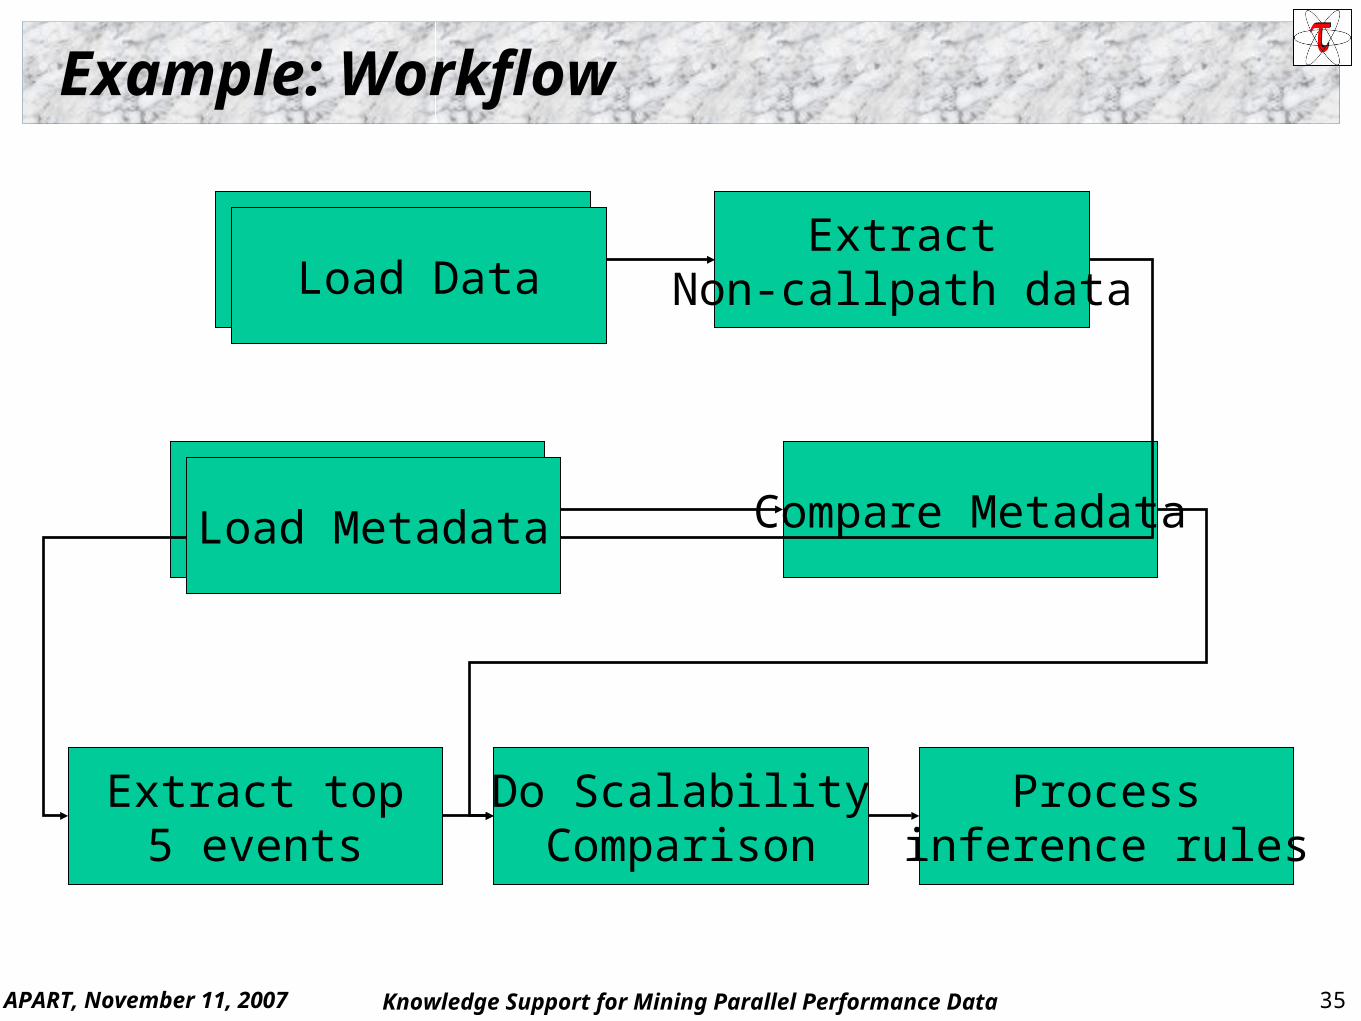
Example: Workflow
Load DataExtract
Non-callpath data
Extract top5 events
Load Metadata Compare Metadata
Do ScalabilityComparison
Processinference rules
Load Data
Load Metadata
APART, November 11, 2007 36Knowledge Support for Mining Parallel Performance Data
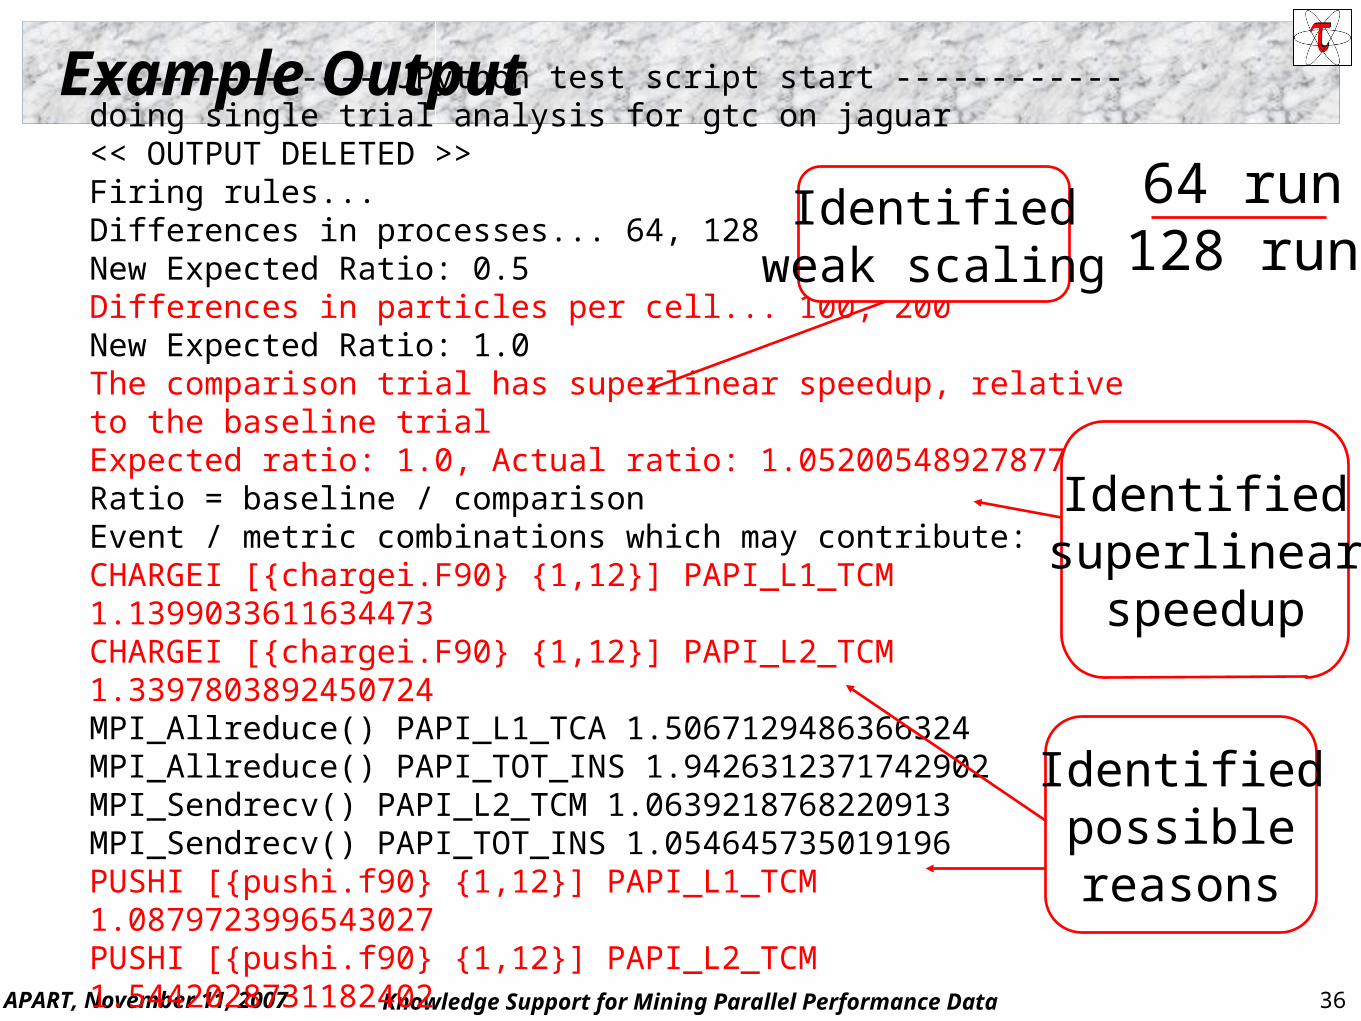
Example Output--------------- JPython test script start ------------doing single trial analysis for gtc on jaguar<< OUTPUT DELETED >>Firing rules...Differences in processes... 64, 128New Expected Ratio: 0.5Differences in particles per cell... 100, 200New Expected Ratio: 1.0The comparison trial has superlinear speedup, relative to the baseline trialExpected ratio: 1.0, Actual ratio: 1.0520054892787758Ratio = baseline / comparisonEvent / metric combinations which may contribute:CHARGEI [{chargei.F90} {1,12}] PAPI_L1_TCM 1.1399033611634473CHARGEI [{chargei.F90} {1,12}] PAPI_L2_TCM 1.3397803892450724MPI_Allreduce() PAPI_L1_TCA 1.5067129486366324MPI_Allreduce() PAPI_TOT_INS 1.9426312371742902MPI_Sendrecv() PAPI_L2_TCM 1.0639218768220913MPI_Sendrecv() PAPI_TOT_INS 1.054645735019196PUSHI [{pushi.f90} {1,12}] PAPI_L1_TCM 1.0879723996543027PUSHI [{pushi.f90} {1,12}] PAPI_L2_TCM 1.5442028731182402---------------- JPython test script end -------------
Identifiedpossiblereasons
Identifiedsuperlinear
speedup
Identifiedweak scaling
64 run128 run
APART, November 11, 2007 37Knowledge Support for Mining Parallel Performance Data
Current Status
Working now Several analysis operations are written Metadata collection is available Scripting and inference engine are in place
To be developed Results persistence Provenance capture and storage
APART, November 11, 2007 38Knowledge Support for Mining Parallel Performance Data
Conclusion Mining performance data will depend on adding
knowledge to analysis frameworks Application, hardware, environment metadata Analysis processes and workflow Rules for inferencing and analysis search
Expert knowledge combined with performance results can explain performance phenomena
Redesigned PerfExplorer framework is one approach Community performance knowledge engineering
Developing inference rules Constructing analysis processes Application-specific metadata and analysis
APART, November 11, 2007 39Knowledge Support for Mining Parallel Performance Data
Acknowledgments
US Department of Energy (DOE) Office of Science
MICS, Argonne National Lab
NSF Software and Tools for High-End Computing
PERI SciDAC PERI-DB project
TAU and PerfExplorer demos:NNSA / ASC, booth #1617, various times daily
PERI-DB demo:RENCI booth #3215, Wednesday at 2:30 PM