allen d. malony [email protected] performance research laboratory (prl) neuroinformatics center...
TRANSCRIPT

Allen D. Malony [email protected]
http://www.cs.uoregon.edu/research/tau
Performance Research Laboratory (PRL)
Neuroinformatics Center (NIC)
Department of Computer and Information Science
University of Oregon
The TAU Parallel Performance System

The TAU Parallel Performance SystemOSDL 2006 2
Outline Research interests and motivation TAU performance system
Instrumentation Measurement Analysis tools
Parallel profile analysis (ParaProf) Performance data management (PerfDMF) Performance data mining (PerfExplorer)
TAU status Open Trace Format (OTF) ZeptoOS and KTAU

The TAU Parallel Performance SystemOSDL 2006 3
Research Motivation
Tools for performance problem solving Empirical-based performance optimization process Performance technology concerns
characterization
PerformanceTuning
PerformanceDiagnosis
PerformanceExperimentation
PerformanceObservation
hypotheses
properties
• Instrumentation• Measurement• Analysis• Visualization
PerformanceTechnology
• Experimentmanagement
• Performancedata storage
PerformanceTechnology

The TAU Parallel Performance SystemOSDL 2006 4
TAU Performance System Tuning and Analysis Utilities (14+ year project effort) Performance system framework for HPC systems
Integrated, scalable, flexible, and parallel Targets a general complex system computation model
Entities: nodes / contexts / threads Multi-level: system / software / parallelism Measurement and analysis abstraction
Integrated toolkit for performance problem solving Instrumentation, measurement, analysis, and visualization Portable performance profiling and tracing facility Performance data management and data mining
Partners: LLNL, ANL, Research Center Jülich, LANL

The TAU Parallel Performance SystemOSDL 2006 5
TAU Parallel Performance System Goals
Portable (open source) parallel performance system Computer system architectures and operating systems Different programming languages and compilers
Multi-level, multi-language performance instrumentation Flexible and configurable performance measurement Support for multiple parallel programming paradigms
Multi-threading, message passing, mixed-mode, hybrid, object oriented (generic), component
Support for performance mapping Integration of leading performance technology Scalable (very large) parallel performance analysis

The TAU Parallel Performance SystemOSDL 2006 6
memory memory
Node Node Node
VMspace
Context
SMP
Threads
node memory
…
…
Interconnection Network Inter-node messagecommunication
*
*
physicalview
modelview
General Complex System Computation Model
Node: physically distinct shared memory machine Message passing node interconnection network
Context: distinct virtual memory space within node Thread: execution threads (user/system) in context

The TAU Parallel Performance SystemOSDL 2006 7
TAU Performance System Architecture

The TAU Parallel Performance SystemOSDL 2006 8
TAU Performance System Architecture

The TAU Parallel Performance SystemOSDL 2006 9
TAU Instrumentation Approach
Support for standard program events Routines, classes and templates Statement-level blocks
Support for user-defined events Begin/End events (“user-defined timers”) Atomic events (e.g., size of memory allocated/freed) Selection of event statistics
Support definition of “semantic” entities for mapping Support for event groups (aggregation, selection) Instrumentation optimization
Eliminate instrumentation in lightweight routines

The TAU Parallel Performance SystemOSDL 2006 10
TAU Instrumentation Mechanisms Source code
Manual (TAU API, TAU component API) Automatic (robust)
C, C++, F77/90/95 (Program Database Toolkit (PDT)) OpenMP (directive rewriting (Opari), POMP2 spec)
Object code Pre-instrumented libraries (e.g., MPI using PMPI) Statically-linked and dynamically-linked
Executable code Dynamic instrumentation (pre-execution) (DynInstAPI) Virtual machine instrumentation (e.g., Java using JVMPI)
TAU_COMPILER to automate instrumentation process

The TAU Parallel Performance SystemOSDL 2006 11
User-level abstractions problem domain
source code
source code
object code libraries
instrumentation
instrumentation
executable
runtime image
compiler
linker
OS
VM
instrumentation
instrumentation
instrumentation
instrumentation
instrumentation
instrumentationperformancedata run
preprocessor
Multi-Level Instrumentation and Mapping
Multiple interfaces Information sharing
Between interfaces Event selection
Within/between levels
Mapping Associate
performance data with high-level semantic abstractions

The TAU Parallel Performance SystemOSDL 2006 12
Program Database Toolkit (PDT)
Application/ Library
C / C++parser
Fortran parserF77/90/95
C / C++IL analyzer
FortranIL analyzer
ProgramDatabase
Files
IL IL
DUCTAPE
PDBhtml
SILOON
CHASM
tau_instrumentor
Programdocumentation
Applicationcomponent glue
C++ / F90/95interoperability
Automatic sourceinstrumentation

The TAU Parallel Performance SystemOSDL 2006 13
Program Database Toolkit (PDT)
Program code analysis framework Develop source-based tools
High-level interface to source code information Integrated toolkit for source code parsing, database
creation, and database query Commercial grade front-end parsers Portable IL analyzer, database format, and access API Open software approach for tool development
Multiple source languages Implement automatic performance instrumentation tools
tau_instrumentor

The TAU Parallel Performance SystemOSDL 2006 14
TAU Measurement Approach
Portable and scalable parallel profiling solution Multiple profiling types and options Event selection and control (enabling/disabling, throttling) Online profile access and sampling Online performance profile overhead compensation
Portable and scalable parallel tracing solution Trace translation to Open Trace Format (OTF) Trace streams and hierarchical trace merging
Robust timing and hardware performance support Multiple counters (hardware, user-defined, system) Performance measurement for CCA component software

The TAU Parallel Performance SystemOSDL 2006 15
TAU Measurement Mechanisms
Parallel profiling Function-level, block-level, statement-level Supports user-defined events and mapping events TAU parallel profile stored (dumped) during execution Support for flat, callgraph/callpath, phase profiling Support for memory profiling
Tracing All profile-level events Inter-process communication events Inclusion of multiple counter data in traced events

The TAU Parallel Performance SystemOSDL 2006 16
Types of Parallel Performance Profiling
Flat profiles Metric (e.g., time) spent in an event (callgraph nodes) Exclusive/inclusive, # of calls, child calls
Callpath profiles (Calldepth profiles) Time spent along a calling path (edges in callgraph) “main=> f1 => f2 => MPI_Send” (event name) TAU_CALLPATH_LENGTH environment variable
Phase profiles Flat profiles under a phase (nested phases are allowed) Default “main” phase Supports static or dynamic (per-iteration) phases

The TAU Parallel Performance SystemOSDL 2006 17
Performance Analysis and Visualization
Analysis of parallel profile and trace measurement Parallel profile analysis
ParaProf: parallel profile analysis and presentation ParaVis: parallel performance visualization package Profile generation from trace data (tau2pprof)
Performance data management framework (PerfDMF) Parallel trace analysis
Translation to VTF (V3.0), EPILOG, OTF formats Integration with VNG (Technical University of Dresden)
Online parallel analysis and visualization Integration with CUBE browser (KOJAK, UTK, FZJ)

The TAU Parallel Performance SystemOSDL 2006 18
ParaProf Parallel Performance Profile Analysis
HPMToolkit
MpiP
TAU
Raw files
PerfDMFmanaged(database)
Metadata
Application
Experiment
Trial

The TAU Parallel Performance SystemOSDL 2006 19
Example Applications sPPM
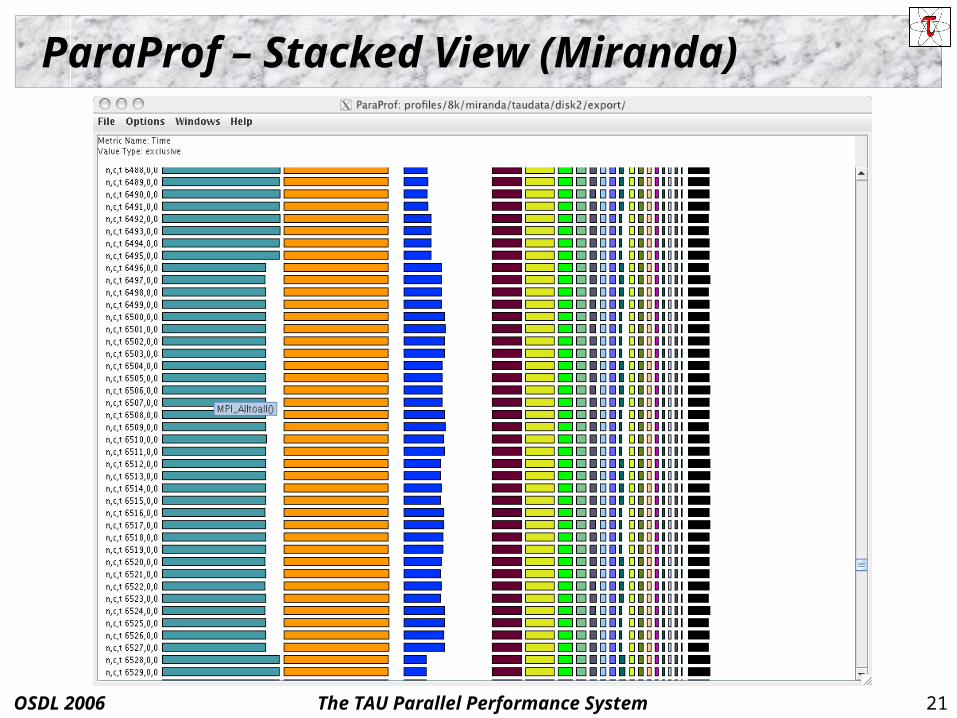
ASCI benchmark, Fortran, C, MPI, OpenMP or pthreads Miranda
research hydrodynamics code, Fortran, MPI GYRO
tokamak turbulence simulation, Fortran, MPI FLASH
physics simulation, Fortran, MPI WRF
weather research and forecasting, Fortran, MPI S3D
3D combustion, Fortran, MPI

The TAU Parallel Performance SystemOSDL 2006 20
ParaProf – Flat Profile (Miranda, BG/L)
8K processorsnode, context, thread
Miranda hydrodynamics Fortran + MPI LLNL
Run to 64K
The TAU Parallel Performance SystemOSDL 2006 21
ParaProf – Stacked View (Miranda)

The TAU Parallel Performance SystemOSDL 2006 22
ParaProf – Callpath Profile (Flash)
Flash thermonuclear flashes Fortran + MPI Argonne

The TAU Parallel Performance SystemOSDL 2006 23
ParaProf – Histogram View (Miranda)
8k processors
16k processors

The TAU Parallel Performance SystemOSDL 2006 24
NAS BT – Flat Profile
How is MPI_Wait()distributed relative tosolver direction?
Application routine namesreflect phase semantics

The TAU Parallel Performance SystemOSDL 2006 25
NAS BT – Phase Profile (Main and X, Y, Z)
Main phase shows nested phases and immediate events

The TAU Parallel Performance SystemOSDL 2006 26
ParaProf – 3D Full Profile (Miranda)
16k processors

The TAU Parallel Performance SystemOSDL 2006 27
ParaProf – 3D Full Profile (Flash)
128 processors

The TAU Parallel Performance SystemOSDL 2006 28
ParaProf Bar Plot (Zoom in/out +/-)

The TAU Parallel Performance SystemOSDL 2006 29
ParaProf – 3D Scatterplot (Miranda)
Each pointis a “thread”of execution
A total offour metricsshown inrelation
ParaVis 3Dprofilevisualizationlibrary JOGL

The TAU Parallel Performance SystemOSDL 2006 30
ParaProf – Callgraph Zoom (Flash)
Zoom in (+)Zoom out (-)

The TAU Parallel Performance SystemOSDL 2006 31
Performance Tracing on Miranda
Use TAU to generate VTF3 traces for Vampir analysis MPI calls with HW counter information (not shown) Detailed code behavior to focus optimization efforts

The TAU Parallel Performance SystemOSDL 2006 32
S3D on Lemieux (TAU-to-VTF3, Vampir)
S3D 3D combustion Fortran + MPI PSC

The TAU Parallel Performance SystemOSDL 2006 33
S3D on Lemieux (Zoomed)

The TAU Parallel Performance SystemOSDL 2006 34
Runtime MPI Shared Library Instrumentation
We can now interpose the MPI wrapper library for applications that have already been compiled (no re-compilation or re-linking necessary!)
Uses LD_PRELOAD for Linux Soon on AIX using MPI_EUILIB/MPI_EUILIBPATH Simply compile TAU with MPI support and prefix your
MPI program with tau_load.sh
Requires shared library MPI Approach will work with other shared libraries
% mpirun –np 4 tau_load.sh a.out

The TAU Parallel Performance SystemOSDL 2006 35
Workload Characterization
Idea: partition performance data for individual functions based on runtime parameters
Enable by configuring with –PROFILEPARAM TAU_PROFILE_PARAM1L (value, “name”) Simple example:
void foo(int input) {
TAU_PROFILE("foo", "", TAU_DEFAULT);
TAU_PROFILE_PARAM1L(input, "input");
...
}

The TAU Parallel Performance SystemOSDL 2006 36
Workload Characterization (continued)
5 seconds spent in function “foo” becomes 2 seconds for “foo [ <input> = <25> ]” 1 seconds for “foo [ <input> = <5> ]” …
Currently used in MPI wrapper library Allows for partitioning of time spent in MPI routines
based on parameters (message size, message tag, destination node)
Can be extrapolated to infer specifics about the MPI subsystem and system as a whole

The TAU Parallel Performance SystemOSDL 2006 37
Characterization Based on Message Size Simple example, send/receive squared message sizes (0-32MB)
#include <stdio.h>#include <mpi.h>
int main(int argc, char **argv) { int rank, size, i, j; int buffer[16*1024*1024]; MPI_Init(&argc, &argv); MPI_Comm_size( MPI_COMM_WORLD, &size ); MPI_Comm_rank( MPI_COMM_WORLD, &rank ); for (i=0;i<1000;i++) for (j=1;j<16*1024*1024;j*=2) { if (rank == 0) {
MPI_Send(buffer,j,MPI_INT,1,42,MPI_COMM_WORLD); } else {
MPI_Status status;MPI_Recv(buffer,j,MPI_INT,0,42,MPI_COMM_WORLD,&status);
} } MPI_Finalize();}

The TAU Parallel Performance SystemOSDL 2006 38
Characterization Results
Two different message sizes (~3.3MB and ~4K)

The TAU Parallel Performance SystemOSDL 2006 39
Important Questions for Application Developers
How does performance vary with different compilers? Is poor performance correlated with certain OS features? Has a recent change caused unanticipated performance? How does performance vary with MPI variants? Why is one application version faster than another? What is the reason for the observed scaling behavior? Did two runs exhibit similar performance? How are performance data related to application events? Which machines will run my code the fastest and why? Which benchmarks predict my code performance best?

The TAU Parallel Performance SystemOSDL 2006 40
Performance Problem Solving Goals Answer questions at multiple levels of interest
Data from low-level measurements and simulations use to predict application performance
High-level performance data spanning dimensions machine, applications, code revisions, data sets examine broad performance trends
Discover general correlations application performance and features of their external environment
Develop methods to predict application performance on lower-level metrics
Discover performance correlations between a small set of benchmarks and a collection of applications that represent a typical workload for a given system

The TAU Parallel Performance SystemOSDL 2006 41
Performance Data Management (PerfDMF)
K. Huck, A. Malony, R. Bell, A. Morris, “Design and Implementation of a Parallel Performance Data Management Framework,” ICPP 2005. (awarded best paper)

The TAU Parallel Performance SystemOSDL 2006 42
Performance Data Mining (Objectives)
Conduct parallel performance analysis in a systematic, collaborative and reusable manner Manage performance complexity Discover performance relationship and properties Automate process
Multi-experiment performance analysis Large-scale performance data reduction
Summarize characteristics of large processor runs Implement extensible analysis framework
Abtraction / automation of data mining operations Interface to existing analysis and data mining tools

The TAU Parallel Performance SystemOSDL 2006 43
Performance Data Mining (PerfExplorer)
Performance knowledge discovery framework Data mining analysis applied to parallel performance data
comparative, clustering, correlation, dimension reduction, … Use the existing TAU infrastructure
TAU performance profiles, PerfDMF Client-server based system architecture
Technology integration Java API and toolkit for portability PerfDMF R-project/Omegahat, Octave/Matlab statistical analysis WEKA data mining package JFreeChart for visualization, vector output (EPS, SVG)

The TAU Parallel Performance SystemOSDL 2006 44
Performance Data Mining (PerfExplorer)
K. Huck and A. Malony, “PerfExplorer: A Performance Data Mining Framework For Large-Scale Parallel Computing,” SC 2005.

The TAU Parallel Performance SystemOSDL 2006 45
PerfExplorer Analysis Methods
Data summaries, distributions, scatterplots Clustering
k-means Hierarchical
Correlation analysis Dimension reduction
PCA Random linear projection Thresholds
Comparative analysis Data management views

The TAU Parallel Performance SystemOSDL 2006 46
Cluster Analysis
Performance data represented as vectors - each dimension is the cumulative time for an event
k-means: k random centers are selected and instances are grouped with the "closest" (Euclidean) center
New centers are calculated and the process repeated until stabilization or max iterations
Dimension reduction necessary for meaningful results Virtual topology, summaries constructed

The TAU Parallel Performance SystemOSDL 2006 47
sPPM Cluster Analysis

The TAU Parallel Performance SystemOSDL 2006 48
Flash Clustering on 16K BG/L Processors
Four significant events automatically selected Clusters and correlations are visible

The TAU Parallel Performance SystemOSDL 2006 49
Correlation Analysis
Describes strength and direction of a linear relationship between two variables (events) in the data

The TAU Parallel Performance SystemOSDL 2006 50
Comparative Analysis
Relative speedup, efficiency total runtime, by event, one event, by phase
Breakdown of total runtime Group fraction of total runtime Correlating events to total runtime Timesteps per second Performance Evaluation Research Center (PERC)
PERC tools study (led by ORNL, Pat Worley) In-depth performance analysis of select applications Evaluation performance analysis requirements Test tool functionality and ease of use

The TAU Parallel Performance SystemOSDL 2006 51
PerfExplorer Interface
Select experiments and trials of interest
Data organized in application, experiment, trial structure(will allow arbitrary in future)
Experimentmetadata

The TAU Parallel Performance SystemOSDL 2006 52
PerfExplorer Interface
Select analysis

The TAU Parallel Performance SystemOSDL 2006 53
B1-std
B3-gtc
Timesteps per Second Cray X1 is the fastest to
solution in all 3 tests FFT (nl2) improves time for
B3-gtc only TeraGrid faster than p690 for
B1-std? Plots generated automatically
B1-std
B2-cy B3-gtc
TeraGrid

The TAU Parallel Performance SystemOSDL 2006 54
Relative Efficiency (B1-std) By experiment (B1-std)
Total runtime (Cheetah (red)) By event for one experiment
Coll_tr (blue) is significant By experiment for one event
Shows how Coll_tr behaves for all experiments
16 processorbase case
Cheetah Coll_tr

The TAU Parallel Performance SystemOSDL 2006 55
PerfExplorer Future Work
Extensions to PerfExplorer framework Examine properties of performance data Automated guidance of analysis Workflow scripting for repeatable analysis Dependency modeling (go beyond correlation) Time-series analysis of phase-based data

The TAU Parallel Performance SystemOSDL 2006 56
Open Trace Format (OTF)
Features Hierarchical trace format Replacement for proprietary formats such as STF
Pallas and Intel Efficient streams based parallel access Tracing library available on IBM BG/L platform
Development of OTF supported by LLNL Joint development effort
ZiH / Technical University of Dresden ParaTools, Inc.
http://www.paratools.com/otf

The TAU Parallel Performance SystemOSDL 2006 57
OTF Options

The TAU Parallel Performance SystemOSDL 2006 58
Vampir and VNG Commercial trace based tools
Developed at ZiH, T.U. Dresden Wolfgang Nagel, Holger Brunst and others… http://www.vampir-ng.de
Vampir Trace Visualizer Known also as Intel ® Trace Analyzer v4.0 Sequential program
Vampir Next Generation (VNG) Client (vng) runs on a desktop, server (vngd) on a cluster Parallel trace analysis Orders of magnitude bigger traces (more memory) State of the art in parallel trace visualization

The TAU Parallel Performance SystemOSDL 2006 59
Vampir Next Generation (VNG) Architecture
MergedTraces
Analysis Server
Classic Analysis:
monolithic
sequential
Worker 1
Worker 2
Worker m
Master
Trace 1Trace 2
Trace 3Trace N
File System
InternetInternet
Parallel Program
Monitor System
Event Streams
Visualization Client
Segment Indicator
768 Processes Thumbnail
Timeline with 16 visible Traces
ProcessParallel
I/OMessage Passing

The TAU Parallel Performance SystemOSDL 2006 60
TAU Tracing Enhancements
Configure TAU with -TRACE –vtf=<dir> –otf=<dir> options% configure –TRACE –vtf=<dir> … % configure –TRACE –otf=<dir> …Generates tau_merge, tau2vtf, tau2otf tools in <tau>/<arch>/bin% tau_f90.sh app.f90 –o app
Instrument and execute application % mpirun -np 4 app
Merge and convert trace files to VTF3/OTF format % tau_treemerge.pl % tau2vtf tau.trc tau.edf app.vpt.gz % vampir foo.vpt.gz
OR % tau2otf tau.trc tau.edf app.otf –n <numstreams> % vampir app.otf
OR use VNG to analyze OTF/VTF trace files

The TAU Parallel Performance SystemOSDL 2006 61
TAU Eclipse Integration
Eclipse GUI integration of existing TAU tools New Eclipse plug-in for code instrumentation
Integration with CDT and FDT Java, C/C++, and Fortran projects Can be instrumented and run from within eclipse
Each project can be given multiple build configurations corresponding to available TAU makefiles
All TAU configuration options are available Paraprof tool can be launched automatically

The TAU Parallel Performance SystemOSDL 2006 62
TAU Eclipse Integration
TAU configuration
TAU experimentation

The TAU Parallel Performance SystemOSDL 2006 63
TAU Eclipse Future Work
Development of the TAU Eclipse plugins for Java and the CDT/FDT is ongoing
Planned features include: Full integration with the Eclipse Parallel Tools project Database storage of project performance data Refinement of the plugin settings interface to allow easier
selection of TAU runtime and compiletime options Accessibility of TAU configuration and commandline
tools via the Eclipse UI

The TAU Parallel Performance SystemOSDL 2006 64
ZeptoOS and TAU
DOE OS/RTS for Extreme Scale Scientific Computation OS research for petascale systems ZeptoOS project
scalable, adaptive components for petascale architectures Argonne National Laboratory and University of Oregon
University of Oregon Kernel-level performance monitoring OS component performance assessment and tuning KTAU (Kernel Tuning and Analysis Utilities)
integration of TAU infrastructure in Linux kernel integration with ZeptoOS (light-weight Linux-based kernel) installation on BG/L and other platforms (e.g., Cray XT3) Port to 32-bit and 64-bit Linux platforms

The TAU Parallel Performance SystemOSDL 2006 65
Linux Kernel Profiling using TAU – Goals
Fine-grained kernel-level performance measurement Parallel applications Support both profiling and tracing
Both process-centric and system-wide view Merge user-space performance with kernel-space
User-space: (TAU) profile/trace Kernel-space: (KTAU) profile/trace
Detailed program-OS interaction data Including interrupts (IRQ)
Analysis and visualization compatible with TAU

The TAU Parallel Performance SystemOSDL 2006 66
KTAU Architecture

The TAU Parallel Performance SystemOSDL 2006 67
KTAU On BG/L

The TAU Parallel Performance SystemOSDL 2006 68
KTAU Future Work Dynamic measurement control
Enable/disable events w/o recompilation or reboot Add new performance data sources
Look into hardware counters Improve user-space integration
Full callpaths and phase-based profiling Merged user/kernel traces
Integration with monitoring technology SuperMon, MRNet, TAUg
New porting efforts IA-64, PPC-64 and AMD Opteron
System characterization studies

The TAU Parallel Performance SystemOSDL 2006 69
TAU Performance System Status
Computing platforms IBM, SGI, Cray, HP, Sun, Hitachi, NEC, Linux clusters,
Apple, Windows, … Programming languages
C, C++, Fortran 90/95, UPC, HPF, Java, OpenMP, Python Thread libraries
pthreads, SGI sproc, Java,Windows, OpenMP Communications libraries
MPI-1/2, PVM, shmem, … Compilers
IBM, Intel, PGI, GNU, Fujitsu, Sun, NAG, Microsoft, SGI, Cray, HP, NEC, Absoft, Lahey, PathScale, Open64
The TAU Parallel Performance SystemOSDL 2006 70
Project Affiliations (selected)
Lawrence Livermore National Lab Hydrodynamics (Miranda), radiation diffusion (KULL) Open Trace Format (OTF) implementation on BG/L
Argonne National Lab ZeptoOS project and KTAU Astrophysical thermonuclear flashes (Flash)
Center for Simulation of Accidental Fires and Explosion University of Utah, ASCI ASAP Center, C-SAFE Uintah Computational Framework (UCF)
Oak Ridge National Lab Contribution to the Joule Report (S3D, AORSA3D)

The TAU Parallel Performance SystemOSDL 2006 71
Project Affiliations (continued)
Sandia National Lab Simulation of turbulent reactive flows (S3D) Combustion code (CFRFS)
Los Alamos National Lab Monte Carlo transport (MCNP) SAIC’s Adaptive Grid Eulerian (SAGE)
CCSM / ESMF / WRF climate/earth/weather simulation NSF, NOAA, DOE, NASA, …
Common component architecture (CCA) integration Performance Evaluation Research Center (PERC)
DOE SciDAC center

The TAU Parallel Performance SystemOSDL 2006 72
Support Acknowledgements Department of Energy (DOE)
Office of Science MICS, Argonne National Lab
ASC/NNSA University of Utah ASC/NNSA Level 1 ASC/NNSA, Lawrence Livermore National Lab
Department of Defense (DoD) HPC Modernization Office (HPCMO) Programming Environment and Training (PET)
NSF Software and Tools for High-End Computing Research Centre Juelich Los Alamos National Laboratory ParaTools
QuickTime™ and aTIFF (Uncompressed) decompressorare needed to see this picture.

The TAU Parallel Performance SystemOSDL 2006 73
Acknowledgements
Dr. Sameer Shende, Senior Scientist Alan Morris, Senior Software Engineer Wyatt Spear, PRL staff Scott Biersdorff, PRL staff Robert Yelle, PRL staff Kevin Huck, Ph.D. student Aroon Nataraj, Ph.D. student Kai Li, Ph.D. student Li Li, Ph.D. student Suravee Suthikulpanit, M.S. student