allen d. malony sameer s. shende robert bell {malony, sameer, bertie}@cs.uoregon.edu department of...
Post on 21-Dec-2015
215 views
TRANSCRIPT
Allen D. Malony Sameer S. Shende Robert Bell {malony, sameer, bertie}@cs.uoregon.edu
Department of Computer and Information Science
Computational Science Institute
University of Oregon
The TAU Performance System
The TAU Performance System Cray Presentation, Berkeley, CA 8/5/032
Overview
Motivation and goals TAU architecture and toolkit
Instrumentation Measurement Analysis
Performance mapping Application case studies
… TAU Integration Work in progress Conclusions
The TAU Performance System Cray Presentation, Berkeley, CA 8/5/033
Motivation
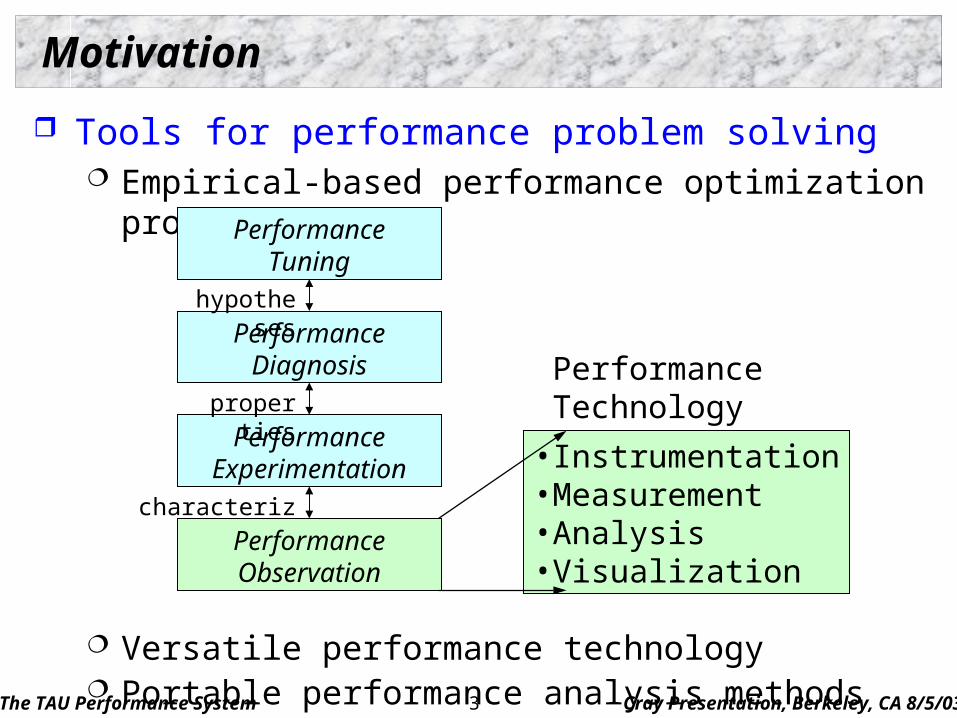
Tools for performance problem solving Empirical-based performance optimization process
Versatile performance technology Portable performance analysis methods
characterization
PerformanceTuning
PerformanceDiagnosis
PerformanceExperimentation
PerformanceObservation
hypotheses
properties
• Instrumentation• Measurement• Analysis• Visualization
PerformanceTechnology
The TAU Performance System Cray Presentation, Berkeley, CA 8/5/034
Problems
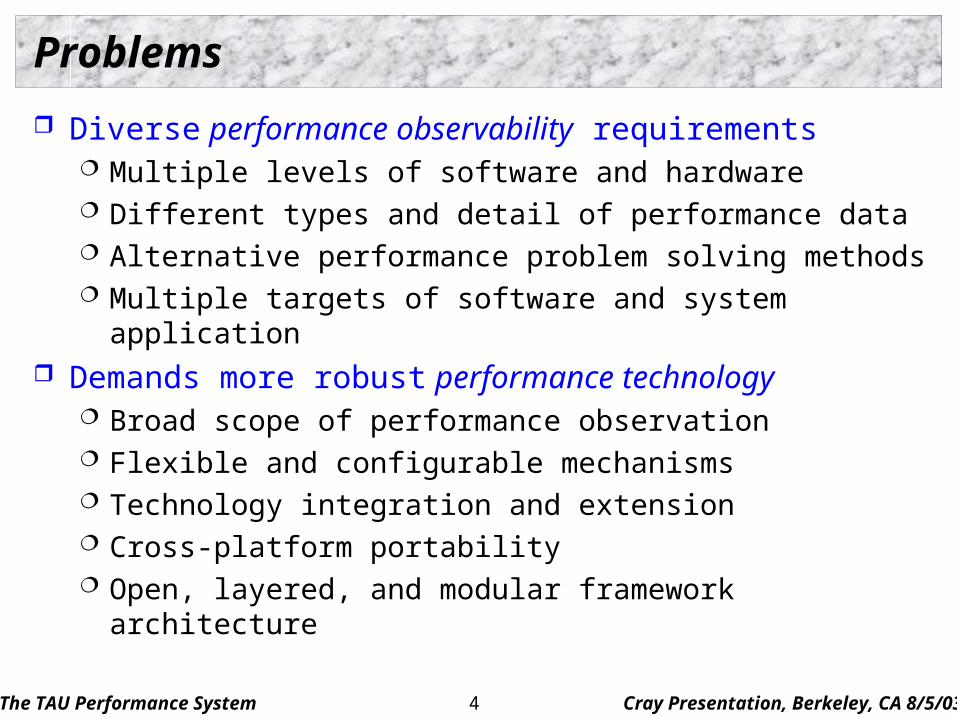
Diverse performance observability requirements Multiple levels of software and hardware Different types and detail of performance data Alternative performance problem solving methods Multiple targets of software and system application
Demands more robust performance technology Broad scope of performance observation Flexible and configurable mechanisms Technology integration and extension Cross-platform portability Open, layered, and modular framework architecture
The TAU Performance System Cray Presentation, Berkeley, CA 8/5/035
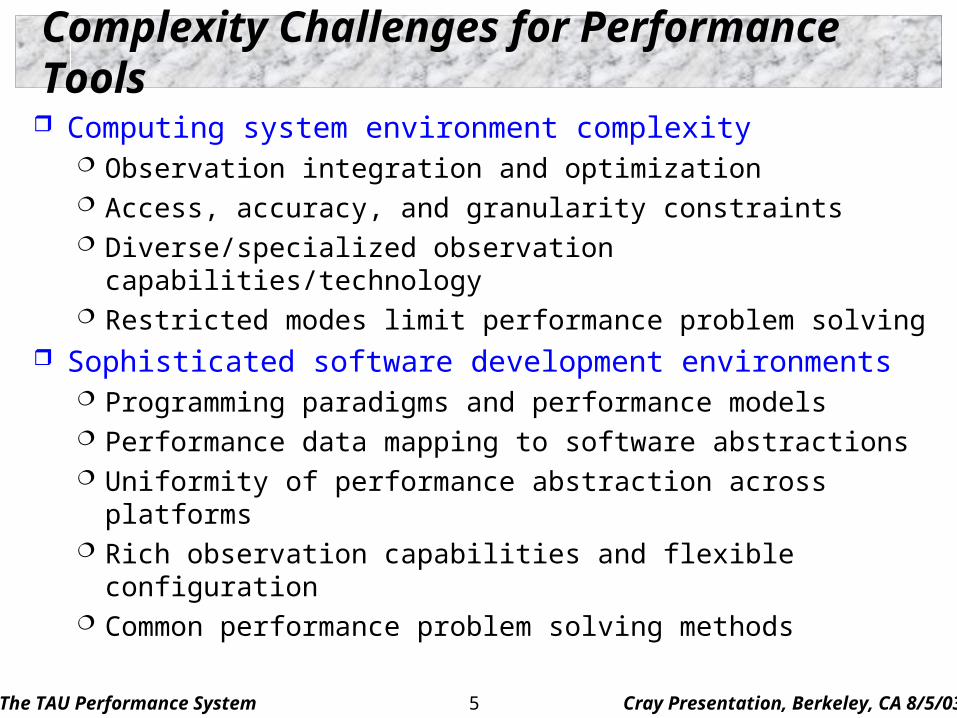
Complexity Challenges for Performance Tools
Computing system environment complexity Observation integration and optimization Access, accuracy, and granularity constraints Diverse/specialized observation capabilities/technology Restricted modes limit performance problem solving
Sophisticated software development environments Programming paradigms and performance models Performance data mapping to software abstractions Uniformity of performance abstraction across platforms Rich observation capabilities and flexible configuration Common performance problem solving methods
The TAU Performance System Cray Presentation, Berkeley, CA 8/5/036
General Problems (Performance Technology)
How do we create robust and ubiquitous performance technology for the analysis and tuning of parallel and distributed software and systems in the presence of (evolving) complexity challenges?
How do we apply performance technology effectively for the variety and diversity of performance problems
that arise in the context of complex parallel and distributed computer systems?
The TAU Performance System Cray Presentation, Berkeley, CA 8/5/037
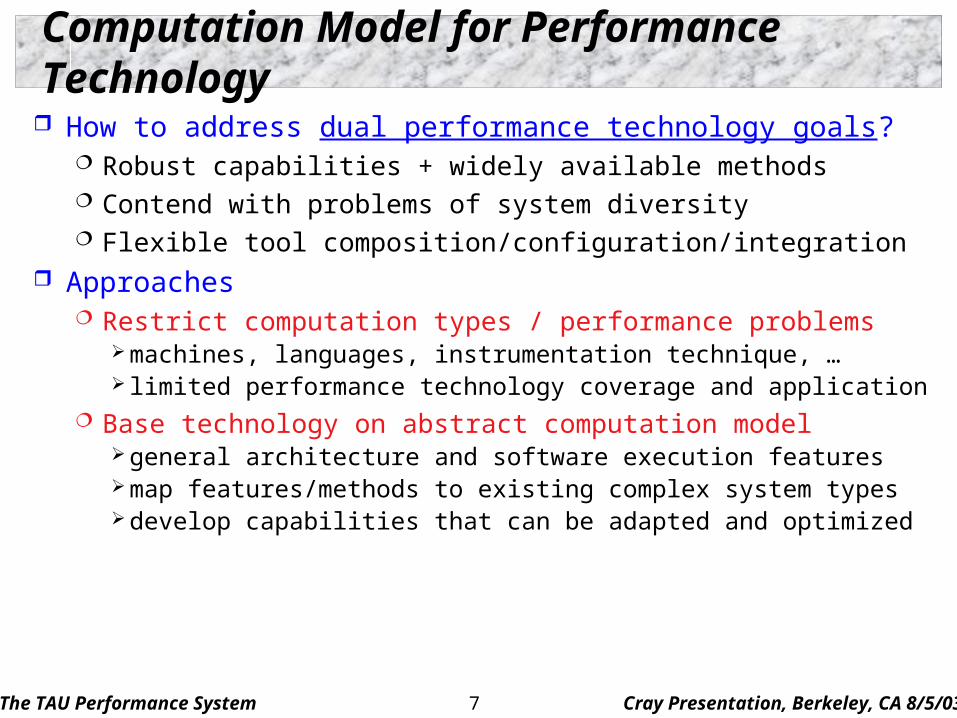
Computation Model for Performance Technology
How to address dual performance technology goals? Robust capabilities + widely available methods Contend with problems of system diversity Flexible tool composition/configuration/integration
Approaches Restrict computation types / performance problems
machines, languages, instrumentation technique, … limited performance technology coverage and application
Base technology on abstract computation model general architecture and software execution features map features/methods to existing complex system types develop capabilities that can be adapted and optimized
The TAU Performance System Cray Presentation, Berkeley, CA 8/5/038
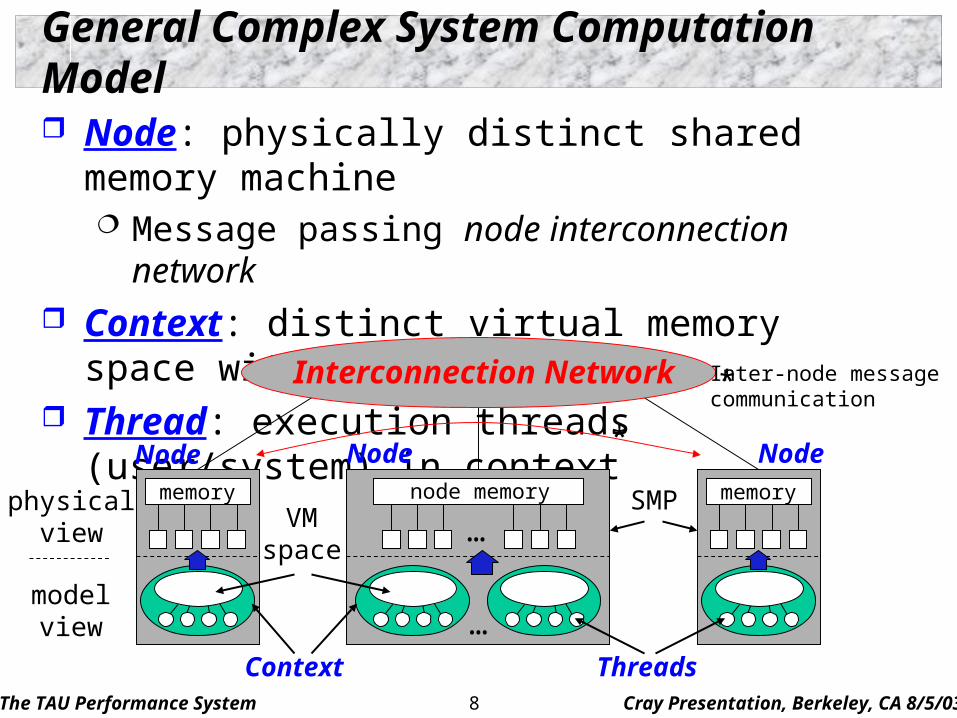
General Complex System Computation Model
Node: physically distinct shared memory machine Message passing node interconnection network
Context: distinct virtual memory space within node Thread: execution threads (user/system) in context
memory memory
Node Node Node
VMspace
Context
SMP
Threads
node memory
…
…
Interconnection Network Inter-node messagecommunication
*
*
physicalview
modelview
The TAU Performance System Cray Presentation, Berkeley, CA 8/5/039
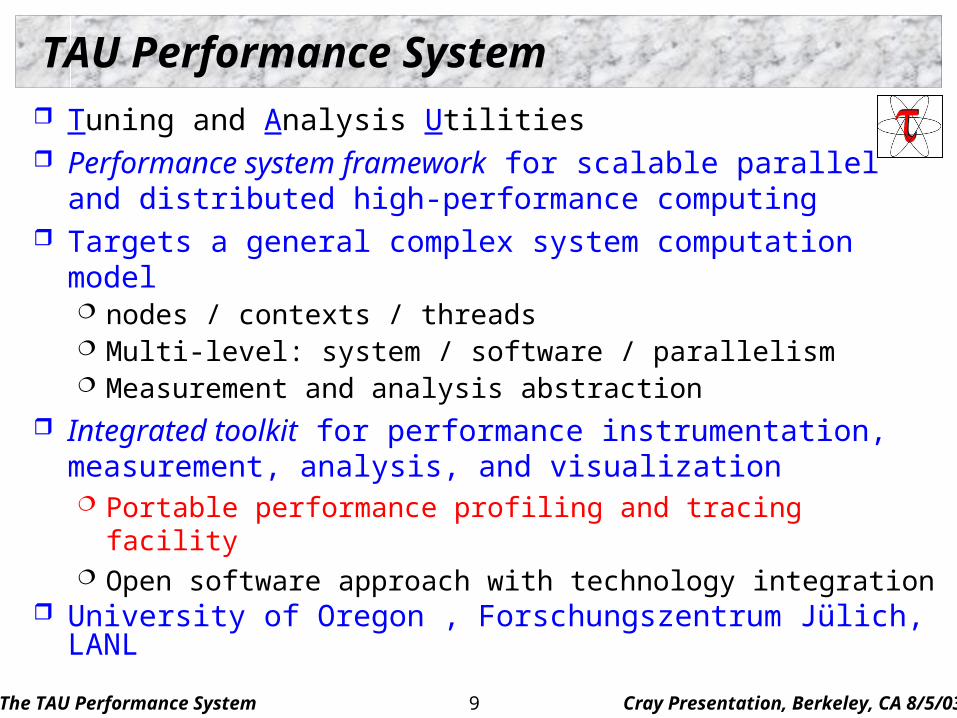
TAU Performance System
Tuning and Analysis Utilities Performance system framework for scalable parallel and
distributed high-performance computing Targets a general complex system computation model
nodes / contexts / threads Multi-level: system / software / parallelism Measurement and analysis abstraction
Integrated toolkit for performance instrumentation, measurement, analysis, and visualization Portable performance profiling and tracing facility Open software approach with technology integration
University of Oregon , Forschungszentrum Jülich, LANL
The TAU Performance System Cray Presentation, Berkeley, CA 8/5/0310
Definitions – Profiling
Profiling Recording of summary information during execution
execution time, # calls, hardware statistics, … Reflects performance behavior of program entities
functions, loops, basic blocks user-defined “semantic” entities
Very good for low-cost performance assessment Helps to expose performance bottlenecks and hotspots Implemented through
sampling: periodic OS interrupts or hardware counter traps instrumentation: direct insertion of measurement code
The TAU Performance System Cray Presentation, Berkeley, CA 8/5/0311
Definitions – Tracing
Tracing Recording of information about significant points (events)
during program execution entering/exiting code region (function, loop, block, …) thread/process interactions (e.g., send/receive message)
Save information in event record timestamp CPU identifier, thread identifier Event type and event-specific information
Event trace is a time-sequenced stream of event records Can be used to reconstruct dynamic program behavior Typically requires code instrumentation
The TAU Performance System Cray Presentation, Berkeley, CA 8/5/0312
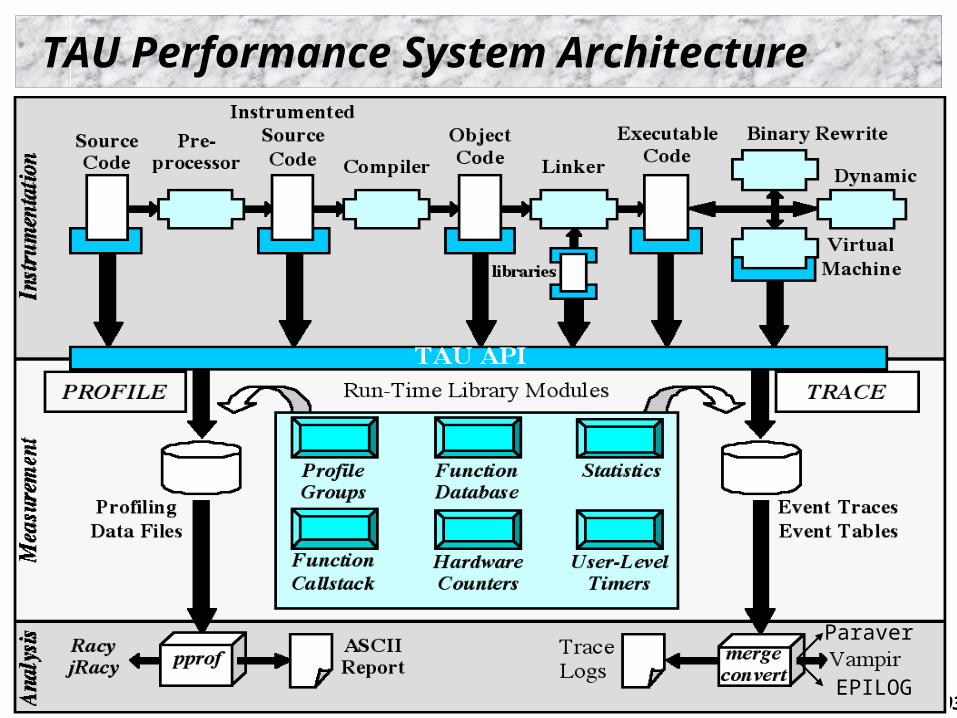
TAU Performance System Architecture
EPILOG
Paraver
The TAU Performance System Cray Presentation, Berkeley, CA 8/5/0313
TAU Performance Systems Goals
Multi-level performance instrumentation Multi-language automatic source instrumentation
Flexible and configurable performance measurement Widely-ported parallel performance profiling system
Computer system architectures and operating systems Different programming languages and compilers
Support for multiple parallel programming paradigms Multi-threading, message passing, mixed-mode, hybrid
Support for performance mapping Support for object-oriented and generic programming Integration in complex software systems and applications
The TAU Performance System Cray Presentation, Berkeley, CA 8/5/0314
How To Use TAU?
Instrumentation Application code and libraries Selective instrumentation
Install, compile, and link with TAU measurement library % configure; make clean install Multiple configurations for different measurements options Does not require change in instrumentation Selective measurement control
Execute “experiments” produce performance data Performance data generated at end or during execution
Use analysis tools to look at performance results
The TAU Performance System Cray Presentation, Berkeley, CA 8/5/0315
TAU Instrumentation Approach
Support for standard program events Routines Classes and templates Statement-level blocks
Support for user-defined events Begin/End events (“user-defined timers”) Atomic events Selection of event statistics
Support definition of “semantic” entities for mapping Support for event groups Instrumentation optimization
The TAU Performance System Cray Presentation, Berkeley, CA 8/5/0316
TAU Instrumentation
Flexible instrumentation mechanisms at multiple levels Source code
manual automatic
C, C++, F77/90 (Program Database Toolkit (PDT))OpenMP (directive rewriting (Opari))
Object code pre-instrumented libraries (e.g., MPI using PMPI) statically-linked and dynamically-linked fast breakpoints (compiler generated)
Executable code dynamic instrumentation (pre-execution) (DynInstAPI) virtual machine instrumentation (e.g., Java using JVMPI)
The TAU Performance System Cray Presentation, Berkeley, CA 8/5/0317
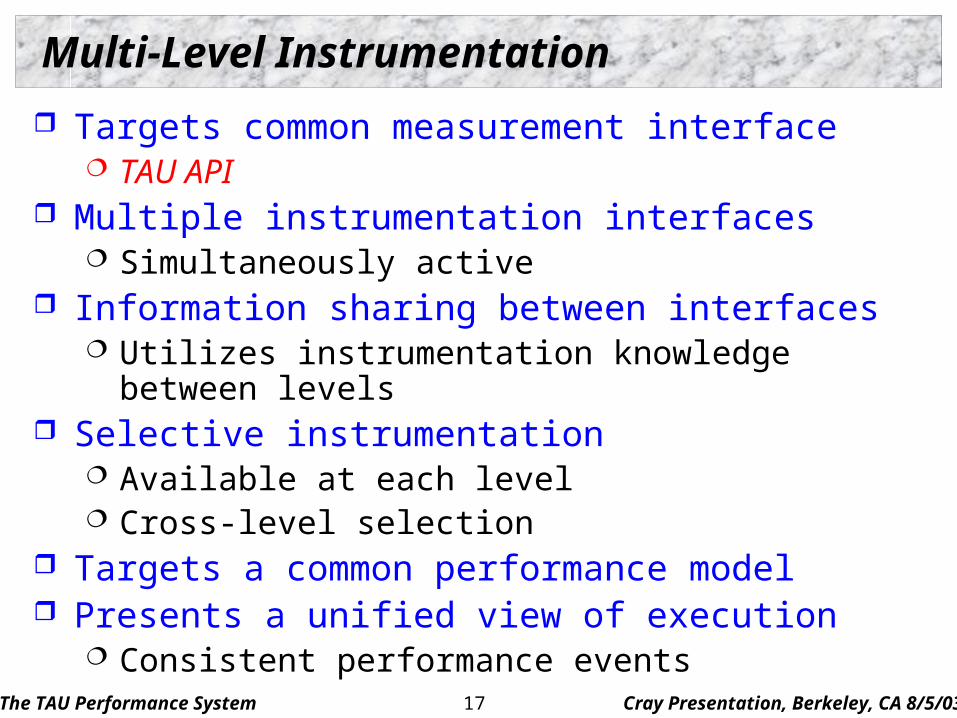
Multi-Level Instrumentation
Targets common measurement interface TAU API
Multiple instrumentation interfaces Simultaneously active
Information sharing between interfaces Utilizes instrumentation knowledge between levels
Selective instrumentation Available at each level Cross-level selection
Targets a common performance model Presents a unified view of execution
Consistent performance events
The TAU Performance System Cray Presentation, Berkeley, CA 8/5/0318
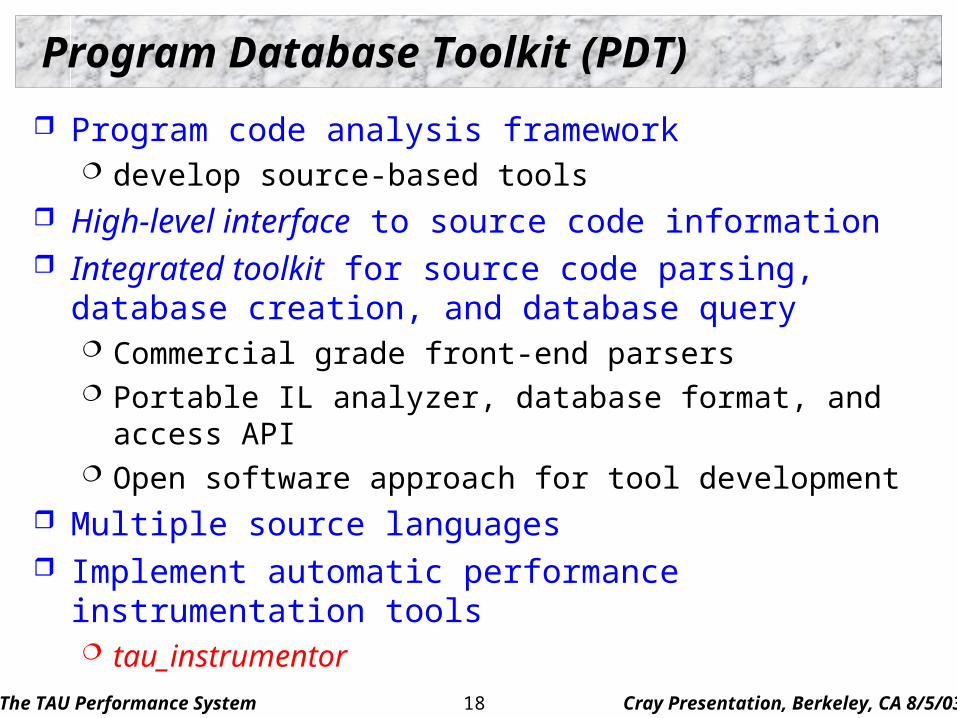
Program Database Toolkit (PDT)
Program code analysis framework develop source-based tools
High-level interface to source code information Integrated toolkit for source code parsing, database
creation, and database query Commercial grade front-end parsers Portable IL analyzer, database format, and access API Open software approach for tool development
Multiple source languages Implement automatic performance instrumentation tools
tau_instrumentor
The TAU Performance System Cray Presentation, Berkeley, CA 8/5/0319
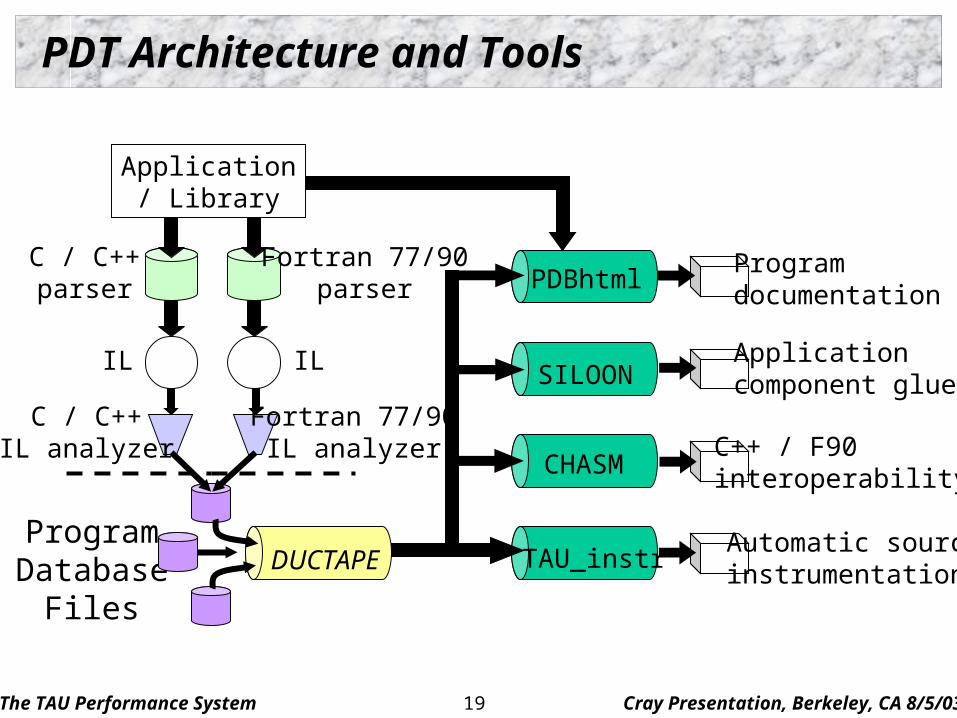
PDT Architecture and Tools
Application/ Library
C / C++parser
Fortran 77/90parser
C / C++IL analyzer
Fortran 77/90IL analyzer
ProgramDatabase
Files
IL IL
DUCTAPE
PDBhtml
SILOON
CHASM
TAU_instr
Programdocumentation
Applicationcomponent glue
C++ / F90interoperability
Automatic sourceinstrumentation
The TAU Performance System Cray Presentation, Berkeley, CA 8/5/0320
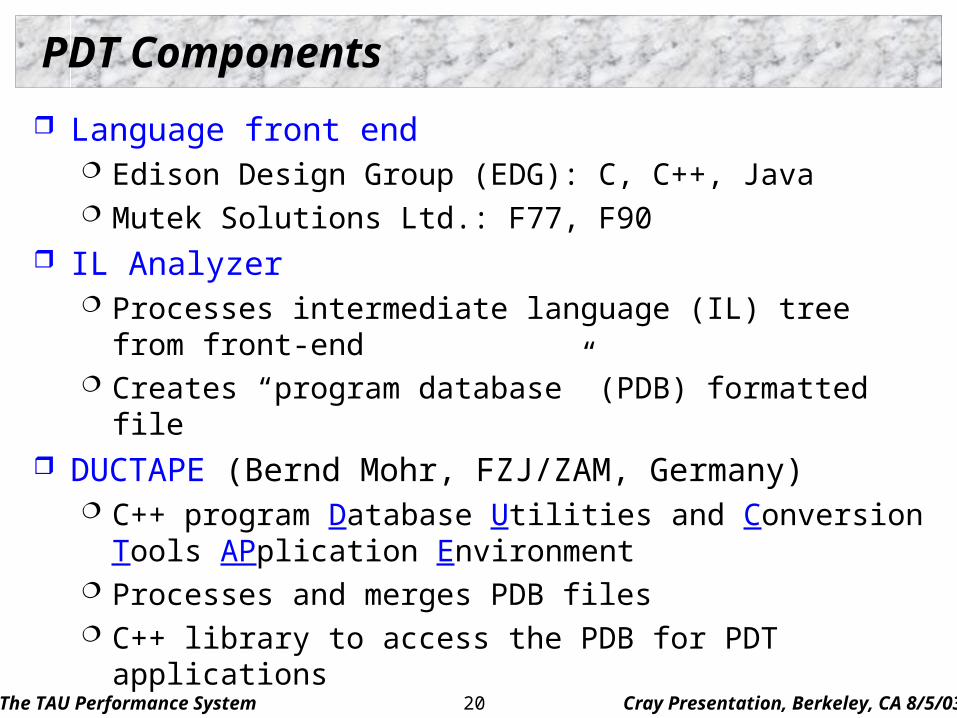
PDT Components
Language front end Edison Design Group (EDG): C, C++, Java Mutek Solutions Ltd.: F77, F90
IL Analyzer Processes intermediate language (IL) tree from front-end Creates “program database” (PDB) formatted file
DUCTAPE (Bernd Mohr, FZJ/ZAM, Germany) C++ program Database Utilities and Conversion Tools
APplication Environment Processes and merges PDB files C++ library to access the PDB for PDT applications
The TAU Performance System Cray Presentation, Berkeley, CA 8/5/0321
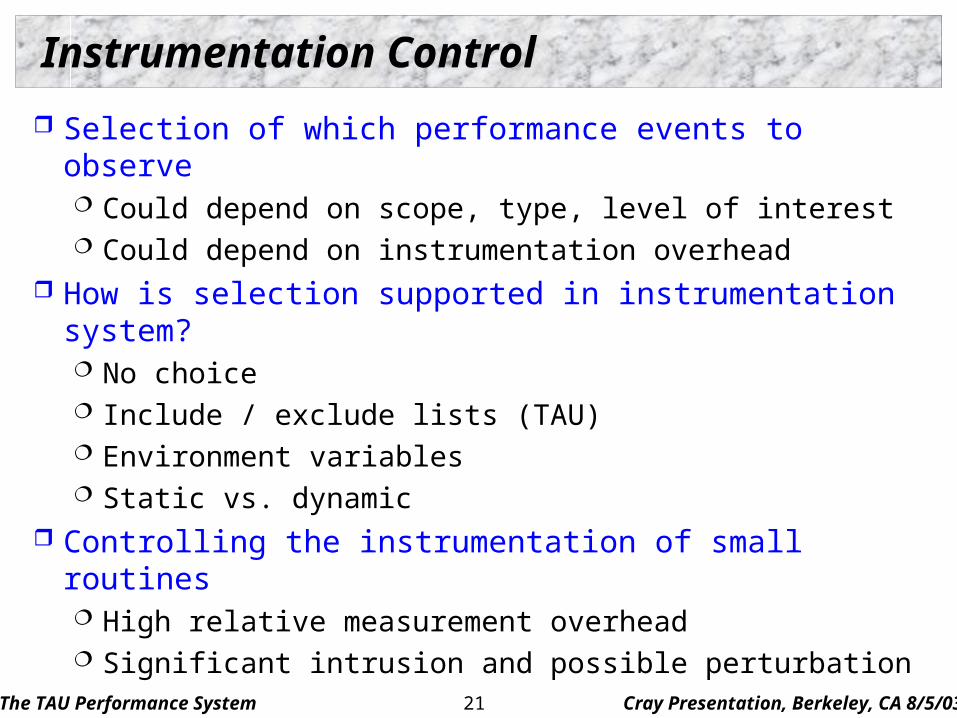
Instrumentation Control
Selection of which performance events to observe Could depend on scope, type, level of interest Could depend on instrumentation overhead
How is selection supported in instrumentation system? No choice Include / exclude lists (TAU) Environment variables Static vs. dynamic
Controlling the instrumentation of small routines High relative measurement overhead Significant intrusion and possible perturbation
The TAU Performance System Cray Presentation, Berkeley, CA 8/5/0322
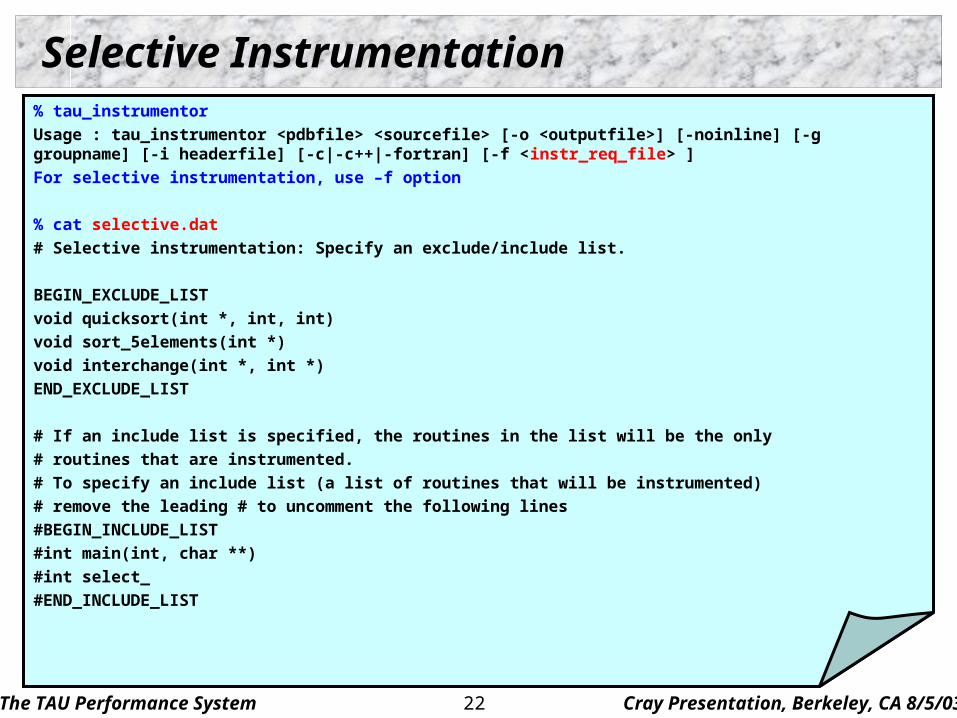
Selective Instrumentation% tau_instrumentor
Usage : tau_instrumentor <pdbfile> <sourcefile> [-o <outputfile>] [-noinline] [-g groupname] [-i headerfile] [-c|-c++|-fortran] [-f <instr_req_file> ]
For selective instrumentation, use –f option
% cat selective.dat
# Selective instrumentation: Specify an exclude/include list.
BEGIN_EXCLUDE_LIST
void quicksort(int *, int, int)
void sort_5elements(int *)
void interchange(int *, int *)
END_EXCLUDE_LIST
# If an include list is specified, the routines in the list will be the only
# routines that are instrumented.
# To specify an include list (a list of routines that will be instrumented)
# remove the leading # to uncomment the following lines
#BEGIN_INCLUDE_LIST
#int main(int, char **)
#int select_
#END_INCLUDE_LIST
The TAU Performance System Cray Presentation, Berkeley, CA 8/5/0323
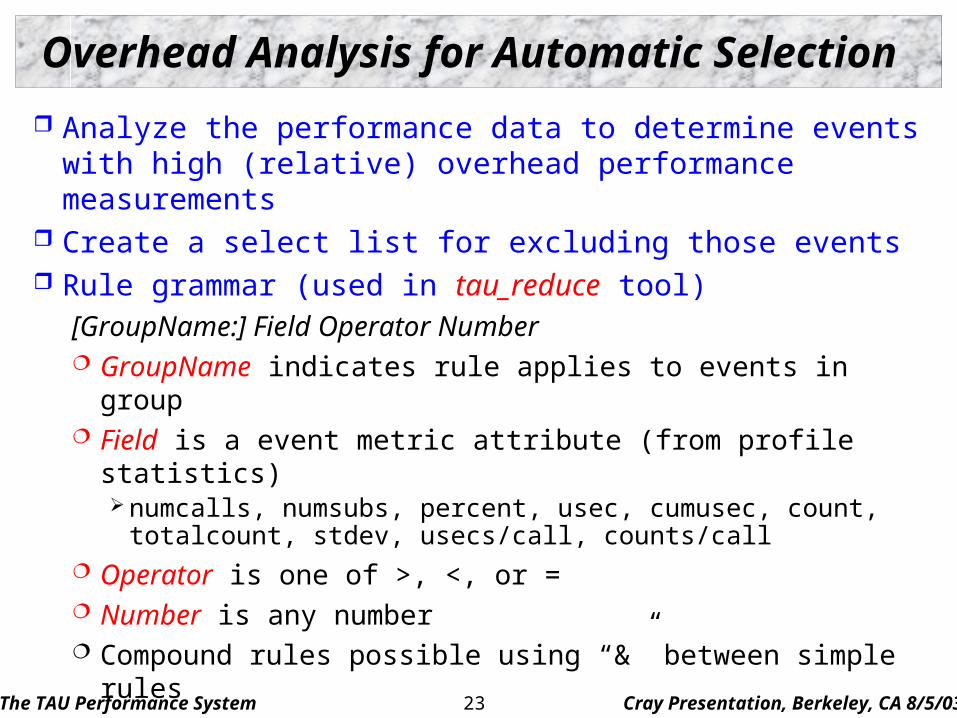
Overhead Analysis for Automatic Selection
Analyze the performance data to determine events with high (relative) overhead performance measurements
Create a select list for excluding those events Rule grammar (used in tau_reduce tool)
[GroupName:] Field Operator Number GroupName indicates rule applies to events in group Field is a event metric attribute (from profile statistics)
numcalls, numsubs, percent, usec, cumusec, count, totalcount, stdev, usecs/call, counts/call
Operator is one of >, <, or = Number is any number Compound rules possible using “&” between simple rules
The TAU Performance System Cray Presentation, Berkeley, CA 8/5/0324
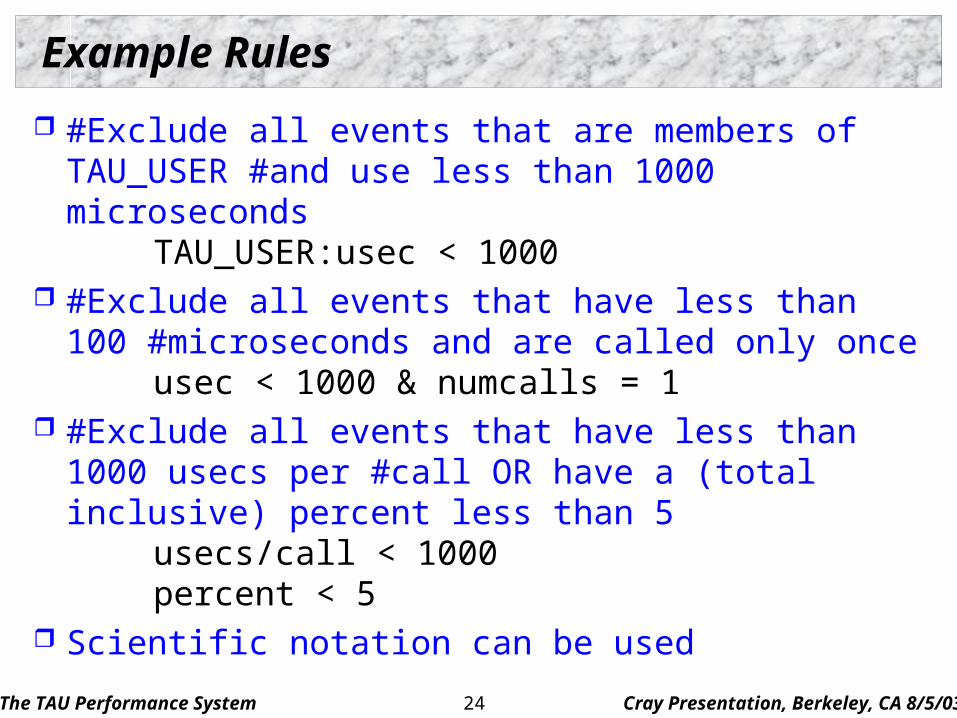
Example Rules
#Exclude all events that are members of TAU_USER #and use less than 1000 microseconds
TAU_USER:usec < 1000 #Exclude all events that have less than 100
#microseconds and are called only onceusec < 1000 & numcalls = 1
#Exclude all events that have less than 1000 usecs per #call OR have a (total inclusive) percent less than 5
usecs/call < 1000percent < 5
Scientific notation can be used
The TAU Performance System Cray Presentation, Berkeley, CA 8/5/0325
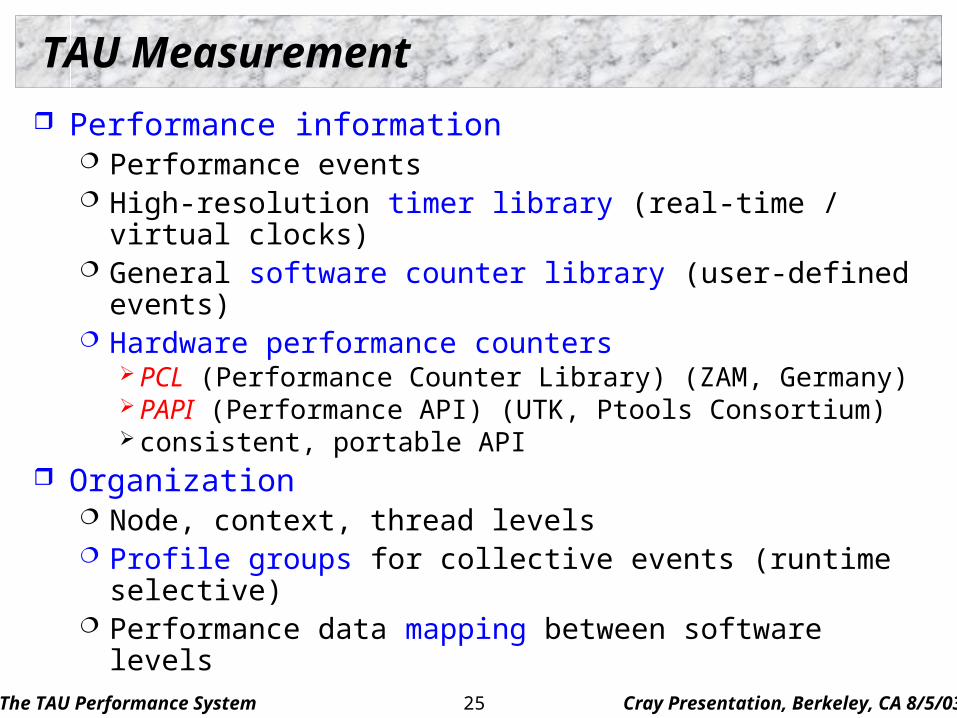
TAU Measurement
Performance information Performance events High-resolution timer library (real-time / virtual clocks) General software counter library (user-defined events) Hardware performance counters
PCL (Performance Counter Library) (ZAM, Germany) PAPI (Performance API) (UTK, Ptools Consortium) consistent, portable API
Organization Node, context, thread levels Profile groups for collective events (runtime selective) Performance data mapping between software levels
The TAU Performance System Cray Presentation, Berkeley, CA 8/5/0326
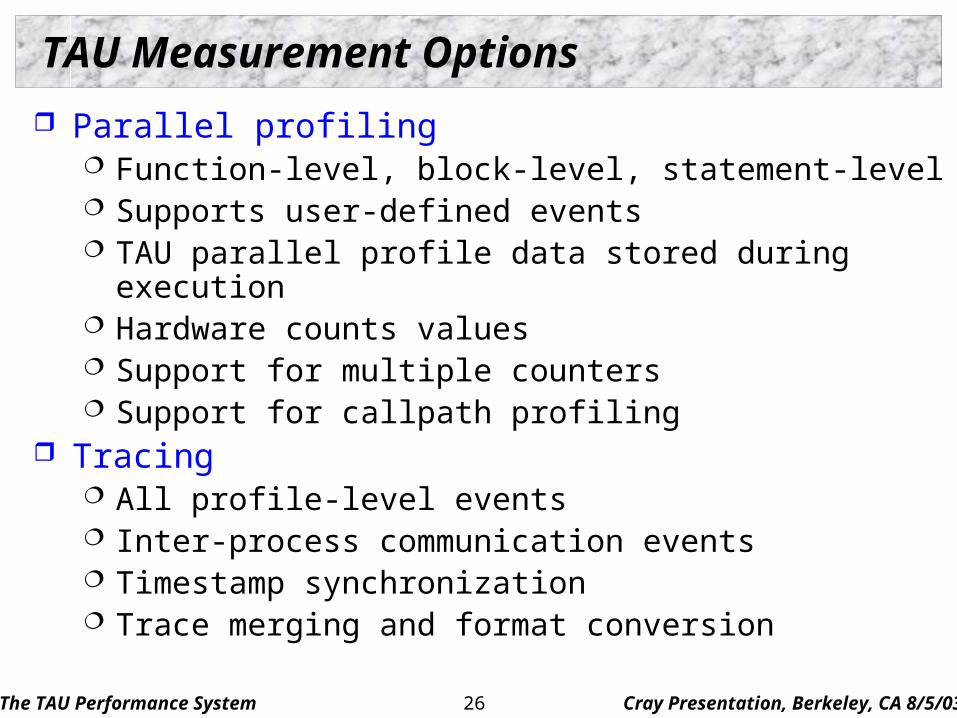
TAU Measurement Options
Parallel profiling Function-level, block-level, statement-level Supports user-defined events TAU parallel profile data stored during execution Hardware counts values Support for multiple counters Support for callpath profiling
Tracing All profile-level events Inter-process communication events Timestamp synchronization Trace merging and format conversion
The TAU Performance System Cray Presentation, Berkeley, CA 8/5/0327
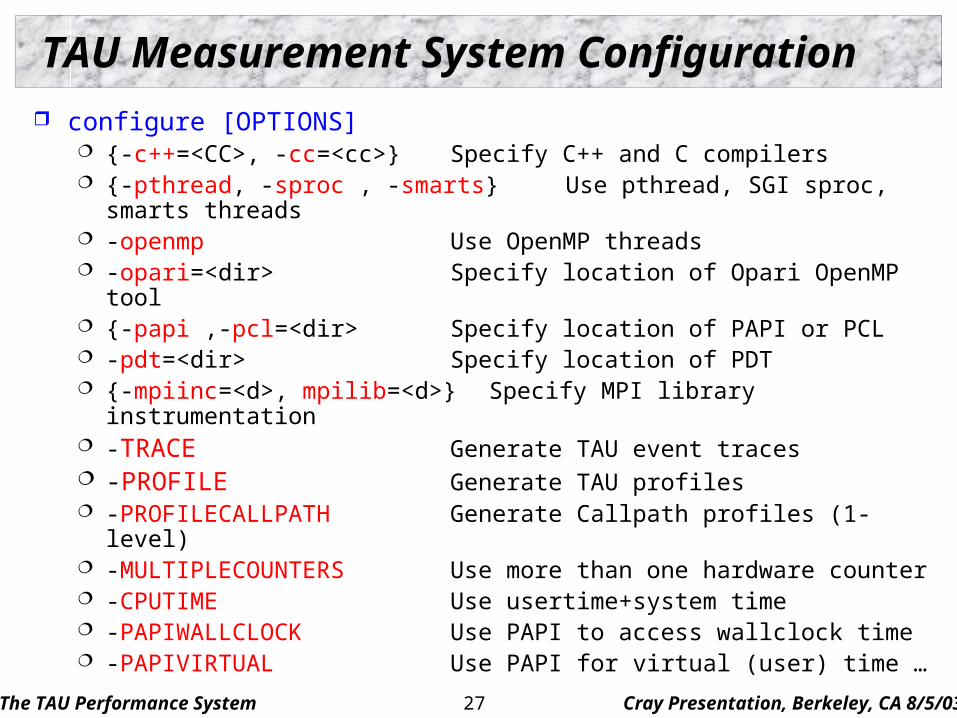
TAU Measurement System Configuration
configure [OPTIONS] {-c++=<CC>, -cc=<cc>} Specify C++ and C compilers {-pthread, -sproc , -smarts} Use pthread, SGI sproc, smarts threads -openmp Use OpenMP threads -opari=<dir> Specify location of Opari OpenMP tool {-papi ,-pcl=<dir> Specify location of PAPI or PCL -pdt=<dir> Specify location of PDT {-mpiinc=<d>, mpilib=<d>} Specify MPI library instrumentation -TRACE Generate TAU event traces -PROFILE Generate TAU profiles -PROFILECALLPATH Generate Callpath profiles (1-level) -MULTIPLECOUNTERS Use more than one hardware counter -CPUTIME Use usertime+system time -PAPIWALLCLOCK Use PAPI to access wallclock time -PAPIVIRTUAL Use PAPI for virtual (user) time …
The TAU Performance System Cray Presentation, Berkeley, CA 8/5/0328
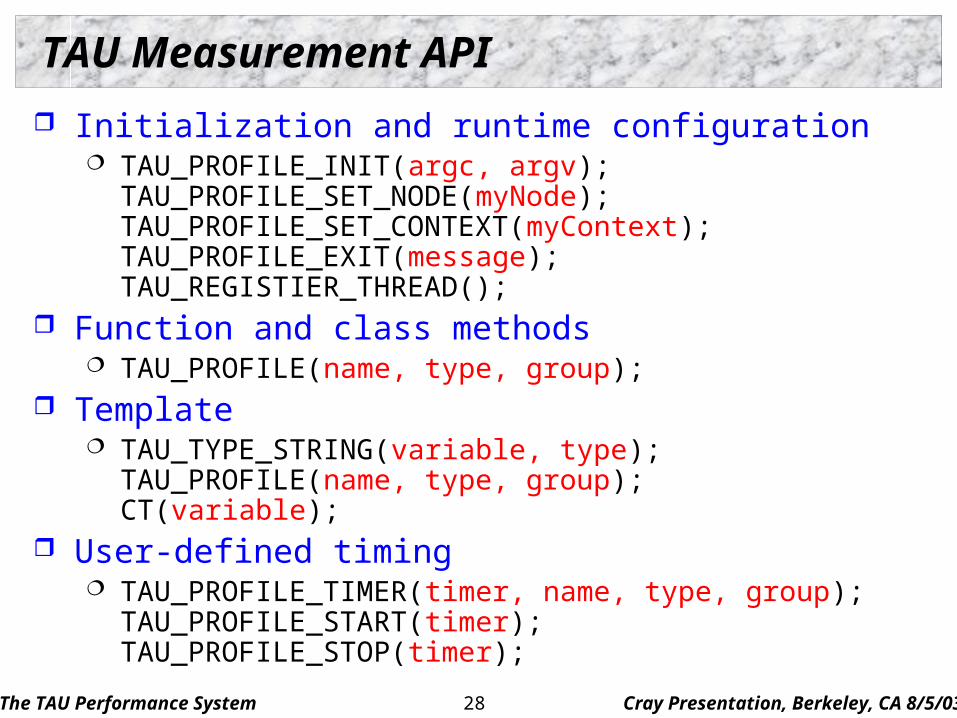
TAU Measurement API
Initialization and runtime configuration TAU_PROFILE_INIT(argc, argv);
TAU_PROFILE_SET_NODE(myNode);TAU_PROFILE_SET_CONTEXT(myContext);TAU_PROFILE_EXIT(message);TAU_REGISTIER_THREAD();
Function and class methods TAU_PROFILE(name, type, group);
Template TAU_TYPE_STRING(variable, type);
TAU_PROFILE(name, type, group);CT(variable);
User-defined timing TAU_PROFILE_TIMER(timer, name, type, group);
TAU_PROFILE_START(timer);TAU_PROFILE_STOP(timer);
The TAU Performance System Cray Presentation, Berkeley, CA 8/5/0329
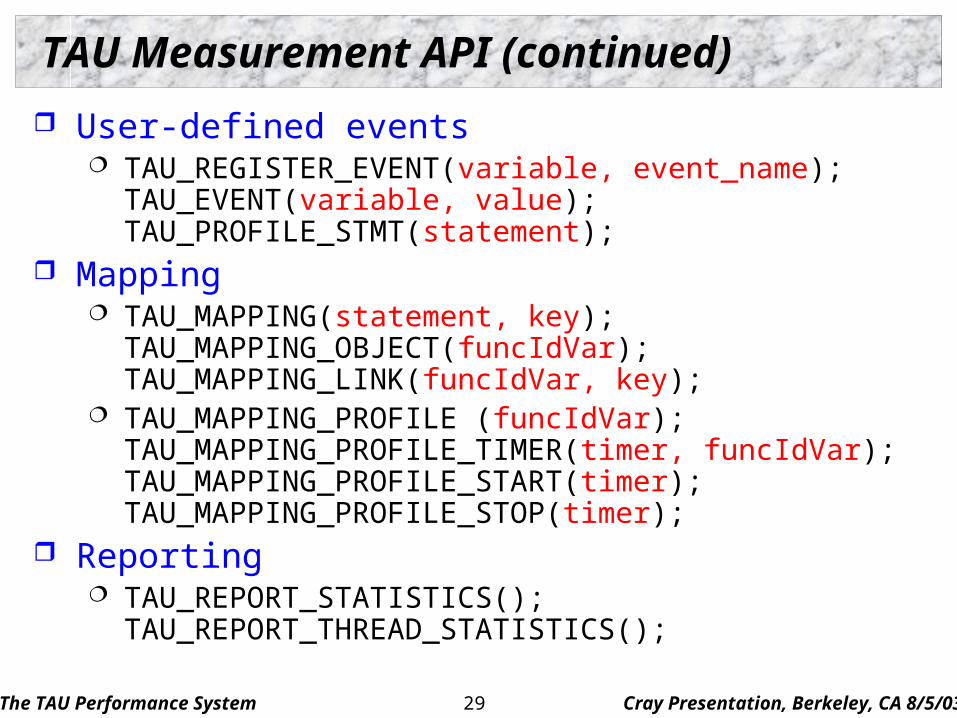
TAU Measurement API (continued)
User-defined events TAU_REGISTER_EVENT(variable, event_name);
TAU_EVENT(variable, value);TAU_PROFILE_STMT(statement);
Mapping TAU_MAPPING(statement, key);
TAU_MAPPING_OBJECT(funcIdVar);TAU_MAPPING_LINK(funcIdVar, key);
TAU_MAPPING_PROFILE (funcIdVar);TAU_MAPPING_PROFILE_TIMER(timer, funcIdVar);TAU_MAPPING_PROFILE_START(timer);TAU_MAPPING_PROFILE_STOP(timer);
Reporting TAU_REPORT_STATISTICS();
TAU_REPORT_THREAD_STATISTICS();
The TAU Performance System Cray Presentation, Berkeley, CA 8/5/0330
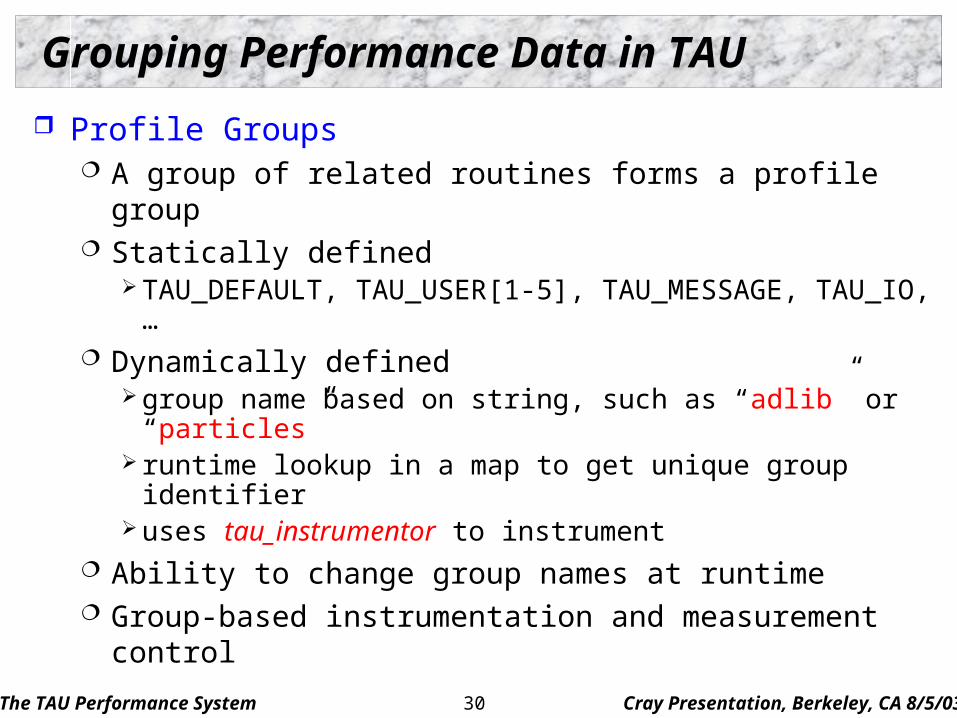
Grouping Performance Data in TAU
Profile Groups A group of related routines forms a profile group Statically defined
TAU_DEFAULT, TAU_USER[1-5], TAU_MESSAGE, TAU_IO, …
Dynamically defined group name based on string, such as “adlib” or “particles” runtime lookup in a map to get unique group identifier uses tau_instrumentor to instrument
Ability to change group names at runtime Group-based instrumentation and measurement control
The TAU Performance System Cray Presentation, Berkeley, CA 8/5/0331
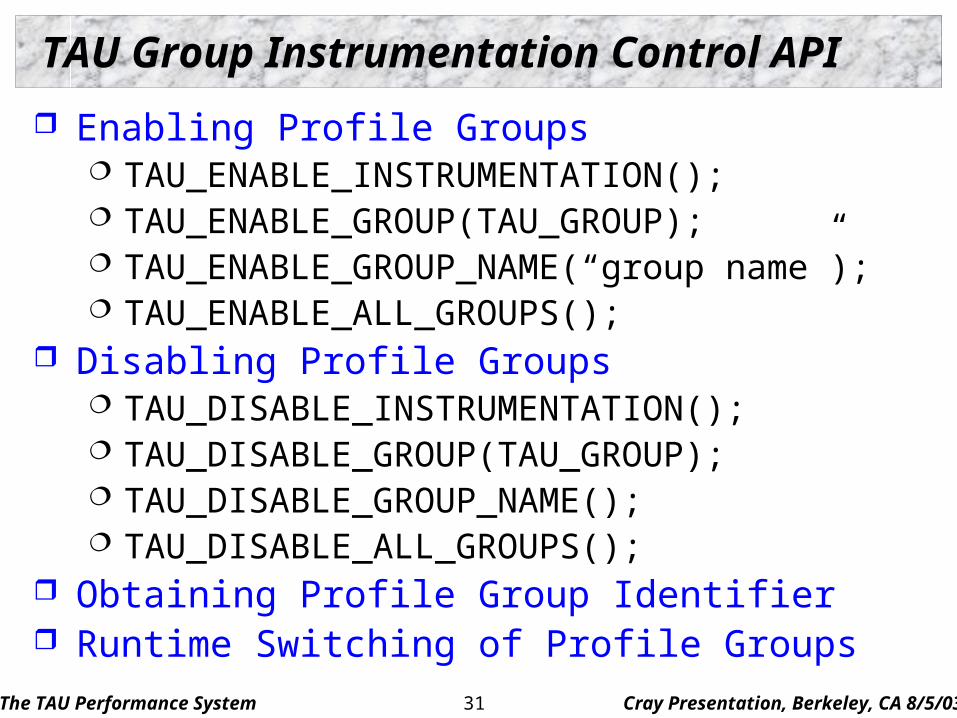
TAU Group Instrumentation Control API
Enabling Profile Groups TAU_ENABLE_INSTRUMENTATION(); TAU_ENABLE_GROUP(TAU_GROUP); TAU_ENABLE_GROUP_NAME(“group name”); TAU_ENABLE_ALL_GROUPS();
Disabling Profile Groups TAU_DISABLE_INSTRUMENTATION(); TAU_DISABLE_GROUP(TAU_GROUP); TAU_DISABLE_GROUP_NAME(); TAU_DISABLE_ALL_GROUPS();
Obtaining Profile Group Identifier Runtime Switching of Profile Groups
The TAU Performance System Cray Presentation, Berkeley, CA 8/5/0332
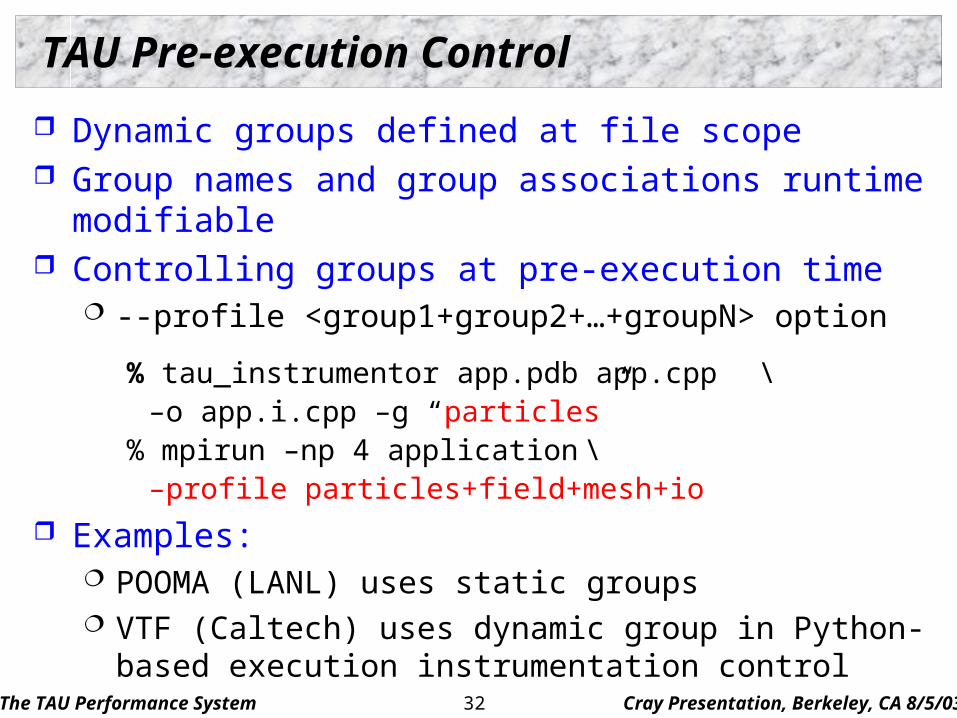
TAU Pre-execution Control
Dynamic groups defined at file scope Group names and group associations runtime modifiable Controlling groups at pre-execution time
--profile <group1+group2+…+groupN> option
% tau_instrumentor app.pdb app.cpp \–o app.i.cpp –g “particles”
% mpirun –np 4 application \–profile particles+field+mesh+io
Examples: POOMA (LANL) uses static groups VTF (Caltech) uses dynamic group in Python-based
execution instrumentation control
The TAU Performance System Cray Presentation, Berkeley, CA 8/5/0333
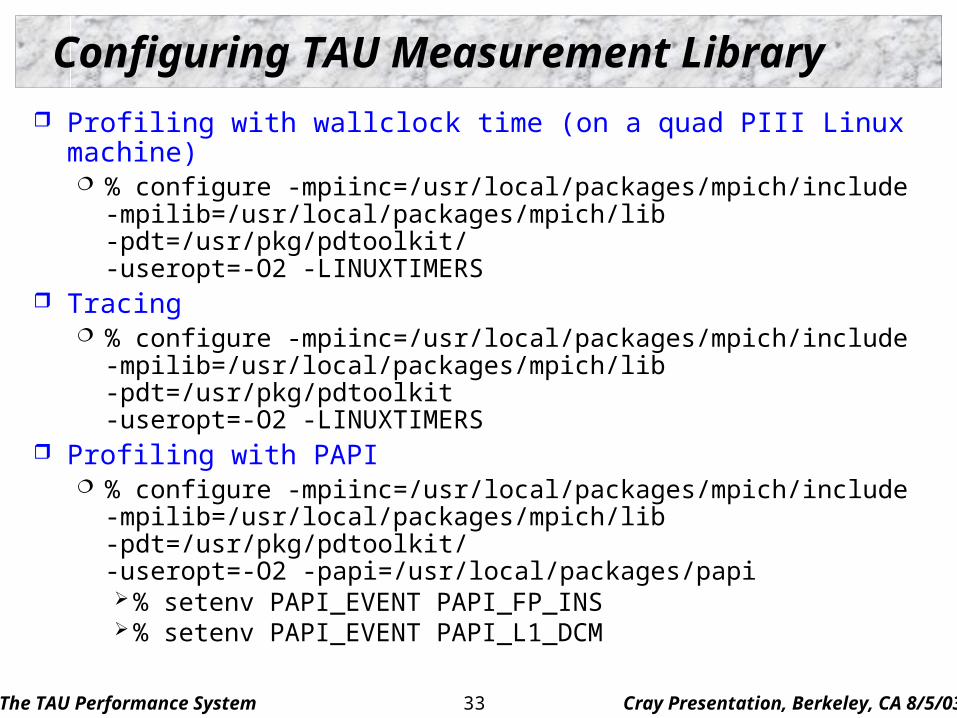
Configuring TAU Measurement Library
Profiling with wallclock time (on a quad PIII Linux machine) % configure -mpiinc=/usr/local/packages/mpich/include
-mpilib=/usr/local/packages/mpich/lib -pdt=/usr/pkg/pdtoolkit/ -useropt=-O2 -LINUXTIMERS
Tracing % configure -mpiinc=/usr/local/packages/mpich/include
-mpilib=/usr/local/packages/mpich/lib -pdt=/usr/pkg/pdtoolkit -useropt=-O2 -LINUXTIMERS
Profiling with PAPI % configure -mpiinc=/usr/local/packages/mpich/include
-mpilib=/usr/local/packages/mpich/lib -pdt=/usr/pkg/pdtoolkit/ -useropt=-O2 -papi=/usr/local/packages/papi % setenv PAPI_EVENT PAPI_FP_INS % setenv PAPI_EVENT PAPI_L1_DCM
The TAU Performance System Cray Presentation, Berkeley, CA 8/5/0334
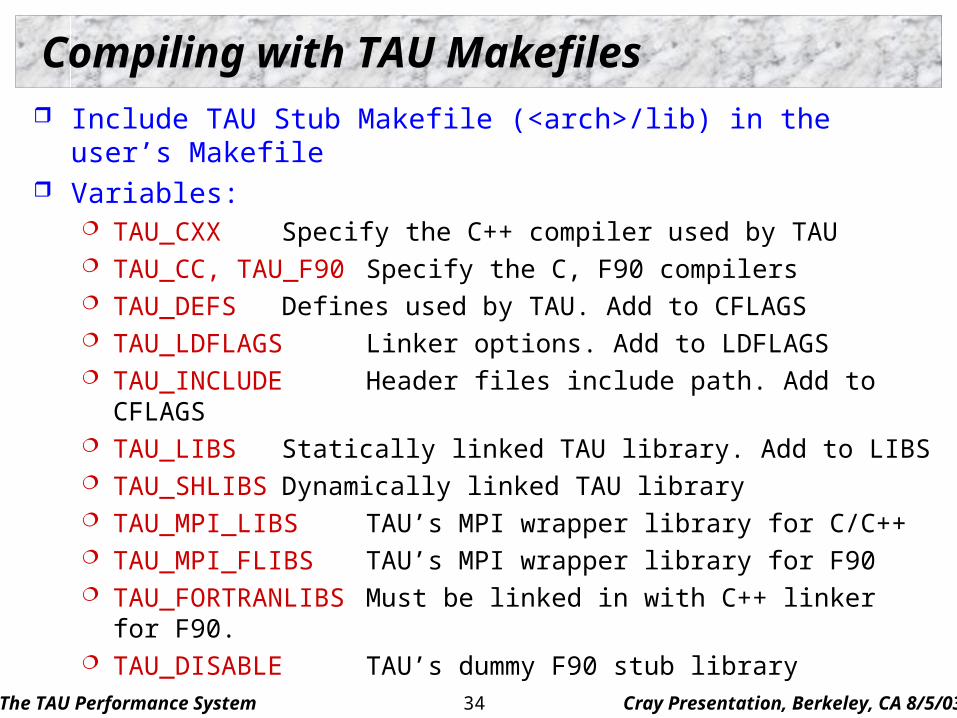
Compiling with TAU Makefiles Include TAU Stub Makefile (<arch>/lib) in the user’s Makefile Variables:
TAU_CXX Specify the C++ compiler used by TAU TAU_CC, TAU_F90 Specify the C, F90 compilers TAU_DEFS Defines used by TAU. Add to CFLAGS TAU_LDFLAGS Linker options. Add to LDFLAGS TAU_INCLUDE Header files include path. Add to CFLAGS TAU_LIBS Statically linked TAU library. Add to LIBS TAU_SHLIBS Dynamically linked TAU library TAU_MPI_LIBS TAU’s MPI wrapper library for C/C++ TAU_MPI_FLIBS TAU’s MPI wrapper library for F90 TAU_FORTRANLIBS Must be linked in with C++ linker for F90. TAU_DISABLE TAU’s dummy F90 stub library
The TAU Performance System Cray Presentation, Berkeley, CA 8/5/0335
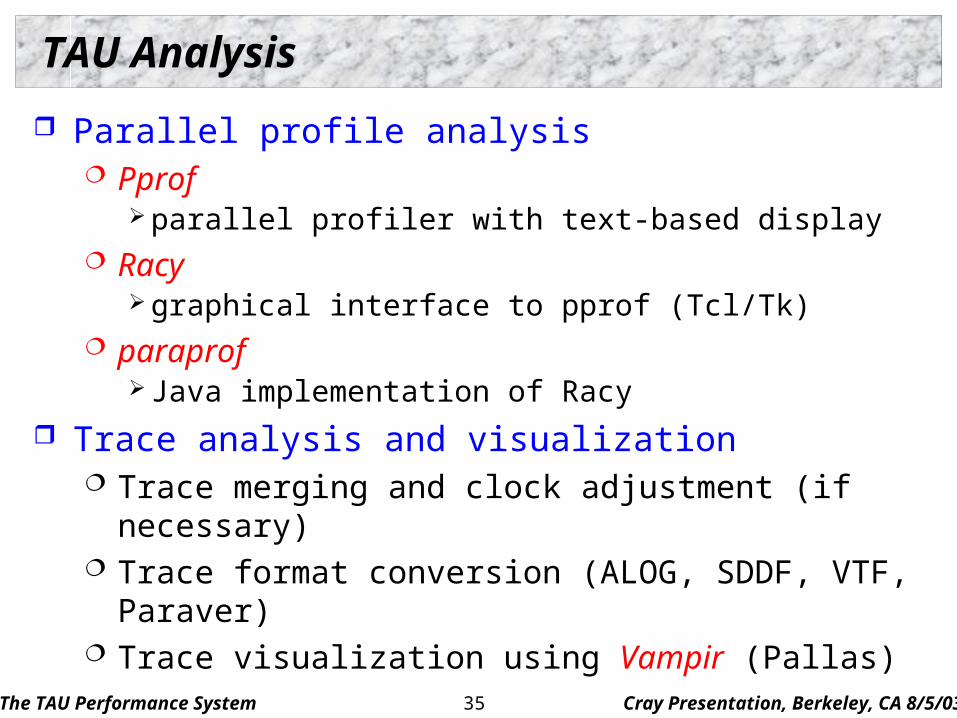
TAU Analysis
Parallel profile analysis Pprof
parallel profiler with text-based display Racy
graphical interface to pprof (Tcl/Tk) paraprof
Java implementation of Racy
Trace analysis and visualization Trace merging and clock adjustment (if necessary) Trace format conversion (ALOG, SDDF, VTF, Paraver) Trace visualization using Vampir (Pallas)
The TAU Performance System Cray Presentation, Berkeley, CA 8/5/0336
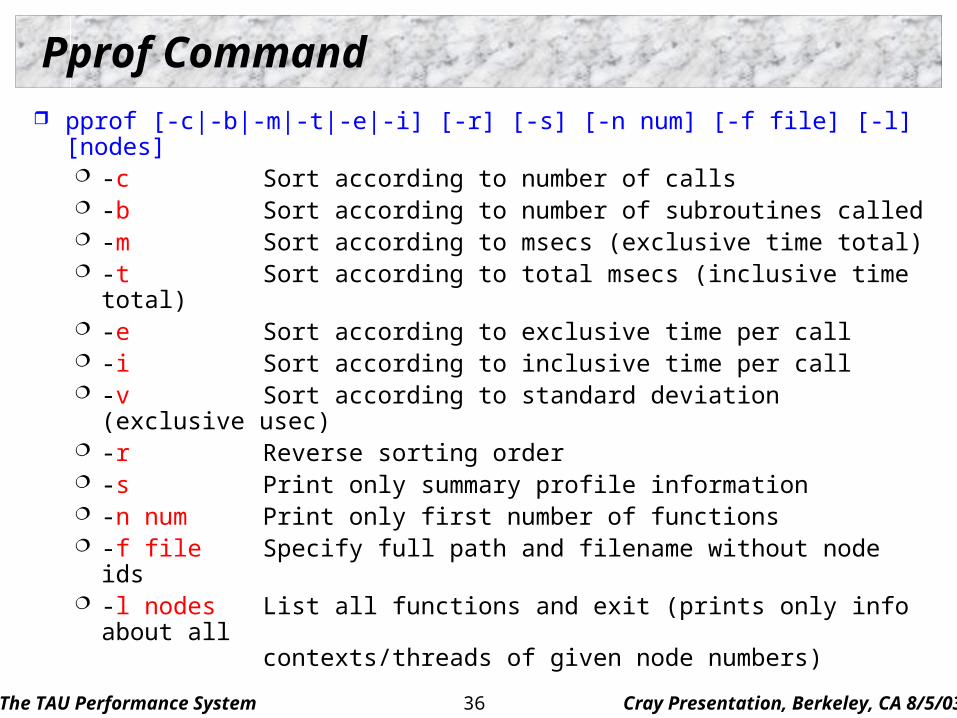
Pprof Command
pprof [-c|-b|-m|-t|-e|-i] [-r] [-s] [-n num] [-f file] [-l] [nodes] -c Sort according to number of calls -b Sort according to number of subroutines called -m Sort according to msecs (exclusive time total) -t Sort according to total msecs (inclusive time total) -e Sort according to exclusive time per call -i Sort according to inclusive time per call -v Sort according to standard deviation (exclusive
usec) -r Reverse sorting order -s Print only summary profile information -n num Print only first number of functions -f file Specify full path and filename without node ids -l nodes List all functions and exit (prints only info about all
contexts/threads of given node numbers)
The TAU Performance System Cray Presentation, Berkeley, CA 8/5/0337
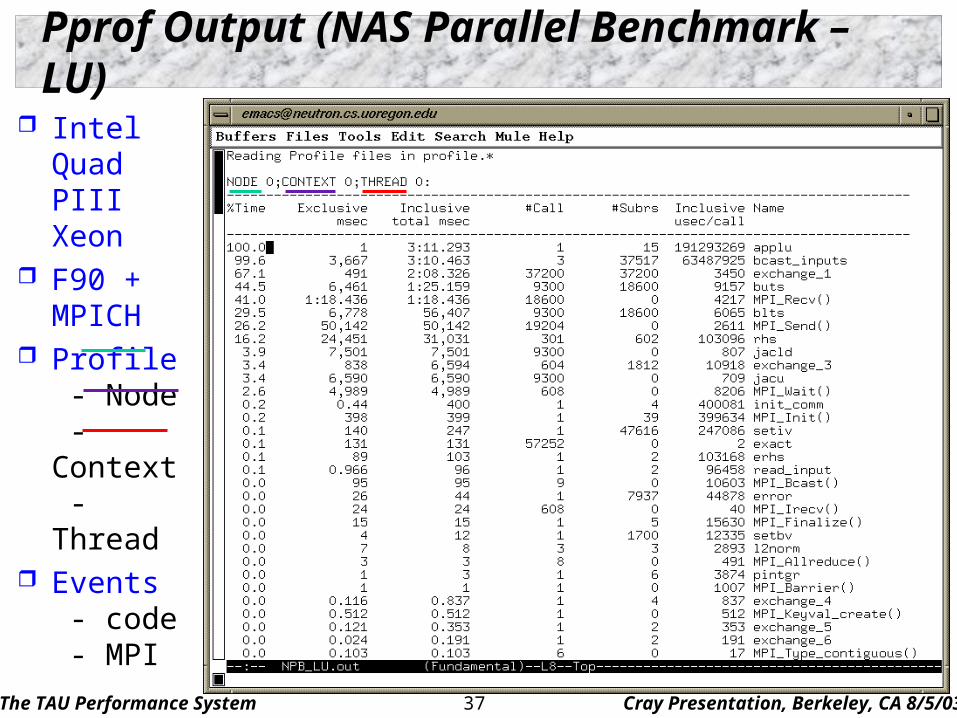
Pprof Output (NAS Parallel Benchmark – LU)
Intel QuadPIII Xeon
F90 + MPICH
Profile - Node - Context - Thread
Events - code - MPI
The TAU Performance System Cray Presentation, Berkeley, CA 8/5/0338
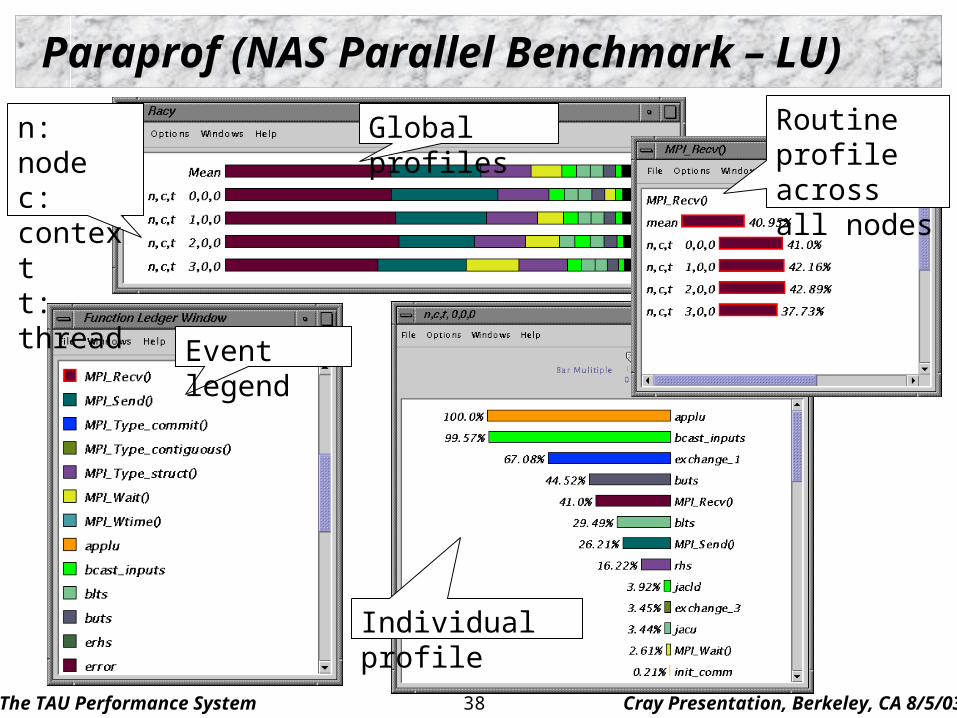
Paraprof (NAS Parallel Benchmark – LU)
n: nodec: contextt: thread
Global profiles Routine profile across all nodes
Event legend
Individual profile
The TAU Performance System Cray Presentation, Berkeley, CA 8/5/0339
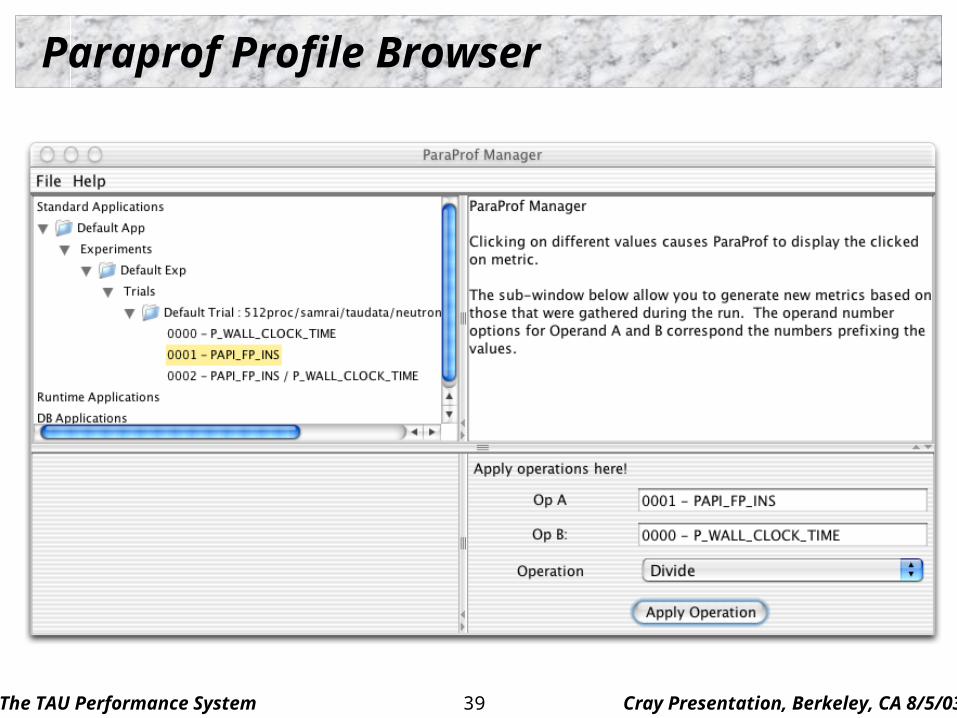
Paraprof Profile Browser
The TAU Performance System Cray Presentation, Berkeley, CA 8/5/0340
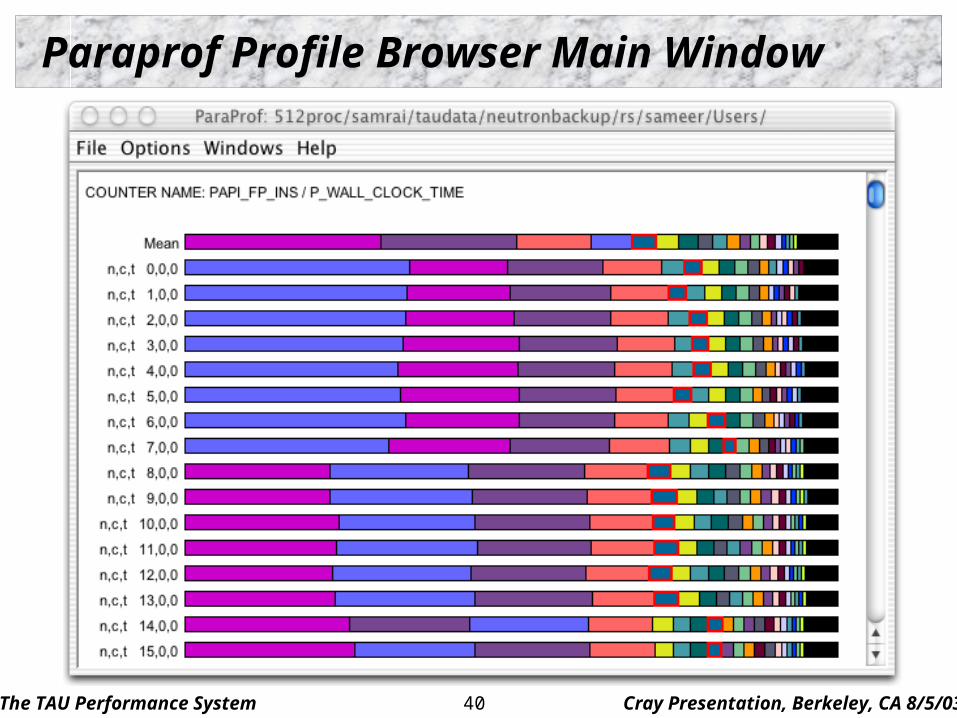
Paraprof Profile Browser Main Window
The TAU Performance System Cray Presentation, Berkeley, CA 8/5/0341
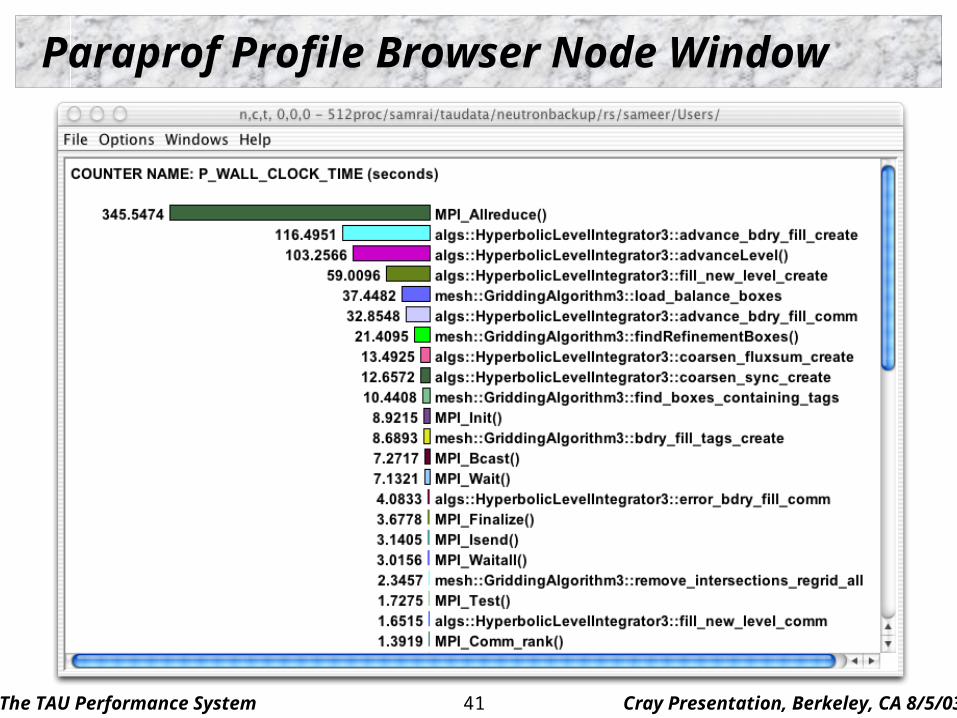
Paraprof Profile Browser Node Window
The TAU Performance System Cray Presentation, Berkeley, CA 8/5/0342
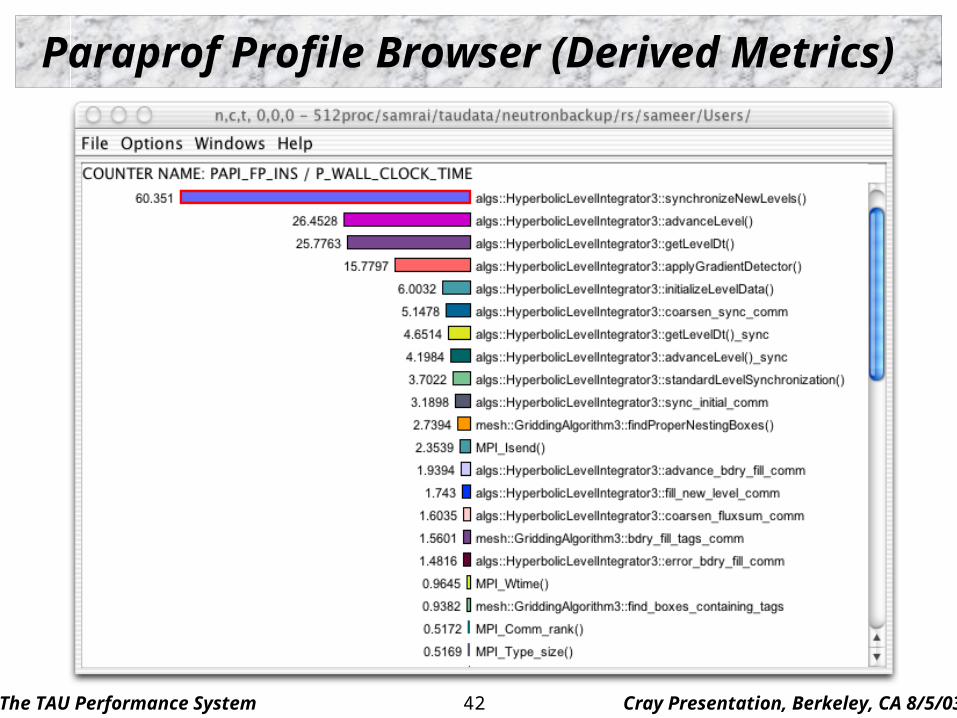
Paraprof Profile Browser (Derived Metrics)
The TAU Performance System Cray Presentation, Berkeley, CA 8/5/0343
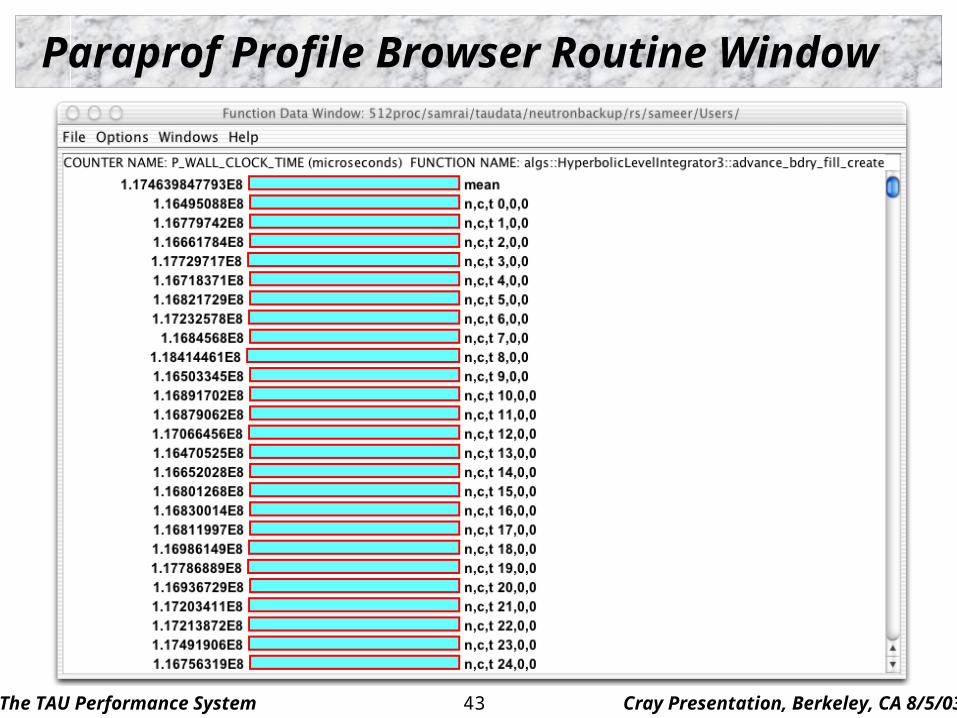
Paraprof Profile Browser Routine Window
The TAU Performance System Cray Presentation, Berkeley, CA 8/5/0344
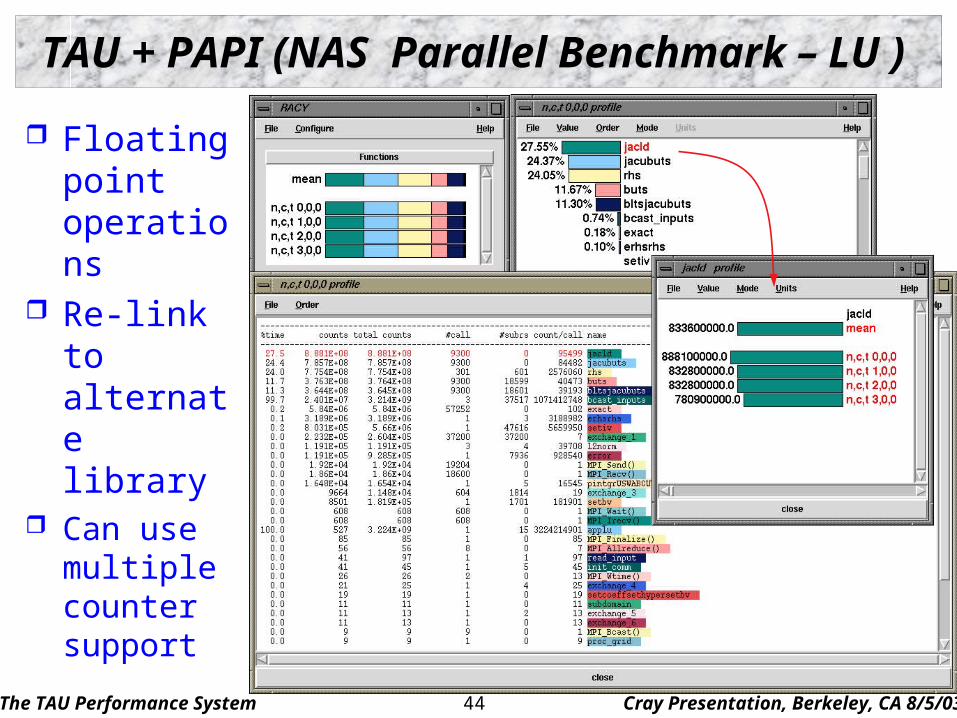
TAU + PAPI (NAS Parallel Benchmark – LU )
Floating point operations
Re-link to alternate library
Can use multiple counter support
The TAU Performance System Cray Presentation, Berkeley, CA 8/5/0345
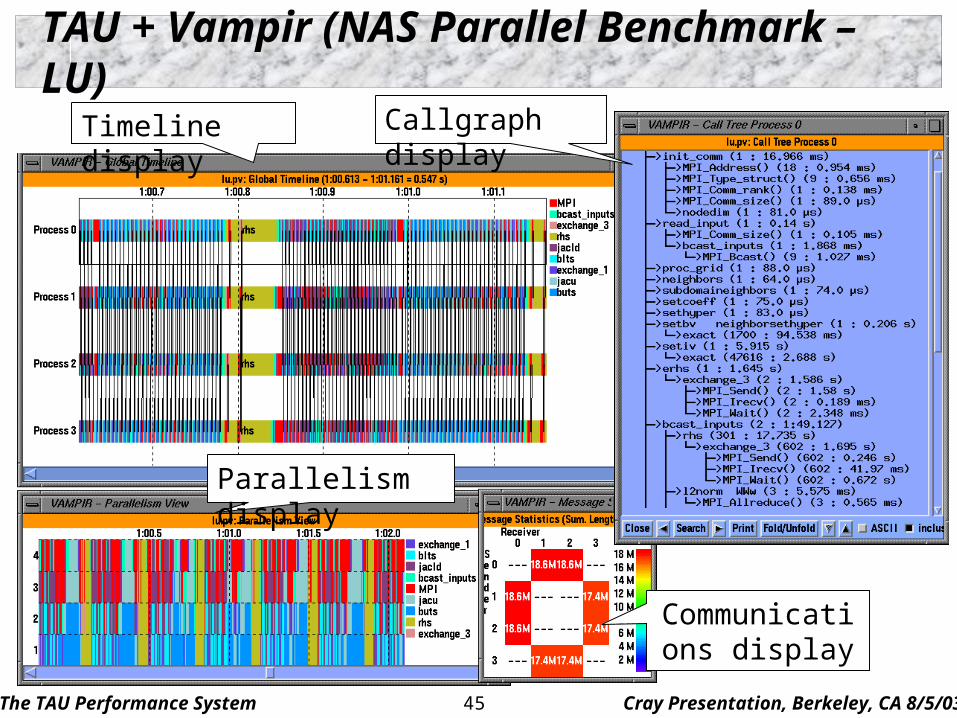
TAU + Vampir (NAS Parallel Benchmark – LU)
Timeline display Callgraph display
Parallelism display
Communications display
The TAU Performance System Cray Presentation, Berkeley, CA 8/5/0346
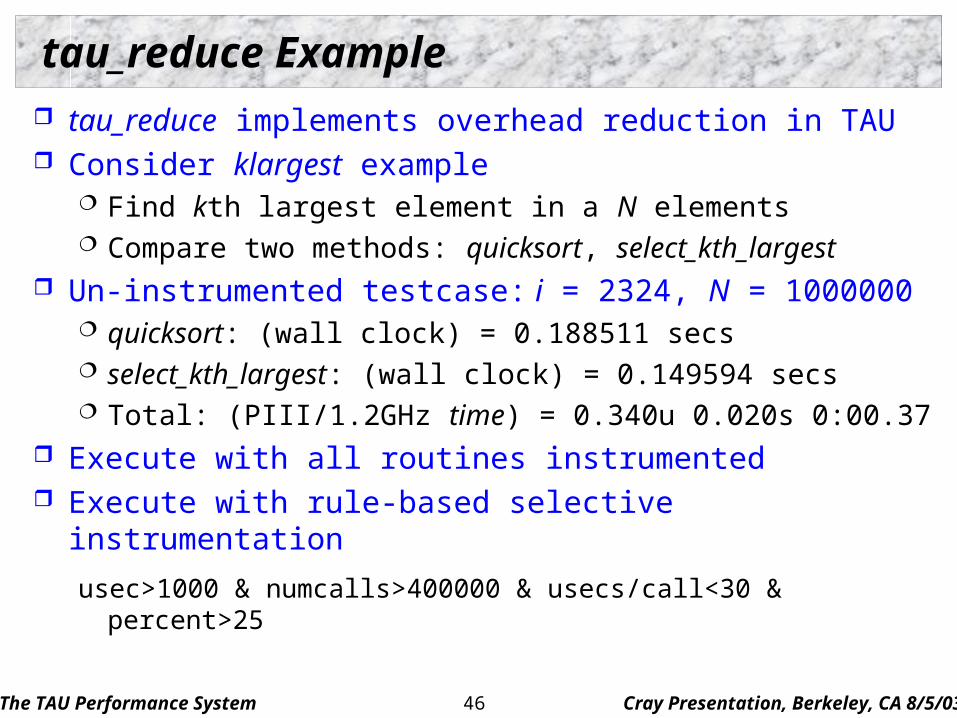
tau_reduce Example
tau_reduce implements overhead reduction in TAU Consider klargest example
Find kth largest element in a N elements Compare two methods: quicksort, select_kth_largest
Un-instrumented testcase: i = 2324, N = 1000000 quicksort: (wall clock) = 0.188511 secs select_kth_largest: (wall clock) = 0.149594 secs Total: (PIII/1.2GHz time) = 0.340u 0.020s 0:00.37
Execute with all routines instrumented Execute with rule-based selective instrumentation
usec>1000 & numcalls>400000 & usecs/call<30 & percent>25
The TAU Performance System Cray Presentation, Berkeley, CA 8/5/0347
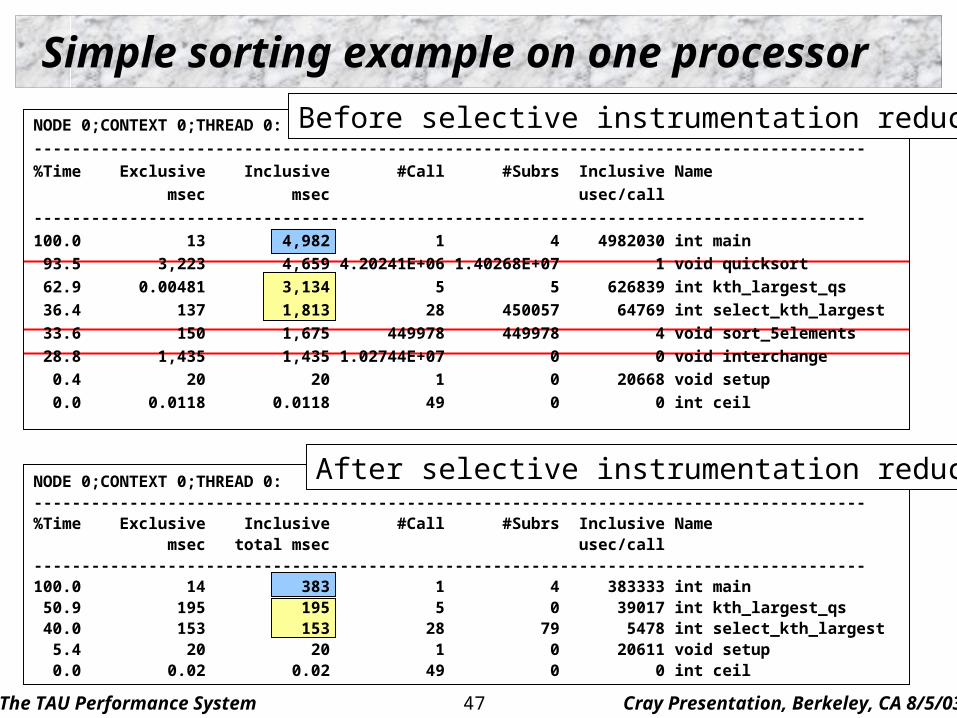
Simple sorting example on one processor
NODE 0;CONTEXT 0;THREAD 0:
---------------------------------------------------------------------------------------
%Time Exclusive Inclusive #Call #Subrs Inclusive Name
msec msec usec/call
---------------------------------------------------------------------------------------
100.0 13 4,982 1 4 4982030 int main
93.5 3,223 4,659 4.20241E+06 1.40268E+07 1 void quicksort
62.9 0.00481 3,134 5 5 626839 int kth_largest_qs
36.4 137 1,813 28 450057 64769 int select_kth_largest
33.6 150 1,675 449978 449978 4 void sort_5elements
28.8 1,435 1,435 1.02744E+07 0 0 void interchange
0.4 20 20 1 0 20668 void setup
0.0 0.0118 0.0118 49 0 0 int ceil
Before selective instrumentation reduction
NODE 0;CONTEXT 0;THREAD 0:---------------------------------------------------------------------------------------%Time Exclusive Inclusive #Call #Subrs Inclusive Name msec total msec usec/call---------------------------------------------------------------------------------------100.0 14 383 1 4 383333 int main 50.9 195 195 5 0 39017 int kth_largest_qs 40.0 153 153 28 79 5478 int select_kth_largest 5.4 20 20 1 0 20611 void setup 0.0 0.02 0.02 49 0 0 int ceil
After selective instrumentation reduction
The TAU Performance System Cray Presentation, Berkeley, CA 8/5/0348
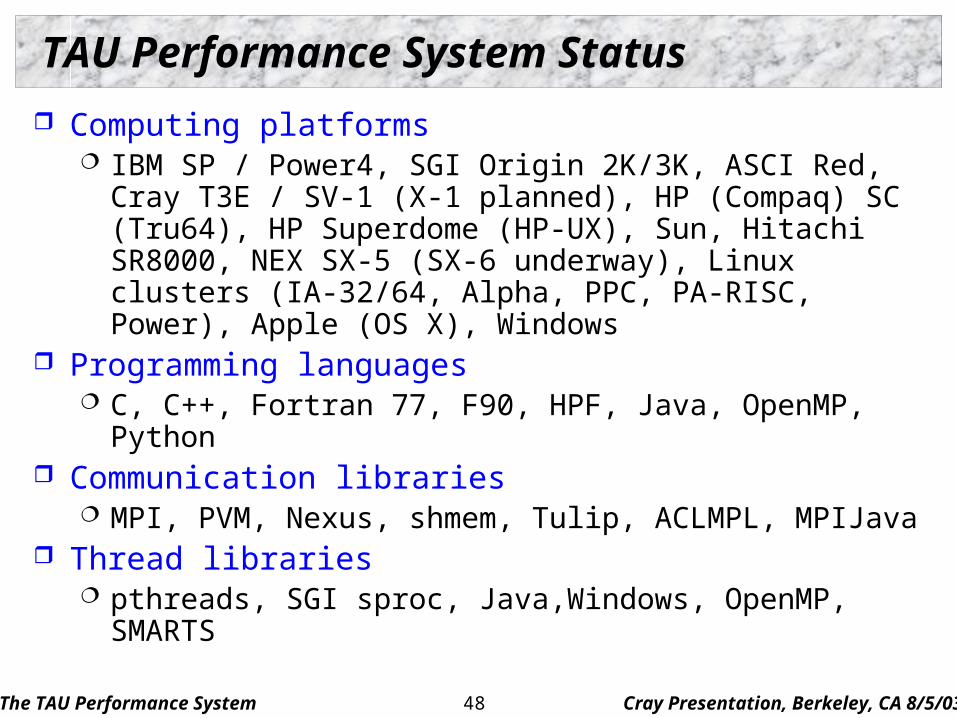
TAU Performance System Status
Computing platforms IBM SP / Power4, SGI Origin 2K/3K, ASCI Red, Cray
T3E / SV-1 (X-1 planned), HP (Compaq) SC (Tru64), HP Superdome (HP-UX), Sun, Hitachi SR8000, NEX SX-5 (SX-6 underway), Linux clusters (IA-32/64, Alpha, PPC, PA-RISC, Power), Apple (OS X), Windows
Programming languages C, C++, Fortran 77, F90, HPF, Java, OpenMP, Python
Communication libraries MPI, PVM, Nexus, shmem, Tulip, ACLMPL, MPIJava
Thread libraries pthreads, SGI sproc, Java,Windows, OpenMP, SMARTS
The TAU Performance System Cray Presentation, Berkeley, CA 8/5/0349
TAU Performance System Status (continued)
Compilers Intel KAI (KCC, KAP/Pro), PGI, GNU, Fujitsu, Sun,
Microsoft, SGI, Cray, IBM, Compaq, Hitachi, NEC, Intel Application libraries (selected)
Blitz++, A++/P++, PETSc, SAMRAI, Overture, PAWS Application frameworks (selected)
POOMA, MC++, Conejo, Uintah, VTF, UPS, GrACE Performance projects using TAU
Aurora / SCALEA: ACPC, University of Vienna TAU full distribution (Version 2.12, web download)
TAU performance system toolkit and user’s guide Automatic software installation and examples
The TAU Performance System Cray Presentation, Berkeley, CA 8/5/0350
PDT Status
Program Database Toolkit (Version 2.2, web download) EDG C++ front end (Version 2.45.2) Mutek Fortran 90 front end (Version 2.4.1) C++ and Fortran 90 IL Analyzer DUCTAPE library Standard C++ system header files (KCC Version 4.0f)
PDT-constructed tools TAU instrumentor (C/C++/F90) Program analysis support for SILOON and CHASM
Platforms Same as for TAU with a few exceptions
The TAU Performance System Cray Presentation, Berkeley, CA 8/5/0351
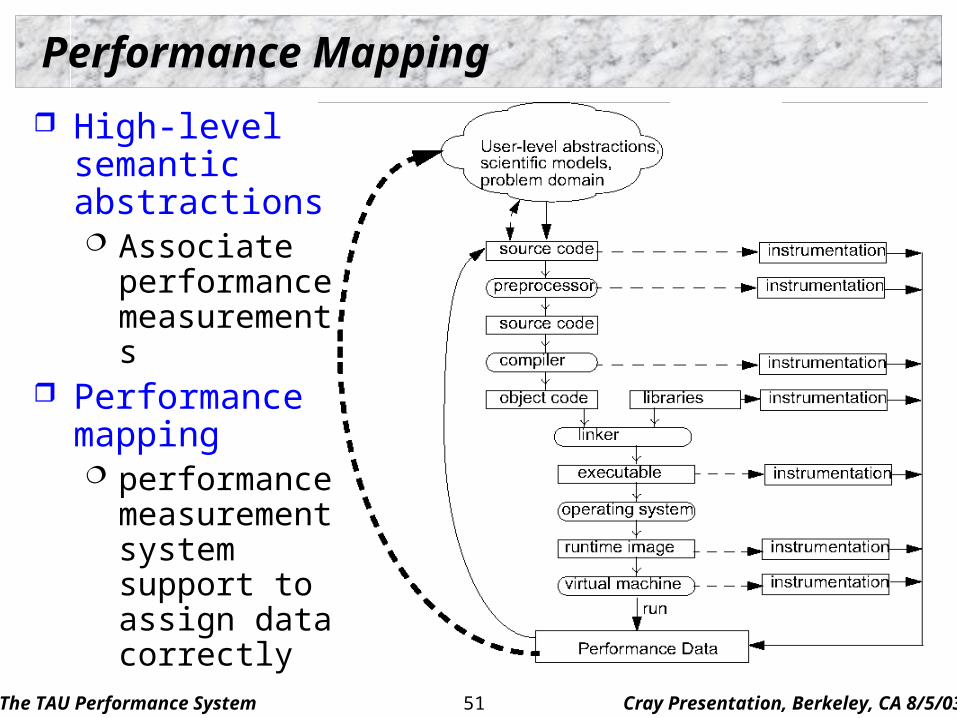
Performance Mapping
High-level semantic abstractions Associate
performance measurements
Performance mapping performance
measurement system support to assign data correctly
The TAU Performance System Cray Presentation, Berkeley, CA 8/5/0352
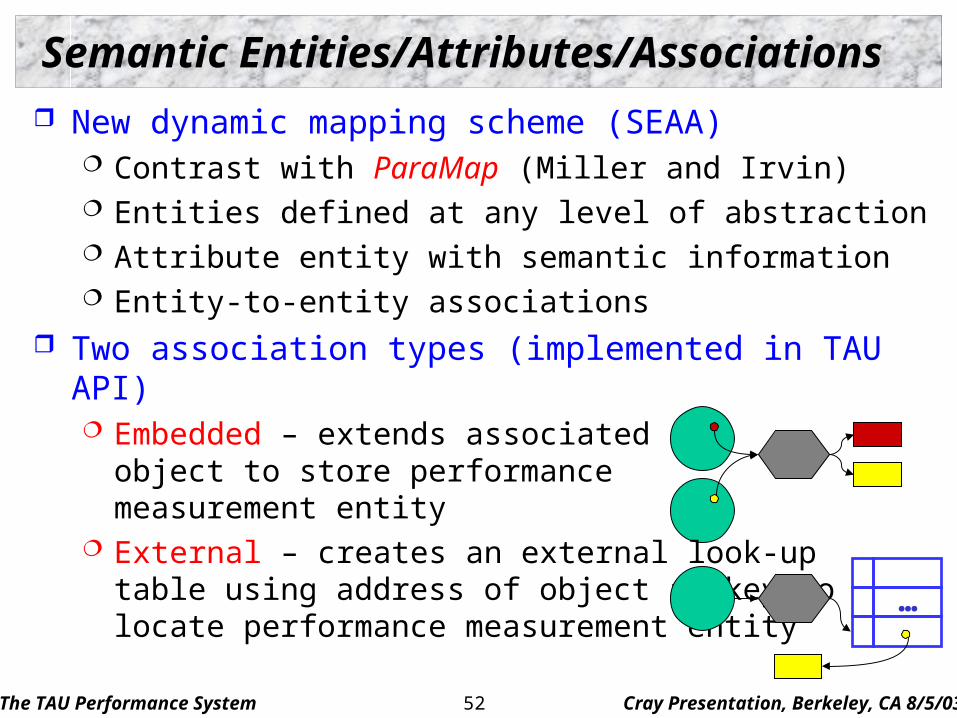
New dynamic mapping scheme (SEAA) Contrast with ParaMap (Miller and Irvin) Entities defined at any level of abstraction Attribute entity with semantic information Entity-to-entity associations
Two association types (implemented in TAU API) Embedded – extends associated
object to store performancemeasurement entity
External – creates an external look-uptable using address of object as key tolocate performance measurement entity
Semantic Entities/Attributes/Associations
…
The TAU Performance System Cray Presentation, Berkeley, CA 8/5/0353
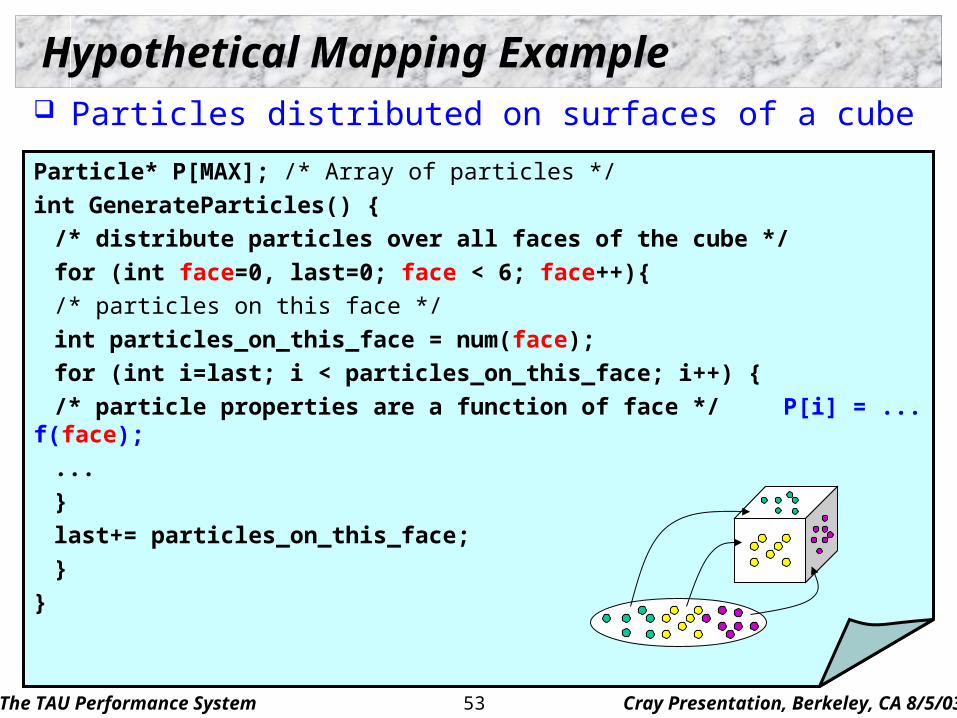
Hypothetical Mapping Example Particles distributed on surfaces of a cubeParticle* P[MAX]; /* Array of particles */
int GenerateParticles() {
/* distribute particles over all faces of the cube */
for (int face=0, last=0; face < 6; face++){
/* particles on this face */
int particles_on_this_face = num(face);
for (int i=last; i < particles_on_this_face; i++) {
/* particle properties are a function of face */ P[i] = ... f(face);
...
}
last+= particles_on_this_face;
}
}
The TAU Performance System Cray Presentation, Berkeley, CA 8/5/0354
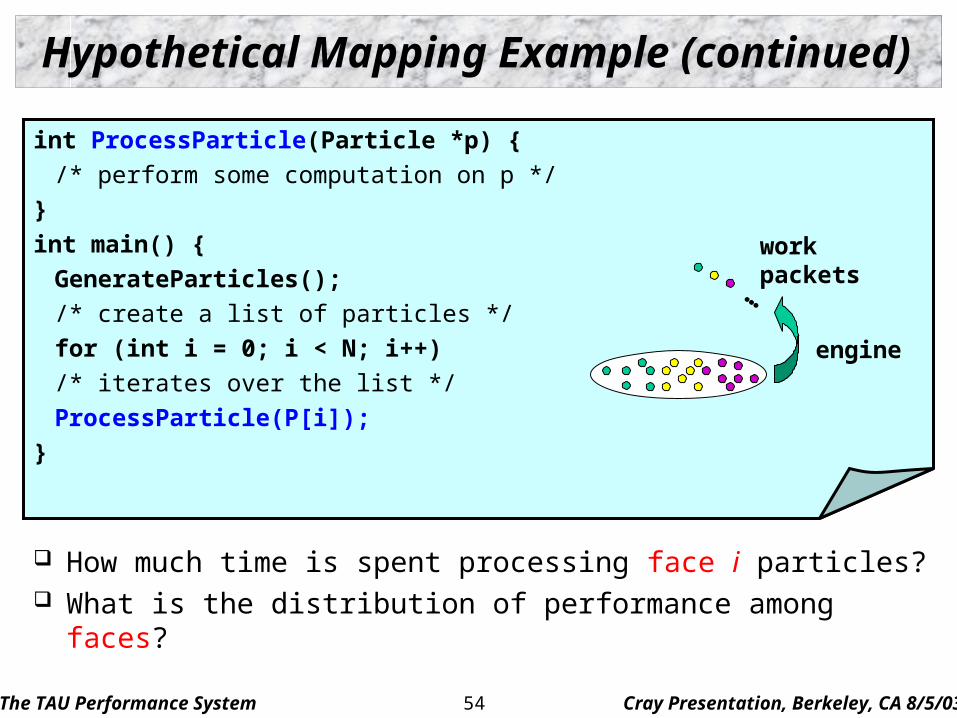
Hypothetical Mapping Example (continued)
How much time is spent processing face i particles? What is the distribution of performance among faces?
int ProcessParticle(Particle *p) {
/* perform some computation on p */
}
int main() {
GenerateParticles();
/* create a list of particles */
for (int i = 0; i < N; i++)
/* iterates over the list */
ProcessParticle(P[i]);
}
…
engine
workpackets
The TAU Performance System Cray Presentation, Berkeley, CA 8/5/0355
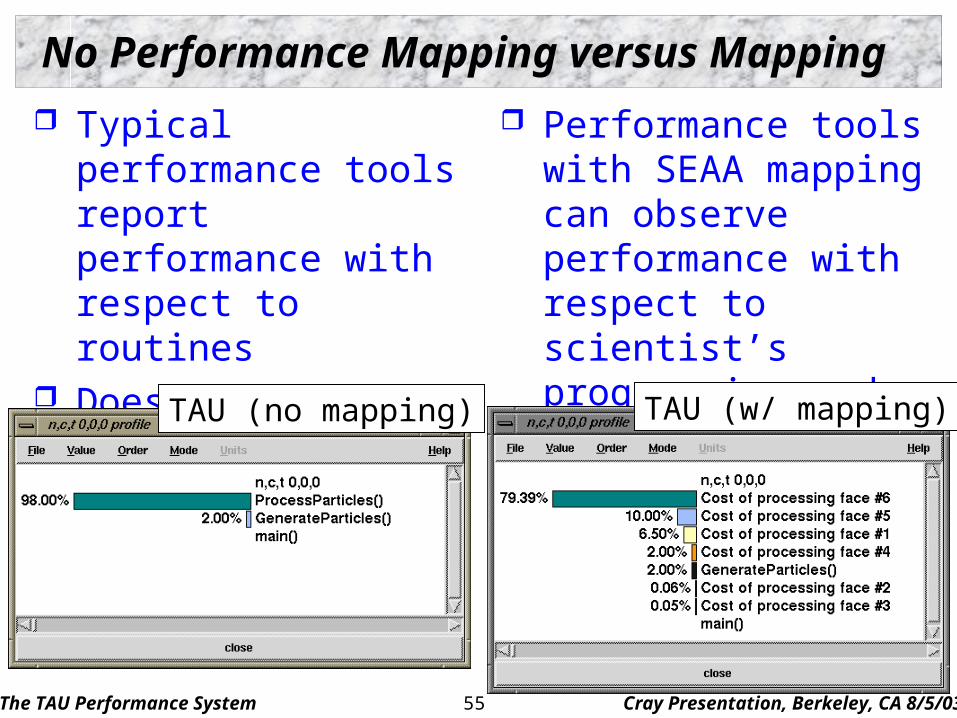
No Performance Mapping versus Mapping
Typical performance tools report performance with respect to routines
Does not provide support for mapping
Performance tools with SEAA mapping can observe performance with respect to scientist’s programming and problem abstractions
TAU (no mapping) TAU (w/ mapping)
The TAU Performance System Cray Presentation, Berkeley, CA 8/5/0356
Performance Mapping in Callpath Profiling
Consider callgraph (callpath) profiling Measure time (metric) along an edge (path) of callgraph
Incident edge gives parent / child view Edge sequence (path) gives parent / descendant view
Callpath profiling when callgraph is unknown Must determine callgraph dynamically at runtime Map performance measurement to dynamic call path state
Callpath levels 0-level: current callgraph node 1-level: immediate parent (descendant) k-level: kth calling parent (call descendant)
The TAU Performance System Cray Presentation, Berkeley, CA 8/5/0357
1-Level Callpath Implementation in TAU
TAU maintains a performance event (routine) callstack Profiled routine (child) looks in callstack for parent
Previous profiled performance event is the parent A callpath profile structure created first time parent calls TAU records parent in a callgraph map for child String representing 1-level callpath used as its key
“a( )=>b( )” : name for time spent in “b” when called by “a” Map returns pointer to callpath profile structure
1-level callpath is profiled using this profiling data Build upon TAU’s performance mapping technology Measurement is independent of instrumentation Use –PROFILECALLPATH to configure TAU
The TAU Performance System Cray Presentation, Berkeley, CA 8/5/0358
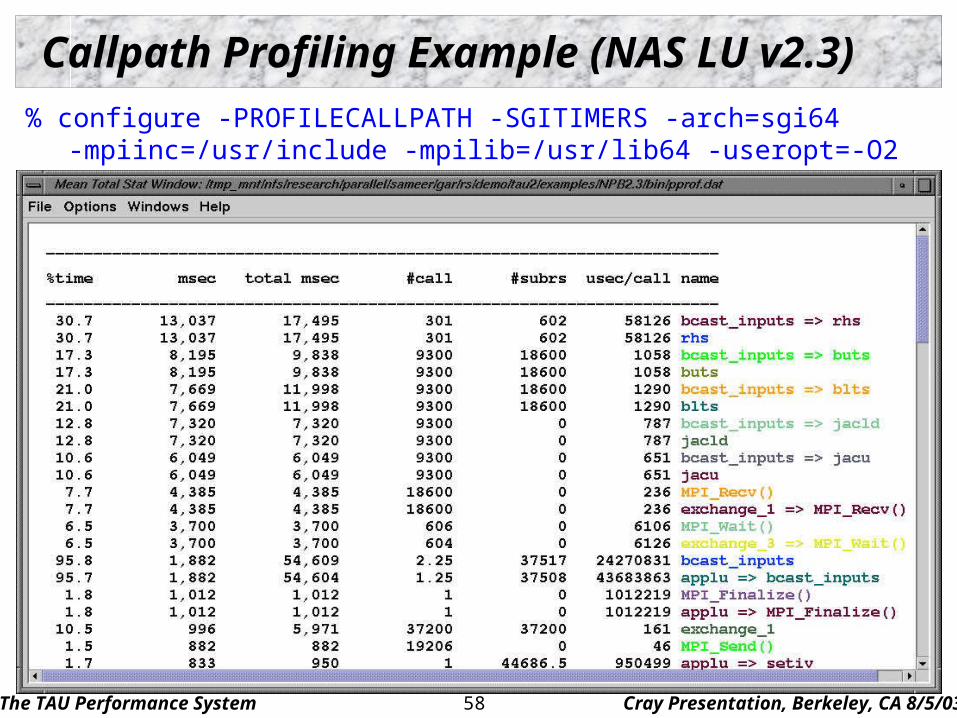
Callpath Profiling Example (NAS LU v2.3)
% configure -PROFILECALLPATH -SGITIMERS -arch=sgi64-mpiinc=/usr/include -mpilib=/usr/lib64 -useropt=-O2
The TAU Performance System Cray Presentation, Berkeley, CA 8/5/0359
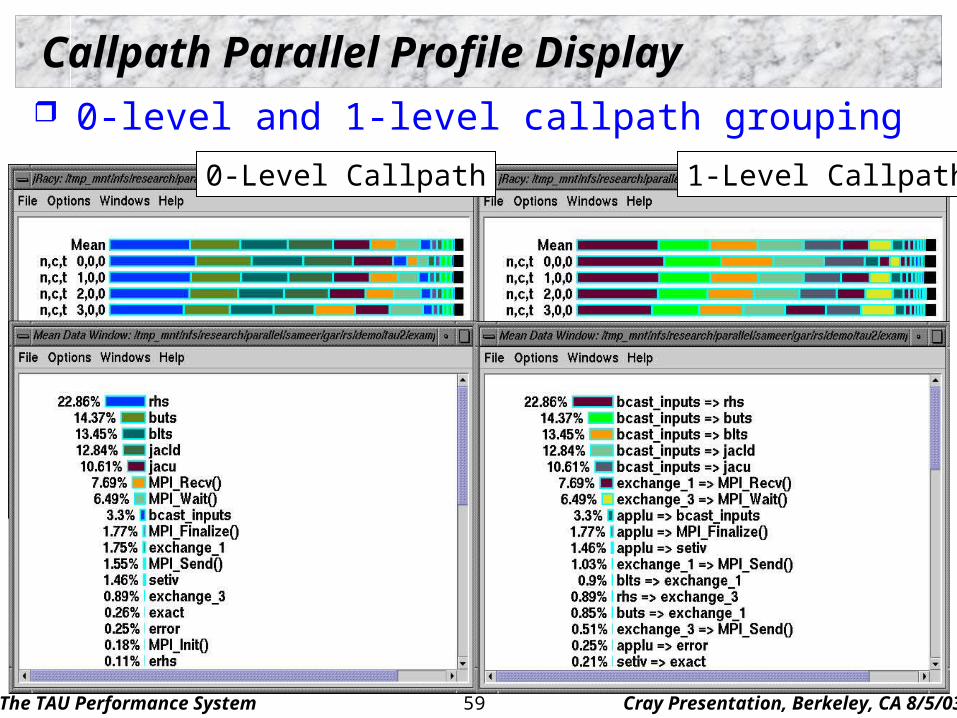
Callpath Parallel Profile Display 0-level and 1-level callpath grouping
1-Level Callpath0-Level Callpath
The TAU Performance System Cray Presentation, Berkeley, CA 8/5/0360
Strategies for Empirical Performance Evaluation
Empirical performance evaluation as a series of performance experiments Experiment trials describing instrumentation and
measurement requirements Where/When/How axes of empirical performance space
where are performance measurements made in program when is performance instrumentation done how are performance measurement/instrumentation chosen
Strategies for achieving flexibility and portability goals Limited performance methods restrict evaluation scope Non-portable methods force use of different techniques Integration and combination of strategies
The TAU Performance System Cray Presentation, Berkeley, CA 8/5/0361
Case Study: SIMPLE Performance Analysis
SIMPLE hydrodynamics benchmark C code with MPI message communication Multiple instrumentation methods
source-to-source translation (PDT) MPI wrapper library level instrumentation (PMPI) pre-execution binary instrumentation (DyninstAPI)
Alternative measurement strategies statistical profiles of software actions statistical profiles of hardware actions (PCL, PAPI) program event tracing choice of time source
gettimeofday, high-res physical, CPU, process virtual
The TAU Performance System Cray Presentation, Berkeley, CA 8/5/0362
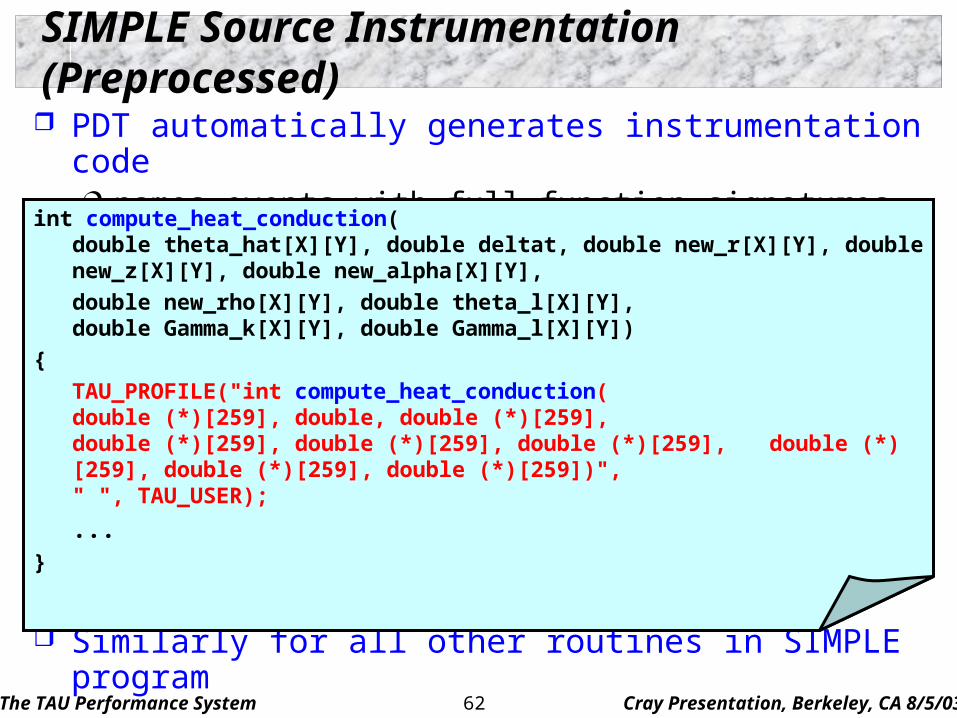
PDT automatically generates instrumentation code names events with full function signatures
Similarly for all other routines in SIMPLE program
SIMPLE Source Instrumentation (Preprocessed)
int compute_heat_conduction(double theta_hat[X][Y], double deltat, double new_r[X][Y], double new_z[X][Y], double new_alpha[X][Y],
double new_rho[X][Y], double theta_l[X][Y],double Gamma_k[X][Y], double Gamma_l[X][Y])
{
TAU_PROFILE("int compute_heat_conduction(double (*)[259], double, double (*)[259],double (*)[259], double (*)[259], double (*)[259],
double (*)[259], double (*)[259], double (*)[259])"," ", TAU_USER);
...}
The TAU Performance System Cray Presentation, Berkeley, CA 8/5/0363
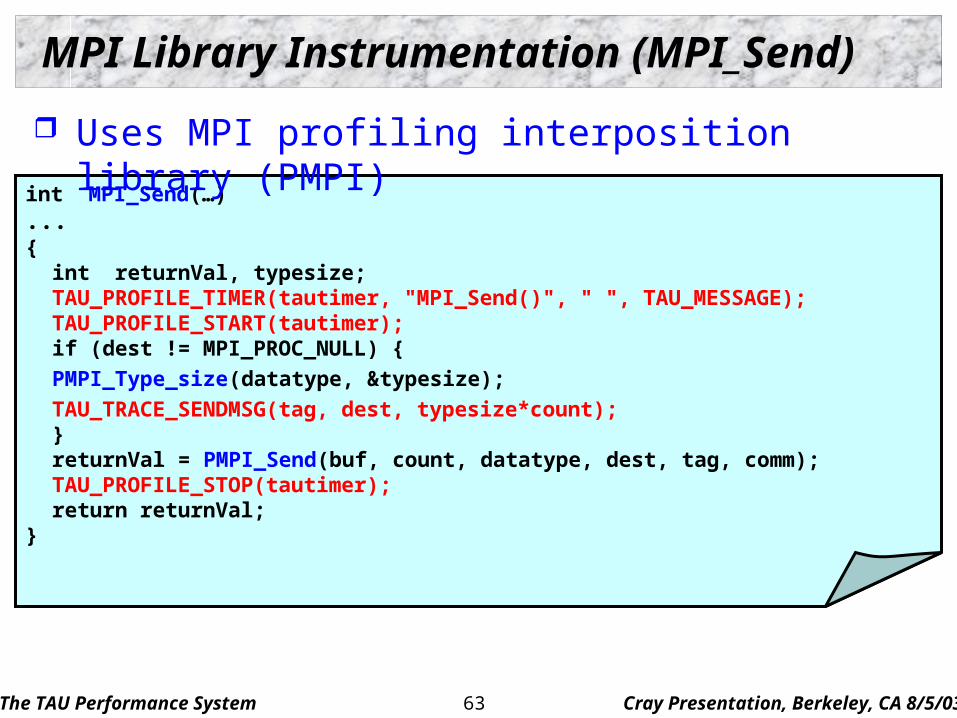
int MPI_Send(…)...{
int returnVal, typesize;TAU_PROFILE_TIMER(tautimer, "MPI_Send()", " ", TAU_MESSAGE);TAU_PROFILE_START(tautimer);if (dest != MPI_PROC_NULL) {
PMPI_Type_size(datatype, &typesize);
TAU_TRACE_SENDMSG(tag, dest, typesize*count);}returnVal = PMPI_Send(buf, count, datatype, dest, tag, comm);TAU_PROFILE_STOP(tautimer); return returnVal;
}
MPI Library Instrumentation (MPI_Send)
Uses MPI profiling interposition library (PMPI)
The TAU Performance System Cray Presentation, Berkeley, CA 8/5/0364
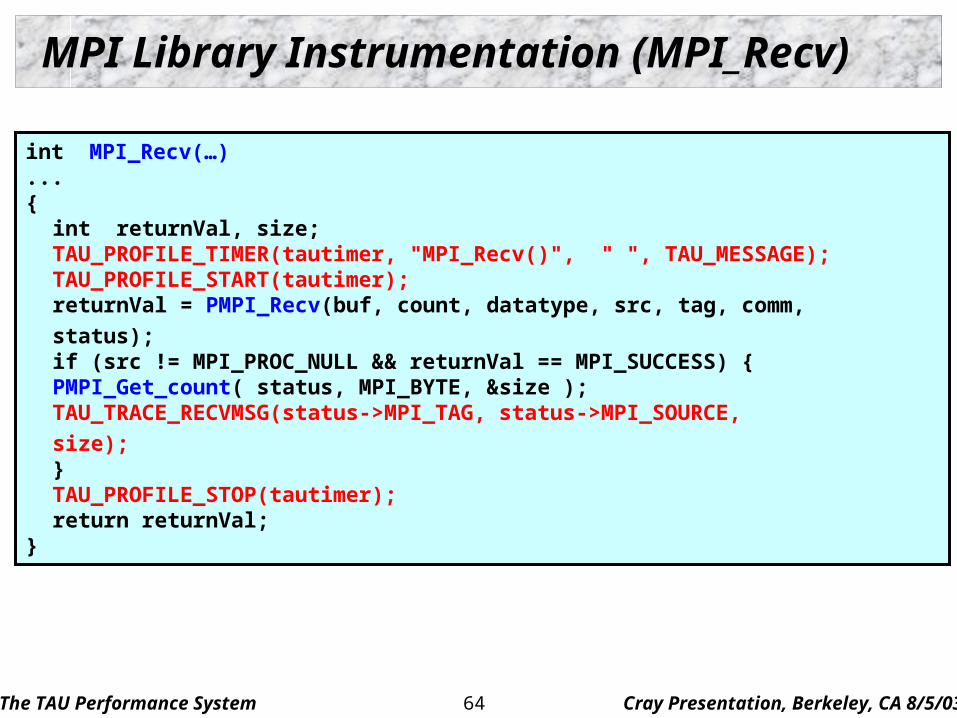
MPI Library Instrumentation (MPI_Recv)
int MPI_Recv(…)...{
int returnVal, size;TAU_PROFILE_TIMER(tautimer, "MPI_Recv()", " ", TAU_MESSAGE);TAU_PROFILE_START(tautimer);returnVal = PMPI_Recv(buf, count, datatype, src, tag, comm,
status);if (src != MPI_PROC_NULL && returnVal == MPI_SUCCESS) {
PMPI_Get_count( status, MPI_BYTE, &size );TAU_TRACE_RECVMSG(status->MPI_TAG, status->MPI_SOURCE,
size);}TAU_PROFILE_STOP(tautimer); return returnVal;
}
The TAU Performance System Cray Presentation, Berkeley, CA 8/5/0365
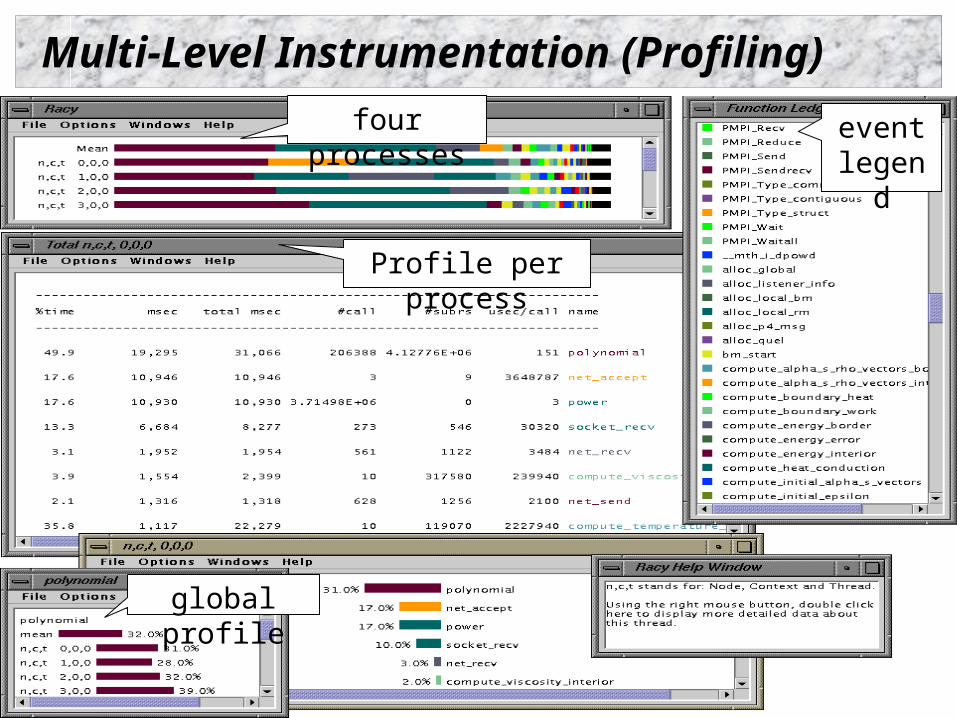
Multi-Level Instrumentation (Profiling)
four processes
Profile per process
global profile
event legend
The TAU Performance System Cray Presentation, Berkeley, CA 8/5/0366
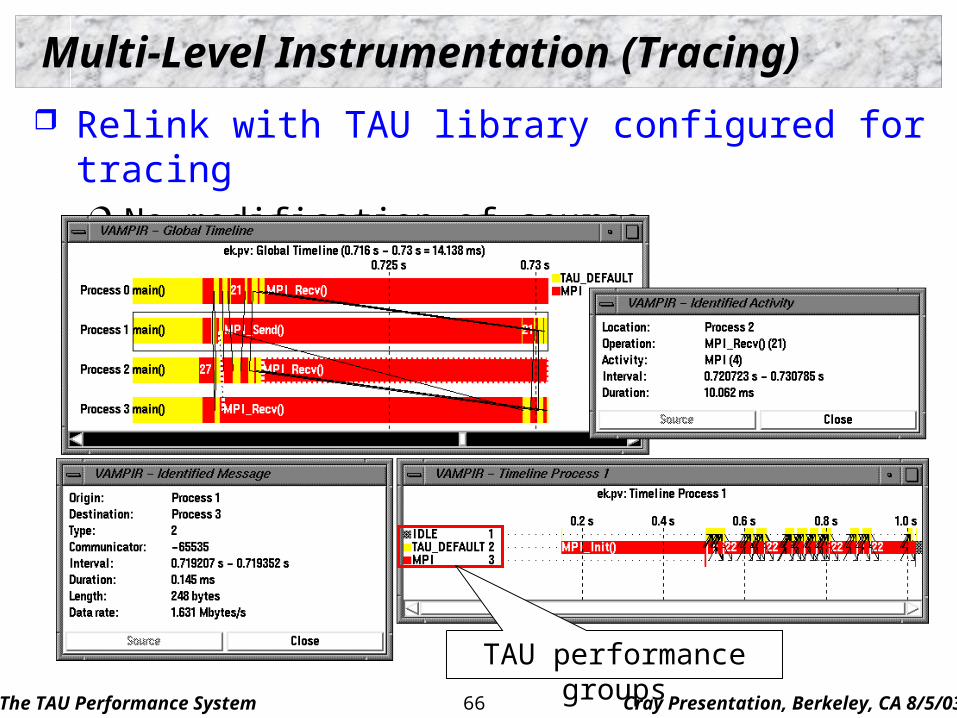
Multi-Level Instrumentation (Tracing)
Relink with TAU library configured for tracing No modification of source instrumentation required!
TAU performance groups
The TAU Performance System Cray Presentation, Berkeley, CA 8/5/0367
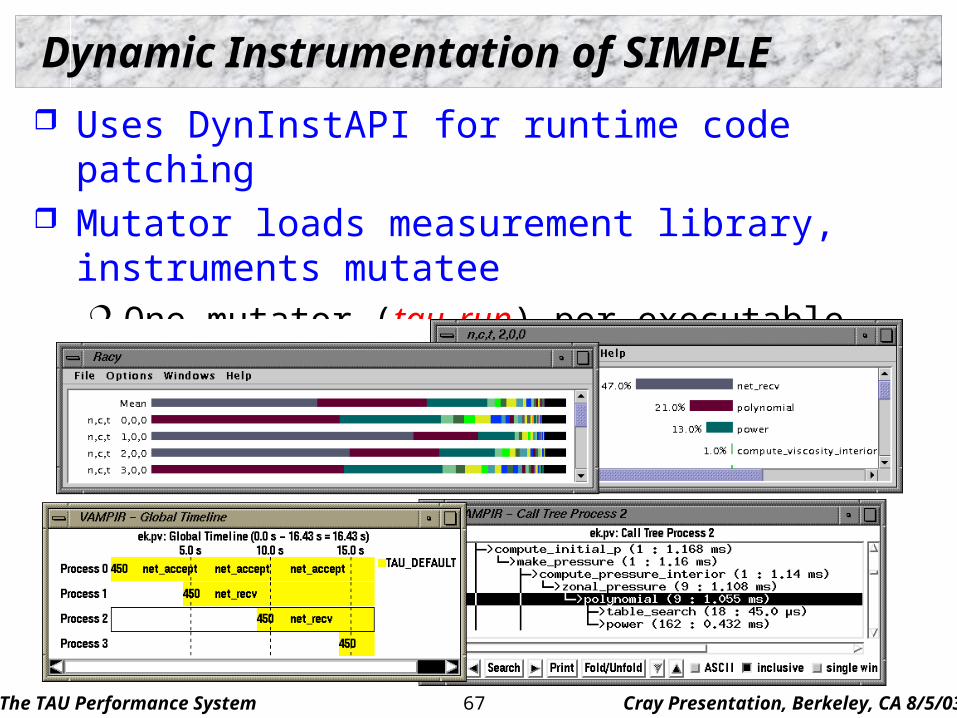
Dynamic Instrumentation of SIMPLE
Uses DynInstAPI for runtime code patching Mutator loads measurement library, instruments mutatee
One mutator (tau_run) per executable image mpirun –np <n> tau.shell
The TAU Performance System Cray Presentation, Berkeley, CA 8/5/0368
Case Study: PETSc v2.1.3 (ANL)
Portable, Extensible Toolkit for Scientific Computation Scalable (parallel) PDE framework
Suite of data structures and routines (374,458 code lines) Solution of scientific applications modeled by PDEs
Parallel implementation MPI used for inter-process communication
TAU instrumentation PDT for C/C++ source instrumentation (100%, no manual) MPI wrapper interposition library instrumentation
Example Linear system of equations (Ax=b) (SLES) (ex2 test case) Non-linear system of equations (SNES) (ex19 test case)
The TAU Performance System Cray Presentation, Berkeley, CA 8/5/0369
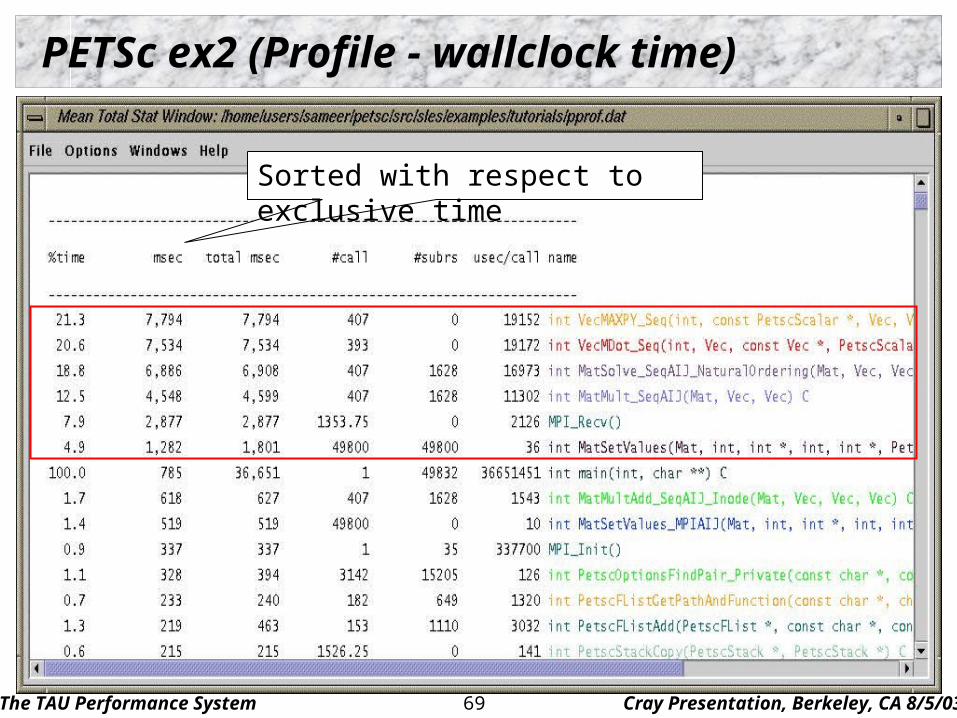
PETSc ex2 (Profile - wallclock time)
Sorted with respect to exclusive time
The TAU Performance System Cray Presentation, Berkeley, CA 8/5/0370
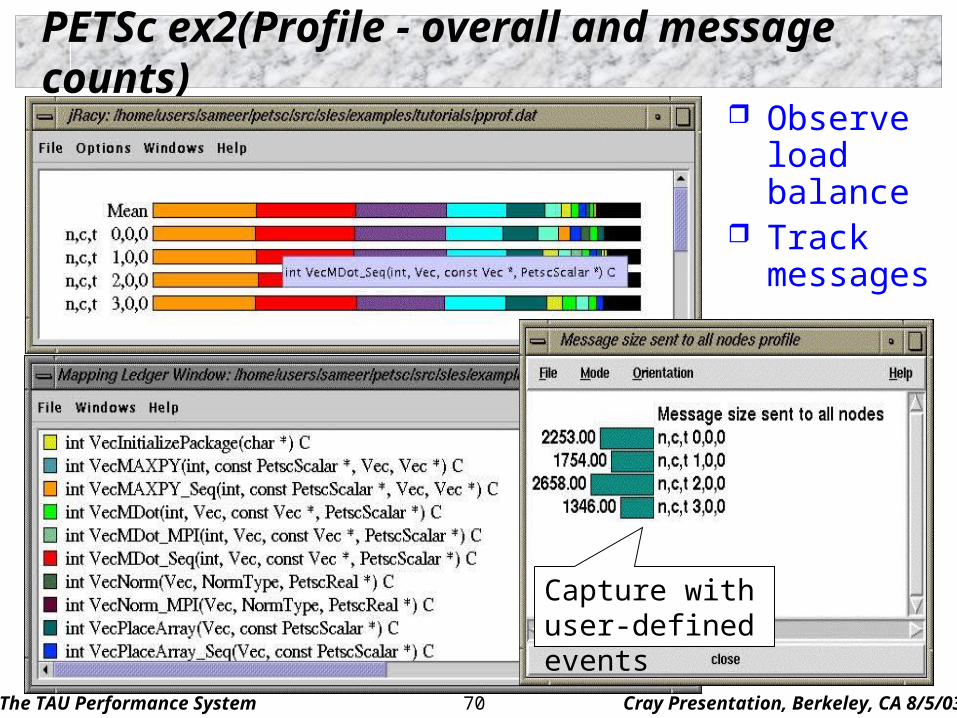
PETSc ex2(Profile - overall and message counts) Observe
load balance
Track messages
Capture with user-defined events
The TAU Performance System Cray Presentation, Berkeley, CA 8/5/0371
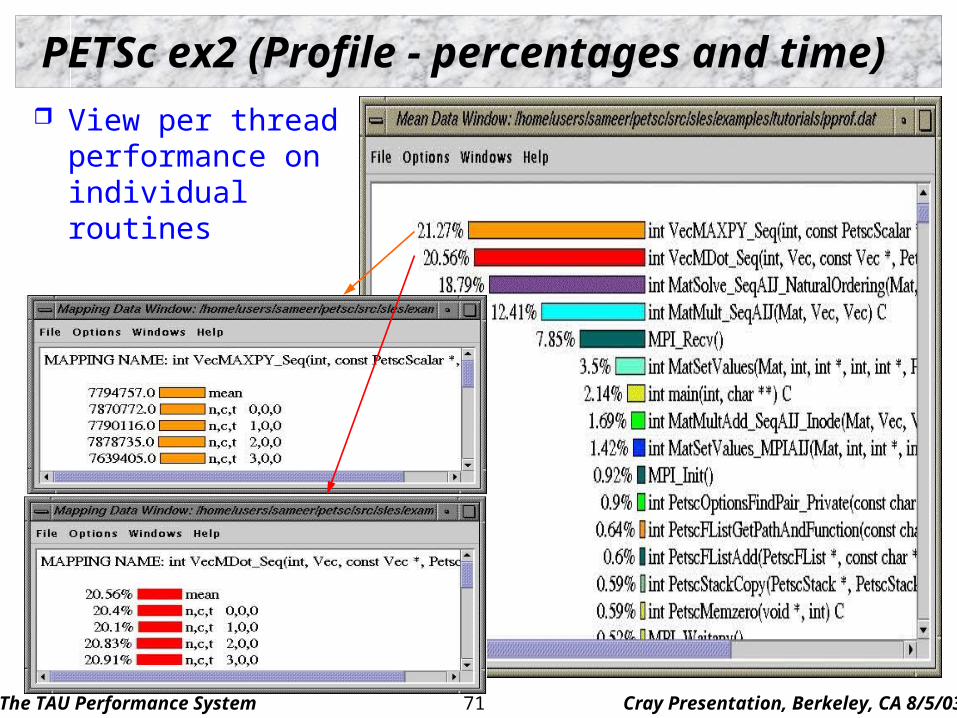
PETSc ex2 (Profile - percentages and time)
View per threadperformance on individual routines
The TAU Performance System Cray Presentation, Berkeley, CA 8/5/0372
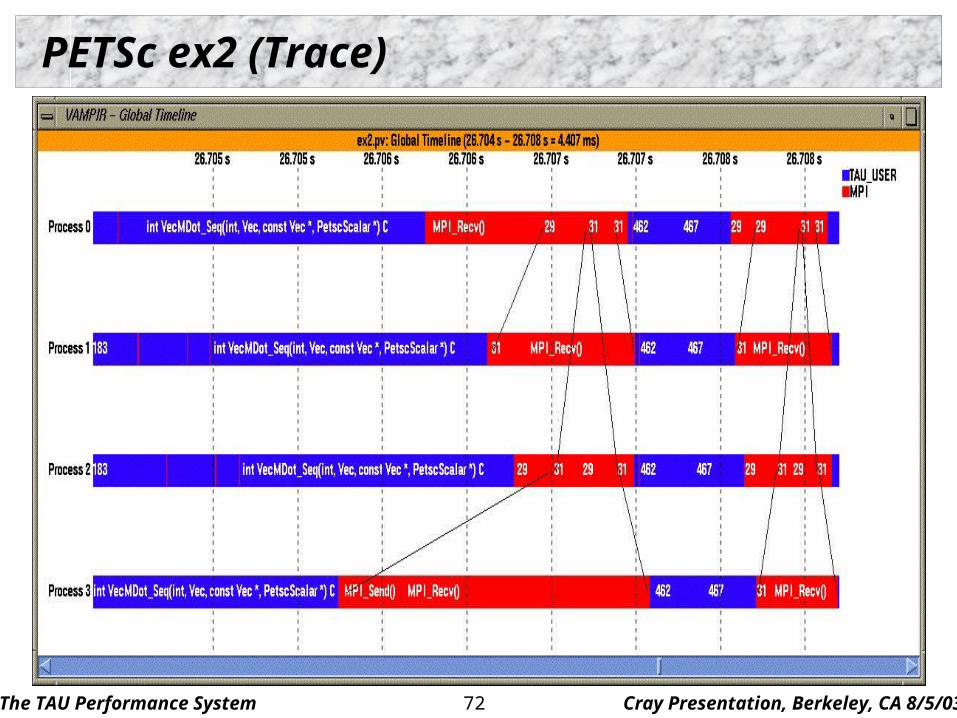
PETSc ex2 (Trace)
The TAU Performance System Cray Presentation, Berkeley, CA 8/5/0373
PETSc ex19
Non-linear solver (SNES) 2-D driven cavity code Uses velocity-vorticity formulation Finite difference discretization on a structured grid
Problem size and measurements 56x56 mesh size on quad Pentium III (550 Mhz, Linux) Executes for approximately one minute MPI wrapper interposition library PDT (tau_instrumentor) Selective instrumentation (tau_reduce)
three routines identified with high instrumentation overhead
The TAU Performance System Cray Presentation, Berkeley, CA 8/5/0374
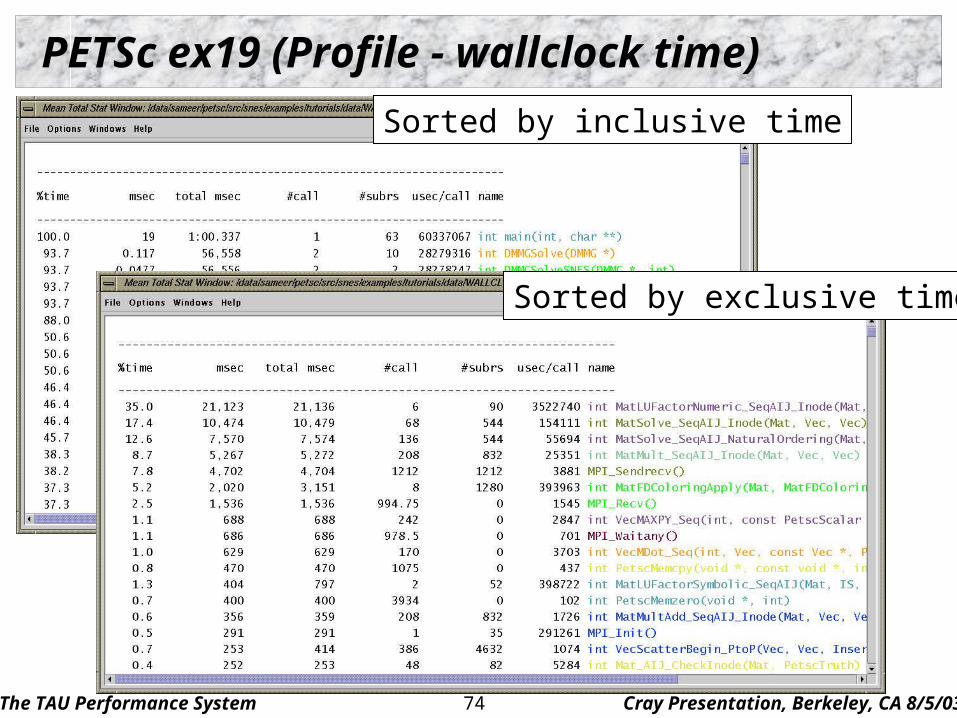
PETSc ex19 (Profile - wallclock time)
Sorted by inclusive time
Sorted by exclusive time
The TAU Performance System Cray Presentation, Berkeley, CA 8/5/0375
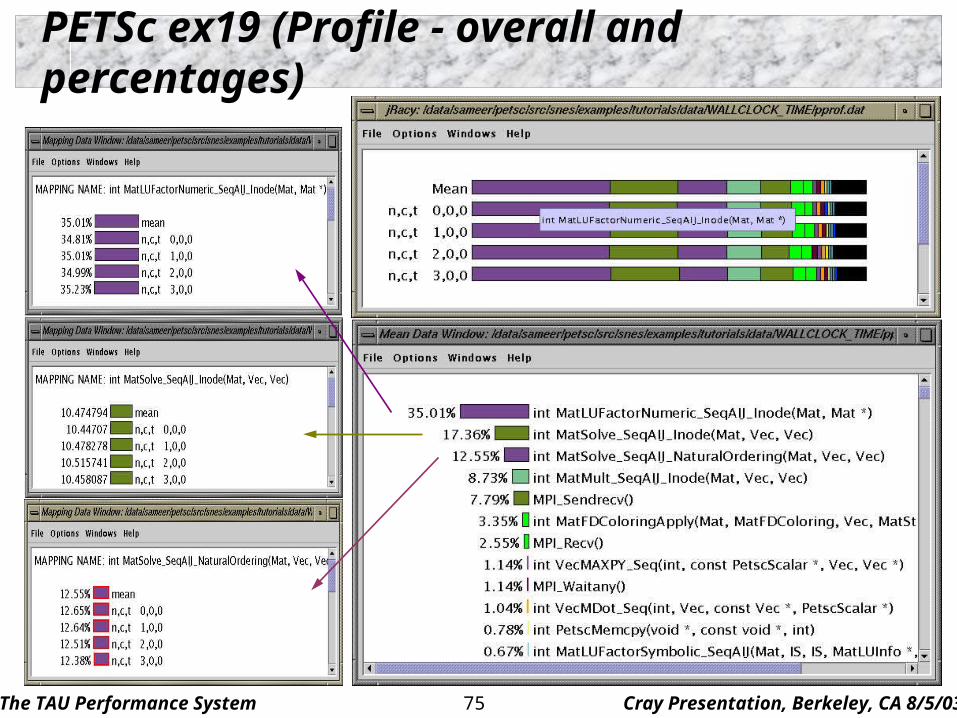
PETSc ex19 (Profile - overall and percentages)
The TAU Performance System Cray Presentation, Berkeley, CA 8/5/0376
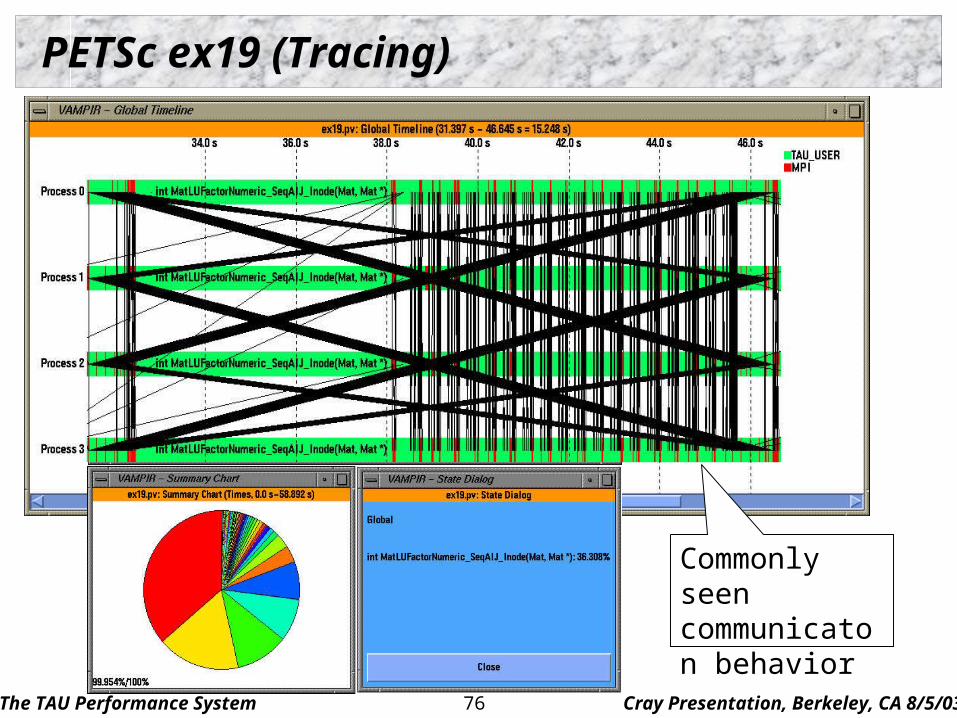
PETSc ex19 (Tracing)
Commonly seen communicaton behavior
The TAU Performance System Cray Presentation, Berkeley, CA 8/5/0377
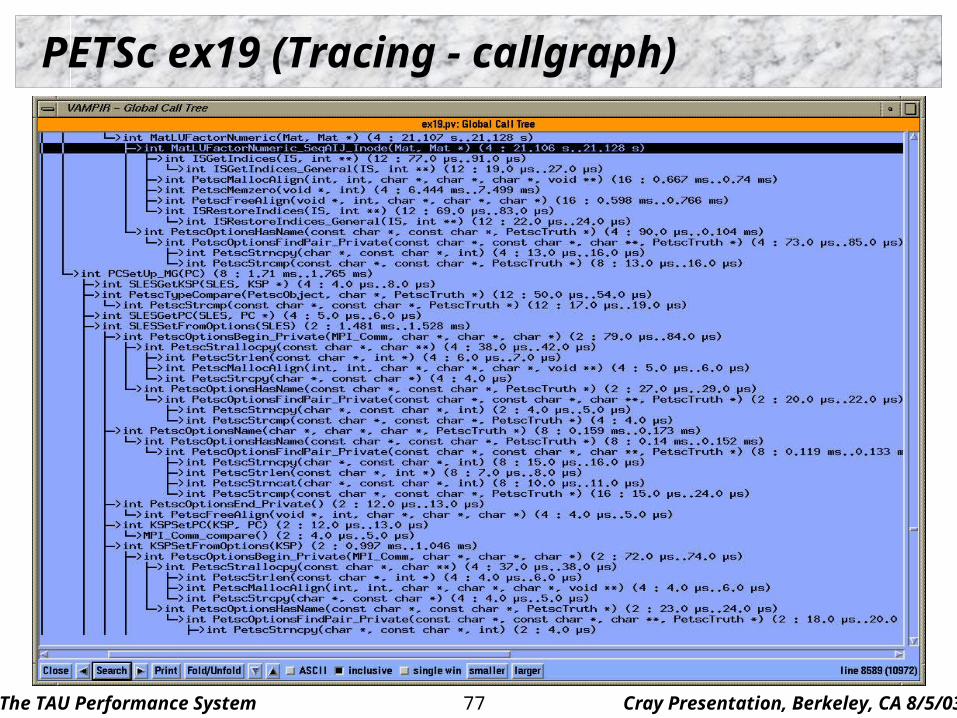
PETSc ex19 (Tracing - callgraph)
The TAU Performance System Cray Presentation, Berkeley, CA 8/5/0378
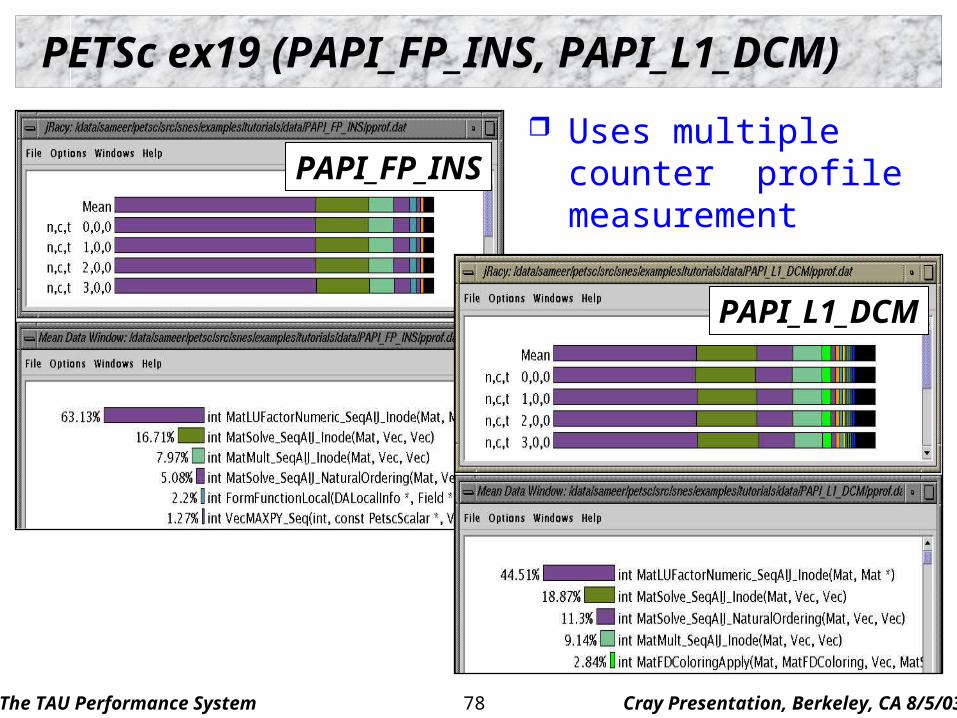
PETSc ex19 (PAPI_FP_INS, PAPI_L1_DCM)
PAPI_FP_INS
PAPI_L1_DCM
Uses multiple counter profile measurement
The TAU Performance System Cray Presentation, Berkeley, CA 8/5/0379
Case Study: Mixed-mode Parallel Programs
Portable mixed-mode parallel programming Multi-threaded shared memory programming Inter-node message passing
Performance measurement Access to runtime system and communication events Associate communication and application events
2-Dimensional Stommel model of ocean circulation OpenMP for shared memory parallel programming MPI for cross-box message-based parallelism Jacobi iteration, 5-point stencil Timothy Kaiser (San Diego Supercomputing Center)
The TAU Performance System Cray Presentation, Berkeley, CA 8/5/0380
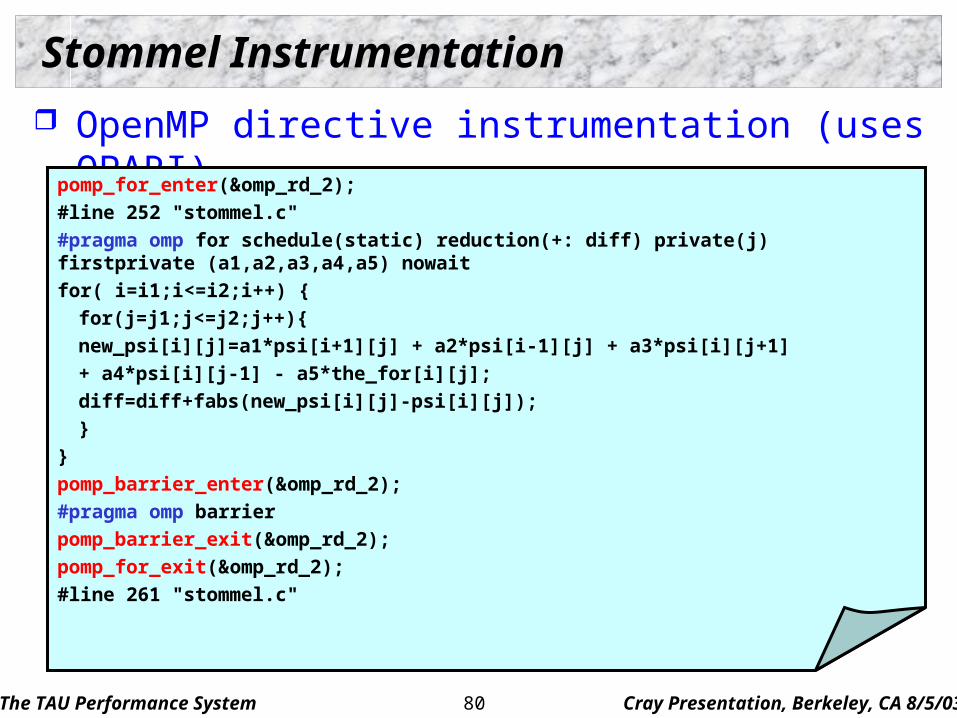
Stommel Instrumentation
OpenMP directive instrumentation (uses OPARI)
pomp_for_enter(&omp_rd_2);
#line 252 "stommel.c"
#pragma omp for schedule(static) reduction(+: diff) private(j) firstprivate (a1,a2,a3,a4,a5) nowait
for( i=i1;i<=i2;i++) {
for(j=j1;j<=j2;j++){
new_psi[i][j]=a1*psi[i+1][j] + a2*psi[i-1][j] + a3*psi[i][j+1]
+ a4*psi[i][j-1] - a5*the_for[i][j];
diff=diff+fabs(new_psi[i][j]-psi[i][j]);
}
}
pomp_barrier_enter(&omp_rd_2);
#pragma omp barrier
pomp_barrier_exit(&omp_rd_2);
pomp_for_exit(&omp_rd_2);
#line 261 "stommel.c"
The TAU Performance System Cray Presentation, Berkeley, CA 8/5/0381
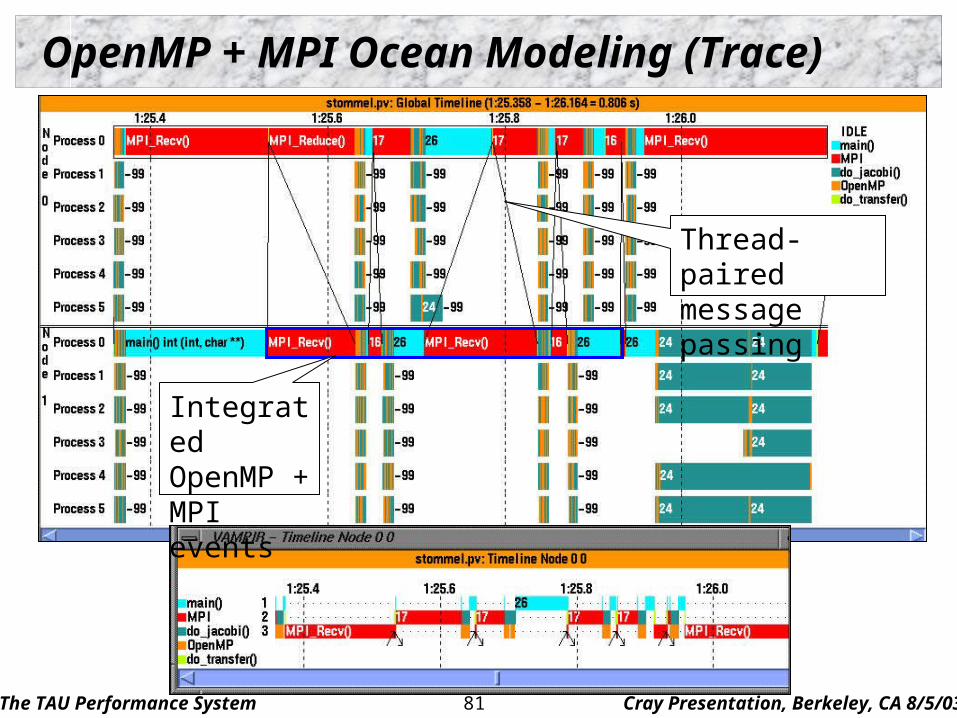
OpenMP + MPI Ocean Modeling (Trace)
Thread-paired message passing
Integrated OpenMP + MPI events
The TAU Performance System Cray Presentation, Berkeley, CA 8/5/0382
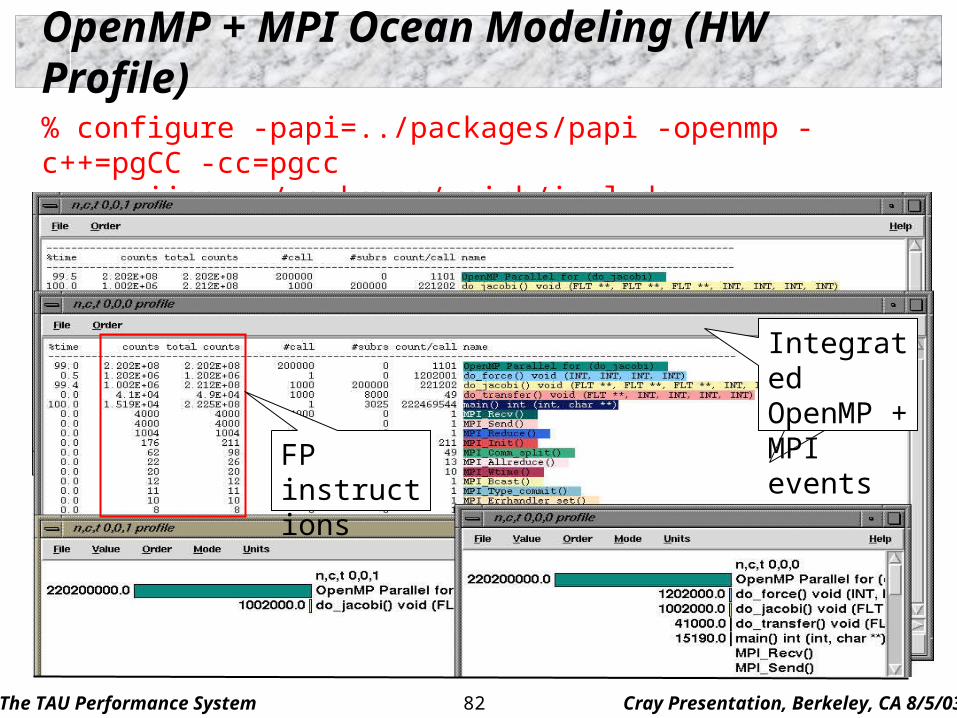
OpenMP + MPI Ocean Modeling (HW Profile)
% configure -papi=../packages/papi -openmp -c++=pgCC -cc=pgcc -mpiinc=../packages/mpich/include -mpilib=../packages/mpich/lib
Integrated OpenMP + MPI events
FP instructions
Integrated OpenMP + MPI events
The TAU Performance System Cray Presentation, Berkeley, CA 8/5/0383
Case Study: C++ and Performance Mapping
Object-oriented programming abstract data types, encapsulation, inheritance, …
Domain-specific abstractions Implemented by OO languages in form of class libraries
Generic programming mechanisms efficient coding abstractions, compile-time transformations
Creates a semantic gap between the transformed code and what the user expects (as describes in source code)
Need a mechanism to expose the nature of high-level abstract computation to the performance tools
Map low-level performance data to high-level semantics
The TAU Performance System Cray Presentation, Berkeley, CA 8/5/0384
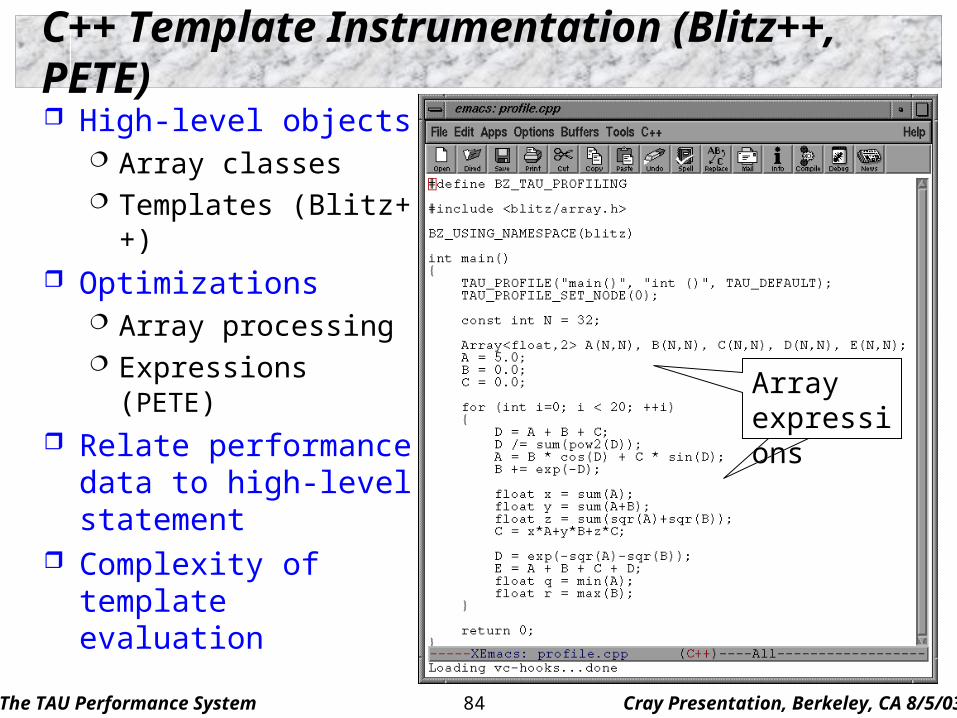
C++ Template Instrumentation (Blitz++, PETE)
High-level objects Array classes Templates (Blitz++)
Optimizations Array processing Expressions (PETE)
Relate performance data to high-level statement
Complexity of template evaluation
ArrayexpressionsArrayexpressions
The TAU Performance System Cray Presentation, Berkeley, CA 8/5/0385
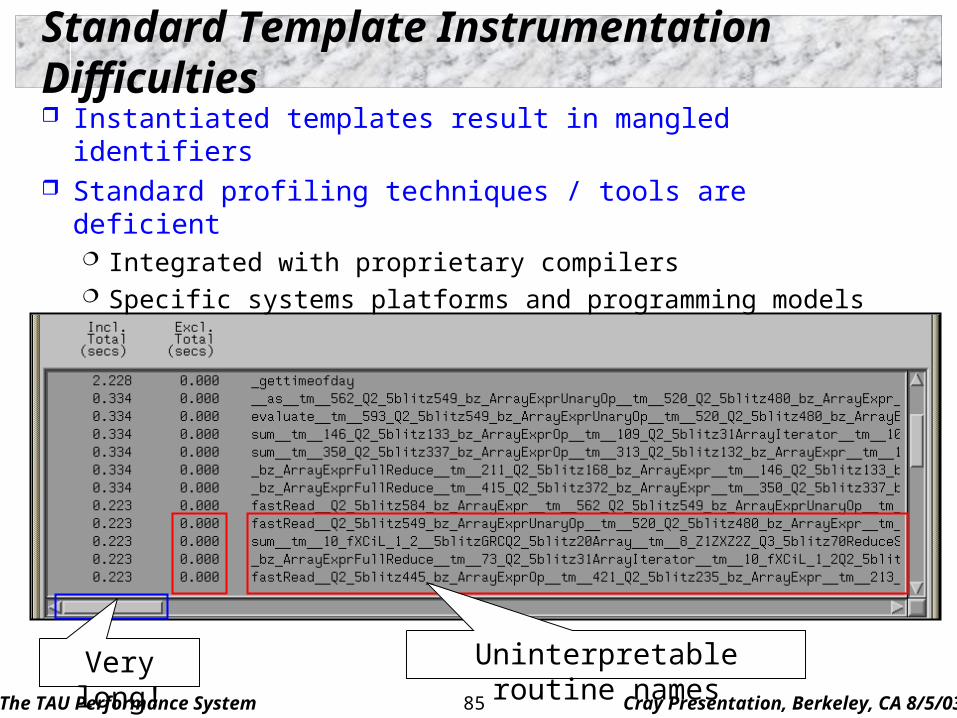
Standard Template Instrumentation Difficulties
Instantiated templates result in mangled identifiers Standard profiling techniques / tools are deficient
Integrated with proprietary compilers Specific systems platforms and programming models
Very long! Uninterpretable routine names
The TAU Performance System Cray Presentation, Berkeley, CA 8/5/0386
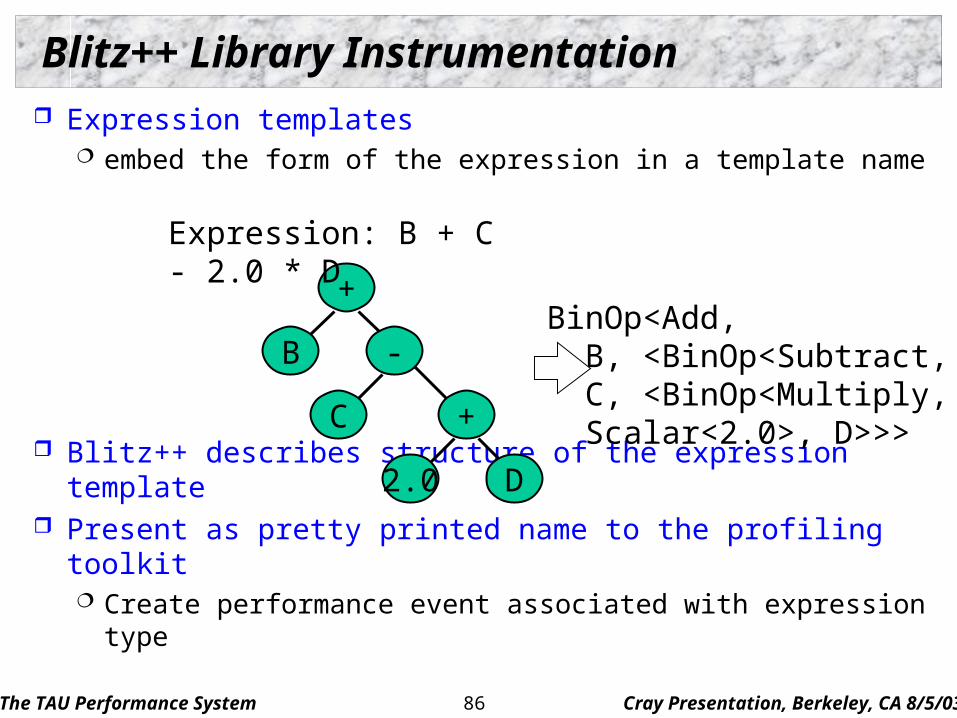
Blitz++ Library Instrumentation
Expression templates embed the form of the expression in a template name
Blitz++ describes structure of the expression template Present as pretty printed name to the profiling toolkit
Create performance event associated with expression type
+
B -
+
2.0 D
C
BinOp<Add, B, <BinOp<Subtract, C, <BinOp<Multiply, Scalar<2.0>, D>>>
Expression: B + C - 2.0 * D
The TAU Performance System Cray Presentation, Berkeley, CA 8/5/0387
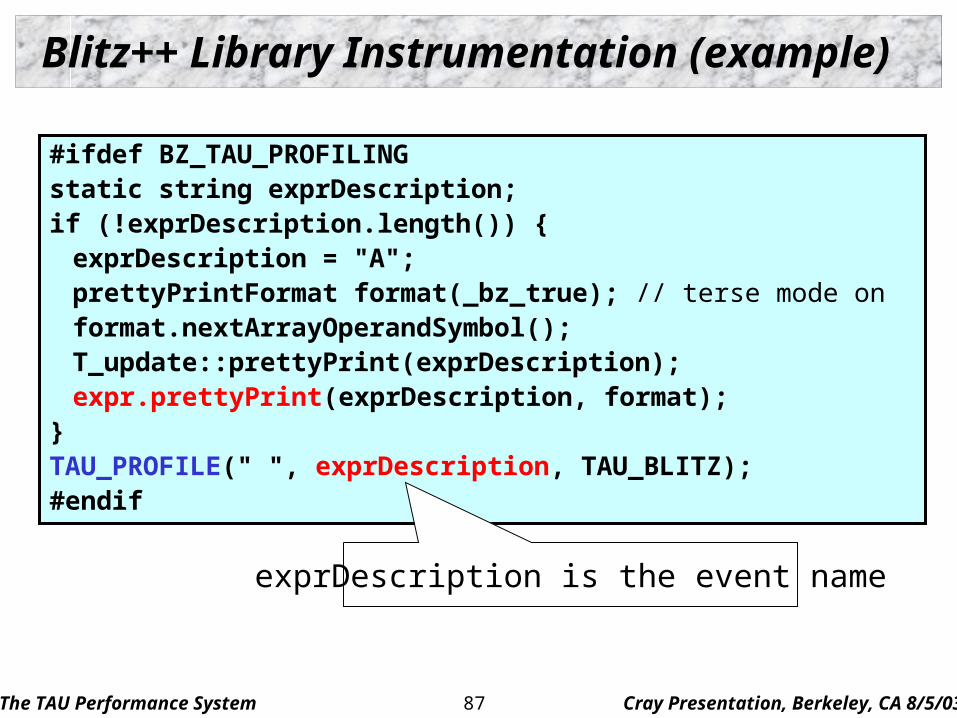
Blitz++ Library Instrumentation (example)
#ifdef BZ_TAU_PROFILINGstatic string exprDescription;if (!exprDescription.length()) {exprDescription = "A";prettyPrintFormat format(_bz_true); // terse mode onformat.nextArrayOperandSymbol();T_update::prettyPrint(exprDescription);expr.prettyPrint(exprDescription, format);
}TAU_PROFILE(" ", exprDescription, TAU_BLITZ);#endif
exprDescription is the event name
The TAU Performance System Cray Presentation, Berkeley, CA 8/5/0388
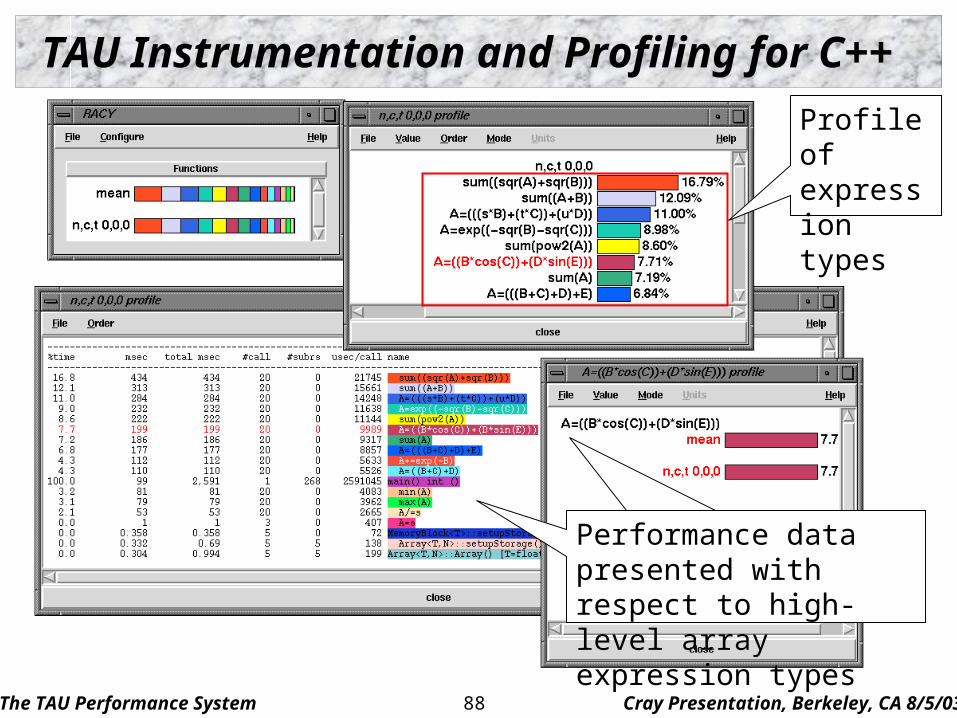
TAU Instrumentation and Profiling for C++
Performance data presented with respect to high-level array expression types
Profile of expression types
Performance data presented with respect to high-level array expression types
The TAU Performance System Cray Presentation, Berkeley, CA 8/5/0389
Case Study: C-SAFE / Uintah
Center for Simulation of Accidental Fires & Explosions ASCI ASAP Level 1 center, University of Utah PSE for multi-model simulation high-energy explosion Coupled non-linear solvers, optimization, computational
steering, visualization, and experimental data verification Very large-scale simulations
Computer science problems: Coupling of multiple simulation codes Software engineering across diverse expert teams Achieving high performance on large-scale systems
The TAU Performance System Cray Presentation, Berkeley, CA 8/5/0390
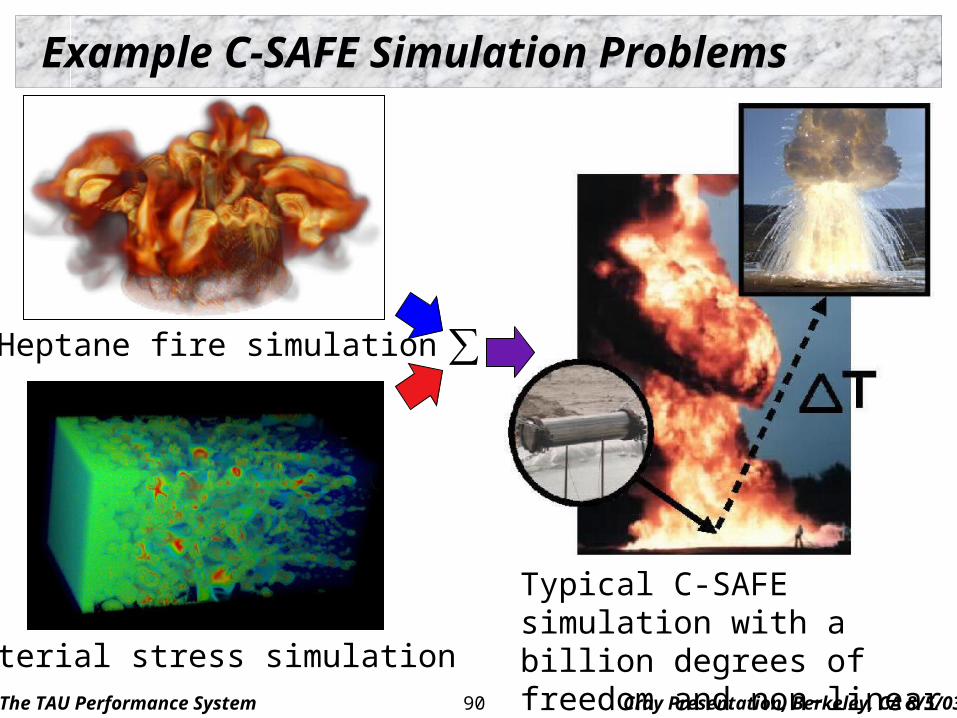
Example C-SAFE Simulation Problems
∑Heptane fire simulation
Material stress simulation
Typical C-SAFE simulation with a billion degrees of freedom and non-linear time dynamics
The TAU Performance System Cray Presentation, Berkeley, CA 8/5/0391
Uintah Computational Framework (UCF)
Execution model based on software (macro) dataflow Exposes parallelism and hides data transport latency Computations expressed a directed acyclic graphs of tasks
consumes input and produces output (input to future task) input/outputs specified for each patch in a structured grid
Abstraction of global single-assignment memory DataWarehouse Directory mapping names to values (array structured) Write value once then communicate to awaiting tasks
Task graph gets mapped to processing resources Communications schedule approximates global optimal
The TAU Performance System Cray Presentation, Berkeley, CA 8/5/0392
Performance Technology Integration
Uintah present challenges to performance integration Software diversity and structure
UCF middleware, simulation code modules component-based hierarchy
Portability objectives cross-language and cross-platform multi-parallelism: thread, message passing, mixed
Scalability objectives High-level programming and execution abstractions
Requires flexible and robust performance technology Requires support for performance mapping
The TAU Performance System Cray Presentation, Berkeley, CA 8/5/0393
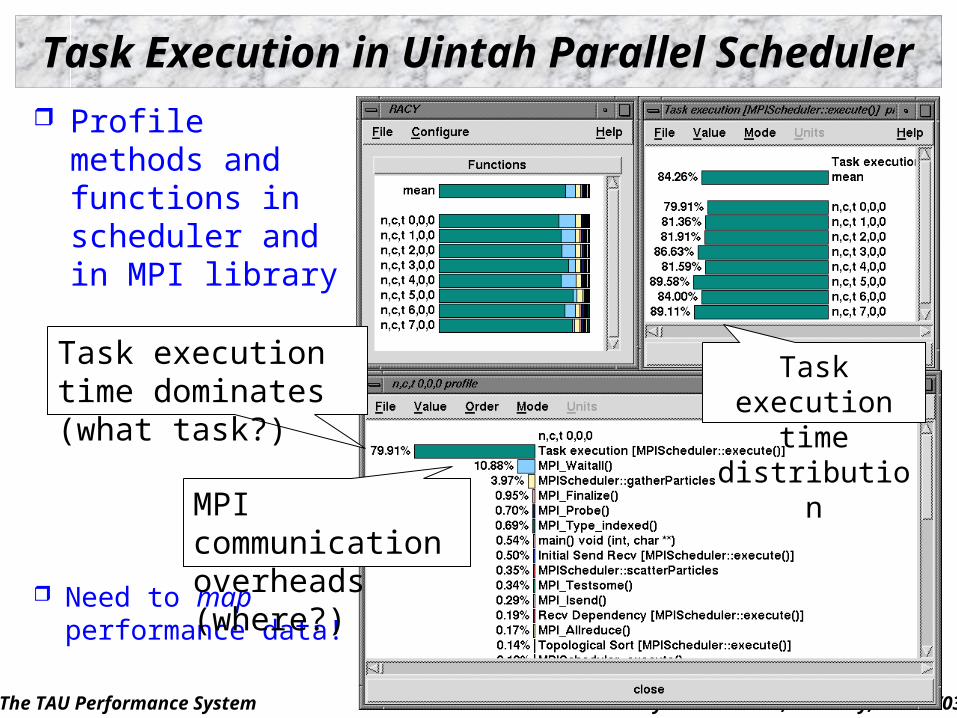
Task Execution in Uintah Parallel Scheduler
Profile methods and functions in scheduler and in MPI library
Need to map performance data!
Task execution time dominates (what task?)
MPI communication overheads (where?)
Task execution time distribution
The TAU Performance System Cray Presentation, Berkeley, CA 8/5/0394
Uintah Task Performance Mapping Uintah partitions individual particles across processing
elements (processes or threads) Simulation tasks in task graph work on particles
Tasks have domain-specific character in the computation “interpolate particles to grid” in Material Point Method
Task instances generated for each partitioned particle set Execution scheduled with respect to task dependencies
How to attributed execution time among different tasks Assign semantic name (task type) to a task instance
SerialMPM::interpolateParticleToGrid Map TAU timer object to (abstract) task (semantic entity) Look up timer object using task type (semantic attribute)
Further partition along different domain-specific axes
The TAU Performance System Cray Presentation, Berkeley, CA 8/5/0395
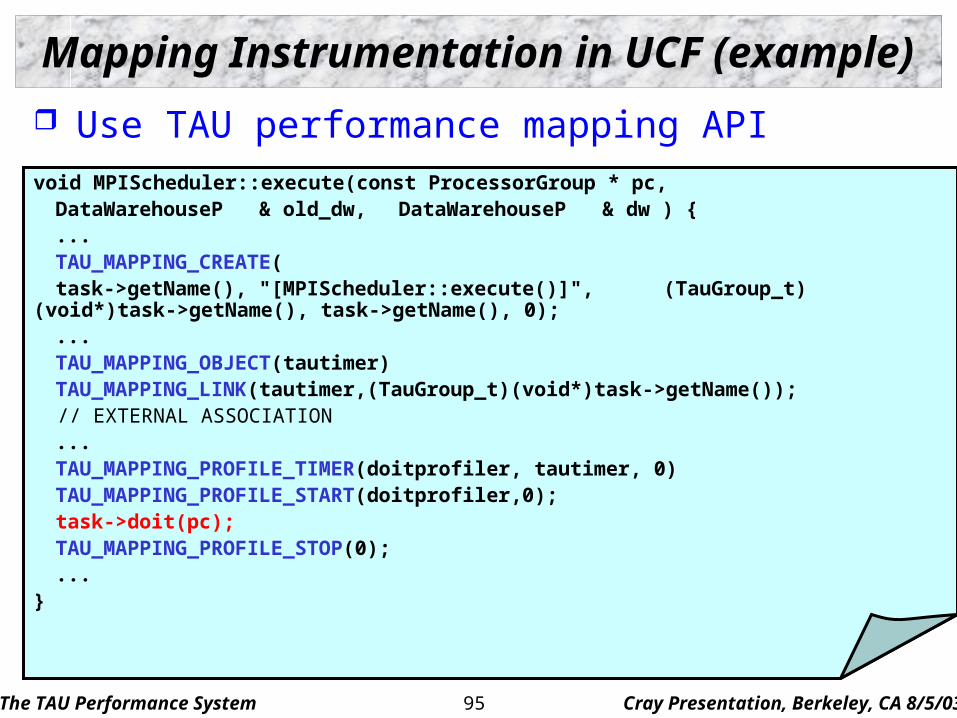
Mapping Instrumentation in UCF (example)
Use TAU performance mapping APIvoid MPIScheduler::execute(const ProcessorGroup * pc,
DataWarehouseP & old_dw, DataWarehouseP & dw ) {
...TAU_MAPPING_CREATE(
task->getName(), "[MPIScheduler::execute()]", (TauGroup_t)(void*)task->getName(), task->getName(), 0);...TAU_MAPPING_OBJECT(tautimer)TAU_MAPPING_LINK(tautimer,(TauGroup_t)(void*)task->getName());
// EXTERNAL ASSOCIATION...TAU_MAPPING_PROFILE_TIMER(doitprofiler, tautimer, 0)TAU_MAPPING_PROFILE_START(doitprofiler,0);task->doit(pc);TAU_MAPPING_PROFILE_STOP(0);...
}
The TAU Performance System Cray Presentation, Berkeley, CA 8/5/0396
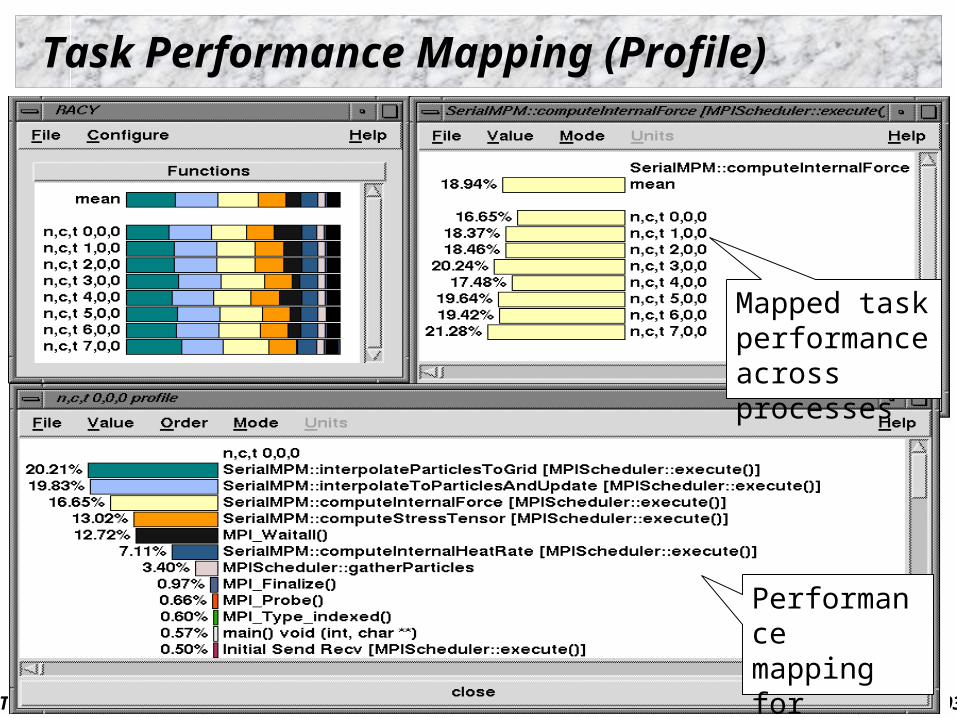
Task Performance Mapping (Profile)
Mapped task performance across processes
Performance mapping for different tasks
The TAU Performance System Cray Presentation, Berkeley, CA 8/5/0397
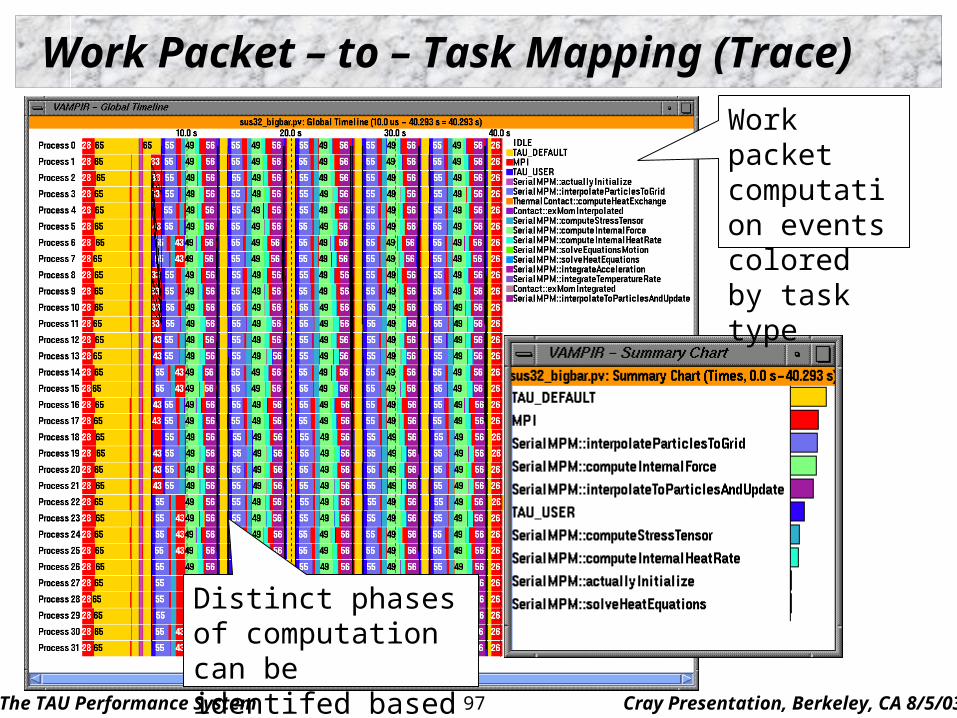
Work Packet – to – Task Mapping (Trace)
Work packet computation events colored by task type
Distinct phases of computation can be identifed based on task
The TAU Performance System Cray Presentation, Berkeley, CA 8/5/0398
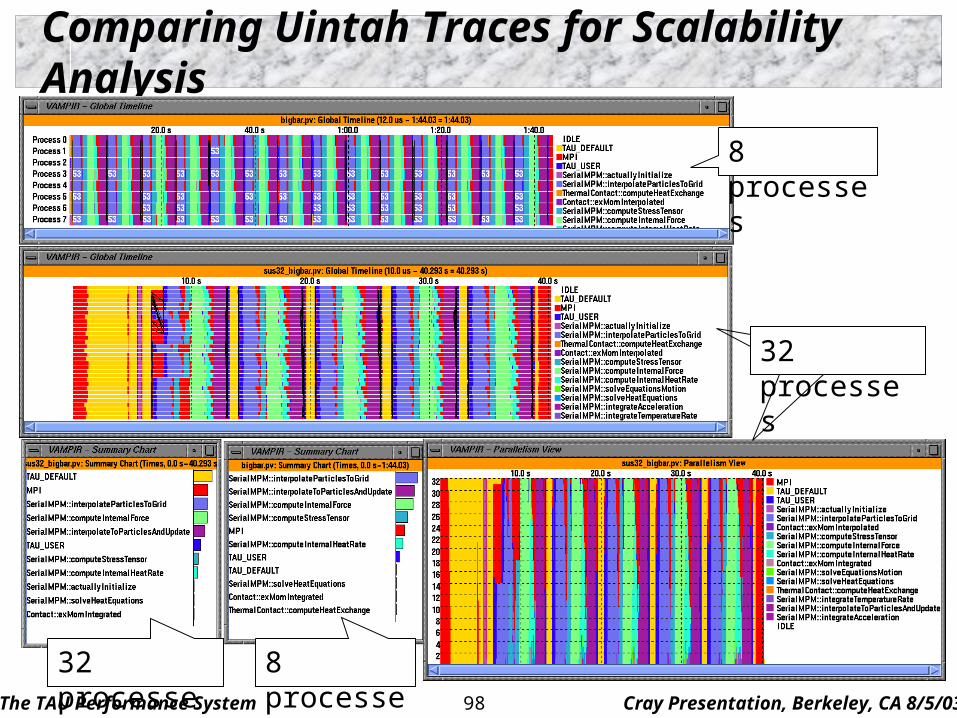
Comparing Uintah Traces for Scalability Analysis
8 processes
8 processes
32 processes32 processes
32 processes
The TAU Performance System Cray Presentation, Berkeley, CA 8/5/0399
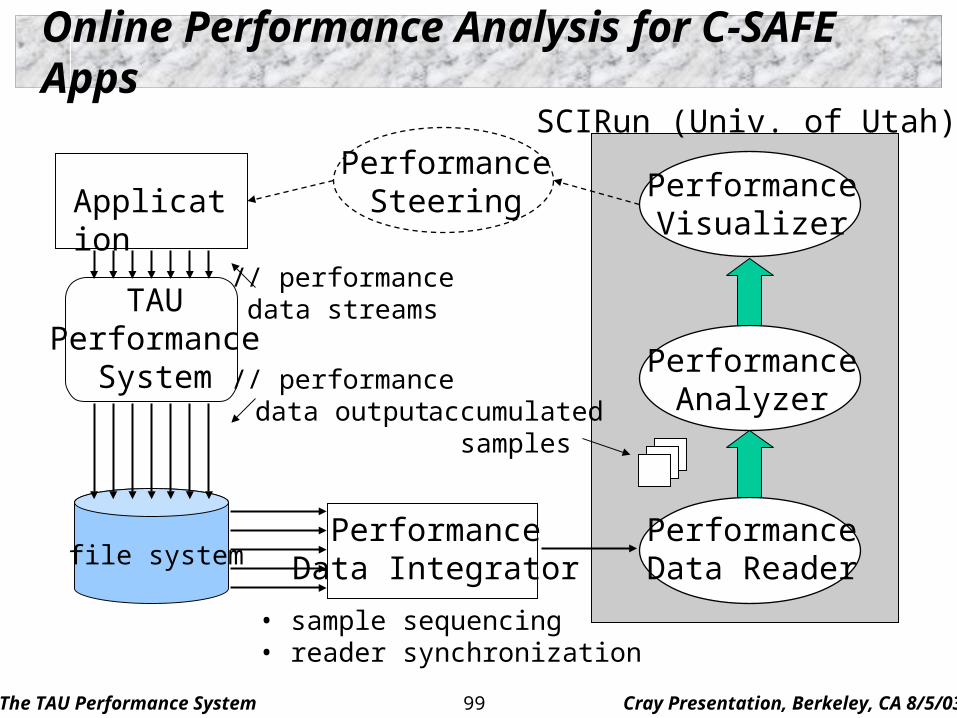
Online Performance Analysis for C-SAFE Apps
ApplicationPerformance
Steering PerformanceVisualizer
PerformanceAnalyzer
PerformanceData Reader
TAUPerformance
System
PerformanceData Integrator
SCIRun (Univ. of Utah)
// performancedata streams
// performancedata output
file system
• sample sequencing• reader synchronization
accumulatedsamples
The TAU Performance System Cray Presentation, Berkeley, CA 8/5/03100
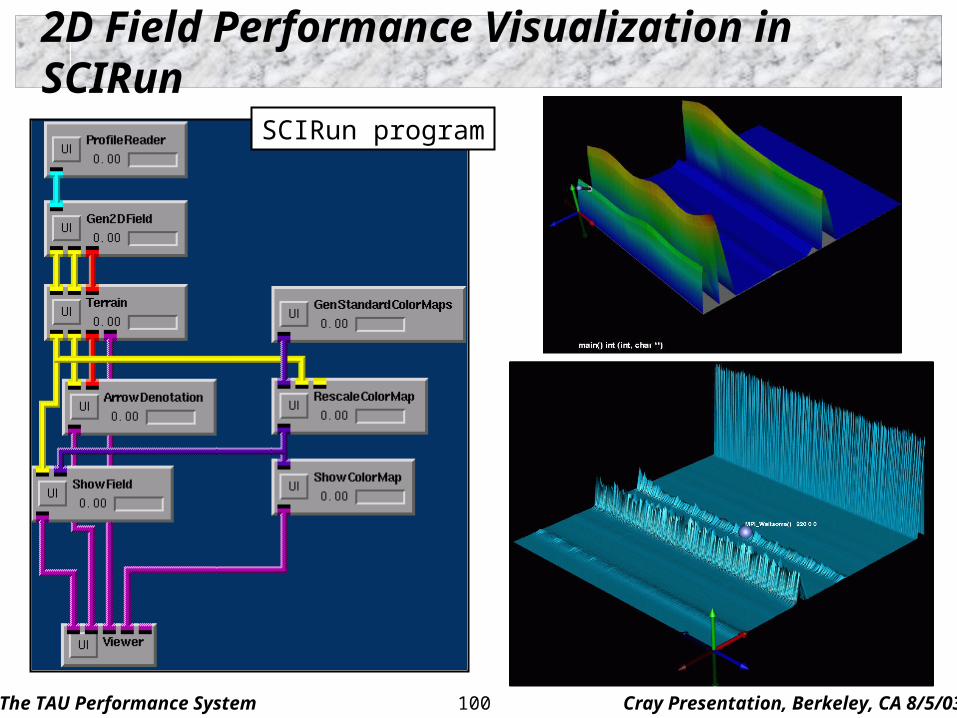
2D Field Performance Visualization in SCIRun
SCIRun program
The TAU Performance System Cray Presentation, Berkeley, CA 8/5/03101
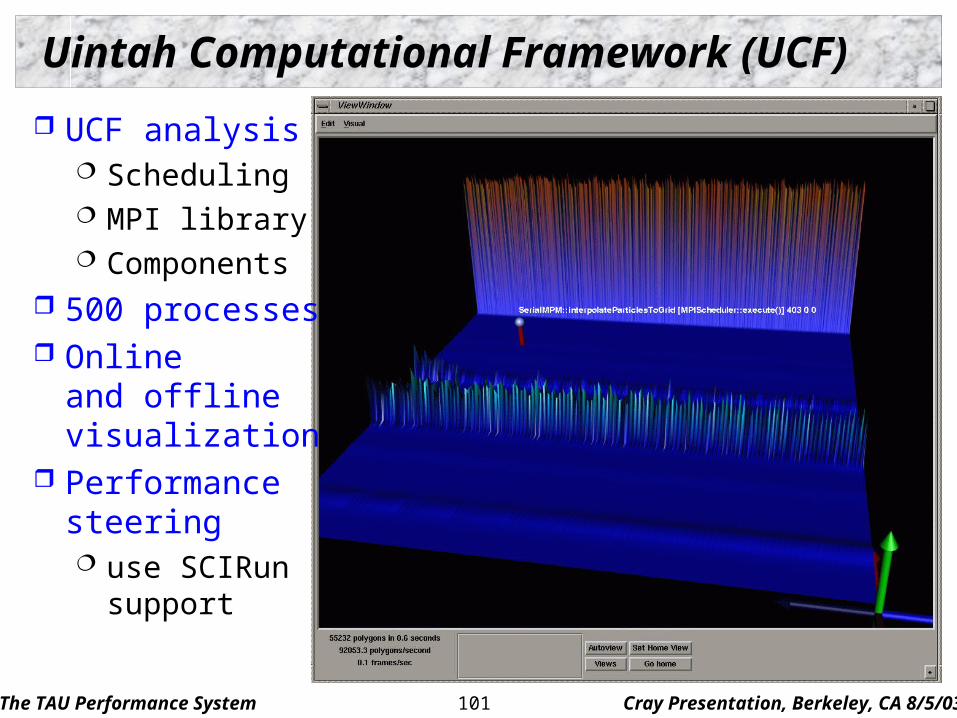
Uintah Computational Framework (UCF)
UCF analysis Scheduling MPI library Components
500 processes Online
and offlinevisualization
Performancesteering use SCIRun
support
The TAU Performance System SC2002 PERC Tutorial, Nov. 17, 2002102
Case Study: SAMRAI (LLNL)
Structured Adaptive Mesh Refinement Application Infrastructure (SAMRAI)
Programming C++ and MPI SPMD
Instrumentation PDT for automatic instrumentation of routines MPI interposition wrappers SAMRAI timers for interesting code segments
timers classified in groups (apps, mesh, …) timer groups are managed by TAU groups
The TAU Performance System SC2002 PERC Tutorial, Nov. 17, 2002103
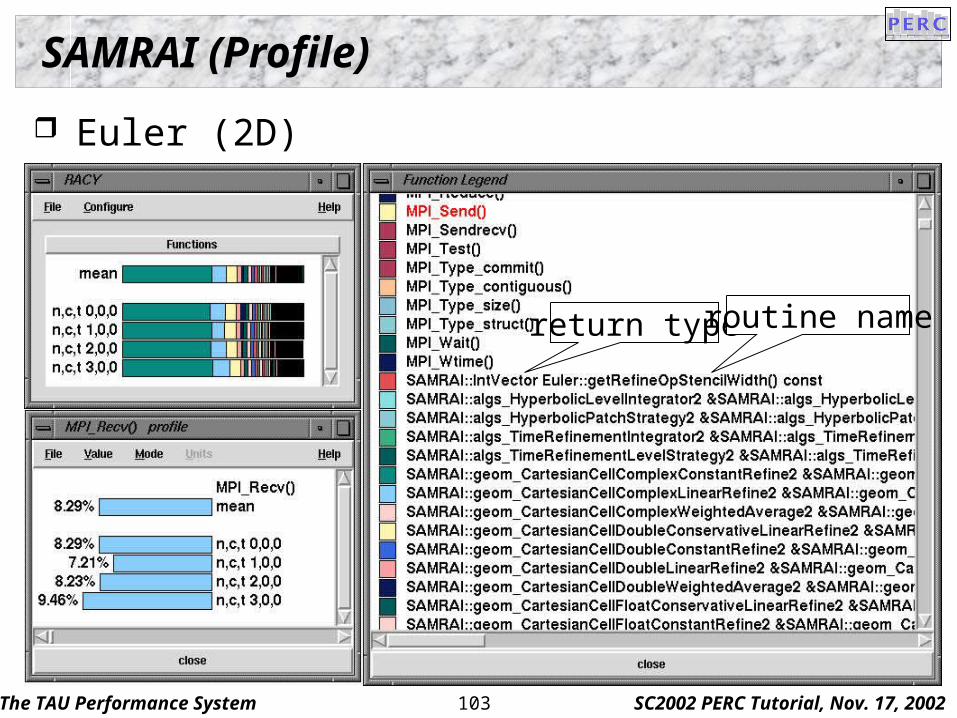
SAMRAI (Profile)
Euler (2D)
return type routine name
The TAU Performance System SC2002 PERC Tutorial, Nov. 17, 2002104
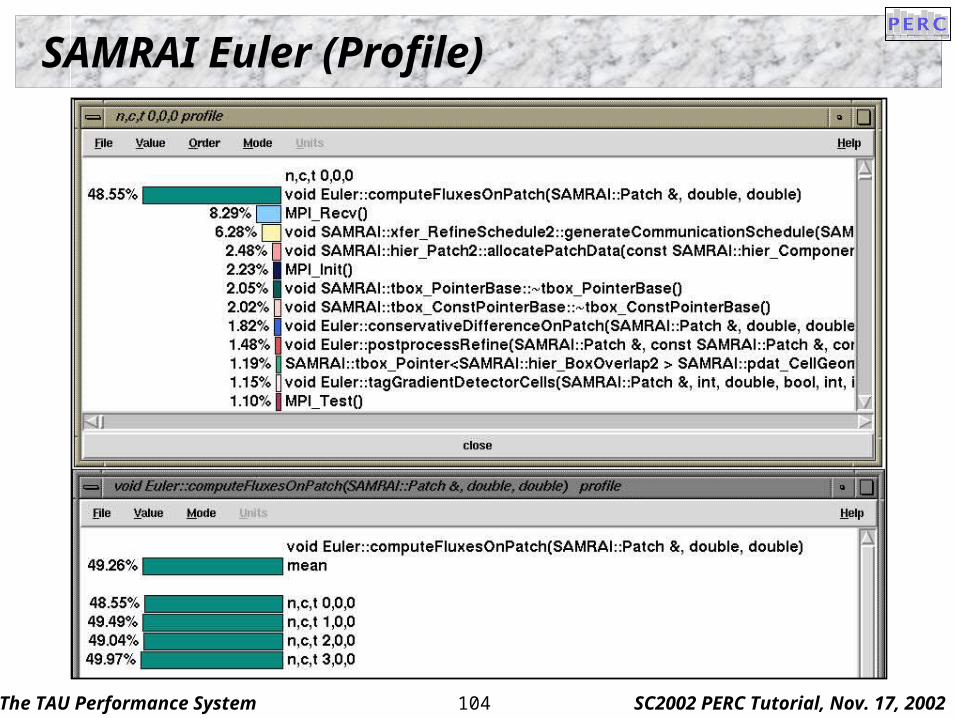
SAMRAI Euler (Profile)
The TAU Performance System SC2002 PERC Tutorial, Nov. 17, 2002105
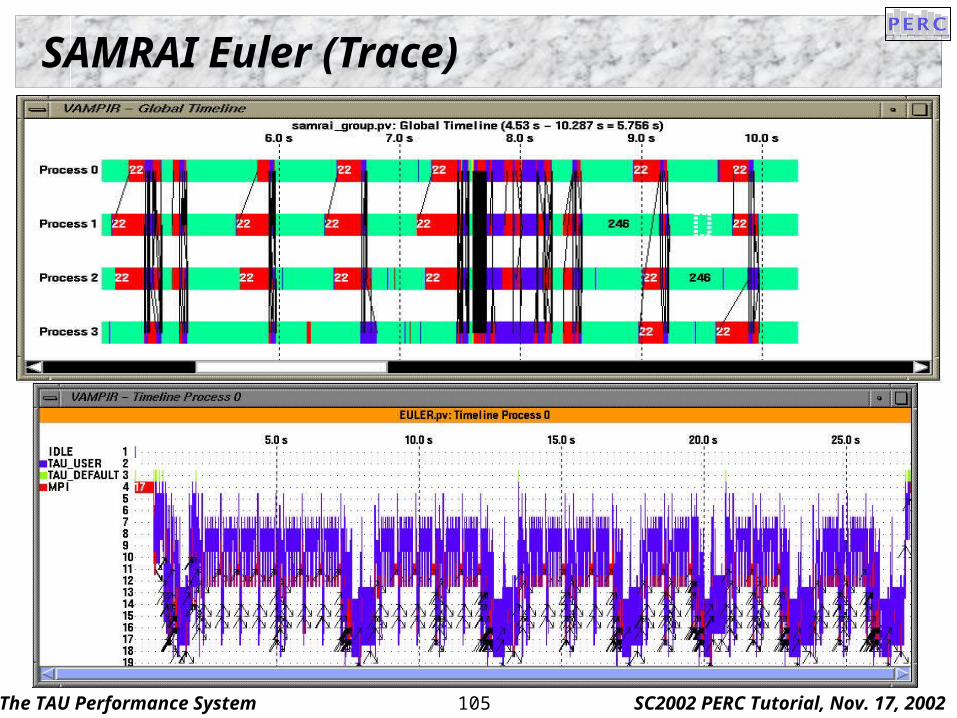
SAMRAI Euler (Trace)
The TAU Performance System SC2002 PERC Tutorial, Nov. 17, 2002106
Case Study: EVH1
Enhanced Virginia Hydrodynamics #1 (EVH1) "TeraScale Simulations of Neutrino-Driven Supernovae
and Their Nucleosynthesis" SciDAC project Configured to run a simulation of the Sedov-Taylor blast
wave solution in 2D spherical geometry Performance study found EVH1 communication bound
for more than 64 processors Predominant routine (>50% of execution time) at this
scale is MPI_ALLTOALL Used in matrix transpose-like operations
The TAU Performance System SC2002 PERC Tutorial, Nov. 17, 2002107
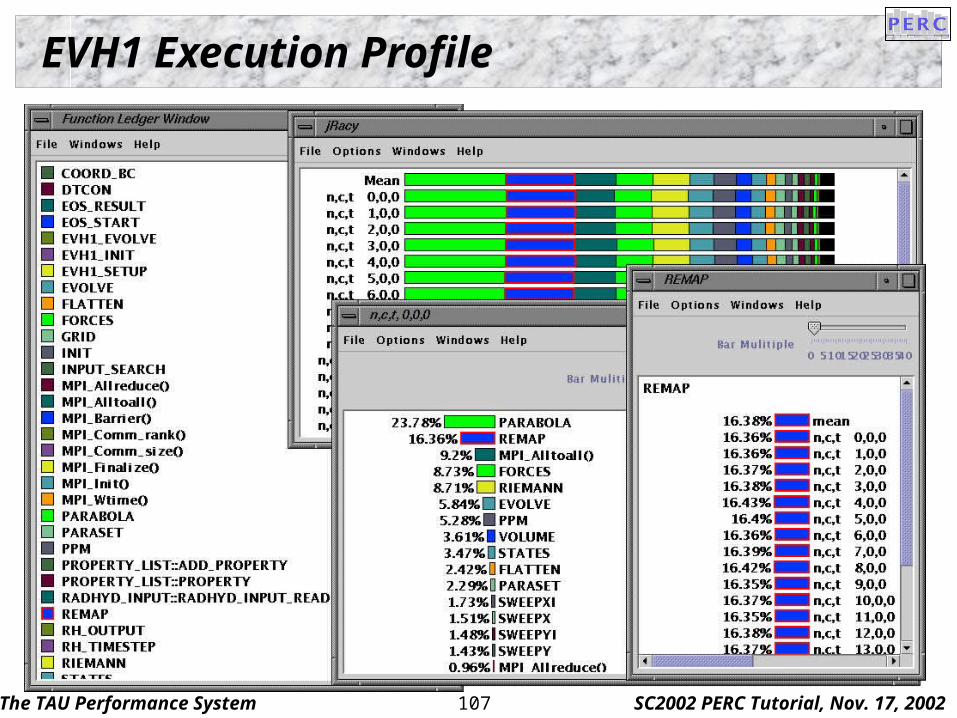
EVH1 Execution Profile
The TAU Performance System SC2002 PERC Tutorial, Nov. 17, 2002108
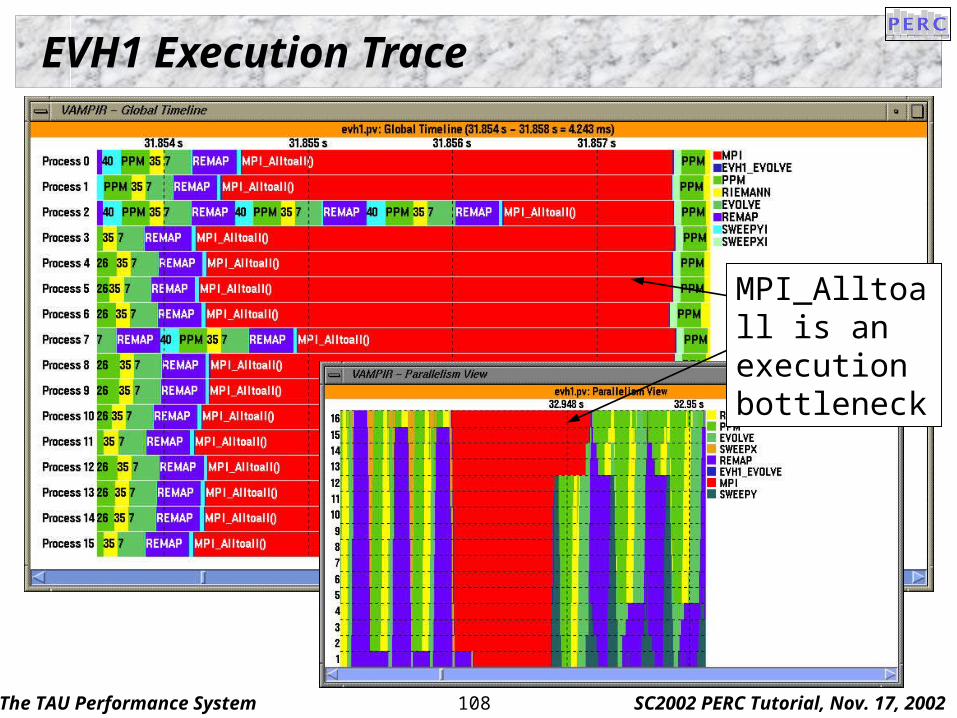
EVH1 Execution Trace
MPI_Alltoall is an execution bottleneck
The TAU Performance System SC2002 PERC Tutorial, Nov. 17, 2002109
TAU Integration (Selected)
SAMRAI (LLNL) Overture (LLNL) C-SAFE (ASCI ASAP) VTF (ASCI ASAP) SAGE (ASCI LANL) POOMA, POOMA-II (LANL, Code Sourcery) PETSc (ANL) CCA (DOE SciDAC) GrACE (Rutgers) Aurora / SCALEA (University of Vienna)
The TAU Performance System Cray Presentation, Berkeley, CA 8/5/03110
Work in Progress
Trace visualization Event traces with counters (Vampir 3.0 will visualize) EPILOG trace conversion
Runtime performance monitoring and analysis Online performance data access Performance analysis and visualization in SCIRun
Performance Database Framework XML parallel profile representation of TAU profiles PostgresSQL performance database
Next-generation PDT Performance analysis for component software (CCA)
The TAU Performance System Cray Presentation, Berkeley, CA 8/5/03111
Concluding Remarks
Complex software and parallel computing systems pose challenging performance analysis problems that require robust methodologies and tools
To build more sophisticated performance tools, existing proven performance technology must be utilized
Performance tools must be integrated with software and systems models and technology Performance engineered software Function consistently and coherently in software and
system environments TAU performance system offers robust performance
technology that can be broadly integrated … so USE IT!
The TAU Performance System Cray Presentation, Berkeley, CA 8/5/03112
Acknowledgements Department of Energy (DOE)
MICS office DOE 2000 ACTS contract “Performance Technology for Tera-class Parallel Computer
Systems: Evolution of the TAU Performance System” PERC SciDAC project affiliate
University of Utah DOE ASCI Level 1 sub-contract DOE ASCI Level 3 (LANL, LLNL)
NSF National Young Investigator (NYI) award Research Centre Juelich
John von Neumann Institute for Computing Dr. Bernd Mohr
Los Alamos National Laboratory
The TAU Performance System Cray Presentation, Berkeley, CA 8/5/03113
Information
TAU (http://www.acl.lanl.gov/tau) PDT (http://www.acl.lanl.gov/pdtoolkit) PAPI (http://icl.cs.utk.edu/projects/papi/) OPARI (http://www.fz-juelich.de/zam/kojak/)