allen d. malony, sameer shende, robert ansell-bell {malony,sameer,bertie}@cs.uoregon.edu computer...
Post on 21-Dec-2015
216 views
TRANSCRIPT
Allen D. Malony, Sameer Shende, Robert Ansell-Bell
{malony,sameer,bertie}@cs.uoregon.edu
Computer & Information Science Department
Computational Science Institute
University of Oregon
TAU Performace System: Developments and Evolution
July 17, 2001 LLNL Seminar
Performance Needs Performance Technology
Observe/analyze/understand performance behavior Multiple levels of software and hardware Different types and detail of performance data Alternative performance problem solving methods Multiple targets of software and system application
Robust AND ubiquitous performance technology Broad scope of performance observability Flexible and configurable mechanisms Technology integration and extension Cross-platform portability Open, layered, and modular framework architecture
July 17, 2001 LLNL Seminar
Complexity Challenges
Computing system environment complexity Observation integration and optimization Access, accuracy, and granularity constraints Diverse/specialized observation capabilities/technology Restricted modes limit performance problem solving
Sophisticated software development environments Programming paradigms and performance models Performance data mapping to software abstractions Uniformity of performance abstraction across platforms Rich observation capabilities and flexible configuration Common performance problem solving methods
July 17, 2001 LLNL Seminar
General Problem
How do we create robust and ubiquitous performance technology for the analysis and tuning of parallel and distributed software and systems in the presence of (evolving) complexity challenges?
July 17, 2001 LLNL Seminar
Talk Outline
Computation Model for Performance Technology TAU Performance Framework
Model-oriented framework architecture TAU performance system toolkit Flexibility and portability (SIMPLE example)
Recent Developments Complexity scenarios Mixed-mode performance analysis (OpenMP+MPI) OpenMP performance API Performance mapping and C-SAFE Uintah
TAU Evolution
July 17, 2001 LLNL Seminar
Computation Model for Performance Technology
How to address dual performance technology goals? Robust capabilities + widely available methodologies Contend with problems of system diversity Flexible tool composition/configuration/integration
Approaches Restrict computation types / performance problems
limited performance technology coverage Base technology on abstract computation model
general architecture and software execution features map features/methods to existing complex system types develop capabilities that can adapt and be optimized
July 17, 2001 LLNL Seminar
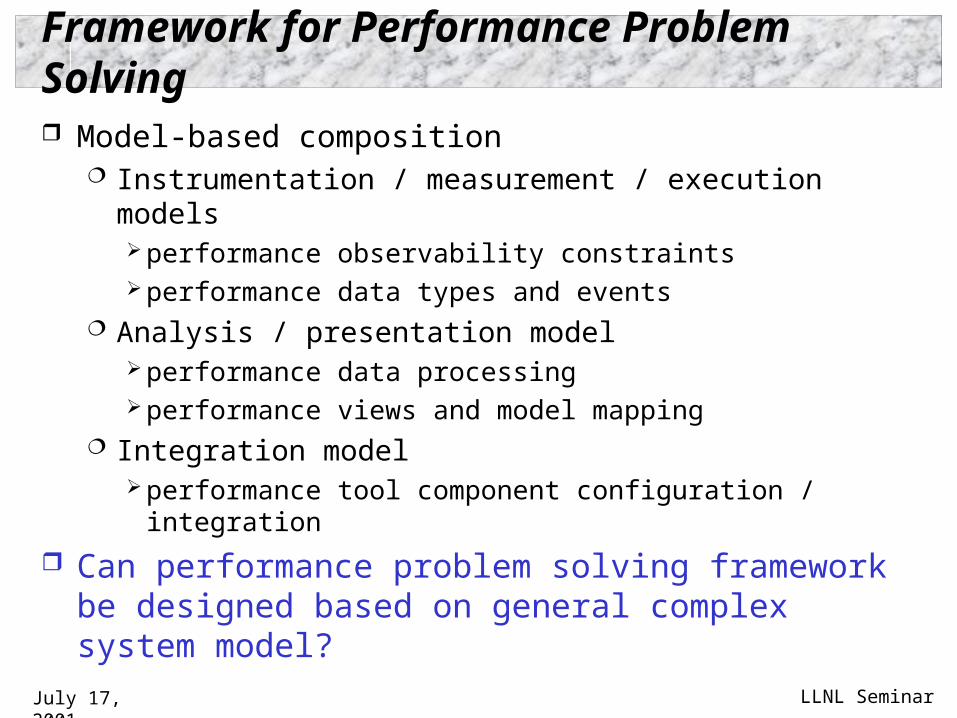
Framework for Performance Problem Solving
Model-based composition Instrumentation / measurement / execution models
performance observability constraints performance data types and events
Analysis / presentation model performance data processing performance views and model mapping
Integration model performance tool component configuration / integration
Can performance problem solving framework be designed based on general complex system model?
July 17, 2001 LLNL Seminar
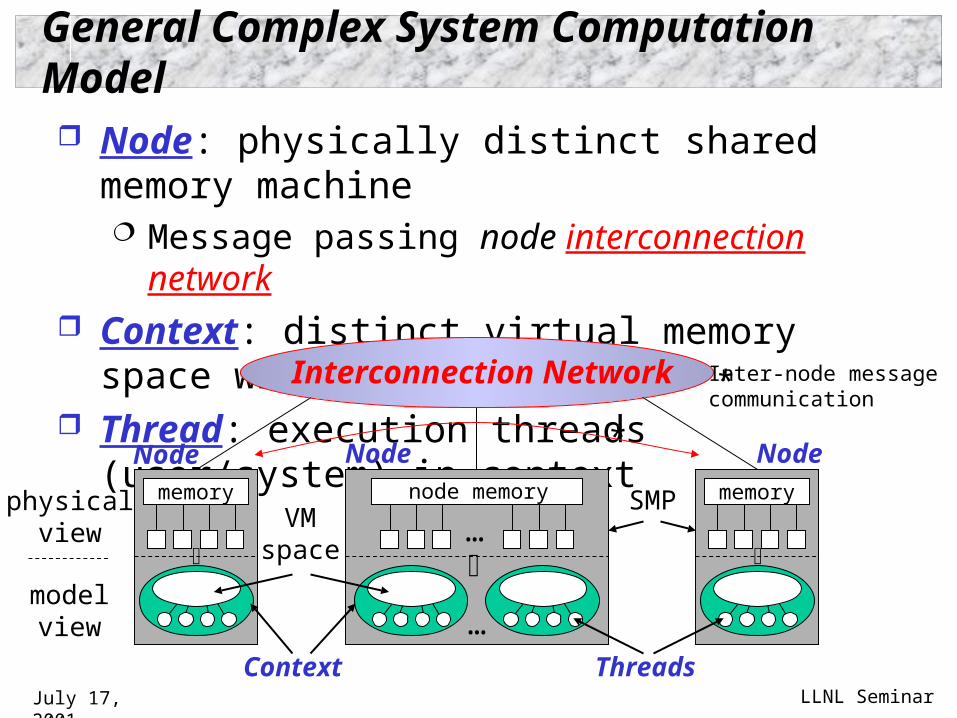
General Complex System Computation Model
Node: physically distinct shared memory machine Message passing node interconnection network
Context: distinct virtual memory space within node Thread: execution threads (user/system) in context
memory
memory
Node Node Node
VMspace
Context
SMP
Threads
node memory
…
…
Interconnection Network Inter-node messagecommunication
*
*
physicalview
modelview
July 17, 2001 LLNL Seminar
TAU Performance Framework
Tuning and Analysis Utilities Performance system framework for scalable parallel
and distributed high-performance computing Targets a general complex system computation model
nodes / contexts / threads Multi-level: system / software / parallelism Measurement and analysis abstraction
Integrated toolkit for performance instrumentation, measurement, analysis, and visualization Portable performance profiling/tracing facility Open software approach
July 17, 2001 LLNL Seminar
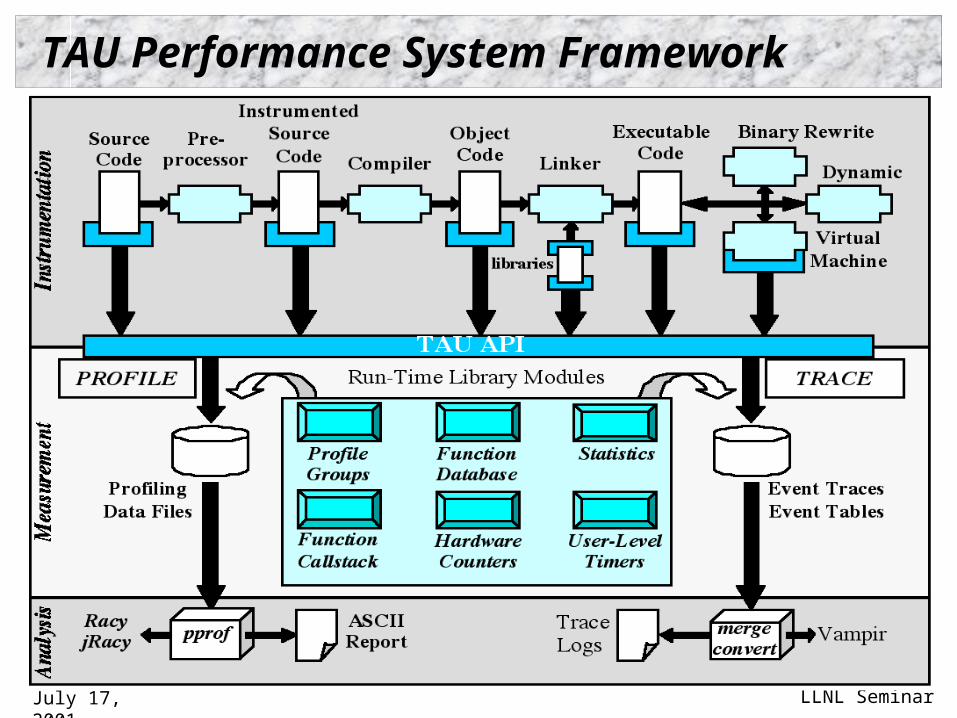
TAU Performance System Framework
July 17, 2001 LLNL Seminar
TAU Instrumentation
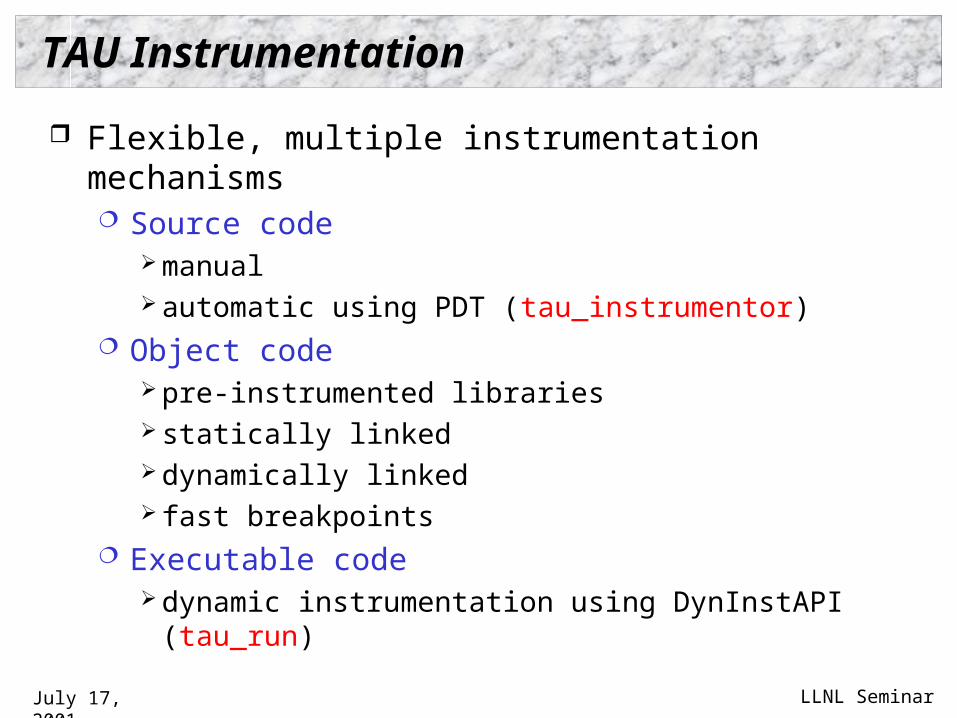
Flexible, multiple instrumentation mechanisms Source code
manual automatic using PDT (tau_instrumentor)
Object code pre-instrumented libraries statically linked dynamically linked fast breakpoints
Executable code dynamic instrumentation using DynInstAPI (tau_run)
July 17, 2001 LLNL Seminar
TAU Instrumentation (continued)
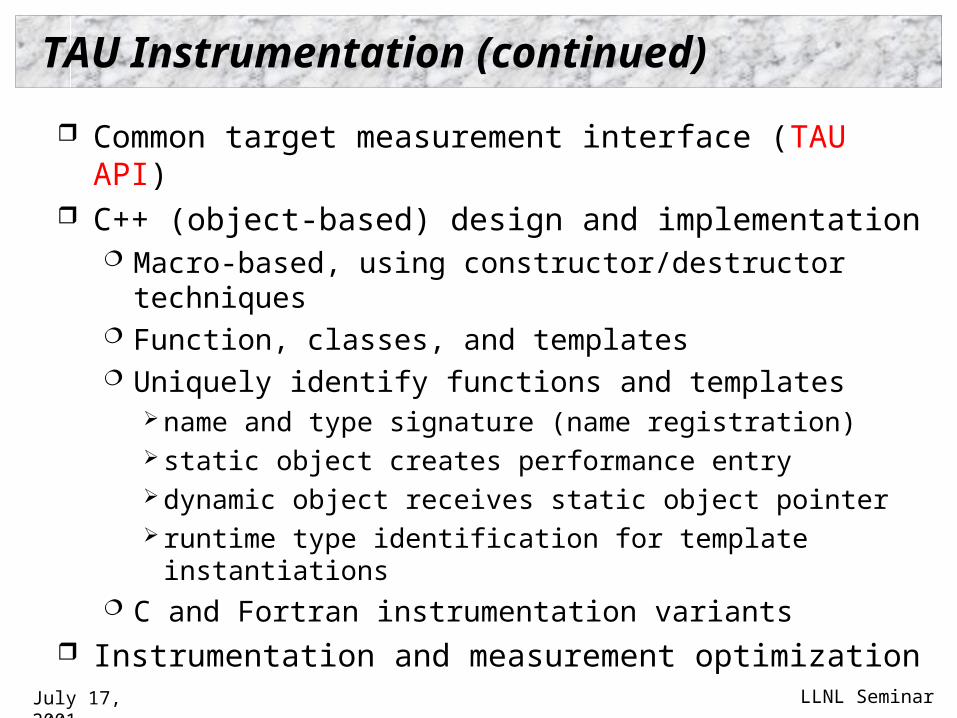
Common target measurement interface (TAU API) C++ (object-based) design and implementation
Macro-based, using constructor/destructor techniques Function, classes, and templates Uniquely identify functions and templates
name and type signature (name registration) static object creates performance entry dynamic object receives static object pointer runtime type identification for template instantiations
C and Fortran instrumentation variants Instrumentation and measurement optimization
July 17, 2001 LLNL Seminar
TAU Measurement
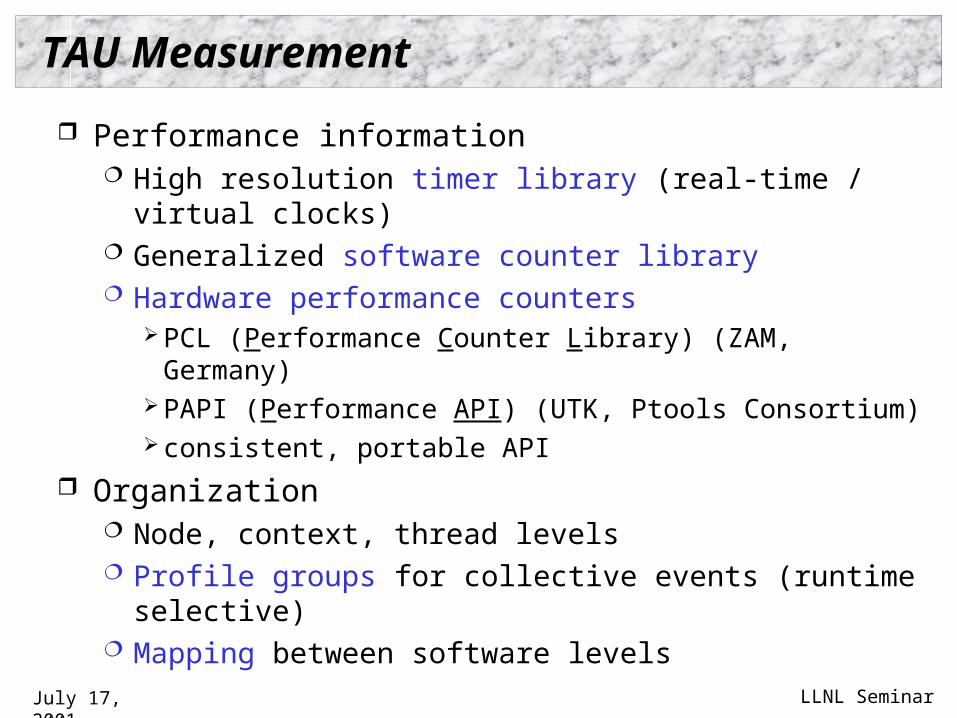
Performance information High resolution timer library (real-time / virtual clocks) Generalized software counter library Hardware performance counters
PCL (Performance Counter Library) (ZAM, Germany) PAPI (Performance API) (UTK, Ptools Consortium) consistent, portable API
Organization Node, context, thread levels Profile groups for collective events (runtime selective) Mapping between software levels
July 17, 2001 LLNL Seminar
TAU Measurement (continued)
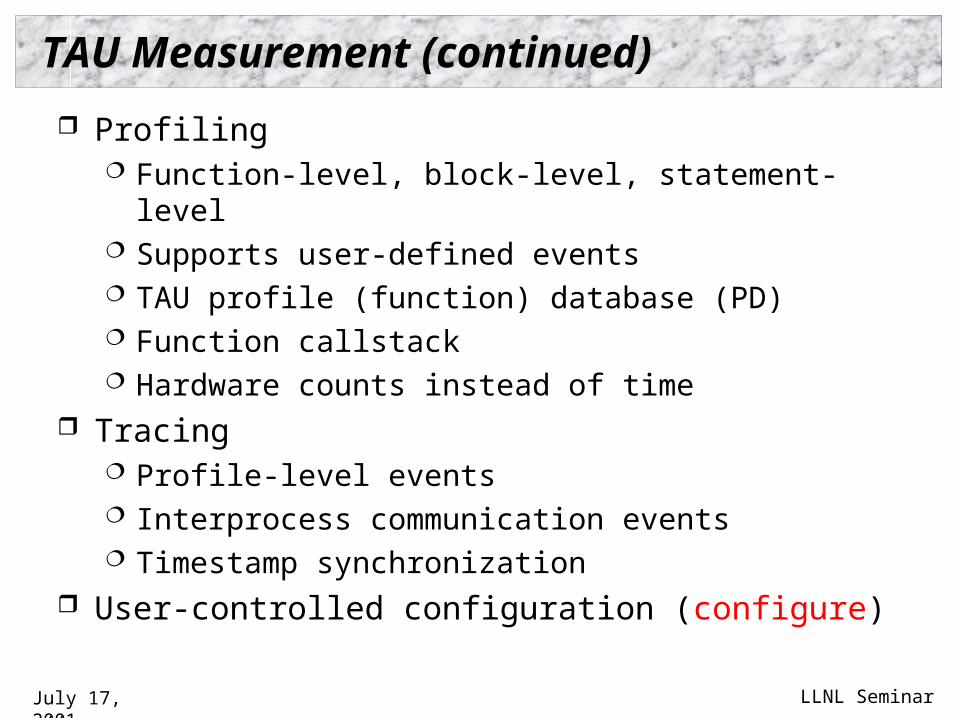
Profiling Function-level, block-level, statement-level Supports user-defined events TAU profile (function) database (PD) Function callstack Hardware counts instead of time
Tracing Profile-level events Interprocess communication events Timestamp synchronization
User-controlled configuration (configure)
July 17, 2001 LLNL Seminar
TAU Analysis
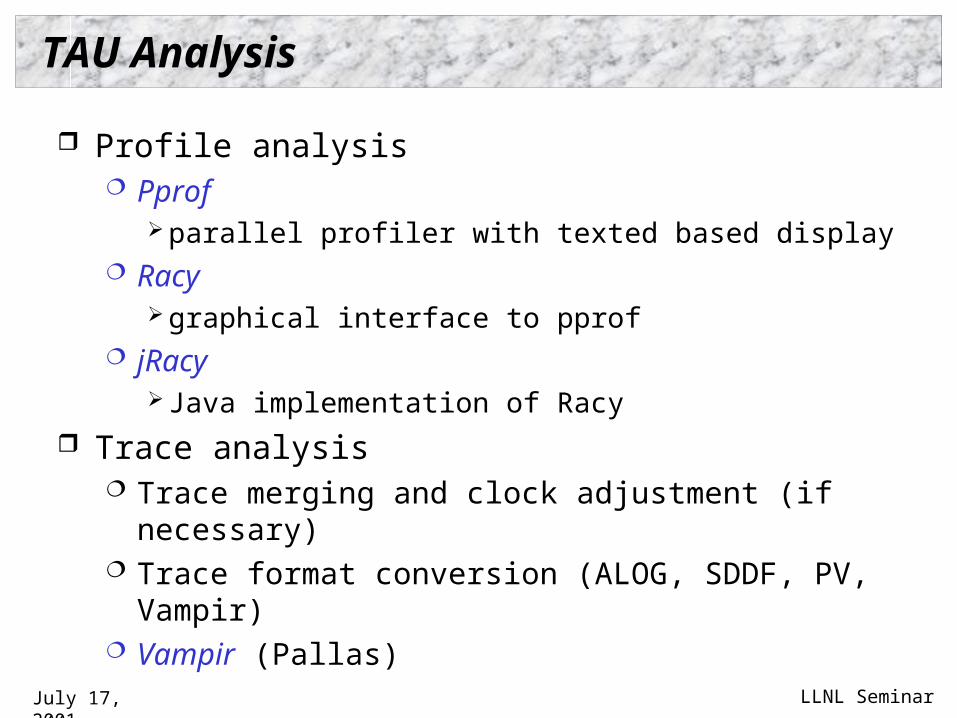
Profile analysis Pprof
parallel profiler with texted based display Racy
graphical interface to pprof jRacy
Java implementation of Racy
Trace analysis Trace merging and clock adjustment (if necessary) Trace format conversion (ALOG, SDDF, PV, Vampir) Vampir (Pallas)
July 17, 2001 LLNL Seminar
Strategies for Empirical Performance Evaluation
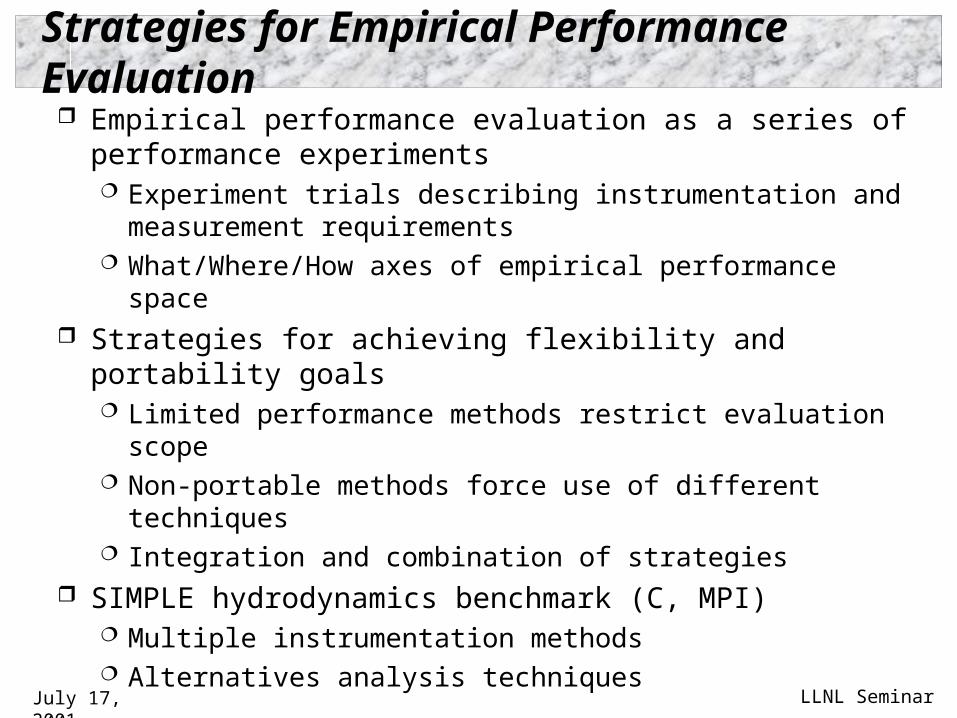
Empirical performance evaluation as a series of performance experiments Experiment trials describing instrumentation and
measurement requirements What/Where/How axes of empirical performance space
Strategies for achieving flexibility and portability goals Limited performance methods restrict evaluation scope Non-portable methods force use of different techniques Integration and combination of strategies
SIMPLE hydrodynamics benchmark (C, MPI) Multiple instrumentation methods Alternatives analysis techniques
July 17, 2001 LLNL Seminar
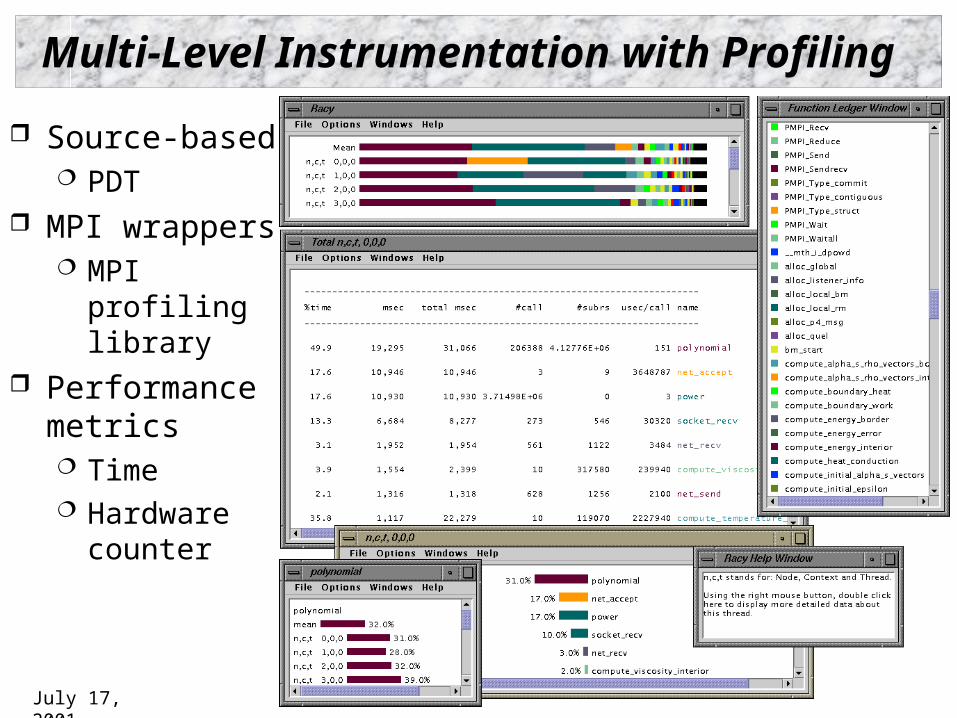
Multi-Level Instrumentation with Profiling
Source-based PDT
MPI wrappers MPI
profiling library
Performance metrics Time Hardware
counter
July 17, 2001 LLNL Seminar
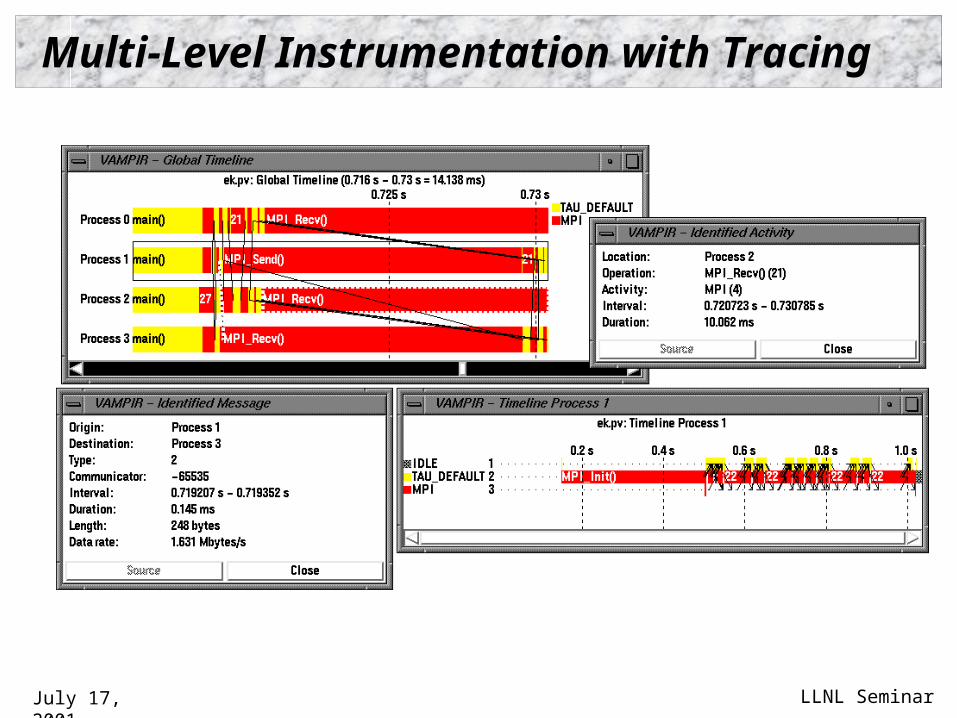
Multi-Level Instrumentation with Tracing
July 17, 2001 LLNL Seminar
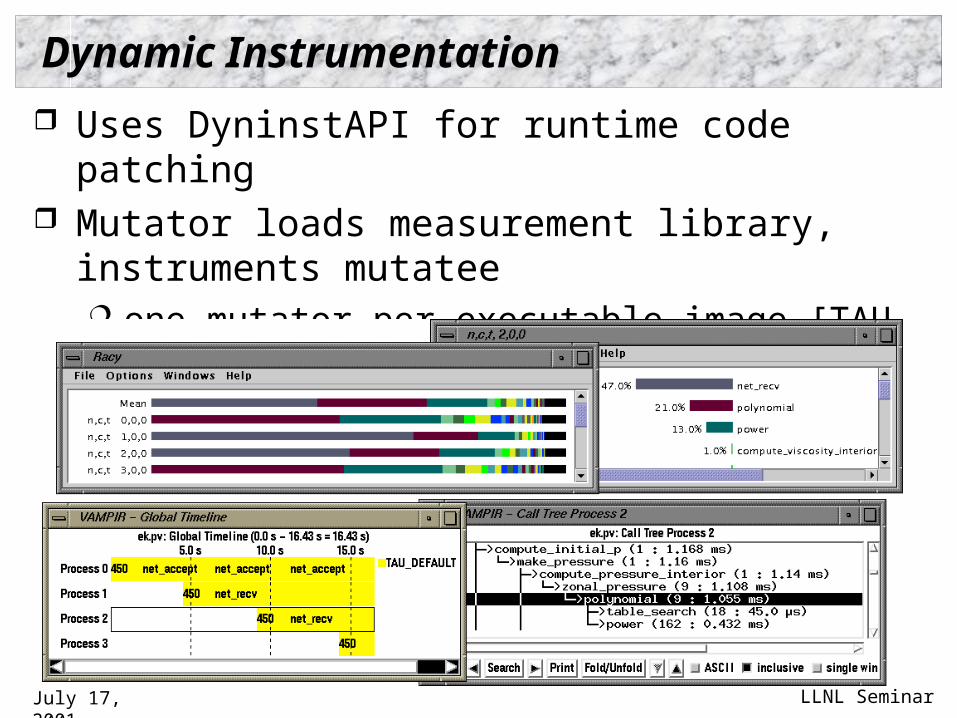
Dynamic Instrumentation
Uses DyninstAPI for runtime code patching Mutator loads measurement library, instruments mutatee
one mutator per executable image [TAU, DynaProf] one mutator for several executables [Paradyn, DPCL]
July 17, 2001 LLNL Seminar
Performance Perturbation Study
Measurement alternatives PAPI wallclock overhead 27% lower than gettimeofday
system call under IA-32 Linux 2.x Source vs. runtime instrumentation
source 23% lower than runtime for TAU profiling Need to balance alternatives
Abstractions and instrumentation levels Flexibility /simplicity
“Instrumentation and Measurement Strategies for Flexible and Portable Empirical Performance Evaluation”, PDPTA, June 2001.
July 17, 2001 LLNL Seminar
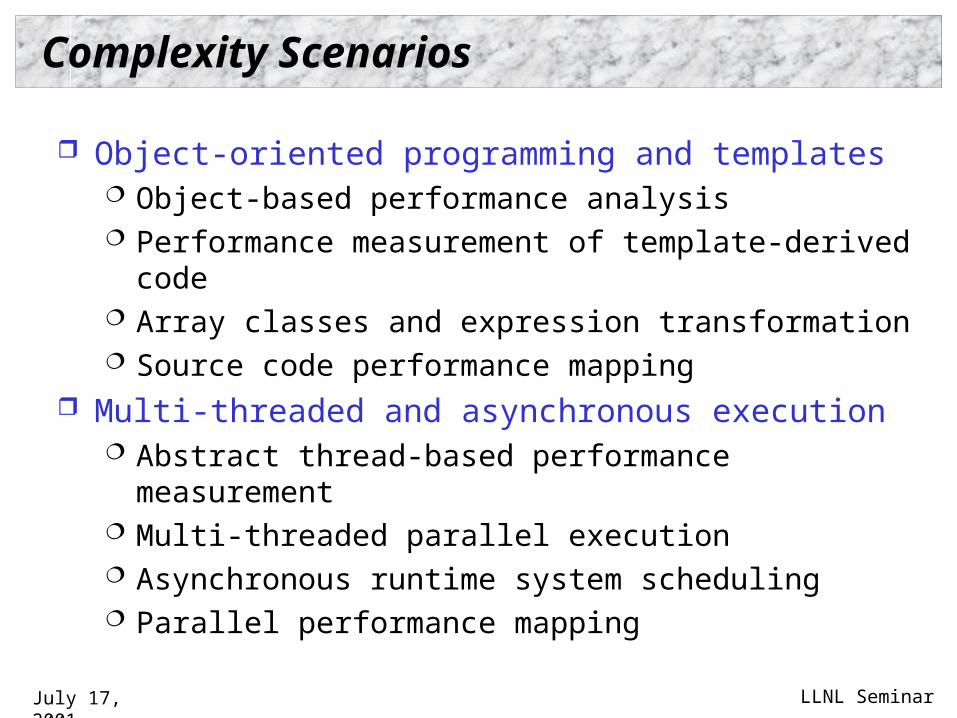
Complexity Scenarios
Object-oriented programming and templates Object-based performance analysis Performance measurement of template-derived code Array classes and expression transformation Source code performance mapping
Multi-threaded and asynchronous execution Abstract thread-based performance measurement Multi-threaded parallel execution Asynchronous runtime system scheduling Parallel performance mapping
July 17, 2001 LLNL Seminar
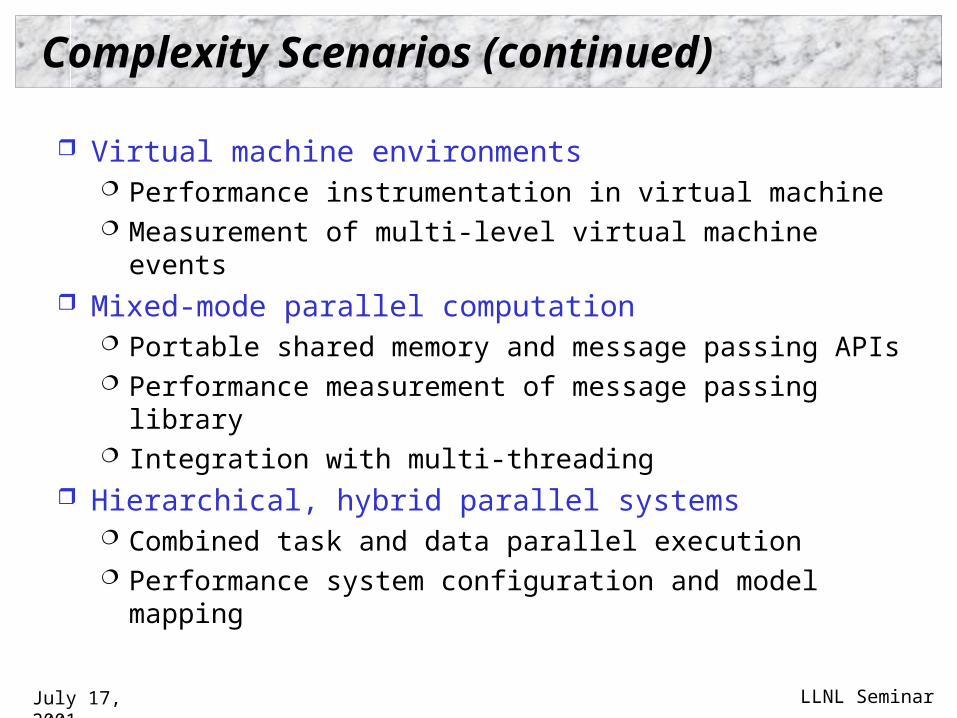
Complexity Scenarios (continued)
Virtual machine environments Performance instrumentation in virtual machine Measurement of multi-level virtual machine events
Mixed-mode parallel computation Portable shared memory and message passing APIs Performance measurement of message passing library Integration with multi-threading
Hierarchical, hybrid parallel systems Combined task and data parallel execution Performance system configuration and model mapping
July 17, 2001 LLNL Seminar
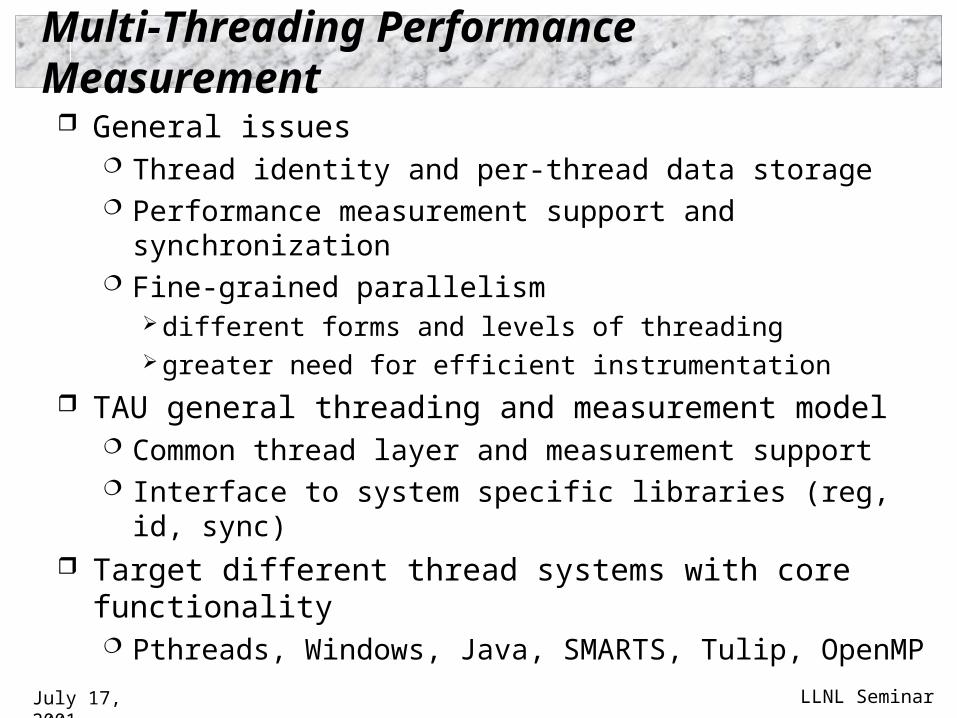
Multi-Threading Performance Measurement
General issues Thread identity and per-thread data storage Performance measurement support and synchronization Fine-grained parallelism
different forms and levels of threading greater need for efficient instrumentation
TAU general threading and measurement model Common thread layer and measurement support Interface to system specific libraries (reg, id, sync)
Target different thread systems with core functionality Pthreads, Windows, Java, SMARTS, Tulip, OpenMP
July 17, 2001 LLNL Seminar
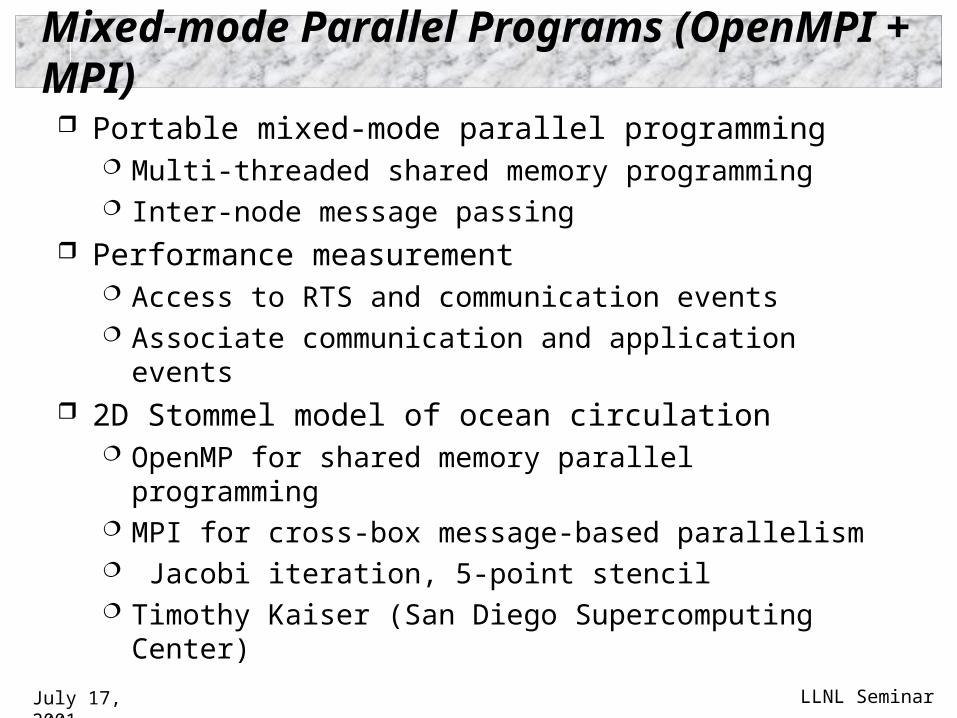
Mixed-mode Parallel Programs (OpenMPI + MPI)
Portable mixed-mode parallel programming Multi-threaded shared memory programming Inter-node message passing
Performance measurement Access to RTS and communication events Associate communication and application events
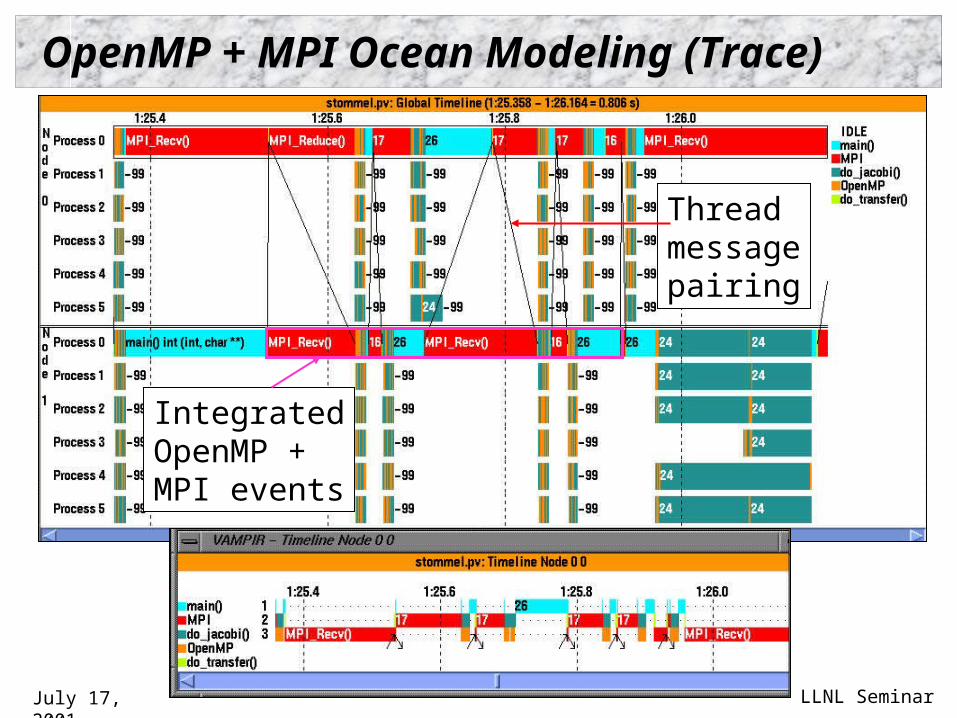
2D Stommel model of ocean circulation OpenMP for shared memory parallel programming MPI for cross-box message-based parallelism Jacobi iteration, 5-point stencil Timothy Kaiser (San Diego Supercomputing Center)
July 17, 2001 LLNL Seminar
OpenMP + MPI Ocean Modeling (Trace)
IntegratedOpenMP +MPI events
Threadmessagepairing
July 17, 2001 LLNL Seminar
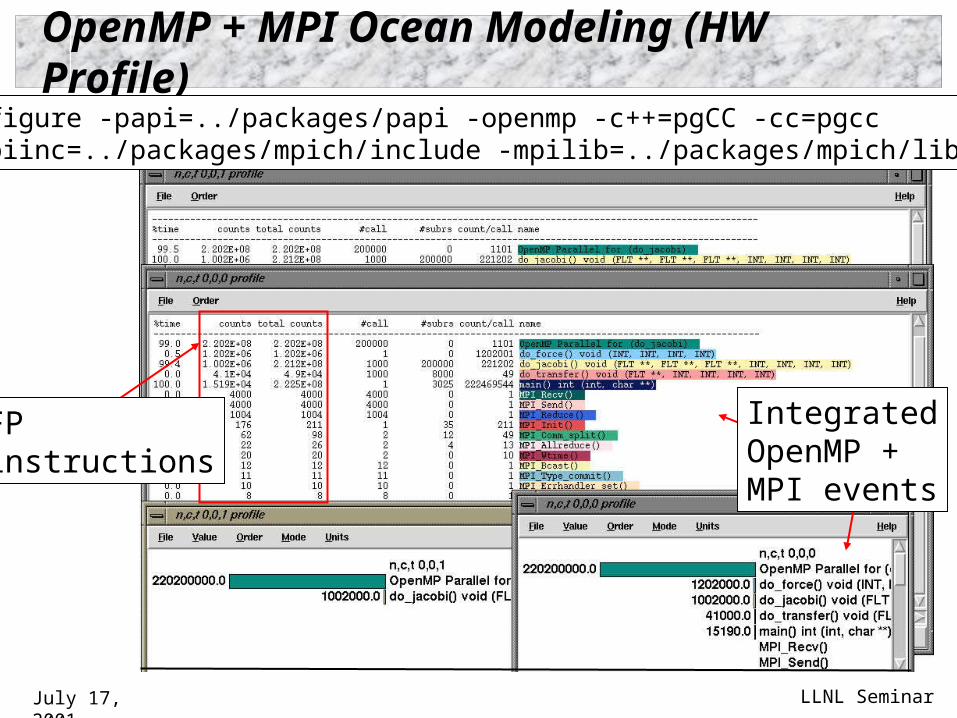
OpenMP + MPI Ocean Modeling (HW Profile)
% configure -papi=../packages/papi -openmp -c++=pgCC -cc=pgcc -mpiinc=../packages/mpich/include -mpilib=../packages/mpich/libo
FPinstructions
IntegratedOpenMP +MPI events
July 17, 2001 LLNL Seminar
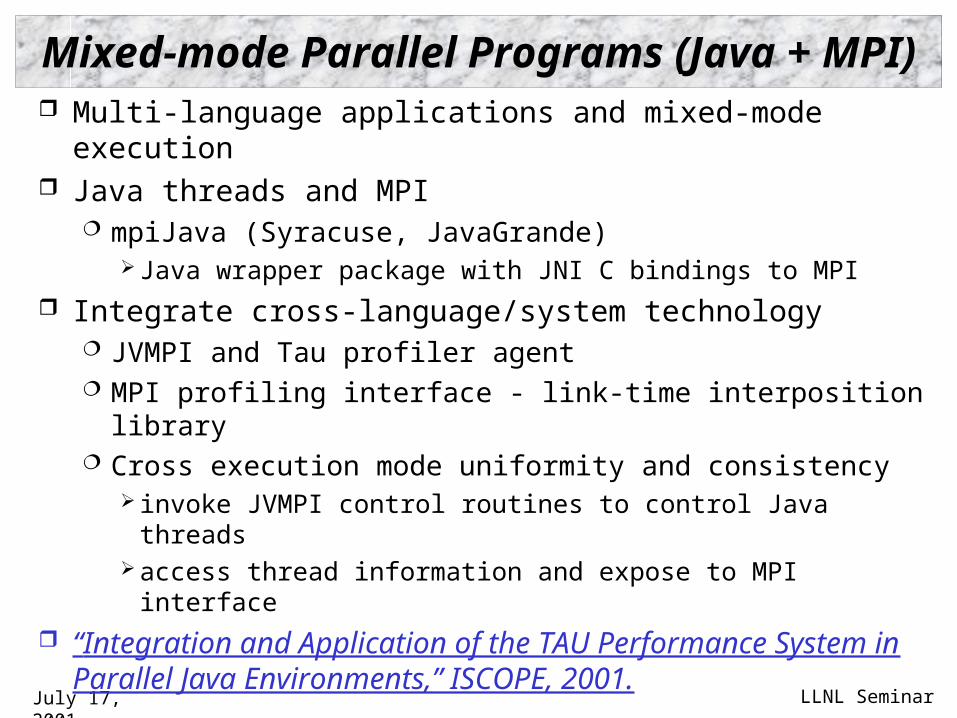
Mixed-mode Parallel Programs (Java + MPI) Multi-language applications and mixed-mode execution Java threads and MPI
mpiJava (Syracuse, JavaGrande) Java wrapper package with JNI C bindings to MPI
Integrate cross-language/system technology JVMPI and Tau profiler agent MPI profiling interface - link-time interposition library Cross execution mode uniformity and consistency
invoke JVMPI control routines to control Java threads access thread information and expose to MPI interface
“Integration and Application of the TAU Performance System in Parallel Java Environments,” ISCOPE, 2001.
July 17, 2001 LLNL Seminar
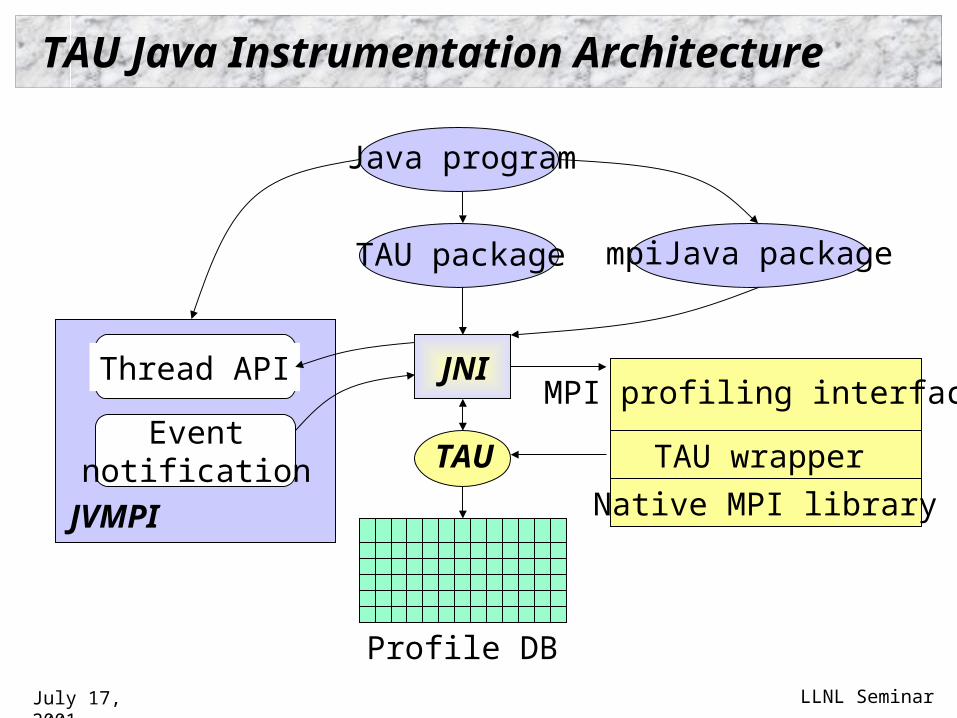
JVMPI
Thread API
Eventnotification
TAU Java Instrumentation Architecture
Java program
TAU package mpiJava package
MPI profiling interface
TAU wrapper
Native MPI library
Profile DB
JNI
TAU
July 17, 2001 LLNL Seminar
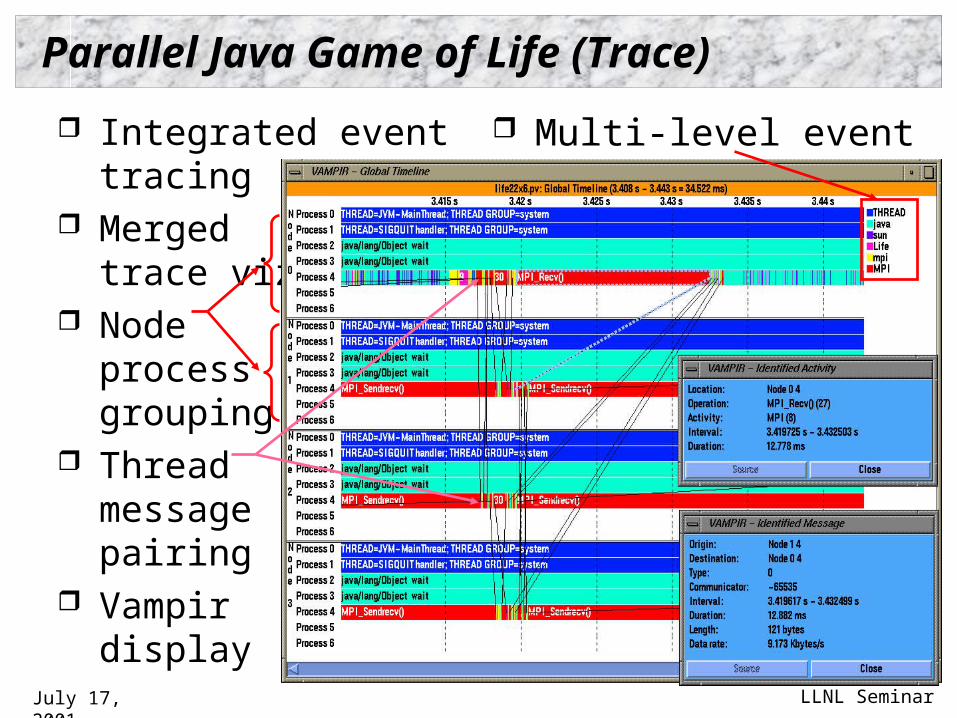
Parallel Java Game of Life (Trace)
Integrated event tracing Merged
trace viz Node
processgrouping
Threadmessagepairing
Vampirdisplay
Multi-level event grouping
July 17, 2001 LLNL Seminar
OMP Performance Tools Interface
Goal 1: Expose OpenMP events and execution states to a performance measurement system What are the OpenMP events / states of interest? What is the nature (mechanism) of the interface?
Goal 2: Make the performance measurement interface portable “Standardize” on interface mechanism / semantics
Goal 3: Support source-level and compiler-level implementation of interface
“Towards a Performance Tools Interface for OpenMP: An Approach Based on Directive Rewriting,” EWOMP 2001.
July 17, 2001 LLNL Seminar
Performance State and Event Model
Based on performance model for (nested) fork-join parallelism, multi-threaded work-sharing, and thread-based synchronization
Define with respect to multi-level state view Level 1: serial and parallel states (with nesting) Level 2: work-sharing states (per team thread) Level 3: synchronization states (per team thread) Level 4: runtime system (thread) states
Events reflect state transitions State enter / exit (begin / end) State graph with event edges
July 17, 2001 LLNL Seminar
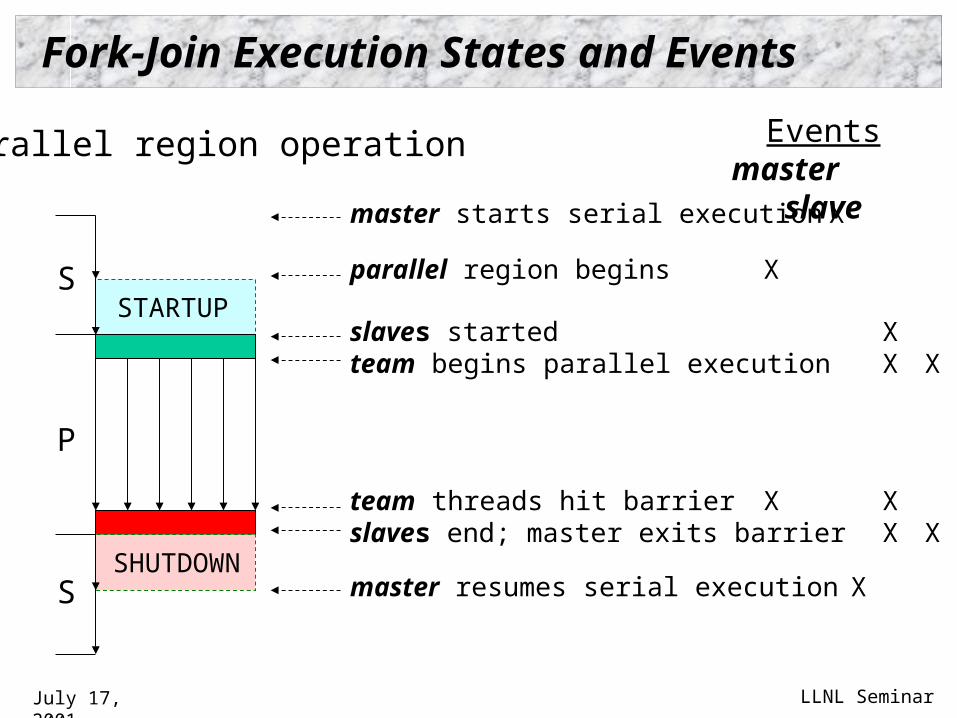
Fork-Join Execution States and Events
Parallel region operation Eventsmaster slave
master starts serial execution X
parallel region begins X
slaves started Xteam begins parallel execution X X
team threads hit barrier X Xslaves end; master exits barrier X X
master resumes serial execution X
S
P
S
STARTUP
SHUTDOWN
July 17, 2001 LLNL Seminar
Performance Measurement Model
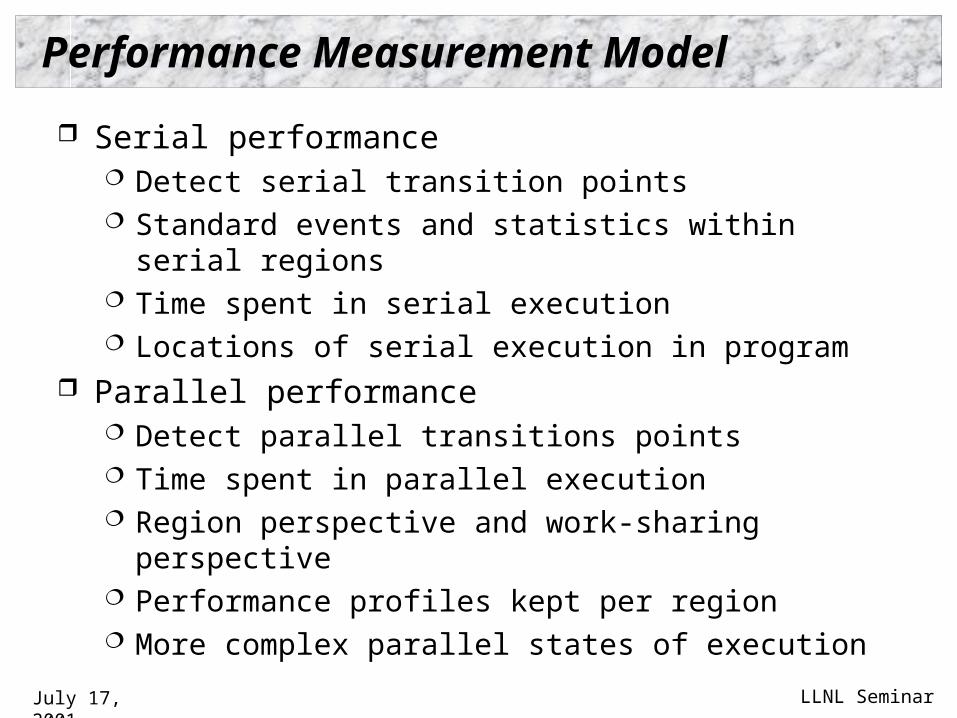
Serial performance Detect serial transition points Standard events and statistics within serial regions Time spent in serial execution Locations of serial execution in program
Parallel performance Detect parallel transitions points Time spent in parallel execution Region perspective and work-sharing perspective Performance profiles kept per region More complex parallel states of execution
July 17, 2001 LLNL Seminar
Event Generation (Callback) Interface
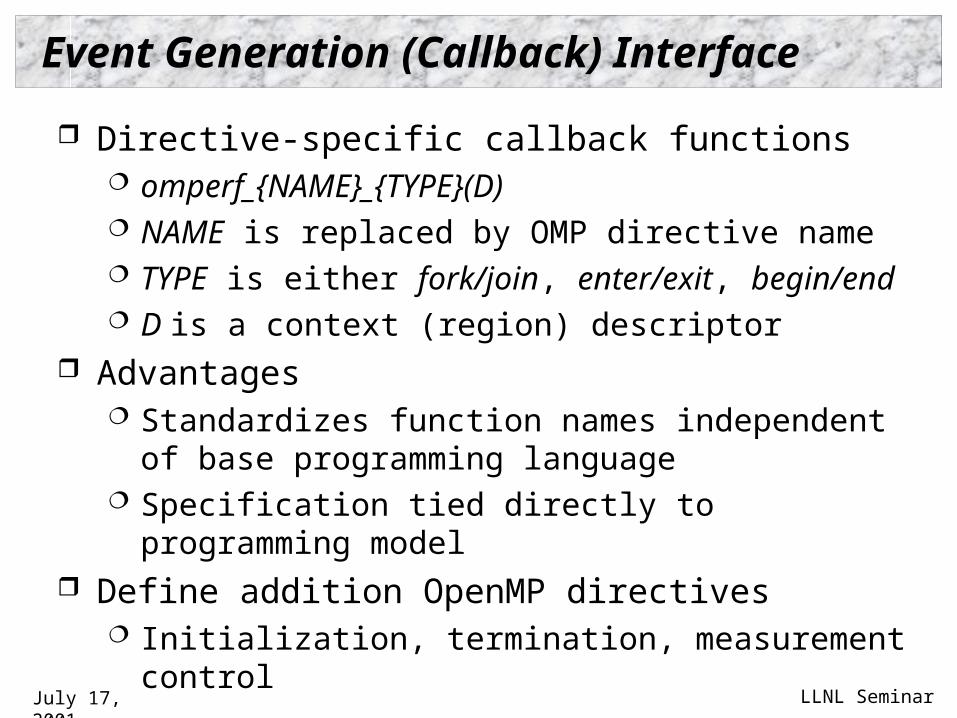
Directive-specific callback functions omperf_{NAME}_{TYPE}(D) NAME is replaced by OMP directive name TYPE is either fork/join, enter/exit, begin/end D is a context (region) descriptor
Advantages Standardizes function names independent of base
programming language Specification tied directly to programming model
Define addition OpenMP directives Initialization, termination, measurement control
July 17, 2001 LLNL Seminar
Instrumentation Alternatives
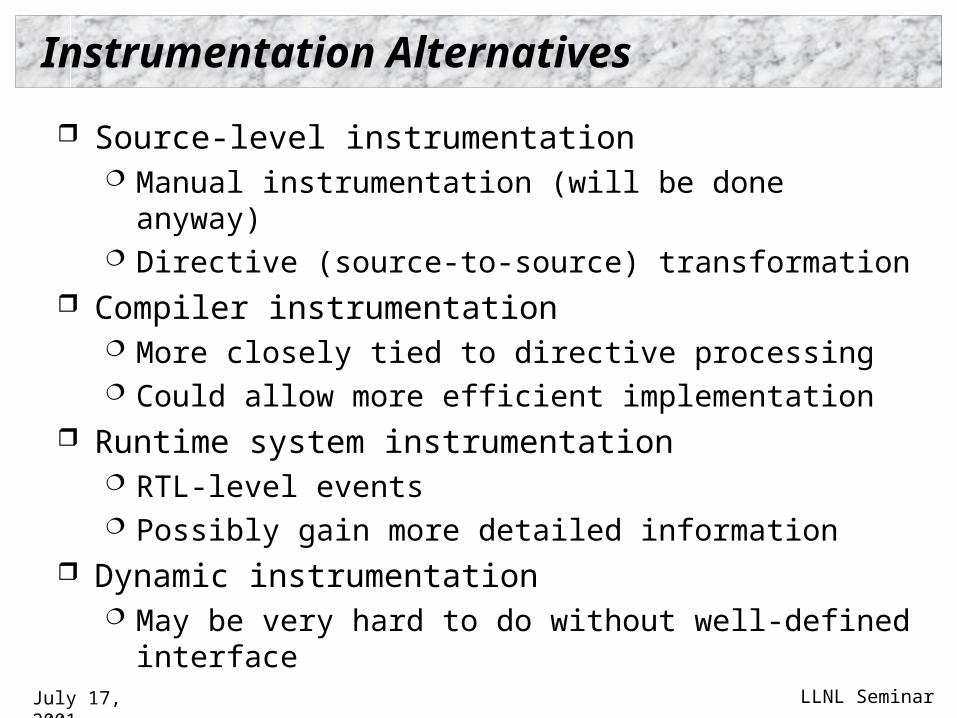
Source-level instrumentation Manual instrumentation (will be done anyway) Directive (source-to-source) transformation
Compiler instrumentation More closely tied to directive processing Could allow more efficient implementation
Runtime system instrumentation RTL-level events Possibly gain more detailed information
Dynamic instrumentation May be very hard to do without well-defined interface
July 17, 2001 LLNL Seminar
Proposal Based on Directive Transformation
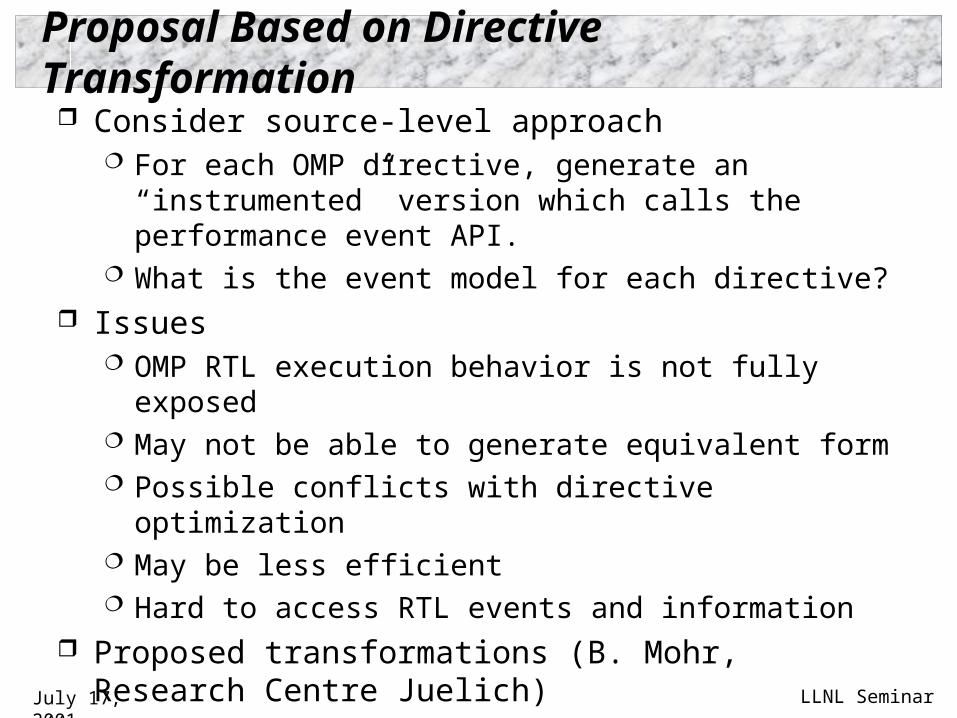
Consider source-level approach For each OMP directive, generate an “instrumented”
version which calls the performance event API. What is the event model for each directive?
Issues OMP RTL execution behavior is not fully exposed May not be able to generate equivalent form Possible conflicts with directive optimization May be less efficient Hard to access RTL events and information
Proposed transformations (B. Mohr, Research Centre Juelich)
July 17, 2001 LLNL Seminar
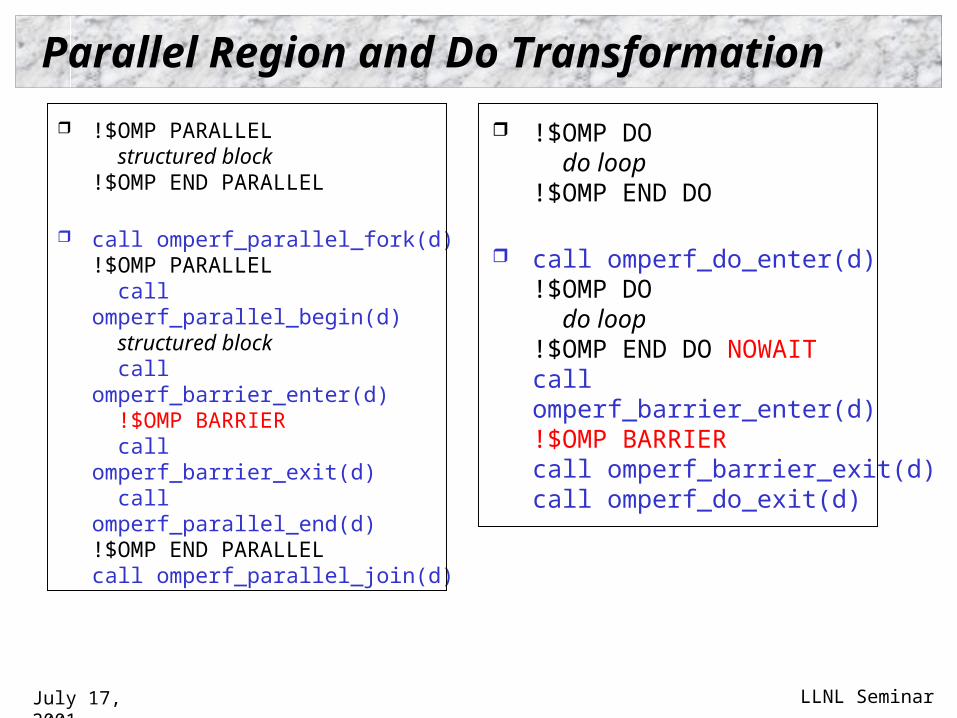
Parallel Region and Do Transformation
!$OMP PARALLEL structured block!$OMP END PARALLEL
call omperf_parallel_fork(d)!$OMP PARALLEL call omperf_parallel_begin(d) structured block call omperf_barrier_enter(d) !$OMP BARRIER call omperf_barrier_exit(d) call omperf_parallel_end(d)!$OMP END PARALLELcall omperf_parallel_join(d)
!$OMP DO do loop!$OMP END DO
call omperf_do_enter(d)!$OMP DO do loop!$OMP END DO NOWAITcall omperf_barrier_enter(d)!$OMP BARRIERcall omperf_barrier_exit(d)call omperf_do_exit(d)
July 17, 2001 LLNL Seminar
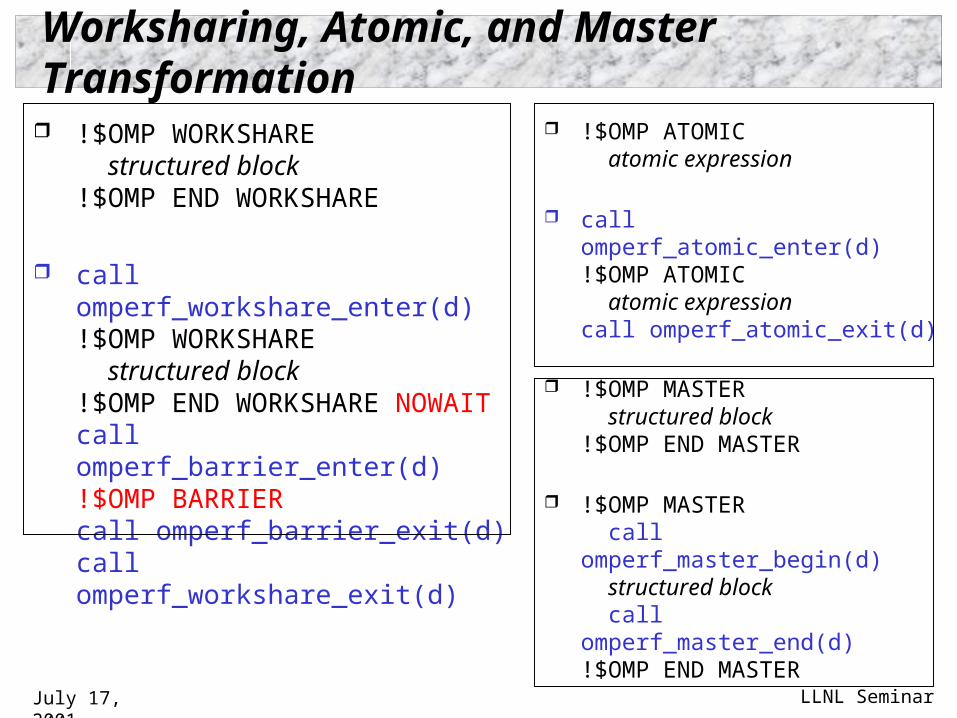
Worksharing, Atomic, and Master Transformation
!$OMP WORKSHARE structured block!$OMP END WORKSHARE
call omperf_workshare_enter(d)!$OMP WORKSHARE structured block!$OMP END WORKSHARE NOWAITcall omperf_barrier_enter(d)!$OMP BARRIERcall omperf_barrier_exit(d)call omperf_workshare_exit(d)
!$OMP ATOMIC atomic expression
call omperf_atomic_enter(d)!$OMP ATOMIC atomic expressioncall omperf_atomic_exit(d)
!$OMP MASTER structured block!$OMP END MASTER
!$OMP MASTER call omperf_master_begin(d) structured block call omperf_master_end(d)!$OMP END MASTER
July 17, 2001 LLNL Seminar
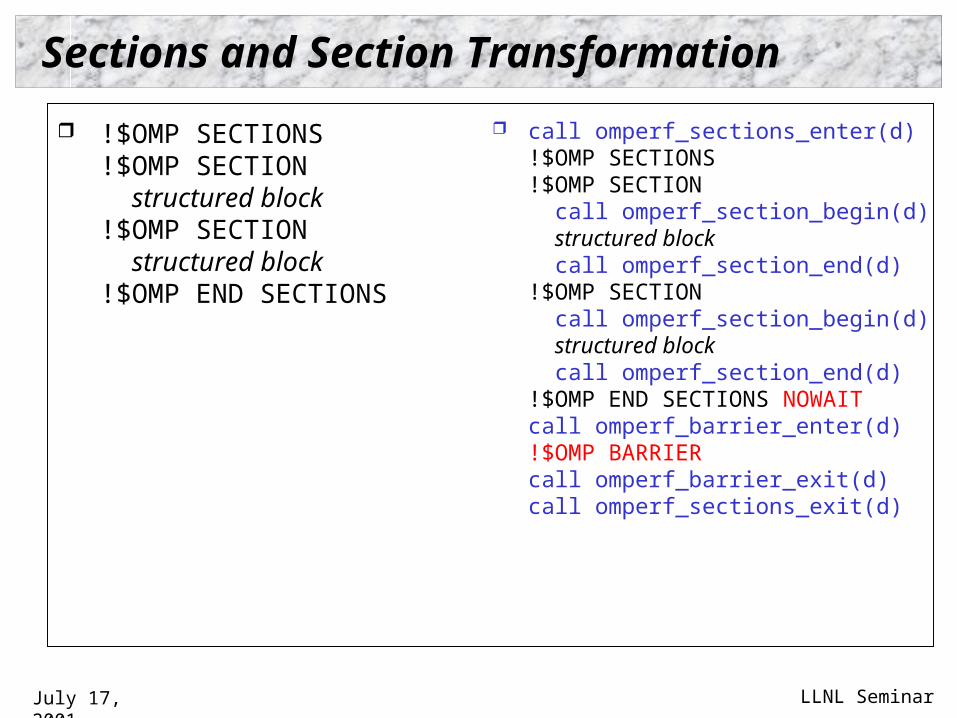
Sections and Section Transformation
!$OMP SECTIONS!$OMP SECTION structured block!$OMP SECTION structured block!$OMP END SECTIONS
call omperf_sections_enter(d)!$OMP SECTIONS!$OMP SECTION call omperf_section_begin(d) structured block call omperf_section_end(d)!$OMP SECTION call omperf_section_begin(d) structured block call omperf_section_end(d)!$OMP END SECTIONS NOWAITcall omperf_barrier_enter(d)!$OMP BARRIERcall omperf_barrier_exit(d)call omperf_sections_exit(d)
July 17, 2001 LLNL Seminar
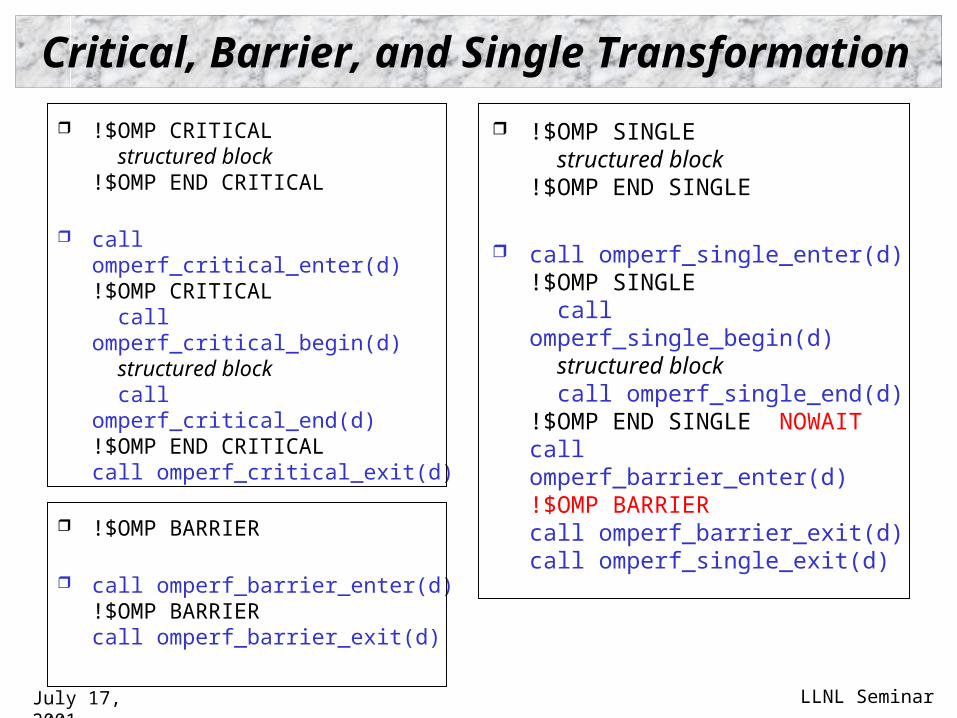
Critical, Barrier, and Single Transformation
!$OMP CRITICAL structured block!$OMP END CRITICAL
call omperf_critical_enter(d)!$OMP CRITICAL call omperf_critical_begin(d) structured block call omperf_critical_end(d)!$OMP END CRITICALcall omperf_critical_exit(d)
!$OMP BARRIER
call omperf_barrier_enter(d)!$OMP BARRIERcall omperf_barrier_exit(d)
!$OMP SINGLE structured block!$OMP END SINGLE
call omperf_single_enter(d)!$OMP SINGLE call omperf_single_begin(d) structured block call omperf_single_end(d)!$OMP END SINGLE NOWAITcall omperf_barrier_enter(d)!$OMP BARRIERcall omperf_barrier_exit(d)call omperf_single_exit(d)
July 17, 2001 LLNL Seminar
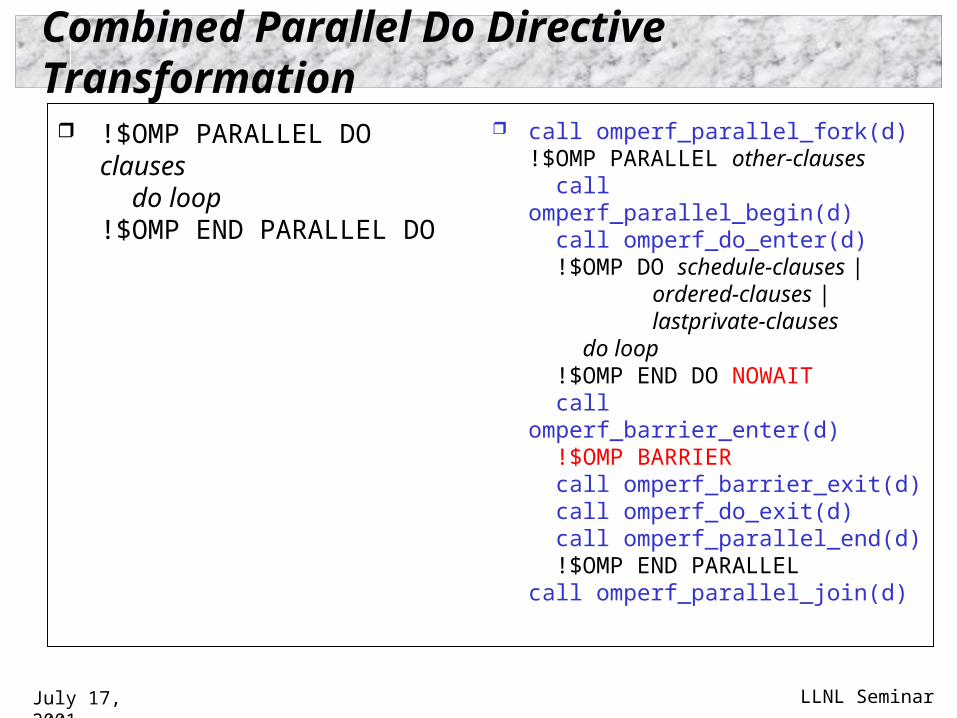
Combined Parallel Do Directive Transformation
!$OMP PARALLEL DO clauses do loop!$OMP END PARALLEL DO
call omperf_parallel_fork(d)!$OMP PARALLEL other-clauses call omperf_parallel_begin(d) call omperf_do_enter(d) !$OMP DO schedule-clauses | ordered-clauses | lastprivate-clauses do loop !$OMP END DO NOWAIT call omperf_barrier_enter(d) !$OMP BARRIER call omperf_barrier_exit(d) call omperf_do_exit(d) call omperf_parallel_end(d) !$OMP END PARALLELcall omperf_parallel_join(d)
July 17, 2001 LLNL Seminar
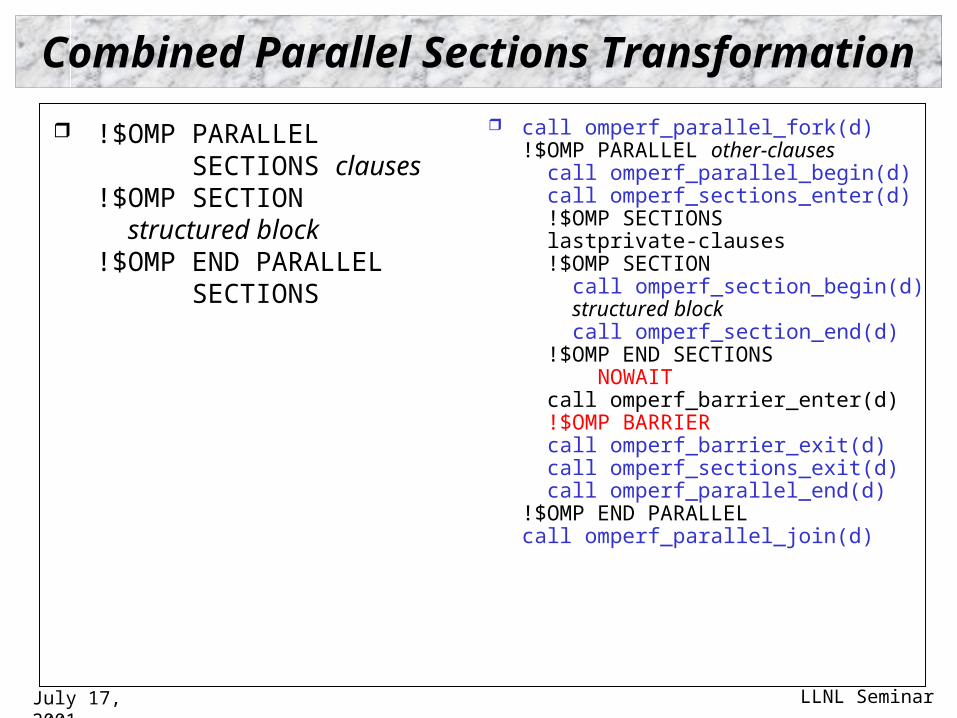
Combined Parallel Sections Transformation
!$OMP PARALLELSECTIONS clauses
!$OMP SECTION structured block!$OMP END PARALLEL
SECTIONS
call omperf_parallel_fork(d)!$OMP PARALLEL other-clauses call omperf_parallel_begin(d) call omperf_sections_enter(d) !$OMP SECTIONS lastprivate-clauses !$OMP SECTION call omperf_section_begin(d) structured block call omperf_section_end(d) !$OMP END SECTIONS
NOWAIT call omperf_barrier_enter(d) !$OMP BARRIER call omperf_barrier_exit(d) call omperf_sections_exit(d) call omperf_parallel_end(d)!$OMP END PARALLELcall omperf_parallel_join(d)
July 17, 2001 LLNL Seminar
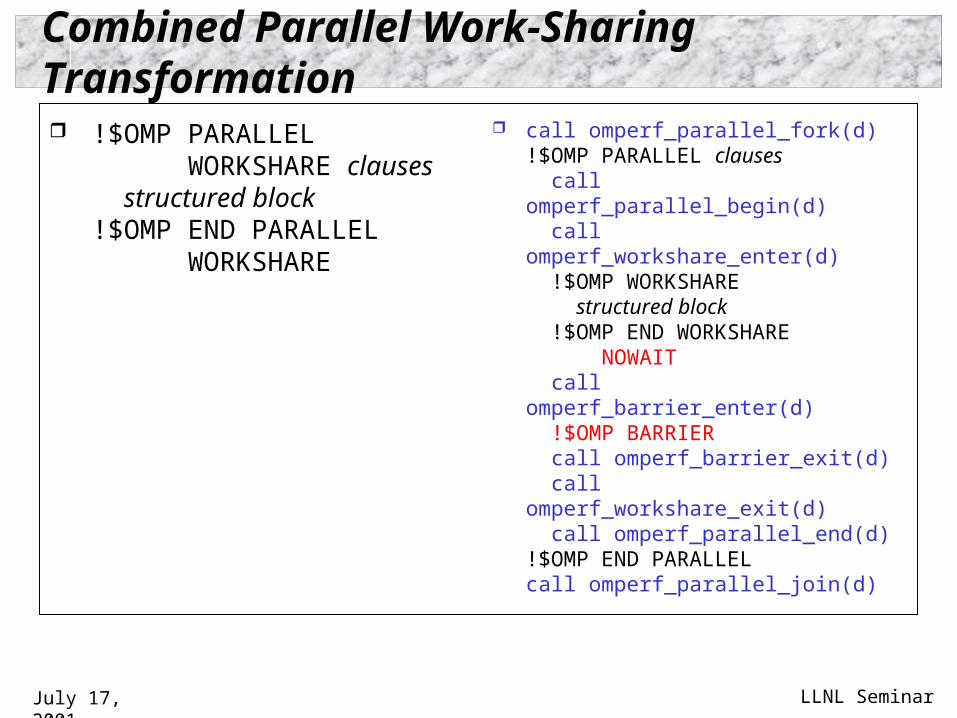
Combined Parallel Work-Sharing Transformation
!$OMP PARALLELWORKSHARE clauses
structured block!$OMP END PARALLEL
WORKSHARE
call omperf_parallel_fork(d)!$OMP PARALLEL clauses call omperf_parallel_begin(d) call omperf_workshare_enter(d) !$OMP WORKSHARE structured block !$OMP END WORKSHARE
NOWAIT call omperf_barrier_enter(d) !$OMP BARRIER call omperf_barrier_exit(d) call omperf_workshare_exit(d) call omperf_parallel_end(d)!$OMP END PARALLELcall omperf_parallel_join(d)
July 17, 2001 LLNL Seminar
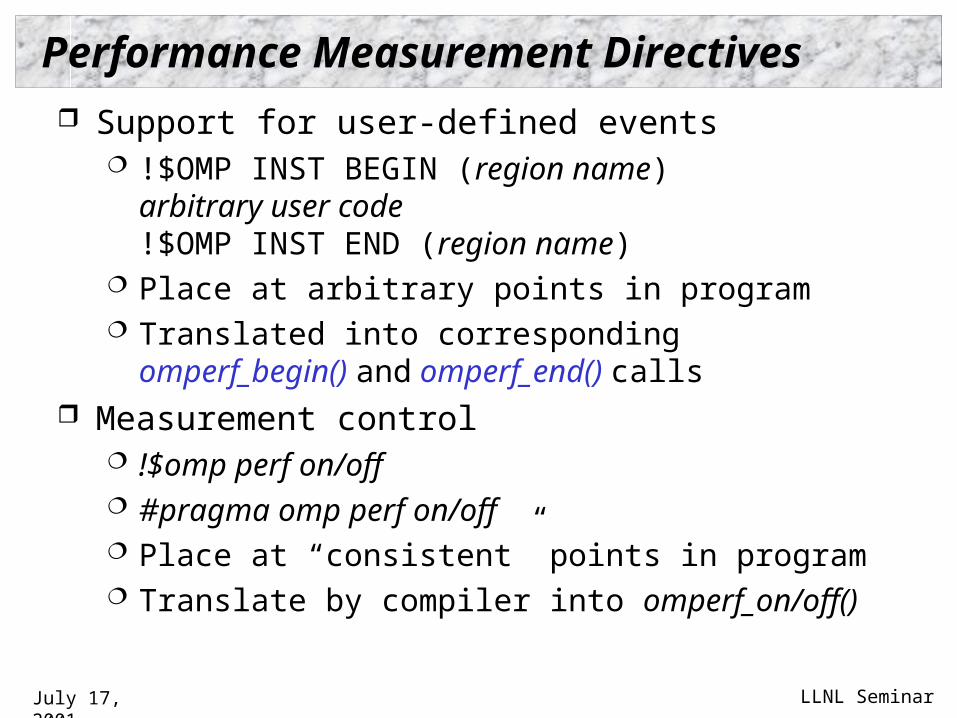
Performance Measurement Directives
Support for user-defined events !$OMP INST BEGIN (region name)
arbitrary user code!$OMP INST END (region name)
Place at arbitrary points in program Translated into corresponding omperf_begin() and
omperf_end() calls Measurement control
!$omp perf on/off #pragma omp perf on/off Place at “consistent” points in program Translate by compiler into omperf_on/off()
July 17, 2001 LLNL Seminar
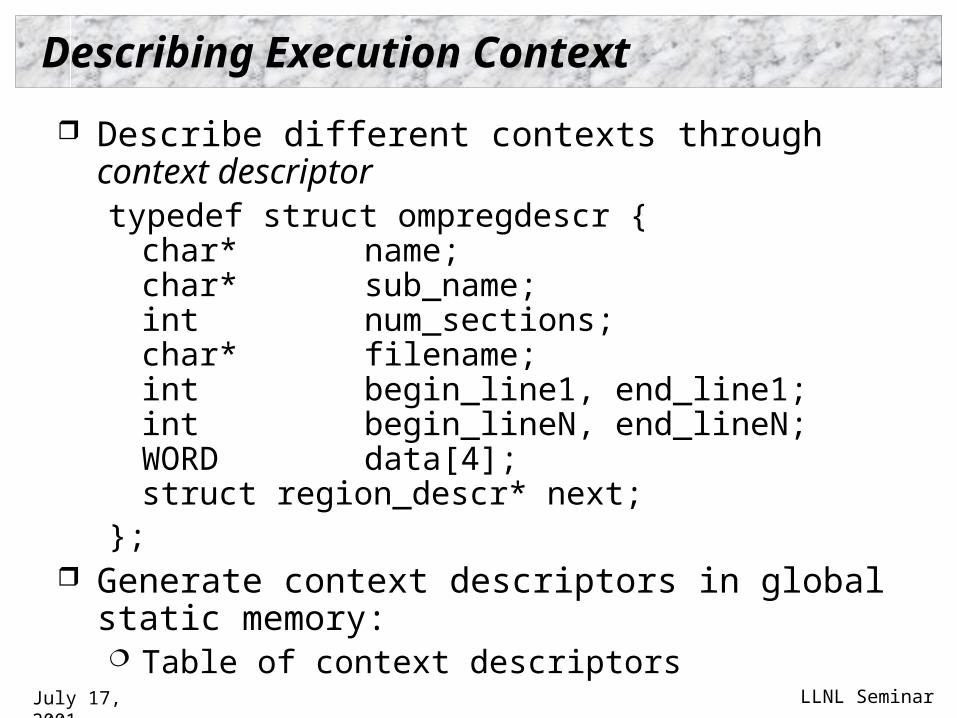
Describing Execution Context
Describe different contexts through context descriptortypedef struct ompregdescr {
char* name;char* sub_name;int num_sections;char* filename;int begin_line1, end_line1;int begin_lineN, end_lineN;WORD data[4];struct region_descr* next;
}; Generate context descriptors in global static memory:
Table of context descriptors
July 17, 2001 LLNL Seminar
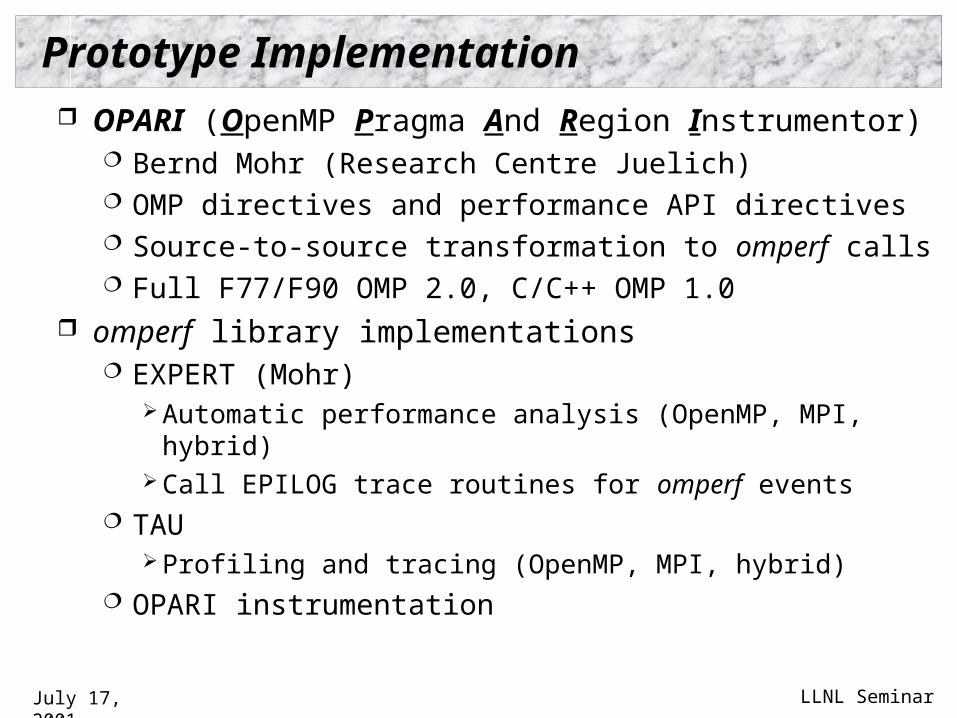
Prototype Implementation
OPARI (OpenMP Pragma And Region Instrumentor) Bernd Mohr (Research Centre Juelich) OMP directives and performance API directives Source-to-source transformation to omperf calls Full F77/F90 OMP 2.0, C/C++ OMP 1.0
omperf library implementations EXPERT (Mohr)
Automatic performance analysis (OpenMP, MPI, hybrid) Call EPILOG trace routines for omperf events
TAU Profiling and tracing (OpenMP, MPI, hybrid)
OPARI instrumentation
July 17, 2001 LLNL Seminar
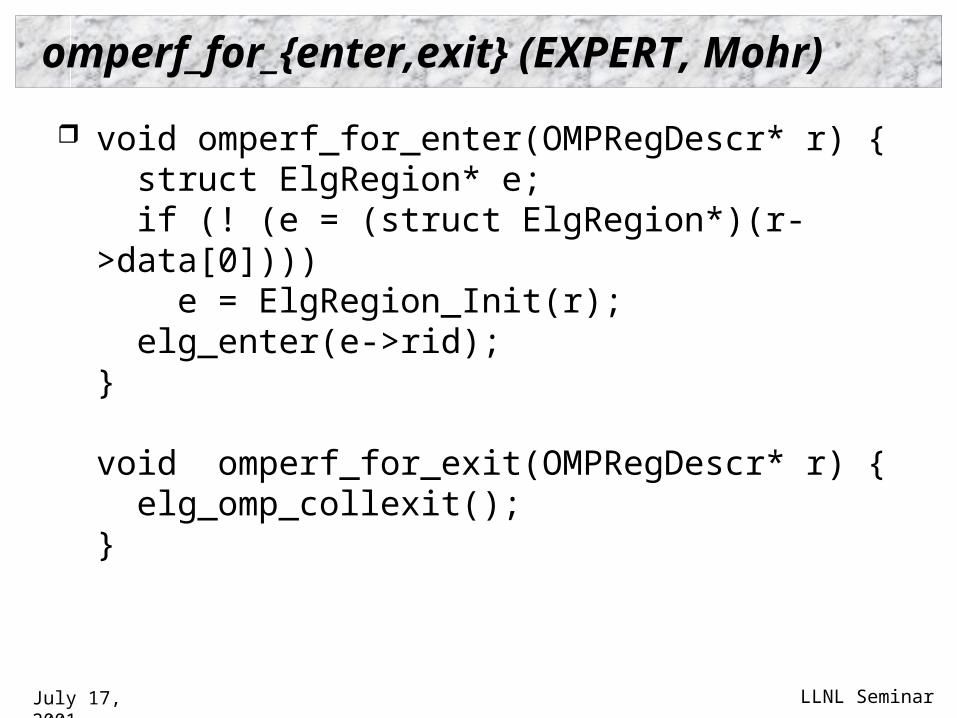
omperf_for_{enter,exit} (EXPERT, Mohr)
void omperf_for_enter(OMPRegDescr* r) { struct ElgRegion* e; if (! (e = (struct ElgRegion*)(r->data[0]))) e = ElgRegion_Init(r); elg_enter(e->rid);}
void omperf_for_exit(OMPRegDescr* r) { elg_omp_collexit();}
July 17, 2001 LLNL Seminar
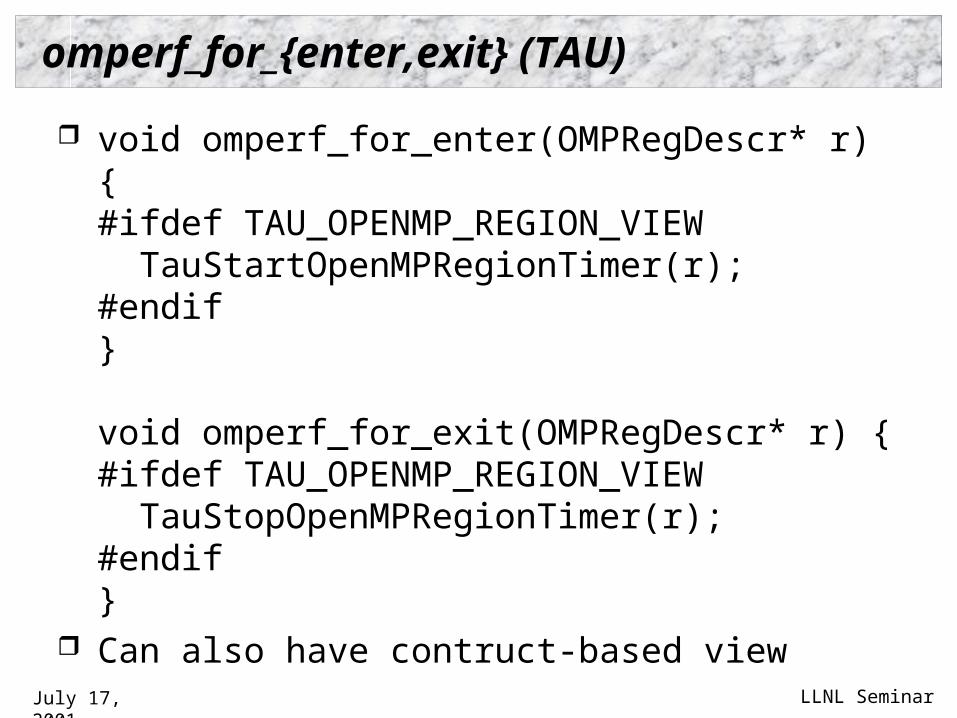
omperf_for_{enter,exit} (TAU)
void omperf_for_enter(OMPRegDescr* r) {#ifdef TAU_OPENMP_REGION_VIEW TauStartOpenMPRegionTimer(r);#endif}
void omperf_for_exit(OMPRegDescr* r) {#ifdef TAU_OPENMP_REGION_VIEW TauStopOpenMPRegionTimer(r);#endif}
Can also have contruct-based view
July 17, 2001 LLNL Seminar
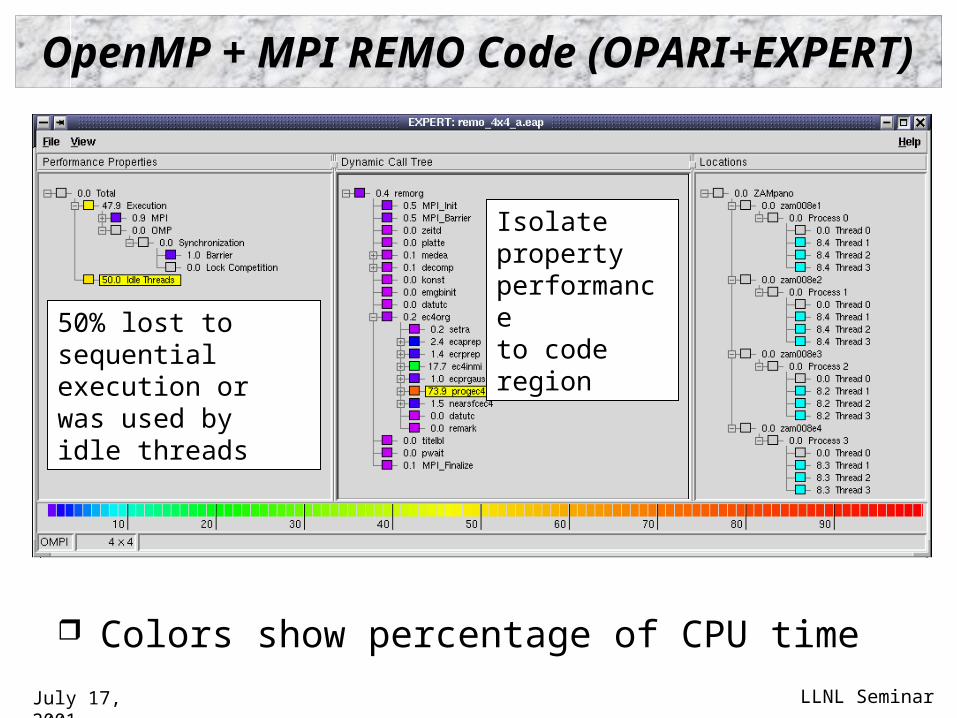
OpenMP + MPI REMO Code (OPARI+EXPERT)
Colors show percentage of CPU time
50% lost to sequentialexecution or was used by idle threads
Isolate property performanceto code region
July 17, 2001 LLNL Seminar
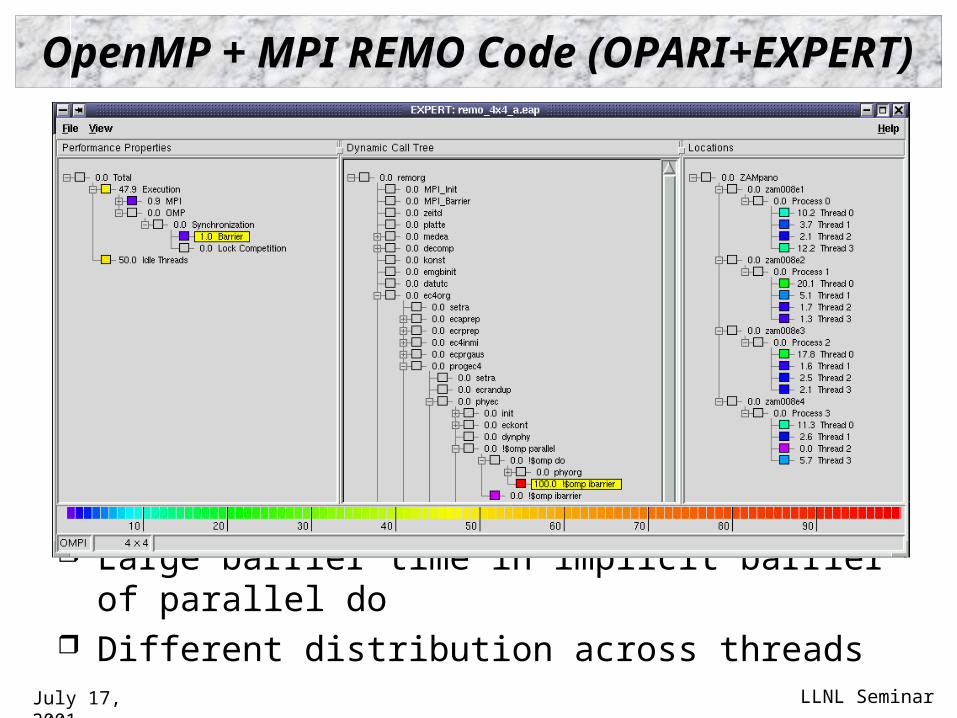
OpenMP + MPI REMO Code (OPARI+EXPERT)
Large barrier time in implicit barrier of parallel do Different distribution across threads
July 17, 2001 LLNL Seminar
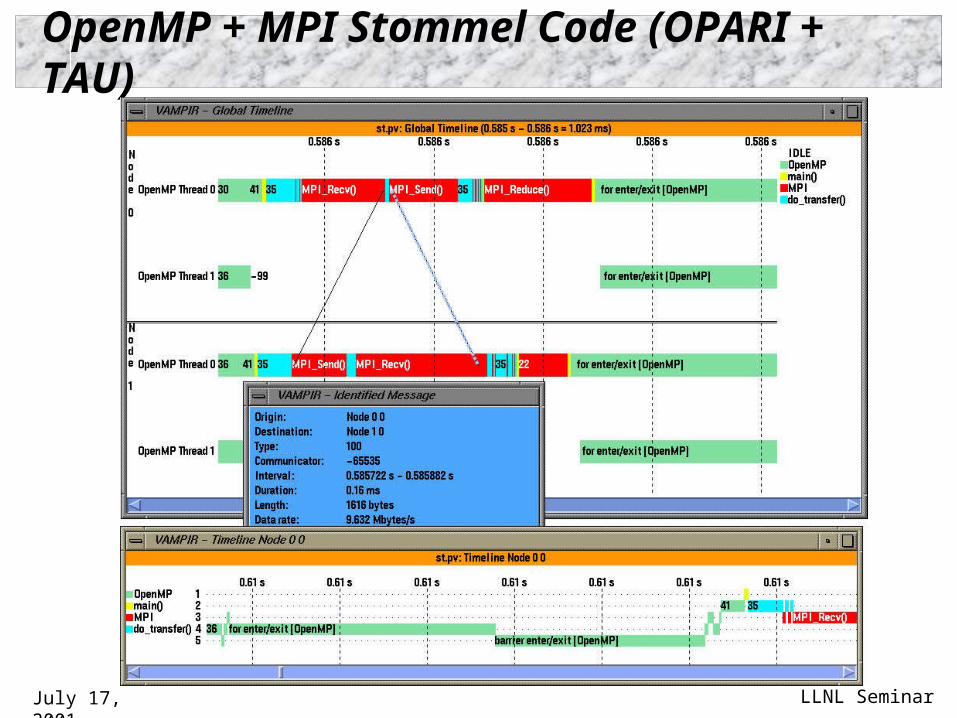
OpenMP + MPI Stommel Code (OPARI + TAU)
July 17, 2001 LLNL Seminar
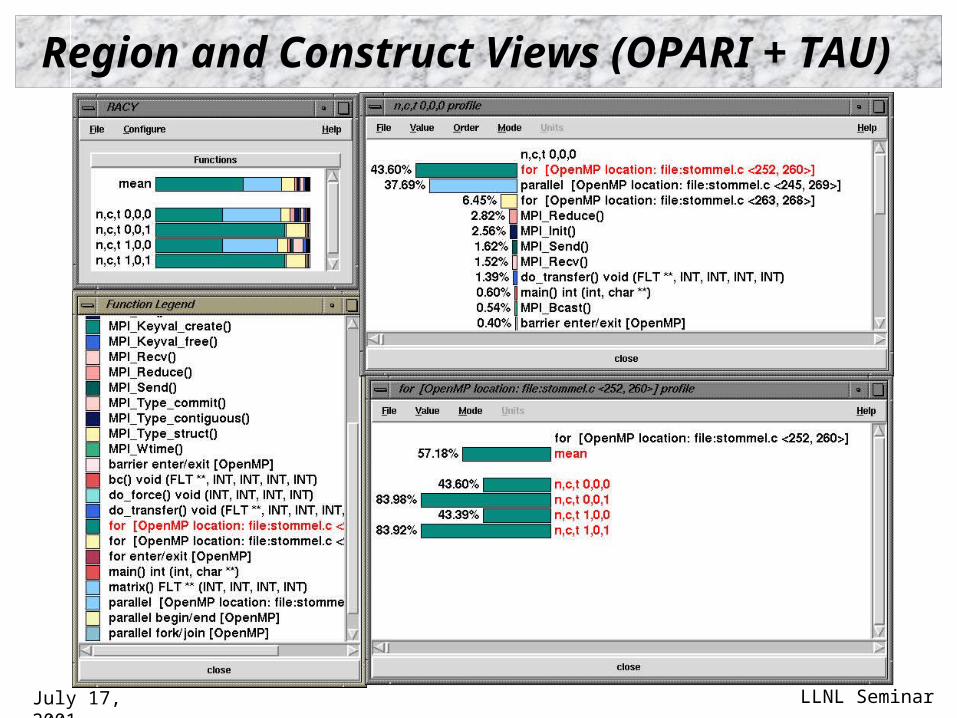
Region and Construct Views (OPARI + TAU)
July 17, 2001 LLNL Seminar
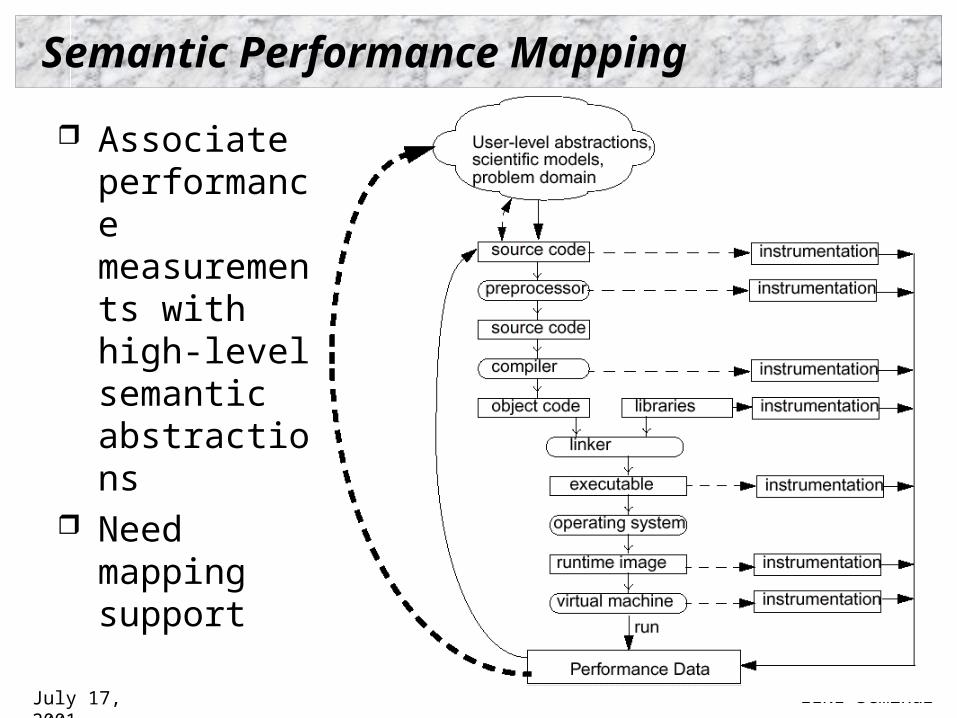
Semantic Performance Mapping
Associate performance measurements with high-level semantic abstractions
Need mapping support
July 17, 2001 LLNL Seminar
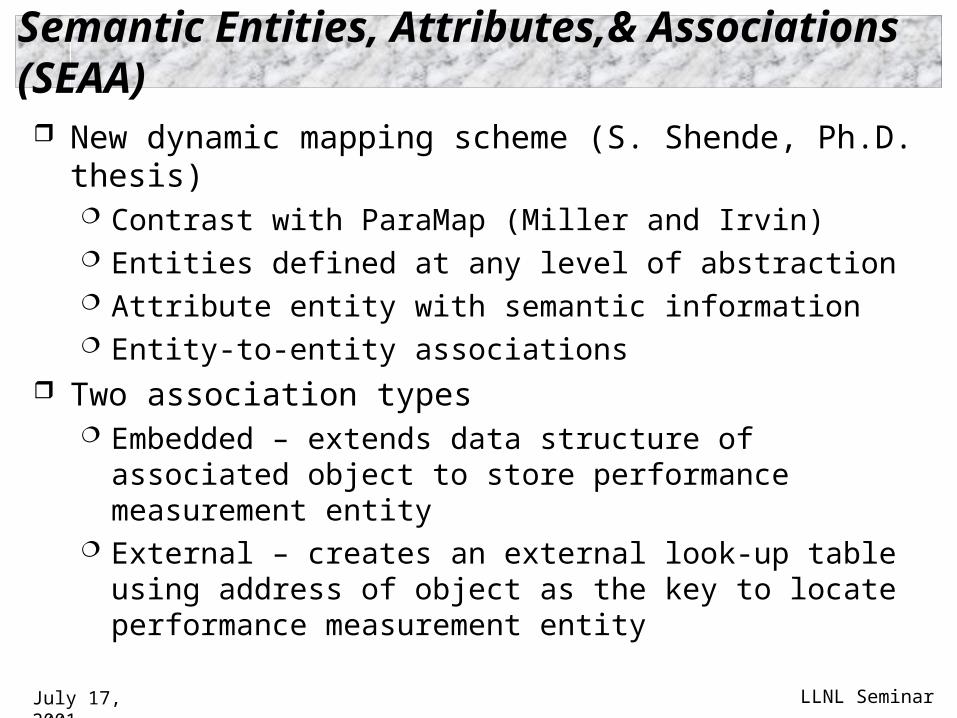
Semantic Entities, Attributes,& Associations (SEAA)
New dynamic mapping scheme (S. Shende, Ph.D. thesis) Contrast with ParaMap (Miller and Irvin) Entities defined at any level of abstraction Attribute entity with semantic information Entity-to-entity associations
Two association types Embedded – extends data structure of associated object to
store performance measurement entity External – creates an external look-up table using address
of object as the key to locate performance measurement entity
July 17, 2001 LLNL Seminar
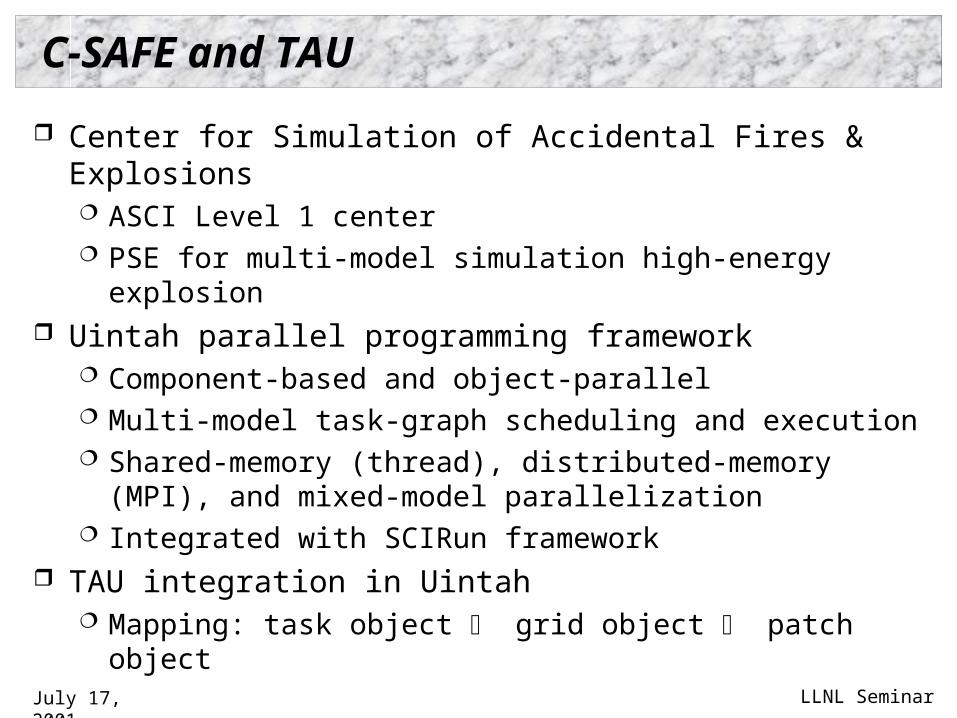
C-SAFE and TAU
Center for Simulation of Accidental Fires & Explosions ASCI Level 1 center PSE for multi-model simulation high-energy explosion
Uintah parallel programming framework Component-based and object-parallel Multi-model task-graph scheduling and execution Shared-memory (thread), distributed-memory (MPI), and
mixed-model parallelization Integrated with SCIRun framework
TAU integration in Uintah Mapping: task object grid object patch object
July 17, 2001 LLNL Seminar
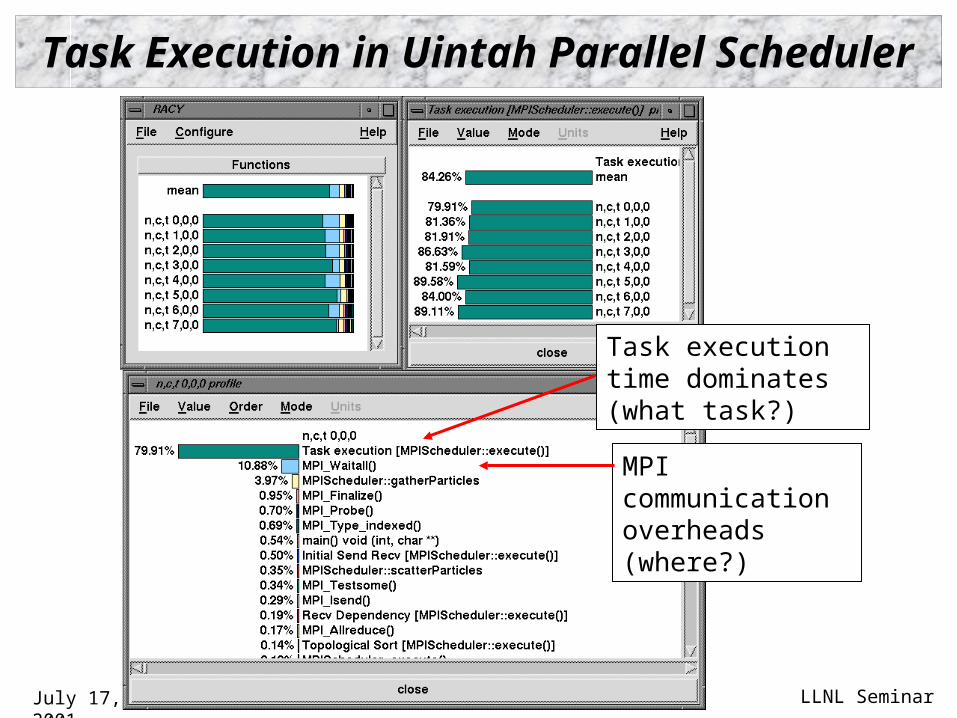
Task Execution in Uintah Parallel Scheduler
Task execution time dominates (what task?)
MPI communication overheads (where?)
July 17, 2001 LLNL Seminar
Task Computation and Mapping
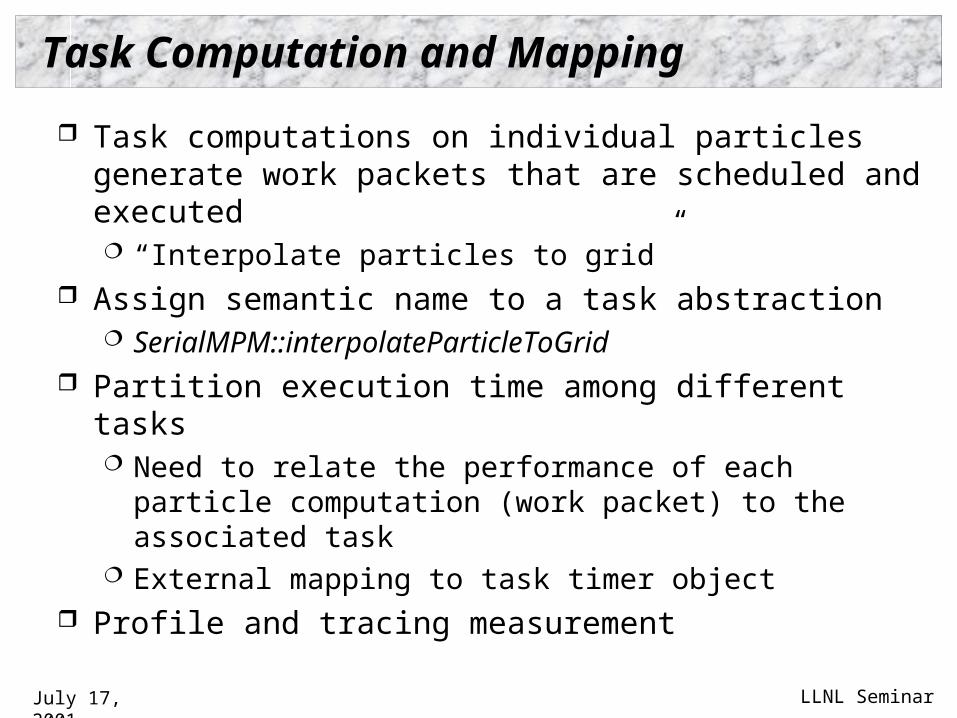
Task computations on individual particles generate work packets that are scheduled and executed “Interpolate particles to grid”
Assign semantic name to a task abstraction SerialMPM::interpolateParticleToGrid
Partition execution time among different tasks Need to relate the performance of each particle
computation (work packet) to the associated task External mapping to task timer object
Profile and tracing measurement
July 17, 2001 LLNL Seminar
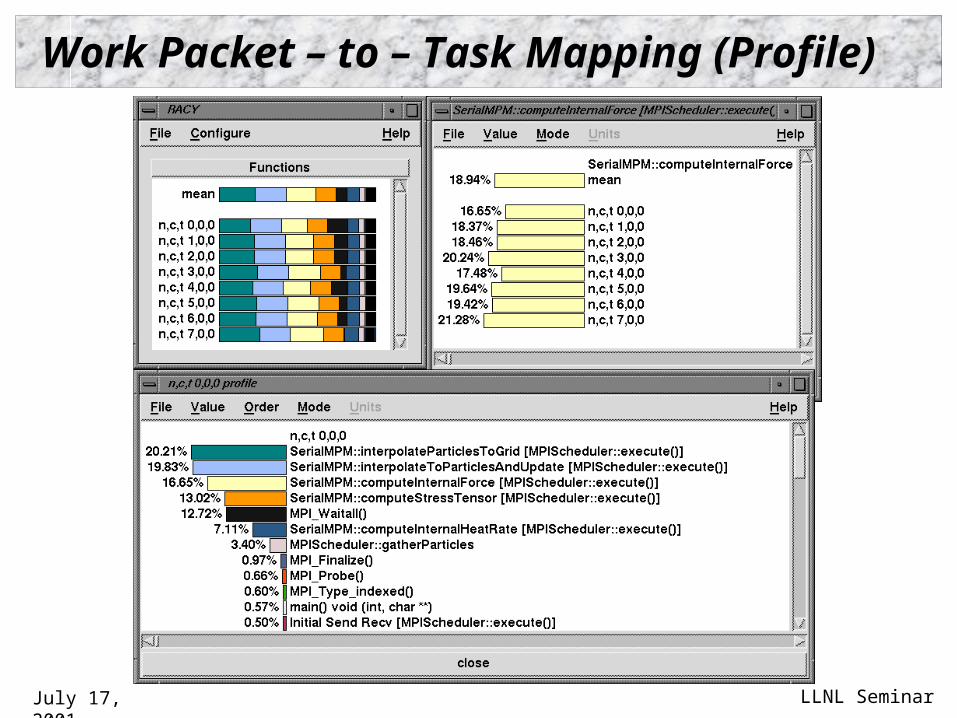
Work Packet – to – Task Mapping (Profile)
July 17, 2001 LLNL Seminar
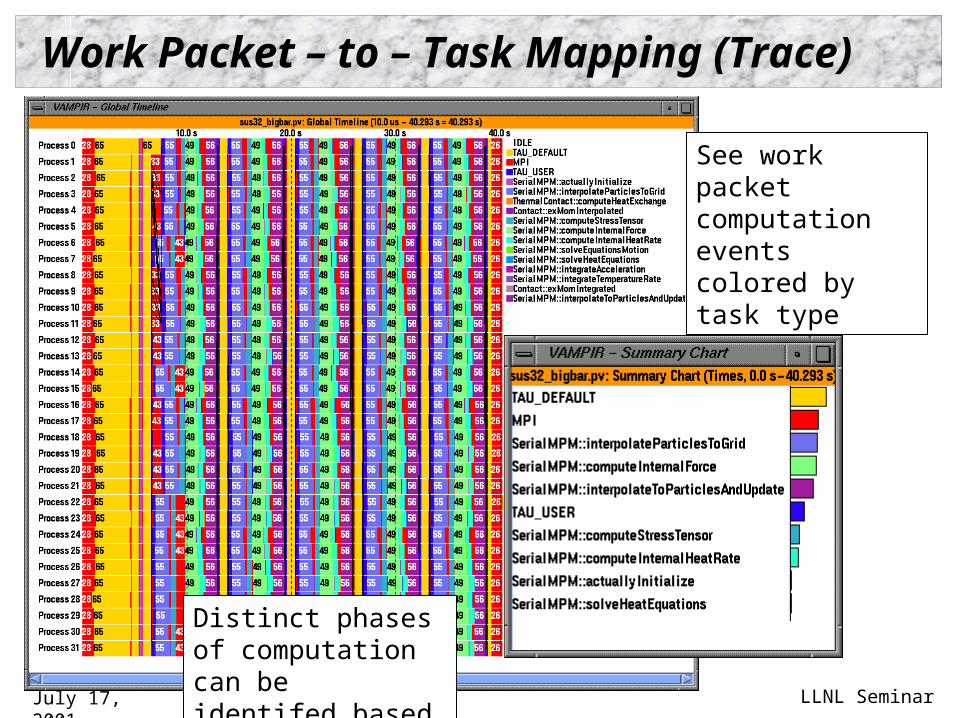
Work Packet – to – Task Mapping (Trace)
Distinct phases of computation can be identifed based on task
See work packet computation events colored by task type
July 17, 2001 LLNL Seminar
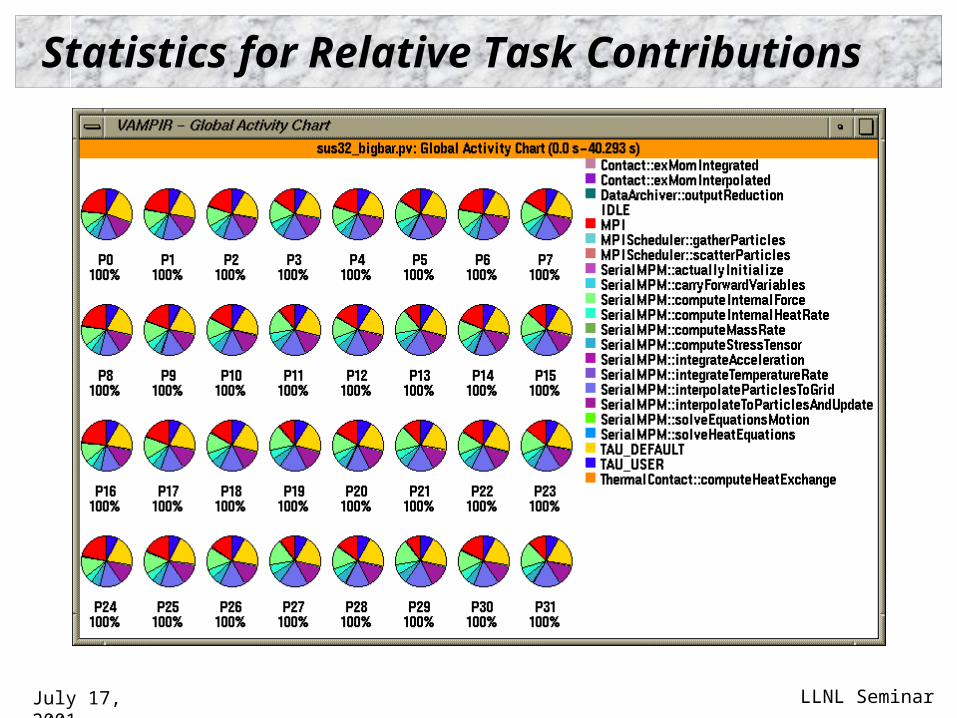
Statistics for Relative Task Contributions
July 17, 2001 LLNL Seminar
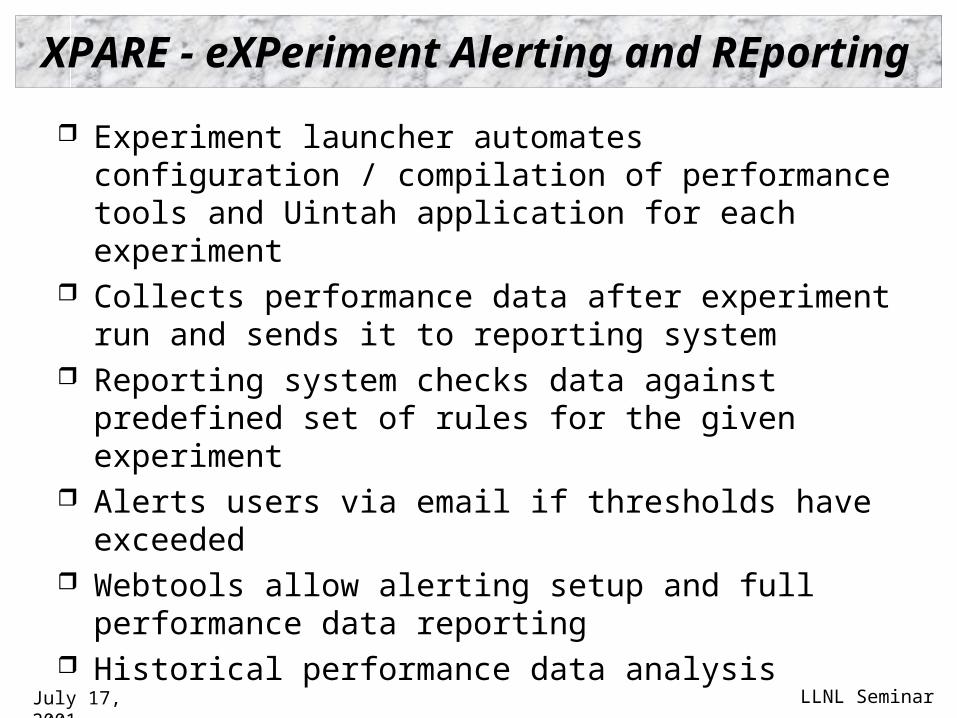
XPARE - eXPeriment Alerting and REporting
Experiment launcher automates configuration / compilation of performance tools and Uintah application for each experiment
Collects performance data after experiment run and sends it to reporting system
Reporting system checks data against predefined set of rules for the given experiment
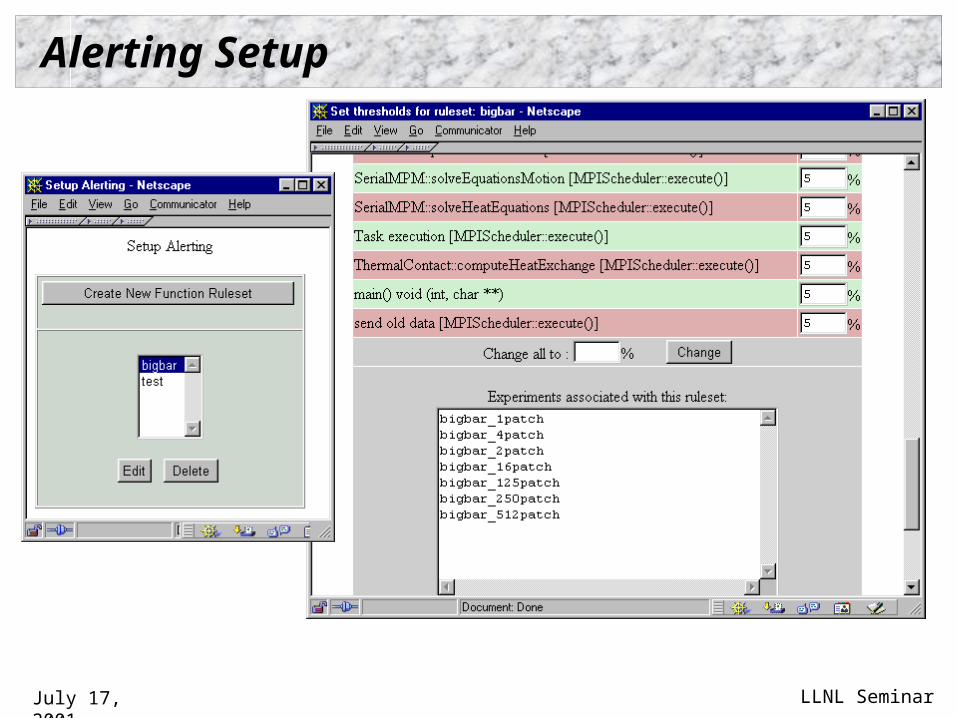
Alerts users via email if thresholds have exceeded Webtools allow alerting setup and full performance
data reporting Historical performance data analysis
July 17, 2001 LLNL Seminar
Alerting Setup
July 17, 2001 LLNL Seminar
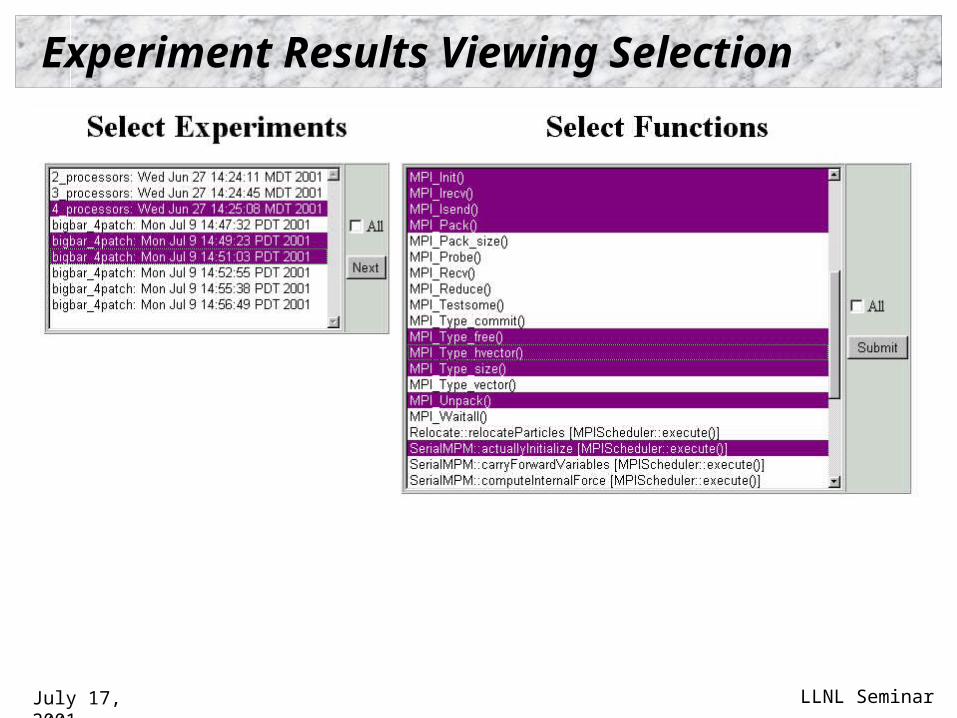
Experiment Results Viewing Selection
July 17, 2001 LLNL Seminar
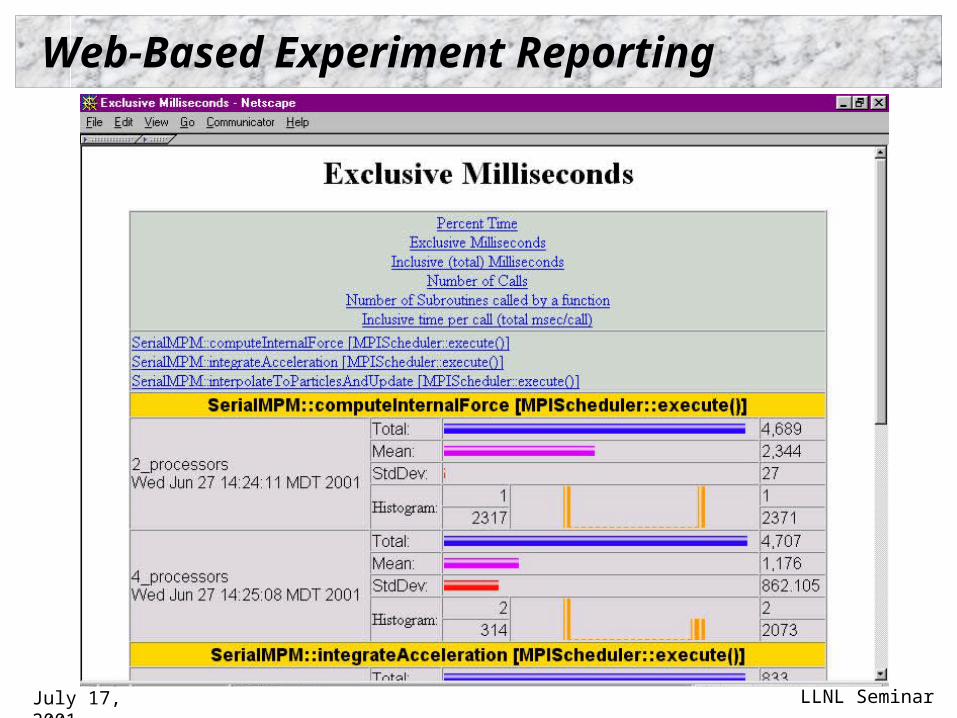
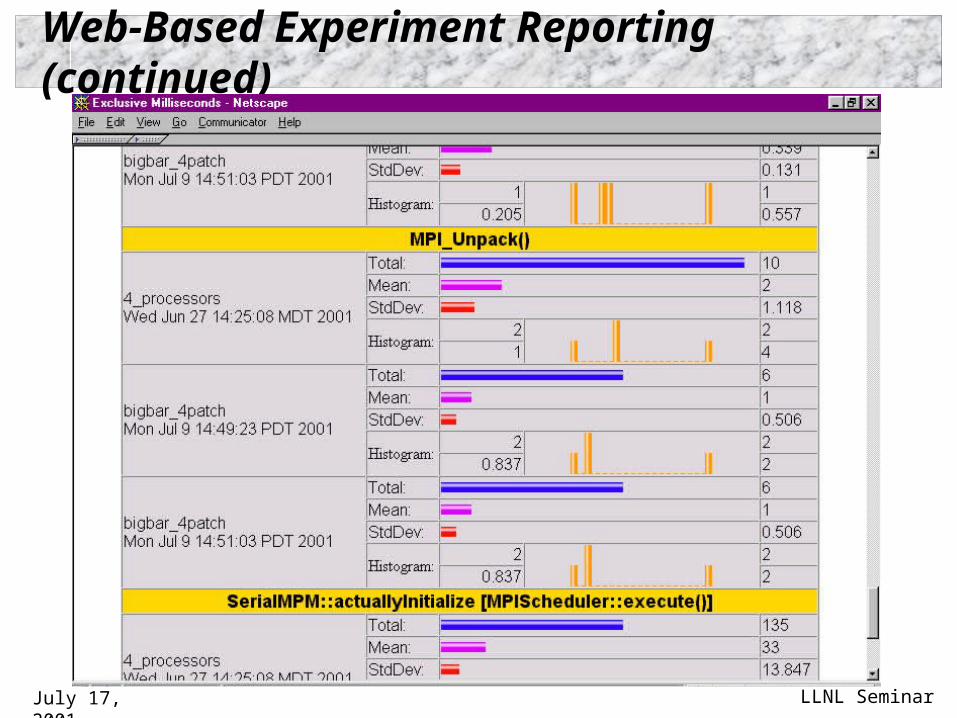
Web-Based Experiment Reporting
July 17, 2001 LLNL Seminar
Web-Based Experiment Reporting (continued)
July 17, 2001 LLNL Seminar
TAU Evolution
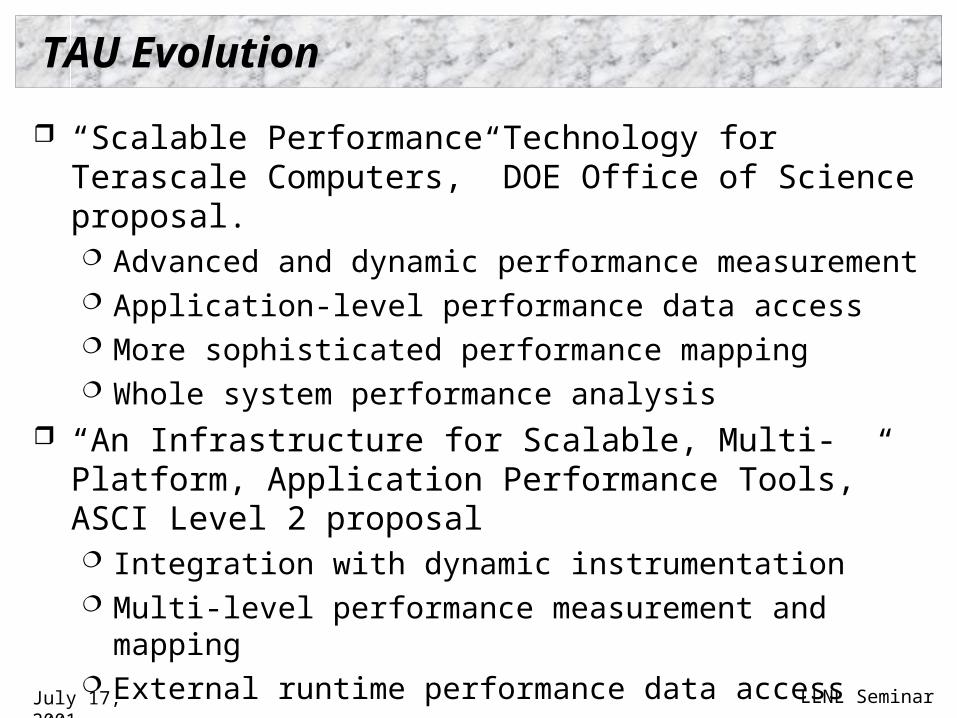
“Scalable Performance Technology for Terascale Computers,” DOE Office of Science proposal. Advanced and dynamic performance measurement Application-level performance data access More sophisticated performance mapping Whole system performance analysis
“An Infrastructure for Scalable, Multi-Platform, Application Performance Tools,” ASCI Level 2 proposal Integration with dynamic instrumentation Multi-level performance measurement and mapping External runtime performance data access
July 17, 2001 LLNL Seminar
TAU Evolution (continued)
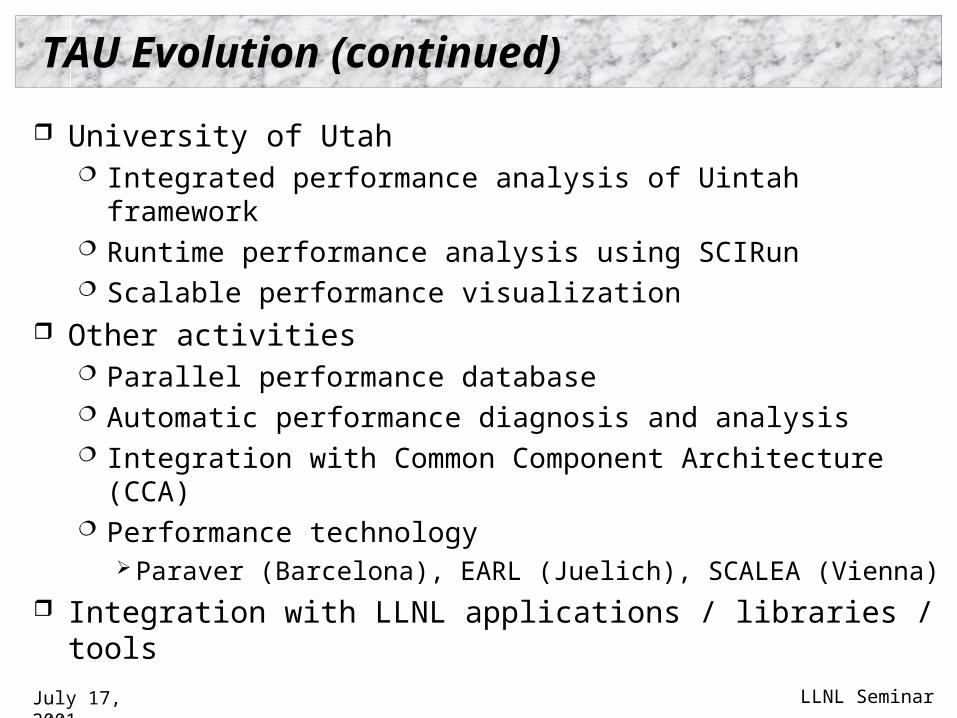
University of Utah Integrated performance analysis of Uintah framework Runtime performance analysis using SCIRun Scalable performance visualization
Other activities Parallel performance database Automatic performance diagnosis and analysis Integration with Common Component Architecture (CCA) Performance technology
Paraver (Barcelona), EARL (Juelich), SCALEA (Vienna)
Integration with LLNL applications / libraries / tools
July 17, 2001 LLNL Seminar
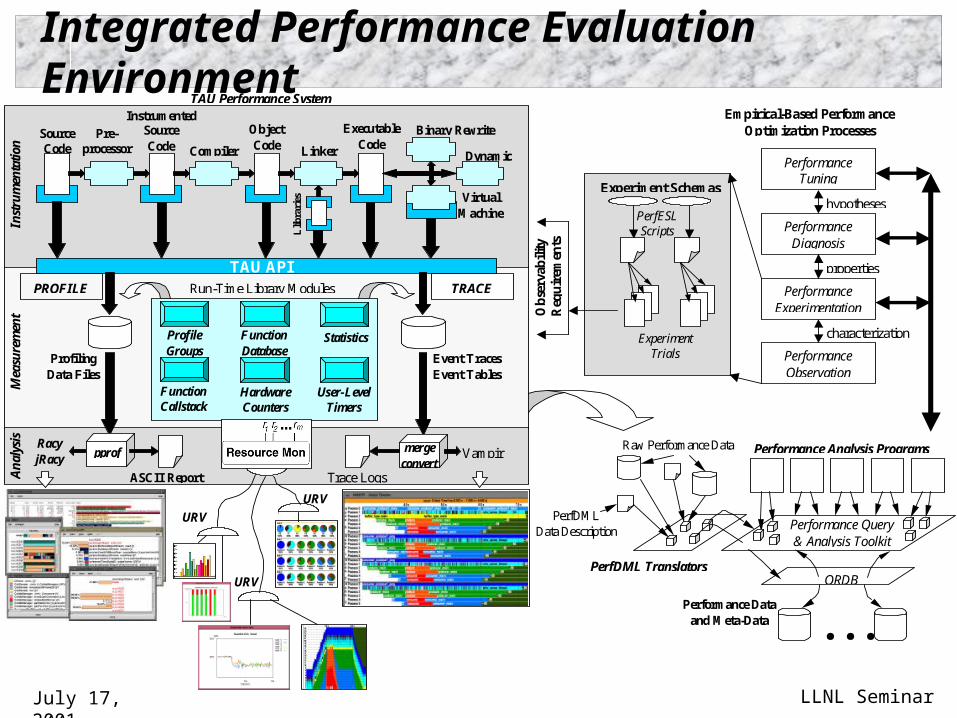
Empirical-Based Performance
Optimization Processes
. . . ORDB
Performance Data and Meta-Data
Performance Query & Analysis Toolkit
Performance Analysis Programs
PerfDML Translators
Raw Performance Data
PerfDML Data Description
Performance Tuning
Performance Diagnosis
Performance Experimentation
Performance Observation
hypotheses
properties
characterization
Experiment Schemas
PerfESL Scripts
Experiment Trials
Ob
serv
abili
ty
Req
uir
emen
ts
Source Code
Pre- processor
Instrumented Source Code Compiler
Object Code Linker
Executable Code
Dynamic
Virtual Machine
Llib
rari
es
Profile Groups
Function Database
Statistics
Function Callstack
Hardware Counters
User-Level Timers
Run-Time Library Modules
Profiling Data Files
Event Traces Event Tables
pprof merge convert
ASCII Report Trace Logs
Racy jRacy Vampir
PROFILE TRACE
TAU API
Inst
rum
enta
tion
M
easu
rem
ent
An
alys
is
Binary Rewrite
TAU Performance System
URV
URV
URV
Integrated Performance Evaluation Environment
July 17, 2001 LLNL Seminar
More Information and Acknowledgments
URLs TAU: www.cs.uoregon.edu/research/paracomp/tau PDT: www.cs.uoregon.edu/research/paracomp/pdtoolkit
Grant support DOE 2000 ACTS
http://www-unix.mcs.anl.gov/DOE2000 http://www.nersc.gov/ACTS
ASCI Level 3 (LANL, LLNL) DARPA