alliance for board diversity - deloitte us 100 total of board seats by gender and minority status 03...
TRANSCRIPT

Missing Pieces Report: The 2016 Board Diversity Census of Women and Minorities on Fortune 500 Boards
alliance forboarddiversity

About The Alliance for Board DiversityFounded in 2004, the Alliance for Board Diversity (ABD) is a collaboration of four leadership organizations: Catalyst, The Executive Leadership Council Inc. (ELC), the Hispanic Association on Corporate Responsibility (HACR), and Leadership Education for Asian Pacifics, Inc. (LEAP). Diversified Search, an executive search firm, is a founding partner of the alliance and serves as advisor and facilitator. The ABD’s mission is to enhance shareholder value in Fortune 500 companies by promoting inclusion of women and minorities on corporate boards. More information about ABD is available at www.theabd.org. About DeloitteDeloitte provides industry-leading audit, consulting, tax and advisory services to many of the world’s most admired brands, including 80 percent of the Fortune 500 and more than 6,000 private and middle market companies. Our people work across more than 20 industry sectors to deliver measurable and lasting results that help reinforce public trust in our capital markets, inspire clients to make their most challenging business decisions with confidence, and help lead the way toward a stronger economy and a healthy society. For more information, visit Deloitte’s U.S. website at www2.deloitte.com/us/en.html.
IntroductionMissing Pieces Report | The 2016 Board Diversity Census of Women and Minorities on Fortune 500 Boards
ESES I. 2 3II. III.

Executive Summary 01
Fortune 100 Findings Figure 1. Fortune 100 Total of Board Seats by Gender and Minority Status 03Figure 2. Fortune 100 Board Seats by Gender and Minority Status 03Table 1. Fortune 100 Board Seats by Gender and Minority Status 04Figure 3. Fortune 100 Total Board Seats by Race/Ethnicity 05Figure 4. Fortune 100 Percentage of Board Seats by Race/Ethnicity 05Figure 5. Fortune 100 Seats Gained/Lost from 2012 to 2016 by Gender and Race/Ethnicity 06Table 2. Fortune 100 Board Seats by Race/Ethnicity 07Table 3. Distribution of Fortune 100 Companies by Diversity of Board, 2004–2016 08
Fortune 500 FindingsFigure 6. Fortune 500 Total Board Seats by Gender and Minority Status 09Figure 7. Fortune 500 Board Seats by Gender and Minority Status 09Table 4. Fortune 500 Board Seats by Gender and Minority Status 10Figure 8. Fortune 500 Total Board Seats by Race/Ethnicity 11Figure 9. Fortune 500 Percentage of Board Seats by Race/Ethnicity 11Figure 10. Fortune 500 Seats Gained/Lost from 2012 to 2016 by Gender and Race/Ethnicity 12Table 5. Fortune 500 Board Seats by Race/Ethnicity 13Table 6: Distribution of Fortune 500 Companies by Diversity of Board, 2010–20016 14Table 7. Fortune 500 Boards with the Broadest Diversity by Fortune Rank 15Figure 11. Fortune 500 Board Leadership Positions 16Closing Thoughts 18
AppendixAppendix 1. Fortune 100 Total Board Seats by Race/Ethnicity and Gender 19Appendix 2. Fortune 500 Total Board Seats by Race/Ethnicity and Gender 20Appendix 3. Fortune 100 Data and Recycle Rates for 2004 and 2016 21Appendix 4. Fortune 500 Data and Recycle Rates for 2010 and 2016 22Appendix 5. Fortune 100 Race/Ethnicity of Directors in 2016 Who Were Not Observed in 2012 23Appendix 6. Fortune 500 Race/Ethnicity of Directors in 2016 Who Were Not Observed in 2012 23Research Methodology 24
II.
ES I. 2 3ES
ContentsMissing Pieces Report | The 2016 Board Diversity Census of Women and Minorities on Fortune 500 Boards
II. III.
III.
I.
ES

1
Executive Summary
Fortune 100 Findings
Fortune 500 Findings
Appendix
Shifting demographics in the United States have brought diversity to the forefront of issues on the minds of c-suite executives and corporate boards. As the population of the United States continues to diversify, companies may need to determine ways to gain more diversity of thought, experience, and background in both management as well as the boardroom.
Since 2004, the Alliance for Board Diversity (“ABD” or “we”) has been striving to enhance shareholder value by promoting inclusion of women and minorities on corporate boards. During this time ABD has celebrated the accomplishments and movement forward, but the fact remains that progress in this vein has been slow.
This study is the outgrowth of a multi-year effort organized by ABD, collaborating with Deloitte for the 2016 census, which has examined and chronicled the degree of participation of diverse professionals on boards of directors across America’s largest companies. Originally organized as a “snapshot” of board diversity, the data, since accumulated over time, has allowed for the development of information on trends relative to overall diversity as well as the comparative differences in rates of representation among minorities and women over a period of more than a decade. This 2016 report highlights the progress to date that has been made for women and minorities on corporate boards. While there have been some gains, they have been negligible at best, and certainly not representative of the broad demographic changes we have seen in the United States in the same period of time.
Executive SummaryMissing Pieces Report | The 2016 Board Diversity Census of Women and Minorities on Fortune 500 Boards
ES I. 2 3ES II. III.

2
Some progress has been made for African Americans/Blacks in securing/holding Fortune 500 board seats. The bulk of the African American male increases occurred within the Fortune 100. There has been an increase in the Fortune 500 of African American/Black women board members by 18.4 percent since 2012, while the total number of African American male board members in the Fortune 500 had only an increase of 1 percent.
African Americans/Blacks appear to have the highest rate of individuals serving on multiple boards— indicating that companies are going to the same individuals rather than expanding the pool of African American candidates for board membership.
3%167 seats
Asian/Pacific Islanders have shown continued growth.
However, their starting baseline was small—thus
their overall representation is still roughly three percent of all board seats, representing
a total of 167 seats, with an additional increase in Asian/
Pacific Islander women.
Nominal gains have been accomplished for Hispanic/Latino men, while we saw a
loss of two Fortune 500 board seats for Hispanic/Latina
women since 2012.
Currently, 65 percent of Fortune 100 boards have greater than 30 percent board diversity, compared to the Fortune 500 where that percentage drops to just under 50 percent of boards.
Reviewing the data of 492 companies, 5,440 board seats, provides us with insight into board diversity changes from 2012-2016 across the Fortune 500. A few specific summary items to note:
40%
Executive Summary
Fortune 100 Findings
Fortune 500 Findings
Appendix
All in all, this year’s census provides powerful metrics on the slow change of diversity in the boardroom, and may help to guide corporations and advocates toward future improvements in women and minority board participation.
Executive SummaryMissing Pieces Report | The 2016 Board Diversity Census of Women and Minorities on Fortune 500 Boards
The percentage of Caucasian/White women currently holding Fortune 500 board seats has increased by 21.2 percent since 2012, and the number of Caucasian/White men has decreased by 6.4 percent.
At the current rate of progress, we may likely see the number of women and minorities increase to 40 percent (a target percentage set by ABD) by year 2026, assuming that the percentage of Caucasian/White men on boards continues to decrease by 0.9 percent per year. While this is a simple straight-line trend, which does not account for the nuances of board terms and the pipeline of potential board members, this metric provides a sense of the progress to expect in the next decade.
ES I. 2 3ES II. III.

3
2016 FORTUNE 100 FindingsMissing Pieces Report | The 2016 Board Diversity Census of Women and Minorities on Fortune 500 Boards
Executive Summary
Fortune 100 Findings
Fortune 500 Findings
Appendix
Data for the Fortune 1001 from 2016, analyzing 1,205 board seats, paints a clear picture that despite some notable gains, women and minorities remain underrepresented in the boardroom, whether considered relative to historic numbers—when boards were almost entirely Caucasian/White men—or in relation to the rapidly shifting demographics of the nation towards greater diversity. The representation of women and minorities in the Fortune 100 has reached a high of 35.9 percent, outpacing the broader Fortune 500 which is at 30.8 percent. The changes in US demographics are likely to continue to put pressure on boards to become more diverse.
Figure 1:Fortune 100 Total Board Seats by Gender and Minority Status
564.6%
15512.9%
221 18.3%
77364.1%
Caucasian/Whitemen
Caucasian/White women
Minority menMinority women
1 Fortune 100 analyses are based on data from 98 companies in the Fortune 100. Results were reported to one-tenth of one percent. Percentages many not sum to 100 because of rounding. Please see the methodology for more details.
Figure 2:Fortune 100 Board Seats by Gender and Minority Status
Since ABD began conducting its census of Fortune 100 board directors in 2004, gains for women and minorities have been minimal. In 2016, women and minorities held 35.9 percent of board seats compared to 30.1 percent in 2010, and 28.8 percent in 2004. Examining these trends in greater detail, looking solely at minority men in that time period, the data shows that their gains have been relatively flat with a gain of only one percent between 2004-2016. Minority women have also seen some gains in this time period, increasing from holding three percent of board seats to nearly five percent in 2016. See Table 1 for complete figures and percentages.
2004 2010 2012 2016
Total menTotal womenWomen and minoritiesMinority menMinority womenMinorities
80%
60%
40%
20%
0%
Minority women
increase from holding
3% of board seats in 2012
to nearly 5% in 2016.
ES I. 2 3ES II. III.

4
2016 FORTUNE 100 FindingsMissing Pieces Report | The 2016 Board Diversity Census of Women and Minorities on Fortune 500 Boards
Executive Summary
Fortune 100 Findings
Fortune 500 Findings
Appendix
Table 1:Fortune 100 Board Seats by Gender and Minority Status
2004 2010 2012 2016
# (%) # (%) # (%) # (%)
Total men 993 83.1% 993 82.0% 974 80.2% 928 77.0%
Total women 202 16.9% 218 18.0% 240 19.8% 277 23.0%
Women and minorities 344 28.8% 364 30.1% 390 32.1% 432 35.9%
Minority men 142 11.9% 146 12.1% 150 12.4% 155 12.9%
Minority women 36 3.0% 41 3.4% 47 3.9% 56 4.6%
Minorities 178 14.9% 187 15.4% 197 16.2% 211 17.5%
Total board seats 1,195 100.0% 1,211 100.0% 1,214 100.0% 1,205 100.0%
ES I. 2 3ES II. III.

5
2016 FORTUNE 100 FindingsMissing Pieces Report | The 2016 Board Diversity Census of Women and Minorities on Fortune 500 Boards
Executive Summary
Fortune 100 Findings
Fortune 500 Findings
Appendix
In 2016, fewer than 20 percent of board seats were held by African Americans/Blacks, Asians/Pacific Islanders, and Hispanics/ Latino(a)s, though this is still a larger number than in the Fortune 500 as a whole. While the pace has been slow, ABD’s mission is to increase diverse representation on corporate boards, and recently ABD set a target for 40 percent of all board seats to be occupied by women and/or minorities in the Fortune 500 by 2020. The Fortune 100 sometimes can set the tone and pace for the Fortune 500, so we would hope the data to show a faster rate of change in future years.
Figure 3:Fortune 100 Total Board Seats by Race/Ethnicity
Caucasian/White
99482.5%
African American/Black
1199.9%
Hispanic/Latino(a)
544.5%
Asian/Pacific Islander
383.2%
Over time, we see that the general progress of board participation rates by minorities in Fortune 100 companies has been slow. Representation of Asians/Pacific Islanders and Hispanics/Latino(a)s has remained relatively flat since 2004. Though after seeing losses in 2010 and 2012, African Americans/Blacks have seen a slight increase in representation. Although there has been a nominal uptick for Asians/Pacific Islanders, it is important to recognize that they are starting from single digit representation, and the overall effect of the increase on representation is negligible.
Figure 4:Fortune 100 Percentage of Board Seats by Race/Ethnicity
Hispanic/Latino(a)3.8%
Asian/Pacific Islander1.0%
2004
Hispanic/Latino(a)3.8%
Asian/Pacific Islander2.2%
2010
African American/Black
10.0%
Caucasian/White
85.1%African American/Black
9.4%
Caucasian/White
84.6%
Hispanic/Latino(a)
4.3%Asian/Pacific Islander
2.7%
2012
Hispanic/Latino(a)
4.5%Asian/Pacific Islander
3.2%
2016
African American/Black
9.2%
Caucasian/White
83.8%African American/Black
9.9%
Caucasian/White
82.5%
ES I. 2 3ES II. III.

6
2016 FORTUNE 100 FindingsMissing Pieces Report | The 2016 Board Diversity Census of Women and Minorities on Fortune 500 Boards
Executive Summary
Fortune 100 Findings
Fortune 500 Findings
Appendix
Similar to prior years, there has been a small shift in the number of board seats held by women and minorities in the Fortune 100. While Asian/Pacific Islander women and Hispanic/Latina women saw 30 percent and 40 percent increases from 2012, respectively, the actual number of directors increased was small.
Figure 5:Fortune 100 Seats Gained/Lost From 2012 to 2016 by Gender and Race/Ethnicity
African American/Black men
5 seats gained
African American/Black women
2 seats gained
Asian/Pacific Islander men
2 seats gained
Asian/Pacific Islander women
3 seats gained
Caucasian/White women
28 seats gained
Hispanic/Latina women
4 seats gained
Hispanic/Latino men
2 seats lost
Caucasian/White men
51 seats lost
ES I. 2 3ES II. III.

7
2016 FORTUNE 100 FindingsMissing Pieces Report |The 2016 Board Diversity Census of Women and Minorities on Fortune 500 Boards
Executive Summary
Fortune 100 Findings
Fortune 500 Findings
Appendix
Table 2:Fortune 100 Board Seats by Race/Ethnicity
Seats in 2012
Change in Seats
% Increase or Decrease in Seats From 2012 to 2016
African American/Black Men 85 5 5.9%African American/Black Women 27 2 7.4%Asian/Pacific Islander Men 23 2 8.7%Asian/Pacific Islander Women 10 3 30.0%Hispanic/Latino(a) Men 42 (2) -4.8%Hispanic/Latino(a) Women 10 4 40.0%Caucasian/White Men 824 (51) -6.2%Caucasian/White Women 193 28 14.5%All Men 974 (46) -4.7%All Women 240 37 15.4%
ES I. 2 3ES II. III.

8
2016 FORTUNE 100 FindingsMissing Pieces Report | The 2016 Board Diversity Census of Women and Minorities on Fortune 500 Boards
Executive Summary
Fortune 100 Findings
Fortune 500 Findings
Appendix
A portrait of progress, and perhaps an implicit benchmark for the future, the data shows the relative board penetration by minorities and women across the Fortune 100. There have been reductions in the number of companies in the 0-10 percent and 11-20 percent range and growth in the next three categories. Significant is the leap of Fortune 100 companies with 41-50 percent women and/or minorities, from 14 in 2012 to 24 in 2016, though it should be noted that there was a slight decrease in the number of companies with greater than 50 percent women and minorities. Beginning in 2012, we saw a shift amongst the companies of the Fortune 100, with the majority having more than 30 percent board members who are women and/or minorities. This trend continued in the current year, with 65 percent of companies now having more than 30 percent of their board comprised of women and minorities.
Table 3:Distribution of Fortune 100 Companies by Diversity of Board, 2004–2016
2004: 1 2010: 4
2012: 11 2016: 9
Percentage of Board Directors Who are Women and/or Minorities
2004
2010
2012
2016
0-10% 4 6 7 311-20% 22 16 17 321-30% 33 32 23 2831-40% 29 28 28 3141-50% 11 14 14 24Greater than 50% 1 4 11 9
Companies with Greater than 50% of Board Directors Who are Women and/or Minorities
65%In 2016, 65% of companies now have more than 30% of their board comprised of women and minorities.
ES I. 2 3ES II. III.

9
2016 FORTUNE 500 Findings2
Missing Pieces Report | The 2016 Board Diversity Census of Women and Minorities on Fortune 500 Boards
Executive Summary
Fortune 100 Findings
Fortune 500 Findings
Appendix
The data shows slight increases across the years, but board representation is increasing at a slow rate. In this census, the representation of women and minorities has reached an all-time high at 30.8 percent. This growth seems to be led by Fortune 100 companies, who have 35.9 percent representation of women and minorities holding board seats. This increase will need to continue in order to reach the ABD goal of 40 percent women and minorities by 2020.
Figure 6:Fortune 500 Total Board Seats by Gender and Minority Status
2073.8%
55710.6%
89316.4%
Caucasian/Whitemen
Caucasian/White women
Minority menMinority women2 Fortune 500 analyses are based on data from 492 companies in the Fortune 500. Results were reported within one-tenth of a percent. Percentages may not sum to 100 because of rounding. Please see the methodology for more details. The analysis for the Fortune 500 began in 2010. The differences are statistically significant, but there was no statistical sampling performed due to the fact that we look at all elements of the population.
Figure 7:Fortune 500 Board Seats by Gender and Minority Status
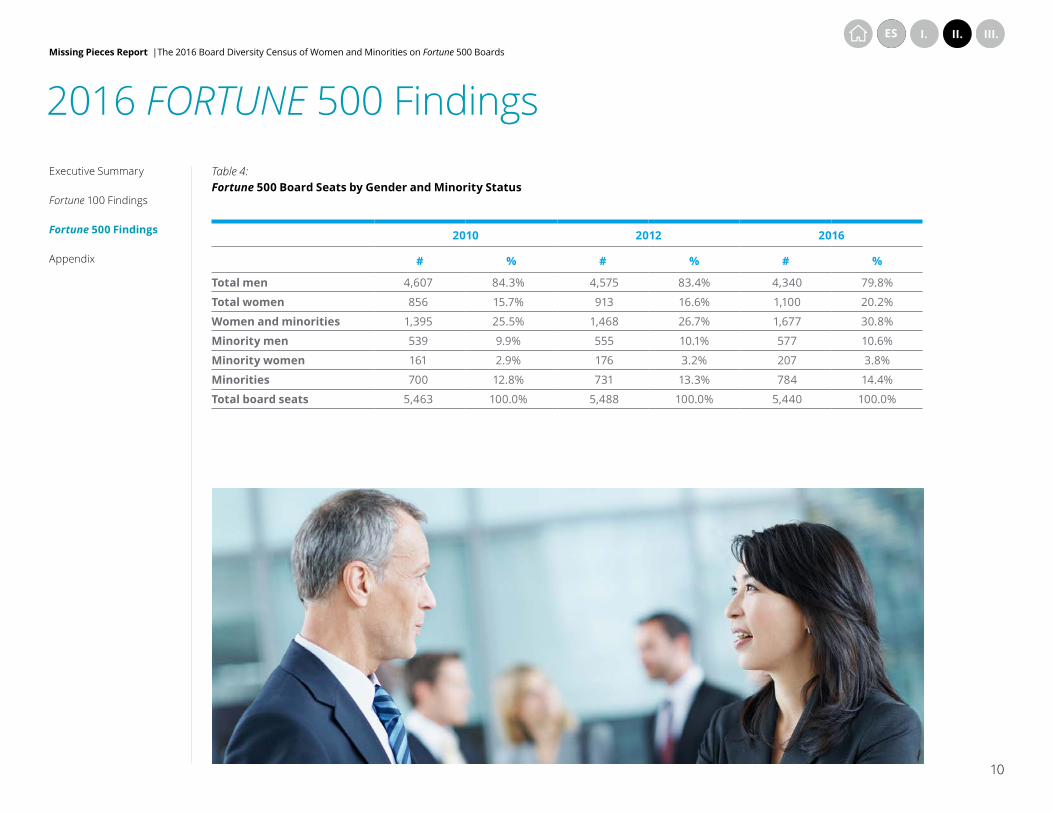
In 2016, women and minorities held 30.8 percent of board seats amongst Fortune 500 companies. While this number represents an increase from 2012, when women and minorities held slightly more than 25 percent of board seats, women and minorities continue to be underrepresented at the decision making tables of these companies.3 Minority men participation has varied over the time periods examined, with steeper gains in representation coming from minority women and Caucasian/White women. Similar to the trends observed in the Fortune 100, minority men and women experienced only slight gains in the six-year span we have been tracking Fortune 500 board diversity. See Table 4 for complete figures and percentages.
2010 2012 2016
80%
60%
40%
20%
0%
3,76369.2%
3 For this census, we measured the top companies by revenue as identified by our research cut-off date (for 2016, the research cut-off date was June 30, 2016). The census results compare Fortune 100 or 500 results against results from prior censuses, not against a specific identified set of companies over time (in other words, the composition of the Fortune 100 and 500 groups changes over time, but the methodology to identify them does not).
Total menTotal womenWomen and minoritiesMinority menMinority womenMinorities
Women and minorities
had 30.8% of board seats
amongst Fortune 500 companies
in 2016.
ES I. 2 3ES II. III.
10
2016 FORTUNE 500 FindingsMissing Pieces Report |The 2016 Board Diversity Census of Women and Minorities on Fortune 500 Boards
Executive Summary
Fortune 100 Findings
Fortune 500 Findings
Appendix
Table 4:Fortune 500 Board Seats by Gender and Minority Status
2010 2012 2016
# % # % # %
Total men 4,607 84.3% 4,575 83.4% 4,340 79.8%
Total women 856 15.7% 913 16.6% 1,100 20.2%
Women and minorities 1,395 25.5% 1,468 26.7% 1,677 30.8%
Minority men 539 9.9% 555 10.1% 577 10.6%
Minority women 161 2.9% 176 3.2% 207 3.8%
Minorities 700 12.8% 731 13.3% 784 14.4%
Total board seats 5,463 100.0% 5,488 100.0% 5,440 100.0%
ES I. 2 3ES II. III.

11
2016 FORTUNE 500 FindingsMissing Pieces Report | The 2016 Board Diversity Census of Women and Minorities on Fortune 500 Boards
Executive Summary
Fortune 100 Findings
Fortune 500 Findings
Appendix
In 2016, fewer than 15 percent of board seats in the Fortune 500 were held by African Americans/Blacks, Asian/Pacific Islanders, and Hispanic/Latino(a)s. Representation of minorities within the Fortune 500 is smaller than in the Fortune 100, where minorities held nearly 18 percent of board seats.
Caucasian/White
4,65685.6%
African American/Black
4287.9%
Hispanic/Latino(a)
1883.5%
Asian/Pacific Islander
1673.1%
Between 2010 and 2016, the data shows minimal changes for African Americans/Blacks, Asians/Pacific Islanders, and Hispanics/Latino(a)s in terms of board seats held in the Fortune 500. Trends for each of these racial and ethnic groups are essentially even across all years, which means consistent representation across time – no increase. The Fortune 100’s slightly higher percentage of diversity on boards led in increases for many groups, especially Asian/Pacific Islanders.
African American/Blacks, Asians/Pacific Islanders, and Hispanics/Latino(a)s trends show minimal changes.
Hispanic/Latino(a)3.0%
Figure 8:Fortune 500 Total Board Seats by Race/Ethnicity
Figure 9:Fortune 500 Percentage of Board Seats by Race/Ethnicity
Asian/Pacific Islander2.1%
2010
Hispanic/Latino(a)3.3%
Asian/Pacific Islander2.6%
2012
Hispanic/Latino(a)3.5%
Asian/Pacific Islander3.1%
2016
African American/Black
7.6%
Caucasian/White
87.2%African American/Black
7.4%
Caucasian/White
86.7%African American/Black
7.9%
Caucasian/White
85.6%
ES I. 2 3ES II. III.

12
2016 FORTUNE 500 FindingsMissing Pieces Report | The 2016 Board Diversity Census of Women and Minorities on Fortune 500 Boards
Executive Summary
Fortune 100 Findings
Fortune 500 Findings
Appendix
Figure 10:Fortune 500 Seats Gained/Lost From 2012 to 2016 by Gender and Race/Ethnicity
African American/Black men
3 seats gained
African American/Black women
19 seats gained
Asian/Pacific Islander men
12 seats gained
Asian/Pacific Islander women
14 seats gained
Caucasian/White women
156 seats gained
Hispanic/Latina women
2 seats lost
Hispanic/Latino men
8 seats gained
Caucasian/White men
257 seats lost
Against a backdrop of a nearly unchanged number of total board seats between 2012 and 2016, women and minorities continued to log gains. The figure and following table show the comparative gains and losses for each group, and that while modest changes in raw numbers, there are strong rates of change for many groups. We see a small shift in the number of seats held by women and minorities in the Fortune 500.
ES I. 2 3ES II. III.

13
2016 FORTUNE 500 FindingsMissing Pieces Report | The 2016 Board Diversity Census of Women and Minorities on Fortune 500 Boards
Executive Summary
Fortune 100 Findings
Fortune 500 Findings
Appendix
Table 5:Fortune 500 Board Seats by Race/Ethnicity
Seats in 2012
Change in Seats
% Increase or Decrease in Seats From 2012 to 2016
African American/Black Men 303 3 1.0%African American/Black Women 103 19 18.4%Asian/Pacific Islander Men 111 12 10.8%Asian/Pacific Islander Women 30 14 46.7%Hispanic/Latino(a) Men 139 8 5.8%Hispanic/Latino(a) Women 43 (2) -4.7%Caucasian/White Men 4,020 (257) -6.4%Caucasian/White Women 737 156 21.2%All Men 4,575 (235) -5.1%All Women 913 187 20.5%
ES I. 2 3ES II. III.

14
2016 FORTUNE 500 FindingsMissing Pieces Report | The 2016 Board Diversity Census of Women and Minorities on Fortune 500 Boards
Executive Summary
Fortune 100 Findings
Fortune 500 Findings
Appendix
As we saw in our analysis of the Fortune 100, there is shift in representation showing that more companies have achieved between 11 percent and 40 percent women and minority representation. Again, much like the Fortune 100, there has been a reduction in the number of firms reporting in at the low end and a growth of those in the 31-40 percent and greater than 40 percent category. Progress is evident across the reporting periods. In 2010, the majority of Fortune 500 companies had 0-30 percent women and/or minority board director representation, and this trend continued in 2012. However, from 2010 to 2012, the number of Fortune 500 companies with 31-40 percent and greater than 40 percent of women and/or minority board directors increased. The 2016 data also shows continued growth in the 31-40 percent category and greater than 40 percent category of women and/or minorities directors. While we are excited to see that nearly 50 percent of Fortune 500 boards have reached at least 30 percent women and minorities on their boards, we need to also consider the “recycle rate” or rate at which individuals serve on more than one board. For example, if every board member served on exactly one board, the recycle rate would be 1, and if every board member served on two boards, the rate would be 2. The recycle rate is higher for women and minorities than for Caucasian/White men, showing that while the diversity of boards may be increasing, there is not necessarily an equivalent rate of increase in the number of new women and minorities on boards. This higher recycle rate may also point to a need to look at a broader set of networks, backgrounds, skills, and experiences for potential board candidates.
Table 6:Distribution of Fortune 500 Companies by Diversity of Board, 2010–2016
Percentage of Board Directors Who are Women and/or Minorities
2010
2012
2016
0% 32 32 15 1-10% 31 32 21 11-20% 124 124 82 21-30% 148 133 133 31-40% 100 105 146 Greater than 40% 54 69 95
2010: 54
2012: 69 2016: 95
Companies with Greater than 40% of Board Directors Who are Women and/or Minorities
~50%In 2016, nearly 50% of of Fortune 500 boards have reached at least 30% women and minorities on their boards.
ES I. 2 3ES II. III.

15
2016 FORTUNE 500 FindingsMissing Pieces Report | The 2016 Board Diversity Census of Women and Minorities on Fortune 500 Boards
Executive Summary
Fortune 100 Findings
Fortune 500 Findings
Appendix
Table 7:Fortune 500 Board with the Broadest Diversity4 by Fortune Rank5
Rank
Company Name
Total
Directors
Men
Women
Caucasian/
White
African American/
Black
Asian/Pacific
Islander
Hispanic/Latino(a)
20 HP 13 8 5 7 2 3 127 Wells Fargo 16 9 7 11 1 2 240 MetLife 12 8 4 9 1 1 141 Archer Daniels Midland 12 11 1 8 1 1 244 PepsiCo 15 11 4 11 1 1 250 Prudential Financial 15 11 4 9 3 1 253 Disney 12 8 4 8 1 1 255 Pfizer 11 8 3 8 1 1 1
76 Massachusetts Mutual Life Insurance 14 9 5 11 1 1 1
99 Time Warner 12 10 2 9 1 1 1103 Macy's 15 9 6 11 2 1 1116 Time Warner Cable 12 10 2 9 1 1 1126 Alcoa 15 12 3 12 1 1 1131 U.S. Bancorp 14 10 4 11 1 1 1141 Eli Lilly 14 10 4 10 1 1 2146 Starbucks 13 10 3 9 2 1 1149 Altria Group 11 9 2 8 1 1 1166 PG&E Corp. 12 9 3 8 1 2 1197 Nordstrom 13 10 3 10 1 1 1199 Aramark 10 9 1 7 1 1 1204 Visa 12 9 3 9 1 1 1227 Farmers Insurance Exchange 12 11 1 9 1 1 1279 Sempra Energy 12 9 3 9 1 1 1302 GameStop 11 9 2 8 1 1 1304 Hormel Foods 15 11 4 10 2 2 1330 Avis Budget Group 13 11 2 9 1 2 1350 PPL 9 8 1 5 2 1 1455 Clorox 11 8 3 6 2 1 2487 Booz Allen Hamilton Holding 10 8 2 7 1 1 1
These companies demonstrate broad diversity based on the analysis; however, the number of companies that have broad diversity has remained relatively stagnant over the years. In fact, this list contains one fewer company than in the 2012 census.
4 Broadest diversity is defined as having at least one director from each of the four major racial/ethnic groups defined by the census and at least one woman director. Race/Ethnicity categories used here are those defined by the US Census Bureau. 5 To ascertain each company’s total number of directors and board composition, Deloitte reviewed Securities and Exchange Commission annual filings submitted as of June 30, 2016. Please see the research methodology for more information.
ES I. 2 3ES II. III.

16
2016 FORTUNE 500 FindingsMissing Pieces Report | The 2016 Board Diversity Census of Women and Minorities on Fortune 500 Boards
Executive Summary
Fortune 100 Findings
Fortune 500 Findings
Appendix
Despite relatively slow growth in the overall representation of women and minorities on corporate boards, there are examples of gains for women and minorities across many key board functions. As compared with 2012, representation of minorities and women in every key leadership position has increased, though not notably in any category. The increase in women and minorities holding leadership positions such as “chair” or “committee chair” does not mask the fact that the rate of overall increase in their representation is slower than desired.
Figure 11:Fortune 500 Board Leadership Position
Caucasian/Whitemen
45090.5%
Caucasian/Whitewomen
265.2%
Minority men
193.8%
Minority women
20.4%
BOARD CHAIR
LEAD DIRECTOR
Caucasian/Whitemen
26681.8%
Caucasian/Whitewomen
319.5%
Minority men
247.4%
Minority women
41.2%
ES I. 2 3ES II. III.

17
2016 FORTUNE 500 FindingsMissing Pieces Report | The 2016 Board Diversity Census of Women and Minorities on Fortune 500 Boards
Executive Summary
Fortune 100 Findings
Fortune 500 Findings
Appendix
Figure 11: (continued)Fortune 500 Board Leadership Position
Caucasian/Whitemen
35173.9%
Caucasian/Whitewomen
7014.7%
AUDIT COMMITTEE CHAIR
NOMINATION/GOVERNANCE COMMITTEE CHAIR DIRECTOR
Caucasian/Whitemen
30366.0%
Caucasian/Whitewomen
9220.0%
Minority men
449.6%
Minority women
204.4%
COMPENSATION COMMITTEE CHAIR
Caucasian/Whitemen
36377.4%
5712.2%
Caucasian/Whitewomen
Minority men Minority women
418.7%
81.7%
Minority men
398.2%
Minority women
153.2%
ES I. 2 3ES II. III.

18
Executive Summary
Fortune 100 Findings
Fortune 500 Findings
Appendix
Closing Thoughts
While the census data shows overall gains in women and minorities in the boardroom, the pace at which Fortune 500 boards are becoming more diverse is slow. These boards and board members have an opportunity. Diversity is beginning to be viewed through a much wider lens to encompass a range of skills, experiences, and perspectives that could help safeguard an organization against new and emerging threats. It is also important for boards to be comprised of individuals that offer different perspectives in order to understand and better serve the diverse customer base that exists today. The fact that many companies are facing a growing number of competitive, regulatory, and technological issues is driving this broader view of diversity. It will be important for corporate boards to consider the benefits and skillsets that gender, racial, and ethnic diversity could bring to boardroom discussions.
2016 FORTUNE 500 FindingsMissing Pieces Report | The 2016 Board Diversity Census of Women and Minorities on Fortune 500 Boards
ES I. 2 3ES II. III.

19
AppendixMissing Pieces Report | The 2016 Board Diversity Census of Women and Minorities on Fortune 500 Boards
Executive Summary
Fortune 100 Findings
Fortune 500 Findings
Appendix
Appendix 1:6
Fortune 100 Total Board Seats by Race/Ethnicity and Gender
ESES I. 2 3II. III.
6 Data includes 98 of 100 Fortune 100 companies with two exclusions due to availability of filings. Race/Ethnicity categories used here are those defined by the US Census Bureau.
2004 2010 2012 2016
# % # % # % # %
African American/Black 120 10.0% 114 9.4% 112 9.2% 119 9.9%
Men 93 7.8% 88 7.3% 85 7.0% 90 7.5%
Women 27 2.3% 26 2.1% 27 2.2% 29 2.4%Asian/Pacific Islander 12 1.0% 27 2.2% 33 2.7% 38 3.2%
Men 9 0.8% 21 1.7% 23 1.9% 25 2.1%Women 3 0.3% 6 0.5% 10 0.8% 13 1.1%
Hispanic/Latino(a) 46 3.8% 46 3.8% 52 4.3% 54 4.5%Men 40 3.3% 37 3.1% 42 3.5% 40 3.3%Women 6 0.5% 9 0.7% 10 0.8% 14 1.2%
Caucasian/White 1,017 85.1% 1,024 84.6% 1,017 83.8% 994 82.5%Men 851 71.2% 847 69.9% 824 67.9% 773 64.1%Women 166 13.9% 177 14.6% 193 15.9% 221 18.3%
Total board seats 1,195 100.0% 1,211 100.0% 1,214 100.0% 1,205 100.0%

20
AppendixMissing Pieces Report | The 2016 Board Diversity Census of Women and Minorities on Fortune 500 Boards
Executive Summary
Fortune 100 Findings
Fortune 500 Findings
Appendix
Appendix 2:7
Fortune 500 Total Board Seats by Race/Ethnicity and Gender
2010 2012 2016
# % # % # %
African American/Black 417 7.6% 406 7.4% 428 7.9%
Men 312 5.7% 303 5.5% 306 5.6%
Women 105 1.9% 103 1.9% 122 2.2%Asian/Pacific Islander 115 2.1% 141 2.6% 167 3.1%
Men 97 1.8% 111 2.0% 123 2.3%Women 18 0.3% 30 0.5% 44 0.8%
Hispanic/Latino(a) 166 3.0% 182 3.3% 188 3.5%Men 128 2.3% 139 2.5% 147 2.7%Women 38 0.7% 43 0.8% 41 0.8%
Other 2 0.0% 2 0.0% 1 0.0%Men 2 0.0% 2 0.0% 1 0.0%Women - 0.0% - 0.0% - 0.0%
Caucasian/White 4,763 87.2% 4,757 86.7% 4,656 85.6%Men 4,068 74.5% 4,020 73.3% 3,763 69.2%Women 695 12.7% 737 13.4% 893 16.4%
Total Board Seats 5,463 100.0% 5,488 100.0% 5,440 100.0%
7 Data includes 492 of 500 Fortune 500 companies with eight exclusions due to availability of filings. Race/Ethnicity categories used here are those defined by the US Census Bureau.
ESES I. 2 3II. III.

21
AppendixMissing Pieces Report | The 2016 Board Diversity Census of Women and Minorities on Fortune 500 Boards
Executive Summary
Fortune 100 Findings
Fortune 500 Findings
Appendix
Appendix 3:Fortune 100 Data and Recycle Rates 2004 and 2016
Total Board Seats Total Directors
2004 2016 2004 2016 Recycle Rate 2004
Recycle Rate 2016# % # % # % # %
Fortune 100 Total 1,195 1,205 995 1,074 1.20 1.12 Men 993 83.1% 928 77.0% 824 82.8% 830 77.3% 1.21 1.12 Women 202 16.9% 277 23.0% 171 17.2% 244 22.7% 1.18 1.14
Caucasians/Whites Total 1,017 85.1% 994 82.5% 867 87.1% 894 83.2% 1.17 1.11 Men 851 71.2% 773 64.1% 724 72.8% 696 64.8% 1.18 1.11 Women 166 13.9% 221 18.3% 143 14.4% 198 18.4% 1.16 1.12
Women and Minorities Total 344 28.8% 432 35.9% 271 27.2% 378 35.2% 1.27 1.14 Minorities Total 178 14.9% 211 17.5% 128 12.9% 180 16.8% 1.39 1.17
African American/Black 120 10.0% 119 9.9% 80 8.0% 102 9.5% 1.50 1.17 Asian/Pacific Islander 12 1.0% 38 3.2% 11 1.1% 35 3.3% 1.09 1.09 Hispanic/Latino(a) 46 3.8% 54 4.5% 37 3.7% 43 4.0% 1.24 1.26
Minority Men Total 142 11.9% 155 12.9% 100 10.1% 134 12.5% 1.42 1.16 African American/Black 93 7.8% 90 7.5% 60 6.0% 76 7.1% 1.55 1.18 Asian/Pacific Islander 9 0.8% 25 2.1% 9 0.9% 24 2.2% 1.00 1.04 Hispanic/Latino(a) 40 3.3% 40 3.3% 31 3.1% 34 3.2% 1.29 1.18
Minority Women Total 36 3.0% 56 4.6% 28 2.8% 46 4.3% 1.29 1.22 African American/Black 27 2.3% 29 2.4% 20 2.0% 26 2.4% 1.35 1.12 Asian/Pacific Islander 3 0.3% 13 1.1% 2 0.2% 11 1.0% 1.50 1.18 Hispanic/Latino(a) 6 0.5% 14 1.2% 6 0.6% 9 0.8% 1.00 1.56
ESES I. 2 3II. III.

22
AppendixMissing Pieces Report | The 2016 Board Diversity Census of Women and Minorities on Fortune 500 Boards
Executive Summary
Fortune 100 Findings
Fortune 500 Findings
Appendix
Appendix 4:Fortune 500 Data and Recycle Rates for 2010 and 2016
Total Board Seats Total Directors
2010 2016 2010 2016 Recycle Rate 2010
Recycle Rate 2016# % # % # % # %
Fortune 500 Total 5,463 5,440 4,423 4,496 1.24 1.21 Men 4,607 84.3% 4,340 79.8% 3,758 85.0% 3,610 80.3% 1.23 1.20 Women 856 15.7% 1,100 20.2% 665 15.0% 886 19.7% 1.29 1.24
Caucasians/Whites Total 4,763 87.2% 4,656 85.6% 3,922 88.7% 3,900 86.7% 1.21 1.19 Men 4,068 74.5% 3,763 69.2% 3,368 76.1% 3,170 70.5% 1.21 1.19 Women 695 12.7% 893 16.4% 554 12.5% 730 16.2% 1.25 1.22
Women and Minorities Total 1,395 25.5% 1,677 30.8% 1,058 23.9% 1,326 29.5% 1.32 1.26 Minorities Total 700 12.8% 784 14.4% 504 11.4% 596 13.3% 1.39 1.32
African American/Black 417 7.6% 428 7.9% 278 6.3% 307 6.8% 1.50 1.39 Asian/Pacific Islander 115 2.1% 167 3.1% 96 2.2% 147 3.3% 1.20 1.14 Hispanic/Latino(a) 166 3.0% 188 3.5% 125 2.8% 141 3.1% 1.33 1.33 Other 2 0.0% 1 0.0% 2 0.0% 1 0.0% 1.00 1.00
Minority Men Total 539 9.9% 577 10.6% 393 8.9% 440 9.8% 1.37 1.31 African American/Black 312 5.7% 306 5.6% 210 4.7% 217 4.8% 1.49 1.41 Asian/Pacific Islander 97 1.8% 123 2.3% 81 1.8% 111 2.5% 1.20 1.11 Hispanic/Latino(a) 128 2.3% 147 2.7% 97 2.2% 111 2.5% 1.32 1.32 Other 2 0.0% 1 0.0% 2 0.0% 1 0.0% 1.00 1.00
Minority Women Total 161 2.9% 207 3.8% 111 2.5% 156 3.5% 1.45 1.33 African American/Black 105 1.9% 122 2.2% 68 1.5% 90 2.0% 1.54 1.36 Asian/Pacific Islander 18 0.3% 44 0.8% 15 0.3% 36 0.8% 1.20 1.22 Hispanic/Latino(a) 38 0.7% 41 0.8% 28 0.6% 30 0.7% 1.36 1.37 Other - 0.0% - 0.0% - 0.0% - 0.0%
ESES I. 2 3II. III.
23
AppendixMissing Pieces Report |The 2016 Board Diversity Census of Women and Minorities on Fortune 500 Boards
Executive Summary
Fortune 100 Findings
Fortune 500 Findings
Appendix
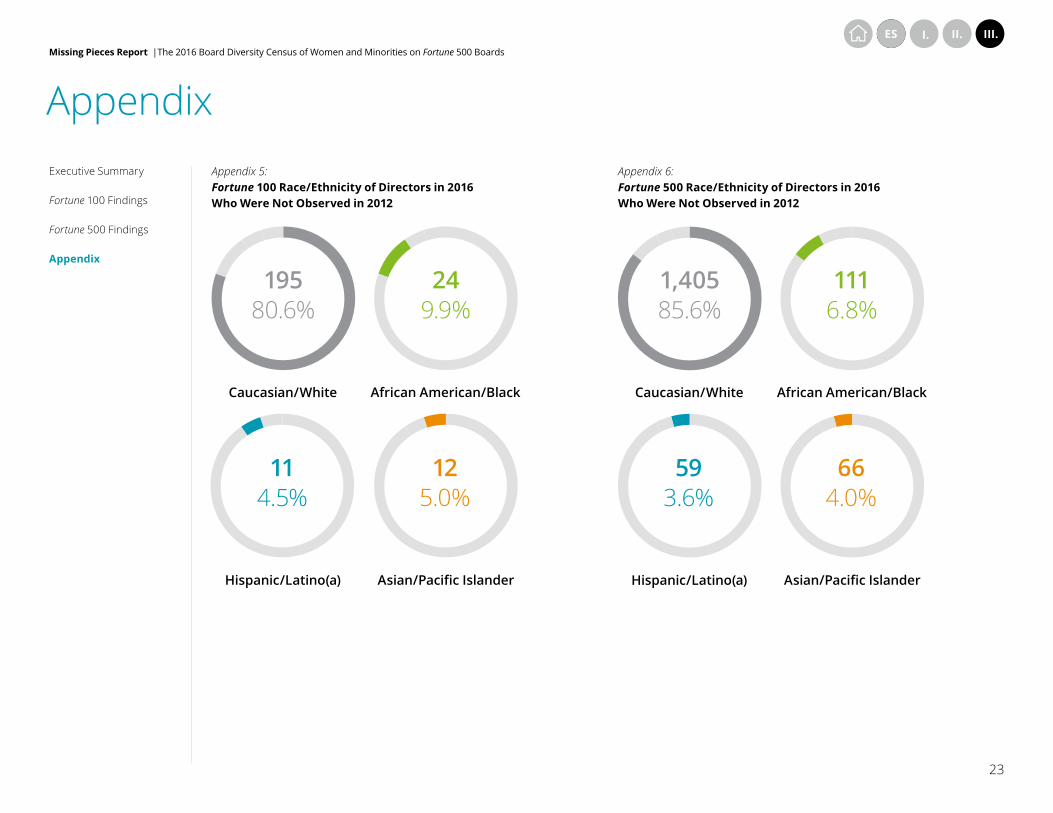
Appendix 5:Fortune 100 Race/Ethnicity of Directors in 2016 Who Were Not Observed in 2012
Caucasian/White
19580.6%
African American/Black
249.9%
Hispanic/Latino(a)
114.5%
Asian/Pacific Islander
125.0%
Appendix 6:Fortune 500 Race/Ethnicity of Directors in 2016 Who Were Not Observed in 2012
Caucasian/White
1,40585.6%
African American/Black
1116.8%
Hispanic/Latino(a)
593.6%
Asian/Pacific Islander
664.0%
ESES I. 2 3II. III.

24
AppendixMissing Pieces Report | The 2016 Board Diversity Census of Women and Minorities on Fortune 500 Boards
Executive Summary
Fortune 100 Findings
Fortune 500 Findings
Appendix
Research Methodology
ABD and Deloitte utilized a census methodology for the 2016 Board Diversity Census. The Board Diversity Census counts Fortune 500 board directors to provide a measurement of the representation and progress of women and minorities in business leadership and to allow for comparable statistics based not on a discrete list of identical companies, but on the Fortune-listed companies in the given years for which the census was conducted.
The Board Diversity Census analyses are based on companies on the Fortune 500 list published in 2016. ABD examined Fortune 500 companies because they are recognized, and serve as the most influential businesses in the US, ranked by revenue each year.
For the purposes of this study, extensive research was conducted to confirm the gender, race, and ethnicity of board directors. To ascertain each company’s total number of directors and board composition, Deloitte reviewed Securities and Exchange Commission annual filings submitted as of June 30, 2016. If these statements were not available or did not list the Board of Directors, Deloitte leveraged other financial statements, such as S-4/A, S1/A, etc. For insurance, companies that do not submit annual filings to the SEC, Deloitte obtained information from the National Association of Insurance Companies (NAIC) regulatory database of annual statements submitted as of June 30, 2016.8 Certain data fields, e.g., Board Chair, Lead Director, Committee Chairmen are not typically identifiable in filings from insurance companies. Additionally, the annual shareholder meeting had to have occurred by June 30, 2016. If these two conditions were not met, Deloitte referred back to the most recent filing that satisfied those parameters.
8 Information submitted to the SEC and NAIC complies with federal or state law. Requirements ensure proper governance, restricting companies to specific content and timing of the filings. SEC filings require companies to list directors serving on the board up to the annual meeting of shareholders and those listed in NAIC filings as directors.
ESES I. 2 3II. III.
25
AppendixMissing Pieces Report | The 2016 Board Diversity Census of Women and Minorities on Fortune 500 Boards
Executive Summary
Fortune 100 Findings
Fortune 500 Findings
Appendix
For the Fortune 100 companies, we evaluated 98 companies due to availability of filings and data. For the Fortune 500 companies, we evaluated 492 companies due to availability of filings and data. The excluded companies are listed as follows:
• Jarden, Fortune Rank 328
• Jones Financial, Fortune Rank 382
• Land O’ Lakes, Fortune Rank 215
• Lansing Trade Group, Fortune Rank 463
• Liberty Mutual Insurance Group, Fortune Rank 73
• Pacific Life, Fortune Rank 326
• Peter Kiewit Sons’ Inc., Fortune Rank 314
• TIAA, Fortune Rank 82
For the 2016 census, to confirm the gender of individual board members, Deloitte leveraged third party data obtained from ESG MSCI, an independent provider of research-driven insights and tools for institutional investors. To confirm the race/ethnicity of individual board members, data was compared against previous studies conducted by Catalyst, The Executive Leadership Council, the Hispanic Association of Corporate Responsibility and Leadership Education for Asian Pacifics. When an individual director was new to the census, each organization conducted a rigorous review of publicly available information in making an attempt to verify an individual’s race and ethnicity. The initial identification was followed by email and written campaigns, and in some instances phone follow-up to the Fortune 500 companies in an attempt to validate the race, ethnicity, and gender of individual directors in the Fortune 500. ABD makes every effort to achieve a high degree of data accuracy and has applied consistent and numerous attempts to verify the information in this census; changes received after January 13, 2017, have not been included in this report. If errors or omissions are discovered, ABD will make reasonable adjustments. Please contact the ABD at [email protected] or Deloitte at [email protected]. For the purpose of this census the following definitions were used:
Asian/Pacific Islander is defined as a person having origins in any of the original peoples of the Far East, Southeast Asia, or the Indian subcontinent. Southeast Asian generally includes Cambodian, Hmong, Indonesian, Laotian, Malaysian, Singaporean, Thai, and Vietnamese. South Asian generally includes Asian Indian, Bangladeshi, Bhutanese, Nepalese, Pakistani, and Sri Lankan. The Native Hawaiian or Pacific Islander category is defined as a person having origins in any of the original peoples of Hawaii, Guam, Samoa, or other Pacific Islands.
African American/Black is defined as a person having origins in any of the Black racial groups of Africa. The Black racial category includes people who marked the “Black or African American” checkbox. It also includes respondents who reported entries such as African American; Sub-Saharan African entries, such as Kenyan and Nigerian; and Afro-Caribbean entries, such as Haitian and Jamaican. Sub-Saharan African entries are classified as Black or African American with the exception of Sudanese and Cape Verdean because of their complex, historical heritage. North African entries are classified as White.
Hispanic/Latino(a) is defined as a US citizen, a non-citizen national of the US, or a lawful permanent resident of the US who is of Mexican, Puerto Rican, Cuban, Central or South American, or other Spanish cultures or origins. It does not include people of Portuguese culture or origin.
Caucasian/White is defined as a person having origins in any of the original peoples of Europe, the Middle East, or North Africa. Gender refers to the socially constructed and culturally specific behaviors, roles, and attributes (i.e., feminine or masculine) assigned to women and men, respectively, whereas “sex” refers to biological differences. The two terms are not interchangeable.
The census analyses are based on the human resources reporting guidelines created by the Office of Personal Management, the US Census, and the Human Rights Campaign.
ESES I. 2 3II. III.

This publication contains general information only and Deloitte is not, by means of this publication, rendering accounting, business, financial, investment, legal, tax, or other professional advice or services. This publication is not a substitute for such professional advice or services, nor should it be used as a basis for any decision or action that may affect your business. Before making any decision or taking any action that may affect your business, you should consult a qualified professional advisor. Deloitte shall not be responsible for any loss sustained by any person who relies on this publication.
About DeloitteDeloitte refers to one or more of Deloitte Touche Tohmatsu Limited, a UK private company limited by guarantee (“DTTL”), its network of member firms, and their related entities. DTTL and each of its member firms are legally separate and independent entities. DTTL (also referred to as “Deloitte Global”) does not provide services to clients. In the United States, Deloitte refers to one or more of the US member firms of DTTL, their related entities that operate using the “Deloitte” name in the United States and their respective affiliates. Certain services may not be available to attest clients under the rules and regulations of public accounting. Please see www.deloitte.com/about to learn more about our global network of member firms.
Copyright © 2017 Deloitte Development LLC. All rights reserved.
Copyright © Catalyst, Diversified Search, The Executive Leadership Council, the Hispanic Association on Corporate Responsibility, and Leadership Education for Asian Pacifics, Inc. 2017. The copyright owners grant permission to use Missing Pieces Report: The 2016 Board Diversity Census of Women and Minorities on Fortune 500 Boards subject to the following attribution: “Reprinted with permission from Catalyst, Diversified Search, The Executive Leadership Council, the Hispanic Association on Corporate Responsibility, and Leadership Education for Asian Pacifics, Inc.” Published on February 6, 2017.