alliance residential company - fora · alliance residential company ... (4s and 5s) = kingsley...
TRANSCRIPT

April 2015
Contact:Kingsley Associates
1-877-908-1220
Strategy. Research. Consulting. www.kingsleyassociates.com
Alliance Residential Company2015 Q1 CORE Program
Community YTD Report
Preston Park

Alliance Residential Company2015 Q1 CORE ProgramCommunity YTD Report - Preston Park
EXECUTIVE SUMMARYPROJECT OVERVIEW AND METHODOLOGY
Kingsley Associates was commissioned by Alliance Residential Company to conduct its 2015 Q1 CORE Program. The goal of the assessment was to gauge resident satisfaction throughout the Alliance Residential Company portfolio as a means of improving performance, increasing retention, maximizing portfolio value and achieving operational excellence.
Response Rates:
Timeline:
RespondentsPotential
RespondentsResponse
RateCommunity YTD Report
Preston Park -- Move-in 7 38.9 18 2015%
Preston Park -- Pre-renewal 1 10.0 10 2015%
Preston Park -- Prospect 2 9.5 21 2015%
Preston Park -- Service Request 28 20.4 137 2015%
Alliance Residential Company Multifamily 2015 Portfolio
12,899 17.4 74,094 2015%
1/1 3/31
Survey Launch Cutoff
Weekly launches each Wednesday, with reminder emails sent 4 and 9 days after initial invitation.
Results from the 2015 assessment are compared to the Kingsley Index, enabling Alliance Residential Company to benchmark its community and portfolio results against the largest and most comprehensive performance-benchmarking database in the industry.
Compiled from over 30 years of analyzing the performance of real estate industry leaders, the proprietary Index represents the industry standard for measuring customer satisfaction.
Kingsley Index:
2
© Copyright 2015 Kingsley Associates. All Rights Reserved.

Alliance Residential Company2015 Q1 CORE ProgramCommunity YTD Report - Preston Park
EXECUTIVE SUMMARYPERFORMANCE DASHBOARD
50%
55%
60%
65%70% 75% 80%
85%
90%
95%
100%Mgmt. - Overall
Satisfaction
50%
55%
60%
65%70% 75% 80%
85%
90%
95%
100%Maintenance - Overall
Satisfaction
50%
55%
60%
65%70% 75% 80%
85%
90%
95%
100%Community Recommendation
= Report percentage.
Kingsley Associates' Key Performance Indicators (KPIs)
% of Satisfied Residents(4s and 5s)
= Kingsley Index.
= Portfolio percentage.
A needle pointing to 50% indicates that the percentage of residents rating the area 4 or 5 is 50% or less. If no needles are present in a gauge, there were no responses for that question.
Resident Satisfaction Matrix
SatisfactionIndicatorAssessment Category
Leasing
Community Management
Maintenance
Community Features
Apartment Features
Satisfaction indicators represent the intra-portfolio percentile ranking.
Bottom quartile
2nd quartile
Above Portfolio
50%
55%
60%
65%
70% 75% 80%
85%
90%
95%
100%Overall Satisfaction
50%
55%
60%
65%
70% 75% 80%
85%
90%
95%
100%Value for Amount Asked
0%
10%
20%
30%
40%
50%
60%
70%
80%
90%
100%
2014 Q1 2015 YTD PortfolioYTD
KI
73%
100% 100%
48% 51%
18%
0% 0%
27%25%
9%0% 0%
25% 23%
Renewal Decision
Pe
rce
nt
of
Re
sp
on
se
s (
%)
= Likely = Unsure = Unlikely
3
© Copyright 2015 Kingsley Associates. All Rights Reserved.

Alliance Residential Company2015 Q1 CORE ProgramCommunity YTD Report - Preston Park
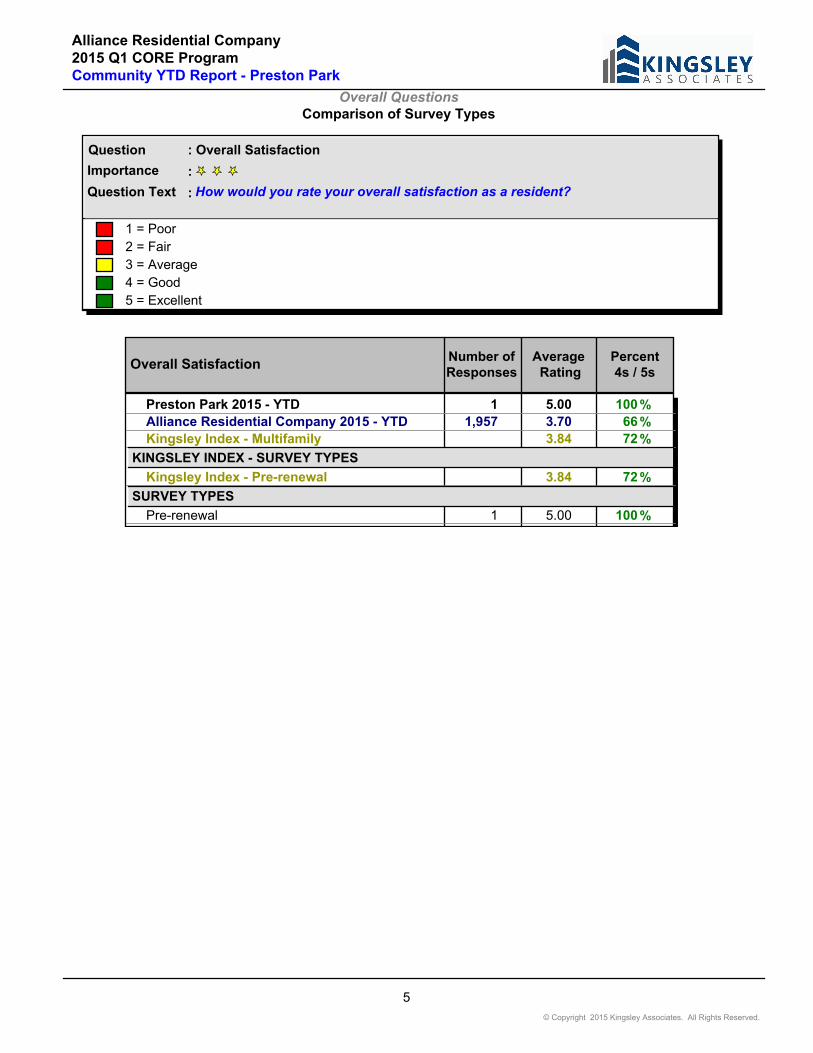
Overall Questions
:Importance
How would you rate your overall satisfaction as a resident?
: Overall Satisfaction
Question Text
Question
:
1 = Poor
2 = Fair
3 = Average
4 = Good
5 = Excellent
1.00
1.50
2.00
2.50
3.00
3.50
4.00
4.50
5.00
2013 2014 Q1 2015 - YTD Portfolio - YTD KI
4.04 4.09
5.00 5.00
3.703.84
Comparison of Average Scores
Po
or
to E
xcellen
t
Overall Satisfaction Number of Responses
Average Rating
Dissatisfied Satisfied
1 2 3 4 5
Neutral
4.04 23Preston Park 2013 0% 0 26 43 30% % % %
4.09 11Preston Park 2014 0% 18 9 18 55% % % %
5.00 1Q1 0% 0 0 0 100% % % %
5.00 1Preston Park 2015 - YTD 0% 0 0 0 100% % % %
3.70 1,957Alliance Residential Company 2015 - YTD
6% 9 18 40 26% % % %
3.84Kingsley Index - Multifamily 4% 7 16 45 27% % % %
4
© Copyright 2015 Kingsley Associates. All Rights Reserved.
Alliance Residential Company2015 Q1 CORE ProgramCommunity YTD Report - Preston Park
Overall QuestionsComparison of Survey Types
:Importance
How would you rate your overall satisfaction as a resident?
: Overall Satisfaction
Question Text
Question
:
1 = Poor
2 = Fair
3 = Average
4 = Good
5 = Excellent
Number of Responses
Overall SatisfactionAverage Rating
Percent4s / 5s
Preston Park 2015 - YTD 1 5.00 % 100
Alliance Residential Company 2015 - YTD 1,957 3.70 % 66
Kingsley Index - Multifamily 3.84 % 72
KINGSLEY INDEX - SURVEY TYPES
Kingsley Index - Pre-renewal 3.84 % 72
SURVEY TYPES
Pre-renewal 1 5.00 % 100
5
© Copyright 2015 Kingsley Associates. All Rights Reserved.
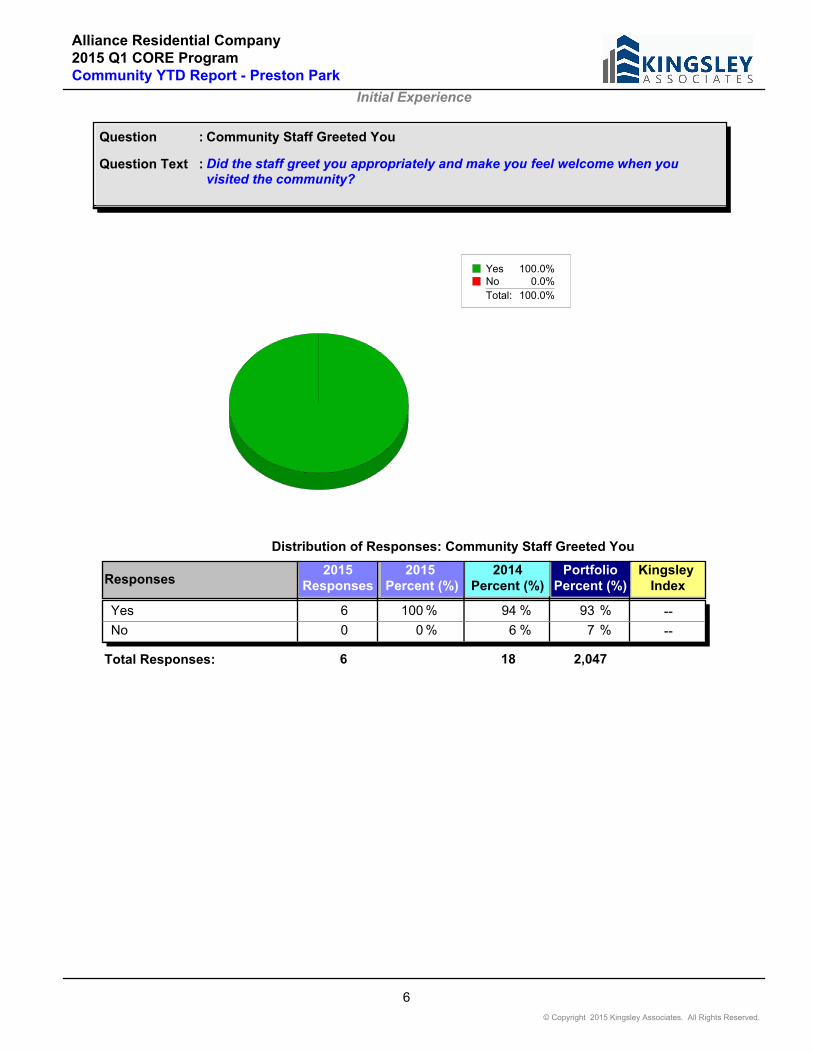
Alliance Residential Company2015 Q1 CORE ProgramCommunity YTD Report - Preston Park
Initial Experience
Did the staff greet you appropriately and make you feel welcome when you visited the community?
Community Staff Greeted You
Question Text
Question
:
:
Yes 100.0%No 0.0%
Total: 100.0%
Responses2015
Responses2015
Percent (%)
Distribution of Responses: Community Staff Greeted You
Kingsley Index
PortfolioPercent (%)
2014Percent (%)
%Yes 6 100 -- 94 % 93 %
%No 0 0 -- 6 % 7 %
Total Responses: 6 18 2,047
6
© Copyright 2015 Kingsley Associates. All Rights Reserved.

Alliance Residential Company2015 Q1 CORE ProgramCommunity YTD Report - Preston Park
Initial ExperienceComparison of Survey Types
:Importance
Did the staff greet you appropriately and make you feel welcome when you visited the community?
: Community Staff Greeted You
Question Text
Question
:
N/A
Community Staff Greeted YouDist. of Responses (%)
Number of Responses YesNo
% % 100 0 6Preston Park 2015 - YTD
% % 93 7 2,047Alliance Residential Company 2015 - YTD
SURVEY TYPES
% % 100 0 6Move-in
7
© Copyright 2015 Kingsley Associates. All Rights Reserved.

Alliance Residential Company2015 Q1 CORE ProgramCommunity YTD Report - Preston Park
Initial Experience
Please indicate if the lease was prepared correctly on the day of your move.
Lease Prepared Correctly
Question Text
Question
:
:
Yes 100.0%No 0.0%
Total: 100.0%
Responses2015
Responses2015
Percent (%)
Distribution of Responses: Lease Prepared Correctly
Kingsley Index
PortfolioPercent (%)
2014Percent (%)
%Yes 7 100 -- 100 % 92 %
%No 0 0 ---- 8 %
Total Responses: 7 18 1,974
8
© Copyright 2015 Kingsley Associates. All Rights Reserved.
Alliance Residential Company2015 Q1 CORE ProgramCommunity YTD Report - Preston Park
Initial ExperienceComparison of Survey Types
:Importance
Please indicate if the lease was prepared correctly on the day of your move.
: Lease Prepared Correctly
Question Text
Question
:
N/A
Lease Prepared CorrectlyDist. of Responses (%)
Number of Responses YesNo
% % 100 0 7Preston Park 2015 - YTD
% % 92 8 1,974Alliance Residential Company 2015 - YTD
SURVEY TYPES
% % 100 0 7Move-in
9
© Copyright 2015 Kingsley Associates. All Rights Reserved.

Alliance Residential Company2015 Q1 CORE ProgramCommunity YTD Report - Preston Park
Initial Experience
Please indicate if the apartment keys were ready on the day of your move.
Apartment Keys Ready at Move-in
Question Text
Question
:
:
Yes 100.0%No 0.0%
Total: 100.0%
Responses2015
Responses2015
Percent (%)
Distribution of Responses: Apartment Keys Ready at Move-in
Kingsley Index
PortfolioPercent (%)
2014Percent (%)
%Yes 7 100 95 % 94 % 92 %
%No 0 0 5 % 6 % 8 %
Total Responses: 7 17 1,972
10
© Copyright 2015 Kingsley Associates. All Rights Reserved.

Alliance Residential Company2015 Q1 CORE ProgramCommunity YTD Report - Preston Park
Initial ExperienceComparison of Survey Types
:Importance
Please indicate if the apartment keys were ready on the day of your move.
: Apartment Keys Ready at Move-in
Question Text
Question
:
N/A
Apartment Keys Ready at Move-inDist. of Responses (%)
Number of Responses YesNo
% % 100 0 7Preston Park 2015 - YTD
% % 92 8 1,972Alliance Residential Company 2015 - YTD
% % 95 5Kingsley Index - Multifamily
KINGSLEY INDEX - SURVEY TYPES
% % 95 5Kingsley Index - Move-in
SURVEY TYPES
% % 100 0 7Move-in
11
© Copyright 2015 Kingsley Associates. All Rights Reserved.

Alliance Residential Company2015 Q1 CORE ProgramCommunity YTD Report - Preston Park
Scale: 1 = poor, 2 = fair, 3 = average, 4 = good, 5 = excellent
LeasingRating Areas
Leasing Staff - Knowledge % 4s and 5s
Avg.Rating
Count
84.75 4.75 100%Preston Park 2013
24.00 4.00 50%Preston Park 2014
3.50 2 3.50 50% 2015 Preston Park - YTD
2,1974.38 4.38 87%Alliance Residential Company - YTD
2015
--4.56 4.56 91%Kingsley Index 2015
KINGSLEY INDEX - SURVEY TYPES
--4.56 4.56 91%KI - Prospect 2015
QUARTERS
23.50 3.50 50%Q1
SURVEY TYPES
23.50 3.50 50%Prospect
Leasing Staff - Made You Feel Important % 4s and 5s
Avg.Rating
Count
84.75 4.75 100%Preston Park 2013
24.00 4.00 50%Preston Park 2014
3.50 2 3.50 50% 2015 Preston Park - YTD
2,2074.26 4.26 83%Alliance Residential Company - YTD
2015
QUARTERS
23.50 3.50 50%Q1
SURVEY TYPES
23.50 3.50 50%Prospect
12
© Copyright 2015 Kingsley Associates. All Rights Reserved.
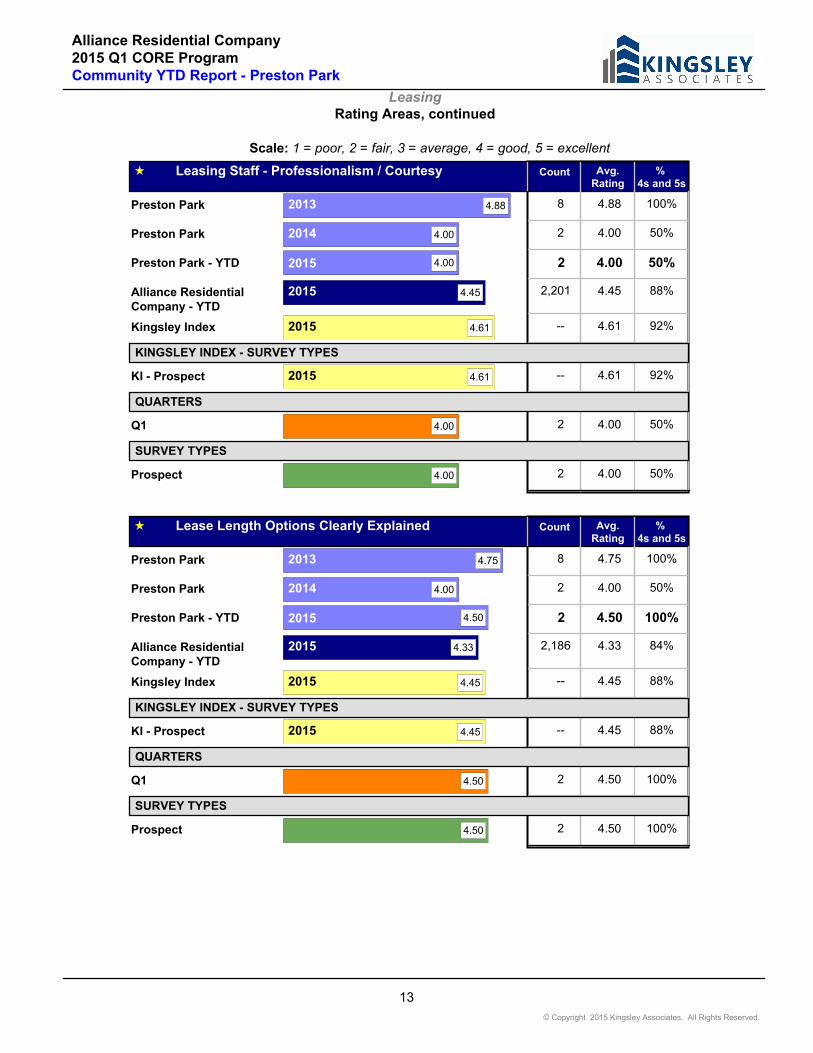
Alliance Residential Company2015 Q1 CORE ProgramCommunity YTD Report - Preston Park
Scale: 1 = poor, 2 = fair, 3 = average, 4 = good, 5 = excellent
LeasingRating Areas, continued
Leasing Staff - Professionalism / Courtesy % 4s and 5s
Avg.Rating
Count
84.88 4.88 100%Preston Park 2013
24.00 4.00 50%Preston Park 2014
4.00 2 4.00 50% 2015 Preston Park - YTD
2,2014.45 4.45 88%Alliance Residential Company - YTD
2015
--4.61 4.61 92%Kingsley Index 2015
KINGSLEY INDEX - SURVEY TYPES
--4.61 4.61 92%KI - Prospect 2015
QUARTERS
24.00 4.00 50%Q1
SURVEY TYPES
24.00 4.00 50%Prospect
Lease Length Options Clearly Explained % 4s and 5s
Avg.Rating
Count
84.75 4.75 100%Preston Park 2013
24.00 4.00 50%Preston Park 2014
4.50 2 4.50 100% 2015 Preston Park - YTD
2,1864.33 4.33 84%Alliance Residential Company - YTD
2015
--4.45 4.45 88%Kingsley Index 2015
KINGSLEY INDEX - SURVEY TYPES
--4.45 4.45 88%KI - Prospect 2015
QUARTERS
24.50 4.50 100%Q1
SURVEY TYPES
24.50 4.50 100%Prospect
13
© Copyright 2015 Kingsley Associates. All Rights Reserved.

Alliance Residential Company2015 Q1 CORE ProgramCommunity YTD Report - Preston Park
Community Management
:Importance
Please rate your overall satisfaction with management.
: Mgmt. - Overall Satisfaction
Question Text
Question
:
1 = Poor
2 = Fair
3 = Average
4 = Good
5 = Excellent
1.00
1.50
2.00
2.50
3.00
3.50
4.00
4.50
5.00
2013 2014 Q1 2015 - YTD Portfolio - YTD KI
4.18
4.45
5.00 5.00
3.81
4.03
Comparison of Average Scores
Po
or
to E
xcellen
t
Mgmt. - Overall Satisfaction Number of Responses
Average Rating
Dissatisfied Satisfied
1 2 3 4 5
Neutral
4.18 22Preston Park 2013 5% 0 18 27 50% % % %
4.45 11Preston Park 2014 0% 0 0 55 45% % % %
5.00 1Q1 0% 0 0 0 100% % % %
5.00 1Preston Park 2015 - YTD 0% 0 0 0 100% % % %
3.81 1,899Alliance Residential Company 2015 - YTD
8% 9 14 31 38% % % %
4.03Kingsley Index - Multifamily 5% 6 12 36 41% % % %
14
© Copyright 2015 Kingsley Associates. All Rights Reserved.
Alliance Residential Company2015 Q1 CORE ProgramCommunity YTD Report - Preston Park
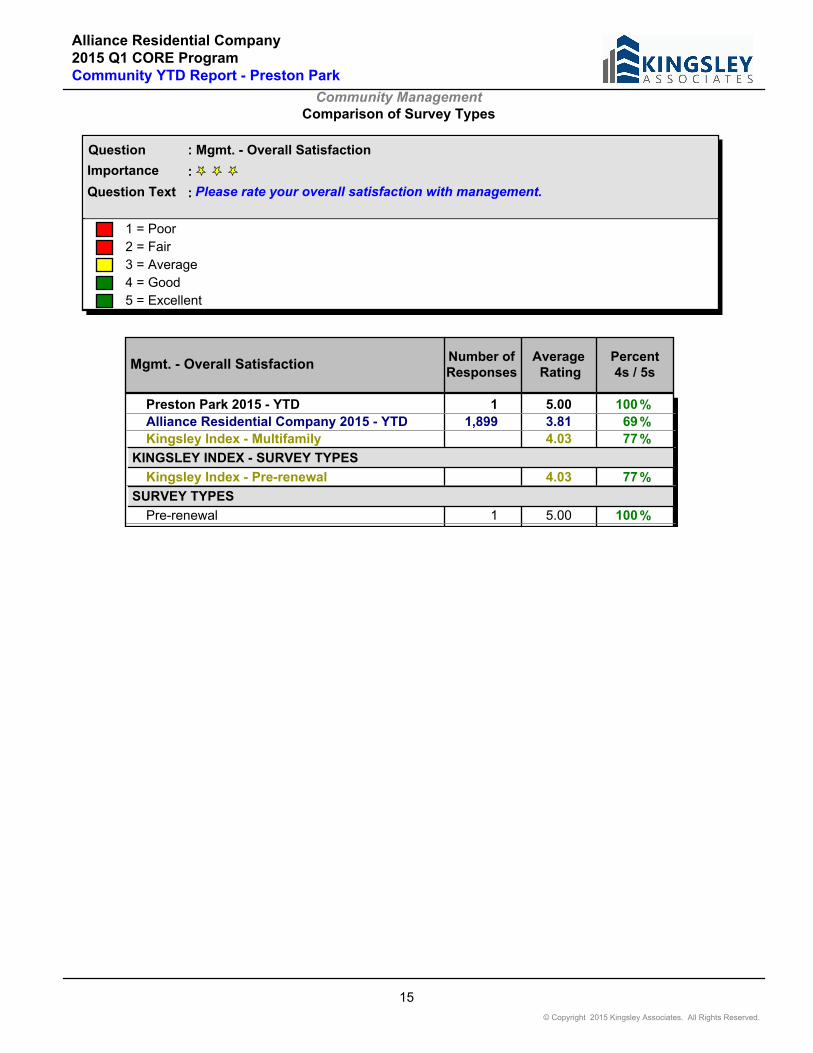
Community ManagementComparison of Survey Types
:Importance
Please rate your overall satisfaction with management.
: Mgmt. - Overall Satisfaction
Question Text
Question
:
1 = Poor
2 = Fair
3 = Average
4 = Good
5 = Excellent
Number of Responses
Mgmt. - Overall SatisfactionAverage Rating
Percent4s / 5s
Preston Park 2015 - YTD 1 5.00 % 100
Alliance Residential Company 2015 - YTD 1,899 3.81 % 69
Kingsley Index - Multifamily 4.03 % 77
KINGSLEY INDEX - SURVEY TYPES
Kingsley Index - Pre-renewal 4.03 % 77
SURVEY TYPES
Pre-renewal 1 5.00 % 100
15
© Copyright 2015 Kingsley Associates. All Rights Reserved.
Alliance Residential Company2015 Q1 CORE ProgramCommunity YTD Report - Preston Park
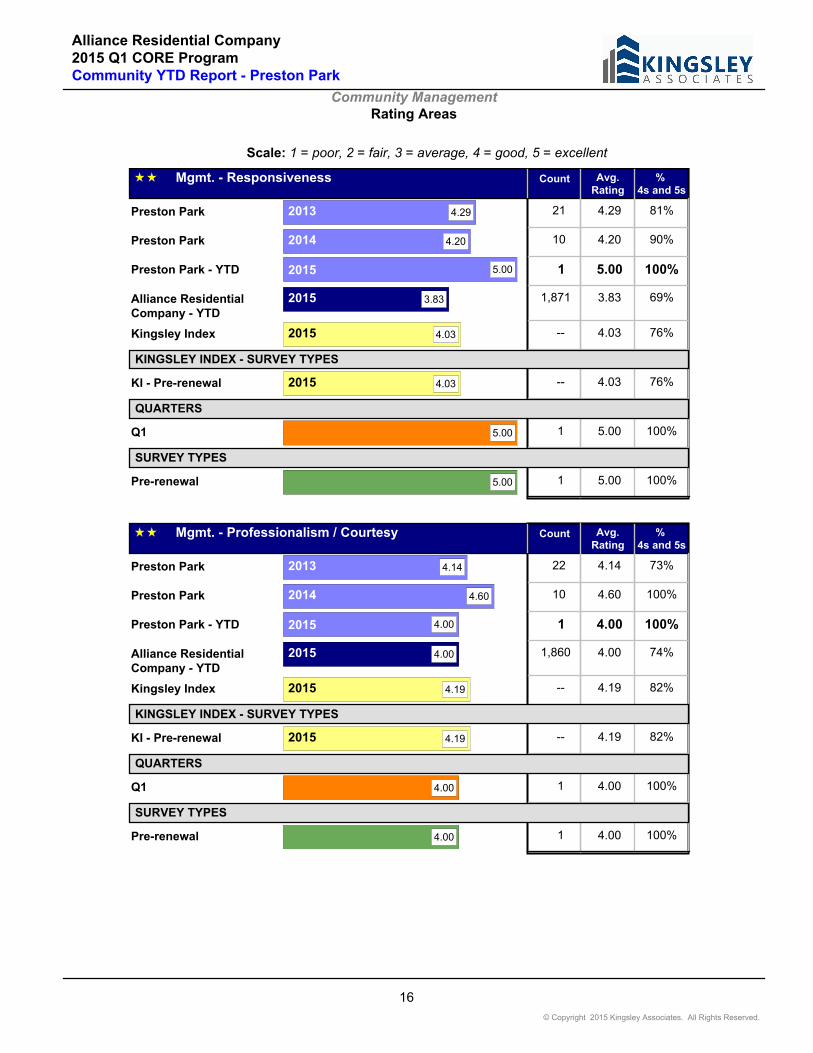
Scale: 1 = poor, 2 = fair, 3 = average, 4 = good, 5 = excellent
Community ManagementRating Areas
Mgmt. - Responsiveness % 4s and 5s
Avg.Rating
Count
214.29 4.29 81%Preston Park 2013
104.20 4.20 90%Preston Park 2014
5.00 1 5.00 100% 2015 Preston Park - YTD
1,8713.83 3.83 69%Alliance Residential Company - YTD
2015
--4.03 4.03 76%Kingsley Index 2015
KINGSLEY INDEX - SURVEY TYPES
--4.03 4.03 76%KI - Pre-renewal 2015
QUARTERS
15.00 5.00 100%Q1
SURVEY TYPES
15.00 5.00 100%Pre-renewal
Mgmt. - Professionalism / Courtesy % 4s and 5s
Avg.Rating
Count
224.14 4.14 73%Preston Park 2013
104.60 4.60 100%Preston Park 2014
4.00 1 4.00 100% 2015 Preston Park - YTD
1,8604.00 4.00 74%Alliance Residential Company - YTD
2015
--4.19 4.19 82%Kingsley Index 2015
KINGSLEY INDEX - SURVEY TYPES
--4.19 4.19 82%KI - Pre-renewal 2015
QUARTERS
14.00 4.00 100%Q1
SURVEY TYPES
14.00 4.00 100%Pre-renewal
16
© Copyright 2015 Kingsley Associates. All Rights Reserved.

Alliance Residential Company2015 Q1 CORE ProgramCommunity YTD Report - Preston Park
Community Management
:Importance
How long does it generally take management to respond to non-emergency calls?
: Community Management Response Time
Question Text
Question
:
N/A
48+ hours
24-48 hours
2-24 hours
Within 2 hours
0%
10%
20%
30%
40%
50%
60%
70%
80%
90%
100%
2013 2014 Q1 2015 - YTD Portfolio -YTD
KI
40%
20%
0% 0%
18%24%
50%
20%
100% 100%
47%
54%
0%
60%
0% 0%
22%
17%
10%
0% 0% 0%
13%5%
Perc
en
t o
f R
esp
on
ses
(%
)
Distribution of Responses: Community Management Response Time
Distribution of Responses (%)
Community Management Response Time
Number of Responses
Within 2 hours
2-24 hours24-48 hours48+ hours
%%%% 40 50 0 10 10Preston Park 2013
%%%% 20 20 60 0 5Preston Park 2014
%%%% 0 100 0 0 1Q1
%% 0 100 0 0 1Preston Park 2015 - YTD % %
%%%% 18 47 22 13 1,564Alliance Residential Company 2015 - YTD
%%%% 24 54 17 5Kingsley Index - Multifamily
17
© Copyright 2015 Kingsley Associates. All Rights Reserved.
Alliance Residential Company2015 Q1 CORE ProgramCommunity YTD Report - Preston Park
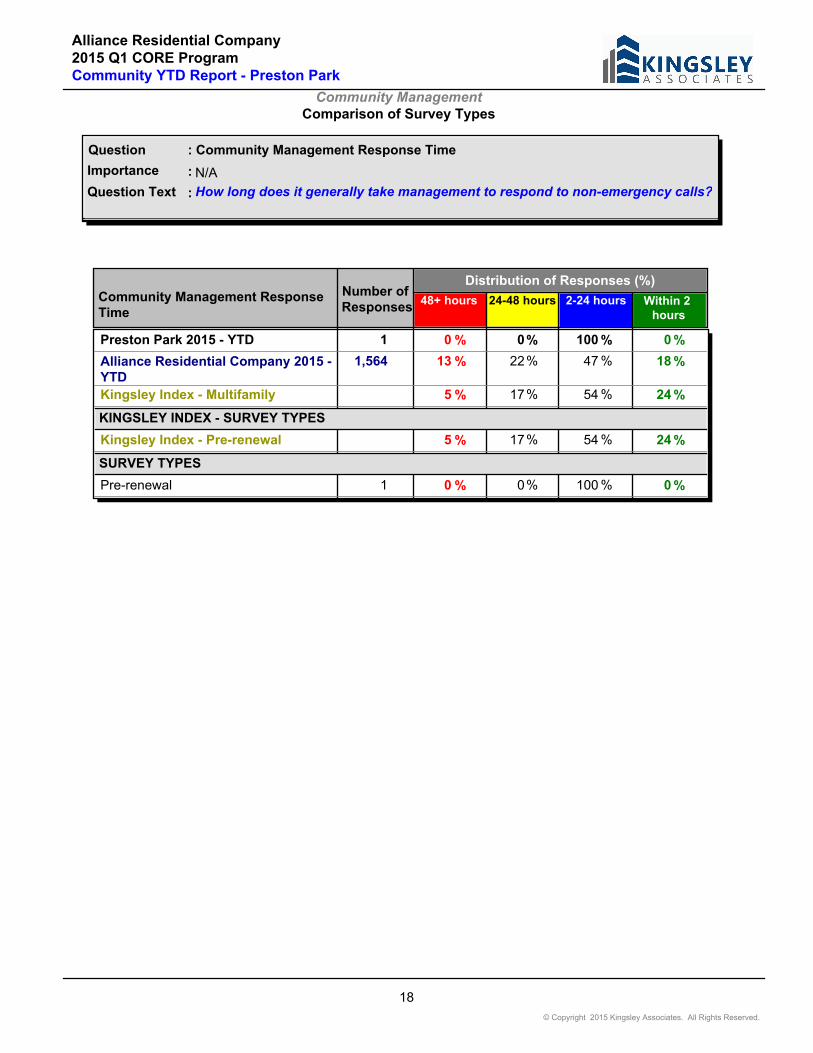
Community ManagementComparison of Survey Types
:Importance
How long does it generally take management to respond to non-emergency calls?
: Community Management Response Time
Question Text
Question
:
N/A
Distribution of Responses (%)Number of Responses
Within 2 hours
2-24 hours24-48 hours48+ hoursCommunity Management Response Time
%% 0 100 0 0 1Preston Park 2015 - YTD % %
%%%% 18 47 22 13 1,564Alliance Residential Company 2015 - YTD
%%%% 24 54 17 5Kingsley Index - Multifamily
KINGSLEY INDEX - SURVEY TYPES
%%%% 24 54 17 5Kingsley Index - Pre-renewal
SURVEY TYPES
%%%% 0 100 0 0 1Pre-renewal
18
© Copyright 2015 Kingsley Associates. All Rights Reserved.

Alliance Residential Company2015 Q1 CORE ProgramCommunity YTD Report - Preston Park
Community Management
:Importance
What frequency of communication do you currently receive from management?
: Current Contact with Community Management
Question Text
Question
:
N/A
Once a week
Once a month
Once a quarter
Twice a year
Never
0%
10%
20%
30%
40%
50%
60%
70%
80%
90%
100%
2013 2014 Q1 2015 - YTD Portfolio - YTD0% 0% 0% 0%
14%
75%
90%
100% 100%
52%
25%
10%
0% 0%
19%
0% 0% 0% 0%
4%
0% 0% 0% 0%
11%
Pe
rce
nt
of
Res
po
ns
es (
%)
Distribution of Responses: Current Contact with Community Management
Never Twice a year Once a quarter
Once a month Once a week
Distribution of Responses (%)Number of Responses
Current Contact with Community Management
0% % % % % 75 25 0 0 4Preston Park 2013
0% % % % % 90 10 0 0 10Preston Park 2014
0% % % % % 100 0 0 0 1Q1
0% % 100 0 0 0 1Preston Park 2015 - YTD %%%
14% % % % % 52 19 4 11 1,804Alliance Residential Company 2015 - YTD
19
© Copyright 2015 Kingsley Associates. All Rights Reserved.
Alliance Residential Company2015 Q1 CORE ProgramCommunity YTD Report - Preston Park
Community ManagementComparison of Survey Types
:Importance
What frequency of communication do you currently receive from management?
: Current Contact with Community Management
Question Text
Question
:
N/A
Never Twice a year Once a quarter
Once a month Once a week
Distribution of Responses (%)Number of Responses
Current Contact with Community Management
0% % 100 0 0 0 1Preston Park 2015 - YTD % % %
14% % % % % 52 19 4 11 1,804Alliance Residential Company 2015 - YTD
SURVEY TYPES
0% % % % % 100 0 0 0 1Pre-renewal
20
© Copyright 2015 Kingsley Associates. All Rights Reserved.
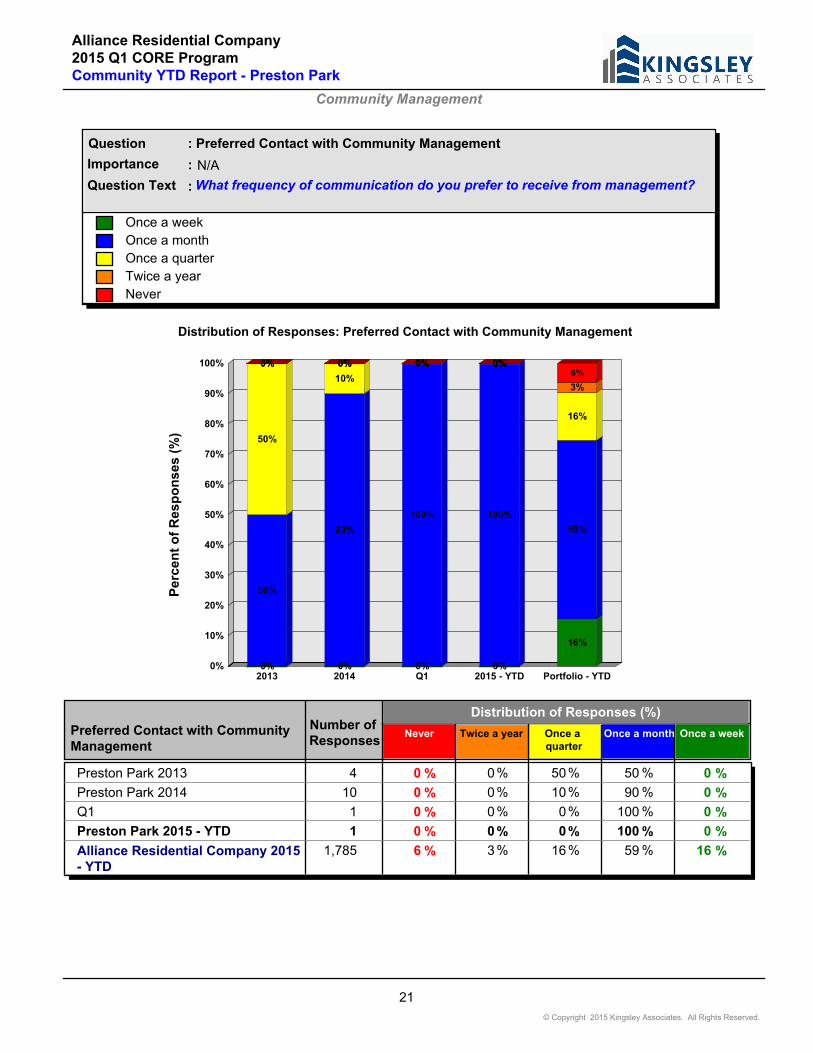
Alliance Residential Company2015 Q1 CORE ProgramCommunity YTD Report - Preston Park
Community Management
:Importance
What frequency of communication do you prefer to receive from management?
: Preferred Contact with Community Management
Question Text
Question
:
N/A
Once a week
Once a month
Once a quarter
Twice a year
Never
0%
10%
20%
30%
40%
50%
60%
70%
80%
90%
100%
2013 2014 Q1 2015 - YTD Portfolio - YTD0% 0% 0% 0%
16%
50%
90%
100% 100%
59%
50%
10%
0% 0%
16%
0% 0% 0% 0%
3%
0% 0% 0% 0%6%
Pe
rce
nt
of
Res
po
ns
es (
%)
Distribution of Responses: Preferred Contact with Community Management
Never Twice a year Once a quarter
Once a month Once a week
Distribution of Responses (%)Number of Responses
Preferred Contact with Community Management
0% % % % % 50 50 0 0 4Preston Park 2013
0% % % % % 90 10 0 0 10Preston Park 2014
0% % % % % 100 0 0 0 1Q1
0% % 100 0 0 0 1Preston Park 2015 - YTD %%%
16% % % % % 59 16 3 6 1,785Alliance Residential Company 2015 - YTD
21
© Copyright 2015 Kingsley Associates. All Rights Reserved.

Alliance Residential Company2015 Q1 CORE ProgramCommunity YTD Report - Preston Park
Community ManagementComparison of Survey Types
:Importance
What frequency of communication do you prefer to receive from management?
: Preferred Contact with Community Management
Question Text
Question
:
N/A
Never Twice a year Once a quarter
Once a month Once a week
Distribution of Responses (%)Number of Responses
Preferred Contact with Community Management
0% % 100 0 0 0 1Preston Park 2015 - YTD % % %
16% % % % % 59 16 3 6 1,785Alliance Residential Company 2015 - YTD
SURVEY TYPES
0% % % % % 100 0 0 0 1Pre-renewal
22
© Copyright 2015 Kingsley Associates. All Rights Reserved.

Alliance Residential Company2015 Q1 CORE ProgramCommunity YTD Report - Preston Park
Maintenance
:Importance
Please rate your overall satisfaction with maintenance.
: Maintenance - Overall Satisfaction
Question Text
Question
:
1 = Poor
2 = Fair
3 = Average
4 = Good
5 = Excellent
1.00
1.50
2.00
2.50
3.00
3.50
4.00
4.50
5.00
2013 2014 Q1 2015 - YTD Portfolio - YTD KI
4.504.39
4.57 4.57
4.26
4.44
Comparison of Average Scores
Po
or
to E
xcellen
t
Maintenance - Overall Satisfaction Number of Responses
Average Rating
Dissatisfied Satisfied
1 2 3 4 5
Neutral
4.50 159Preston Park 2013 2% 3 5 25 65% % % %
4.39 102Preston Park 2014 5% 5 4 19 68% % % %
4.57 28Q1 0% 4 0 32 64% % % %
4.57 28Preston Park 2015 - YTD 0% 4 0 32 64% % % %
4.26 8,312Alliance Residential Company 2015 - YTD
6% 4 7 23 60% % % %
4.44Kingsley Index - Multifamily 4% 3 5 21 67% % % %
23
© Copyright 2015 Kingsley Associates. All Rights Reserved.
Alliance Residential Company2015 Q1 CORE ProgramCommunity YTD Report - Preston Park
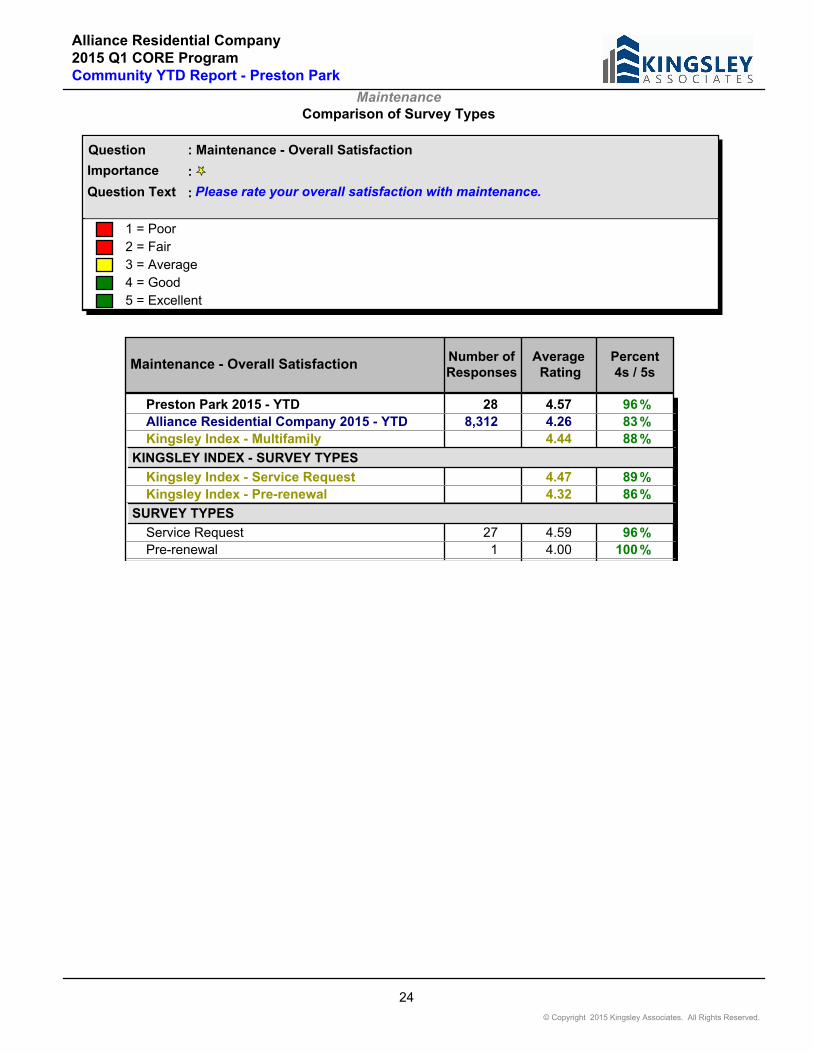
MaintenanceComparison of Survey Types
:Importance
Please rate your overall satisfaction with maintenance.
: Maintenance - Overall Satisfaction
Question Text
Question
:
1 = Poor
2 = Fair
3 = Average
4 = Good
5 = Excellent
Number of Responses
Maintenance - Overall SatisfactionAverage Rating
Percent4s / 5s
Preston Park 2015 - YTD 28 4.57 % 96
Alliance Residential Company 2015 - YTD 8,312 4.26 % 83
Kingsley Index - Multifamily 4.44 % 88
KINGSLEY INDEX - SURVEY TYPES
Kingsley Index - Service Request 4.47 % 89
Kingsley Index - Pre-renewal 4.32 % 86
SURVEY TYPES
Service Request 27 4.59 % 96
Pre-renewal 1 4.00 % 100
24
© Copyright 2015 Kingsley Associates. All Rights Reserved.
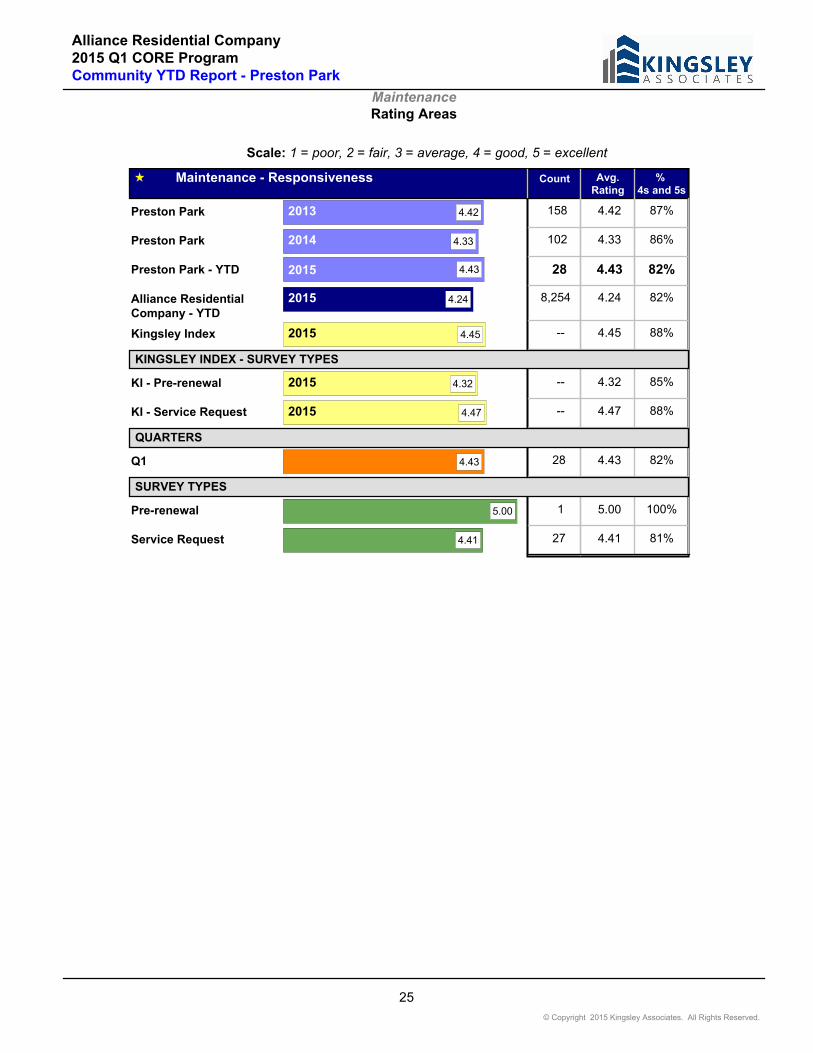
Alliance Residential Company2015 Q1 CORE ProgramCommunity YTD Report - Preston Park
Scale: 1 = poor, 2 = fair, 3 = average, 4 = good, 5 = excellent
MaintenanceRating Areas
Maintenance - Responsiveness % 4s and 5s
Avg.Rating
Count
1584.42 4.42 87%Preston Park 2013
1024.33 4.33 86%Preston Park 2014
4.43 28 4.43 82% 2015 Preston Park - YTD
8,2544.24 4.24 82%Alliance Residential Company - YTD
2015
--4.45 4.45 88%Kingsley Index 2015
KINGSLEY INDEX - SURVEY TYPES
--4.32 4.32 85%KI - Pre-renewal 2015
--4.47 4.47 88%KI - Service Request 2015
QUARTERS
284.43 4.43 82%Q1
SURVEY TYPES
15.00 5.00 100%Pre-renewal
274.41 4.41 81%Service Request
25
© Copyright 2015 Kingsley Associates. All Rights Reserved.
Alliance Residential Company2015 Q1 CORE ProgramCommunity YTD Report - Preston Park
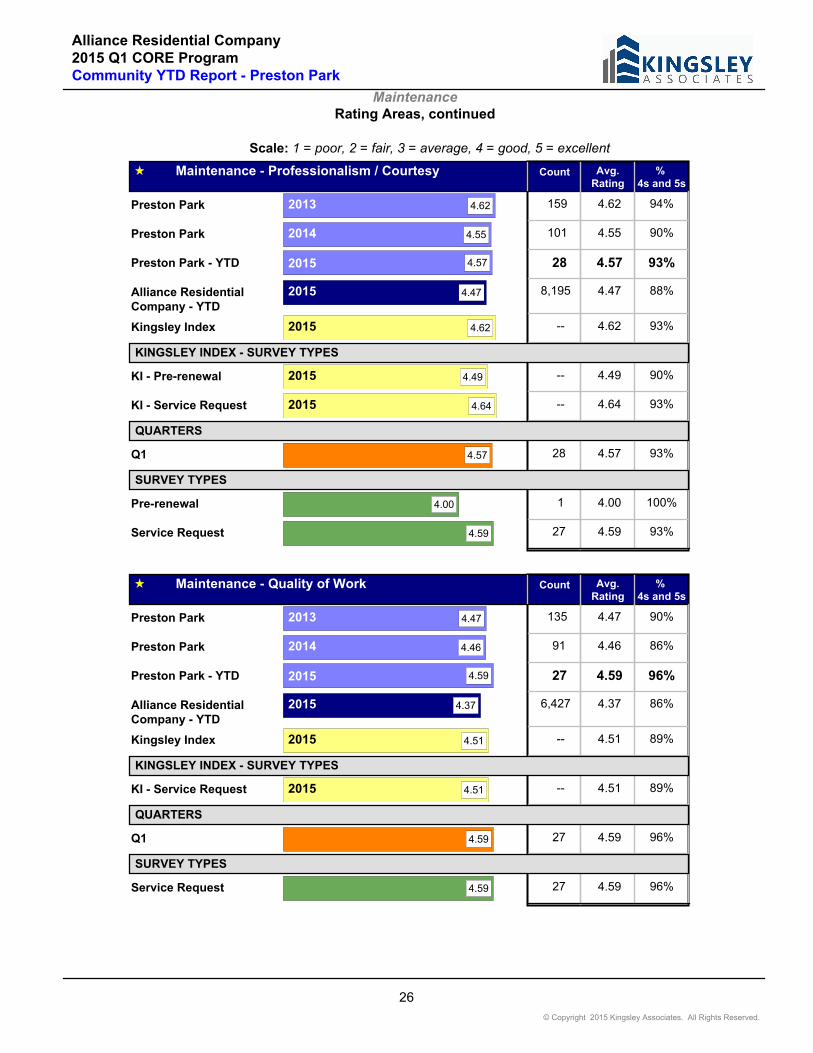
Scale: 1 = poor, 2 = fair, 3 = average, 4 = good, 5 = excellent
MaintenanceRating Areas, continued
Maintenance - Professionalism / Courtesy % 4s and 5s
Avg.Rating
Count
1594.62 4.62 94%Preston Park 2013
1014.55 4.55 90%Preston Park 2014
4.57 28 4.57 93% 2015 Preston Park - YTD
8,1954.47 4.47 88%Alliance Residential Company - YTD
2015
--4.62 4.62 93%Kingsley Index 2015
KINGSLEY INDEX - SURVEY TYPES
--4.49 4.49 90%KI - Pre-renewal 2015
--4.64 4.64 93%KI - Service Request 2015
QUARTERS
284.57 4.57 93%Q1
SURVEY TYPES
14.00 4.00 100%Pre-renewal
274.59 4.59 93%Service Request
Maintenance - Quality of Work % 4s and 5s
Avg.Rating
Count
1354.47 4.47 90%Preston Park 2013
914.46 4.46 86%Preston Park 2014
4.59 27 4.59 96% 2015 Preston Park - YTD
6,4274.37 4.37 86%Alliance Residential Company - YTD
2015
--4.51 4.51 89%Kingsley Index 2015
KINGSLEY INDEX - SURVEY TYPES
--4.51 4.51 89%KI - Service Request 2015
QUARTERS
274.59 4.59 96%Q1
SURVEY TYPES
274.59 4.59 96%Service Request
26
© Copyright 2015 Kingsley Associates. All Rights Reserved.
Alliance Residential Company2015 Q1 CORE ProgramCommunity YTD Report - Preston Park
Scale: 1 = poor, 2 = fair, 3 = average, 4 = good, 5 = excellent
MaintenanceRating Areas, continued
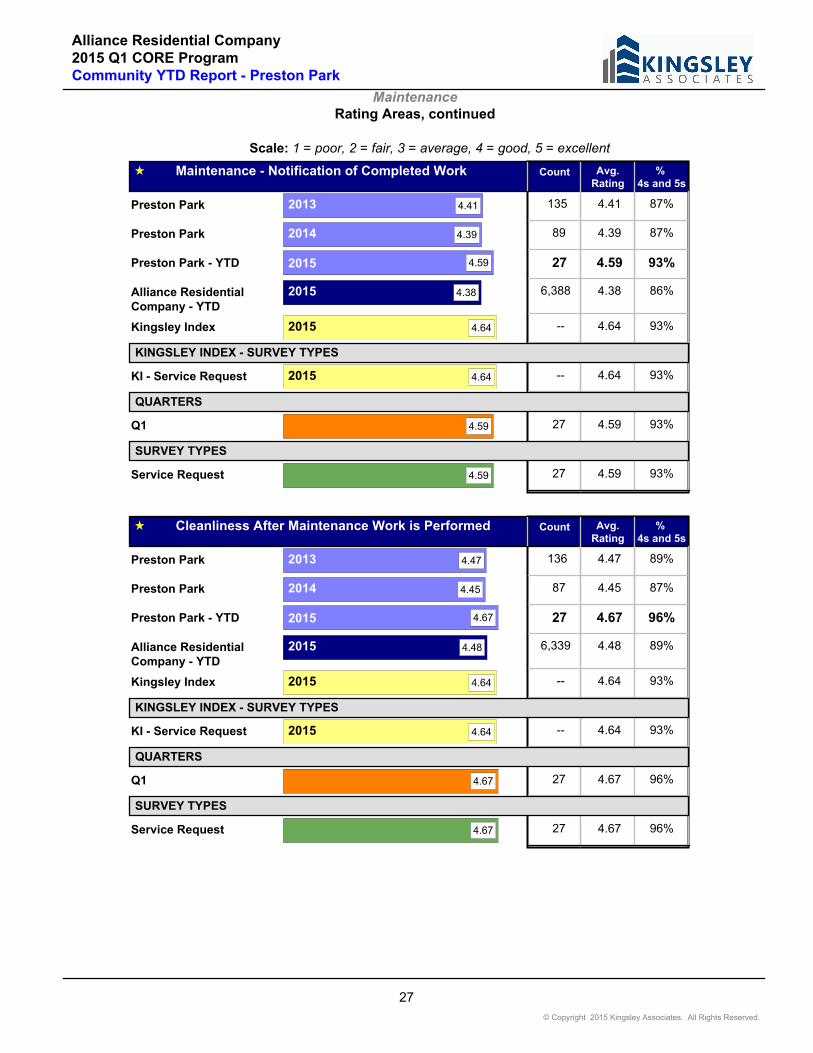
Maintenance - Notification of Completed Work % 4s and 5s
Avg.Rating
Count
1354.41 4.41 87%Preston Park 2013
894.39 4.39 87%Preston Park 2014
4.59 27 4.59 93% 2015 Preston Park - YTD
6,3884.38 4.38 86%Alliance Residential Company - YTD
2015
--4.64 4.64 93%Kingsley Index 2015
KINGSLEY INDEX - SURVEY TYPES
--4.64 4.64 93%KI - Service Request 2015
QUARTERS
274.59 4.59 93%Q1
SURVEY TYPES
274.59 4.59 93%Service Request
Cleanliness After Maintenance Work is Performed % 4s and 5s
Avg.Rating
Count
1364.47 4.47 89%Preston Park 2013
874.45 4.45 87%Preston Park 2014
4.67 27 4.67 96% 2015 Preston Park - YTD
6,3394.48 4.48 89%Alliance Residential Company - YTD
2015
--4.64 4.64 93%Kingsley Index 2015
KINGSLEY INDEX - SURVEY TYPES
--4.64 4.64 93%KI - Service Request 2015
QUARTERS
274.67 4.67 96%Q1
SURVEY TYPES
274.67 4.67 96%Service Request
27
© Copyright 2015 Kingsley Associates. All Rights Reserved.

Alliance Residential Company2015 Q1 CORE ProgramCommunity YTD Report - Preston Park
Maintenance
:Importance
How long does it generally take maintenance to respond to non-emergency calls?
: Maintenance Response Time
Question Text
Question
:
N/A
48+ hours
24-48 hours
2-24 hours
Within 2 hours
0%
10%
20%
30%
40%
50%
60%
70%
80%
90%
100%
2013 2014 Q1 2015 - YTD Portfolio -YTD
KI
17% 15% 15% 15% 17% 18%
43%
30%
56% 56%48%
52%
26%
33%
19% 19%23%
21%
14%
22%
11% 11% 13%9%
Perc
en
t o
f R
esp
on
ses
(%
)
Distribution of Responses: Maintenance Response Time
Distribution of Responses (%)
Maintenance Response TimeNumber of Responses
Within 2 hours
2-24 hours24-48 hours48+ hours
%%%% 17 43 26 14 129Preston Park 2013
%%%% 15 30 33 22 89Preston Park 2014
%%%% 15 56 19 11 27Q1
%% 15 56 19 11 27Preston Park 2015 - YTD % %
%%%% 17 48 23 13 6,351Alliance Residential Company 2015 - YTD
%%%% 18 52 21 9Kingsley Index - Multifamily
28
© Copyright 2015 Kingsley Associates. All Rights Reserved.
Alliance Residential Company2015 Q1 CORE ProgramCommunity YTD Report - Preston Park
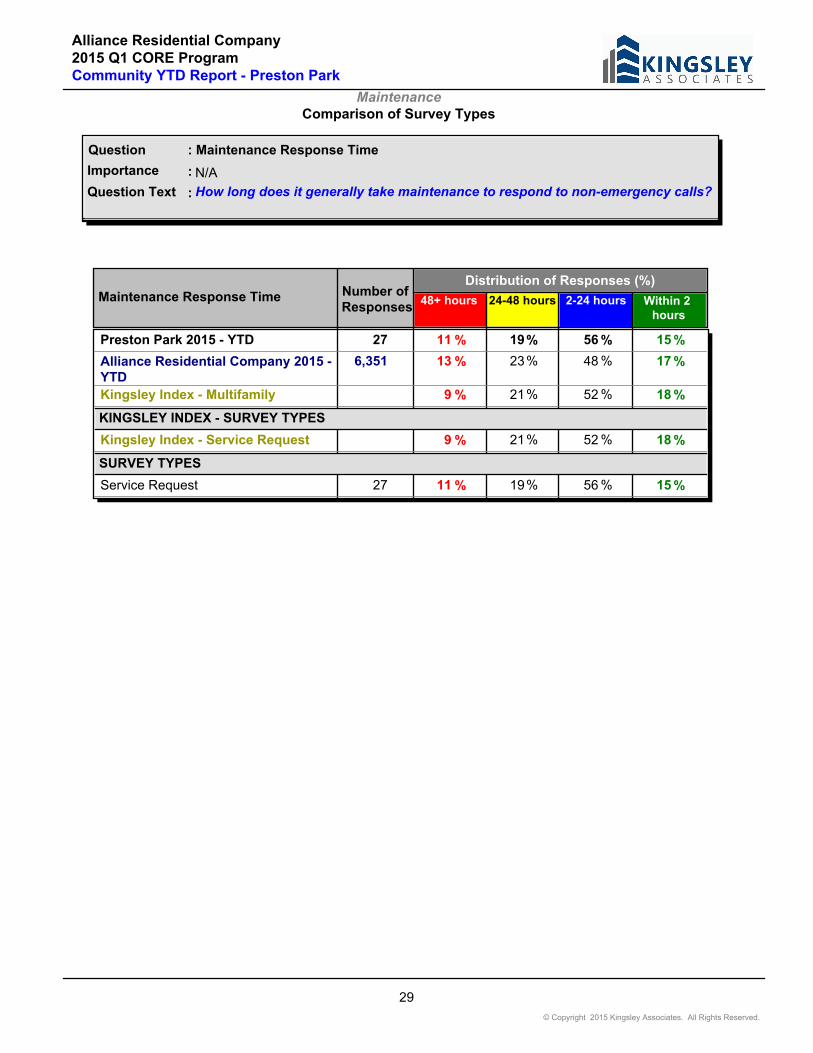
MaintenanceComparison of Survey Types
:Importance
How long does it generally take maintenance to respond to non-emergency calls?
: Maintenance Response Time
Question Text
Question
:
N/A
Distribution of Responses (%)Number of Responses
Within 2 hours
2-24 hours24-48 hours48+ hoursMaintenance Response Time
%% 15 56 19 11 27Preston Park 2015 - YTD % %
%%%% 17 48 23 13 6,351Alliance Residential Company 2015 - YTD
%%%% 18 52 21 9Kingsley Index - Multifamily
KINGSLEY INDEX - SURVEY TYPES
%%%% 18 52 21 9Kingsley Index - Service Request
SURVEY TYPES
%%%% 15 56 19 11 27Service Request
29
© Copyright 2015 Kingsley Associates. All Rights Reserved.

Alliance Residential Company2015 Q1 CORE ProgramCommunity YTD Report - Preston Park
Maintenance
Was the work completed to your satisfaction?
Maintenance - Work Completed to Your Satisfaction
Question Text
Question
:
:
Yes 88.9%No 11.1%
Total: 100.0%
Responses2015
Responses2015
Percent (%)
Distribution of Responses: Maintenance - Work Completed to Your Satisfaction
Kingsley Index
PortfolioPercent (%)
2014Percent (%)
%Yes 24 89 91 % 88 % 87 %
%No 3 11 9 % 12 % 13 %
Total Responses: 27 90 6,406
30
© Copyright 2015 Kingsley Associates. All Rights Reserved.

Alliance Residential Company2015 Q1 CORE ProgramCommunity YTD Report - Preston Park
MaintenanceComparison of Survey Types
:Importance
Was the work completed to your satisfaction?
: Maintenance - Work Completed to Your Satisfaction
Question Text
Question
:
N/A
Maintenance - Work Completed to Your Satisfaction
Dist. of Responses (%)Number of Responses YesNo
% % 89 11 27Preston Park 2015 - YTD
% % 87 13 6,406Alliance Residential Company 2015 - YTD
% % 91 9Kingsley Index - Multifamily
KINGSLEY INDEX - SURVEY TYPES
% % 91 9Kingsley Index - Service Request
SURVEY TYPES
% % 89 11 27Service Request
31
© Copyright 2015 Kingsley Associates. All Rights Reserved.

Alliance Residential Company2015 Q1 CORE ProgramCommunity YTD Report - Preston Park
The most successful firms in real estate rely on Kingsley Associates for cutting-edge business intelligence solutions. With a depth and breadth of insight unmatched in the industry, we bring thought leadership and passionate client service to every engagement. Let us partner with you to unlock the value in your organization and its relationships.
SAN FRANCISCO:44 Montgomery StreetSuite 1430San Francisco, CA 94104415.777.1140
ATLANTA:229 Peachtree Street NESuite 1100Atlanta, GA 30303770.908.1220 www.kingsleyassociates.com
KINGSLEY ASSOCIATESBusiness intelligence for the real estate industry
Research & Benchmarking
· Tenant and resident satisfaction programs
· Broker perception surveys
· Associate/employee engagement programs
· Client and investor surveys
· Compensation research
· Fund structuring and fee benchmarking
· Portfolio performance scorecards
Consulting
· Organizational structuring
· Succession planning
· Competitive positioning assessment
Unmatched real estate expertise
Actionable results
Unparalleled benchmarking via the Kingsley Index
Customized, full-service approach
SM
32
© Copyright 2015 Kingsley Associates. All Rights Reserved.