alliances in the oil field - schlumberger
TRANSCRIPT

26
uraging oilfield operators and contrac-
one of the ways oilfield companies are
st of their resources—and gaining on
■■Reduction in wellproductivity. Sincethe 1980s, thenumber of oil wellshas increased, butthe number of bar-rels of oil per day(BOPD) producedper well has fallen.(Adapted from Adamset al, reference 1.)
Alliances in the Oil Field
C. Brent AustinSteve DolePanCanadian PetroleumCalgary, Alberta, Canada
Walt ChmilowskiGregg VernonCalgary, Alberta, Canada
J. Harmon Heidt Amoco Exploration and ProductiDenver, Colorado, USA
Richard LewisJohn ThompsonMike VinsonHouston, Texas, USA
Ty WatsonDenver, Colorado, USA
For help in preparation of this article, Adams, Mobil Oil, Midland, Texas, USA; naz and Jean-Pierre Delhomme, Schlumb& Testing, Clamart, France; Andy Cart, Ation Company, Houston, Texas; Dave CFree, Jay Haskell, Ed Nordmeyer, Jerry Thompson and DJ White, Dowell, HoustDove, GeoQuest, Houston, Texas; Georgeell, Bakersfield, California, USA; Tony FoMcKenna, Wireline & Testing, Calgary, ARoger Goodan, Schlumberger Integratedagement, Houston, Texas; Gary Griffith, SStephen St. Amand, Marathon Oil CompLouisiana, USA; Joel Guttormsen, ConocCalgary, Alberta; Gary Horton, AnadLouisiana; Jeff Icenhower, Amoco ProducDenver, Colorado, USA; Bobbie Joines, DColorado; Joe Mach and Scott Scheid, Wing, Houston, Texas; Mike Mathews anDowell, Lafayette, Louisiana; and Brian Midland, Texas.In this article, BRACKETFRAC, Charisma, Dand Evaluation Services for Clients), DipFAFracNPV, GeoFrame, HyPerSTIM (High-PeStimulation), PCM (Precision Continuous MView and SPIN (Sticking Pipe Indicator) arSchlumberger. SUMIC is a mark of Statoil.
heedity, ofrs.onby
asutllsm
av-by
Striving to remain profitable, oil compa-nies are taking action in two areas to controlcosts. First, they are redefining their busi-ness, identifying core competencies andoutsourcing noncore activities. Second, theyare changing the way they do business,gradually converting the arm’s-length rela-tionship with contractors into more cooper-ative collaborations to eliminate redun-dancy and boost efficiency, exploiting newtechnologies to enhance productivity.2
Oilfield business relationships take manyforms. Volume discounts, turnkeys, servicebundling, integrated services, joint ventures,
Ave
rage
BO
PD
/wel
l8 89 90 91 92
16
15
14
13
12
Today’s business climate is enco
tors to join forces. Alliances are
cutting costs and making the mo
the competition.
on
thanks to RickHervé Anxion-erger Wirelinemoco Produc-hurch, Dustin
Richards, Johnon, Texas; Roy Dozier, Dow-ndyga and Pat
lberta, Canada; Project Man-
cott Mathis andany, Lafayette,
o Canada Ltd.,rill, Lafayette,tion Company,owell, Denver,ireline & Test-
d Bob Murray,
In the oil field, two factors drive profits. Tfirst, market price of oil or gas, is governby many elements, such as political stabileconomic growth and the weather, allwhich are outside the control of operatoHowever, the second factor, producticost, can be controlled to some degree the industry.
During the past decade, market price hstabilized—albeit at a moderate level—bproduction costs continue to increase. Wecost more to drill and bring on streabecause much of the easy oil is gone, leing behind oil that defies production
700
650
600
550
500
Pro
duci
ng w
ells
, in
thou
sand
s
81 82 83 84 85 86 87 8
Year
Wells
BOPD
Oilfield Review
Taylor, Dowell,
ESC (DesignN, FasTex,rmeability
ixer), Sedi-e marks of
conventional techniques and oil in deeper,more complex reservoirs in frontier areas.Total production costs remain high becauseproductivity per well has declined and thetechniques and materials required are gen-erally more expensive (above).1
partnerships, alliances—each has a place inthe continuum of business practices, eachwith different levels of cooperation and

Entry Focused Enhanced Strategic
All focused attributesplus mutual businessand profitability growthdue to enhancedcooperation
Supply chainmanagement
Synergistic R & D
Easy agreements onrights of development
Active steeringcommittee
Regular meetingreview
Long term, 3+year duration
Feedback atall levels
A continuity strategy
Partnershipmeasurementsystem to addresstotal quality and valueof partnership
All enhanced andfocused attributesplus:
Long-term viewof outcome
Significantimprovement inboth partners’perfomance
An agreement toachieve strategicobjectives throughinterdependence
Risk sharing inpursuit of objectives
Commitment ofsignificant resourcesby both parties
Integration ofmanagementplanning
Sharing of rewards
Optimum trust
Highly synergisticR & D
Established qualityexpectationsexceeded
Competitivetotal system cost
Effective qualitysystem
1- to 3-yearduration
Project-specificR & D
Supplyassurance
Qualitymanagement
Developmentcooperation
Businessresultsoptimization
Controlledaccess to bothparties’ processand informationsystems
grated services contract, the client assignsresponsibility to the supplier to reduce theclient’s costs. In an alliance, the supplieraccepts responsibility to reduce client cost,and the client takes on responsibility toensure the supplier’s profit, often by assuringfuture business to the supplier. The two sideswork together to reduce costs and improveprofitability for all involved. Trust and confi-dence in supplier commitment make bid-ding each service or per well a thing of thepast.
However, integrated services andalliances are not mutually exclusive. Anintegrated services project may be offered toan alliance partner, or may evolve into analliance. In fact, most alliances start out astests for a certain period of time, then if suc-cessful, may become self-renewing, some-times called evergreen. Not written as longcontracts, the terms of an alliance often fiton a single page.
Alliances themselves take many shapes.An alliance may be an agreement betweenan operator and a service company for asingle service, or it may embrace severalcompanies or several product lines within acompany to create what is called an inte-grated alliance.
Some alliances cover one geographic areaor business unit; others encompass world-wide activities. The alliance between Tex-aco and Dowell, for example, covers allpumping services for Texaco’s North Ameri-can operations (see “DESC in an Alliance:Texaco,” page 43). The alliance betweenOryx Energy Company and Schlumbergerspans wireline, testing and logging-while-drilling services worldwide.
Service companies can form a brand ofalliance among themselves—more a consor-tium, or partnership, following the defini-tions in this article—to offer complementaryservices when the market is for integratedservices. Oil companies forge similar part-nerships to develop their assets.4
“Strategic alliance” often describesalliances that are part of the partner compa-nies’ strategies, and implies that the compa-nies share their strategies openly. Few oil-field alliances so far have reached such alevel of cooperation and openness, but thatis the goal to which many aspire (left).
27Summer 1995
2. de Wardt JP: “Strategic Alliances: Where are WeHeaded?” World Oil 216 (February 1995): 103-107.
3. “Pressed into Service,” Journal of Petroleum Technology 46 (March 1994): 198-200, 223.King GE: “Improving Quality Control in Alliances andPartnering,” Journal of Petroleum Technology 46(March 1994): 192.
nFour stages in the evolution ofalliances. As an alliance evolves,the partner companies share morestrategies, risks and rewards.
4. Nicandros CS: “North Sea Trends Typify Industry’sWorldwide Adjustment to Change,” Oil & Gas Journal 91 (November 8, 1993): 47-53.Hamel G and Doz YL: “Collaborate with Your Competitors—and Win,” Harvard Business Review (January-February 1989): 133.
trust. Volume discounts and turnkeys arevariations on the traditional way of doingbusiness. Jobs are bid, whether by well orby project, and job specifications are set bythe operator. The service company reacts,then executes the job on demand.
In a second category, service bundlingand integrated services are new ways ofdoing business that are gaining acceptance,especially outside North America. Servicebundling gathers several services under onecontract and concentrates the points of con-tact between the operator and contractors.Here, the operator still provides all thespecs, and the service supplier executes thejob. Integrated services contracts span awide range of activities, from service execu-tion—performing bundled services—at themost basic end, to product delivery at themost sophisticated end (see “Integrated Ser-vices,” page 11). Product delivery, in whichthe product may be an offshore platform, awell or some other complicated project,
entails conceptual design, process planning,service execution and evaluation.
Joint ventures tend to denote sharedequity and sometimes result in acquisitionof one party by the other.
The third category, and perhaps thenewest in the oil industry—certainly thehardest to define—includes partnershipsand alliances. Partnerships are defined bythe Journal of Petroleum Technology as“short-term, project-specific relationshipsbetween supplier and client that seek togain greater economic value for both par-ties.”3 Alliances are similar to partnerships,except they are designed to persist beyondthe scope of individual projects. Other defi-nitions exist, but an alliance is defined hereas a long-term relationship between twocompanies that furthers their common inter-ests over a specific range of activities.
Although both are new business practicesin the oil industry, alliances differ from inte-grated services contracts. Under an inte-
1. Adams R, Englehardt S and Free D: “Forming a Cus-tomer-Supplier Alliance in an Exploration and Produc-ing Environment,” presented at IMPRO94, The JuranInstitute’s Conference on Managing for Total Quality,Buena Vista, Florida, USA, November 6-8, 1994.
Frac treatment
Drilling new
wells
Com
pletion rig operations
Lifting costsAbandonm
ent costs
Well pulling costs
Casing integrity test
Pipeline replacement
Developm
ent wells election process
Moving pum
p jackC
hemical costs
Reviewing and correlating logs
New
well program
ming process
Remedial w
ell selection
Remedial w
ell programm
ing process
Frac tank cleaning and fluid disposal
Gauge setting repair
3 week schedule
Frac site prep and equipment spotting
Location cleaningFinal reportsPostfrac analysisPlant solids control
Invoice processingTank cleaningVessel cleaning
0
50
100
150
200
Thou
sand
s of
dol
lars
Through the alliance, now a frac job isdesigned jointly, and then modeled by theservice company engineer, freeing the oilcompany engineer to spend time on otherprojects that add more value—in some casesselection of other wells to be stimulated,called candidate recognition. In other cases,the optimal division of labor may assign can-didate recognition and job design to the ser-vice company engineer, leaving the oil com-pany engineer free to develop future growthopportunities. In a growing number ofalliances, the oil company no longerrequires a representative on site for the job.The streamlined process is more efficient,but trust in the alliance partner is crucial tothe success of such a scheme (page 30).
Eliminating bidding is another example ofincreasing efficiency by slashing processesthat add no value. Through process map-ping, some oil companies have found thatalmost as much money is spent on the bid-ding process as on the job itself. An advan-tage of the alliance between ConocoCanada Ltd. and Schlumberger Wireline &Testing has been the time and money savedby not bidding. Conoco Canada Ltd. previ-ously required at least three bids for everywell. Specifying the logging program took ahalf day; getting the bids back took another
While this manner of association is rela-tively new to the oil business, it has beenpracticed by other industries, notably inmanufacturing, for up to 15 years. Kodak,Apple Computer, Siemens, Ford MotorCompany, Motorola, Toshiba andInternational Business Machines are just afew of the companies with experience ingaining efficiency through alliances.Alliance analysts have a rich selection ofongoing and past alliances from which todraw analogies, along with success and fail-ure factors (see “The Alliance as a Relation-ship,” page 34).
28 Oilfield Review
Efficiency Improvements Through AlliancesThe cooperative spirit of an alliance changesthe way problems are approached. In thequest to cut costs, it means not dwelling oncontractor profit, but cutting total projectcost (next page, top). To uncover where cutscan be made, every process in the entireproject must be analyzed and examined forinefficiencies. Alliance partners construct adescription, called a process map, for eachprocess. A process map may be a list ofsteps or a flow chart (next page, bottomleft and right). The total project is analyzedand individual processes are retained onlyif they add value. Improvements are madeto the remaining processes, or entirely newprocesses are developed, and the new pro-cesses are remapped, giving continuousimprovement.5 Decisions on how toimprove a process come from the alliancepartners, and team members have thepower make the necessary changes.
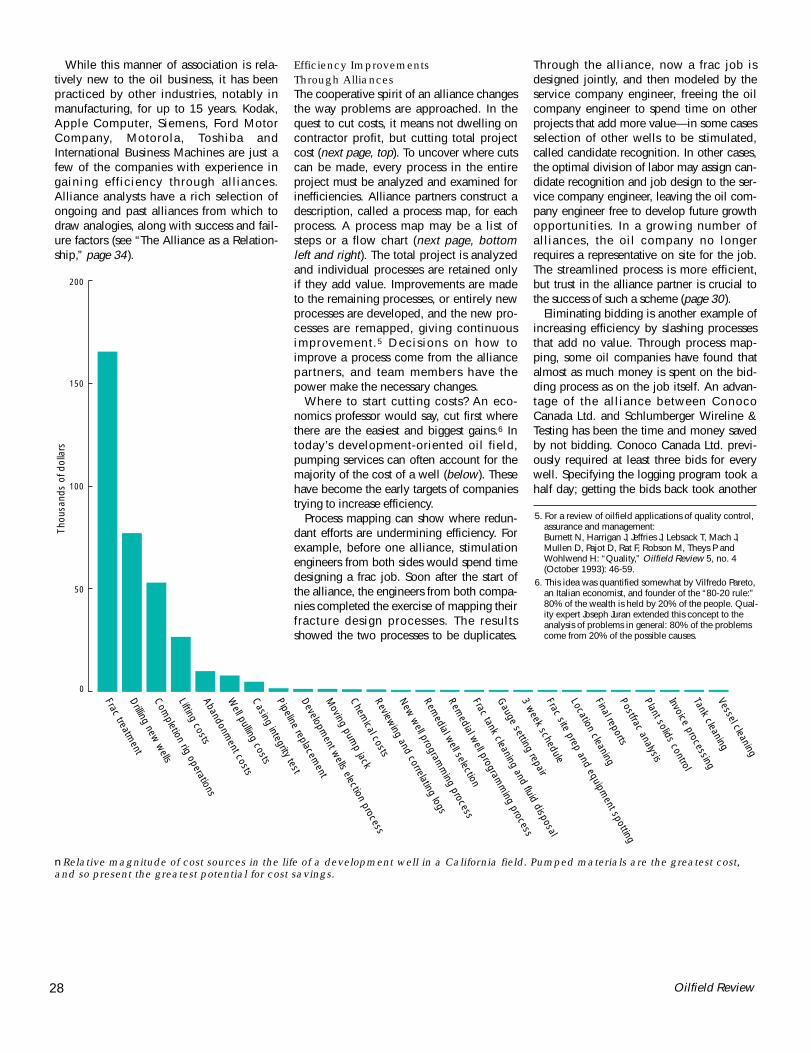
Where to start cutting costs? An eco-nomics professor would say, cut first wherethere are the easiest and biggest gains.6 Intoday’s development-oriented oil field,pumping services can often account for themajority of the cost of a well (below). Thesehave become the early targets of companiestrying to increase efficiency.
Process mapping can show where redun-dant efforts are undermining efficiency. Forexample, before one alliance, stimulationengineers from both sides would spend timedesigning a frac job. Soon after the start ofthe alliance, the engineers from both compa-nies completed the exercise of mapping theirfracture design processes. The resultsshowed the two processes to be duplicates.
5. For a review of oilfield applications of quality control,assurance and management: Burnett N, Harrigan J, Jeffries J, Lebsack T, Mach J,Mullen D, Pajot D, Rat F, Robson M, Theys P andWohlwend H: “Quality,” Oilfield Review 5, no. 4(October 1993): 46-59.
6. This idea was quantified somewhat by Vilfredo Pareto,an Italian economist, and founder of the “80-20 rule:”80% of the wealth is held by 20% of the people. Qual-ity expert Joseph Juran extended this concept to theanalysis of problems in general: 80% of the problemscome from 20% of the possible causes.
nRelative magnitude of cost sources in the life of a development well in a California field. Pumped materials are the greatest cost,and so present the greatest potential for cost savings.

29Summer 1995
nTwo fracture-design process maps streamlined to create one,more efficient process. Through continuous improvement, theoperator (pink) and service company (light blue) processesbecome a new single process (purple). Further improvementsyield a process with optimum efficiency (dark blue).
nAnalyzing a well stimulation process map. More than 6 ft [2 m]long, this typical process map comprises more than 100 steps.
nNew focus on cost-effectiveness forproduct-based andservice-based sys-tems. The traditionalapproach reducescosts by cutting sup-plier profit. Alliancesachieve increasedefficiency by cuttingtotal system costs.
Customer design, specification,procurement supervision,QA/QC and payables
Supplier profit(traditional approach focuses here)
Supplier labor(including overheads)
Supplier equipment(including depreciation and recapitalization)
Supplier materials
Cycle time, productivity,logistics, research, engineering,market swings, utilizationand missed opportunities
15
5
20
30
45
Invo
iced
cos
t =
115
%
Pric
e =
100
%
Tota
l sys
tem
cos
t
15
5
20
30
45
Percent Percent
Service-basedsystem
Product-basedsystem
New
tot
al s
yste
m c
ost
Alliances
Process A(operator)
Process A(service company)
Improved process A(operator + service company)
Further improved process A(operator + service company)

Offshore Integrated AllianceAn example of an integrated alliancedesigned to increase drilling and comple-tion efficiency is the multiservice, single-project alliance between Marathon OilCompany and the Schlumberger companiesof Anadrill, Dowell and Wireline & Testing.Diamond Offshore Drilling was the drillingcontractor, and mud was provided by M-IDrilling Fluids Company.
The challenge was to drill and completenine directional offshore wells in the Ver-milion Block 331 field of the Gulf of Mex-ico. Marathon fielded an interdisciplinaryteam that interfaced with the contractorteam, and all decisions were approved bythe new collaboration.
half day. The bids then had to be opened inthe presence of a witness. Comparing bidswas a job in itself, and since there was nouniform format, this could take another dayor two. After selecting a contractor, Conocomet with an accountant, then called thecontractor to announce the award. “In theweek I save by not bidding, I can identifynew prospects,” remarks Joel Guttormsen, ageologist with Conoco in Calgary, Alberta,Canada. “That’s adding value.”
An idealistic example of process stream-lining through trust is the story of tubu-lars—drillpipe, casing and tubing. Mappingthe many processes from steel manufactur-ing and tubular construction throughdeployment and finally recycling shows that
tubulars are picked up, put down, invento-ried and inspected anywhere from three toeight times each (next page). Cutting outredundant steps and checks yields the seam-less circle of the ideally efficient process.Most of the process lies outside the realm ofthe operating company alone, but throughsupply chain management—alliances withother links in the supply chain—total pro-cess efficiency can be optimized.
Some alliances initially formed to addressdrilling and pumping costs later expand toenfold other services. Examples from threeNorth American oil companies show howsuch alliances are increasing productivityand cutting costs.
Preperforating
Amoco/Dowell engineersselect perfs.
Perforating Fracturing Tree-up
Forward to localDowell coordinator.
Copy to Amoco
Amoco installs frac valve;coordinates w/Dowell
to test casing.
Copy to SchlumbergerWireline & Testing;
prepare for job.
Dowell notifies Amocoof total depth (TD)
and Amoco OKs TDor cleanout.
Dowell coordinates forpit/frac tank/lines
and coiled tubing unit.
Dowell coordinateswith water supplier.
Run wash tool;wash to plugged-back
TD and test casing.
Schlumberger coordinateslogging and perforation;notifies Amoco of date.
Run gauge ring w/gammaray/casing collar locator.
TD not OK TD OK
Log and perforate
Well ready to perforate Well ready to fracture
Dowell engineerdesigns frac.
Forward to localDowell coordinator.
Copy to Amoco
Dowell and Palestine meeton location for equipment
layout and select fracdate; Dowell notifiesAmoco of frac date.
Palestine coordinatesinstalling frac stack,pit/lines separator
and watchmen.
Frac well;shut in for 36 to 48 hours.
Palestine coordinateshauling flowback fluid.
Well cleaned up and readyto run production tubing
Amoco coordinatesw/Schlumberger toset wireline packer.
Amoco coordinatesw/packer company.
Run gauge ring andjunk basket;set packer.
Amoco coordinatesfor rig.
Rig pusher coordinatesfor tools, water/packerfluid, tubing and tree.
Run tubing andland tree.
Rig pusher coordinatesrig-down and pick-
up tools.
Turn over to production;ready for sales.
nStreamlined process map from Amoco Southeast Business Unit alliance with Dowell.
30 Oilfield Review

Mill
PipeProcessor
Distributor
InspectionCompany
Operator
Scrap Make steel Manufacturepipe
Inspect Nondestructivetest
Inventory Handle & load Ship to pipeprocessor
Handle & load Inspect Inventory Processgrades, threads
Nondestructivetest
Inventory Handle & load Ship todistributor
Handle & load Inspect Inventory Handle & load Ship to inspectioncompany
Handle & load
Handle & load
Inspect Inventory
Inventory
Handle & load
Handle & load
Ship tooperator
Nondestructivetest
Ship towell
Utilize Scrap
Typical Tubular Supply Chain
Allied Tubular Supply Chain
Utilize
Scrap
Make steel
Manufacturepipe
Handle & load
Ship to pipeprocessor
Processgrades, threads
Handle & load
Ship towell
nProcess mapsdescribing the usecycle of tubulars.Traditional processesallow tubulars to behandled, inventoriedand inspected anumber of times(top). Alliancesbetween links in thechain permit elimi-nation of redundantsteps, yielding theideally efficient pro-cess (bottom).(Adapted from AmocoASAP 2000 program,with permission.)
31Summer 1995

Benchmarks were set in three areas: bet-ter-than-market financial compensation wasoffered if drilling time, health, safety andenvironment compliance, and well perfor-mance exceeded expectations. The jointteam worked to anticipate time-consumingsteps and solve problems rapidly. Drillingtime was minimized with topdrive to speedtripping and connections, and with the helpof the SPIN Sticking Pipe Indicator program,which requires downhole weight-on-bit anddownhole torque as inputs. Before the
alliance, Marathon normally wouldn’tacquire these measurements while drillingbecause of the high cost, but Anadrill drillingengineers pushed for them, certain the mea-surements would make drilling safer, wouldcreate a more stable hole and ultimatelysave money. Compared with other recentsimilar drilling projects conducted via “busi-ness as usual,“ or outside the alliance, theVermilion 331 team increased the averagedrilling rate by 56% and decreased drillingcosts by 14% (below).
The completion phase also benefited fromthe team organization and the risk-rewardfinancial structure. By focusing attention onboth productivity enhancement and processcost reduction for the 15 zones completed,the team was able to reduce average rigtime by 1.8 days and shave nonrig comple-tion costs by 10%.
These savings were achieved while imple-menting the relatively new HyPerSTIM frac-turing and sand control technique. TheHyPerSTIM technology, combined withMarathon’s emphasis on sound completionpractices and the team’s attention to detail,resulted in flow capabilities that averaged atleast 30% more than in the prealliancecompletions (next page, top left).7
While the overall project met or exceededexpectations, it took time and effort to stepout of the comfort of long-standing roles,responsibilities and communication lines. Afinancial structure that gave all parties avested interest in achieving project goalsand an environment that promoted opencommunication and risk taking was key tothe success of the project.
PanCanadian Stimulation AllianceUnlike the integrated alliance that drilledMarathon’s Vermilion wells, most oilfieldalliances begin with a single service. Anexample is the alliance between PanCana-dian Petroleum and Dowell, the goals ofwhich are to assure high-quality stimulationand to control treatment costs. In 1992, topmanagement at PanCanadian urged busi-ness managers to search worldwide formore efficient production methods. Out ofthat came the motivation to forge alliancesto optimize production and speed payout(next page, bottom). The alliance withDowell emphasizes finding the best tech-nology for the problems encountered inPanCanadian’s variety of assets, which spana multitude of environments in Canada,including shallow gas wells, deep foothillexploration wells and wells producingheavy oil.
A Dowell engineer—called a DESC engi-neer, for Design and Evaluation Services forClients (see “The DESC Engineer Redefines
32 Oilfield Review
7. Mullen ME, Norman PE and Granger JC: “ProductivityComparison of Sand Control Techniques Used forCompletions in the Vermilion 331 Field,” paper SPE27361, presented at the SPE International Symposiumon Formation Damage Control, Lafayette, Louisiana,USA, February 7-10, 1994.
8. For information on crosslinkers, breakers and otherfluid additives: Brown E, Elphick J, Gulbis J, Hawkins G, King M andPulsinelli R: “Taking the Brakes off Proppant-Pack Conductivity,” Oilfield Review 3, no. 1 (January 1991):18-26. Also, see an article on advanced fracturing flu-ids in the Autumn 1995 issue of Oilfield Review.
6030
7840
Production
Bbl
of o
il eq
uiva
lent
/day
0
1000
2000
3000
4000
5000
6000
7000
8000
Drilling
Completion
Ft/day
0
100
200
300
400
500
600
700
800
900
1000
Ft
Cost/ft
Dol
lars
0
10
20
30
40
50
60
70
80
90
100
Day
s
Days/gravel pack
0
1
2
3
4
5
6
7
Dol
lars
Cost/gravel pack
0
100
200
300
400
500
592
921 92
79
473
425
6.6
4.8
Business as usual
Vermilion 331
nResults of Vermil-ion 331 integratedalliance betweenMarathon Oil Com-pany, M-I DrillingFluids, Schlum-berger Wireline &Testing, Anadrill,Dowell and Dia-mond OffshoreDrilling.

Work,” page 40)—was posted to the Pan-Canadian office to interact with field devel-opment teams and provide a link withDowell research capabilities. Continuousimprovement teams were formed to ana-lyze the entire stimulation process. Prior tothe alliance, PanCanadian had consideredthe shallow gas wells deserving of onlylow-technology fracture treatments. Stimu-lation engineers were pumping batches ofpremixed frac fluid. Premixed fluid is lessexpensive, but the quantity required is diffi-
cult to predict, and engineers tend to err onthe side of surplus. A more efficient processwas developed by switching to a moreexpensive PCM Precision Continuous Mixersystem, giving higher quality fluid, and nowaste.
Alliance engineers also examined the typeof crosslinkers in the frac fluid. Previously,they had used titanate crosslinkers withcovalent bonds. Then they tried borate, withionic bonds, which are more flexible, so notaffected by shearing during passage throughperforations. Finally, they switched to anencapsulated breaker to improve the break-ing of the link created by the crosslinkers tostart fluid flowing out of the fracture.8 Thecombination of new technologies yieldedimproved fracture conductivity (right).
In the deeper oil and gas wells, thealliance team tested a new energy-assisted,or foam, fracture technique that gave higherproductivity. “We did switch to more expen-sive products, but they have decreased ourtotal cost and increased our productivity.The results of the alliance surprised us,” saysSteve Dole, coordinator for completionsengineering at PanCanadian in Calgary,Alberta, Canada. “We thought we’d bot-tomed out on the cost per job by 1993. Butwe’ve learned we can keep cutting.”
After two years, the alliance completed1500 high-tech frac jobs, 700 cement jobsand 140 conventional fractures all with rea-sonable cost, excellent quality and no lost-time accidents—a perfect safety record. Jobsare now scheduled to avoid delays duringperiods of peak activity and to make better
use of Dowell’s resources. This improvedresource utilization has resulted in reducedcosts for Dowell, thus benefiting both com-panies. The alliance is expanding to includecoiled tubing services and cementing, andto plan longer-term actions. Through thealliance, PanCanadian is now influencingDowell’s research in areas of special need,such as fracturing techniques for shallow gaswells and hydrocarbon frac fluid breakers.
Alongside the stimulation alliance is aparallel alliance to add value to open- and
33Summer 1995
kh-n
orm
aliz
ed p
rodu
ctiv
ity in
dex
Oil Well Performance Analysis
0
2
3
4
1
Sand 1 Sand 2 Sand 3 Sand 4
Alliance withoutHyPerSTIMAlliance withHyPerSTIM
Prealliance
TitanateBorate
Encapsulatedbreakers
Futurebenchmark
0
2
4
6
8
10
12
Nor
mal
ized
abs
olut
e op
en fl
ow p
oten
tial
Stimulation Improvements
Neg
ativ
eP
ositi
ve
Cas
h flo
w
Land Drilling Completion Production
Optimized
Early payout Late payout
Traditional
Delayed payout
nImproved well performance inwells stimulated with HyPerSTIMfracture treatment.
nContinuous improvement in flow ratesby changing stimulation fluid. Normal-ized absolute openhole flow rate hasincreased steadily as stimulation engi-neers optimize crosslinker and breakertechnology.
nPayout curves showing traditional and optimized drilling and production.
cased-hole logging and drillstem testing, ini-tiated in 1993. PanCanadian has increasedits drilling activity from 413 wells in 1992 toa budgeted 1250 in 1995, without increas-ing staff. To handle the increase in loggingactivity, two additional Schlumberger per-sonnel have been dedicated to the PanCana-dian office; an applications developmentengineer helps design logging programs,and an evaluation services technical repre-sentative coordinates all logging and testing.
In an atypical exchange of expertise, athird Schlumberger engineer has been sec-onded to the PanCanadian petrophysics

onded to the PanCanadian petrophysicsgroup for a two-year stay. Tony Fondyga,with 15 years of wireline and testing experi-ence, works with the geology and reservoirgroups to make decisions on the fate of wells—whether to case or abandon. Workingwithin the PanCanadian group, Tony sees thebusiness through the eyes of the operatorand deals directly with service suppliers,including competing wireline companies.
During the first two years of the alliance,logging time and costs per meter havedropped relative to PanCanadian’s preal-liance average. Process improvements havestreamlined log data delivery by eliminatinglog films and delivering digital log datadirectly to an outsourced data library. Team-work with the Dowell DESC engineer toanalyze cased-hole logs for fracture designhas led to improvements in the quality ofshallow gas well treatments. Plans call for aSchlumberger interpretation specialist tomove into the PanCanadian office to workon special projects and help the drilling anddevelopment groups get better value fromtheir data.
Multiple Amoco AlliancesWhat makes an alliance successful? Fromthose who’ve done it, one of the firstanswers is top-down commitment. Thealliance must have champions at the high-est level. An example is the case of AmocoProduction Company. Early in 1992,Amoco launched the Vendor Asset Materi-als Management (VAMM) team as part of acompany-wide business process reengi-neering effort. The VAMM team, led by USOperating Group Vice-President JerryBrown, made a presentation to the sevenNorth American business unit managers,urging alliances as a tool for loweringinvestment costs and reducing controllable
operational expenditures. The Amoco Sup-plier Alliance Program, ASAP 2000, was setin motion throughout the company to bringa systems approach to managing supplierrelationships (above).
The business unit managers were encour-aged to create supplier alliances with theservice companies of their choice. Fivealliances have been built with Schlumbergercompanies, and three with HalliburtonEnergy Services. Each alliance is different,but share some common features. “We havea healthy concern for the profitability of ouralliance partners,” says Harmon Heidt,Alliance Coordinator with Amoco in Den-
ver, Colorado, USA. “Our focus is on elimi-nating costs deemed to be unnecessary—inall our operations, Amoco’s and our suppli-ers.” The following examples from threeAmoco business units demonstrate some ofthe progress to date in increasing efficiency.
Early in 1992, John Morris, the operationsmanager of the Southeast Business Unit(SBU)—covering land operations inLouisiana, east Texas, south Texas, Arkansas,Mississippi, Alabama and Michigan—metwith major service suppliers to discussalliances. He anticipated a significantreduction in operating costs associated withreducing the number of suppliers. At
34
Strategizing
Planning
Research
Designing
Scheduling
Evaluation
Reengineering
Profiting
Operationsquality
Continuousimprovementprocess
Not done
Reactionary
On demand
As ordered
Microinternal
Not done
Potential fortesting
Supplierreacting
Both areseparate
Spending vs.revenue
Joint testing
Supplier responding
Enhanced forincentives
Joint effortspecific to incentives
Centered aroundincentives
Planned spending-actual costs
Local marketposition and price
Budgeted spendingand revenue
Supplier and operatorcommunicating
Changing tasks oflocal process owners
Developing strategicissue jointly
Optimizing valueand reducing cost
Jointly developing
Supplier responsible
Supplier is scheduler
Most effectiveand efficient
Focused at totalsystem impact
Feedback inevery process
Upstream suppliersinvolved
Enhanced revenuesand total system cost
Process Bidding Single Sourced Allied Supply Chain
■■Supply chain evolution.
The Alliance as a Relationship
In French, alliance means marriage. And many
alliances seem to resemble marriages more than
they do other business relationships. After studying
37 alliances in different industries, Professor Rosa-
beth Moss Kanter of the Harvard Business School,
Cambridge, Massachusetts, USA, has found that
relationships between companies grow or fail much
like relationships between people.1 She describes
the four phases of an alliance as courtship, engage-
ment, marriage and old marrieds.
sometimes coming as a surprise to those who
founded the alliance—and the partners must work
out problems and develop techniques for getting
along. Trust is crucial and individual sacrifices are
made for the good of the relationship.
As partners enter the “old marrieds” phase, they
can reflect back and recognize changes, changes
not anticipated at the start of the relationship. Col-
laborating becomes more effortless and routine.
Kanter also outlines the eight essentials “I”s in
an alliance that make for a strong “we”:
During courtship each side checks out the other,
and compares with others, looking for the most
attractive, compatible partner. Compatibility is
based on common values, principles, experi-
ences, resources and hopes for the future.
After the engagement, plans are drawn and the
wedding closes the deal. The agreement is given a
name and made public. Executives from both sides
are invited to “meet the family.”
The marriage phase begins as the partners set
up housekeeping together and grow as a family.
During this phase, differences are discovered—

midyear, a project was designed to test theabilities of the service companies to providecost-effective stimulation solutions. By thebeginning of 1993, the SBU had aligned allpumping and wireline business with theSchlumberger companies.
The alliance operates with a steering com-mittee comprising the Amoco operationsmanager, representatives from Dowell andWireline & Testing and the alliance coordi-nators. The role of the steering committee isto set objectives and communicate resultsbetween upper management and the work-ing committee.
Most alliances have two coordinators—one from the Amoco business unit and onefrom the Schlumberger companies. Thecoordinators are the facilitators for thealliance, and also responsible for schedul-ing, quality assessment, a newsletter forcommunicating results, interventions tosolve specific technical problems andalliance scorecards—tools for measuring thesuccess of the alliance.
The SBU alliance is organized into fouralliance field teams, each composed ofAmoco, Dowell, Wireline & Testing andGeoQuest people in the office and the field.The teams select and evaluate wells, andidentify and modify processes for their localoperations from recompletion and fracturingto plug and abandon.
Initially, there was redundancy in fractureand recompletion evaluation and design,with both sides performing the same tasks. Astreamlined approach was approved by eachside, and is now used in the alliance. Flexi-bility in job scheduling has resulted in betterutilization of equipment and personnel.
Comparison of well completion and frac-turing costs tracked before and after forma-tion of the alliance shows that the coopera-tive approach has reduced costs by 20%.Accompanying the reduction in costs is animprovement in well performance relativeto benchmark wells (left).
35
Individual Excellence: Each company is strong
and has something of value to contribute. Motives
for pursuing the relationship are positive—to pur-
sue future opportunities, not mask weaknesses.
Importance: The alliance fits with major strate-
gic objectives.
Interdependence: The partners need each other,
have complementary skills and couldn’t achieve
the same results alone.
Investment: Each side shows tangible signs of
long-term commitment by devoting financial or
other resources to the relationship.
Information: Partners share data required to
make the alliance work. These include objectives,
technical data, and knowledge of conflict, trouble
spots or changes.
Integration: Partners develop linkages and
shared ways of working together. They build broad
connections between many people at different lev-
els in the organization. They become both teach-
ers and students.
Institutionalization: The alliance is given a for-
mal status, and extends beyond the people who
formed it.
■■Amoco SoutheastBusiness Unit wellcompletion andfracturing costsand performancebefore and afterthe alliance withSchlumberger.
Integrity: The partners behave honorably in
ways that justify and enhance mutual trust. They
do not abuse information, nor do they undermine
each other.
Avg. benchmark
100
150
200
250
300
350
400
Thou
sand
s of
dol
lars
Wireline & Pumping Cost Analysis
Fracturing Cost Analysis
100
150
200
250
300
Thou
sand
s of
dol
lars
Well Performance100
80
60
40
20
0
1991 1992 1993May July Sept Nov Jan Mar May July Sept Nov Jan
1991 1992 1993May July Sept Nov Jan Mar May July Sept Nov Jan
Abs
olut
e op
en fl
ow/n
et fe
et o
fpe
rfora
tion,
Mcf
d/ft
1991 1992 1993May July Sept Nov Jan Mar May July Sept Nov Jan
Avg. benchmarkAvg. alliance
Avg. benchmarkAvg. alliance
Avg. alliance
1. Kanter RM: “Collaborative Advantage: The Art of Alliances,”Harvard Business Review (July-August 1994): 96-108.Daunis JR and Scott FL: “Division of Technology Owner-ship Between a Service Company and Customer,” paperSPE 25843, presented at the SPE Hydrocarbon Economicsand Evaluation Symposium, Dallas, Texas, USA, March 29-30, 1993.

operating in West Texas, officially began apumping alliance with Dowell in 1992 cov-ering cementing, acidizing and fracturing.“Substantial savings have been realized andpumping service quality has improved con-stantly,” reports alliance coordinator FredRay of Amoco, in a recent alliance newslet-ter. “We attribute the savings and improve-ments to our commodity planning and pro-cess reengineering.” Since the alliancebegan, the PBBU has documented a costsavings of $1.3 million.
Among the greatest challenges in anyalliance effort are documenting and quanti-fying improvement, probably more difficultin a service industry than in manufacturing.One of the most powerful tools for record-ing progress is the scorecard, and the PBBUalliance team takes scorecards seriously—tothe point of creating a team to evaluatescorecards. Scorecards have been devised totrack all activities to understand problems,identify bottlenecks and recognize improve-ment. Examples are scoring workovercementing jobs in categories such as cost ofjob, cement left in pipe, job pumped ontime and remedial cement required. Oftenthe best scorecards are the ones that lookbad, because problems can be tackled onlyif they are discovered. And some of themost successful scorecards are those thatare no longer used—either they have helpedidentify other factors that should be tracked,or the problems they’ve exposed have beenaddressed.
The PBBU alliance operates through inter-vention teams to drive improvements to gainefficiency. “Joint intervention teams arehighly focused to resolve issues in a timelymanner,” says Amoco Resource ManagerTed Rolfvondenbaumen. “In other words,we involve the right people at the righttime.” For example, in the past year, thefracture appraisal intervention team hasreduced lost time per job from 50 to 32minutes; replaced bagged sand with con-veyed sand; switched to PCM fluid delivery;scheduled multiple fracture jobs in one day;reduced spillage to almost nothing; andbrought wells on production within an aver-age of 4.5 days, compared to 51 days in1993. These process improvements haveresulted in 17.6% cost savings for Amoco,and 5.3% savings for Dowell.
A third alliance has developed with
Amoco’s Northwest Business Unit (NWBU).The NWBU comprises six basins straddlingthe Rocky Mountains in Colorado andWyoming. In 1993, the NWBU’s GreaterGreen River basin group formed an inte-grated alliance to maximize value from theremaining exploitation opportunities in a20-year-old field. The alliance united theefforts of Amoco, Dowell, Wireline & Test-ing, Exeter Drilling, Apex Mud and CooperWellheads. Since then the agreement hasbeen extended to include three other fields.The major objectives were to reduce totalsystem costs for drilling and completion,reduce cycle time and continuouslyimprove service quality.
The alliance steering committee set incen-tives for recognition of innovative and supe-rior work at three levels: individual, teamand company. To monitor progress, thecommittee established measures—well per-formance, well cost, service quality, timingand adherence to plan.
Total well costs in the first field dropped49% compared to 1991 levels, an achieve-ment made possible by numerous changesin the drilling and completion process.Amoco completely redesigned the wellheadassembly, facilities and casing size to shavecosts. The drilling contractor improved thedrilling process to reduce average drillingtime per well by six days. Alliance partnersmodified frac fluid and proppant, takingadvantage of the BRACKETFRAC techniquein which both buoyant and dense proppantare injected to create artificial barriersabove and below the desired fracture inter-val, thereby controlling fracture height.Dowell engineers used the FracNPV appli-cation that examined the balance betweenfracture cost and anticipated production toidentify the most cost-effective fracture treat-
ment. Dowell supplied coiled tubing ser-vices to eliminate the need for a service rigand exploited used coiled tubing as cost-effective production tubing.
Fracturing costs per volume of gas pro-duced have been reduced by an average of57% compared with prealliance fracs. Con-nection time—time from spud to first sales—dropped 66% (left). News of the project’ssuccess has spread, and other operators inthe region have approached Amoco withproposals to turn portions of their operationsover to Amoco to optimize production.
Alliances in Research and DevelopmentNot all alliances between oil and servicecompanies revolve around field operations.Collaboration and optimization of resourcesare being taken a step further with researchand development alliances. Through suchalliances, the oil company benefits byobtaining the tools and products for theirprecise needs. In addition, the service com-pany develops products that can be trans-ferred to the market, and the companiesexchange know-how.
An example of such an alliance is thecollaboration between AGIP, the Italian oilcompany, and Wireline & Testing andGeoQuest. In 1992, Agip sought a workingrelationship with a service company toenhance the usefulness of dipmeter logs byautomating more of the interpretation andintegrating it with other log data. Agipwanted more than a typical operator-con-tractor arrangement, in which the contrac-tor programmers would meet Agip’s specifi-cations: working together, geologists andprogrammers from both sides created aproduct adapted to user needs.
The project was named DipFAN for dipfacies analysis, and split into six modules.For three of the modules, Agip engineers areassuming the role of operator, taking theproject lead with responsibility for specifica-tion and design documents, executablecode and a user guide, while their Schlum-berger counterparts take the role of partner.For the other three modules, the rolesreverse. Four of the modules have devel-oped to field-test stage, and work began onthe remaining two early in 1995. All sixmodules will become part of the GeoFrameoilfield data interpretation system (see “Tap-ping the Dipmeter,” next page).
Another example of a developmentalliance is the agreement between Statoil,the Norwegian oil company, and Geco-
36 Oilfield Review
1991Amoco
1994Amoco
1994Industry
Tim
e, d
ays
Connection Time
50
100
150
200
0
nReduction in connection time—fromwell spud to product sales—for Amoco’sGreater Green River basin.
Tapping the Dipmeter
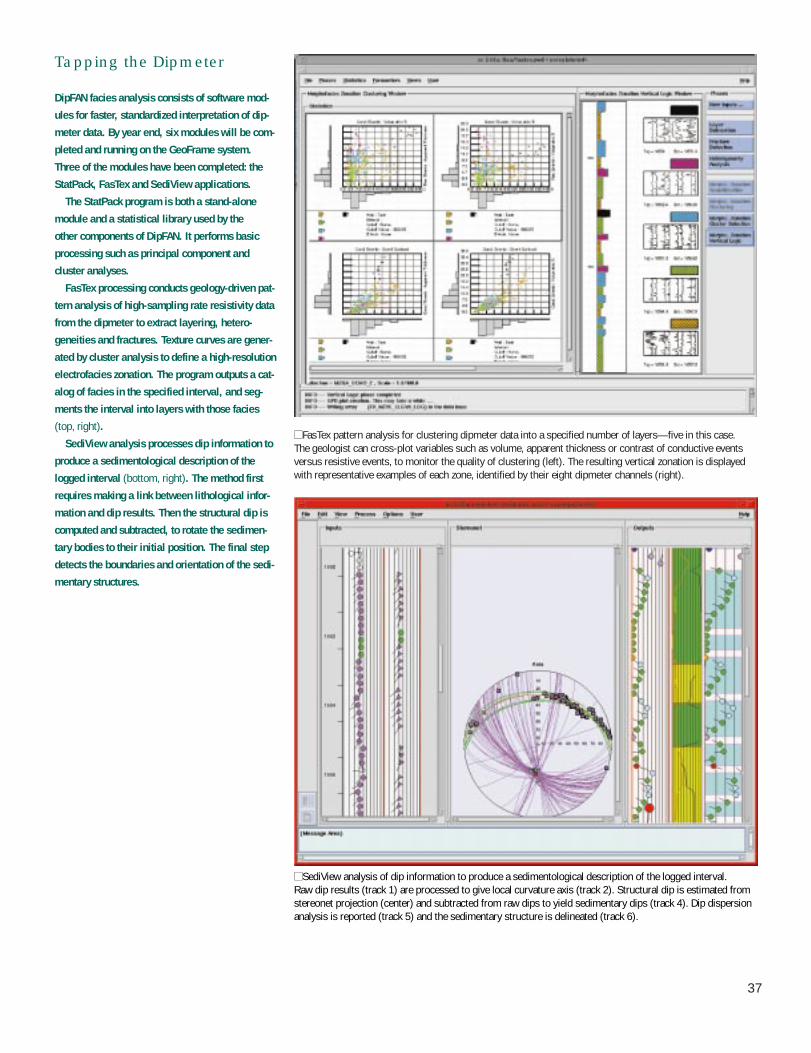
DipFAN facies analysis consists of software mod-
ules for faster, standardized interpretation of dip-
meter data. By year end, six modules will be com-
pleted and running on the GeoFrame system.
Three of the modules have been completed: the
StatPack, FasTex and SediView applications.
The StatPack program is both a stand-alone
module and a statistical library used by the
other components of DipFAN. It performs basic
processing such as principal component and
cluster analyses.
FasTex processing conducts geology-driven pat-
tern analysis of high-sampling rate resistivity data
from the dipmeter to extract layering, hetero-
geneities and fractures. Texture curves are gener-
ated by cluster analysis to define a high-resolution
electrofacies zonation. The program outputs a cat-
alog of facies in the specified interval, and seg-
ments the interval into layers with those facies
(top, right).
SediView analysis processes dip information to
produce a sedimentological description of the
logged interval (bottom, right). The method first
requires making a link between lithological infor-
mation and dip results. Then the structural dip is
computed and subtracted, to rotate the sedimen-
tary bodies to their initial position. The final step
detects the boundaries and orientation of the sedi-
mentary structures.
37
■■FasTex pattern analysis for clustering dipmeter data into a specified number of layers—five in this case. The geologist can cross-plot variables such as volume, apparent thickness or contrast of conductive eventsversus resistive events, to monitor the quality of clustering (left). The resulting vertical zonation is displayedwith representative examples of each zone, identified by their eight dipmeter channels (right).
■■SediView analysis of dip information to produce a sedimentological description of the logged interval. Raw dip results (track 1) are processed to give local curvature axis (track 2). Structural dip is estimated fromstereonet projection (center) and subtracted from raw dips to yield sedimentary dips (track 4). Dip dispersionanalysis is reported (track 5) and the sedimentary structure is delineated (track 6).
the Norwegian oil company, and Geco-Prakla to commercialize the SUMIC subseaseismic acquisition and processing tech-nique. The new system places four sensorcomponents on the ocean floor and recordssignals from a conventional marine seismicsource. This allows recording of shearwaves, which have previously beenrecorded only on land (see “Why SubseaSeismics?” below). Shear wave analysisadds information about rock and fluidboundaries that eludes conventional com-pressional-wave seismic interpretation.
Statoil had already invested years toresearch the SUMIC technology, includingthree feasibility studies, scaled experimentsand comparison of the sensors with refer-ence sensors in controlled environments. Itwas time to find a contractor to help com-mercialize the system.
After considering several companies, Sta-toil selected Geco-Prakla to develop and
improve the equipment and associated ser-vices, and promote marketing and sales. Theagreement permits Statoil to retain owner-ship rights on the technique, while Schlum-berger has exclusive user rights. The agree-ment is one of a collection of projects undera wider umbrella agreement with Statoil. Ina separate project for processing and inter-pretation, new functionality will be addedto the Charisma seismic workstation to han-dle the new type of data.
The Hard Road to AlliancesThere are no short cuts to alliance success.Process mapping can be a tedious exercise.Meeting after meeting to explain total qual-ity management and to ensure continuousimprovement can make office life moredemanding. The alliance approach requireslearning a new way to work, and it raisessome difficulties and questions. The fore-most problem has been securing top-level
commitment and top-to-bottom buy-in tothe alliance concept. For alliances to work,they must be part of the business plan, not apassing fad.
An alliance is not a short-term fix. Theremay be early successes that are not repeat-able. Large cost savings encountered in thefirst rounds of continuous improvement mayhave caught what alliance specialists call“no-brainers,” or “low-hanging fruit”—theeasy fixes that yield big savings. Later sav-ings may be incremental, but still important,and not attainable if the alliance partnersgive up too quickly.
There is also a fear of change. People aregoing to be concerned about their careers,their power and their control. These verydelicate, significant issues must be consid-ered before an alliance is formed. Restruc-turing is not a necessary outcome of analliance. According to Rick Adams, Opera-tions Engineer for Mobil Exploration & Pro-
38
Why Subsea Seismics?
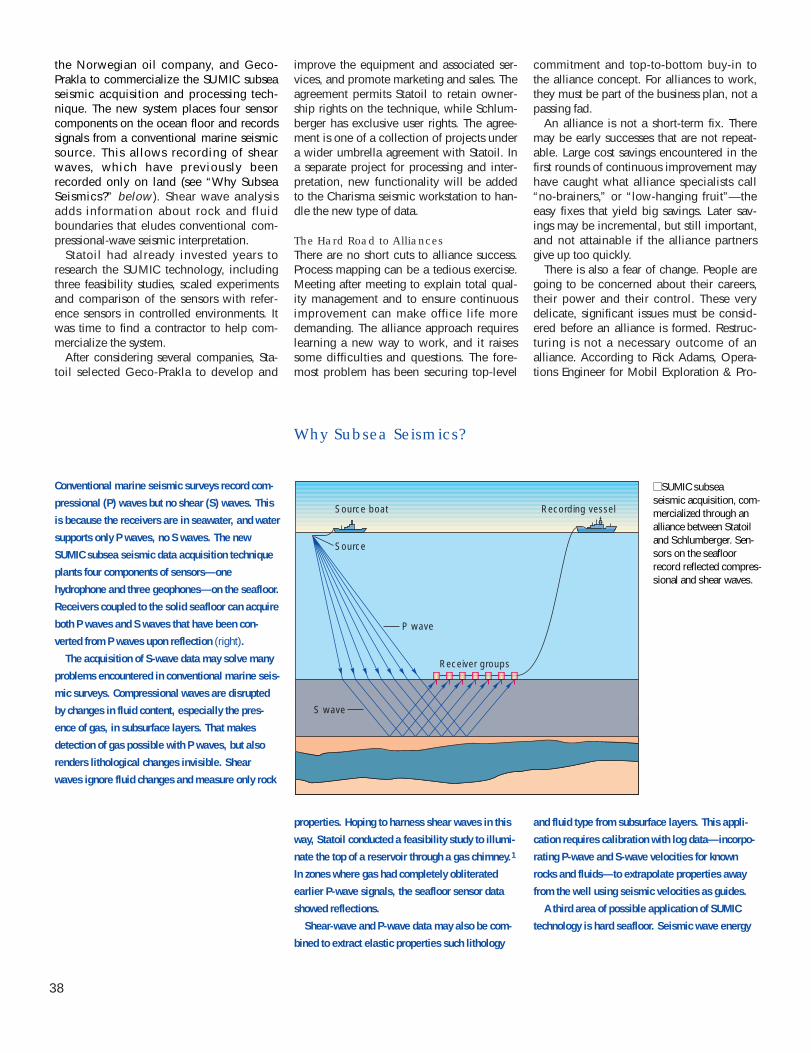
Conventional marine seismic surveys record com-
pressional (P) waves but no shear (S) waves. This
is because the receivers are in seawater, and water
supports only P waves, no S waves. The new
SUMIC subsea seismic data acquisition technique
plants four components of sensors—one
hydrophone and three geophones—on the seafloor.
Receivers coupled to the solid seafloor can acquire
both P waves and S waves that have been con-
verted from P waves upon reflection (right).
The acquisition of S-wave data may solve many
problems encountered in conventional marine seis-
mic surveys. Compressional waves are disrupted
by changes in fluid content, especially the pres-
ence of gas, in subsurface layers. That makes
detection of gas possible with P waves, but also
renders lithological changes invisible. Shear
waves ignore fluid changes and measure only rock
properties. Hoping to harness shear waves in this
way, Statoil conducted a feasibility study to illumi-
nate the top of a reservoir through a gas chimney.1
In zones where gas had completely obliterated
earlier P-wave signals, the seafloor sensor data
showed reflections.
Shear-wave and P-wave data may also be com-
bined to extract elastic properties such lithology
and fluid type from subsurface layers. This appli-
cation requires calibration with log data—incorpo-
rating P-wave and S-wave velocities for known
rocks and fluids—to extrapolate properties away
from the well using seismic velocities as guides.
A third area of possible application of SUMIC
technology is hard seafloor. Seismic wave energy
■■SUMIC subsea seismic acquisition, com-mercialized through analliance between Statoiland Schlumberger. Sen-sors on the seafloorrecord reflected compres-sional and shear waves.
S wave
P wave
Receiver groups
Source boat Recording vessel
Source

ducing, in Midland, Texas, “Alliances are away of improving productivity without thenegative side effect of downsizing.”
Another potential concern is the fear ofbeing locked into an agreement and not get-ting the best technology. This must be takeninto account when choosing a partner. Thealliance partner that has offered the besttechnology in the past and who offers ittoday is likely to be the one who will beable to offer it in the future.
Oil companies may question how bigthey must be to have an alliance. Accordingto industry experts, alliances can work forsmall independents as well as for majors.The goal is to optimize assets, maximizeefficiency and lower total costs. An opera-tor’s assets may be its infrastructure, or alarge in-house staff. Or it may have a smallin-house staff that needs to be augmented.
As more companies begin to makealliances, some are looking for ways to
share their experience and to promotealliancing as a new technology. Others arebeginning to view alliancing as a core com-petency, and are less inclined to share theirexpertise. They have worked hard to learnthe skills, and are more reluctant to giveaway their new competitive advantage. Butsuch an advantage may be temporary. Newbusiness relationships that control total costsand encourage constant change are healthyfor the industry, and give a direction formore companies to follow.
Through alliances, operators and servicecompanies are trying to achieve a commongoal—lower the total cost per energy unitproduced. As more companies gain experi-ence with alliances, significant savings willcontinue to be made by both operators andsuppliers, and more opportunities will befound for gaining efficiency and addingvalue. —LS
39
is greatly attenuated by reflection at large-contrast
boundaries. In conventional surveys, waves reflect
twice—going down, then up again—at the water-
rock interface. Compressional- and shear-wave
recordings both may benefit from the placement of
receivers on the seafloor.
Finally, the new technology may facilitate
repeat surveys designed to monitor changes in
fluid saturation fronts. In the past, such surveys
have suffered from difficulties associated with
changes in acquisition geometry and equipment
and in processing methods between one survey
and the next. Permanently secured sensors may
alleviate some of those difficulties.
1. Berg E, Svenning B and Martin J: “SUMIC—A New Strate-gic Tool for Exploration and Reservoir Mapping,” presentedat the EAEG 56th Meeting and Technical Exhibition, Vienna,Austria, June 6-10, 1994.