alliant energy interstate power and light company prairie … · interstate power and light company...
TRANSCRIPT

Report Issued: October 10, 2016 Revision 0
ALLIANT ENERGY Interstate Power and Light Company Prairie Creek Generating Station CCR SURFACE IMPOUNDMENT INFLOW DESIGN FLOOD CONTROL PLAN

Interstate Power and Light Company – Prairie Creek Generating Station Inflow Design Flood Control System Plan October 10, 2016 i
EXECUTIVE SUMMARY
This Inflow Flood Control Plan (Report) is prepared in accordance with the requirements
of the United States Environmental Protection Agency (USEPA) published Final Rule for
Hazardous and Solid Waste Management System – Disposal of Coal Combustion
Residual from Electric Utilities (40 CFR Parts 257 and 261, also known as the CCR Rule)
published on April 17, 2015 and effective October 19, 2015.
This Report assesses the hydrologic and hydraulic capacity requirements for each CCR
unit at Prairie Creek Generating Station in Cedar Rapids, Iowa in accordance with §257.82
of the CCR Rule. For purposes of this Report, a CCR unit is defined as any existing CCR
surface impoundment. Primarily, the Report documents how the inflow design flood
control system has been designed and constructed to meet the CCR Rule section §257.82.

Interstate Power and Light Company – Prairie Creek Generating Station Inflow Design Flood Control System Plan October 10, 2016 ii
Table of Contents
1 Introduction ............................................................................................................................................ 1
1.1 CCR Rule Applicability .................................................................................................................. 1
1.2 Hydrologic and Hydraulic Capacity Applicability ........................................................................... 1
2 FACILITY DESCRIPTION ..................................................................................................................... 3
2.1 Northern Impoundment System .................................................................................................... 4
2.2 Southern Impoundment System.................................................................................................... 5
2.3 PCS Discharge Pond (PCS Pond 8) ............................................................................................. 6
3 HYDROLOGIC AND HYDRAULIC CAPACITY- §257.82(a) ................................................................. 7
3.1 Hazard Classification and Design Storm ...................................................................................... 7
3.2 Hydrologic and Hydraulic Capacity Methods ................................................................................ 8
3.3 Hydrologic and Hydraulic Capacity Input and Assumptions ......................................................... 8
4 Inflow Design Flood Control System Plan ........................................................................................... 11
5 QUALIFIED PROFESSIONAL ENGINEER CERTIFICATION ............................................................ 12
Figures
Figure 1: Inflow Flood Control Site Plan Figure 2: Storm Water Routing
Appendices
Appendix A: Water Balance Flow Chart
Appendix B: NOAA Storm Frequency
Appendix C: Outlet Hydraulic Conditions
Appendix D: Hydraulic Analysis
Interstate Power and Light Company – Prairie Creek Generating Station Inflow Design Flood Control System Plan October 10, 2016 1
1 Introduction
The owner or operator of the Coal Combustion Residual (CCR) unit must conduct an
initial and periodic inflow design flood control system plan to determine if each CCR unit
adequately manages flow into and from each CCR unit during and following the peak
discharge of the inflow design flood. The inflow design flood is selected based on the
hazard potential classification (§257.73(a)(2)) for each CCR unit.
This Report is prepared in accordance with the requirements of §257.82 of the CCR Rule.
1.1 CCR Rule Applicability
The CCR Rule requires an initial and periodic inflow design flood control system plan
certified by a qualified professional engineer (PE) for all existing CCR surface
impoundments. This report is the initial inflow design flood control system plan.
1.2 Hydrologic and Hydraulic Capacity Applicability
The Prairie Creek Generating Station (PCS) in Cedar Rapids, Iowa (Figure 1) has eight
existing CCR surface impoundments; PCS Ponds 1 through 7 and the PCS Discharge
Pond (PCS Pond 8). There are also three impoundments, PCS Pond 9, PCS Pond 10, and
PCS Pond 11, which are not CCR units.
The impoundments are grouped into discharge areas:
• PCS Northern Impoundments (PCS Pond 1, PCS Pond 2, PCS Pond 3, and PCS Pond 4)
• PCS Southern Impoundments (PCS Pond 5, PCS Pond 6, PCS Pond 7, PCS Pond 9, PCS Pond 10, and PCS Pond 11)
• PCS Discharge Pond (PCS Pond 8)
The PCS Northern Impoundments are interconnected and drain the northern limits of
PCS, Figure 2. The PCS Southern Impoundments drain a larger area south of the northern
drainage area. Both drainage areas discharge to the PCS Discharge Pond (Pond 8), where
the outfall flow rate is metered prior to discharge into Prairie Creek.

Interstate Power and Light Company – Prairie Creek Generating Station Inflow Design Flood Control System Plan October 10, 2016 2
PCS Discharge Pond and PCS Pond 7 are formed by an embankment on the western end
of the drainage basin. All other impoundments in each drainage basin are incised.
Interstate Power and Light Company – Prairie Creek Generating Station Inflow Design Flood Control System Plan October 10, 2016 3
2 FACILITY DESCRIPTION
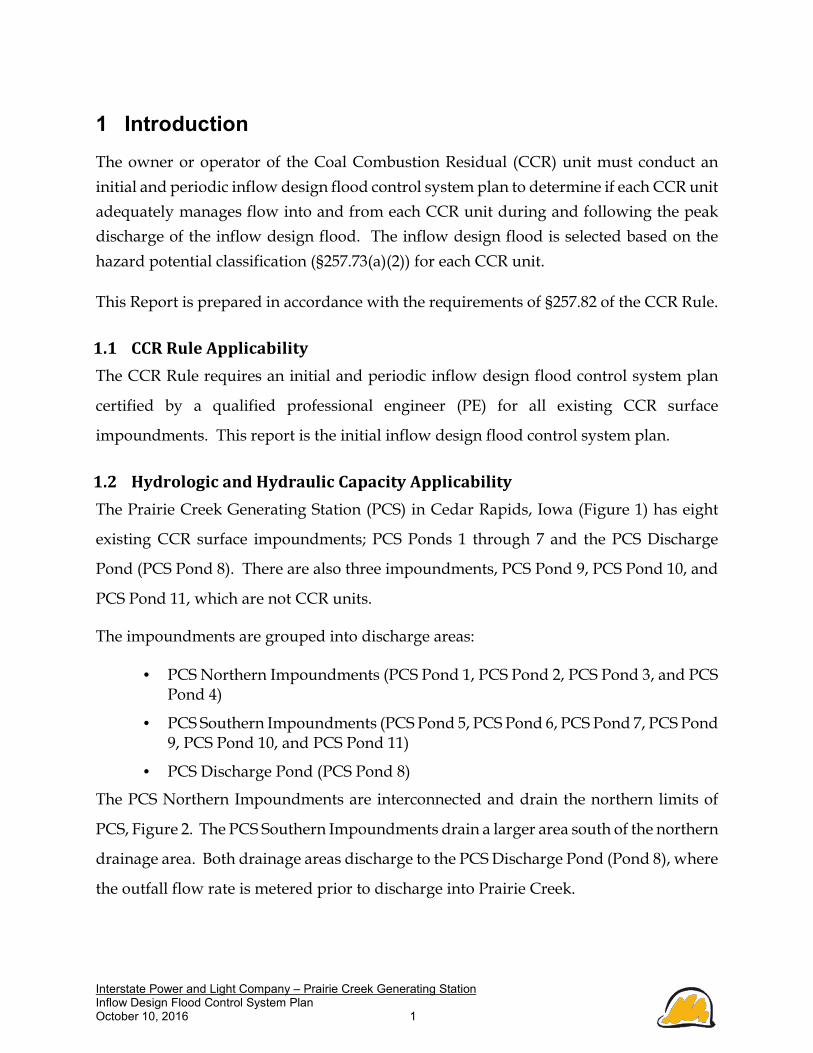
PCS is located in the City of Cedar Rapids, Iowa. The generating plant is located
approximately 800 feet west of the western shore of the Cedar River and 1,000 feet east
of the eastern shore of Prairie Creek. PCS is located in Linn County, at 3300 C Street S.W.,
Cedar Rapids, Iowa (Figure 1).
PCS is a fossil-fueled electric generating and steam production station consisting of four
coal-fired boilers (Unit 1, Unit 2, Unit 3, and Unit 4), two natural gas-fired package boilers
(Unit 5 and Unit 6) and three steam electric turbine generating units. The Unit 2 turbine
generator was decommissioned in 2013. Boilers 5 and 6 are used for steam production
only and are independent of the turbine generators. Sub-bituminous coal is the primary
fuel for producing steam at PCS. The burning of coal produces a by-product of CCR. The
CCR at PCS is categorized into two types, bottom ash and precipitator fly ash.
The precipitator fly ash at PCS is collected by the electrostatic precipitators and sent to
the on-site storage silos located on the east and west sides of the generating plant. The
precipitator fly ash is then transported off-site for beneficial reuse or disposal.
The Northern Impoundment System receives bottom ash and sluice water. The bottom
ash is sluiced at 0.08 million gallons per day (MGD) from Unit 3 and 0.39 MGD from Unit
4 into to PCS Pond 1 west of the generating plant, Figure 2. The bottom ash settles in PCS
Pond 1 and is removed and stockpiled to dewater at the east end of PCS Pond 1.
Additionally, the floor sumps and ash overflow tank discharge into PCS Pond 1 at 1.07
MGD and 1.22 MGD respectively.
The Southern Impoundment System, PCS Pond 5, PCS Pond 6, PCS Pond 7, PCS Pond 9,
PCS Pond 10, and PCS Pond 11 receive sump water from the power station and from the
coal handling area. The impoundments also act as a backup discharge pathway for PCS
Pond 1 through the interconnection between PCS Pond 2 and PCS Pond 5. The sump

Interstate Power and Light Company – Prairie Creek Generating Station Inflow Design Flood Control System Plan October 10, 2016 4
water flow is from the basement of the generating station into PCS Pond 11 at 0.07 MGD
and from the coal handling facilities into PCS Pond 9 at 0.5 MGD.
The Northern and Southern Impoundment Systems discharge into a final surface
impoundment identified as the PCS Discharge Pond (PCS Pond 8). The water in the PCS
Discharge Pond discharges through the facilities National Pollution Discharge
Elimination System (NPDES) Outfall 002. From the NPDES Outfall 002 the water flows
into Prairie Creek.
The impoundments of the Northern and Southern Impoundment Systems are all existing
CCR surface impoundments, except for PCS Pond 9, Pond 10, and Pond 11. IPL has
determined that PCS Pond 9, PCS Pond 10 and PCS Pond 11 have not contained or
received any CCR on or after October 19, 2015, and therefore, are exempt from the
requirements of the CCR Rule. Additionally, PCS Discharge Pond and PCS Pond 7 are
the only non-incised surface impoundments at PCS.
General Facility Information:
Date of Initial Facility Operations: 1950
NPDES Permit Number: IA5715108
Latitude / Longitude: 41°56’38.43”N 91°38’22.39”W
Coordinates: Section 3, Township 82 North, Range 7 West
Unit Nameplate Ratings: Unit 1 (1996): 16 MW
Unit 2 (1952): Turbine Decommissioned in 2013
Unit 3 (1958): 50 MW,
Unit 4 (1968): 149 MW,
2.1 Northern Impoundment System
In addition to receiving sluiced bottom ash, the plant area to the east of PCS Pond 1,
including mainly the plant substation, drains to PCS Pond 1 during rain events. The
water elevation in PCS Pond 1 is controlled with a weir board that overflows to an open
channel connection with PCS Pond 2, Figure 2. PCS Pond 2 is an impoundment that

Interstate Power and Light Company – Prairie Creek Generating Station Inflow Design Flood Control System Plan October 10, 2016 5
normally discharges through an open channel into PCS Pond 3. An alternate high water
elevation overflow from PCS Pond 2 at elevation 714.5 (feet above sea level) through a
24-inch diameter corrugated metal pipe allows water to flow to or from PCS Pond 5 of
the Southern Impoundment System during high water events. PCS Pond 3 discharges to
PCS Pond 4 through an 18-inch diameter metal pipe at invert elevation 712.6 feet
(approximately 2 feet below the emergency outlet of PCS Pond 2). PCS Pond 4 is the final
impoundment in the string of northern impoundments and is formed by construction of
an embankment at the western end. PCS Pond 4 discharges into a 30-inch diameter
vertical riser pipe connected to a 30-inch diameter corrugated metal pipe under the
embankment discharging into the PCS Discharge Pond (PCS Pond 8). The invert
elevation on the top of the riser pipe is elevation 713.7 feet. The incised PCS Pond 3 has
emergency overflow capacity to pass water over the interior embankment that separates
PCS Pond 3 and PCS Pond 4 in the event that storm water storage exceeds elevation 715.5
feet. The outlet structure on PCS Pond 4 is the final and only storm water critical outlet
on the Northern Impoundment System.
2.2 Southern Impoundment System
PCS Pond 9 receives storm water runoff from the PCS plant site, Figure 2. PCS Pond 9
also receives sump water flow from the generating station at via PCS Pond 11. PCS Pond
9 discharges through a 15 inch diameter PVC pipe at invert elevation 714.7 feet south
under a plant railroad spur. PCS Pond 10 receives storm water from the CCR storage
area and one half of the coal storage area and sump discharge from the coal handling
shakerhouse, Figure 1. PCS Pond 10 overflows through a 48-inch diameter concrete pipe
at invert elevation 711.5 feet, under the railroad spur. PCS Pond 5 receives flow from
PCS Pond 10 and is interconnected with PCS Pond 2 of the Northern Impoundment
System. During normal flow conditions, the water in PCS Pond 5 flows to the west
through a 24-inch diameter corrugated metal pipe at invert elevation 721.9 feet into
incised PCS Pond 6. PCS Pond 6 receives influent flows from PCS Pond 5, and small
amounts of storm water runoff. The water in PCS Pond 6 flows to the west through a 24-

Interstate Power and Light Company – Prairie Creek Generating Station Inflow Design Flood Control System Plan October 10, 2016 6
inch diameter corrugated metal pipe at invert elevation 712.6 feet into PCS Pond 7. PCS
Pond 7 receives influent flows from PCS Pond 6 and controls the normal operating
elevation of the southern impoundment system with its 24-inch diameter vertical riser
outfall at elevation 713.5 feet. The discharge water from PCS Pond 7 flows to the west
through a 24-inch diameter metal pipe under the embankment and into the southeast
corner of the PCS Discharge Pond.
2.3 PCS Discharge Pond (PCS Pond 8)
The PCS Discharge Pond is the final impoundment in the CCR surface impoundment
system and is located after both the Northern Impoundment System and the Southern
Impoundment System.
The PCS Discharge Pond contains a metering Parshall flume cut into the embankment of
the impoundment discharging at an elevation of 711 feet. During storm events, the
capacity of the metering system is exceeded and water discharges through a V-notch
channel with a top width of 13 feet at elevation 713 feet. Above elevation 713 feet the
embankment is overtopped.

Interstate Power and Light Company – Prairie Creek Generating Station Inflow Design Flood Control System Plan October 10, 2016 7
3 HYDROLOGIC AND HYDRAULIC CAPACITY- §257.82(a)
This Report provides hydrologic and hydraulic capacity information for inflow design
flood control systems which is intended to:
1. Adequately manage flow into each CCR unit during and following the peak
discharge inflow of the specified design flood,
2. Adequately manage flow from each CCR unit during and following the peak
discharge inflow of the specified design flood; and,
3. Handle discharge from the CCR unit in accordance with National Pollutant
Discharge Elimination System (NPDES) regulations §257.3-3.
3.1 Hazard Classification and Design Storm
PCS Pond 7 and PCS Discharge Pond are classified as low hazard potential because
failure or mis-operation has no probable loss of human life and low economic and/or
environmental losses. Additionally, losses would be principally limited to the owner’s
property. PCS Pond 1, PCS Pond 2, PCS Pond 3, PCS Pond 4, PCS Pond 5, and PCS Pond
6 are incised impoundments without hazard of release.
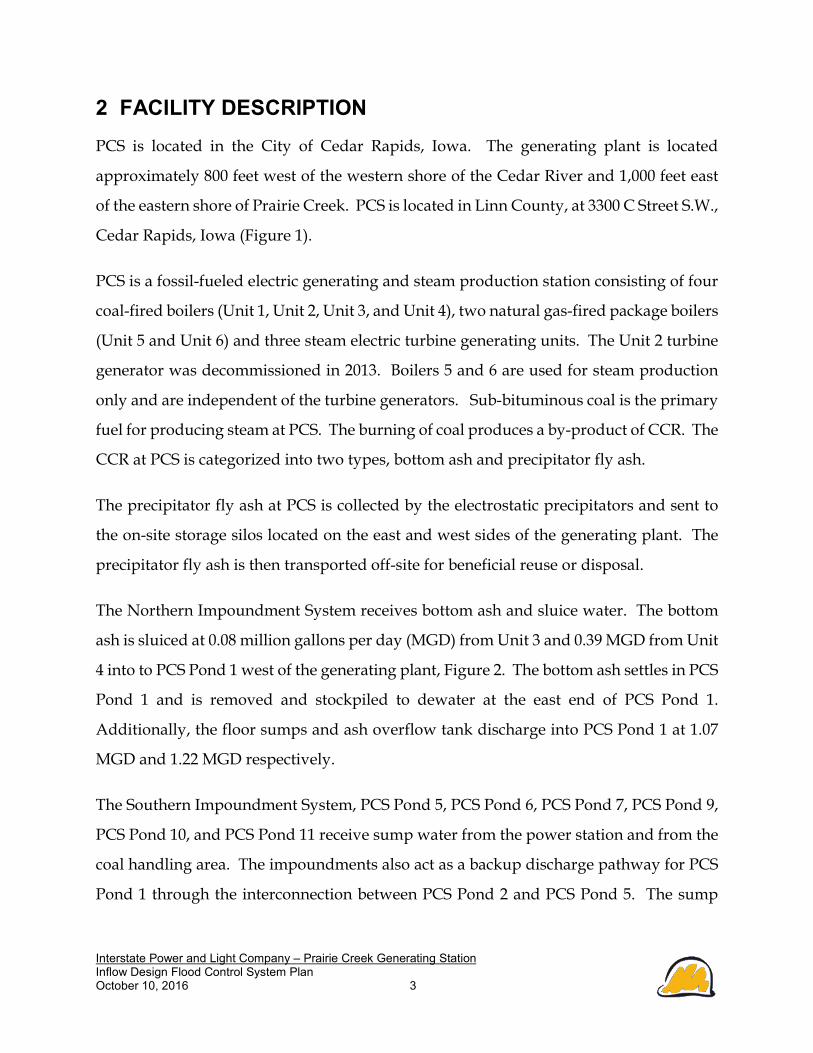
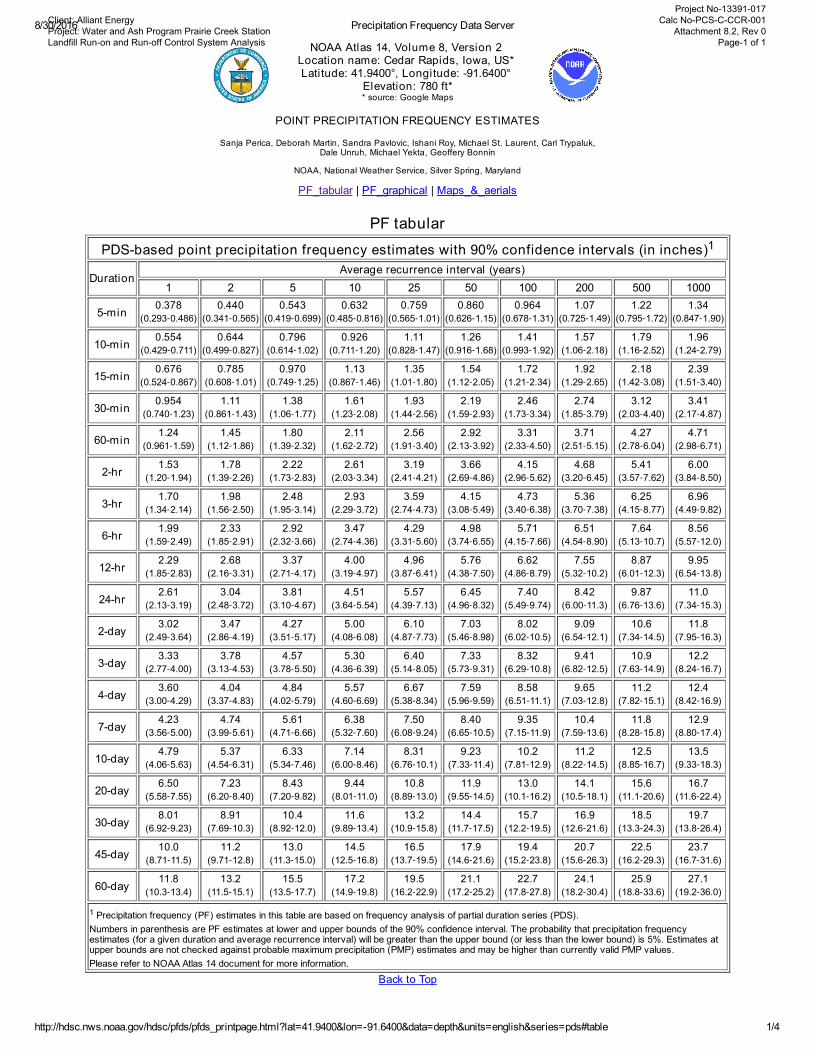
The design storm for PCS Pond 7 and PCS Discharge Pond is the 100 year return event
SCS Type II 24 hour storm as defined in §257.82(3)(ii). The total rainfall for the event
selected from the National Oceanographic and Atmospheric Administration’s
probabilistic map for the OGS site coordinates is 7.40 inches for the 100 year event,
Appendix B. The design storm for the incised impoundments is the 25 year event as
defined in §257.82(3)(iv).
Since the incised impoundment storage volume is integral to and controlled by the
discharge weirs in PCS Pond 4 and PCS Pond 7, the 100 year storm is routed through all
of the impoundments and safe passage through the incised impoundments is evidence
of compliance with the 25 year storm requirement.

Interstate Power and Light Company – Prairie Creek Generating Station Inflow Design Flood Control System Plan October 10, 2016 8
3.2 Hydrologic and Hydraulic Capacity Methods
The 100 year SCS Type II storm was routed through the PCS Pond 4 and PCS Pond 7 over
the 30-inch and 24-inch diameter outfall weirs into PCS Discharge Pond and from PCS
Discharge Pond through a V-notch weir in the embankment. The routing was completed
using the program Hydraflow by Intelisolve1. Hydraflow uses the unit hydrograph
method to generate a Type II distribution rainfall for the drainage area of the
impoundments. Hydraflow routes the rainfall hydrograph through the outlet structure
storing water within the impoundments in accordance with the reservoir capacity of each
impoundment. The proportion of runoff to rainfall for the drainage watershed is input
based on characteristics of the watershed area. The drainage areas of the watershed
include 20 acres of level power plant and 10 acres of water surface and embankment for
a total of 30 acres draining to the PCS Discharge Pond outfall.
3.3 Hydrologic and Hydraulic Capacity Input and Assumptions
This section identifies the input and assumptions for the hydrologic and hydraulic
capacity calculations. The input for each sub-drainage area of the impoundments are:
Impoundment Name
Acreage Average Curve Number
(CN)
Slope (%)
Hydraulic Length (ft)
PCS Pond 1 5.6 75 0.1 800
PCS Pond 2 & PCS Pond 3
2.1 85 0.1 150
PCS Pond 4 2.2 90 0.1 60
PCS Pond 9, PCS Pond 10,
& PCS Pond 11 16.4 75 0.1 815
PCS Pond 5 3.5 85 0.1 400
PCS Pond 6 2.1 90 0.1 200
PCS Pond 7 2.6 90 0.1 200
The storm water falling in PCS Discharge Pond is ignored due to its small size. The curve
numbers for the two largest areas are an average based on the soil type and the surface
usage at the plant site and contribute most of the storm water runoff that is not direct
1 Intelisolve, Pond Routing Software Hydraflow, 2002

Interstate Power and Light Company – Prairie Creek Generating Station Inflow Design Flood Control System Plan October 10, 2016 9
rainfall into the impoundments. Slopes of the coal pile are ignored due to the high
infiltration rate.
The outlet characteristics for PCS Pond 4 and PCS Pond 7 are controlled by vertical
circular pipes that operate as overflow weirs during low flow and convert to outlet pipe
flow at higher flows. For both outlet pipes the pipe flow is controlled by the flooding of
PCS Discharge Pond at elevation 713 feet. The PCS Pond 4 pipe at 2.5 foot diameter stays
in weir overflow during the design storm due to the capacity of the vertical riser. For the
PCS Pond 7 pipe the flow changes to outlet controlled pipe flow at around 18 cubic feet
per second, Appendix C.
The outlet for PCS Discharge Pond is modeled as a V-notch weir with a starting overflow
elevation of 711 feet and a top surface of 713 feet at approximately 13 foot width. Above
elevation 713 the V-notch becomes a broad crest weir 13 foot wide, Appendix C. The
actual width of the broad crested weir increases to the full width of the embankment
between 713 and 714 elevation and the analysis over predicts the overflow of the PCS
Discharge Pond embankment.
During normal PCS operation, the process water flow to the Northern and Southern
Impoundment Systems is 1.76 MGD and 0.06 MGD, respectively, Appendix A. At the
operating water discharge rate, infiltration of water into the ground below the
impoundments results in no discharge from PCS Discharge Pond. The process water
does not impact the flow capacity for storm water and the starting water elevation of the
impoundments is set equal to the overflow elevation of PCS Pond 4 and PCS Pond 7 as a
conservative assessment of storage capacity in the impoundment systems.
The analysis assumes that the outlet of the PCS Discharge Pond outlet is not restricted by
the water elevation within Prairie Creek. For this to take place, the peak storm water flow
would need to occur in conjunction with a regional flooding event affecting the Cedar
River, which are unlikely to occur simultaneously.

Interstate Power and Light Company – Prairie Creek Generating Station Inflow Design Flood Control System Plan October 10, 2016 10
The storage capacity of the impoundments is generated by digitizing the area of the
impoundment at starting water elevation and retaining the same area as water height
increases. The result is a conservative estimation of the storage capacity of the
impoundment systems.
Exfiltration of water from impoundments is accounted for by ignoring the operating
water flow from PCS, since it normally infiltrates into the ground under the
impoundments. Any increase in infiltration rate due to higher water elevations in the
impoundments during the storm is ignored.
The interconnecting pipe between PCS Pond 2 and PCS Pond 5 is ignored in the analysis.
If PCS Pond 5 water elevation exceed 714.5 feet (the invert on the PCS Pond 2 end of the
pipe), water from PCS Pond 5 could flow into the Northern Impoundment System. Since
the Southern Impoundment System has more of the drainage area this would let water
route through the PCS Pond 4 outlet which is bigger than the PCS Pond 7 outlet. Ignoring
the interconnection is conservative to assessing the capacity of PCS Pond 7.

Interstate Power and Light Company – Prairie Creek Generating Station Inflow Design Flood Control System Plan October 10, 2016 11
4 Inflow Design Flood Control System Plan
The normal operating water elevation for PCS Pond 4 (elevation 713.7 feet) and for PCS
Pond 7 (elevation 713.5 feet) are the starting elevations for routing of the 100 year storm
event, Figure 2.
During the 100 year design storm, the PCS Pond 4 and PCS Pond 7 route the storm flow
as summarized below:
Impoundment Peak Flow (cfs)
Water Elevation (feet)
Crest Elevation (feet)
Freeboard (feet)
Pond 4 8.5 714.2 715 0.8
Pond 7 20.2 714.6 715 0.4
PCS Discharge Pond 28.5 713.6 N/A N/A
PCS Discharge Pond is a metering impoundment without substantial storage that is
designed to overflow during intense rain events and has no distinct crest elevation.
During the 100 year storm event the combination of both the Northern and Southern
Impoundment Systems stores 6.8 acre feet of water. The incised impoundments all
contain the 100 year event without overfilling and therefore meet the 25 year storm
routing requirement. The calculation of volumes and storage elevation are included in
Appendix D.


Interstate Power and Light Company – Prairie Creek Generating Station Inflow Design Flood Control System Plan October 10, 2016
FIGURES
Alliant Energy Interstate Power and Light Company Prairie Creek Generating Station Cedar Rapids, Iowa Inflow Design Flood Control System Plan
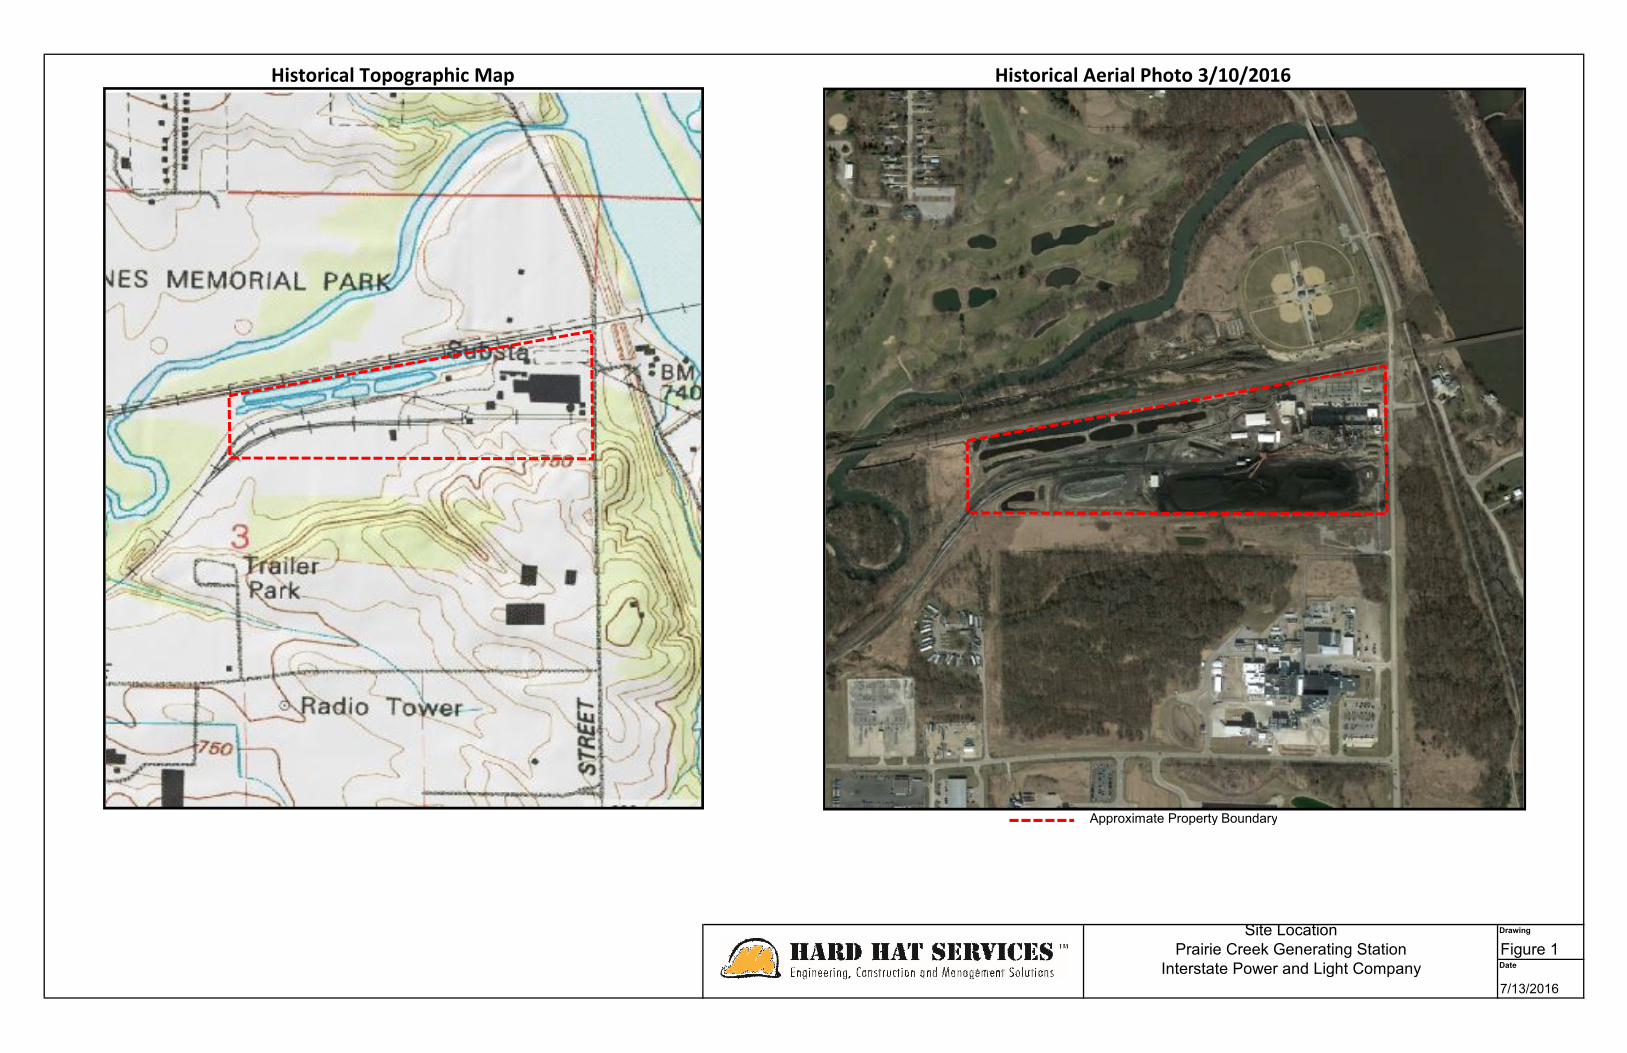
Approximate Property Boundary
Site Location Drawing
Prairie Creek Generating Station Figure 1
Interstate Power and Light Company Date
7/13/2016
Historical Aerial Photo 3/10/2016Historical Topographic Map


Interstate Power and Light Company – Prairie Creek Generating Station Inflow Design Flood Control System Plan October 10, 2016
EXHIBIT A
40 CFR Part 112 Cross Reference Wisconsin Power & Light Company Riverside Energy Center Spill Prevention, Control, and Countermeasure (SPCC) Plan
APPENDIX A – Water Balance Chart
Alliant Energy Interstate Power and Light Company Prairie Creek Generating Station Cedar Rapids, Iowa Inflow Design Flood Control System Plan

Prairie Creek Generating Station Outfall 002 Water Flow Diagram - 2016
Bottom Ash Transport
Wa
ter
Inta
ke
Str
uctu
re
Unit 3 Ash Sluice
Unit 4 Ash Sluice
Air Heater Oil Cooler
Boiler Seal Water
Boiler Blowdown
Water
Floor Sumps Unit 1 & 2
Floor Sumps Unit 3
Ash Overflow Tank
Plant grounds, ash handling, fuel oil
storage, chemical storage and portion of
coal handling
Pond 8 of Ash Pond System
Infiltration
Outfall 002 NPDES Sampling Point
Coal Pile Runoff & Surrounding Area
Coal Pile Runoff Pond
Outfall 003 NPDES Sampling Point
Ce
da
r R
ive
r
Well
1.22 MGD Pra
irie
Cre
ek
Evaporation
Pond 1 of Northern
Impoundment System
Pond 9 of Southern
Impoundment System
Northern Impoundment
System
Southern Pond System
Infiltration
Evaporation
Precipitation and Runoff
Precipitation and Runoff
Precipitation and Runoff
0.08 MGD
0.388 MGD
0.02MGD
0.0058 MGD
0.05 MGD
0.0057 MGD
City Water
Reverse Osmosis
RO Water to Boilers
Export Steam
Boiler Blow Down to Condenser Discharge
(Outfall 001)
RO Reject Water to Condenser Discharge
(Outfall 001)
Lab Sample Skid
Demineralization/Regeneration
Water
Water Treatment Building Sump (Outfall 004)
0.5 MGD
0.07 MGD
Basement Sumps
Pond 11 of Southern
Impoundment System
0.07 MGDCoal Handling Floor
Sump

Interstate Power and Light Company – Prairie Creek Generating Station Inflow Design Flood Control System Plan October 10, 2016
EXHIBIT A
40 CFR Part 112 Cross Reference Wisconsin Power & Light Company Riverside Energy Center Spill Prevention, Control, and Countermeasure (SPCC) Plan
APPENDIX B – NOAA Storm Frequency
Alliant Energy Interstate Power and Light Company Prairie Creek Generating Station Cedar Rapids, Iowa Inflow Design Flood Control System Plan
8/30/2016 Precipitation Frequency Data Server
http://hdsc.nws.noaa.gov/hdsc/pfds/pfds_printpage.html?lat=41.9400&lon=-91.6400&data=depth&units=english&series=pds#table 1/4
NOAA Atlas 14, Volume 8, Version 2 Location name: Cedar Rapids, Iowa, US* Latitude: 41.9400°, Longitude: -91.6400°
Elevation: 780 ft** source: Google Maps
POINT PRECIPITATION FREQUENCY ESTIMATES
Sanja Perica, Deborah Martin, Sandra Pavlovic, Ishani Roy, Michael St. Laurent, Carl Trypaluk,Dale Unruh, Michael Yekta, Geoffery Bonnin
NOAA, National Weather Service, Silver Spring, Maryland
PF_tabular | PF_graphical | Maps_&_aerials
PF tabular
PDS-based point precipitation frequency estimates with 90% confidence intervals (in inches)1
DurationAverage recurrence interval (years)
1 2 5 10 25 50 100 200 500 1000
5-min0.378
(0.293‑0.486)0.440
(0.341‑0.565)0.543
(0.419‑0.699)0.632
(0.485‑0.816)0.759
(0.565‑1.01)0.860
(0.626‑1.15)0.964
(0.678‑1.31)1.07
(0.725‑1.49)1.22
(0.795‑1.72)1.34
(0.847‑1.90)
10-min0.554
(0.429‑0.711)0.644
(0.499‑0.827)0.796
(0.614‑1.02)0.926
(0.711‑1.20)1.11
(0.828‑1.47)1.26
(0.916‑1.68)1.41
(0.993‑1.92)1.57
(1.06‑2.18)1.79
(1.16‑2.52)1.96
(1.24‑2.79)
15-min0.676
(0.524‑0.867)0.785
(0.608‑1.01)0.970
(0.749‑1.25)1.13
(0.867‑1.46)1.35
(1.01‑1.80)1.54
(1.12‑2.05)1.72
(1.21‑2.34)1.92
(1.29‑2.65)2.18
(1.42‑3.08)2.39
(1.51‑3.40)
30-min0.954
(0.740‑1.23)1.11
(0.861‑1.43)1.38
(1.06‑1.77)1.61
(1.23‑2.08)1.93
(1.44‑2.56)2.19
(1.59‑2.93)2.46
(1.73‑3.34)2.74
(1.85‑3.79)3.12
(2.03‑4.40)3.41
(2.17‑4.87)
60-min1.24
(0.961‑1.59)1.45
(1.12‑1.86)1.80
(1.39‑2.32)2.11
(1.62‑2.72)2.56
(1.91‑3.40)2.92
(2.13‑3.92)3.31
(2.33‑4.50)3.71
(2.51‑5.15)4.27
(2.78‑6.04)4.71
(2.98‑6.71)
2-hr1.53
(1.20‑1.94)1.78
(1.39‑2.26)2.22
(1.73‑2.83)2.61
(2.03‑3.34)3.19
(2.41‑4.21)3.66
(2.69‑4.86)4.15
(2.96‑5.62)4.68
(3.20‑6.45)5.41
(3.57‑7.62)6.00
(3.84‑8.50)
3-hr1.70
(1.34‑2.14)1.98
(1.56‑2.50)2.48
(1.95‑3.14)2.93
(2.29‑3.72)3.59
(2.74‑4.73)4.15
(3.08‑5.49)4.73
(3.40‑6.38)5.36
(3.70‑7.38)6.25
(4.15‑8.77)6.96
(4.49‑9.82)
6-hr1.99
(1.59‑2.49)2.33
(1.85‑2.91)2.92
(2.32‑3.66)3.47
(2.74‑4.36)4.29
(3.31‑5.60)4.98
(3.74‑6.55)5.71
(4.15‑7.66)6.51
(4.54‑8.90)7.64
(5.13‑10.7)8.56
(5.57‑12.0)
12-hr2.29
(1.85‑2.83)2.68
(2.16‑3.31)3.37
(2.71‑4.17)4.00
(3.19‑4.97)4.96
(3.87‑6.41)5.76
(4.38‑7.50)6.62
(4.86‑8.79)7.55
(5.32‑10.2)8.87
(6.01‑12.3)9.95
(6.54‑13.8)
24-hr2.61
(2.13‑3.19)3.04
(2.48‑3.72)3.81
(3.10‑4.67)4.51
(3.64‑5.54)5.57
(4.39‑7.13)6.45
(4.96‑8.32)7.40
(5.49‑9.74)8.42
(6.00‑11.3)9.87
(6.76‑13.6)11.0
(7.34‑15.3)
2-day3.02
(2.49‑3.64)3.47
(2.86‑4.19)4.27
(3.51‑5.17)5.00
(4.08‑6.08)6.10
(4.87‑7.73)7.03
(5.46‑8.98)8.02
(6.02‑10.5)9.09
(6.54‑12.1)10.6
(7.34‑14.5)11.8
(7.95‑16.3)
3-day3.33
(2.77‑4.00)3.78
(3.13‑4.53)4.57
(3.78‑5.50)5.30
(4.36‑6.39)6.40
(5.14‑8.05)7.33
(5.73‑9.31)8.32
(6.29‑10.8)9.41
(6.82‑12.5)10.9
(7.63‑14.9)12.2
(8.24‑16.7)
4-day3.60
(3.00‑4.29)4.04
(3.37‑4.83)4.84
(4.02‑5.79)5.57
(4.60‑6.69)6.67
(5.38‑8.34)7.59
(5.96‑9.59)8.58
(6.51‑11.1)9.65
(7.03‑12.8)11.2
(7.82‑15.1)12.4
(8.42‑16.9)
7-day4.23
(3.56‑5.00)4.74
(3.99‑5.61)5.61
(4.71‑6.66)6.38
(5.32‑7.60)7.50
(6.08‑9.24)8.40
(6.65‑10.5)9.35
(7.15‑11.9)10.4
(7.59‑13.6)11.8
(8.28‑15.8)12.9
(8.80‑17.4)
10-day4.79
(4.06‑5.63)5.37
(4.54‑6.31)6.33
(5.34‑7.46)7.14
(6.00‑8.46)8.31
(6.76‑10.1)9.23
(7.33‑11.4)10.2
(7.81‑12.9)11.2
(8.22‑14.5)12.5
(8.85‑16.7)13.5
(9.33‑18.3)
20-day6.50
(5.58‑7.55)7.23
(6.20‑8.40)8.43
(7.20‑9.82)9.44
(8.01‑11.0)10.8
(8.89‑13.0)11.9
(9.55‑14.5)13.0
(10.1‑16.2)14.1
(10.5‑18.1)15.6
(11.1‑20.6)16.7
(11.6‑22.4)
30-day8.01
(6.92‑9.23)8.91
(7.69‑10.3)10.4
(8.92‑12.0)11.6
(9.89‑13.4)13.2
(10.9‑15.8)14.4
(11.7‑17.5)15.7
(12.2‑19.5)16.9
(12.6‑21.6)18.5
(13.3‑24.3)19.7
(13.8‑26.4)
45-day10.0
(8.71‑11.5)11.2
(9.71‑12.8)13.0
(11.3‑15.0)14.5
(12.5‑16.8)16.5
(13.7‑19.5)17.9
(14.6‑21.6)19.4
(15.2‑23.8)20.7
(15.6‑26.3)22.5
(16.2‑29.3)23.7
(16.7‑31.6)
60-day11.8
(10.3‑13.4)13.2
(11.5‑15.1)15.5
(13.5‑17.7)17.2
(14.9‑19.8)19.5
(16.2‑22.9)21.1
(17.2‑25.2)22.7
(17.8‑27.8)24.1
(18.2‑30.4)25.9
(18.8‑33.6)27.1
(19.2‑36.0)
1 Precipitation frequency (PF) estimates in this table are based on frequency analysis of partial duration series (PDS).Numbers in parenthesis are PF estimates at lower and upper bounds of the 90% confidence interval. The probability that precipitation frequencyestimates (for a given duration and average recurrence interval) will be greater than the upper bound (or less than the lower bound) is 5%. Estimates atupper bounds are not checked against probable maximum precipitation (PMP) estimates and may be higher than currently valid PMP values.Please refer to NOAA Atlas 14 document for more information.
Back to Top
Client: Alliant Energy Project: Water and Ash Program Prairie Creek Station Landfill Run-on and Run-off Control System Analysis
Project No-13391-017 Calc No-PCS-C-CCR-001
Attachment 8.2, Rev 0 Page-1 of 1

Interstate Power and Light Company – Prairie Creek Generating Station Inflow Design Flood Control System Plan October 10, 2016
EXHIBIT A
40 CFR Part 112 Cross Reference Wisconsin Power & Light Company Riverside Energy Center Spill Prevention, Control, and Countermeasure (SPCC) Plan
APPENDIX C – Outfall Hydraulic Conditions
Alliant Energy Interstate Power and Light Company Prairie Creek Generating Station Cedar Rapids, Iowa Inflow Design Flood Control System Plan

Prarie Creek Generating Station - Pond # 7
SUMMERGED OUTLET
2 FT = Pipe Diameter Steel
0.5 FT = Hydraulic Radius
2.5499 k in Q outlet control equation
709.4 FT = Pipe Inlet Invert Elevation
36 FT = Length
0.02 = n for MP
0.6 = Co for Inlet Control
713 FT = Tail Water Elevation
6.2832 FT = Weir Width
3.3 = Weir Coefficient
OUTLET CONTROL / BARROW CONTROL
Q Elevation Head
CFS Ft
11.159 713.50 0.5
13.668 713.75 0.8
15.782 714.00 1.0
17.645 714.25 1.3
19.329 714.50 1.5
20.877 714.75 1.8
22.319 715.00 2.0 Weir Equation COMBO
23.673 715.25 2.3 Q = Cw * L * H^1.5
24.953 715.50 2.5
H Q H Q
INLET CONTROL Ft CFS Ft CFS
Q Elevation Head (to pipe middle) 713.5 0.0 713.45 0.0 Inlet
CFS Ft 713.75 3.4 713.75 3.4
26.623 713.50 3.1 714.00 8.5 714.00 8.5
27.675 713.75 3.35 714.25 14.8 714.25 14.8
28.689 714.00 3.6 714.50 22.3 714.50 19.3 Outlet
29.669 714.25 3.85 714.75 30.7 714.75 20.9
30.617 714.50 4.1 715.00 40.0 715.00 22.3
31.536 714.75 4.35 715.25 50.1 715.25 23.7
32.43 715.00 4.6 715.50 60.9 715.50 25.0
33.3 715.25 4.85
34.147 715.50 5.1
713.0
713.5
714.0
714.5
715.0
715.5
716.0
0.0 10.0 20.0 30.0 40.0 50.0 60.0 70.0
Po
nd
Wat
er E
leva
tio
n
Q (CFS)
Weir
Outlet Control
Inlet Control
The two Wier outlet pipes can easily handle high flows even if one pipe is plugged and the outlet submerged (15' + above the flood plain).

Prarie Creek Generating Station - Pond # 8
V-Notch Weir
Q=1.38 * Tan(120/2) * H^2.5 COMBO
Q Elevation Head Q Elevation
CFS Ft Ft CFS Ft
0 711.00 0.0 0.00 711.00
0.422537 711.50 0.5 0.42 711.50
2.39023 712.00 1.0 2.39 712.00
6.5867 712.50 1.5 6.59 712.50
13.52118 713.00 2.0 13.52 713.00
23.3 713.5
46.0 714.0
Broad Crested Weir Equation
Q = Cw * L * H^1.5
H Q
Ft CFS
713.5 9.8
714.00 32.5
2.50 = Cw
13.00 = Length
Broad Crested Weir on top of a wide V-Notch Weir two feet high.

Interstate Power and Light Company – Prairie Creek Generating Station Inflow Design Flood Control System Plan October 10, 2016
EXHIBIT A
40 CFR Part 112 Cross Reference Wisconsin Power & Light Company Riverside Energy Center Spill Prevention, Control, and Countermeasure (SPCC) Plan
APPENDIX D – Hydraulic Analysis
Alliant Energy Interstate Power and Light Company Prairie Creek Generating Station Cedar Rapids, Iowa Inflow Design Flood Control System Plan

HYDRAFLOW MODEL DIAGRAM
Pond 1 (Hyd. No. 3)
Pond 2 & 3 (Hyd. No. 5)
Pond 4 (Hyd. No. 8)
Pond 8 (Hyd. No. 24)
Pond 9 & 10 (Hyd. No. 13)
Pond 5 (Hyd. No. 16)
Pond 6 (Hyd. No. 19)
Pond 7(Hyd. No. 22)

Hydrograph Summary Report Page 1
Hyd. Hydrograph Peak Time Time to Volume Inflow Maximum Maximum Hydrograph
No. type flow interval peak hyd(s) elevation storage description
(origin) (cfs) (min) (min) (acft) (ft) (acft)
1 SCS Runoff 9.99 2 772 2.093 ---- ------ ------ Pond 1 Inflow
2 SCS Runoff 13.36 2 724 0.986 ---- ------ ------ Pond 2 and 3 Inflow
3 Reservoir 9.55 2 782 2.093 1 716.12 0.175 Pond 1 Outflow
4 Combine 15.12 2 724 3.079 2, 3 ------ ------ Ponds 2 and 3 Inflow
5 Reservoir 8.19 2 818 3.006 4 714.73 0.792 Ponds 2 & 3 outflow
6 SCS Runoff 20.06 2 718 1.140 ---- ------ ------ Pond 4 Inflow
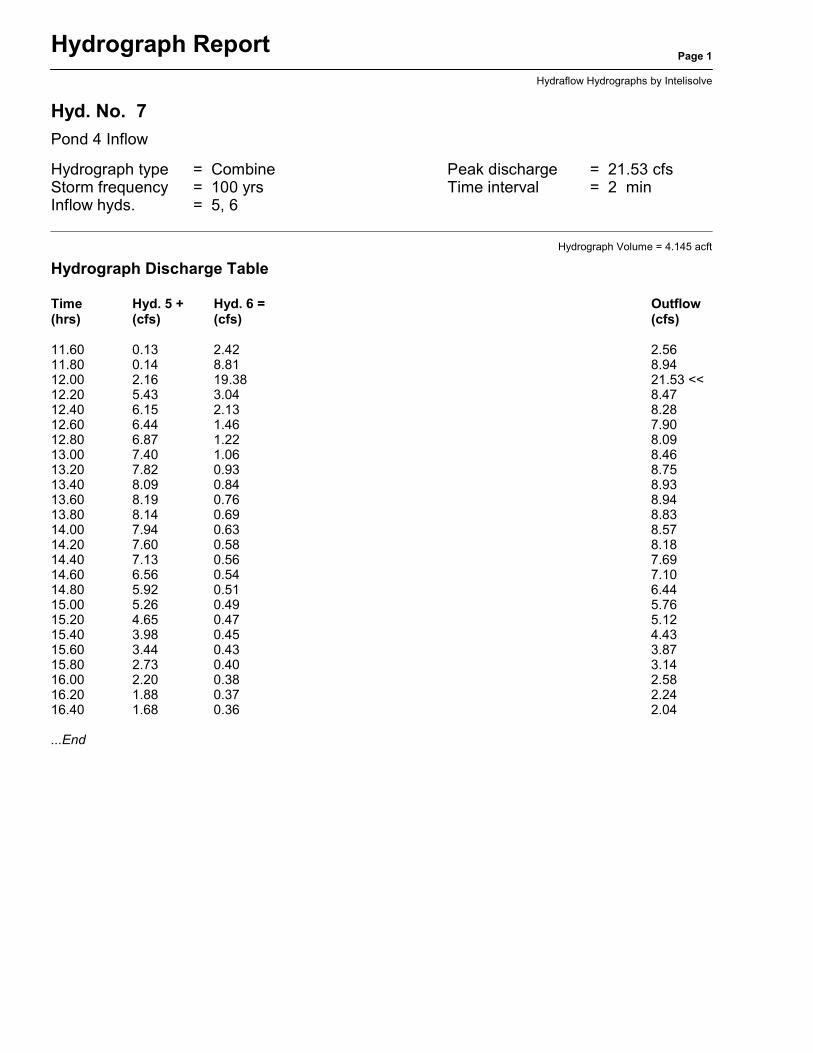
7 Combine 21.53 2 720 4.145 5, 6 ------ ------ Pond 4 Inflow
8 Reservoir 8.53 2 842 4.123 7 714.21 0.689 Pond 4 Outflow
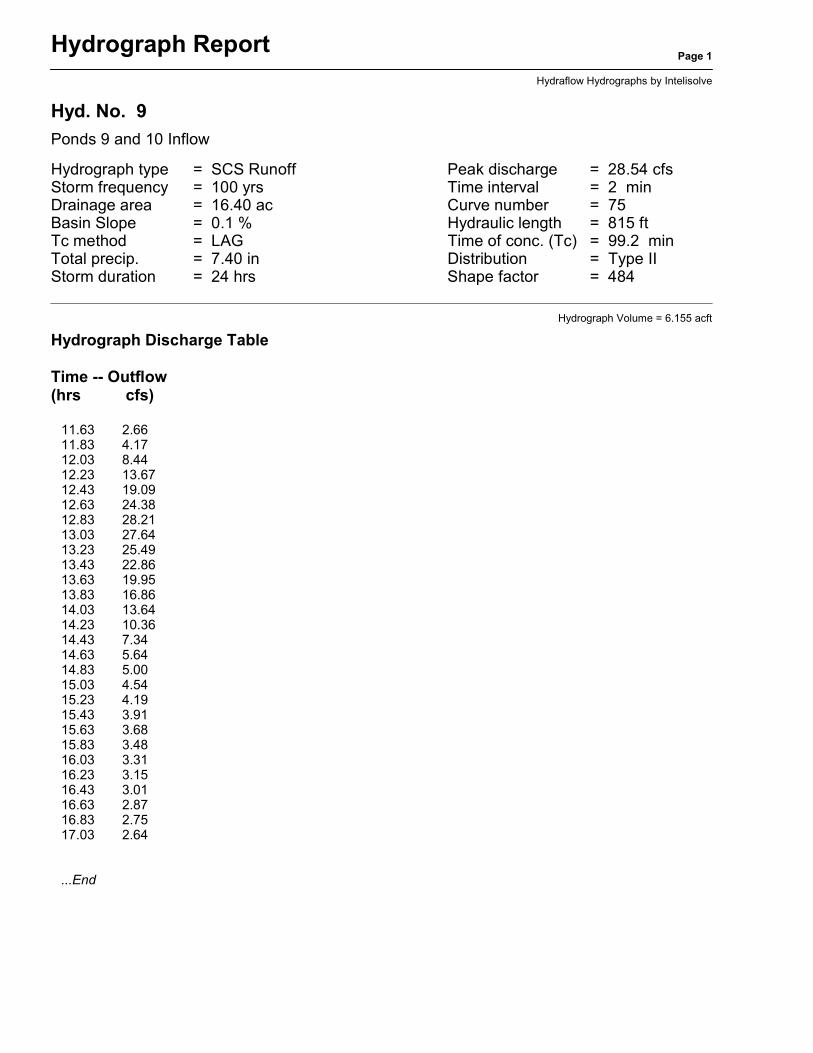
9 SCS Runoff 28.54 2 774 6.155 ---- ------ ------ Ponds 9 and 10 Inflow
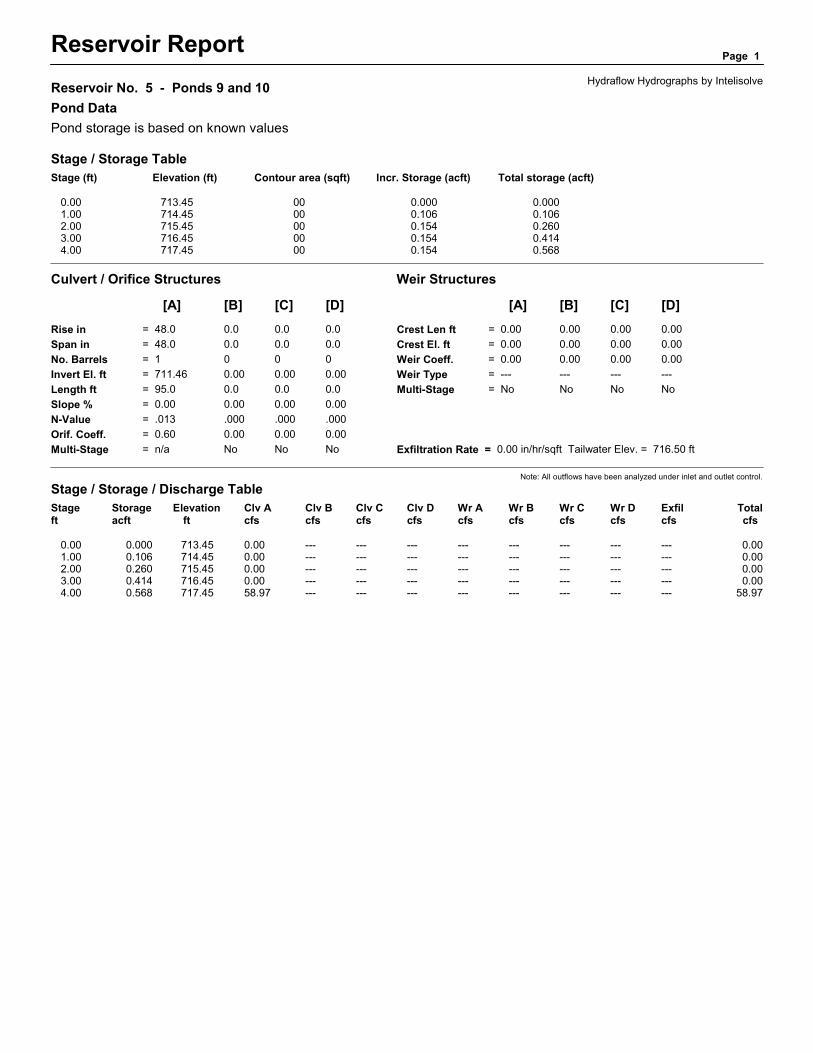
10 Reservoir 28.47 2 776 5.741 9 716.72 0.456 Ponds 9 and 10 Outlfow
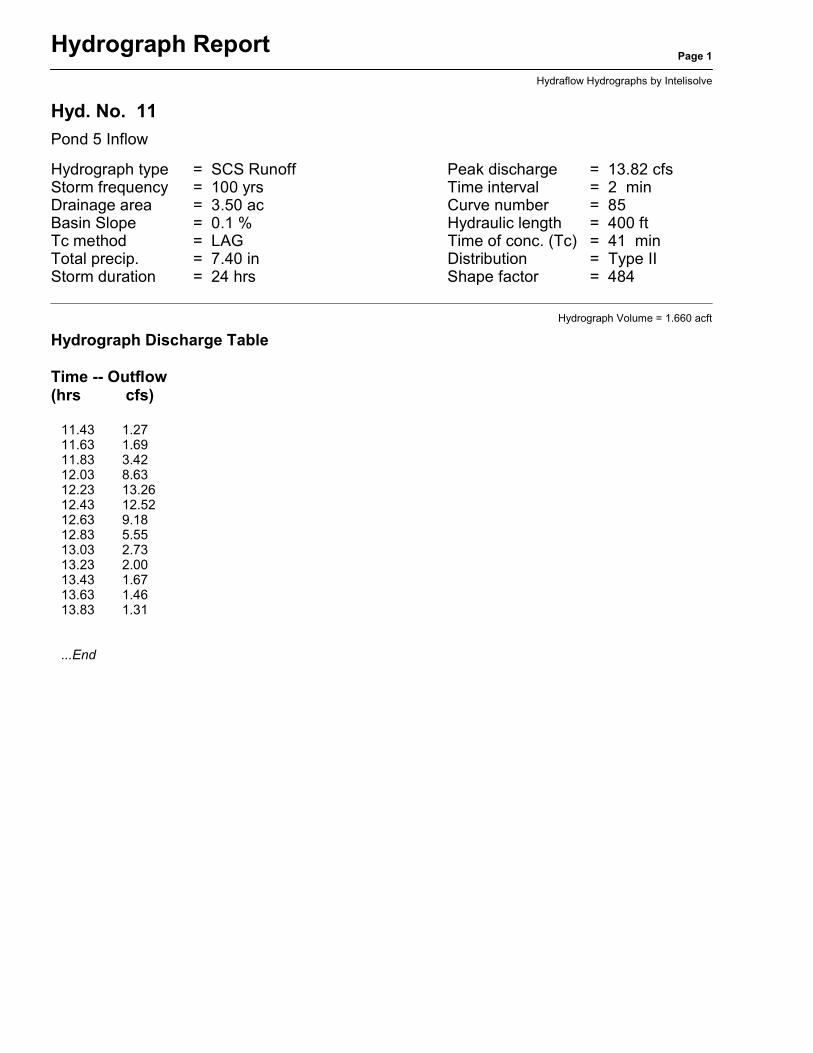
11 SCS Runoff 13.82 2 738 1.660 ---- ------ ------ Pond 5 Inflow
12 Combine 33.47 2 768 7.401 10, 11 ------ ------ Pond 5 Inflow
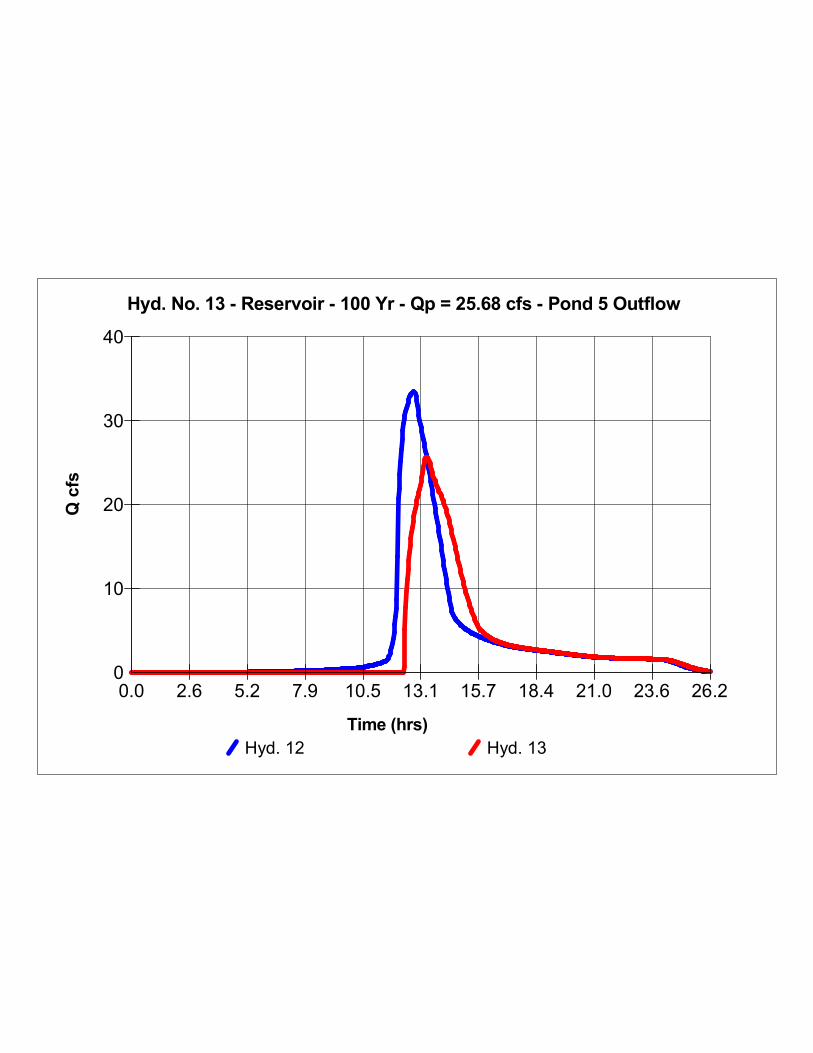
13 Reservoir 25.68 2 802 6.427 12 716.60 2.046 Pond 5 Outflow
14 SCS Runoff 14.32 2 724 1.088 ---- ------ ------ Pond 6 Inflow
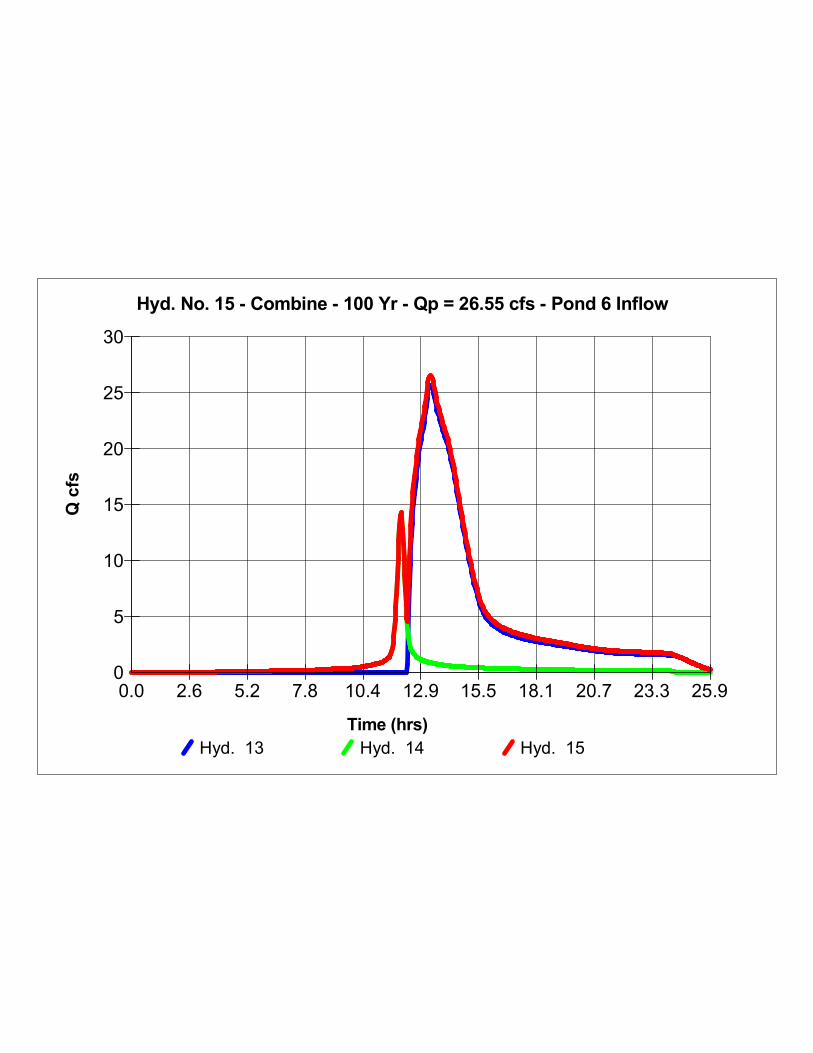
15 Combine 26.55 2 802 7.515 13, 14 ------ ------ Pond 6 Inflow
16 Reservoir 23.75 2 824 7.236 15 715.63 1.215 Pond 6 Outflow
17 SCS Runoff 17.72 2 724 1.347 ---- ------ ------ Pond 7 Inflow
18 Combine 24.64 2 824 8.583 16, 17 ------ ------ Pond 7 Inflow
19 Reservoir 20.18 2 872 8.583 18 714.64 1.162 Pond 7 Outlfow
20 Combine 28.53 2 858 12.705 8, 19 ------ ------ North Ponds + South Ponds
21 Reservoir 28.53 2 860 12.692 20 713.62 0.233 Pond 8 Outflow
Proj. file: Prarie Creek 2016.gpw Return Period: 100 yr Run date: 09-20-2016
Hydraflow Hydrographs by Intelisolve

Hydrograph ReportPage 1
Hydraflow Hydrographs by Intelisolve
Hyd. No. 1
Pond 1 Inflow
Hydrograph type = SCS Runoff Peak discharge = 9.99 cfsStorm frequency = 100 yrs Time interval = 2 minDrainage area = 5.60 ac Curve number = 75Basin Slope = 0.1 % Hydraulic length = 800 ftTc method = LAG Time of conc. (Tc) = 97.8 minTotal precip. = 7.40 in Distribution = Type IIStorm duration = 24 hrs Shape factor = 484
Hydrograph Volume = 2.093 acft
Hydrograph Discharge Table
Time -- Outflow(hrs cfs)
11.63 0.9411.83 1.4812.03 3.0312.23 4.9312.43 6.9012.63 8.7812.83 9.9713.03 9.5313.23 8.7013.43 7.7013.63 6.6213.83 5.4714.03 4.2814.23 3.1114.43 2.1814.63 1.8414.83 1.6515.03 1.5115.23 1.4015.43 1.3115.63 1.2315.83 1.1716.03 1.1116.23 1.0616.43 1.0116.63 0.9716.83 0.92
...End

Hyd. No. 1 - SCS Runoff - 100 Yr - Qp = 9.99 cfs - Pond 1 Inflow
Hyd. 1
Qcfs
Time (hrs)
0
2
4
6
8
10
0.0 2.6 5.1 7.7 10.2 12.8 15.3 17.9 20.5 23.0 25.6

Hydrograph ReportPage 1
Hydraflow Hydrographs by Intelisolve
Hyd. No. 2
Pond 2 and 3 Inflow
Hydrograph type = SCS Runoff Peak discharge = 13.36 cfsStorm frequency = 100 yrs Time interval = 2 minDrainage area = 2.10 ac Curve number = 85Basin Slope = 0.1 % Hydraulic length = 150 ftTc method = LAG Time of conc. (Tc) = 18.7 minTotal precip. = 7.40 in Distribution = Type IIStorm duration = 24 hrs Shape factor = 484
Hydrograph Volume = 0.986 acft
Hydrograph Discharge Table
Time -- Outflow(hrs cfs)
11.57 1.2511.77 3.4311.97 10.8612.17 10.8612.37 3.7112.57 1.8112.77 1.32
...End

Hyd. No. 2 - SCS Runoff - 100 Yr - Qp = 13.36 cfs - Pond 2 and 3 Inflow
Hyd. 2
Qcfs
Time (hrs)
0
5
10
15
0.0 2.4 4.8 7.2 9.7 12.1 14.5 16.9 19.3 21.7 24.1

Hydrograph ReportPage 1
Hydraflow Hydrographs by Intelisolve
Hyd. No. 3
Pond 1 Outflow
Hydrograph type = Reservoir Peak discharge = 9.55 cfsStorm frequency = 100 yrs Time interval = 2 minInflow hyd. No. = 1 Reservoir name = Pond 1Max. Elevation = 716.12 ft Max. Storage = 0.175 acft
Storage Indication method used. Outflow hydrograph volume = 2.093 acft
Hydrograph Discharge Table
Time Inflow Elevation Clv A Clv B Clv C Clv D Wr A Wr B Wr C Wr D Exfil Outflow(hrs) cfs ft cfs cfs cfs cfs cfs cfs cfs cfs cfs cfs
12.00 2.73 715.60 ----- ----- ----- ----- 1.38 ----- ----- ----- ----- 1.3812.20 4.61 715.71 ----- ----- ----- ----- 2.71 ----- ----- ----- ----- 2.7112.40 6.57 715.84 ----- ----- ----- ----- 4.62 ----- ----- ----- ----- 4.6212.60 8.49 715.97 ----- ----- ----- ----- 6.73 ----- ----- ----- ----- 6.7312.80 9.87 716.07 ----- ----- ----- ----- 8.65 ----- ----- ----- ----- 8.6513.00 9.65 716.12 ----- ----- ----- ----- 9.54 ----- ----- ----- ----- 9.5413.20 8.85 716.11 ----- ----- ----- ----- 9.27 ----- ----- ----- ----- 9.2713.40 7.88 716.07 ----- ----- ----- ----- 8.55 ----- ----- ----- ----- 8.5513.60 6.80 716.02 ----- ----- ----- ----- 7.60 ----- ----- ----- ----- 7.6013.80 5.66 715.96 ----- ----- ----- ----- 6.57 ----- ----- ----- ----- 6.5714.00 4.48 715.90 ----- ----- ----- ----- 5.46 ----- ----- ----- ----- 5.4614.20 3.30 715.83 ----- ----- ----- ----- 4.36 ----- ----- ----- ----- 4.3614.40 2.29 715.75 ----- ----- ----- ----- 3.32 ----- ----- ----- ----- 3.3214.60 1.88 715.70 ----- ----- ----- ----- 2.53 ----- ----- ----- ----- 2.5314.80 1.67 715.66 ----- ----- ----- ----- 2.11 ----- ----- ----- ----- 2.1115.00 1.53 715.64 ----- ----- ----- ----- 1.82 ----- ----- ----- ----- 1.8215.20 1.41 715.62 ----- ----- ----- ----- 1.62 ----- ----- ----- ----- 1.6215.40 1.32 715.61 ----- ----- ----- ----- 1.48 ----- ----- ----- ----- 1.4815.60 1.24 715.60 ----- ----- ----- ----- 1.37 ----- ----- ----- ----- 1.3715.80 1.18 715.59 ----- ----- ----- ----- 1.30 ----- ----- ----- ----- 1.3016.00 1.12 715.58 ----- ----- ----- ----- 1.23 ----- ----- ----- ----- 1.2316.20 1.07 715.57 ----- ----- ----- ----- 1.17 ----- ----- ----- ----- 1.1716.40 1.02 715.57 ----- ----- ----- ----- 1.11 ----- ----- ----- ----- 1.1116.60 0.97 715.56 ----- ----- ----- ----- 1.06 ----- ----- ----- ----- 1.0616.80 0.93 715.56 ----- ----- ----- ----- 1.01 ----- ----- ----- ----- 1.0117.00 0.89 715.55 ----- ----- ----- ----- 0.96 ----- ----- ----- ----- 0.9617.20 0.86 715.55 ----- ----- ----- ----- 0.92 ----- ----- ----- ----- 0.9217.40 0.83 715.54 ----- ----- ----- ----- 0.89 ----- ----- ----- ----- 0.89
...End

Reservoir ReportPage 1
Hydraflow Hydrographs by IntelisolveReservoir No. 1 - Pond 1
Pond Data
Pond storage is based on known contour areas. Average end area method used.
Stage / Storage Table
Stage (ft) Elevation (ft) Contour area (sqft) Incr. Storage (acft) Total storage (acft)
0.00 715.40 10,595 0.000 0.0001.00 716.40 10,595 0.243 0.2432.00 717.40 10,595 0.243 0.4863.00 718.40 10,595 0.243 0.7304.00 719.40 10,595 0.243 0.973
Culvert / Orifice Structures Weir Structures
[A] [B] [C] [D] [A] [B] [C] [D]
Rise in = 0.0 0.0 0.0 0.0
Span in = 0.0 0.0 0.0 0.0
No. Barrels = 0 0 0 0
Invert El. ft = 0.00 0.00 0.00 0.00
Length ft = 0.0 0.0 0.0 0.0
Slope % = 0.00 0.00 0.00 0.00
N-Value = .000 .000 .000 .000
Orif. Coeff. = 0.00 0.00 0.00 0.00
Multi-Stage = n/a No No No
Crest Len ft = 6.00 0.00 0.00 0.00
Crest El. ft = 715.40 0.00 0.00 0.00
Weir Coeff. = 2.60 0.00 0.00 0.00
Weir Type = Broad --- --- ---
Multi-Stage = No No No No
Exfiltration Rate = 0.00 in/hr/sqft Tailwater Elev. = 0.00 ft
Note: All outflows have been analyzed under inlet and outlet control.
Stage / Storage / Discharge Table
Stage Storage Elevation Clv A Clv B Clv C Clv D Wr A Wr B Wr C Wr D Exfil Totalft acft ft cfs cfs cfs cfs cfs cfs cfs cfs cfs cfs
0.00 0.000 715.40 --- --- --- --- 0.00 --- --- --- --- 0.001.00 0.243 716.40 --- --- --- --- 15.60 --- --- --- --- 15.602.00 0.486 717.40 --- --- --- --- 44.12 --- --- --- --- 44.123.00 0.730 718.40 --- --- --- --- 81.06 --- --- --- --- 81.064.00 0.973 719.40 --- --- --- --- 124.80 --- --- --- --- 124.80

Hyd. No. 3 - Reservoir - 100 Yr - Qp = 9.55 cfs - Pond 1 Outflow
Hyd. 1 Hyd. 3
Qcfs
Time (hrs)
0
2
4
6
8
10
0.0 2.7 5.3 8.0 10.7 13.4 16.0 18.7 21.4 24.0 26.7

Hydrograph ReportPage 1
Hydraflow Hydrographs by Intelisolve
Hyd. No. 4
Ponds 2 and 3 Inflow
Hydrograph type = Combine Peak discharge = 15.12 cfsStorm frequency = 100 yrs Time interval = 2 minInflow hyds. = 2, 3
Hydrograph Volume = 3.079 acft
Hydrograph Discharge Table
Time Hyd. 2 + Hyd. 3 = Outflow(hrs) (cfs) (cfs) (cfs)
11.40 0.97 0.48 1.4511.60 1.39 0.63 2.0111.80 4.20 0.84 5.0412.00 12.17 1.38 13.5512.20 9.50 2.71 12.2112.40 2.96 4.62 7.5912.60 1.71 6.73 8.4412.80 1.27 8.65 9.9213.00 1.07 9.54 10.6013.20 0.93 9.27 10.2013.40 0.83 8.55 9.3813.60 0.75 7.60 8.3513.80 0.67 6.57 7.2514.00 0.61 5.46 6.0814.20 0.56 4.36 4.9214.40 0.53 3.32 3.8514.60 0.51 2.53 3.0414.80 0.49 2.11 2.6015.00 0.47 1.82 2.2915.20 0.45 1.62 2.0715.40 0.43 1.48 1.9115.60 0.41 1.37 1.7815.80 0.39 1.30 1.6816.00 0.37 1.23 1.5916.20 0.35 1.17 1.5116.40 0.34 1.11 1.4416.60 0.33 1.06 1.38
...End

Hyd. No. 4 - Combine - 100 Yr - Qp = 15.12 cfs - Ponds 2 and 3 Inflow
Hyd. 2 Hyd. 3 Hyd. 4
Qcfs
Time (hrs)
0
5
10
15
20
0.0 2.6 5.2 7.8 10.4 13.0 15.6 18.2 20.8 23.4 26.0

Hydrograph ReportPage 1
Hydraflow Hydrographs by Intelisolve
Hyd. No. 5
Ponds 2 & 3 outflow
Hydrograph type = Reservoir Peak discharge = 8.19 cfsStorm frequency = 100 yrs Time interval = 2 minInflow hyd. No. = 4 Reservoir name = Pond 2 and 3Max. Elevation = 714.73 ft Max. Storage = 0.792 acft
Storage Indication method used. Outflow hydrograph volume = 3.006 acft
Hydrograph Discharge Table
Time Inflow Elevation Clv A Clv B Clv C Clv D Wr A Wr B Wr C Wr D Exfil Outflow(hrs) cfs ft cfs cfs cfs cfs cfs cfs cfs cfs cfs cfs
12.00 13.55 714.16 2.16 ----- ----- ----- ----- ----- ----- ----- ----- 2.1612.20 12.21 714.38 5.43 ----- ----- ----- ----- ----- ----- ----- ----- 5.4312.40 7.59 714.46 6.15 ----- ----- ----- ----- ----- ----- ----- ----- 6.1512.60 8.44 714.49 6.44 ----- ----- ----- ----- ----- ----- ----- ----- 6.4412.80 9.92 714.54 6.87 ----- ----- ----- ----- ----- ----- ----- ----- 6.8713.00 10.60 714.61 7.40 ----- ----- ----- ----- ----- ----- ----- ----- 7.4013.20 10.20 714.67 7.82 ----- ----- ----- ----- ----- ----- ----- ----- 7.8213.40 9.38 714.71 8.09 ----- ----- ----- ----- ----- ----- ----- ----- 8.0913.60 8.35 714.73 8.19 ----- ----- ----- ----- ----- ----- ----- ----- 8.1913.80 7.25 714.72 8.14 ----- ----- ----- ----- ----- ----- ----- ----- 8.1414.00 6.08 714.69 7.94 ----- ----- ----- ----- ----- ----- ----- ----- 7.9414.20 4.92 714.64 7.60 ----- ----- ----- ----- ----- ----- ----- ----- 7.6014.40 3.85 714.58 7.13 ----- ----- ----- ----- ----- ----- ----- ----- 7.1314.60 3.04 714.50 6.56 ----- ----- ----- ----- ----- ----- ----- ----- 6.5614.80 2.60 714.43 5.92 ----- ----- ----- ----- ----- ----- ----- ----- 5.9215.00 2.29 714.36 5.26 ----- ----- ----- ----- ----- ----- ----- ----- 5.2615.20 2.07 714.30 4.65 ----- ----- ----- ----- ----- ----- ----- ----- 4.6515.40 1.91 714.25 3.98 ----- ----- ----- ----- ----- ----- ----- ----- 3.9815.60 1.78 714.21 3.44 ----- ----- ----- ----- ----- ----- ----- ----- 3.4415.80 1.68 714.18 2.73 ----- ----- ----- ----- ----- ----- ----- ----- 2.7316.00 1.59 714.17 2.20 ----- ----- ----- ----- ----- ----- ----- ----- 2.2016.20 1.51 714.16 1.88 ----- ----- ----- ----- ----- ----- ----- ----- 1.8816.40 1.44 714.15 1.68 ----- ----- ----- ----- ----- ----- ----- ----- 1.6816.60 1.38 714.15 1.55 ----- ----- ----- ----- ----- ----- ----- ----- 1.5516.80 1.33 714.14 1.45 ----- ----- ----- ----- ----- ----- ----- ----- 1.4517.00 1.28 714.14 1.38 ----- ----- ----- ----- ----- ----- ----- ----- 1.3817.20 1.23 714.14 1.32 ----- ----- ----- ----- ----- ----- ----- ----- 1.3217.40 1.19 714.14 1.26 ----- ----- ----- ----- ----- ----- ----- ----- 1.2617.60 1.15 714.13 1.21 ----- ----- ----- ----- ----- ----- ----- ----- 1.2117.80 1.11 714.13 1.17 ----- ----- ----- ----- ----- ----- ----- ----- 1.1718.00 1.08 714.13 1.13 ----- ----- ----- ----- ----- ----- ----- ----- 1.1318.20 1.05 714.13 1.10 ----- ----- ----- ----- ----- ----- ----- ----- 1.1018.40 1.02 714.13 1.06 ----- ----- ----- ----- ----- ----- ----- ----- 1.0618.60 0.99 714.13 1.04 ----- ----- ----- ----- ----- ----- ----- ----- 1.0318.80 0.97 714.13 1.01 ----- ----- ----- ----- ----- ----- ----- ----- 1.0119.00 0.94 714.13 0.98 ----- ----- ----- ----- ----- ----- ----- ----- 0.9819.20 0.91 714.13 0.95 ----- ----- ----- ----- ----- ----- ----- ----- 0.9519.40 0.89 714.13 0.93 ----- ----- ----- ----- ----- ----- ----- ----- 0.93
Continues on next page...

Ponds 2 & 3 outflow Page 2
Hydrograph Discharge Table
Time Inflow Elevation Clv A Clv B Clv C Clv D Wr A Wr B Wr C Wr D Exfil Outflow(hrs) cfs ft cfs cfs cfs cfs cfs cfs cfs cfs cfs cfs
19.60 0.86 714.12 0.90 ----- ----- ----- ----- ----- ----- ----- ----- 0.9019.80 0.84 714.12 0.88 ----- ----- ----- ----- ----- ----- ----- ----- 0.8820.00 0.81 714.12 0.85 ----- ----- ----- ----- ----- ----- ----- ----- 0.8520.20 0.79 714.12 0.83 ----- ----- ----- ----- ----- ----- ----- ----- 0.8320.40 0.77 714.12 0.80 ----- ----- ----- ----- ----- ----- ----- ----- 0.8020.60 0.75 714.12 0.78 ----- ----- ----- ----- ----- ----- ----- ----- 0.7820.80 0.73 714.12 0.76 ----- ----- ----- ----- ----- ----- ----- ----- 0.7621.00 0.72 714.12 0.74 ----- ----- ----- ----- ----- ----- ----- ----- 0.74
...End

Reservoir ReportPage 1
Hydraflow Hydrographs by IntelisolveReservoir No. 2 - Pond 2 and 3
Pond Data
Pond storage is based on known contour areas. Average end area method used.
Stage / Storage Table
Stage (ft) Elevation (ft) Contour area (sqft) Incr. Storage (acft) Total storage (acft)
0.00 713.70 33,536 0.000 0.0001.00 714.70 33,536 0.770 0.7702.00 715.70 33,536 0.770 1.540
Culvert / Orifice Structures Weir Structures
[A] [B] [C] [D] [A] [B] [C] [D]
Rise in = 18.0 0.0 0.0 0.0
Span in = 18.0 0.0 0.0 0.0
No. Barrels = 1 0 0 0
Invert El. ft = 712.60 0.00 0.00 0.00
Length ft = 16.0 0.0 0.0 0.0
Slope % = 0.00 0.00 0.00 0.00
N-Value = .015 .000 .000 .000
Orif. Coeff. = 0.86 0.00 0.00 0.00
Multi-Stage = n/a No No No
Crest Len ft = 33.00 0.00 0.00 0.00
Crest El. ft = 715.50 0.00 0.00 0.00
Weir Coeff. = 2.60 0.00 0.00 0.00
Weir Type = Broad --- --- ---
Multi-Stage = No No No No
Exfiltration Rate = 0.00 in/hr/sqft Tailwater Elev. = 713.71 ft
Note: All outflows have been analyzed under inlet and outlet control.
Stage / Storage / Discharge Table
Stage Storage Elevation Clv A Clv B Clv C Clv D Wr A Wr B Wr C Wr D Exfil Totalft acft ft cfs cfs cfs cfs cfs cfs cfs cfs cfs cfs
0.00 0.000 713.70 0.00 --- --- --- 0.00 --- --- --- --- 0.001.00 0.770 714.70 8.00 --- --- --- 0.00 --- --- --- --- 8.002.00 1.540 715.70 13.07 --- --- --- 7.67 --- --- --- --- 20.74

Hyd. No. 5 - Reservoir - 100 Yr - Qp = 8.19 cfs - Ponds 2 & 3 outflow
Hyd. 4 Hyd. 5
Qcfs
Time (hrs)
0
5
10
15
20
0.0 4.8 9.6 14.4 19.2 24.0 28.8 33.6 38.4 43.2 48.0

Hydrograph ReportPage 1
Hydraflow Hydrographs by Intelisolve
Hyd. No. 6
Pond 4 Inflow
Hydrograph type = SCS Runoff Peak discharge = 20.06 cfsStorm frequency = 100 yrs Time interval = 2 minDrainage area = 2.20 ac Curve number = 90Basin Slope = 0.1 % Hydraulic length = 60 ftTc method = LAG Time of conc. (Tc) = 7.4 minTotal precip. = 7.40 in Distribution = Type IIStorm duration = 24 hrs Shape factor = 484
Hydrograph Volume = 1.140 acft
Hydrograph Discharge Table
Time -- Outflow(hrs cfs)
11.57 1.9311.77 7.3811.97 20.06 <<12.17 3.9312.37 2.25
...End

Hyd. No. 6 - SCS Runoff - 100 Yr - Qp = 20.06 cfs - Pond 4 Inflow
Hyd. 6
Qcfs
Time (hrs)
0
5
10
15
20
25
0.0 2.1 4.2 6.4 8.5 10.6 12.7 14.8 17.0 19.1 21.2
Hydrograph ReportPage 1
Hydraflow Hydrographs by Intelisolve
Hyd. No. 7
Pond 4 Inflow
Hydrograph type = Combine Peak discharge = 21.53 cfsStorm frequency = 100 yrs Time interval = 2 minInflow hyds. = 5, 6
Hydrograph Volume = 4.145 acft
Hydrograph Discharge Table
Time Hyd. 5 + Hyd. 6 = Outflow(hrs) (cfs) (cfs) (cfs)
11.60 0.13 2.42 2.5611.80 0.14 8.81 8.9412.00 2.16 19.38 21.53 <<12.20 5.43 3.04 8.4712.40 6.15 2.13 8.2812.60 6.44 1.46 7.9012.80 6.87 1.22 8.0913.00 7.40 1.06 8.4613.20 7.82 0.93 8.7513.40 8.09 0.84 8.9313.60 8.19 0.76 8.9413.80 8.14 0.69 8.8314.00 7.94 0.63 8.5714.20 7.60 0.58 8.1814.40 7.13 0.56 7.6914.60 6.56 0.54 7.1014.80 5.92 0.51 6.4415.00 5.26 0.49 5.7615.20 4.65 0.47 5.1215.40 3.98 0.45 4.4315.60 3.44 0.43 3.8715.80 2.73 0.40 3.1416.00 2.20 0.38 2.5816.20 1.88 0.37 2.2416.40 1.68 0.36 2.04
...End

Hyd. No. 7 - Combine - 100 Yr - Qp = 21.53 cfs - Pond 4 Inflow
Hyd. 5 Hyd. 6 Hyd. 7
Qcfs
Time (hrs)
0
5
10
15
20
25
0.0 2.6 5.2 7.8 10.4 13.0 15.6 18.2 20.8 23.4 26.0

Hydrograph ReportPage 1
Hydraflow Hydrographs by Intelisolve
Hyd. No. 8
Pond 4 Outflow
Hydrograph type = Reservoir Peak discharge = 8.53 cfsStorm frequency = 100 yrs Time interval = 2 minInflow hyd. No. = 7 Reservoir name = Pond 4Max. Elevation = 714.21 ft Max. Storage = 0.689 acft
Storage Indication method used. Outflow hydrograph volume = 4.123 acft
Hydrograph Discharge Table
Time Inflow Elevation Clv A Clv B Clv C Clv D Wr A Wr B Wr C Wr D Exfil Outflow(hrs) cfs ft cfs cfs cfs cfs cfs cfs cfs cfs cfs cfs
11.80 8.94 713.85 ----- ----- ----- ----- 1.40 ----- ----- ----- ----- 1.4012.00 21.53 << 714.01 ----- ----- ----- ----- 4.08 ----- ----- ----- ----- 4.0812.20 8.47 714.11 ----- ----- ----- ----- 6.27 ----- ----- ----- ----- 6.2712.40 8.28 714.14 ----- ----- ----- ----- 6.80 ----- ----- ----- ----- 6.8012.60 7.90 714.15 ----- ----- ----- ----- 7.12 ----- ----- ----- ----- 7.1212.80 8.09 714.16 ----- ----- ----- ----- 7.33 ----- ----- ----- ----- 7.3313.00 8.46 714.17 ----- ----- ----- ----- 7.57 ----- ----- ----- ----- 7.5713.20 8.75 714.18 ----- ----- ----- ----- 7.83 ----- ----- ----- ----- 7.8313.40 8.93 714.19 ----- ----- ----- ----- 8.09 ----- ----- ----- ----- 8.0913.60 8.94 714.20 ----- ----- ----- ----- 8.31 ----- ----- ----- ----- 8.3113.80 8.83 714.21 ----- ----- ----- ----- 8.46 ----- ----- ----- ----- 8.4614.00 8.57 714.21 << ----- ----- ----- ----- 8.53 ----- ----- ----- ----- 8.5314.20 8.18 714.21 ----- ----- ----- ----- 8.49 ----- ----- ----- ----- 8.4914.40 7.69 714.20 ----- ----- ----- ----- 8.34 ----- ----- ----- ----- 8.3414.60 7.10 714.19 ----- ----- ----- ----- 8.10 ----- ----- ----- ----- 8.1014.80 6.44 714.18 ----- ----- ----- ----- 7.76 ----- ----- ----- ----- 7.7615.00 5.76 714.16 ----- ----- ----- ----- 7.34 ----- ----- ----- ----- 7.3415.20 5.12 714.14 ----- ----- ----- ----- 6.86 ----- ----- ----- ----- 6.8615.40 4.43 714.12 ----- ----- ----- ----- 6.33 ----- ----- ----- ----- 6.3315.60 3.87 714.09 ----- ----- ----- ----- 5.80 ----- ----- ----- ----- 5.8015.80 3.14 714.07 ----- ----- ----- ----- 5.29 ----- ----- ----- ----- 5.2916.00 2.58 714.04 ----- ----- ----- ----- 4.73 ----- ----- ----- ----- 4.7316.20 2.24 714.02 ----- ----- ----- ----- 4.21 ----- ----- ----- ----- 4.2116.40 2.04 713.99 ----- ----- ----- ----- 3.76 ----- ----- ----- ----- 3.7616.60 1.90 713.97 ----- ----- ----- ----- 3.41 ----- ----- ----- ----- 3.4116.80 1.79 713.96 ----- ----- ----- ----- 3.11 ----- ----- ----- ----- 3.1117.00 1.71 713.94 ----- ----- ----- ----- 2.85 ----- ----- ----- ----- 2.8517.20 1.64 713.93 ----- ----- ----- ----- 2.62 ----- ----- ----- ----- 2.6217.40 1.58 713.92 ----- ----- ----- ----- 2.42 ----- ----- ----- ----- 2.4217.60 1.52 713.91 ----- ----- ----- ----- 2.25 ----- ----- ----- ----- 2.2517.80 1.47 713.90 ----- ----- ----- ----- 2.11 ----- ----- ----- ----- 2.1118.00 1.43 713.89 ----- ----- ----- ----- 2.01 ----- ----- ----- ----- 2.0118.20 1.38 713.89 ----- ----- ----- ----- 1.91 ----- ----- ----- ----- 1.9118.40 1.34 713.88 ----- ----- ----- ----- 1.83 ----- ----- ----- ----- 1.8318.60 1.30 713.87 ----- ----- ----- ----- 1.75 ----- ----- ----- ----- 1.7518.80 1.27 713.87 ----- ----- ----- ----- 1.68 ----- ----- ----- ----- 1.6819.00 1.23 713.86 ----- ----- ----- ----- 1.61 ----- ----- ----- ----- 1.6219.20 1.20 713.86 ----- ----- ----- ----- 1.55 ----- ----- ----- ----- 1.55
Continues on next page...

Pond 4 Outflow Page 2
Hydrograph Discharge Table
Time Inflow Elevation Clv A Clv B Clv C Clv D Wr A Wr B Wr C Wr D Exfil Outflow(hrs) cfs ft cfs cfs cfs cfs cfs cfs cfs cfs cfs cfs
19.40 1.17 713.86 ----- ----- ----- ----- 1.50 ----- ----- ----- ----- 1.5019.60 1.13 713.85 ----- ----- ----- ----- 1.44 ----- ----- ----- ----- 1.4419.80 1.10 713.85 ----- ----- ----- ----- 1.39 ----- ----- ----- ----- 1.3920.00 1.07 713.84 ----- ----- ----- ----- 1.35 ----- ----- ----- ----- 1.3520.20 1.03 713.84 ----- ----- ----- ----- 1.30 ----- ----- ----- ----- 1.3020.40 1.01 713.84 ----- ----- ----- ----- 1.26 ----- ----- ----- ----- 1.2620.60 0.99 713.83 ----- ----- ----- ----- 1.22 ----- ----- ----- ----- 1.2220.80 0.96 713.83 ----- ----- ----- ----- 1.18 ----- ----- ----- ----- 1.1821.00 0.94 713.83 ----- ----- ----- ----- 1.15 ----- ----- ----- ----- 1.1521.20 0.93 713.83 ----- ----- ----- ----- 1.11 ----- ----- ----- ----- 1.1121.40 0.91 713.82 ----- ----- ----- ----- 1.08 ----- ----- ----- ----- 1.0821.60 0.89 713.82 ----- ----- ----- ----- 1.06 ----- ----- ----- ----- 1.0621.80 0.88 713.82 ----- ----- ----- ----- 1.03 ----- ----- ----- ----- 1.0322.00 0.87 713.82 ----- ----- ----- ----- 1.01 ----- ----- ----- ----- 1.0122.20 0.86 713.82 ----- ----- ----- ----- 0.98 ----- ----- ----- ----- 0.9822.40 0.85 713.82 ----- ----- ----- ----- 0.96 ----- ----- ----- ----- 0.9622.60 0.84 713.81 ----- ----- ----- ----- 0.95 ----- ----- ----- ----- 0.9522.80 0.83 713.81 ----- ----- ----- ----- 0.93 ----- ----- ----- ----- 0.9323.00 0.83 713.81 ----- ----- ----- ----- 0.91 ----- ----- ----- ----- 0.9123.20 0.82 713.81 ----- ----- ----- ----- 0.90 ----- ----- ----- ----- 0.9023.40 0.81 713.81 ----- ----- ----- ----- 0.89 ----- ----- ----- ----- 0.8923.60 0.81 713.81 ----- ----- ----- ----- 0.88 ----- ----- ----- ----- 0.8823.80 0.80 713.81 ----- ----- ----- ----- 0.86 ----- ----- ----- ----- 0.8624.00 0.79 713.81 ----- ----- ----- ----- 0.85 ----- ----- ----- ----- 0.8524.20 0.60 713.81 ----- ----- ----- ----- 0.83 ----- ----- ----- ----- 0.8324.40 0.53 713.80 ----- ----- ----- ----- 0.79 ----- ----- ----- ----- 0.79
...End

Reservoir ReportPage 1
Hydraflow Hydrographs by IntelisolveReservoir No. 3 - Pond 4
Pond Data
Pond storage is based on known contour areas. Average end area method used.
Stage / Storage Table
Stage (ft) Elevation (ft) Contour area (sqft) Incr. Storage (acft) Total storage (acft)
0.00 713.70 59,078 0.000 0.0001.00 714.70 59,078 1.356 1.3562.00 715.70 59,078 1.356 2.712
Culvert / Orifice Structures Weir Structures
[A] [B] [C] [D] [A] [B] [C] [D]
Rise in = 0.0 0.0 0.0 0.0
Span in = 0.0 0.0 0.0 0.0
No. Barrels = 0 0 0 0
Invert El. ft = 0.00 0.00 0.00 0.00
Length ft = 0.0 0.0 0.0 0.0
Slope % = 0.00 0.00 0.00 0.00
N-Value = .000 .000 .000 .000
Orif. Coeff. = 0.00 0.00 0.00 0.00
Multi-Stage = n/a No No No
Crest Len ft = 7.85 0.00 0.00 0.00
Crest El. ft = 713.70 0.00 0.00 0.00
Weir Coeff. = 3.00 0.00 0.00 0.00
Weir Type = Riser --- --- ---
Multi-Stage = No No No No
Exfiltration Rate = 0.00 in/hr/sqft Tailwater Elev. = 0.00 ft
Note: All outflows have been analyzed under inlet and outlet control.
Stage / Storage / Discharge Table
Stage Storage Elevation Clv A Clv B Clv C Clv D Wr A Wr B Wr C Wr D Exfil Totalft acft ft cfs cfs cfs cfs cfs cfs cfs cfs cfs cfs
0.00 0.000 713.70 --- --- --- --- 0.00 --- --- --- --- 0.001.00 1.356 714.70 --- --- --- --- 23.55 --- --- --- --- 23.552.00 2.712 715.70 --- --- --- --- 66.61 --- --- --- --- 66.61

Hyd. No. 8 - Reservoir - 100 Yr - Qp = 8.53 cfs - Pond 4 Outflow
Hyd. 7 Hyd. 8
Qcfs
Time (hrs)
0
5
10
15
20
25
0.0 4.8 9.6 14.4 19.2 24.0 28.8 33.6 38.4 43.2 48.0
Hydrograph ReportPage 1
Hydraflow Hydrographs by Intelisolve
Hyd. No. 9
Ponds 9 and 10 Inflow
Hydrograph type = SCS Runoff Peak discharge = 28.54 cfsStorm frequency = 100 yrs Time interval = 2 minDrainage area = 16.40 ac Curve number = 75Basin Slope = 0.1 % Hydraulic length = 815 ftTc method = LAG Time of conc. (Tc) = 99.2 minTotal precip. = 7.40 in Distribution = Type IIStorm duration = 24 hrs Shape factor = 484
Hydrograph Volume = 6.155 acft
Hydrograph Discharge Table
Time -- Outflow(hrs cfs)
11.63 2.6611.83 4.1712.03 8.4412.23 13.6712.43 19.0912.63 24.3812.83 28.2113.03 27.6413.23 25.4913.43 22.8613.63 19.9513.83 16.8614.03 13.6414.23 10.3614.43 7.3414.63 5.6414.83 5.0015.03 4.5415.23 4.1915.43 3.9115.63 3.6815.83 3.4816.03 3.3116.23 3.1516.43 3.0116.63 2.8716.83 2.7517.03 2.64
...End
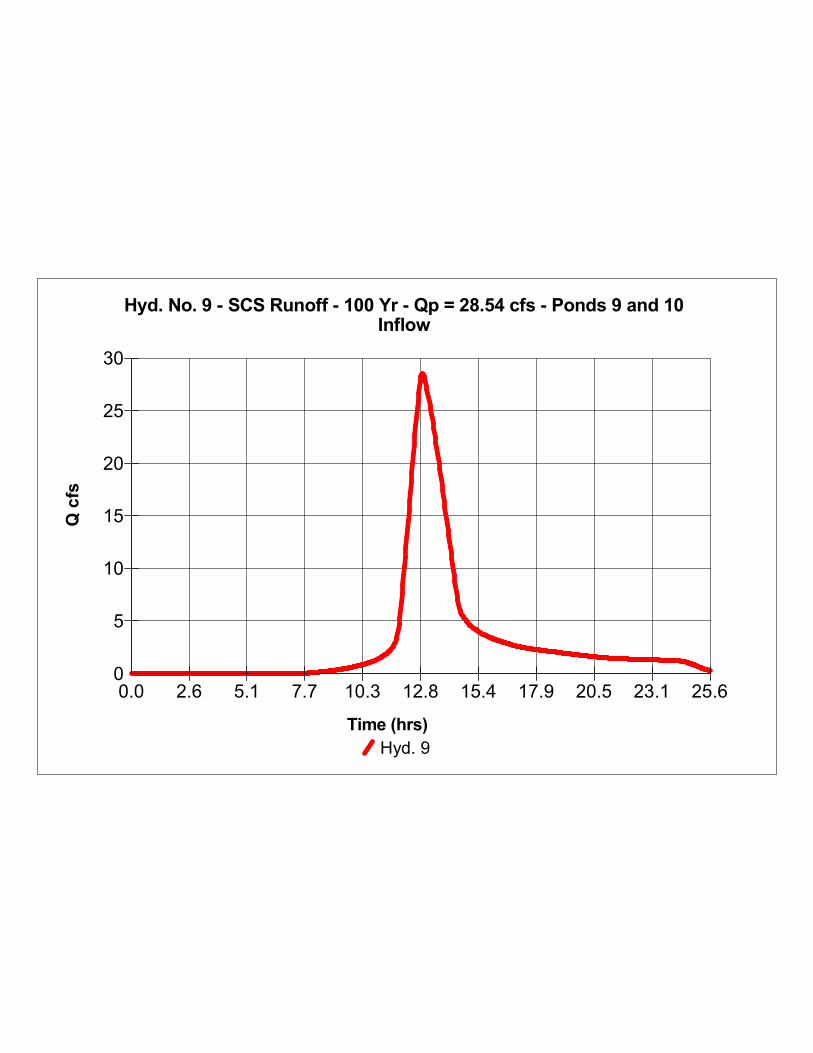
Hyd. No. 9 - SCS Runoff - 100 Yr - Qp = 28.54 cfs - Ponds 9 and 10Inflow
Hyd. 9
Qcfs
Time (hrs)
0
5
10
15
20
25
30
0.0 2.6 5.1 7.7 10.3 12.8 15.4 17.9 20.5 23.1 25.6

Hydrograph ReportPage 1
Hydraflow Hydrographs by Intelisolve
Hyd. No. 10
Ponds 9 and 10 Outlfow
Hydrograph type = Reservoir Peak discharge = 28.47 cfsStorm frequency = 100 yrs Time interval = 2 minInflow hyd. No. = 9 Reservoir name = Ponds 9 and 10Max. Elevation = 716.72 ft Max. Storage = 0.456 acft
Storage Indication method used. Outflow hydrograph volume = 5.741 acft
Hydrograph Discharge Table
Time Inflow Elevation Clv A Clv B Clv C Clv D Wr A Wr B Wr C Wr D Exfil Outflow(hrs) cfs ft cfs cfs cfs cfs cfs cfs cfs cfs cfs cfs
12.20 12.78 716.54 12.41 ----- ----- ----- ----- ----- ----- ----- ----- 12.4112.40 18.18 716.59 17.67 ----- ----- ----- ----- ----- ----- ----- ----- 17.6712.60 23.55 716.65 23.05 ----- ----- ----- ----- ----- ----- ----- ----- 23.0612.80 27.80 716.71 27.34 ----- ----- ----- ----- ----- ----- ----- ----- 27.3413.00 27.93 716.72 28.14 ----- ----- ----- ----- ----- ----- ----- ----- 28.1413.20 25.89 716.69 26.20 ----- ----- ----- ----- ----- ----- ----- ----- 26.2013.40 23.33 716.65 23.69 ----- ----- ----- ----- ----- ----- ----- ----- 23.7013.60 20.45 716.62 20.73 ----- ----- ----- ----- ----- ----- ----- ----- 20.7313.80 17.38 716.59 17.68 ----- ----- ----- ----- ----- ----- ----- ----- 17.6814.00 14.18 716.56 14.48 ----- ----- ----- ----- ----- ----- ----- ----- 14.4814.20 10.90 716.53 11.13 ----- ----- ----- ----- ----- ----- ----- ----- 11.1314.40 7.80 716.51 7.99 ----- ----- ----- ----- ----- ----- ----- ----- 7.9914.60 5.79 716.49 5.86 ----- ----- ----- ----- ----- ----- ----- ----- 5.8614.80 5.09 716.49 5.13 ----- ----- ----- ----- ----- ----- ----- ----- 5.1315.00 4.60 716.48 4.63 ----- ----- ----- ----- ----- ----- ----- ----- 4.6315.20 4.24 716.48 4.27 ----- ----- ----- ----- ----- ----- ----- ----- 4.2715.40 3.96 716.48 3.97 ----- ----- ----- ----- ----- ----- ----- ----- 3.9715.60 3.72 716.48 3.73 ----- ----- ----- ----- ----- ----- ----- ----- 3.7315.80 3.51 716.48 3.53 ----- ----- ----- ----- ----- ----- ----- ----- 3.5316.00 3.34 716.47 3.34 ----- ----- ----- ----- ----- ----- ----- ----- 3.3516.20 3.18 716.47 3.19 ----- ----- ----- ----- ----- ----- ----- ----- 3.1916.40 3.03 716.47 3.04 ----- ----- ----- ----- ----- ----- ----- ----- 3.0416.60 2.89 716.47 2.91 ----- ----- ----- ----- ----- ----- ----- ----- 2.9016.80 2.77 716.47 2.77 ----- ----- ----- ----- ----- ----- ----- ----- 2.7817.00 2.65 716.47 2.66 ----- ----- ----- ----- ----- ----- ----- ----- 2.66
...End
Reservoir ReportPage 1
Hydraflow Hydrographs by IntelisolveReservoir No. 5 - Ponds 9 and 10
Pond Data
Pond storage is based on known values
Stage / Storage Table
Stage (ft) Elevation (ft) Contour area (sqft) Incr. Storage (acft) Total storage (acft)
0.00 713.45 00 0.000 0.0001.00 714.45 00 0.106 0.1062.00 715.45 00 0.154 0.2603.00 716.45 00 0.154 0.4144.00 717.45 00 0.154 0.568
Culvert / Orifice Structures Weir Structures
[A] [B] [C] [D] [A] [B] [C] [D]
Rise in = 48.0 0.0 0.0 0.0
Span in = 48.0 0.0 0.0 0.0
No. Barrels = 1 0 0 0
Invert El. ft = 711.46 0.00 0.00 0.00
Length ft = 95.0 0.0 0.0 0.0
Slope % = 0.00 0.00 0.00 0.00
N-Value = .013 .000 .000 .000
Orif. Coeff. = 0.60 0.00 0.00 0.00
Multi-Stage = n/a No No No
Crest Len ft = 0.00 0.00 0.00 0.00
Crest El. ft = 0.00 0.00 0.00 0.00
Weir Coeff. = 0.00 0.00 0.00 0.00
Weir Type = --- --- --- ---
Multi-Stage = No No No No
Exfiltration Rate = 0.00 in/hr/sqft Tailwater Elev. = 716.50 ft
Note: All outflows have been analyzed under inlet and outlet control.
Stage / Storage / Discharge Table
Stage Storage Elevation Clv A Clv B Clv C Clv D Wr A Wr B Wr C Wr D Exfil Totalft acft ft cfs cfs cfs cfs cfs cfs cfs cfs cfs cfs
0.00 0.000 713.45 0.00 --- --- --- --- --- --- --- --- 0.001.00 0.106 714.45 0.00 --- --- --- --- --- --- --- --- 0.002.00 0.260 715.45 0.00 --- --- --- --- --- --- --- --- 0.003.00 0.414 716.45 0.00 --- --- --- --- --- --- --- --- 0.004.00 0.568 717.45 58.97 --- --- --- --- --- --- --- --- 58.97

Hyd. No. 10 - Reservoir - 100 Yr - Qp = 28.47 cfs - Ponds 9 and 10Outlfow
Hyd. 9 Hyd. 10
Qcfs
Time (hrs)
0
5
10
15
20
25
30
0.0 2.6 5.2 7.8 10.4 13.0 15.6 18.2 20.8 23.4 26.0
Hydrograph ReportPage 1
Hydraflow Hydrographs by Intelisolve
Hyd. No. 11
Pond 5 Inflow
Hydrograph type = SCS Runoff Peak discharge = 13.82 cfsStorm frequency = 100 yrs Time interval = 2 minDrainage area = 3.50 ac Curve number = 85Basin Slope = 0.1 % Hydraulic length = 400 ftTc method = LAG Time of conc. (Tc) = 41 minTotal precip. = 7.40 in Distribution = Type IIStorm duration = 24 hrs Shape factor = 484
Hydrograph Volume = 1.660 acft
Hydrograph Discharge Table
Time -- Outflow(hrs cfs)
11.43 1.2711.63 1.6911.83 3.4212.03 8.6312.23 13.2612.43 12.5212.63 9.1812.83 5.5513.03 2.7313.23 2.0013.43 1.6713.63 1.4613.83 1.31
...End

Hyd. No. 11 - SCS Runoff - 100 Yr - Qp = 13.82 cfs - Pond 5 Inflow
Hyd. 11
Qcfs
Time (hrs)
0
5
10
15
0.0 2.5 4.9 7.4 9.8 12.3 14.7 17.2 19.6 22.1 24.5

Hydrograph ReportPage 1
Hydraflow Hydrographs by Intelisolve
Hyd. No. 12
Pond 5 Inflow
Hydrograph type = Combine Peak discharge = 33.47 cfsStorm frequency = 100 yrs Time interval = 2 minInflow hyds. = 10, 11
Hydrograph Volume = 7.401 acft
Hydrograph Discharge Table
Time Hyd. 10 + Hyd. 11 = Outflow(hrs) (cfs) (cfs) (cfs)
12.00 0.00 7.66 7.6612.20 12.41 12.72 25.1412.40 17.67 13.01 30.6812.60 23.06 9.77 32.8312.80 27.34 6.14 33.47 <<13.00 28.14 3.06 31.2013.20 26.20 2.07 28.2613.40 23.70 1.71 25.4113.60 20.73 1.49 22.2213.80 17.68 1.33 19.0114.00 14.48 1.20 15.6814.20 11.13 1.09 12.2114.40 7.99 1.00 8.9914.60 5.86 0.93 6.7914.80 5.13 0.88 6.0115.00 4.63 0.84 5.4715.20 4.27 0.80 5.0715.40 3.97 0.77 4.7415.60 3.73 0.74 4.4715.80 3.53 0.70 4.2316.00 3.35 0.67 4.0116.20 3.19 0.63 3.8216.40 3.04 0.60 3.6416.60 2.90 0.58 3.4816.80 2.78 0.56 3.3417.00 2.66 0.55 3.2117.20 2.56 0.53 3.09
...End

Hyd. No. 12 - Combine - 100 Yr - Qp = 33.47 cfs - Pond 5 Inflow
Hyd. 10 Hyd. 11 Hyd. 12
Qcfs
Time (hrs)
0
10
20
30
40
0.0 2.6 5.1 7.7 10.2 12.8 15.3 17.9 20.5 23.0 25.6

Hydrograph ReportPage 1
Hydraflow Hydrographs by Intelisolve
Hyd. No. 13
Pond 5 Outflow
Hydrograph type = Reservoir Peak discharge = 25.68 cfsStorm frequency = 100 yrs Time interval = 2 minInflow hyd. No. = 12 Reservoir name = Pond 5Max. Elevation = 716.60 ft Max. Storage = 2.046 acft
Storage Indication method used. Outflow hydrograph volume = 6.427 acft
Hydrograph Discharge Table
Time Inflow Elevation Clv A Clv B Clv C Clv D Wr A Wr B Wr C Wr D Exfil Outflow(hrs) cfs ft cfs cfs cfs cfs cfs cfs cfs cfs cfs cfs
12.40 30.68 715.08 5.05 ----- ----- ----- ----- ----- ----- ----- ----- 5.0512.60 32.83 715.62 14.28 ----- ----- ----- ----- ----- ----- ----- ----- 14.2812.80 33.47 << 716.05 18.52 ----- ----- ----- ----- ----- ----- ----- ----- 18.5213.00 31.20 716.37 21.18 ----- ----- ----- ----- ----- ----- ----- ----- 21.1813.20 28.26 716.56 22.58 ----- ----- ----- 1.18 ----- ----- ----- ----- 23.7613.40 25.41 716.60 22.89 ----- ----- ----- 2.78 ----- ----- ----- ----- 25.6713.60 22.22 716.57 22.65 ----- ----- ----- 1.57 ----- ----- ----- ----- 24.2213.80 19.01 716.50 22.15 ----- ----- ----- 0.44 ----- ----- ----- ----- 22.6014.00 15.68 716.39 21.29 ----- ----- ----- ----- ----- ----- ----- ----- 21.2914.20 12.21 716.21 19.93 ----- ----- ----- ----- ----- ----- ----- ----- 19.9314.40 8.99 716.00 18.07 ----- ----- ----- ----- ----- ----- ----- ----- 18.0714.60 6.79 715.76 15.81 ----- ----- ----- ----- ----- ----- ----- ----- 15.8114.80 6.01 715.55 13.46 ----- ----- ----- ----- ----- ----- ----- ----- 13.4615.00 5.47 715.39 11.21 ----- ----- ----- ----- ----- ----- ----- ----- 11.2115.20 5.07 715.26 9.21 ----- ----- ----- ----- ----- ----- ----- ----- 9.2215.40 4.74 715.17 7.49 ----- ----- ----- ----- ----- ----- ----- ----- 7.4915.60 4.47 715.12 6.07 ----- ----- ----- ----- ----- ----- ----- ----- 6.0715.80 4.23 715.09 5.15 ----- ----- ----- ----- ----- ----- ----- ----- 5.1516.00 4.01 715.07 4.60 ----- ----- ----- ----- ----- ----- ----- ----- 4.6016.20 3.82 715.06 4.23 ----- ----- ----- ----- ----- ----- ----- ----- 4.2316.40 3.64 715.05 3.93 ----- ----- ----- ----- ----- ----- ----- ----- 3.9316.60 3.48 715.04 3.69 ----- ----- ----- ----- ----- ----- ----- ----- 3.6816.80 3.34 715.04 3.50 ----- ----- ----- ----- ----- ----- ----- ----- 3.5017.00 3.21 715.03 3.35 ----- ----- ----- ----- ----- ----- ----- ----- 3.3517.20 3.09 715.03 3.21 ----- ----- ----- ----- ----- ----- ----- ----- 3.2117.40 2.99 715.03 3.10 ----- ----- ----- ----- ----- ----- ----- ----- 3.1017.60 2.90 715.02 2.99 ----- ----- ----- ----- ----- ----- ----- ----- 2.9917.80 2.82 715.02 2.90 ----- ----- ----- ----- ----- ----- ----- ----- 2.9018.00 2.74 715.02 2.82 ----- ----- ----- ----- ----- ----- ----- ----- 2.8218.20 2.67 715.02 2.74 ----- ----- ----- ----- ----- ----- ----- ----- 2.7418.40 2.60 715.02 2.67 ----- ----- ----- ----- ----- ----- ----- ----- 2.6718.60 2.54 715.01 2.60 ----- ----- ----- ----- ----- ----- ----- ----- 2.6018.80 2.47 715.01 2.54 ----- ----- ----- ----- ----- ----- ----- ----- 2.5419.00 2.41 715.01 2.47 ----- ----- ----- ----- ----- ----- ----- ----- 2.4719.20 2.35 715.01 2.41 ----- ----- ----- ----- ----- ----- ----- ----- 2.4119.40 2.28 715.01 2.34 ----- ----- ----- ----- ----- ----- ----- ----- 2.34
...End

Reservoir ReportPage 1
Hydraflow Hydrographs by IntelisolveReservoir No. 6 - Pond 5
Pond Data
Pond storage is based on known contour areas. Average end area method used.
Stage / Storage Table
Stage (ft) Elevation (ft) Contour area (sqft) Incr. Storage (acft) Total storage (acft)
0.00 713.45 28,271 0.000 0.0001.00 714.45 28,271 0.649 0.6492.00 715.45 28,271 0.649 1.2983.00 716.45 28,271 0.649 1.9474.00 717.45 28,271 0.649 2.596
Culvert / Orifice Structures Weir Structures
[A] [B] [C] [D] [A] [B] [C] [D]
Rise in = 24.0 0.0 0.0 0.0
Span in = 24.0 0.0 0.0 0.0
No. Barrels = 1 0 0 0
Invert El. ft = 712.85 0.00 0.00 0.00
Length ft = 27.0 0.0 0.0 0.0
Slope % = 0.00 0.00 0.00 0.00
N-Value = .015 .000 .000 .000
Orif. Coeff. = 0.86 0.00 0.00 0.00
Multi-Stage = n/a No No No
Crest Len ft = 30.00 0.00 0.00 0.00
Crest El. ft = 716.50 0.00 0.00 0.00
Weir Coeff. = 2.60 0.00 0.00 0.00
Weir Type = Broad --- --- ---
Multi-Stage = No No No No
Exfiltration Rate = 0.00 in/hr/sqft Tailwater Elev. = 715.00 ft
Note: All outflows have been analyzed under inlet and outlet control.
Stage / Storage / Discharge Table
Stage Storage Elevation Clv A Clv B Clv C Clv D Wr A Wr B Wr C Wr D Exfil Totalft acft ft cfs cfs cfs cfs cfs cfs cfs cfs cfs cfs
0.00 0.000 713.45 0.00 --- --- --- 0.00 --- --- --- --- 0.001.00 0.649 714.45 0.00 --- --- --- 0.00 --- --- --- --- 0.002.00 1.298 715.45 12.13 --- --- --- 0.00 --- --- --- --- 12.133.00 1.947 716.45 21.78 --- --- --- 0.00 --- --- --- --- 21.784.00 2.596 717.45 28.31 --- --- --- 72.23 --- --- --- --- 100.53
Hyd. No. 13 - Reservoir - 100 Yr - Qp = 25.68 cfs - Pond 5 Outflow
Hyd. 12 Hyd. 13
Qcfs
Time (hrs)
0
10
20
30
40
0.0 2.6 5.2 7.9 10.5 13.1 15.7 18.4 21.0 23.6 26.2

Hydrograph ReportPage 1
Hydraflow Hydrographs by Intelisolve
Hyd. No. 14
Pond 6 Inflow
Hydrograph type = SCS Runoff Peak discharge = 14.32 cfsStorm frequency = 100 yrs Time interval = 2 minDrainage area = 2.10 ac Curve number = 90Basin Slope = 0.1 % Hydraulic length = 200 ftTc method = LAG Time of conc. (Tc) = 19.5 minTotal precip. = 7.40 in Distribution = Type IIStorm duration = 24 hrs Shape factor = 484
Hydrograph Volume = 1.088 acft
Hydrograph Discharge Table
Time -- Outflow(hrs cfs)
11.50 1.2911.70 2.6211.90 8.4912.10 13.9212.30 6.0212.50 2.1012.70 1.50
...End

Hyd. No. 14 - SCS Runoff - 100 Yr - Qp = 14.32 cfs - Pond 6 Inflow
Hyd. 14
Qcfs
Time (hrs)
0
5
10
15
0.0 2.4 4.8 7.2 9.7 12.1 14.5 16.9 19.3 21.7 24.1

Hydrograph ReportPage 1
Hydraflow Hydrographs by Intelisolve
Hyd. No. 15
Pond 6 Inflow
Hydrograph type = Combine Peak discharge = 26.55 cfsStorm frequency = 100 yrs Time interval = 2 minInflow hyds. = 13, 14
Hydrograph Volume = 7.515 acft
Hydrograph Discharge Table
Time Hyd. 13 + Hyd. 14 = Outflow(hrs) (cfs) (cfs) (cfs)
11.80 0.00 4.73 4.7312.00 0.00 13.15 13.1512.20 0.00 10.07 10.0712.40 5.05 3.09 8.1512.60 14.28 1.77 16.0512.80 18.52 1.32 19.8313.00 21.18 1.11 22.2913.20 23.76 0.96 24.7213.40 25.67 0.86 26.5313.60 24.22 0.77 24.9913.80 22.60 0.70 23.3014.00 21.29 0.63 21.9214.20 19.93 0.58 20.5114.40 18.07 0.55 18.6214.60 15.81 0.53 16.3314.80 13.46 0.50 13.9615.00 11.21 0.48 11.7015.20 9.22 0.46 9.6815.40 7.49 0.44 7.9315.60 6.07 0.42 6.4915.80 5.15 0.40 5.5516.00 4.60 0.38 4.9716.20 4.23 0.36 4.5916.40 3.93 0.35 4.2816.60 3.68 0.34 4.0216.80 3.50 0.33 3.8317.00 3.35 0.32 3.6717.20 3.21 0.32 3.5317.40 3.10 0.31 3.4117.60 2.99 0.30 3.2917.80 2.90 0.29 3.1918.00 2.82 0.28 3.1018.20 2.74 0.28 3.0218.40 2.67 0.27 2.9418.60 2.60 0.26 2.8618.80 2.54 0.25 2.7919.00 2.47 0.25 2.7219.20 2.41 0.24 2.65
Continues on next page...

Pond 6 Inflow Page 2
Hydrograph Discharge Table
Time Hyd. 13 + Hyd. 14 = Outflow(hrs) (cfs) (cfs) (cfs)
19.40 2.34 0.23 2.5719.60 2.28 0.22 2.5019.80 2.21 0.22 2.43
...End
Hyd. No. 15 - Combine - 100 Yr - Qp = 26.55 cfs - Pond 6 Inflow
Hyd. 13 Hyd. 14 Hyd. 15
Qcfs
Time (hrs)
0
5
10
15
20
25
30
0.0 2.6 5.2 7.8 10.4 12.9 15.5 18.1 20.7 23.3 25.9

Hydrograph ReportPage 1
Hydraflow Hydrographs by Intelisolve
Hyd. No. 16
Pond 6 Outflow
Hydrograph type = Reservoir Peak discharge = 23.75 cfsStorm frequency = 100 yrs Time interval = 2 minInflow hyd. No. = 15 Reservoir name = Pond 6Max. Elevation = 715.63 ft Max. Storage = 1.215 acft
Storage Indication method used. Outflow hydrograph volume = 7.236 acft
Hydrograph Discharge Table
Time Inflow Elevation Clv A Clv B Clv C Clv D Wr A Wr B Wr C Wr D Exfil Outflow(hrs) cfs ft cfs cfs cfs cfs cfs cfs cfs cfs cfs cfs
12.00 13.15 714.09 4.45 ----- ----- ----- ----- ----- ----- ----- ----- 4.4512.20 10.07 714.29 7.27 ----- ----- ----- ----- ----- ----- ----- ----- 7.2712.40 8.15 714.27 7.22 ----- ----- ----- ----- ----- ----- ----- ----- 7.2212.60 16.05 714.43 7.65 ----- ----- ----- ----- ----- ----- ----- ----- 7.6512.80 19.83 714.71 10.49 ----- ----- ----- ----- ----- ----- ----- ----- 10.4913.00 22.29 714.98 13.90 ----- ----- ----- ----- ----- ----- ----- ----- 13.9113.20 24.72 715.22 16.43 ----- ----- ----- ----- ----- ----- ----- ----- 16.4313.40 26.53 715.47 18.69 ----- ----- ----- 0.16 ----- ----- ----- ----- 18.8413.60 24.99 715.61 19.88 ----- ----- ----- 3.23 ----- ----- ----- ----- 23.1113.80 23.30 715.63 19.98 ----- ----- ----- 3.68 ----- ----- ----- ----- 23.6714.00 21.92 715.61 19.82 ----- ----- ----- 2.91 ----- ----- ----- ----- 22.7314.20 20.51 715.58 19.60 ----- ----- ----- 1.94 ----- ----- ----- ----- 21.5414.40 18.62 715.54 19.32 ----- ----- ----- 0.82 ----- ----- ----- ----- 20.1314.60 16.33 715.48 18.79 ----- ----- ----- 0.26 ----- ----- ----- ----- 19.0514.80 13.96 715.38 17.94 ----- ----- ----- ----- ----- ----- ----- ----- 17.9415.00 11.70 715.25 16.72 ----- ----- ----- ----- ----- ----- ----- ----- 16.7215.20 9.68 715.09 15.15 ----- ----- ----- ----- ----- ----- ----- ----- 15.1515.40 7.93 714.93 13.34 ----- ----- ----- ----- ----- ----- ----- ----- 13.3415.60 6.49 714.77 11.38 ----- ----- ----- ----- ----- ----- ----- ----- 11.3815.80 5.55 714.64 9.40 ----- ----- ----- ----- ----- ----- ----- ----- 9.4016.00 4.97 714.44 7.67 ----- ----- ----- ----- ----- ----- ----- ----- 7.6716.20 4.59 714.45 7.69 ----- ----- ----- ----- ----- ----- ----- ----- 7.6916.40 4.28 714.37 7.51 ----- ----- ----- ----- ----- ----- ----- ----- 7.5116.60 4.02 714.27 7.23 ----- ----- ----- ----- ----- ----- ----- ----- 7.2316.80 3.83 714.18 6.45 ----- ----- ----- ----- ----- ----- ----- ----- 6.4517.00 3.67 714.12 5.24 ----- ----- ----- ----- ----- ----- ----- ----- 5.2417.20 3.53 714.09 4.31 ----- ----- ----- ----- ----- ----- ----- ----- 4.3117.40 3.41 714.07 3.83 ----- ----- ----- ----- ----- ----- ----- ----- 3.8317.60 3.29 714.06 3.55 ----- ----- ----- ----- ----- ----- ----- ----- 3.5517.80 3.19 714.05 3.38 ----- ----- ----- ----- ----- ----- ----- ----- 3.3718.00 3.10 714.05 3.24 ----- ----- ----- ----- ----- ----- ----- ----- 3.2418.20 3.02 714.04 3.12 ----- ----- ----- ----- ----- ----- ----- ----- 3.1218.40 2.94 714.04 3.03 ----- ----- ----- ----- ----- ----- ----- ----- 3.0318.60 2.86 714.04 2.95 ----- ----- ----- ----- ----- ----- ----- ----- 2.9518.80 2.79 714.04 2.87 ----- ----- ----- ----- ----- ----- ----- ----- 2.8719.00 2.72 714.03 2.80 ----- ----- ----- ----- ----- ----- ----- ----- 2.7919.20 2.65 714.03 2.72 ----- ----- ----- ----- ----- ----- ----- ----- 2.7219.40 2.57 714.03 2.65 ----- ----- ----- ----- ----- ----- ----- ----- 2.65
Continues on next page...
Pond 6 Outflow Page 2
Hydrograph Discharge Table
Time Inflow Elevation Clv A Clv B Clv C Clv D Wr A Wr B Wr C Wr D Exfil Outflow(hrs) cfs ft cfs cfs cfs cfs cfs cfs cfs cfs cfs cfs
19.60 2.50 714.03 2.58 ----- ----- ----- ----- ----- ----- ----- ----- 2.5819.80 2.43 714.03 2.50 ----- ----- ----- ----- ----- ----- ----- ----- 2.5020.00 2.36 714.02 2.43 ----- ----- ----- ----- ----- ----- ----- ----- 2.4320.20 2.29 714.02 2.36 ----- ----- ----- ----- ----- ----- ----- ----- 2.3620.40 2.22 714.02 2.29 ----- ----- ----- ----- ----- ----- ----- ----- 2.2920.60 2.16 714.02 2.22 ----- ----- ----- ----- ----- ----- ----- ----- 2.2220.80 2.10 714.02 2.16 ----- ----- ----- ----- ----- ----- ----- ----- 2.16
...End
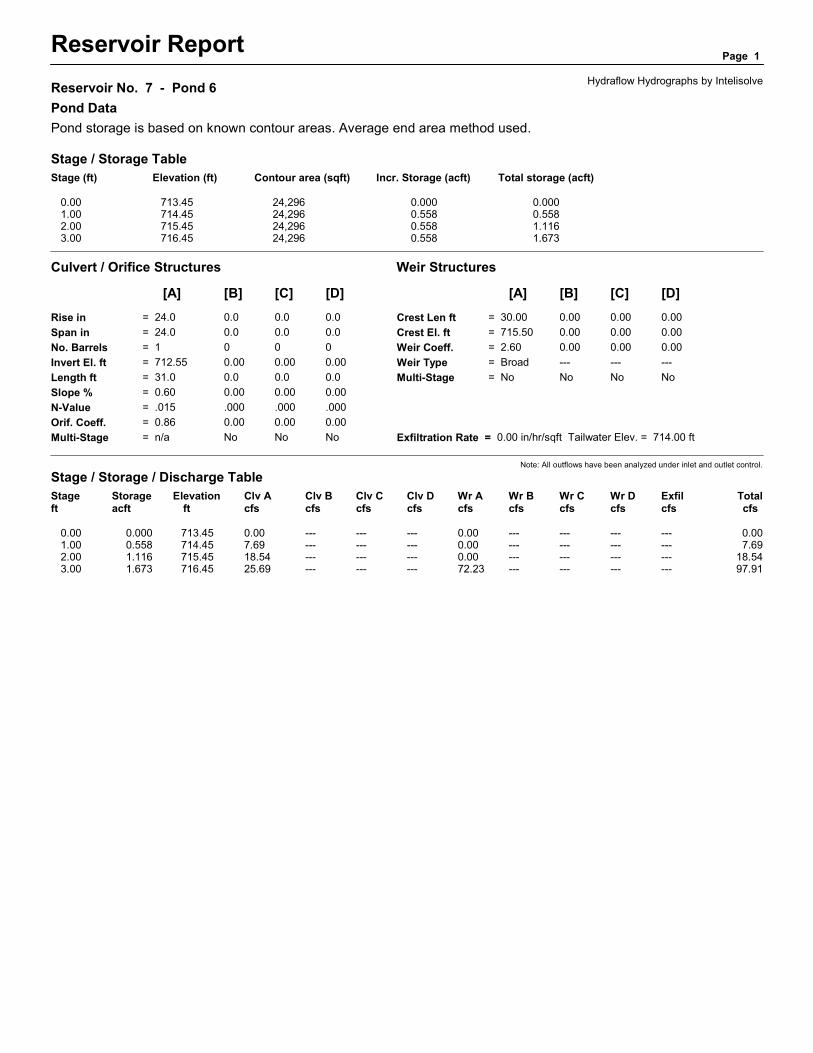
Reservoir ReportPage 1
Hydraflow Hydrographs by IntelisolveReservoir No. 7 - Pond 6
Pond Data
Pond storage is based on known contour areas. Average end area method used.
Stage / Storage Table
Stage (ft) Elevation (ft) Contour area (sqft) Incr. Storage (acft) Total storage (acft)
0.00 713.45 24,296 0.000 0.0001.00 714.45 24,296 0.558 0.5582.00 715.45 24,296 0.558 1.1163.00 716.45 24,296 0.558 1.673
Culvert / Orifice Structures Weir Structures
[A] [B] [C] [D] [A] [B] [C] [D]
Rise in = 24.0 0.0 0.0 0.0
Span in = 24.0 0.0 0.0 0.0
No. Barrels = 1 0 0 0
Invert El. ft = 712.55 0.00 0.00 0.00
Length ft = 31.0 0.0 0.0 0.0
Slope % = 0.60 0.00 0.00 0.00
N-Value = .015 .000 .000 .000
Orif. Coeff. = 0.86 0.00 0.00 0.00
Multi-Stage = n/a No No No
Crest Len ft = 30.00 0.00 0.00 0.00
Crest El. ft = 715.50 0.00 0.00 0.00
Weir Coeff. = 2.60 0.00 0.00 0.00
Weir Type = Broad --- --- ---
Multi-Stage = No No No No
Exfiltration Rate = 0.00 in/hr/sqft Tailwater Elev. = 714.00 ft
Note: All outflows have been analyzed under inlet and outlet control.
Stage / Storage / Discharge Table
Stage Storage Elevation Clv A Clv B Clv C Clv D Wr A Wr B Wr C Wr D Exfil Totalft acft ft cfs cfs cfs cfs cfs cfs cfs cfs cfs cfs
0.00 0.000 713.45 0.00 --- --- --- 0.00 --- --- --- --- 0.001.00 0.558 714.45 7.69 --- --- --- 0.00 --- --- --- --- 7.692.00 1.116 715.45 18.54 --- --- --- 0.00 --- --- --- --- 18.543.00 1.673 716.45 25.69 --- --- --- 72.23 --- --- --- --- 97.91

Hyd. No. 16 - Reservoir - 100 Yr - Qp = 23.75 cfs - Pond 6 Outflow
Hyd. 15 Hyd. 16
Qcfs
Time (hrs)
0
5
10
15
20
25
30
0.0 2.7 5.3 8.0 10.6 13.3 15.9 18.6 21.2 23.8 26.5
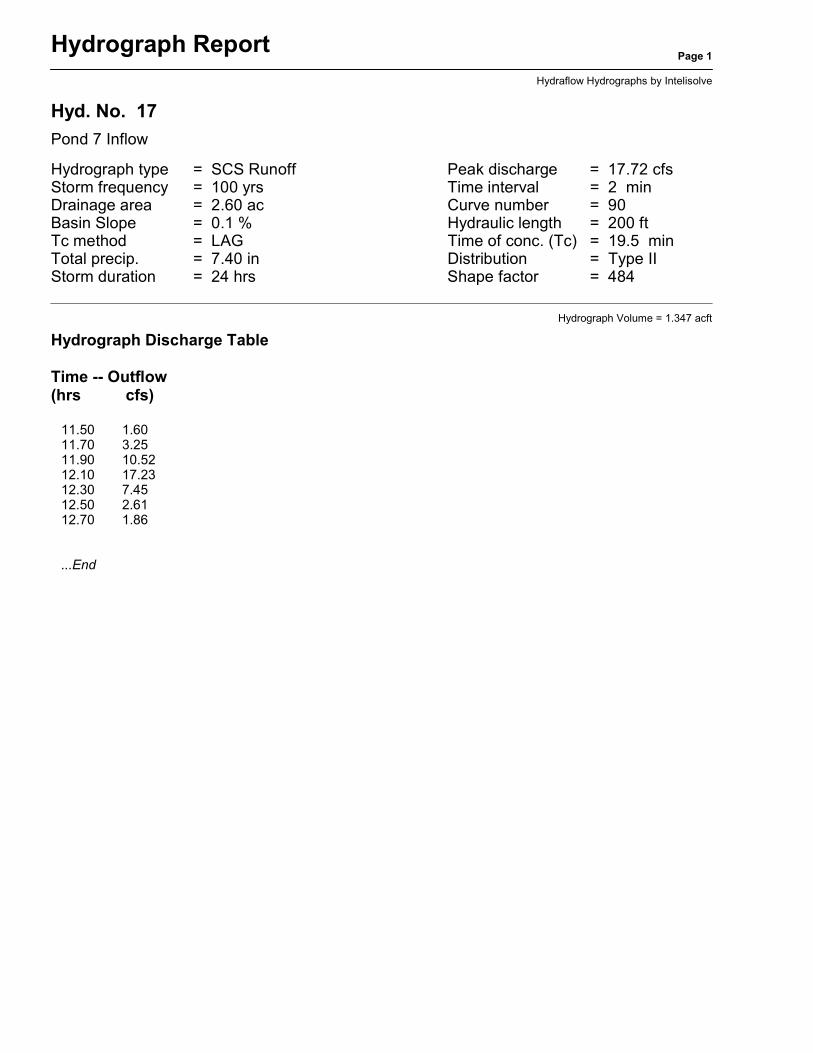
Hydrograph ReportPage 1
Hydraflow Hydrographs by Intelisolve
Hyd. No. 17
Pond 7 Inflow
Hydrograph type = SCS Runoff Peak discharge = 17.72 cfsStorm frequency = 100 yrs Time interval = 2 minDrainage area = 2.60 ac Curve number = 90Basin Slope = 0.1 % Hydraulic length = 200 ftTc method = LAG Time of conc. (Tc) = 19.5 minTotal precip. = 7.40 in Distribution = Type IIStorm duration = 24 hrs Shape factor = 484
Hydrograph Volume = 1.347 acft
Hydrograph Discharge Table
Time -- Outflow(hrs cfs)
11.50 1.6011.70 3.2511.90 10.5212.10 17.2312.30 7.4512.50 2.6112.70 1.86
...End

Hyd. No. 17 - SCS Runoff - 100 Yr - Qp = 17.72 cfs - Pond 7 Inflow
Hyd. 17
Qcfs
Time (hrs)
0
5
10
15
20
0.0 2.4 4.8 7.2 9.7 12.1 14.5 16.9 19.3 21.7 24.1

Hydrograph ReportPage 1
Hydraflow Hydrographs by Intelisolve
Hyd. No. 18
Pond 7 Inflow
Hydrograph type = Combine Peak discharge = 24.64 cfsStorm frequency = 100 yrs Time interval = 2 minInflow hyds. = 16, 17
Hydrograph Volume = 8.583 acft
Hydrograph Discharge Table
Time Hyd. 16 + Hyd. 17 = Outflow(hrs) (cfs) (cfs) (cfs)
11.80 0.00 5.85 5.8512.00 4.45 16.28 20.7312.20 7.27 12.47 19.7412.40 7.22 3.83 11.0612.60 7.65 2.20 9.8512.80 10.49 1.63 12.1213.00 13.91 1.37 15.2813.20 16.43 1.19 17.6213.40 18.84 1.06 19.9013.60 23.11 0.96 24.0713.80 23.67 0.86 24.5314.00 22.73 0.79 23.5214.20 21.54 0.72 22.2614.40 20.13 0.68 20.8114.60 19.05 0.65 19.7014.80 17.94 0.62 18.5715.00 16.72 0.60 17.3115.20 15.15 0.57 15.7215.40 13.34 0.55 13.8915.60 11.38 0.52 11.9015.80 9.40 0.49 9.8916.00 7.67 0.47 8.1416.20 7.69 0.44 8.1316.40 7.51 0.43 7.9416.60 7.23 0.42 7.6516.80 6.45 0.41 6.8617.00 5.24 0.40 5.6417.20 4.31 0.39 4.7017.40 3.83 0.38 4.2117.60 3.55 0.37 3.9317.80 3.37 0.36 3.7418.00 3.24 0.35 3.5918.20 3.12 0.34 3.4718.40 3.03 0.33 3.3618.60 2.95 0.32 3.2718.80 2.87 0.31 3.1819.00 2.79 0.31 3.1019.20 2.72 0.30 3.02
Continues on next page...

Pond 7 Inflow Page 2
Hydrograph Discharge Table
Time Hyd. 16 + Hyd. 17 = Outflow(hrs) (cfs) (cfs) (cfs)
19.40 2.65 0.29 2.9419.60 2.58 0.28 2.8519.80 2.50 0.27 2.7720.00 2.43 0.26 2.6920.20 2.36 0.25 2.6120.40 2.29 0.25 2.5320.60 2.22 0.24 2.4720.80 2.16 0.24 2.4021.00 2.10 0.24 2.3421.20 2.05 0.24 2.2921.40 2.01 0.24 2.25
...End
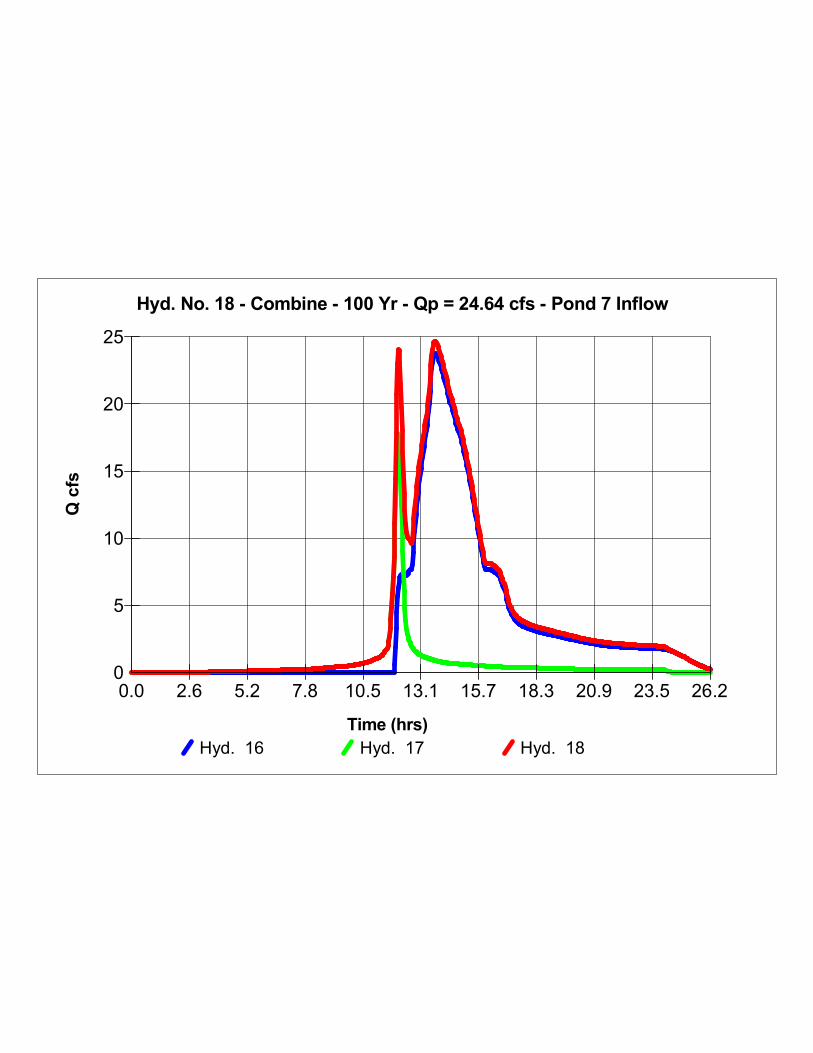
Hyd. No. 18 - Combine - 100 Yr - Qp = 24.64 cfs - Pond 7 Inflow
Hyd. 16 Hyd. 17 Hyd. 18
Qcfs
Time (hrs)
0
5
10
15
20
25
0.0 2.6 5.2 7.8 10.5 13.1 15.7 18.3 20.9 23.5 26.2
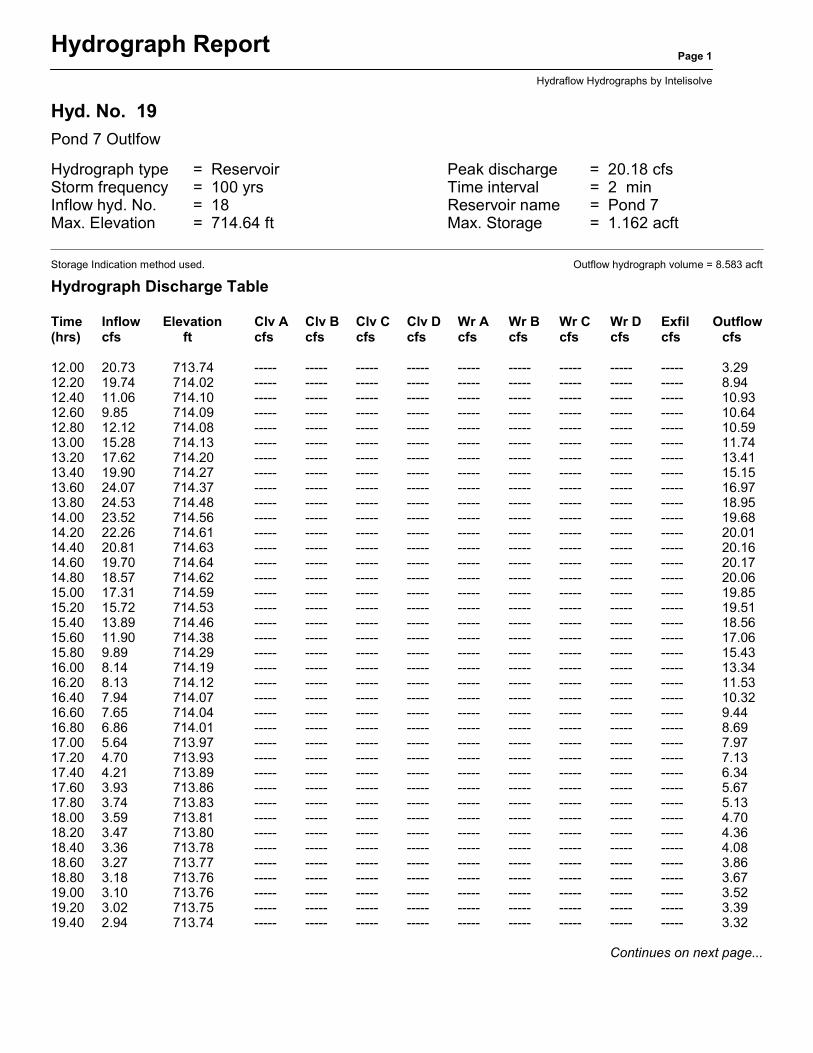
Hydrograph ReportPage 1
Hydraflow Hydrographs by Intelisolve
Hyd. No. 19
Pond 7 Outlfow
Hydrograph type = Reservoir Peak discharge = 20.18 cfsStorm frequency = 100 yrs Time interval = 2 minInflow hyd. No. = 18 Reservoir name = Pond 7Max. Elevation = 714.64 ft Max. Storage = 1.162 acft
Storage Indication method used. Outflow hydrograph volume = 8.583 acft
Hydrograph Discharge Table
Time Inflow Elevation Clv A Clv B Clv C Clv D Wr A Wr B Wr C Wr D Exfil Outflow(hrs) cfs ft cfs cfs cfs cfs cfs cfs cfs cfs cfs cfs
12.00 20.73 713.74 ----- ----- ----- ----- ----- ----- ----- ----- ----- 3.2912.20 19.74 714.02 ----- ----- ----- ----- ----- ----- ----- ----- ----- 8.9412.40 11.06 714.10 ----- ----- ----- ----- ----- ----- ----- ----- ----- 10.9312.60 9.85 714.09 ----- ----- ----- ----- ----- ----- ----- ----- ----- 10.6412.80 12.12 714.08 ----- ----- ----- ----- ----- ----- ----- ----- ----- 10.5913.00 15.28 714.13 ----- ----- ----- ----- ----- ----- ----- ----- ----- 11.7413.20 17.62 714.20 ----- ----- ----- ----- ----- ----- ----- ----- ----- 13.4113.40 19.90 714.27 ----- ----- ----- ----- ----- ----- ----- ----- ----- 15.1513.60 24.07 714.37 ----- ----- ----- ----- ----- ----- ----- ----- ----- 16.9713.80 24.53 714.48 ----- ----- ----- ----- ----- ----- ----- ----- ----- 18.9514.00 23.52 714.56 ----- ----- ----- ----- ----- ----- ----- ----- ----- 19.6814.20 22.26 714.61 ----- ----- ----- ----- ----- ----- ----- ----- ----- 20.0114.40 20.81 714.63 ----- ----- ----- ----- ----- ----- ----- ----- ----- 20.1614.60 19.70 714.64 ----- ----- ----- ----- ----- ----- ----- ----- ----- 20.1714.80 18.57 714.62 ----- ----- ----- ----- ----- ----- ----- ----- ----- 20.0615.00 17.31 714.59 ----- ----- ----- ----- ----- ----- ----- ----- ----- 19.8515.20 15.72 714.53 ----- ----- ----- ----- ----- ----- ----- ----- ----- 19.5115.40 13.89 714.46 ----- ----- ----- ----- ----- ----- ----- ----- ----- 18.5615.60 11.90 714.38 ----- ----- ----- ----- ----- ----- ----- ----- ----- 17.0615.80 9.89 714.29 ----- ----- ----- ----- ----- ----- ----- ----- ----- 15.4316.00 8.14 714.19 ----- ----- ----- ----- ----- ----- ----- ----- ----- 13.3416.20 8.13 714.12 ----- ----- ----- ----- ----- ----- ----- ----- ----- 11.5316.40 7.94 714.07 ----- ----- ----- ----- ----- ----- ----- ----- ----- 10.3216.60 7.65 714.04 ----- ----- ----- ----- ----- ----- ----- ----- ----- 9.4416.80 6.86 714.01 ----- ----- ----- ----- ----- ----- ----- ----- ----- 8.6917.00 5.64 713.97 ----- ----- ----- ----- ----- ----- ----- ----- ----- 7.9717.20 4.70 713.93 ----- ----- ----- ----- ----- ----- ----- ----- ----- 7.1317.40 4.21 713.89 ----- ----- ----- ----- ----- ----- ----- ----- ----- 6.3417.60 3.93 713.86 ----- ----- ----- ----- ----- ----- ----- ----- ----- 5.6717.80 3.74 713.83 ----- ----- ----- ----- ----- ----- ----- ----- ----- 5.1318.00 3.59 713.81 ----- ----- ----- ----- ----- ----- ----- ----- ----- 4.7018.20 3.47 713.80 ----- ----- ----- ----- ----- ----- ----- ----- ----- 4.3618.40 3.36 713.78 ----- ----- ----- ----- ----- ----- ----- ----- ----- 4.0818.60 3.27 713.77 ----- ----- ----- ----- ----- ----- ----- ----- ----- 3.8618.80 3.18 713.76 ----- ----- ----- ----- ----- ----- ----- ----- ----- 3.6719.00 3.10 713.76 ----- ----- ----- ----- ----- ----- ----- ----- ----- 3.5219.20 3.02 713.75 ----- ----- ----- ----- ----- ----- ----- ----- ----- 3.3919.40 2.94 713.74 ----- ----- ----- ----- ----- ----- ----- ----- ----- 3.32
Continues on next page...

Pond 7 Outlfow Page 2
Hydrograph Discharge Table
Time Inflow Elevation Clv A Clv B Clv C Clv D Wr A Wr B Wr C Wr D Exfil Outflow(hrs) cfs ft cfs cfs cfs cfs cfs cfs cfs cfs cfs cfs
19.60 2.85 713.74 ----- ----- ----- ----- ----- ----- ----- ----- ----- 3.2419.80 2.77 713.73 ----- ----- ----- ----- ----- ----- ----- ----- ----- 3.1720.00 2.69 713.72 ----- ----- ----- ----- ----- ----- ----- ----- ----- 3.0920.20 2.61 713.72 ----- ----- ----- ----- ----- ----- ----- ----- ----- 3.0120.40 2.53 713.71 ----- ----- ----- ----- ----- ----- ----- ----- ----- 2.9420.60 2.47 713.70 ----- ----- ----- ----- ----- ----- ----- ----- ----- 2.8620.80 2.40 713.70 ----- ----- ----- ----- ----- ----- ----- ----- ----- 2.7921.00 2.34 713.69 ----- ----- ----- ----- ----- ----- ----- ----- ----- 2.7121.20 2.29 713.68 ----- ----- ----- ----- ----- ----- ----- ----- ----- 2.6421.40 2.25 713.68 ----- ----- ----- ----- ----- ----- ----- ----- ----- 2.5821.60 2.21 713.67 ----- ----- ----- ----- ----- ----- ----- ----- ----- 2.5221.80 2.17 713.67 ----- ----- ----- ----- ----- ----- ----- ----- ----- 2.4622.00 2.14 713.66 ----- ----- ----- ----- ----- ----- ----- ----- ----- 2.4122.20 2.12 713.66 ----- ----- ----- ----- ----- ----- ----- ----- ----- 2.3622.40 2.09 713.65 ----- ----- ----- ----- ----- ----- ----- ----- ----- 2.3122.60 2.07 713.65 ----- ----- ----- ----- ----- ----- ----- ----- ----- 2.2722.80 2.05 713.65 ----- ----- ----- ----- ----- ----- ----- ----- ----- 2.2423.00 2.04 713.64 ----- ----- ----- ----- ----- ----- ----- ----- ----- 2.2023.20 2.02 713.64 ----- ----- ----- ----- ----- ----- ----- ----- ----- 2.1723.40 2.00 713.64 ----- ----- ----- ----- ----- ----- ----- ----- ----- 2.1523.60 1.99 713.64 ----- ----- ----- ----- ----- ----- ----- ----- ----- 2.1223.80 1.97 713.64 ----- ----- ----- ----- ----- ----- ----- ----- ----- 2.1024.00 1.96 713.63 ----- ----- ----- ----- ----- ----- ----- ----- ----- 2.0724.20 1.83 713.63 ----- ----- ----- ----- ----- ----- ----- ----- ----- 2.0424.40 1.62 713.63 ----- ----- ----- ----- ----- ----- ----- ----- ----- 1.9924.60 1.47 713.62 ----- ----- ----- ----- ----- ----- ----- ----- ----- 1.9124.80 1.32 713.61 ----- ----- ----- ----- ----- ----- ----- ----- ----- 1.82
...End

Reservoir ReportPage 1
Hydraflow Hydrographs by IntelisolveReservoir No. 8 - Pond 7
Pond Data
Pond storage is based on known contour areas. Average end area method used.
Stage / Storage Table
Stage (ft) Elevation (ft) Contour area (sqft) Incr. Storage (acft) Total storage (acft)
0.00 713.45 42,621 0.000 0.0000.30 713.75 42,621 0.294 0.2940.55 714.00 42,621 0.245 0.5380.80 714.25 42,621 0.245 0.7831.05 714.50 42,621 0.245 1.0271.30 714.75 42,621 0.245 1.2721.55 715.00 42,621 0.245 1.5171.80 715.25 42,621 0.245 1.7612.05 715.50 42,621 0.245 2.006
Culvert / Orifice Structures Weir Structures
[A] [B] [C] [D] [A] [B] [C] [D]
Rise in = 0.0 0.0 0.0 0.0
Span in = 0.0 0.0 0.0 0.0
No. Barrels = 0 0 0 0
Invert El. ft = 0.00 0.00 0.00 0.00
Length ft = 0.0 0.0 0.0 0.0
Slope % = 0.00 0.00 0.00 0.00
N-Value = .013 .000 .000 .000
Orif. Coeff. = 0.60 0.00 0.00 0.00
Multi-Stage = n/a No No No
Crest Len ft = 0.00 0.00 0.00 0.00
Crest El. ft = 0.00 0.00 0.00 0.00
Weir Coeff. = 3.33 3.33 0.00 0.00
Weir Type = --- --- --- ---
Multi-Stage = No No No No
Exfiltration Rate = 0.00 in/hr/sqft Tailwater Elev. = 0.00 ft
Note: All outflows have been analyzed under inlet and outlet control.
Stage / Storage / Discharge Table
Stage Storage Elevation Clv A Clv B Clv C Clv D Wr A Wr B Wr C Wr D Exfil Totalft acft ft cfs cfs cfs cfs cfs cfs cfs cfs cfs cfs
0.00 0.000 713.45 --- --- --- --- 22.46 10.20 --- --- --- 0.000.30 0.294 713.75 --- --- --- --- --- --- --- --- --- 3.400.55 0.538 714.00 --- --- --- --- --- --- --- --- --- 8.500.80 0.783 714.25 --- --- --- --- --- --- --- --- --- 14.801.05 1.027 714.50 --- --- --- --- --- --- --- --- --- 19.301.30 1.272 714.75 --- --- --- --- --- --- --- --- --- 20.901.55 1.517 715.00 --- --- --- --- --- --- --- --- --- 22.301.80 1.761 715.25 --- --- --- --- --- --- --- --- --- 23.702.05 2.006 715.50 --- --- --- --- --- --- --- --- --- 25.00

Hyd. No. 19 - Reservoir - 100 Yr - Qp = 20.18 cfs - Pond 7 Outlfow
Hyd. 18 Hyd. 19
Qcfs
Time (hrs)
0
5
10
15
20
25
0.0 2.9 5.7 8.6 11.5 14.3 17.2 20.0 22.9 25.8 28.6

Hydrograph ReportPage 1
Hydraflow Hydrographs by Intelisolve
Hyd. No. 20
North Ponds + South Ponds
Hydrograph type = Combine Peak discharge = 28.53 cfsStorm frequency = 100 yrs Time interval = 2 minInflow hyds. = 8, 19
Hydrograph Volume = 12.705 acft
Hydrograph Discharge Table
Time Hyd. 8 + Hyd. 19 = Outflow(hrs) (cfs) (cfs) (cfs)
11.80 1.40 1.39 2.7812.00 4.08 3.29 7.3712.20 6.27 8.94 15.2112.40 6.80 10.93 17.7312.60 7.12 10.64 17.7612.80 7.33 10.59 17.9213.00 7.57 11.74 19.3113.20 7.83 13.41 21.2413.40 8.09 15.15 23.2413.60 8.31 16.97 25.2813.80 8.46 18.95 27.4214.00 8.53 19.68 28.2114.20 8.49 20.01 28.4914.40 8.34 20.16 28.5014.60 8.10 20.17 28.2714.80 7.76 20.06 27.8215.00 7.34 19.85 27.1915.20 6.86 19.51 26.3615.40 6.33 18.56 24.8915.60 5.80 17.06 22.8615.80 5.29 15.43 20.7216.00 4.73 13.34 18.0716.20 4.21 11.53 15.7416.40 3.76 10.32 14.0816.60 3.41 9.44 12.8616.80 3.11 8.69 11.8017.00 2.85 7.97 10.8117.20 2.62 7.13 9.7517.40 2.42 6.34 8.7617.60 2.25 5.67 7.9217.80 2.11 5.13 7.2418.00 2.01 4.70 6.7118.20 1.91 4.36 6.2718.40 1.83 4.08 5.9118.60 1.75 3.86 5.6118.80 1.68 3.67 5.3519.00 1.62 3.52 5.1319.20 1.55 3.39 4.94
Continues on next page...

North Ponds + South Ponds Page 2
Hydrograph Discharge Table
Time Hyd. 8 + Hyd. 19 = Outflow(hrs) (cfs) (cfs) (cfs)
19.40 1.50 3.32 4.8119.60 1.44 3.24 4.6919.80 1.39 3.17 4.5620.00 1.35 3.09 4.4420.20 1.30 3.01 4.3120.40 1.26 2.94 4.1920.60 1.22 2.86 4.0820.80 1.18 2.79 3.9721.00 1.15 2.71 3.8621.20 1.11 2.64 3.7621.40 1.08 2.58 3.6621.60 1.06 2.52 3.5721.80 1.03 2.46 3.4922.00 1.01 2.41 3.4122.20 0.98 2.36 3.3422.40 0.96 2.31 3.2822.60 0.95 2.27 3.2222.80 0.93 2.24 3.1723.00 0.91 2.20 3.1223.20 0.90 2.17 3.0723.40 0.89 2.15 3.0323.60 0.88 2.12 2.9923.80 0.86 2.10 2.9624.00 0.85 2.07 2.9324.20 0.83 2.04 2.8724.40 0.79 1.99 2.7824.60 0.75 1.91 2.65
...End

Hyd. No. 20 - Combine - 100 Yr - Qp = 28.53 cfs - North Ponds + SouthPonds
Hyd. 8 Hyd. 19 Hyd. 20
Qcfs
Time (hrs)
0
5
10
15
20
25
30
0.0 2.9 5.9 8.8 11.7 14.6 17.6 20.5 23.4 26.4 29.3

Hydrograph ReportPage 1
Hydraflow Hydrographs by Intelisolve
Hyd. No. 21
Pond 8 Outflow
Hydrograph type = Reservoir Peak discharge = 28.53 cfsStorm frequency = 100 yrs Time interval = 2 minInflow hyd. No. = 20 Reservoir name = Pond 8Max. Elevation = 713.62 ft Max. Storage = 0.233 acft
Storage Indication method used. Outflow hydrograph volume = 12.692 acft
Hydrograph Discharge Table
Time Inflow Elevation Clv A Clv B Clv C Clv D Wr A Wr B Wr C Wr D Exfil Outflow(hrs) cfs ft cfs cfs cfs cfs cfs cfs cfs cfs cfs cfs
12.00 7.37 712.21 ----- ----- ----- ----- ----- ----- ----- ----- ----- 4.1912.20 15.21 712.92 ----- ----- ----- ----- ----- ----- ----- ----- ----- 12.3512.40 17.73 713.19 ----- ----- ----- ----- ----- ----- ----- ----- ----- 17.2812.60 17.76 713.22 ----- ----- ----- ----- ----- ----- ----- ----- ----- 17.7712.80 17.92 713.22 ----- ----- ----- ----- ----- ----- ----- ----- ----- 17.7913.00 19.31 713.27 ----- ----- ----- ----- ----- ----- ----- ----- ----- 18.8813.20 21.24 713.37 ----- ----- ----- ----- ----- ----- ----- ----- ----- 20.7013.40 23.24 713.47 ----- ----- ----- ----- ----- ----- ----- ----- ----- 22.7313.60 25.28 713.54 ----- ----- ----- ----- ----- ----- ----- ----- ----- 25.0013.80 27.42 713.59 ----- ----- ----- ----- ----- ----- ----- ----- ----- 27.1914.00 28.21 713.61 ----- ----- ----- ----- ----- ----- ----- ----- ----- 28.1514.20 28.49 713.61 ----- ----- ----- ----- ----- ----- ----- ----- ----- 28.4714.40 28.50 713.61 ----- ----- ----- ----- ----- ----- ----- ----- ----- 28.5114.60 28.27 713.61 ----- ----- ----- ----- ----- ----- ----- ----- ----- 28.3114.80 27.82 713.60 ----- ----- ----- ----- ----- ----- ----- ----- ----- 27.8815.00 27.19 713.59 ----- ----- ----- ----- ----- ----- ----- ----- ----- 27.2715.20 26.36 713.57 ----- ----- ----- ----- ----- ----- ----- ----- ----- 26.4715.40 24.89 713.54 ----- ----- ----- ----- ----- ----- ----- ----- ----- 25.1215.60 22.86 713.49 ----- ----- ----- ----- ----- ----- ----- ----- ----- 23.1915.80 20.72 713.40 ----- ----- ----- ----- ----- ----- ----- ----- ----- 21.3116.00 18.07 713.27 ----- ----- ----- ----- ----- ----- ----- ----- ----- 18.8416.20 15.74 713.14 ----- ----- ----- ----- ----- ----- ----- ----- ----- 16.3316.40 14.08 713.05 ----- ----- ----- ----- ----- ----- ----- ----- ----- 14.5016.60 12.86 712.98 ----- ----- ----- ----- ----- ----- ----- ----- ----- 13.2516.80 11.80 712.91 ----- ----- ----- ----- ----- ----- ----- ----- ----- 12.2117.00 10.81 712.83 ----- ----- ----- ----- ----- ----- ----- ----- ----- 11.2017.20 9.75 712.76 ----- ----- ----- ----- ----- ----- ----- ----- ----- 10.1617.40 8.76 712.68 ----- ----- ----- ----- ----- ----- ----- ----- ----- 9.1417.60 7.92 712.62 ----- ----- ----- ----- ----- ----- ----- ----- ----- 8.2417.80 7.24 712.57 ----- ----- ----- ----- ----- ----- ----- ----- ----- 7.5018.00 6.71 712.52 ----- ----- ----- ----- ----- ----- ----- ----- ----- 6.9118.20 6.27 712.49 ----- ----- ----- ----- ----- ----- ----- ----- ----- 6.4818.40 5.91 712.45 ----- ----- ----- ----- ----- ----- ----- ----- ----- 6.1318.60 5.61 712.41 ----- ----- ----- ----- ----- ----- ----- ----- ----- 5.8118.80 5.35 712.37 ----- ----- ----- ----- ----- ----- ----- ----- ----- 5.5219.00 5.13 712.34 ----- ----- ----- ----- ----- ----- ----- ----- ----- 5.2819.20 4.94 712.32 ----- ----- ----- ----- ----- ----- ----- ----- ----- 5.0719.40 4.81 712.30 ----- ----- ----- ----- ----- ----- ----- ----- ----- 4.91
Continues on next page...
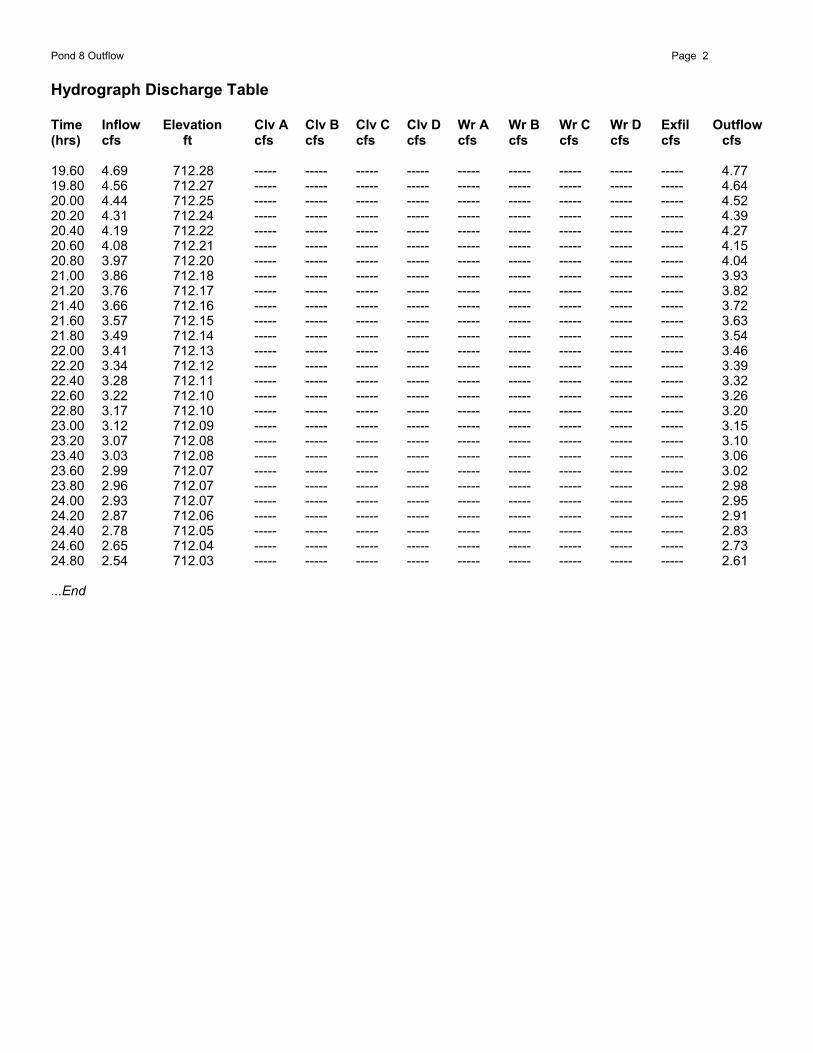
Pond 8 Outflow Page 2
Hydrograph Discharge Table
Time Inflow Elevation Clv A Clv B Clv C Clv D Wr A Wr B Wr C Wr D Exfil Outflow(hrs) cfs ft cfs cfs cfs cfs cfs cfs cfs cfs cfs cfs
19.60 4.69 712.28 ----- ----- ----- ----- ----- ----- ----- ----- ----- 4.7719.80 4.56 712.27 ----- ----- ----- ----- ----- ----- ----- ----- ----- 4.6420.00 4.44 712.25 ----- ----- ----- ----- ----- ----- ----- ----- ----- 4.5220.20 4.31 712.24 ----- ----- ----- ----- ----- ----- ----- ----- ----- 4.3920.40 4.19 712.22 ----- ----- ----- ----- ----- ----- ----- ----- ----- 4.2720.60 4.08 712.21 ----- ----- ----- ----- ----- ----- ----- ----- ----- 4.1520.80 3.97 712.20 ----- ----- ----- ----- ----- ----- ----- ----- ----- 4.0421.00 3.86 712.18 ----- ----- ----- ----- ----- ----- ----- ----- ----- 3.9321.20 3.76 712.17 ----- ----- ----- ----- ----- ----- ----- ----- ----- 3.8221.40 3.66 712.16 ----- ----- ----- ----- ----- ----- ----- ----- ----- 3.7221.60 3.57 712.15 ----- ----- ----- ----- ----- ----- ----- ----- ----- 3.6321.80 3.49 712.14 ----- ----- ----- ----- ----- ----- ----- ----- ----- 3.5422.00 3.41 712.13 ----- ----- ----- ----- ----- ----- ----- ----- ----- 3.4622.20 3.34 712.12 ----- ----- ----- ----- ----- ----- ----- ----- ----- 3.3922.40 3.28 712.11 ----- ----- ----- ----- ----- ----- ----- ----- ----- 3.3222.60 3.22 712.10 ----- ----- ----- ----- ----- ----- ----- ----- ----- 3.2622.80 3.17 712.10 ----- ----- ----- ----- ----- ----- ----- ----- ----- 3.2023.00 3.12 712.09 ----- ----- ----- ----- ----- ----- ----- ----- ----- 3.1523.20 3.07 712.08 ----- ----- ----- ----- ----- ----- ----- ----- ----- 3.1023.40 3.03 712.08 ----- ----- ----- ----- ----- ----- ----- ----- ----- 3.0623.60 2.99 712.07 ----- ----- ----- ----- ----- ----- ----- ----- ----- 3.0223.80 2.96 712.07 ----- ----- ----- ----- ----- ----- ----- ----- ----- 2.9824.00 2.93 712.07 ----- ----- ----- ----- ----- ----- ----- ----- ----- 2.9524.20 2.87 712.06 ----- ----- ----- ----- ----- ----- ----- ----- ----- 2.9124.40 2.78 712.05 ----- ----- ----- ----- ----- ----- ----- ----- ----- 2.8324.60 2.65 712.04 ----- ----- ----- ----- ----- ----- ----- ----- ----- 2.7324.80 2.54 712.03 ----- ----- ----- ----- ----- ----- ----- ----- ----- 2.61
...End

Reservoir ReportPage 1
Hydraflow Hydrographs by IntelisolveReservoir No. 9 - Pond 8
Pond Data
Pond storage is based on known contour areas. Average end area method used.
Stage / Storage Table
Stage (ft) Elevation (ft) Contour area (sqft) Incr. Storage (acft) Total storage (acft)
0.00 711.00 3,883 0.000 0.0000.50 711.50 3,883 0.045 0.0451.00 712.00 3,883 0.045 0.0891.50 712.50 3,883 0.045 0.1342.00 713.00 3,883 0.045 0.1782.50 713.50 3,883 0.045 0.2233.00 714.00 3,883 0.045 0.267
Culvert / Orifice Structures Weir Structures
[A] [B] [C] [D] [A] [B] [C] [D]
Rise in = 0.0 0.0 0.0 0.0
Span in = 0.0 0.0 0.0 0.0
No. Barrels = 0 0 0 0
Invert El. ft = 0.00 0.00 0.00 0.00
Length ft = 0.0 0.0 0.0 0.0
Slope % = 0.00 0.00 0.00 0.00
N-Value = .013 .000 .000 .000
Orif. Coeff. = 0.60 0.00 0.00 0.00
Multi-Stage = n/a No No No
Crest Len ft = 0.00 0.00 0.00 0.00
Crest El. ft = 0.00 0.00 0.00 0.00
Weir Coeff. = 3.33 0.00 0.00 0.00
Weir Type = --- --- --- ---
Multi-Stage = No No No No
Exfiltration Rate = 0.00 in/hr/sqft Tailwater Elev. = 0.00 ft
Note: All outflows have been analyzed under inlet and outlet control.
Stage / Storage / Discharge Table
Stage Storage Elevation Clv A Clv B Clv C Clv D Wr A Wr B Wr C Wr D Exfil Totalft acft ft cfs cfs cfs cfs cfs cfs cfs cfs cfs cfs
0.00 0.000 711.00 --- --- --- --- --- --- --- --- --- 0.000.50 0.045 711.50 --- --- --- --- --- --- --- --- --- 0.421.00 0.089 712.00 --- --- --- --- --- --- --- --- --- 2.391.50 0.134 712.50 --- --- --- --- --- --- --- --- --- 6.592.00 0.178 713.00 --- --- --- --- --- --- --- --- --- 13.522.50 0.223 713.50 --- --- --- --- --- --- --- --- --- 23.303.00 0.267 714.00 --- --- --- --- --- --- --- --- --- 46.00

Hyd. No. 21 - Reservoir - 100 Yr - Qp = 28.53 cfs - Pond 8 Outflow
Hyd. 20 Hyd. 21
Qcfs
Time (hrs)
0
5
10
15
20
25
30
0.0 3.8 7.5 11.3 15.0 18.8 22.5 26.3 30.1 33.8 37.6