allometric equations for estimating tree aboveground biomass in tropical dipterocarp...
TRANSCRIPT

Article
Allometric Equations for Estimating TreeAboveground Biomass in Tropical DipterocarpForests of VietnamBao Huy 1,2, Krishna P. Poudel 2, Karin Kralicek 2, Nguyen Dinh Hung 3, Phung Van Khoa 4,Vu Tan Phương 5 and Hailemariam Temesgen 2,*
1 Department of Forest Resources and Environment Management, Tay Nguyen University, 567 Le Duan,Buon Ma Thuot, Dak Lak 630000, Vietnam; [email protected]
2 Department of Forest Engineering, Resources and Management, Oregon State University, Corvallis,OR 97333, USA; [email protected] (K.P.P.); [email protected] (K.K.)
3 Forest Inventory and Planning Institute, Vinh Quynh, Thanh Tri, Ha Noi 100000, Vietnam;[email protected]
4 Vietnam National University of Forestry, Xuan Mai, Chuong My, Ha Noi 100000, Vietnam;[email protected]
5 Vietnamese Academy of Forest Sciences, Ðuc Thang, Bac Tu Liem, Ha Noi 100000, Vietnam;[email protected]
* Correspondence: [email protected]; Tel.: +1-541-7378549; Fax: +1-541-7379126
Academic Editors: Shibu Jose and Timothy A. MartinReceived: 23 May 2016; Accepted: 16 August 2016; Published: 22 August 2016
Abstract: There are few allometric equations available for dipterocarp forests, despite the factthat this forest type covers extensive areas in tropical Southeast Asia. This study aims to developa set of equations to estimate tree aboveground biomass (AGB) in dipterocarp forests in Vietnamand to validate and compare their predictive performance with allometric equations used fordipterocarps in Indonesia and pantropical areas. Diameter at breast height (DBH), total tree height(H), and wood density (WD) were used as input variables of the nonlinear weighted least squaremodels. Akaike information criterion (AIC) and residual plots were used to select the best models;while percent bias, root mean square percentage error, and mean absolute percent error wereused to compare their performance to published models. For mixed-species, the best equationwas AGB = 0.06203×DBH2.26430 ×H0.51415 ×WD0.79456. When applied to a random independentvalidation dataset, the predicted values from the generic equations and the dipterocarp equationsin Indonesia overestimated the AGB for different sites, indicating the need for region-specificequations. At the genus level, the selected equations were AGB = 0.03713 × DBH2.73813 andAGB = 0.07483 × DBH2.54496 for two genera, Dipterocarpus and Shorea, respectively, in Vietnam.Compared to the mixed-species equations, the genus-specific equations improved the accuracy ofthe AGB estimates. Additionally, the genus-specific equations showed no significant differences inpredictive performance in different regions (e.g., Indonesia, Vietnam) of Southeast Asia.
Keywords: aboveground biomass; allometric equation; dipterocarp forest; genus; Southeast Asia
1. Introduction
There is a significant need globally and in Vietnam to develop equations that estimate forestbiomass and carbon for national measuring, reporting, and verification systems. Under the UnitedNations Framework Convention on Climate Change, countries must report the state of their forestresources through initiatives such as the United Nations collaborative programme on ReducingEmissions from Deforestation and Forest Degradation Plus UN-REDD+ programme [1] in developing
Forests 2016, 7, 180; doi:10.3390/f7080180 www.mdpi.com/journal/forests

Forests 2016, 7, 180 2 of 19
countries [2]. For high accuracy, equations specific to dominant forest types and ecological regionsare necessary.
Dipterocarpaceae is one of the most well-known tree families in the tropics for its species’ iconicform and value as timber [3]. Timber species of Dipterocarpaceae are distributed widely throughouttropical Asia, spanning multiple climatic zones and geographic regions [4]. In Vietnam, this foresttype covers approximately 650,000 ha and is distributed in two main ecological regions or ecoregions,namely the Central Highlands (CH) and the Southeast (SE) [5]. Differences in historical managementof dipterocarps have resulted in an uneven balance of knowledge across their range, with much knownabout dipterocarps on the Indian subcontinent and comparatively little known about the dipterocarpsof Southeast Asia [3]. In Vietnam, the ability to accurately estimate biomass and carbon in dipterocarpforests is complicated further by the mixed-species nature of this forest type [4].
Jenkins et al. [6,7] performed a modified national-level meta-analysis of allometric regressionequations for total aboveground biomass (AGB) based on tree diameter and developed consistentequations for tree species in the United States using a logarithm function as the general form ofthese equations. Power models relating tree AGB to diameter at breast height (DBH) or morecomplex associations of input variables have also been widely developed and used for pantropic [8,9].For example, Ter-Mikaelian and Korzukhin [10] used power models to estimate biomass for 65 NorthAmerican tree species. In general, numerous publications suggest power models as a suitable option forbuilding allometric equations based on one or more variables [8,11]. In developing biomass equationsfor pantropic or dipterocarp forests in the Southeast Asia, Brown [12], and Basuki et al. [13] appliedlogarithmic transformation of the power model. Picard et al. [14] pointed out that although beinga good model for biomass prediction, the power model was outperformed by the allometric model.
The literature on allometric equations developed to estimate biomass for tropical forests issizable [12,13,15–21]. However, there is limited literature and allometric equations for tropicaldipterocarp forests [13] despite covering extensive areas in tropical Southeast Asia. To date, thereare only a few general pantropical equations, but due to the range of diverse forest types withdifferent characteristics in this region, there is a need to develop more specific biomass equations.Using data collected from 122 destructively sampled trees, Basuki et al. [13] developed allometricequations for dipterocarp forests, including one for each of the four main genera (Dipterocarpus,Hopea, Polaquium, and Shorea), one for commercial forests, and one for mixed-species of dipterocarpsin East Kalimantan, Indonesia. The input variables of these equations were DBH, wood density(WD), and commercial bole height. Despite the development of equations for the main genera of thedipterocarp forest type, these authors focused on only one model form: a power model linearizedby log transformation. Furthermore, they did not compare the predictive performances of genus ormixed-species allometric equations.
In Vietnam, there were a few allometric equations developed before the beginning of theUN-REDD programme [8,9]. Recently, Huy et al. [22] developed aboveground biomass equations forthe evergreen broadleaf forests of the South Central Coastal ecoregion. The authors of this study reporton the development of national-scale allometric equations to estimate tree biomass for the dipterocarpforest type in Vietnam, which was summarized and introduced by Sola et al. [8,9]. The objectives of thisstudy were to: (i) develop equations to estimate AGB of dipterocarp forests in Vietnam; (ii) examinethe performance of nonlinear mixed models using ecoregion as a random effect and develop separateequations for both mixed-species and dominant genera; and (iii) validate the accuracy of selectedequations and compare them with both allometric equations for dipterocarps in Indonesia [13] andgeneral pantropic equations [12,16,17,19].
2. Materials and Methods
2.1. Study Sites
The data for this study were collected in two of the eight agro-ecological zones or ecoregionsof Vietnam [5,8]: CH and SE. (Binh Thuan Province). The ecoregion classification accounts for

Forests 2016, 7, 180 3 of 19
environmental variability with respect to climate, soil, and altitude, and is therefore relevant to foreststratification. Most of the country’s dipterocarp forests exist within the CH and SE ecoregions. Figure 1shows the location of sample plots of dipterocarps of two agro-ecological zones.
Forests 2016, 7, 180 3 of 20
environmental variability with respect to climate, soil, and altitude, and is therefore relevant to forest
stratification. Most of the country’s dipterocarp forests exist within the CH and SE ecoregions. Figure
1 shows the location of sample plots of dipterocarps of two agro‐ecological zones.
Figure 1. The location of sample plots in two ecoregions where the dipterocarp forests of Viet Nam
are distributed.
The CH has an area of approximately 600,000 ha of the dipterocarp forest located at an elevation
of 197 to 417 m with less than 10° slope. Mean annual rainfall is 1600 mm with a dry season lasting
four months and mean annual temperature of 25.3 °C [23]. The SE ecoregion has an area of
approximately 50,000 ha of the dipterocarp forest located at an elevation of 230 m with less than 3°
slope. Mean annual rainfall for this ecoregion is 1003 mm with a dry season lasting three months and
mean annual temperature of 25.5 °C [23]. Both ecoregions have a mixed‐dipterocarp forest that is
distributed primarily on a soil type of igneous rocks [24] with stand density ranging from 256 to 1292
trees ha−1 and basal area ranging from 10 to 25 m2 ha−1.
2.2. Sampling Design and Data Collection
Forest inventory data for the CH and SE ecoregions was collected with the support of Viet Nam
UN‐REDD+ Phase I Program. Most of the data for the CH ecoregion was collected by the main author
of this study (Huy et al. [25]) with the support of the Viet Nam Ministry of Education and Training.
Thirteen 0.25 ha (50 m × 50 m) plots from the CH, home of the dipterocarp forests in Viet Nam, and
one 1 ha plot from the SE ecoregion were surveyed. Attributes measured were plot location, forest
status, basal area, slope, soil type, and standing tree measurements: species, DBH (cm), and tree
Figure 1. The location of sample plots in two ecoregions where the dipterocarp forests of Vietnamare distributed.
The CH has an area of approximately 600,000 ha of the dipterocarp forest located at an elevationof 197 to 417 m with less than 10◦ slope. Mean annual rainfall is 1600 mm with a dry season lasting fourmonths and mean annual temperature of 25.3 ◦C [23]. The SE ecoregion has an area of approximately50,000 ha of the dipterocarp forest located at an elevation of 230 m with less than 3◦ slope. Meanannual rainfall for this ecoregion is 1003 mm with a dry season lasting three months and mean annualtemperature of 25.5 ◦C [23]. Both ecoregions have a mixed-dipterocarp forest that is distributedprimarily on a soil type of igneous rocks [24] with stand density ranging from 256 to 1292 trees ha−1
and basal area ranging from 10 to 25 m2 ha−1.
2.2. Sampling Design and Data Collection
Forest inventory data for the CH and SE ecoregions was collected with the support of VietnamUN-REDD+ Phase I Program. Most of the data for the CH ecoregion was collected by the main authorof this study (Huy et al. [25]) with the support of the Vietnam Ministry of Education and Training.Thirteen 0.25 ha (50 m × 50 m) plots from the CH, home of the dipterocarp forests in Vietnam, and one

Forests 2016, 7, 180 4 of 19
1 ha plot from the SE ecoregion were surveyed. Attributes measured were plot location, forest status,basal area, slope, soil type, and standing tree measurements: species, DBH (cm), and tree height (H, m)of all trees with DBH ≥ 5 cm. Within the sample plots, the selection of sample trees was proportionalto the number of trees in each of the 10 cm DBH class. The DBH of sample trees ranged from 5 to 50 cmand heights ranged from 2 to 24 m. A complete list of the species, families, and genera of the sampletrees used in modeling is provided in Table 1. A total of 222 trees were destructively sampled for datacollection between the CH (168 trees, 10–15 trees per 0.25-ha plot) and SE (54 trees) ecoregion.
Table 1. Number of destructively sampled trees (N), average WD and standard deviation (SD) of WDby family, genus, and species. Family and genus-level averages are in bold.
Family/Genus/Species N Average WD (g/cm3) SD of WD (g/cm3)
Chrysobalanaceae 3 0.535665 0.016343Parinari 3 0.535665 0.016343
Parinari anamensis Hance 3 0.535665 0.016343Combretaceae 23 0.747057 0.094749
Terminalia 23 0.747057 0.094749Terminalia alata Roth 16 0.730093 0.100805
Terminalia corticosa Pierre ex Laness 7 0.785830 0.070653Dilleniaceae 2 0.700423 0.246027
Dillenia 2 0.700423 0.246027Dillenia sp. 2 0.700423 0.246027
Dipterocarpaceae 130 0.657599 0.098560Dipterocarpus 94 0.627294 0.080587
Dipterocarpus intricatus Dyer 21 0.589667 0.037682Dipterocarpus obtusifolius Teijsm. ex Miq. 10 0.640704 0.050715
Dipterocarpus tuberculatus Roxb. 63 0.637707 0.091056Shorea 36 0.736729 0.098185
Shorea obtusa Wall. ex Blume 28 0.772400 0.074928Shorea siamensis Miq. 8 0.611881 0.060359
Phyllanthaceae 7 0.612478 0.074246Aporosa 7 0.612478 0.074246
Aporosa sp. 7 0.612478 0.074246Hypericaceae 1 0.625000 -Cratoxylum 1 0.625000 -
Cratoxylum formosum (Jacq.) Benth. & Hook.f. exDyer 1 0.625000 -
Irvingiaceae 6 0.704833 0.017702Irvingia 6 0.704833 0.017702
Irvingia malayana Oliv. ex A.W.Benn. 6 0.704833 0.017702Lauraceae 2 0.585500 0.024749
Cryptocarya 2 0.585500 0.024749Cryptocarya sp. 2 0.585500 0.024749Lecythidaceae 5 0.592586 0.134872
Careya 5 0.592586 0.134872Careya arborea Roxb. 5 0.592586 0.134872
Leguminosae 19 0.683648 0.082150Dalbergia 4 0.606063 0.049240
Dalbergia cochinchinensis Pierre 3 0.587667 0.040079Dalbergia nigrescens var. saigonensis (Pierre) Gagnep. 1 0.661252 -
Sindora 1 0.818989 -Sindora siamensis Miq. 1 0.818989 -
Xylia 14 0.696148 0.073180Xylia xylocarpa (Roxb.) Taub. 14 0.696148 0.073180
Loganiaceae 2 0.600613 0.006983Strychnos 2 0.600613 0.006983
Strychnos nux-blanda A.W. Hill 2 0.600613 0.006983Myrtaceae 6 0.521244 0.062018Syzygium 6 0.521244 0.062018

Forests 2016, 7, 180 5 of 19
Table 1. Cont.
Family/Genus/Species N Average WD (g/cm3) SD of WD (g/cm3)
Syzygium cumini (L.) Skeels 2 0.589732 0.062332Syzygium sp. 4 0.487000 0.020607Rubiaceae 15 0.589079 0.051010
Adina 2 0.571000 0.000000Adina pilulifera (Lam.) Franch. ex Drake 2 0.571000 0.000000
Haldina 2 0.611293 0.031190Haldina cordifolia (Roxb.) Ridsdale 2 0.611293 0.031190
Morinda 1 0.463000 -Morinda citrifolia L. 1 0.463000 -
Nauclea 10 0.600860 0.042858Nauclea orientalis (L.) L. 10 0.600860 0.042858
Sapindaceae 1 0.630000 -Sapindus 1 0.630000 -
Sapindus saponaria L. 1 0.630000 -Grand Total 222 0.656475 0.101823
Species name was recorded and DBH, H were measured on sample trees prior to felling. Total treeheight (H) and green component mass for stems with bark, branches, and foliage was measured postfelling. To establish the green-to-dry ratio of each tree, five samples for stem, three for branches,and two for old and new leaves were brought to the laboratory in sealed plastic bags to determinemoisture content and reweighed to determine their mass in grams. Samples were then dried at 105 ◦Cuntil a constant weight was reached [13,21,26]. The dry biomass of stem, branches, and leaves wasestimated by multiplying the green biomass with the averaged green-to-dry ratio of each component.The total dry weight of a tree (AGB) was obtained by summing the dry biomass of the stem, branches,and foliage.
For wood density (WD) analysis, samples were taken from every one-fifth of the stem length.The water displacement method was used to measure the volume, and the averaged WD (g/cm3) persample tree was calculated as oven-dry weight divided by volume at saturation.
Table 2 shows a summary for each of the predictors and the response variables of the destructivelysampled trees for mixed-species and two main genera: Dipterocarpus and Shorea.
Table 2. Summary for each of the predictors and the response variables of the destructively sampledtrees for mixed-species and two main genera.
Level Summary DBH (cm) H (m) WD (g/cm3) AGB (kg)
Mixed-Species
Min 3.4 2.5 0.379 1.3Average 17.6 10.3 0.656 184.9Max 48.8 23.5 0.953 1710.8Standard Deviation 10.3 4.5 0.102 315.0n 222 222 222 222
Dipterocarpus Genus
Min 4.9 3.8 0.379 1.5Average 20.4 11.2 0.627 285.6Max 48.8 23.5 0.858 1710.8Standard Deviation 12.4 5.3 0.081 431.8n 94 94 94 94
Shorea Genus
Min 5.6 4.4 0.507 2.9Average 15.2 9.4 0.737 86.4Max 23.0 14.1 0.917 205.9Standard Deviation 4.2 2.4 0.098 52.5n 36 36 36 36

Forests 2016, 7, 180 6 of 19
2.3. Equation Development and Selection
The dataset was randomly split 200 times into model development dataset (70% or 156 trees) andvalidation dataset (30% or 66 trees). After selecting, validating, and comparing the equations, the finalparameters of the selected equations were obtained using the entire dataset (222 trees).
Equations were developed at two levels: mixed-species (all trees) and dominant genera of thedipterocarps (Dipterocarpus and Shorea). Exploratory analysis of destructively sampled tree data byecoregion, family, and genus suggested the use of a power model with random effects (Figure 2).
Forests 2016, 7, 180 6 of 20
Table 2. Summary for each of the predictors and the response variables of the destructively sampled
trees for mixed‐species and two main genera.
Level Summary DBH (cm) H (m) WD (g/cm3) AGB (kg)
Mixed‐Species
Min 3.4 2.5 0.379 1.3
Average 17.6 10.3 0.656 184.9
Max 48.8 23.5 0.953 1,710.8
Standard Deviation 10.3 4.5 0.102 315.0
n 222 222 222 222
Dipterocarpus Genus
Min 4.9 3.8 0.379 1.5
Average 20.4 11.2 0.627 285.6
Max 48.8 23.5 0.858 1710.8
Standard Deviation 12.4 5.3 0.081 431.8
n 94 94 94 94
Shorea Genus
Min 5.6 4.4 0.507 2.9
Average 15.2 9.4 0.737 86.4
Max 23.0 14.1 0.917 205.9
Standard Deviation 4.2 2.4 0.098 52.5
n 36 36 36 36
2.3. Equation Development and Selection
The dataset was randomly split 200 times into model development dataset (70% or 156 trees)
and validation dataset (30% or 66 trees). After selecting, validating, and comparing the equations, the
final parameters of the selected equations were obtained using the entire dataset (222 trees).
Equations were developed at two levels: mixed‐species (all trees) and dominant genera of the
dipterocarps (Dipterocarpus and Shorea). Exploratory analysis of destructively sampled tree data by
ecoregion, family, and genus suggested the use of a power model with random effects (Figure 2).
Figure 2. AGB vs. DBH of destructively sampled trees by ecoregion, plant family, and genus. The
trend of relationship between AGB and DBH follows power model.
The nonlinear mixed‐effects models used in this study had the following form:
ε (1)
ε ~ 0, (2)
where is the observed ABG (kg) for the jth tree associated with the ith ecoregion; and are
parameters of the model; and are parameters associated with the random effect of the ith
ecoregion; and is the DBH (cm), H (m), WD (g/cm3), DBH2H (m3), or DBH2HWD (kg) for the jth
Figure 2. AGB vs. DBH of destructively sampled trees by ecoregion, plant family, and genus. The trendof relationship between AGB and DBH follows power model.
The nonlinear mixed-effects models used in this study had the following form:
Yij = (ao + ai)× Xij(bo+ bi) + εij (1)
εij ∼ iid N(
0,σ2)
(2)
where Yij is the observed ABG (kg) for the jth tree associated with the ith ecoregion; ao and bo areparameters of the model; ai and bi are parameters associated with the random effect of the ith ecoregion;and Xij is the DBH (cm), H (m), WD (g/cm3), DBH2H (m3), or DBH2HWD (kg) for the jth tree in ithecoregion; and εij is the random error associated with the jth tree in ith ecoregion. The input variablesDBH2H and DBH2HWD for Xij are approximations of volume and AGB, respectively, and werecalculated as follows:
DBH2H =
(DBH100
)2×H (3)
DBH2HWD = DBH2H×WD× 1000 (4)
Preliminary analysis also indicated that heterogeneous variance of residuals existed in all AGBmodels, as the variance tended to increase with increasing diameters. A power variance function asdefined in Equation (5) was used to take into account the heterogeneity of residuals.
Var(εij)= σ2(Xij)
k (5)
where σ2 is the residual sum of squares, Xij is the weighting variable (DBH, DBH2H, or DBH2HWD inthis study), and k is the variance function coefficient. The weighted nonlinear mixed-effects modelswith a specified variance function were fit using the NLME package [27] in R statistical software [28].
Allometric equations were first developed for mixed-species (all trees) and the best modelforms for each input variable were selected. Best models were determined as those with significant

Forests 2016, 7, 180 7 of 19
parameters, no obvious issues with diagnostic plot, lower Akaike information criterion (AIC), andhigher adjusted R2. The random effect of ecoregion was then tested for significance. Finally, theequations were built for two dominant genera of dipterocarp forests, Dipterocarpus and Shorea.
2.4. Equation Validation and Comparison
Performance of selected equations were validated and compared to each other and to equationsdeveloped for the dipterocarp and pantropic forests in terms of percent bias, root mean squarepercentage error (RMSPE), and mean absolute percent error (MAPE) [29]. These indicators werecalculated for the validation dataset and smaller values were preferred. The cross-validationstatistics were computed for each realization of randomly selected data and averaged over the200 realizations [30].
Percent Bias =100R
R
∑r=1
nr
∑i=1
[yri − yri
yri
]/nr (6)
R
∑r=1
√√√√ nr
∑i=1
(yri − yri
yri
)2/nr (7)
MAPE =100R
R
∑r=1
nr
∑i=1
[|yri − yri|
yri
]/nr (8)
where, R is the number of realizations (200); nr is the number of trees per realization r; yri and yri arethe observed and predicted AGB (kg) for the ith tree in realization r, respectively.
The validation dataset was used to evaluate the performance of the following allometric equationsdeveloped for pantropic and dipterocarp forests of Indonesia and compared with the selected equationsfor mixed-species and genera developed in this study:
Pan-tropic equations for mixed-species:Brown (1997) [12]:
AGB = exp (−2.134 + 2.530× log (DBH)) (9)
IPCC (2003) [19]:
AGB = exp(−2.289 + 2.649× log (DBH)− 0.021× (log (DBH))2
)(10)
Chave et al. (2005) [16] for dry forests:
AGB = WD× exp(−0.667 + 1.784× log (DBH) + 0.207× (log (DBH))2 − 0.0281× (log (DBH))3
)(11)
Chave et al. (2014) [17]:
AGB = 0.0673×(
WD×DBH2 ×H)0.976
(12)
Dipterocarp forest equations of Basuki et al. [13] for Indonesia:Basuki et al. I (2009) for mixed-species:
AGB = exp (−1.201 + 2.196× log (DBH)) (13)
Basuki et al. II (2009) for mixed-species:
AGB = exp (−0.744 + 2.188× log (DBH) + 0.832× log (WD)) (14)
Basuki et al. I (2009) for Dipterocarpus genus:

Forests 2016, 7, 180 8 of 19
AGB = exp (−1.232 + 2.178× log (DBH)) (15)
Basuki et al. I (2009) for Shorea genus:
AGB = exp (−2.193 + 2.371× log (DBH)) (16)
where, log(·) is natural logarithm and all other variables are as previously defined.Finally, after selecting, validating, and comparing the equations with the pantropic and
dipterocarp equations in Indonesia, the parameters of the selected equations in this study wereobtained using the entire dataset (222 trees).
3. Results
Sizable differences were observed in WD among tree species, genus, and family. Average andstandard deviation of WD for each plant species, genus, and family are presented in Table 1 andFigure 3.
Forests 2016, 7, 180 8 of 20
Chave et al. (2014) [17]: AGB 0.0673 WD DBH H . (12)
Dipterocarp forest equations of Basuki et al. [13] for Indonesia:
Basuki et al. I (2009) for mixed‐species: AGB exp 1.201 2.196 log DBH (13)
Basuki et al. II (2009) for mixed‐species: AGB exp 0.744 2.188 log DBH0.832 log WD
(14)
Basuki et al I (2009) for Dipterocarpus genus: AGB exp 1.232 2.178log DBH
(15)
Basuki et al. I (2009) for Shorea genus: AGB exp 2.193 2.371 log DBH (16)
where, log(∙) is natural logarithm and all other variables are as previously defined.
Finally, after selecting, validating, and comparing the equations with the pantropic and
dipterocarp equations in Indonesia, the parameters of the selected equations in this study were
obtained using the entire dataset (222 trees).
3. Results
Sizable differences were observed in WD among tree species, genus, and family. Average and
standard deviation of WD for each plant species, genus, and family are presented in Table 1 and
Figure 3.
Figure 3. Box plot of WD by sampled genera in alphabetical order. Numbers inside the boxplots
represent the sample size in that genus.
3.1. Equations for Mixed‐Species
The summary of the model fit for fixed‐ and mixed‐effects models using different covariates to
describe AGB in mixed‐species forests are given in Table 3. The adjusted R2 of all models was more
than 0.9 and the models that used separate input variables produced smaller AIC and RMSPE values
compared to the models that used combined variables as the covariates. Therefore, equations with
separate input variables were selected for mixed‐species AGB estimation. Parameter estimates for
these equations are presented in Table 4 and all parameters were statistically significant at the 0.001
Figure 3. Box plot of WD by sampled genera in alphabetical order. Numbers inside the boxplotsrepresent the sample size in that genus.
3.1. Equations for Mixed-Species
The summary of the model fit for fixed- and mixed-effects models using different covariates todescribe AGB in mixed-species forests are given in Table 3. The adjusted R2 of all models was morethan 0.9 and the models that used separate input variables produced smaller AIC and RMSPE valuescompared to the models that used combined variables as the covariates. Therefore, equations withseparate input variables were selected for mixed-species AGB estimation. Parameter estimates forthese equations are presented in Table 4 and all parameters were statistically significant at the 0.001level. Figure 4 shows the plots of fitted values and weighted residuals of those equations. The AICvalue of the three-variable (DBH, H, and WD) model with random effect of ecoregion was smallercompared to the same model without random effect. However, there was no substantial changes in

Forests 2016, 7, 180 9 of 19
the parameter estimates for different ecoregions. Therefore, we selected the fixed-effects model as ourfinal model.
Table 3. Comparison of different AGB models for mixed-species with and without the random effect ofecoregion (156 trees).
Model Selected Model Form Random Effect Weight Variable AIC Adj. R2 RMSPE
Covariate: DBHM1 AGB = a × DBHb None 1/DBH k 1335 0.966 59.0
AGB = a × DBHb Ecoregion 1/DBH k 1335 0.966 59.0
Covariates: DBH and H
M2 AGB = a × (DBH2H)b None 1/(DBH2H) k 1374 0.967 48.1AGB = a × DBHb × Hc None 1/DBH k 1324 0.975 51.1AGB = a × DBHb × Hc Ecoregion 1/DBH k 1324 0.975 51.1
Covariates: DBH and WDAGB = a × (DBH2WD)b None 1/(DBH2WD) k 1337 0.901 53.7
M3 AGB = a × DBHb ×WDc None 1/DBH k 1322 0.933 54.8AGB = a × DBHb ×WDc Ecoregion 1/DBH k 1322 0.933 54.8
Covariates: DBH, H, and WDAGB = a × (DBH2HWD)b None 1/(DBH2HWD) k 1323 0.945 39.3
M4 AGB = a × DBHb × Hc ×WDd None 1/DBH k 1298 0.940 43.7AGB = a × DBHb × Hc ×WDd Ecoregion 1/DBH k 1280 0.940 43.7
k is the variance function coefficient.
Table 4. Selected AGB models with different input variables, their parameter estimates, and standarderrors for mixed-species of the dipterocarp forests (based on the entire dataset, 222 trees).
Model Selected Covariate (s) Model Form Parameter Estimates Standard Error
M1 DBH AGB = a×DBHb a 0.04742 0.00434b 2.66663 0.03151
M2 DBH, H AGB = a×DBHb ×Hca 0.03844 0.00377b 2.40756 0.05861c 0.40408 0.07988
M3 DBH, WD AGB = a×DBHb ×WDca 0.07126 0.00843b 2.60940 0.03290c 0.59275 0.59275
M4 DBH, H, WD AGB = a×DBHb ×Hc ×WDd
a 0.06203 0.00679b 2.26430 0.05754c 0.51415 0.07497d 0.79456 0.11420
The effect of ecoregion was then tested on the selected mixed-species models. The inclusion ofecoregion as a random effect did not improve the model fit (Table 3), nor did it change the parameterestimates substantially. After examining the between-ecoregion variability of the coefficient of thepower equations, we found that there were no significant differences between the two ecoregions.Thus, the selected models with different input variables for mixed-species (equations in Table 4) canbe applied to either CH or SE without considering the effect of different ecoregions. Among thesemodels, the model with three input variables (DBH, H, and WD) performed the best and had thefollowing form:
AGB = 0.06203×DBH2.26430 ×H0.51415 ×WD0.79456 (17)

Forests 2016, 7, 180 10 of 19
Forests 2016, 7, 180 10 of 20
Model
Selected
Covariate
(s)
Model Form Parameter
Estimates
Standard
Error
c 0.51415 0.07497
d 0.79456 0.11420
Figure 4. Plots of selected AGB models for mixed‐species: fitted vs. observed (left column) and
residuals vs. fitted (right column) using the entire dataset of 222 destructively sampled trees. (a)
Model AGB = a × DBHb, (b) Model AGB = a × DBHb × Hc, (c) Model AGB = a × DBHb × Hc × WDd.
The effect of ecoregion was then tested on the selected mixed‐species models. The inclusion of
ecoregion as a random effect did not improve the model fit (Table 3), nor did it change the parameter
estimates substantially. After examining the between‐ecoregion variability of the coefficient of the
power equations, we found that there were no significant differences between the two ecoregions.
Figure 4. Plots of selected AGB models for mixed-species: fitted vs. observed (left column) andresiduals vs. fitted (right column) using the entire dataset of 222 destructively sampled trees. (a) ModelAGB = a × DBHb; (b) Model AGB = a × DBHb × Hc; (c) Model AGB = a × DBHb × Hc ×WDd.
3.2. Equations for Dominant Genera
The summary of the model fit for fixed-effects models using different covariates to describeAGB for these genera are given in Table 5. AIC and R2 were very close between models for the samegenus. Therefore, models with the fewest parameters were selected for parsimony and their parameterestimates are presented in Table 6.

Forests 2016, 7, 180 11 of 19
Table 5. Comparison of different AGB models with different input variables for Dipterocarpus (67 trees)and for Shorea (26 trees).
Model Selected Covariate(s) Model Form Weight Variable AIC Adj. R2 RMSPE
Genus: DipterocarpusD1 DBH AGB = a × DBHb 1/DBH k 600 0.970 60.7D2
DBH, HAGB = a × (DBH2H)b 1/DBH k 616 0.965 46.5AGB = a × DBHb × Hc 1/DBH k 600 0.979 54.1
D3DBH, WD
AGB = a × (DBH2WD)b 1/(DBH2WD) k 603 0.920 61.8AGB = a × DBHb ×WDc(#) 1/DBH k 605 0.952 59.9
D4DBH, H, WD
AGB = a × (DBH2HWD)b 1/(DBH2HWD) k 602 0.970 45.2AGB = a × DBHb × Hc ×WDd 1/DBH k 601 0.970 49.8
Genus: ShoreaS1 DBH AGB = a × DBHb 1/DBH k 220 0.919 25.4S2
DBH, HAGB = a × (DBH2H)b 1/(DBH2H) k 231 0.861 33.6AGB = a × DBHb × Hc(#) 1/DBH k 227 0.921 25.9
S3DBH, WD
AGB = a × (DBH2WD)b 1/(DBH2WD) k 224 0.881 22.3AGB = a × DBHb ×WDc(#) 1/DBH k 226 0.912 22.6
S4DBH, H, WD
AGB = a × (DBH2HWD)b 1/(DBH2HWD) k 220 0.894 24.0AGB = a × DBHb × Hc(#) ×WDd 1/DBH k 231 0.920 21.0
(#): p-value of the parameter > 0.05 and k is the variance function coefficient.
Table 6. Parameter estimates and their standard errors for the selected AGB models with differentinput variables for Dipterocarpus (the entire dataset, 94 trees) and for Shorea (the entire dataset, 36 trees).
Model Selected Covariate (s) Model FormParameter Estimates Standard Error
a b a b
Genus: DipterocarpusD1 DBH AGB = a×DBHb 0.03713 2.73813 0.00488 0.04310
D2 DBH, H AGB = a× (DBH2H)b
290.370 1.03913 9.30399 0.01900
D3 DBH, WD AGB = a× (DBH2WD)b
0.09387 1.31539 0.01047 0.02101
D4 DBH, H, WD AGB = a× (DBH2HWD)b
0.45812 1.00673 0.04729 0.01707
Genus: ShoreaS1 DBH AGB = a×DBHb 0.07483 2.54496 0.02897 0.13722
S2 DBH, H AGB = a× (DBH2H)b
325.264 0.95220 24.2081 0.04909
S3 DBH, WD AGB = a× (DBH2WD)b
0.19114 1.16390 0.06181 0.06166
S4 DBH, H, WD AGB = a× (DBH2HWD)b
0.69838 0.92173 0.13807 0.03772
However, as increasing the number of input variables from one (DBH) to three (DBH, H, and WD)did not improve model fit for either genus, the following simple AGB models with DBH as the onlyindependent variable were selected for Dipterocarpus and Shorea, respectively.
Dipterocarpus : AGB = 0.03713×DBH2.73813 (18)
Shorea : AGB = 0.07483×DBH2.54496 (19)
When differences between observed and predicted AGB values were compared over tree size, noevidence of lack of fit was found. The models predicted AGB across tree sizes well for both Dipterocarpusand Shorea. The plots of fitted and weighted residuals of the selected models showed no trend orpatterns for both genera (Figure 5).

Forests 2016, 7, 180 12 of 19
Forests 2016, 7, 180 12 of 20
Model
Selected
Covariate
(s)
Model Form Parameter
Estimates
Standard Error
a b a b
D2 DBH, H AGB DBH H 290.370 1.03913 9.30399 0.01900
D3 DBH, WD AGB DBH WD 0.09387 1.31539 0.01047 0.02101
D4 DBH, H,
WD
AGB DBH HWD 0.45812 1.00673 0.04729 0.01707
Genus: Shorea
S1 DBH AGB DBH 0.07483 2.54496 0.02897 0.13722
S2 DBH, H AGB DBH H 325.264 0.95220 24.2081 0.04909
S3 DBH, WD AGB DBH WD 0.19114 1.16390 0.06181 0.06166
S4 DBH, H,
WD
AGB DBH HWD 0.69838 0.92173 0.13807 0.03772
However, as increasing the number of input variables from one (DBH) to three (DBH, H, and
WD) did not improve model fit for either genus, the following simple AGB models with DBH as the
only independent variable were selected for Dipterocarpus and Shorea, respectively.
Dipterocarpus: AGB 0.03713 DBH . (18)
Shorea: AGB 0.07483 DBH . (19)
When differences between observed and predicted AGB values were compared over tree size,
no evidence of lack of fit was found. The models predicted AGB across tree sizes well for both
Dipterocarpus and Shorea. The plots of fitted and weighted residuals of the selected models showed
no trend or patterns for both genera (Figure 5).
Forests 2016, 7, 180 13 of 20
Figure 5. Plots of fitted values vs. DBH (left) and fitted values vs. weighted residuals (right) of the
selected model AGB = a × DBHb for two main genera: (a) Dipterocarpus (the entire dataset, n = 94 trees),
and (b) for Shorea (the entire dataset, n = 36 trees).
3.3. Equation Validation and Comparison
Mixed‐species equations:
Cross‐validation was employed for the four selected mixed‐species equations (M1–M4) and
compared to the mixed‐species equations for dipterocarp of Indonesia (Equations (13) and (14)) and
pantropic forests (Equations (9)–(12)). Averaged validation statistics over the 200 realizations for
mixed‐species equations are presented in Table 7 for all three DBH classes.
The MAPE of the four selected equations (M1–M4) ranged from 24.0% to 25.7%, while the range
was from 36.6% to 81.9% for the pantropic equations. Compared to the generic pantropic equations,
the equations regionally specific to Viet Nam reduced MAPE by 13% to 56% for dipterocarp forests
in Viet Nam.
Table 7. Percent bias, RMSPE, and MAPE for the selected mixed‐species models, mixed‐species
models for dipterocarp forest of Indonesia, and pantropical models for mixed‐species by covariate (s).
Covariate (s) Model DBH Class
(cm)
Percent
Bias
RMSPE MAPE
DBH
Brown (1997)
[12]
Equation (9)
<15 −86.5 106.7 86.5
15–30 −74.0 80.9 74.0
>30 −79.0 92.7 79.0
All −80.9 101.5 80.9
IPCC (2003)
[18]
Equation (10)
<15 −86.8 106.4 86.8
15–30 −76.2 83.1 76.2
> 30 −79.2 93.0 79.2
All −81.9 102.0 81.9
Basuki et al. I
(2009) [13]
Equation (13)
<15 −132.2 163.5 132.2
15–30 −64.6 72.0 64.6
> 30 −37.7 57.6 47.8
All −92.3 126.2 94.2
M1 <15 2.5 32.0 24.3
15–30 −3.4 21.9 19.4
Figure 5. Plots of fitted values vs. DBH (left) and fitted values vs. weighted residuals (right) of theselected model AGB = a × DBHb for two main genera: (a) Dipterocarpus (the entire dataset, n = 94 trees),and (b) for Shorea (the entire dataset, n = 36 trees).
3.3. Equation Validation and Comparison
Mixed-species equations:Cross-validation was employed for the four selected mixed-species equations (M1–M4) and
compared to the mixed-species equations for dipterocarp of Indonesia (Equations (13) and (14)) andpantropic forests (Equations (9)–(12)). Averaged validation statistics over the 200 realizations formixed-species equations are presented in Table 7 for all three DBH classes.
The MAPE of the four selected equations (M1–M4) ranged from 24.0% to 25.7%, while the rangewas from 36.6% to 81.9% for the pantropic equations. Compared to the generic pantropic equations,the equations regionally specific to Vietnam reduced MAPE by 13% to 56% for dipterocarp forestsin Vietnam.
The AGB estimates obtained from the four selected mixed-species equations (M1–M4),closely match the observed values of the validation dataset (Figure 6) and produced the lowestvalues for percent bias, RMSPE, and MAPE in all three DBH classes (Table 7). The pantropic equationsand the equations developed for dipterocarp forests of Indonesia (Equations (9)–(14)) all overestimatedAGB for the validation dataset (Figure 6) and had significantly higher percent bias, RMSPE, and MAPEthan produced by equations M1–M4 in all three DBH classes (Table 7).

Forests 2016, 7, 180 13 of 19
Table 7. Percent bias, RMSPE, and MAPE for the selected mixed-species models, mixed-species modelsfor dipterocarp forest of Indonesia, and pantropical models for mixed-species by covariate (s).
Covariate (s) Model DBH Class (cm) Percent Bias RMSPE MAPE
DBH
Brown (1997) [12]Equation (9)
<15 −86.5 106.7 86.515–30 −74.0 80.9 74.0
>30 −79.0 92.7 79.0All −80.9 101.5 80.9
IPCC (2003) [18]Equation (10)
<15 −86.8 106.4 86.815–30 −76.2 83.1 76.2
> 30 −79.2 93.0 79.2All −81.9 102.0 81.9
Basuki et al. I (2009) [13]Equation (13)
<15 −132.2 163.5 132.215–30 −64.6 72.0 64.6
> 30 −37.7 57.6 47.8All −92.3 126.2 94.2
M1
<15 2.5 32.0 24.315–30 −3.4 21.9 19.4
>30 −17.2 43.7 38.1All −3.1 34.6 25.2
DBH, H M2
<15 0.1 31.6 24.215–30 −2.1 19.9 16.9
>30 −18.0 41.8 36.2All −3.9 33.5 24.0
DBH, WD
Chave et al. (2005) [16]Equation (11)
<15 −97.2 117.3 97.315–30 −73.8 83.8 73.8
>30 −46.5 69.7 56.0All −79.2 105.0 81.1
Basuki et al. II (2009) [13]Equation (14)
<15 −139.2 164.2 139.215–30 −90.3 99.1 90.3
>30 −56.4 76.4 61.5All −107.6 136.9 108.7
M3
< 15 2.8 28.4 21.115–30 −8.3 27.4 23.6
>30 −15.5 47.2 39.6All −4.1 36.5 25.7
DBH, H, WD
Chave et al. (2014) [17]Equation (12)
<15 −27.1 44.5 33.015–30 −30.9 41.8 33.9
>30 −42.9 60.3 48.2All -31.2 53.5 36.6
M4
< 15 0.1 26.5 20.615–30 −7.4 23.7 20.2
>30 −16.6 46.1 38.5All −5.2 34.7 24.2

Forests 2016, 7, 180 14 of 19Forests 2016, 7, 180 15 of 20
Figure 6. Observed vs. predicted AGB obtained from the mixed‐species equations developed in this
study, pantropical equations, and equations for dipterocarp forest of Indonesia.
Genus‐level equations:
The selected genus‐level models for Dipterocarpus and Shorea (D1 and S1, respectively) were
cross‐validated and compared to those of Basuki et al. [13] that were developed for the same genera,
though located in Indonesia (Equations (15) and (16), respectively). Predictions from Equations (D1),
(S1) and (16) closely matched the random validation data, with low values for percent bias, RMSPE,
and MAPE in all three DBH classes (Table 8, Figure 7). The validation statistics (percent bias, RMSPE,
and MAPE) were higher for Equation 15, Basuki et al.’s Dipterocarpus equation (overall bias −50.9%
vs. 7.9%), but the biases were similar for Shorea (10.4% vs. 9.6%).
Figure 6. Observed vs. predicted AGB obtained from the mixed-species equations developed in thisstudy, pantropical equations, and equations for dipterocarp forest of Indonesia.
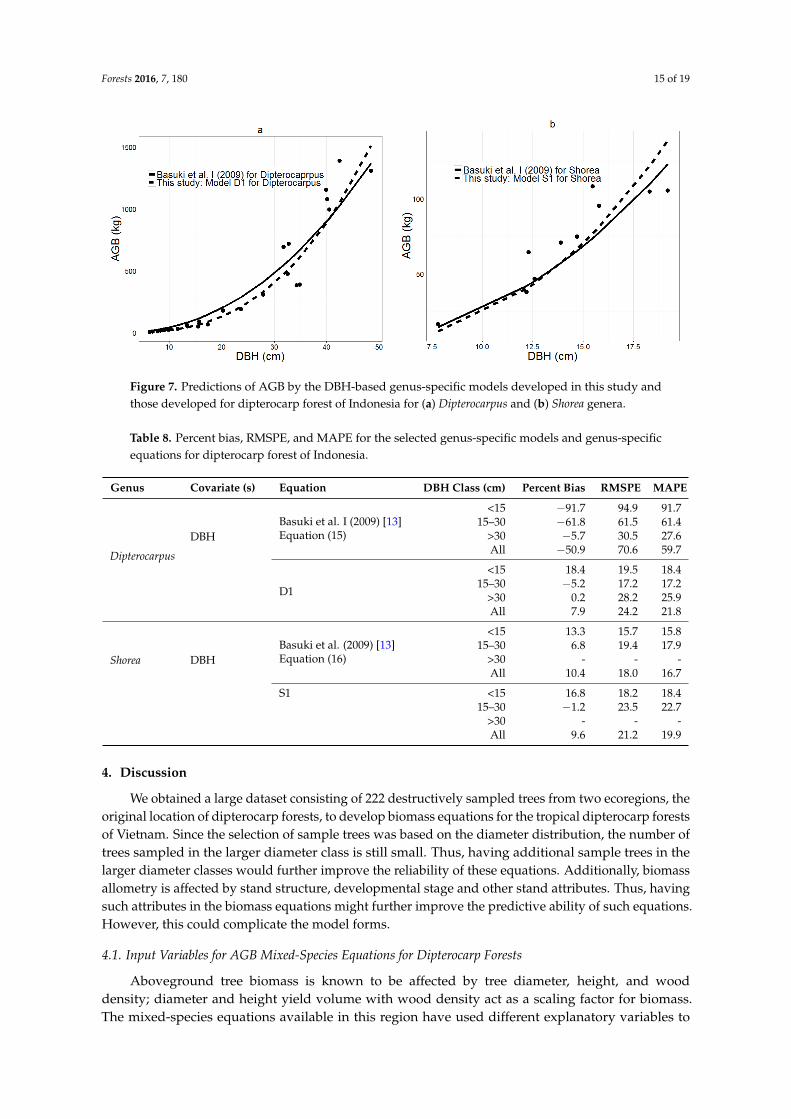
Genus-level equations:The selected genus-level models for Dipterocarpus and Shorea (D1 and S1, respectively) were
cross-validated and compared to those of Basuki et al. [13] that were developed for the same genera,though located in Indonesia (Equations (15) and (16), respectively). Predictions from Equations(D1), (S1) and (16) closely matched the random validation data, with low values for percent bias,RMSPE, and MAPE in all three DBH classes (Table 8, Figure 7). The validation statistics (percent bias,RMSPE, and MAPE) were higher for Equation 15, Basuki et al.’s Dipterocarpus equation (overall bias−50.9% vs. 7.9%), but the biases were similar for Shorea (10.4% vs. 9.6%).
Forests 2016, 7, 180 15 of 19Forests 2016, 7, 180 16 of 20
Figure 7. Predictions of AGB by the DBH‐based genus‐specific models developed in this study and
those developed for dipterocarp forest of Indonesia for (a) Dipterocarpus and (b) Shorea genera.
Table 8. Percent bias, RMSPE, and MAPE for the selected genus‐specific models and genus‐specific
equations for dipterocarp forest of Indonesia.
Genus Covariate
(s) Equation
DBH Class
(cm)
Percent Bias RMSPE MAPE
Dipterocarpus
DBH
Basuki et
al. I (2009)
[13]
Equation
(15)
<15 −91.7 94.9 91.7
15–30 −61.8 61.5 61.4
>30 −5.7 30.5 27.6
All −50.9 70.6 59.7
D1
<15 18.4 19.5 18.4
15–30 −5.2 17.2 17.2
>30 0.2 28.2 25.9
All 7.9 24.2 21.8
Shorea DBH
Basuki et
al. (2009)
[13]
Equation
(16)
<15 13.3 15.7 15.8
15–30 6.8 19.4 17.9
>30 ‐ ‐ ‐
All 10.4 18.0 16.7
S1 <15 16.8 18.2 18.4
15–30 −1.2 23.5 22.7
>30 ‐ ‐ ‐
All 9.6 21.2 19.9
4. Discussion
We obtained a large dataset consisting of 222 destructively sampled trees from two ecoregions,
the original location of dipterocarp forests, to develop biomass equations for the tropical dipterocarp
forests of Viet Nam. Since the selection of sample trees was based on the diameter distribution, the
number of trees sampled in the larger diameter class is still small. Thus, having additional sample
trees in the larger diameter classes would further improve the reliability of these equations.
Figure 7. Predictions of AGB by the DBH-based genus-specific models developed in this study andthose developed for dipterocarp forest of Indonesia for (a) Dipterocarpus and (b) Shorea genera.
Table 8. Percent bias, RMSPE, and MAPE for the selected genus-specific models and genus-specificequations for dipterocarp forest of Indonesia.
Genus Covariate (s) Equation DBH Class (cm) Percent Bias RMSPE MAPE
Dipterocarpus
DBHBasuki et al. I (2009) [13]Equation (15)
<15 −91.7 94.9 91.715–30 −61.8 61.5 61.4
>30 −5.7 30.5 27.6All −50.9 70.6 59.7
D1
<15 18.4 19.5 18.415–30 −5.2 17.2 17.2
>30 0.2 28.2 25.9All 7.9 24.2 21.8
Shorea DBHBasuki et al. (2009) [13]Equation (16)
<15 13.3 15.7 15.815–30 6.8 19.4 17.9
>30 - - -All 10.4 18.0 16.7
S1 <15 16.8 18.2 18.415–30 −1.2 23.5 22.7
>30 - - -All 9.6 21.2 19.9
4. Discussion
We obtained a large dataset consisting of 222 destructively sampled trees from two ecoregions, theoriginal location of dipterocarp forests, to develop biomass equations for the tropical dipterocarp forestsof Vietnam. Since the selection of sample trees was based on the diameter distribution, the number oftrees sampled in the larger diameter class is still small. Thus, having additional sample trees in thelarger diameter classes would further improve the reliability of these equations. Additionally, biomassallometry is affected by stand structure, developmental stage and other stand attributes. Thus, havingsuch attributes in the biomass equations might further improve the predictive ability of such equations.However, this could complicate the model forms.
4.1. Input Variables for AGB Mixed-Species Equations for Dipterocarp Forests
Aboveground tree biomass is known to be affected by tree diameter, height, and wooddensity; diameter and height yield volume with wood density act as a scaling factor for biomass.The mixed-species equations available in this region have used different explanatory variables to

Forests 2016, 7, 180 16 of 19
estimate aboveground biomass e.g., [12,13,16,17,19]. For modeling AGB in mixed-species dipterocarpforests, we found that an equation with DBH as the only covariate performed poorly (highest AIC)when compared to equations that also incorporated H, WD, or both H and WD variables. Furthermore,the mixed-species equation developed in this study that incorporated all three variables resulted inthe lowest uncertainty and lowest AIC. This could be due to the fact that at the mixed-species level,the wood density component helps in adjusting for the differences in allometric relationship betweenDBH and H among species. Thus, the best option for mixed-species was the AGB equation with threevariables, DBH, H, and WD, in the form of M4. We would like to point out the use of height in fittingbiomass equations. Commonly, the height measured after felling the sample trees is used in modeldevelopment but the standing tree heights are used in applying these equations. This discrepancy inthe variable used in model fitting and application can result in biased estimate of the AGB and themagnitude of bias depends on the sign and magnitude of bias in height measurement as well as themodel form and coefficients.
4.2. Equations at the Mixed-Species Level in the Dipterocarp Forests of Southeast Asia
While generic equations for estimating AGB in tropical forests exist [12,16,17,19], the dipterocarpforest is a specific forest type dominated by the Dipterocarpaceae plant family and has specific siteconditions that differ from those of other forest types. Therefore, the application of pantropic equationsfor dipterocarp forests must be evaluated.
The mixed-species pantropic equations of Brown [12], IPCC [19], and Chave et al. [16,17] fortropical forests all overestimate the AGB of mixed-species dipterocarp forests in Vietnam (Figure 6).Based on the Vietnam mixed-species validation dataset, the pantropic equations produced higherpercent bias, RMSPE, and MAPE than the equations developed in this study for mixed-speciesdipterocarp forests of Vietnam (Table 7).
Basuki et al.’s [13] equations for mixed-species dipterocarp forests in Indonesia (Equations (13)and (14)) also overestimated the AGB of mixed-species dipterocarp forests in Vietnam (Figure 6).These mixed-species equations developed based on dipterocarp forests of Indonesia resulted insubstantially higher MAPE (94% to 108%) than the selected mixed-species equations developed in thisstudy (24% to 26%). The substantial differences in performance between these sets of equations canpartially be explained by the different species used in the studies. There was no overlap in speciesused in equation development between the 26 species reported by Basuki et al. [14] and the 26 speciesfrom this study, despite the fact that they include some of the same main families and genera, such asDipterocarpus and Shorea. Our evaluation shows that while equations developed for specific ecoregions(e.g., CH or SE) do not increase the reliability and accuracy of the AGB estimates when applied at themixed-species level of the dipterocarps, regionally specific equations (e.g., Vietnam) offer considerableimprovement over pantropic equations or equations developed for other regions (e.g., Indonesia).This finding is supported by the work of Basuki et al. [14], Nelson et al. (1999) [31], and Cairns et al.(2003) [32], which indicated that site-specific equations improve the accuracy of biomass estimates [33].
4.3. Equations at the Genus Level in the Dipterocarp Forests of Southeast Asia
The results demonstrate that the allometric equations developed at the genus-level in differentregions (e.g., Vietnam vs. Indonesia) were not significantly different in accuracy (Figure 7 and Table 8).As a subset of the species list for mixed-species equations, the species list for the Dipterocarpus andShorea genera used in genus-level equation development by Basuki et al. [13] differed from that of thisstudy (Table 1). However, the prediction of AGB values from the genus equations of Basuki et al. [13](Equations 16 for Shorea genus) and from this study (S1) were not substantially different. This couldbe because the species in the same genus have similar of tree foliage structure, stem form, and inparticular the WD, compared to trees in a different genus (Figure 3). Such differences are not accountedfor in the generic equations. These evaluations support the application of common equations for eachplant genus of the dipterocarp forests throughout Southeast Asia. Future research using additionaldata would further validate our findings.

Forests 2016, 7, 180 17 of 19
5. Conclusions
All variables of diameter at breast height (DBH), height (H), and wood density (WD) affectedaboveground biomass (AGB). Increasing number of input variables from one to three reduced theuncertainty of the estimates. However, from an application perspective, a simpler model might bepreferred as obtaining the wood density variable is very difficult. In general, for tropical forests witha large number of tree species, using the mixed-species model with multi-tree input variables wasappropriate to improve the accuracy of the AGB estimates.
The predicted values from generic equations overestimated AGB in mixed-species dipterocarpforests. Because the dipterocarp forest is a specific forest type, the equations specific to different regionsof Southeast Asia are appropriate and increase the reliability and accuracy of the AGB estimates.
The power models with DBH as the only input variable for the Dipterocarpus and Shoreagenera were developed and validated for application to the dipterocarps. We speculate that usinggenus-specific equations improve the reliability of the AGB estimates in the dipterocarp forestsover generic mixed-species equations. There were no substantial differences in accuracy amongthe developed equations for the same genus in different regions or countries. Therefore, it seemsreasonable to develop and apply the common equations for each genus of the dipterocarps throughoutSoutheast Asia.
Acknowledgments: This work was undertaken in 2014, with the support of the UN-REDD+ Vietnam Phase IIProgram and built on an extensive field measurement campaign supported by the UN-REDD+ Vietnam Phase IProgram in 2012 and 2013, and a research was carried out in 2010–2013 in the Central Highlands by Tay NguyenUniversity with funding from Ministry of Education and Training. Four institutions collaborated on the fieldwork and analysis: Forest Inventory and Planning Institute, Vietnamese Academy of Forest Sciences, VietnamNational University of Forestry and Tay Nguyen University, with technical assistance from FAO. The authors alsowould like to acknowledge technical support provided by Gael Sola (FAO). We acknowledge Caryn Davis for heredits on an earlier manuscript.
Author Contributions: Bao Huy, Nguyen Dinh Hung, Phung Van Khoa, Vu Tan Phuong collected data setand analyzed the raw data; Bao Huy, Hailemariam Temesgen, Krishna P. Poudel developed methodologyand analyzed data for equation development and validation; Bao Huy, Krishna P. Poudel, Karin Kralicek,Hailemariam Temesgen, Nguyen Dinh Hung, Phung Van Khoa and Vu Tan Phuong wrote the paper.
Conflicts of Interest: The authors declare no conflict of interest.
References
1. Measurement, Reporting & Verification (MRV) Framework Document. Available online: http://theredddesk.org/resources/measurement-reporting-and-verification-framework-document (accessed on 17 August 2016).
2. UNFCCC (United Nations Framework Convention on Climate Change). Report of the Conference of the Partieson its Thirteenth Session; Proceedings of UNFCCC: Bonn, Germany, 2008.
3. Appanah, S. Management of Natural Forests. In A Review of Dipterocarp: Taxonomy, Ecology and Silviculture;Appanah, S., Turnbull, J.M., Eds.; Center for International Forestry Research (CIFOR): Bogor, Indonesia, 1998;pp. 130–149.
4. Maury-Lechon, G.; Curtet, L. Biogeography and Evolutionary Systematics of Dipterocarpaceae. In A Reviewof Dipterocarp: Taxonomy, Ecology and Silviculture; Appanah, S., Turnbull, J.M., Eds.; Center for InternationalForestry Research (CIFOR): Bogor, Indonesia, 1998; pp. 5–44.
5. Huy, B. Part B1: Equations for Biomass of Aboveground Trees, Branches and Leaves Biomass in EvergreenBroadleaved Forests, and for Aboveground Biomass of Six Tree Families in Evergreen and Deciduous Forests.In Allometric Equations at National Scale for Estimating Tree and Forest Biomass in Vietnam; Sola, G., Inoguchi, A.,Garcia-Perez, J., Donegan, E., Birigazzi, L., Henry, M., Eds.; UN-REDD Programme: Ha Noi, Vietnam, 2014.
6. Jenkins, J.C.; Chojnacky, D.C.; Heath, L.S.; Birdsey, R.A. Comprehensive Database of Diameter-based BiomassRegressions for North American Tree Species; General Technical Report NE-319; USDA Forest Service: NewtownSquare, PA, USA, 2004; p. 45.
7. Jenkins, J.C.; Chojnacky, D.C.; Heath, L.S.; Birdsey, R.A. National-scale biomass estimators for USA treespecies. J. For. Sci. 2003, 49, 12–35.

Forests 2016, 7, 180 18 of 19
8. Sola, G.; Inoguchi, A.; Garcia-Perez, J.; Donegan, E.; Birigazzi, L.; Henry, M. Allometric Equations at NationalScale for Tree Biomass Assessment in Vietnam, Context, methodology and summary of the results; UN-REDDProgramme: Ha Noi, Vietnam, 2014.
9. Sola, G.; Inoguchi, A.; Phuong, V.T.; Huy, B.; Khoa, P.V.; Hung, N.D.; Xuan, N.V.; Henry, M. AllometricEquations at National Scale for Tree Biomass Assessment in Vietnam; UN-REDD Programme: Ha Noi,Vietnam, 2014.
10. Ter-Mikaelian, M.T.; Korzukhin, M.D. Biomass equations for sixty-five North American tree species. J. For.Ecol. Manag. 1997, 97, 1–24. [CrossRef]
11. Pearson, T.R.H.; Brown, S.; Birdsey, R.A. Measurement Guidelines for the Sequestration of Forest Carbon; GeneralTechnical Report NRS-18; USDA Forest Service: Newton Square, PA, USA, 2007.
12. Estimating Biomass and Biomass Change of Tropical Forests: A Primer. (FAO Forestry Paper-134). Availableonline: http://www.fao.org/docrep/W4095E/w4095e00.htm#Contents (accessed on 16 August 2016).
13. Basuki, T.M.; Van Lake, P.E.; Skidmore, A.K.; Hussin, Y.A. Allometric equations for estimating theabove-ground biomass in the tropical lowland Dipterocarp forests. For. Ecol. Manag. 2009, 257, 1684–1694.[CrossRef]
14. Picard, N.; Rutishauser, E.; Ploton, P.; Ngomanda, A.; Henry, M. Should tree biomass allometry be restrictedto power models? For. Ecol. Manag. 2015, 353, 156–163. [CrossRef]
15. Chambers, J.Q.; dos Santos, J.; Ribeiro, R.J.; Higuchi, N. Tree damage allometric relationship andabove-ground net primary production in central Amazon forest. For. Ecol. Manag. 2001, 152, 73–84.[CrossRef]
16. Chave, J.; Andalo, C.; Brown, S.; Cairns, M.A.; Chambers, J.Q.; Eamus, D.; Folster, H.; Fromard, F.; Higuchi, N.;Kira, T.; et al. Tree allometry and improved estimation of carbon stocks and balance in tropical forests.Oecologia 2005, 145, 87–99. [CrossRef] [PubMed]
17. Chave, J.; Mechain, M.R.; Burquez, A.; Chidumayo, E.; Colgan, M.S.; Delitti, W.B.C.; Duque, A.; Eid, T.;Fearnside, P.M.; Goodman, R.C.; et al. Improved allometric models to estimate the aboveground biomass oftropical trees. Glob. Change Biol. 2014, 20, 3177–3190. [CrossRef] [PubMed]
18. IPCC National Greenhouse Gas Inventories Programme. Good Practice Guidance for Land Use, Land-Use Changeand Forestry; IPCC: Hayama, Japan, 2003; p. 295.
19. National Greenhouse Gas Inventories Programme. IPCC Guidelines for National Greenhouse Gas Inventories;IGES: Hayama, Kanagawa, Japan, 2006.
20. Keller, M.; Palace, M.; Hurtt, G. Biomass estimation in the Tapajos National Forest. Brazil examination ofsampling and allometric uncertainties. For. Ecol. Manag. 2001, 154, 371–382. [CrossRef]
21. Ketterings, Q.M.; Coe, R.; van Noordwijk, M.; Ambagau, Y.; Palm, C.A. Reducing uncertainty in the useof allometric biomass equations for predicting above ground tree biomass in mixed secondary forests.For. Ecol. Manag. 2001, 146, 199–209. [CrossRef]
22. Huy, B.; Poudel, K.P.; Temegen, H. Aboveground biomass equations for evergreen broadleaf forests in SouthCentral Coastal of Vietnam: Selection of eco-regional or pantropical models. For. Ecol. Manag. 2016, 376,276–283. [CrossRef]
23. Hijmans, R.J.; Cameron, S.E.; Parra, J.L.; Jones, P.G.; Jarvis, A. Very high resolution interpolated climatesurfaces for global land areas. Int. J. Climatol. 2005, 25, 1965–1978. [CrossRef]
24. Nachtergaele, F.O.; van Velthuizen, H.T.; Verelst, L.; Wiberg, D.; Batjes, N.H.; Dijkshoorn, J.A.;van Engelen, V.W.P.; Fischer, G.; Jones, A.; Montanarella, L.; et al. Harmonized World Soil Database (Version 1.2);FAO: Rome, Italy; IIASA: Laxenburg, Austria, 2012; p. 42.
25. Huy, B.; Ly, C.T.; Hung, V.; Nguyen, T.T.H.; Dinh, N.D. Define CO2 Absorbed in the Broad-Leaf Ever-GreenForests in the Central Highlands of Vietnam to Join the REDD+ Program; Technical Report. Ministry of Educationand Training: Ha Noi, Vietnam, 2013.
26. Stewart, J.L.; Dunsdon, A.J.; Hellin, J.J.; Hughes, C.E. Wood Biomass Estimation of the Central American DryZone Species; Tropical Forestry Papers 26; Oxford Forestry Institute, Department of Plant Sciences, Universityof Oxford: Oxford, UK, 1992.
27. Nlme: Linear and nonlinear mixed effects models. Available online: http://CRAN.R-project.org/package=nlme. (accessed on 19 August 2016).
28. The R Project for Statistical Computing. Available online: https://www.R-project.org/ (accessed on16 August 2016).

Forests 2016, 7, 180 19 of 19
29. Swanson, D.A.; Tayman, J.; Bryan, T.M. MAPE-R: A rescaled measure of accuracy for cross-sectionalsubnational population forecasts. J. Pop. Res. 2011, 28, 225–243. [CrossRef]
30. Temesgen, H.; Zhang, C.H.; Zhao, X.H. Modelling tree height-diameter relationships in multi-species andmulti-layered forests: A large observational study from Northeast China. For. Ecol. Manag. 2014, 316, 78–89.[CrossRef]
31. Nelson, B.W.; Mesquita, R.; Pereira, J.L.G.; de Souza, S.G.A.; Batista, G.T.; Couta, L.B. Allometric regressionsfor improved estimate of secondary forest biomass in the Central Amazon. For. Ecol. Manag. 1999, 177,149–167. [CrossRef]
32. Cairns, M.A.; Olmsted, I.; Granados, J.; Argaez, J. Composition and aboveground tree biomass of the drysemi-evergreen forest on Mexico’s Yucatan Peninsula. For. Ecol. Manag. 2003, 186, 125–132. [CrossRef]
33. Temesgen, H.; Affleck, D.; Poudel, K.P.; Gray, A.; Sessions, J. A review of the challenges and opportunities inestimating above ground forest biomass using tree-level models. Scand. J. For. Res. 2015, 30, 326–335.
© 2016 by the authors; licensee MDPI, Basel, Switzerland. This article is an open accessarticle distributed under the terms and conditions of the Creative Commons Attribution(CC-BY) license (http://creativecommons.org/licenses/by/4.0/).