almond almanac2014 - your favorite easy snack · 25 almond quality + food safety program ......
TRANSCRIPT

ALMOND ALMANAC
2014

1
AT YOUR FINGERTIPSAlmond Board of California (ABC) promotes almonds through its research-based approach to all aspects of farming, production and marketing on behalf of California Almond growers and handlers. The Almond Almanac is ABC’s annual report, which outlines the programs and projects that power the industry toward meeting its vision, and it provides a comprehensive analysis of the production and marketing of California Almonds.
The Almond Almanac is prepared by ABC on a crop-year basis, spanning August 1 through July 31, and includes comprehensive historical information about almond production, acreage and varieties, as well as shipment and market information. The statistical content is compiled using various handler forms required by the industry’s Federal Marketing Order. Additional data, including crop estimates and farm price, are supplied by the USDA National Agricultural Statistics Service, Pacific Region Field Office (NASS/PRO).
TABLE OF CONTENTS 2 Strategic Priorities + Supporting Objectives 2014
3 Almond Board of California Programs + Budget
4 What a Difference a Year Makes
6 California Almond Growers
7 California Almond Industry Overview
8 Position Report of California Almonds
9 Carry-in As a Percentage of Prior Year Shipments + World Almond Production
10 Top Ten Almond Varieties + Acreage
11 Crop Value + Yield Per Bearing Acre
12 California Almond Production by County
13 California Almond Receipts by County + Variety
14 California Almond Crop Estimates vs. Actual Receipts
16 World Destinations
17 Domestic + Export Shipments
18 Top California Agricultural Exports
19 Top Ten California Crop Acreage + Top Ten U.S. Specialty Crop Exports by Value
20 Almond Market Variety Classifications
22 California Almond Crop-Size History vs. Inedible Percentage
23 Competing Nuts
24 Research Overview
25 Almond Quality + Food Safety Program
26 California Almond Sustainability Program
28 The Facts About Water + Almonds
30 The Pollination Partnership
32 Nutrition Research
34 Global Marketing
38 Trade Stewardship
40 Technical Issues + International Trade
41 California Almond Industry Relations

2 3
Program Budget Allocation 2013/14
2% Industry Services
STRATEGIC PRIORITIES + SUPPORTING OBJECTIVES 2014INVEST IN PROGRAMS AND RESEARCH THAT MAKE ALMONDS A CROP OF CHOICE FOR CALIFORNIA
■ Promote the sustainability* of California Almonds
■ Enhance industry-wide quality and food safety
■ Support basic and applied research to advance production and processing efficiencies
■ Demonstrate water use efficiency and supply implications
■ Enhance leadership position in bee health research, education and outreach
INVEST IN PROGRAMS AND RESEARCH THAT BUILD MARKET DEMAND FOR ALMONDS, MAKING THEM THE NUT OF CHOICE
■ Expand the science-based foundation for the health benefits and functional attributes of almonds in dietary patterns and healthy lifestyles
■ Increase consumers perceived value of almonds
■ Implement actions that mitigate trade and regulatory barriers
■ Use market research and performance analysis for strategy development and resource allocation
■ Establish a proactive public relations stewardship program
BUILD AN ALMOND BOARD ORGANIZATION THAT OPTIMIZES ITS EFFECTIVENESS IN ESTABLISHING AND EXECUTING GOALS
■ Ensure that Almond Board representatives understand and
adhere to fiduciary responsibility standards
■ Implement Board of Directors development initiatives
■ Optimize staff and committee structures and processes
■ Provide fact-based information to support industry advocacy efforts
■ Enhance the relationship with and education of the growers
and almond community
ALMOND BOARD OF CALIFORNIA PROGRAMS + BUDGETKey programs for ABC contribute to meeting our vision and mission. These areas include a comprehensive global marketing program in established, emerging and exploratory markets; nutrition, production, environmental and technical research; a sustainability program; industry communications outreach; and more. ABC programs are funded by a handler assessment placed on each pound of almonds produced. Each year, the ABC Board of Directors, made up of both growers and almond handlers, approves the allocation given to each program area. ABC staff is responsible for implementing the programs detailed on the following pages.
43% Established Markets29% Emerging Markets
15% Administration
3% Scientific Affairs/ Nutrition Research
3% Production Research
2% Technical + Regulatory Affairs 2% Almond Quality + Food Safety
2% Environmental Research
0.5% Corporate Technology
BOARD OFDIRECTORS
FinanceCommittee
ScientificAdvisory
Panel
Almond Quality + Food Safety
Committee
Production Research
Committee
Nutrition Research
Committee
Environmental Committee
Global Market Development Committee
Technical + Regulatory
Affairs Committee
Industry Services
Committee
Committee Structure
VISIONTo bring great taste, health and vitality to people around the world through the enjoyment of California Almonds.
MISSIONTo make California Almonds essential to customers and consumers worldwide through innovative research, market development and industry support.
*Please see page 26 for the Almond Board of California definition for sustainability. Source: Almond Board of California. Note: Total does not sum to 100% due to rounding.
4 5
Pine NutsMacadamia Nuts
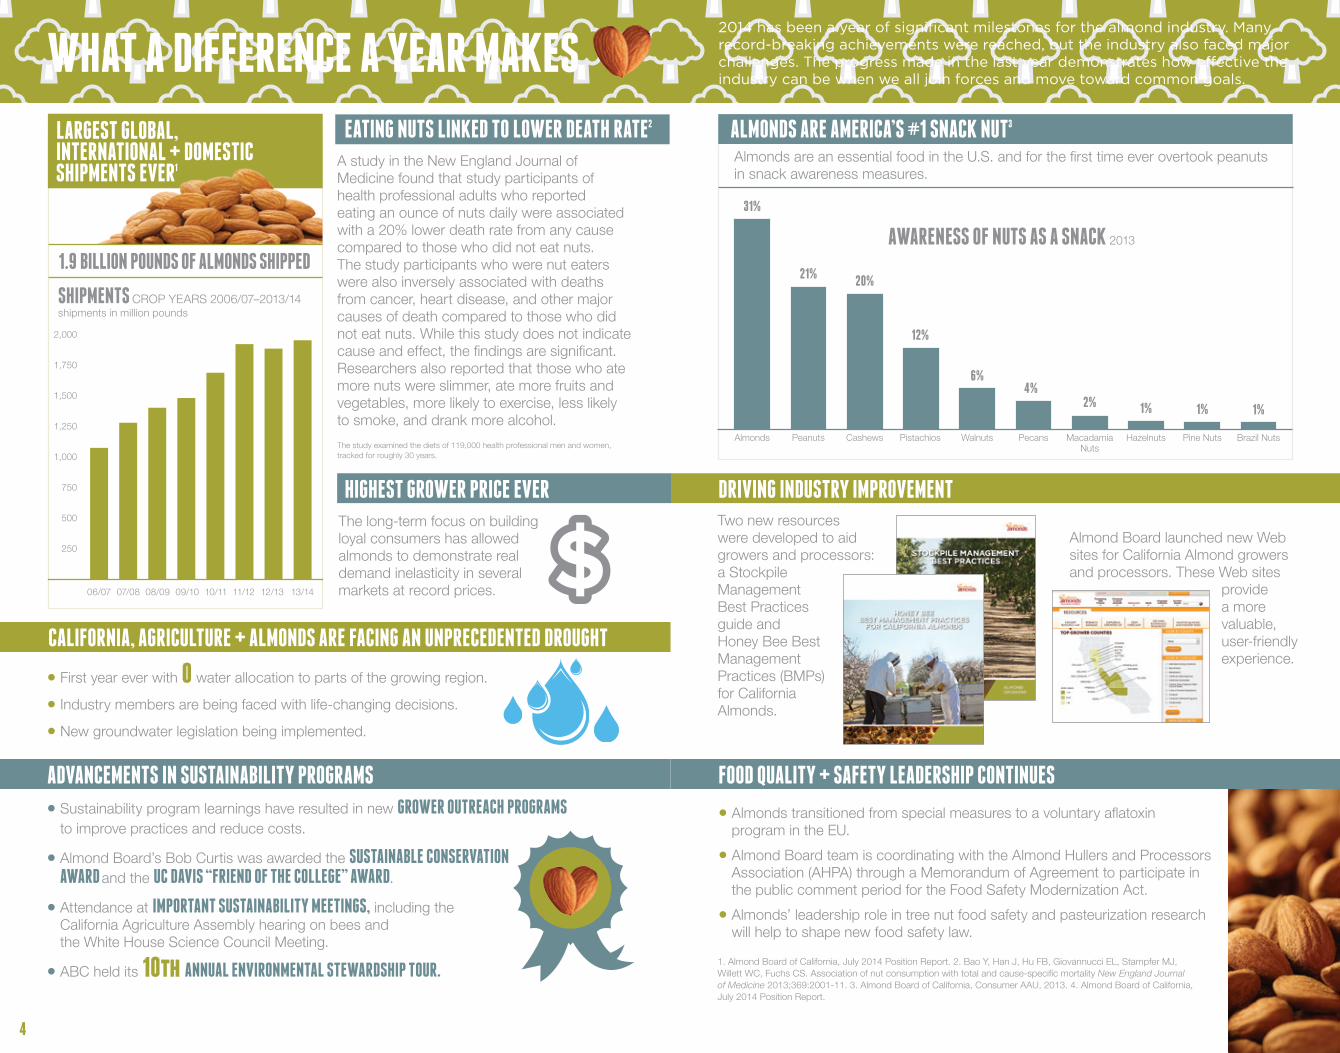
WHAT A DIFFERENCE A YEAR MAKES
1. Almond Board of California, July 2014 Position Report. 2. Bao Y, Han J, Hu FB, Giovannucci EL, Stampfer MJ, Willett WC, Fuchs CS. Association of nut consumption with total and cause-specific mortality New England Journal of Medicine 2013;369:2001-11. 3. Almond Board of California, Consumer AAU, 2013. 4. Almond Board of California, July 2014 Position Report.
HIGHEST GROWER PRICE EVER
ADVANCEMENTS IN SUSTAINABILITY PROGRAMS
• First year ever with 0 water allocation to parts of the growing region.
• Industry members are being faced with life-changing decisions.
• New groundwater legislation being implemented.
• Sustainability program learnings have resulted in new GROWER OUTREACH PROGRAMS to improve practices and reduce costs.
• Almond Board’s Bob Curtis was awarded the SUSTAINABLE CONSERVATION AWARD and the UC DAVIS “FRIEND OF THE COLLEGE” AWARD.
• Attendance at IMPORTANT SUSTAINABILITY MEETINGS, including the California Agriculture Assembly hearing on bees and the White House Science Council Meeting.
• ABC held its 10th ANNUAL ENVIRONMENTAL STEWARDSHIP TOUR.
• Almonds transitioned from special measures to a voluntary aflatoxin program in the EU.
• Almond Board team is coordinating with the Almond Hullers and Processors Association (AHPA) through a Memorandum of Agreement to participate in the public comment period for the Food Safety Modernization Act.
• Almonds’ leadership role in tree nut food safety and pasteurization research will help to shape new food safety law.
The long-term focus on building loyal consumers has allowed almonds to demonstrate real demand inelasticity in several markets at record prices.
Two new resources were developed to aid growers and processors: a Stockpile Management Best Practices guide and Honey Bee Best Management Practices (BMPs) for California Almonds.
Almond Board launched new Web sites for California Almond growers and processors. These Web sites
provide a more valuable, user-friendly experience.
Almonds are an essential food in the U.S. and for the first time ever overtook peanuts in snack awareness measures.
AWARENESS OF NUTS AS A SNACK 2013
31%
21%20%
12%
6%4%
2% 1% 1% 1%
FOOD QUALITY + SAFETY LEADERSHIP CONTINUES
2014 has been a year of significant milestones for the almond industry. Many record-breaking achievements were reached, but the industry also faced major challenges. The progress made in the last year demonstrates how effective the industry can be when we all join forces and move toward common goals.
EATING NUTS LINKED TO LOWER DEATH RATE2
DRIVING INDUSTRY IMPROVEMENT
CALIFORNIA, AGRICULTURE + ALMONDS ARE FACING AN UNPRECEDENTED DROUGHT
1.9 BILLION POUNDS OF ALMONDS SHIPPED
SHIPMENTS CROP YEARS 2006/07–2013/14shipments in million pounds
06/07 07/08 08/09 09/10 10/11 11/12 12/13 13/14
2,000
1,750
1,500
1,250
1,000
750
500
250
Almonds Peanuts Cashews Pistachios Walnuts Pecans Hazelnuts Brazil Nuts
LARGEST GLOBAL, INTERNATIONAL + DOMESTIC SHIPMENTS EVER1
ALMONDS ARE AMERICA’S #1 SNACK NUT3
A study in the New England Journal of Medicine found that study participants of health professional adults who reported eating an ounce of nuts daily were associated with a 20% lower death rate from any cause compared to those who did not eat nuts. The study participants who were nut eaters were also inversely associated with deaths from cancer, heart disease, and other major causes of death compared to those who did not eat nuts. While this study does not indicate cause and effect, the findings are significant. Researchers also reported that those who ate more nuts were slimmer, ate more fruits and vegetables, more likely to exercise, less likely to smoke, and drank more alcohol.
The study examined the diets of 119,000 health professional men and women, tracked for roughly 30 years.

6 7
Historical Crop Size + Shipments vs. Farm Price crop years 1994/95–2013/14
Almond Farms
Crop size in million pounds Shipments in million pounds Farm price
04/0598/9996/97 05/0699/00 06/0700/01 07/0801/02 08/0902/03 09/10 10/11 11/12 12/13 13/1403/0497/9895/9694/95
$1.57
$0.86$0.97 $0.91
$1.11
$2.21
$2.81
$2.48
$1.34
$2.08
$1.56
$1.41$1.75
$1.45
$1.65$1.79
Number of Handlers
Percentage of Crop Handled
<1M pounds 28 <1%
1 –24M pounds 53 23%
25–49M pounds 13 23%
50–74M pounds 6 17%
>75M pounds 5 36%
105 100%
SANJOAQUIN
MERCED
FRESNO
KINGS
TEHAMA
BUTTE
SUTTER
STANISLAUS
MADERA
TULARE
KERN
GLENN
YOLO
COLUSA
SOLANO
YUBA
..................
..................
................
..................
................
..................
..................
..............
..................
..................
..................
........
..................
..................
.......
..................
..................
......
................
................
.............
..................
..................
.........
................
.........
....................
................
................
................
.... ..................
..................
.......
................
................
................
....................
................
.......
................
................
.
..................
................
>100 million pounds50–100 million pounds1–49 million poundsAcreage (1 dot = 100 acres)
$1.99$2.06
2,000
1,750
1,500
1,250
1,000
750
500
250
0
$3.00
$2.00
$1.00
$0.00
$2.58
$2.90
Distribution of Crop by Handler Size 2013/14
Almond Production by County 2013/14
CALIFORNIA ALMOND GROWERSCalifornia’s Central Valley has ideal conditions for growing almonds with its mild climate, rich soil and abundant sunshine. California Almonds make up about 80% of the global and virtually 100% of the U.S. supply.
The California Almond growing community is driven by multigenerational family farmers. According to the 2012 USDA Ag Census, there are around 6,600 California Almond farms. Of those, more than 88% are family farms and 61% consist of 1–49 acres.
Almond growers depend on natural resources for their livelihood. Some are third and fourth generation family farmers who live on their land and expect to pass it along to their children and grandchildren. They understand that near record production has to be matched by an unprecedented commitment to sustainability. Almond growers have continued to invest in research and make advances in water efficiency, promote the health of honey bees and other pollinators, use pesticides responsibly and, above all, protect the quality and safety of California Almonds.
Please see pages 24–31 to learn more.
CALIFORNIA ALMOND INDUSTRY OVERVIEWGlobal demand for California Almonds continues to grow across markets with crop year 2013/14 achieving the highest overall shipments and the second highest production level by almond growers.
Overall shipments were up 3.8%, at a record 1.94 billion pounds. The U.S. accounted for 33% share of total shipments and 67% were destined for more than 90 countries around the world.
For the eighth consecutive year, the U.S. market set a record—shipments were up 9% over the prior year, at 641.8 million pounds. U.S. increases were across all categories—shelled, inshell and manufactured product. For the fifth year, California Almond handlers shipped over 1 billion pounds to export destinations. With shipments up slightly over last year at 1.3 billion, making it the second largest export year.
The 2014/15 crop is forecasted at 2.1 billion pounds and is based on an estimated 860,000 bearing acres.
88% Family Farms12% Other
13% 50–99 acres
26% 100+ acres
61% 1–49 acres
Source: USDA 2012 Census of Agriculture.
Source: USDA 2007 Census of Agriculture.
Sources: Almond Board of California, USDA, NASS/PRO.
8 9
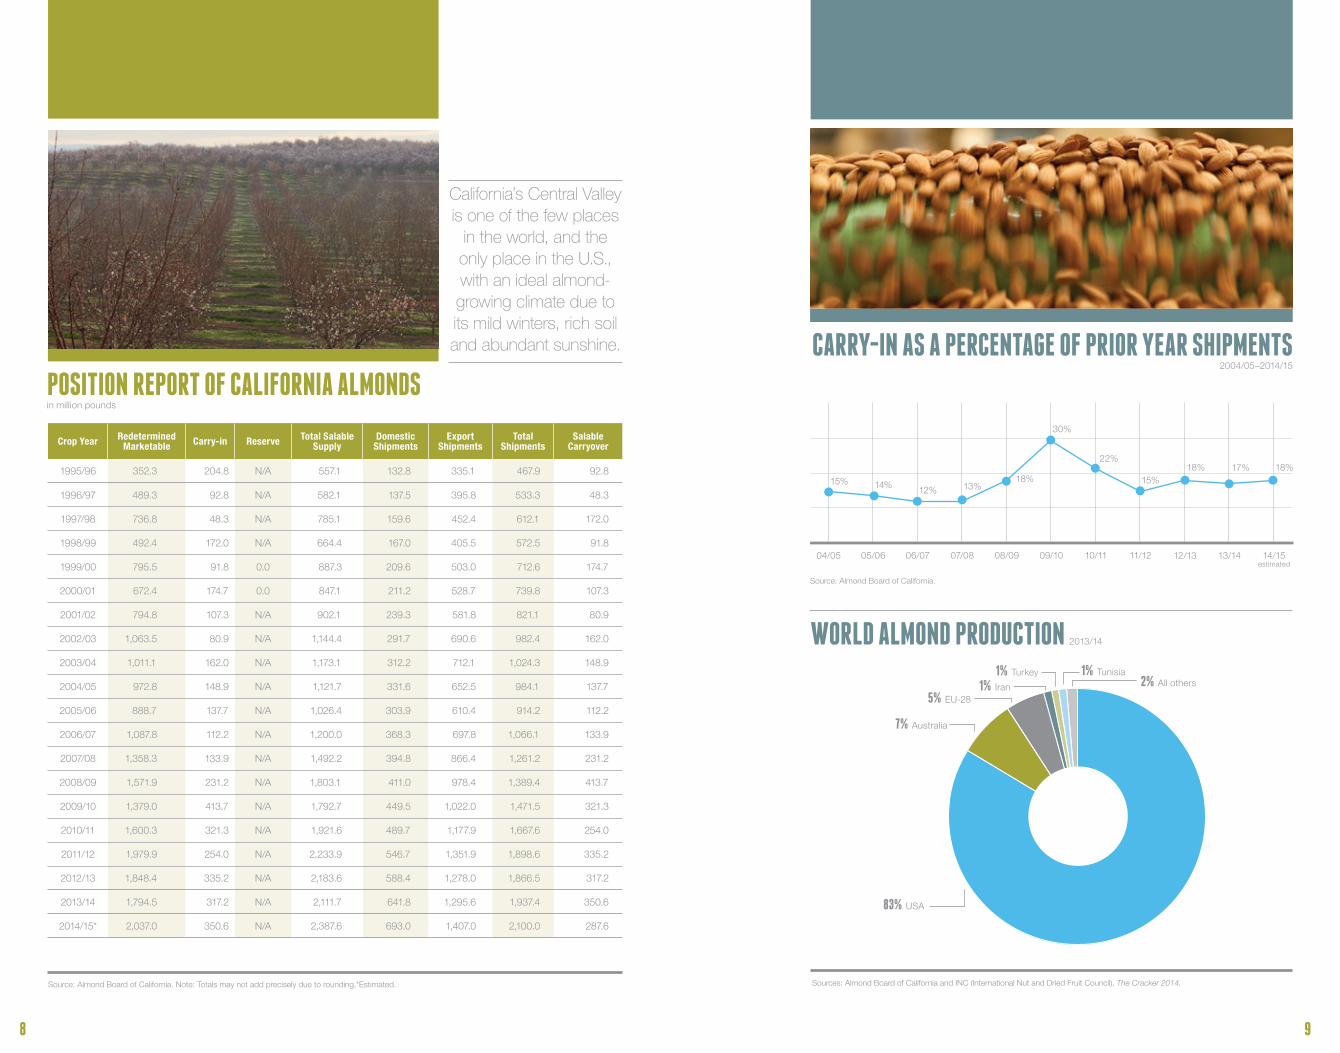
WORLD ALMOND PRODUCTION 2013/14
Crop Year Redetermined Marketable Carry-in Reserve Total Salable
SupplyDomestic
ShipmentsExport
ShipmentsTotal
ShipmentsSalable
Carryover
1995/96 352.3 204.8 N/A 557.1 132.8 335.1 467.9 92.8
1996/97 489.3 92.8 N/A 582.1 137.5 395.8 533.3 48.3
1997/98 736.8 48.3 N/A 785.1 159.6 452.4 612.1 172.0
1998/99 492.4 172.0 N/A 664.4 167.0 405.5 572.5 91.8
1999/00 795.5 91.8 0.0 887.3 209.6 503.0 712.6 174.7
2000/01 672.4 174.7 0.0 847.1 211.2 528.7 739.8 107.3
2001/02 794.8 107.3 N/A 902.1 239.3 581.8 821.1 80.9
2002/03 1,063.5 80.9 N/A 1,144.4 291.7 690.6 982.4 162.0
2003/04 1,011.1 162.0 N/A 1,173.1 312.2 712.1 1,024.3 148.9
2004/05 972.8 148.9 N/A 1,121.7 331.6 652.5 984.1 137.7
2005/06 888.7 137.7 N/A 1,026.4 303.9 610.4 914.2 112.2
2006/07 1,087.8 112.2 N/A 1,200.0 368.3 697.8 1,066.1 133.9
2007/08 1,358.3 133.9 N/A 1,492.2 394.8 866.4 1,261.2 231.2
2008/09 1,571.9 231.2 N/A 1,803.1 411.0 978.4 1,389.4 413.7
2009/10 1,379.0 413.7 N/A 1,792.7 449.5 1,022.0 1,471.5 321.3
2010/11 1,600.3 321.3 N/A 1,921.6 489.7 1,177.9 1,667.6 254.0
2011/12 1,979.9 254.0 N/A 2,233.9 546.7 1,351.9 1,898.6 335.2
2012/13 1,848.4 335.2 N/A 2,183.6 588.4 1,278.0 1,866.5 317.2
2013/14 1,794.5 317.2 N/A 2,111.7 641.8 1,295.6 1,937.4 350.6
2014/15* 2,037.0 350.6 N/A 2,387.6 693.0 1,407.0 2,100.0 287.6
Source: Almond Board of California. Note: Totals may not add precisely due to rounding.*Estimated.
POSITION REPORT OF CALIFORNIA ALMONDSin million pounds
Sources: Almond Board of California and INC (International Nut and Dried Fruit Council), The Cracker 2014.
Source: Almond Board of California.
18%
15% 14% 12% 13%18%
18% 17%
30%
22%
15%
04/05 05/06 06/07 07/08 08/09 09/10 10/11 11/12 12/13 13/14 14/15estimated
CARRY-IN AS A PERCENTAGE OF PRIOR YEAR SHIPMENTS 2004/05–2014/15
California’s Central Valley is one of the few places
in the world, and the only place in the U.S., with an ideal almond-growing climate due to its mild winters, rich soil and abundant sunshine.
83% USA
1% Tunisia2% All others
7% Australia
5% EU-281% Iran
1% Turkey
10 11
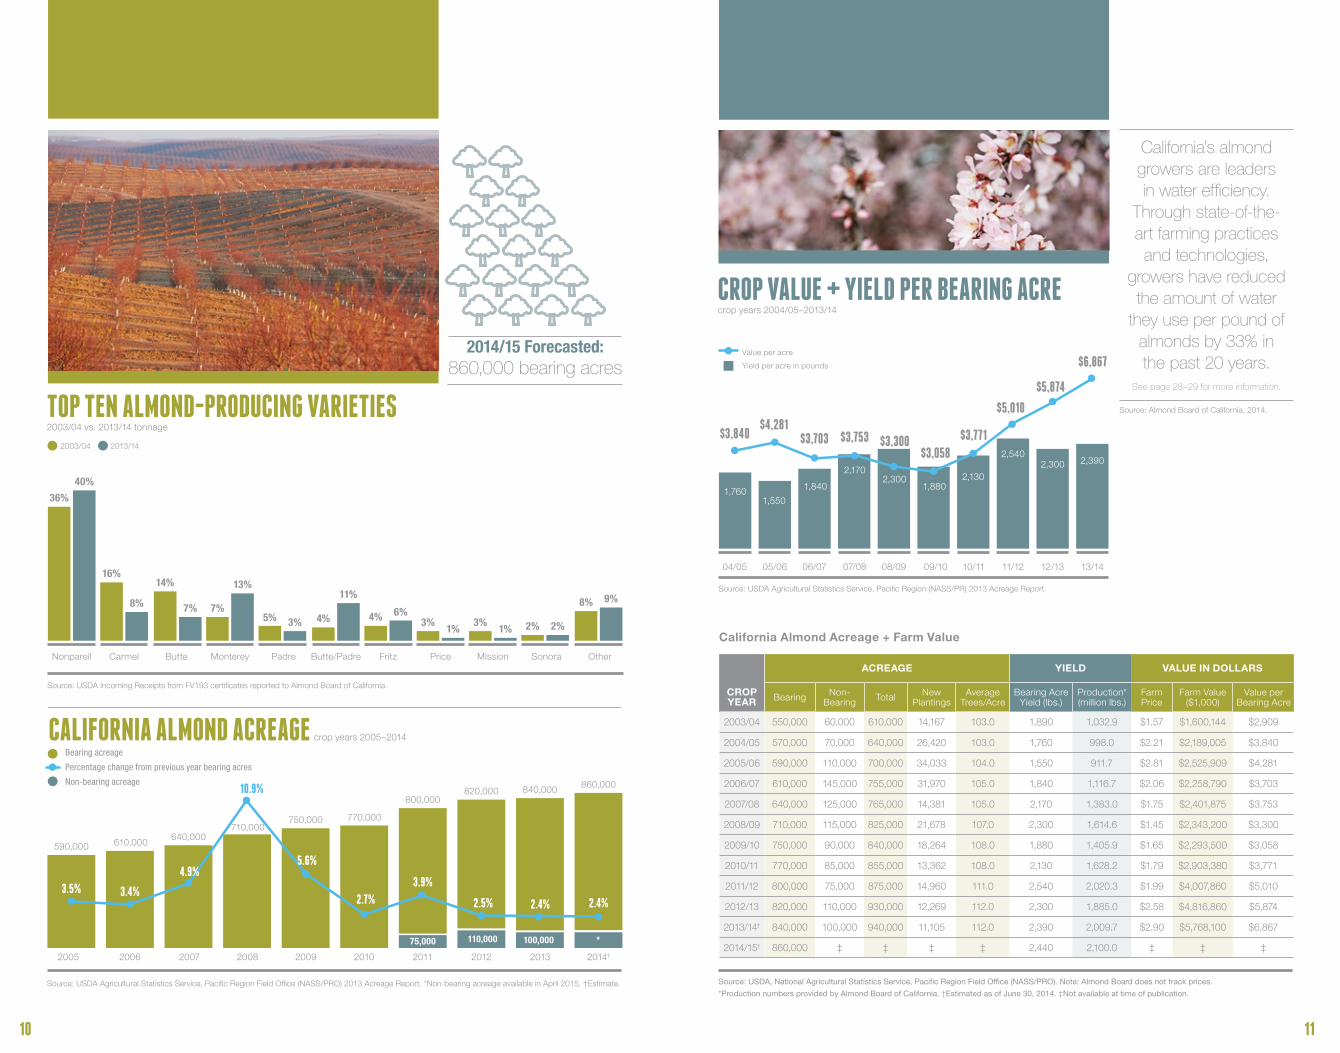
CROP VALUE + YIELD PER BEARING ACRE crop years 2004/05–2013/14
Value per acre
Yield per acre in pounds
Source: USDA Agricultural Statistics Service, Pacific Region (NASS/PR) 2013 Acreage Report.
Source: Almond Board of California, 2014.
04/05 05/06 06/07 07/08 08/09 09/10 10/11 11/12 12/13 13/14
2,5402,300 2,390
2,1301,880
2,3002,170
1,5501,760
$3,840$4,281
$3,703 $3,753 $3,300$3,058
$3,771
$5,010
$5,874
$6,867
1,840
California’s almond growers are leaders in water efficiency.
Through state-of-the-art farming practices and technologies,
growers have reduced the amount of water
they use per pound of almonds by 33% in the past 20 years.
See page 28–29 for more information.
ACREAGE YIELD VALUE IN DOLLARS
CROP YEAR Bearing Non-
Bearing Total New Plantings
Average Trees/Acre
Bearing Acre Yield (lbs.)
Production* (million lbs.)
Farm Price
Farm Value ($1,000)
Value per Bearing Acre
2003/04 550,000 60,000 610,000 14,167 103.0 1,890 1,032.9 $1.57 $1,600,144 $2,909
2004/05 570,000 70,000 640,000 26,420 103.0 1,760 998.0 $2.21 $2,189,005 $3,840
2005/06 590,000 110,000 700,000 34,033 104.0 1,550 911.7 $2.81 $2,525,909 $4,281
2006/07 610,000 145,000 755,000 31,970 105.0 1,840 1,116.7 $2.06 $2,258,790 $3,703
2007/08 640,000 125,000 765,000 14,381 105.0 2,170 1,383.0 $1.75 $2,401,875 $3,753
2008/09 710,000 115,000 825,000 21,678 107.0 2,300 1,614.6 $1.45 $2,343,200 $3,300
2009/10 750,000 90,000 840,000 18,264 108.0 1,880 1,405.9 $1.65 $2,293,500 $3,058
2010/11 770,000 85,000 855,000 13,362 108.0 2,130 1,628.2 $1.79 $2,903,380 $3,771
2011/12 800,000 75,000 875,000 14,960 111.0 2,540 2,020.3 $1.99 $4,007,860 $5,010
2012/13 820,000 110,000 930,000 12,269 112.0 2,300 1,885.0 $2.58 $4,816,860 $5,874
2013/14† 840,000 100,000 940,000 11,105 112.0 2,390 2,009.7 $2.90 $5,768,100 $6,867
2014/15† 860,000 ‡ ‡ ‡ ‡ 2,440 2,100.0 ‡ ‡ ‡
Source: USDA, National Agricultural Statistics Service, Pacific Region Field Office (NASS/PRO). Note: Almond Board does not track prices.
*Production numbers provided by Almond Board of California. †Estimated as of June 30, 2014. ‡Not available at time of publication.
California Almond Acreage + Farm Value
2005 2006 2007 2008 2009 2010 2011 2012 2013 2014†
CALIFORNIA ALMOND ACREAGE crop years 2005–2014
Bearing acreage
Percentage change from previous year bearing acres
Non-bearing acreage
Source: USDA Agricultural Statistics Service, Pacific Region Field Office (NASS/PRO) 2013 Acreage Report. *Non-bearing acreage available in April 2015. †Estimate.
3.5% 3.4%
4.9%
10.9%
2.5%
5.6%
2.7%
3.9%
2.4%
75,000 110,000 100,000 *
820,000 840,000 860,000
800,000
770,000750,000710,000
640,000610,000590,000
2.4%
36%
40%
Nonpareil
16%
8%
Carmel
14%
7%
Butte
7%
13%
Monterey
5% 3%
Padre
4%
11%
Butte/Padre
4% 6%
Fritz
3%1%
Price
3%1%
Mission
2% 2%
Sonora
8% 9%
Other
Source: USDA Incoming Receipts from FV193 certificates reported to Almond Board of California.
TOP TEN ALMOND-PRODUCING VARIETIES2003/04 vs. 2013/14 tonnage
2003/04 2013/14
2014/15 Forecasted: 860,000 bearing acres

12 13
Counties Percentage Crop
Nonpareil Lbs.
Monterey Lbs.
Butte/Padre Lbs.
Carmel Lbs.
Butte Lbs.
Fritz Lbs.
All Others Lbs.
All Varieties Lbs.
NORTH VALLEY
BUTTE 2.79% 23,931,248 1,927,913 2,318,482 5,729,294 4,310,413 326,984 17,461,000 56,005,334
COLUSA 5.16% 45,516,504 9,068,728 1,348,753 10,275,832 13,818,449 6,263,807 17,306,614 103,598,687
GLENN 3.48% 33,221,292 3,439,652 2,149,189 7,499,090 7,630,442 1,073,144 14,734,447 69,747,256
SOLANO 0.30% 3,179,520 217,273 317,954 274,773 918,290 12,544 1,067,555 5,987,909
SUTTER 0.37% 2,083,953 316,109 1,057,726 571,044 753,533 46,412 2,507,992 7,336,769
TEHAMA 0.73% 6,524,336 299,648 878,342 1,879,846 2,043,325 39,577 3,017,138 14,682,212
YOLO 1.12% 9,798,346 2,176,137 540,767 1,926,548 2,355,636 659,733 5,042,458 22,499,625
YUBA 0.07% 638,303 124,820 51,018 75,325 10,698 44,349 380,671 1,325,184
TOTAL 14.01% 124,893,502 17,570,280 8,662,231 28,231,752 31,840,786 8,466,550 61,517,875 281,182,976
SOUTH VALLEY
FRESNO 19.84% 154,788,365 66,494,004 41,103,121 22,123,804 33,463,464 18,009,819 62,118,060 398,100,637
KERN 21.29% 168,656,555 81,860,740 41,084,894 14,445,279 29,669,127 41,193,814 50,272,891 427,183,300
KINGS 1.62% 13,031,477 4,933,467 6,719,382 826,333 634,501 2,601,573 3,846,594 32,593,327
MADERA 10.81% 84,945,135 37,964,549 31,694,826 15,807,639 7,677,143 9,818,756 28,949,500 216,857,548
MERCED 10.65% 82,621,765 19,924,679 25,228,610 25,893,118 11,728,927 10,155,048 38,260,040 213,812,187
SAN JOAQUIN 4.78% 41,075,450 3,503,861 14,296,758 15,039,814 3,531,107 5,370,533 13,035,690 95,853,213
STANISLAUS 14.20% 111,361,810 20,996,176 37,347,436 41,129,817 12,424,251 11,897,129 49,778,460 284,935,079
TULARE 2.78% 23,583,573 10,431,851 6,250,824 1,550,131 2,191,019 5,849,958 5,981,771 55,839,127
TOTAL 85.96% 680,064,130 246,109,327 203,725,851 136,815,935 101,319,539 104,896,630 252,243,006 1,725,174,418
ALL OTHERS
DEL NORTE 0.01% 206,628 0 0 0 0 0 0 206,628
MARIPOSA 0.00% 36,839 25,879 0 0 0 0 13,233 75,951
MENDOCINO 0.00% 35,811 0 0 15,305 0 0 11,033 62,149
ORANGE 0.00% 0 0 0 0 6,154 0 0 6,154
SHASTA 0.01% 18,360 0 0 12,003 52,926 0 45,113 128,402
TUOLUMNE 0.00% 21,793 0 0 0 0 0 27,974 49,767
TOTAL 0.03% 319,431 25,879 0 27,308 59,080 0 97,353 529,051
GRAND TOTAL 100.00% 805,277,063 263,705,486 212,388,082 165,074,995 133,219,405 113,363,180 313,858,234 2,006,886,445
CALIFORNIA ALMOND RECEIPTS BY COUNTY + VARIETYcrop year 2013/14
Northern California Valley Counties Southern California Valley Counties
Cro
p Y
ear
Col
usa
Gle
nn
But
te
Yolo
Teha
ma
Sut
ter
Ker
n
Fres
no
Sta
nisl
aus
Mer
ced
Mad
era
San
Joa
qui
n
Tula
re
Kin
gs
All
Oth
ers
Tota
l
2003/04 55.0 42.3 50.0 6.6 8.0 5.7 205.9 176.9 169.3 129.3 94.5 55.3 18.5 12.3 4.1 1,033.6
2004/05 38.0 37.2 45.0 4.7 6.9 4.6 215.8 173.5 163.9 127.6 93.4 51.0 20.4 13.0 2.9 997.9
2005/06 40.3 42.6 50.4 5.6 8.4 4.6 210.1 160.1 132.2 102.1 82.4 41.8 15.9 12.0 2.7 911.4
2006/07 50.8 38.4 41.8 6.3 7.7 4.9 247.8 232.7 163.6 124.6 100.1 55.6 21.5 17.7 3.8 1,117.3
2007/08 66.2 51.8 66.7 10.0 11.4 5.6 271.0 253.8 223.3 172.9 125.3 75.2 26.7 17.9 5.1 1,383.6
2008/09 86.0 48.6 56.9 10.4 9.7 5.3 354.3 322.2 240.6 187.3 142.7 82.1 36.2 23.4 5.2 1,611.0
2009/10 75.7 52.7 49.2 12.4 10.9 5.2 317.9 281.9 198.8 156.7 112.3 70.7 32.6 20.6 4.9 1,402.6
2010/11 83.0 55.8 47.1 13.6 11.7 4.9 403.5 344.2 202.5 164.2 149.7 68.0 42.4 29.9 6.0 1,626.6
2011/12 85.5 59.7 49.0 17.9 11.9 6.9 472.6 443.0 269.7 216.7 206.1 87.9 44.5 39.0 6.6 2,017.1
2012/13 85.1 57.9 50.9 18.1 12.5 7.0 393.4 413.6 261.8 201.4 203.5 91.5 49.1 30.7 7.5 1,884.1
2013/14 103.6 69.7 56.0 22.5 14.7 7.3 427.2 398.1 284.9 213.8 216.9 95.9 55.8 32.6 7.9 2,006.9
CALIFORNIA ALMOND PRODUCTION BY COUNTY crop year 2013/14in million pounds
Source: USDA Form FV193, Report of Inedible Content of Almond Receipts. Source: USDA Form FV193, Report of Inedible Content of Almond Receipts.
86% Southern counties
14% Northern counties

14 15
Crop Year Objective Forecast
Handler Receipts
Loss and Exempt
Redetermined Marketable
Weight
Pounds Rejects in Receipts
1995/96 310.0 366.7 14.4 352.3 10.4
1996/97 530.0 507.5 18.2 489.3 13.0
1997/98 680.0 756.5 19.7 736.8 14.3
1998/99 540.0 517.0 24.6 492.4 14.9
1999/00 830.0 829.9 34.4 795.5 9.3
2000/01 640.0 698.4 26.0 672.4 15.7
2001/02 850.0 824.1 29.3 794.8 16.7
2002/03 980.0 1,083.7 20.2 1,063.5 8.2
2003/04 1,000.0 1,032.9 21.8 1,011.1 19.8
2004/05 1,080.0 998.0 25.2 972.8 14.5
2005/06 880.0 911.7 23.0 888.7 16.0
2006/07 1,050.0 1,116.7 28.9 1,087.8 24.0
2007/08 1,330.0 1,383.0 24.7 1,358.3 17.2
2008/09 1,500.0 1,614.6 42.7 1,571.9 13.9
2009/10 1,350.0 1,405.9 26.9 1,379.0 19.6
2010/11 1,650.0 1,628.2 27.9 1,600.3 18.1
2011/12 1,950.0 2,020.4 40.5 1,979.9 16.1
2012/13 2,100.0 1,884.0 35.6 1,848.4 23.1
2013/14 1,850.0 2,009.7 39.0 1,970.7 21.0
2014/15 2,100.0 * 63.0 2,037.0† *
CALIFORNIA ALMOND CROP ESTIMATES VS. ACTUAL RECEIPTS in million pounds
Source: Almond Board of California. Objective forecast provided by USDA, National Agricultural Statistics Service Pacific Region Field Office (NASS/PRO).*Not available at time of publication. †Estimate.
2014/15 Almond Forecast: 2,100 million pounds
Subjective Forecast 1,100 850 1,020 1,310 1,460 1,450 1,530 1,750 2,000 2,000
Objective Forecast 1,080 880 1,050 1,330 1,500 1,350 1,650 1,950 2,100 1,850
Actual Production 998 912 1,117 1,383 1,615 1,406 1,628 2,020 1,884 2,010
04/05 05/06 06/07 07/08 08/09 09/10 10/11 11/12 12/13 13/14
1,600
2,000
1,200
800
400
0
-8%
-15%
15%
0%
4%6%
4%
8%
4% 4%
-1%
-10%
04/05 05/06 06/07 07/08 08/09 09/10 10/11 11/12 12/13 13/14
9%
Source: Almond Board of California. Note: Objective forecast provided by USDA, NASS/PRO.
California Almond Receipts Variance from Objective Forecast crop years 2004/05–2013/14
California Almond Crop Estimates vs. Actual Receipts crop years 2004/05–2013/14, in million pounds
Per
cent
age
Varia
nce
16 17
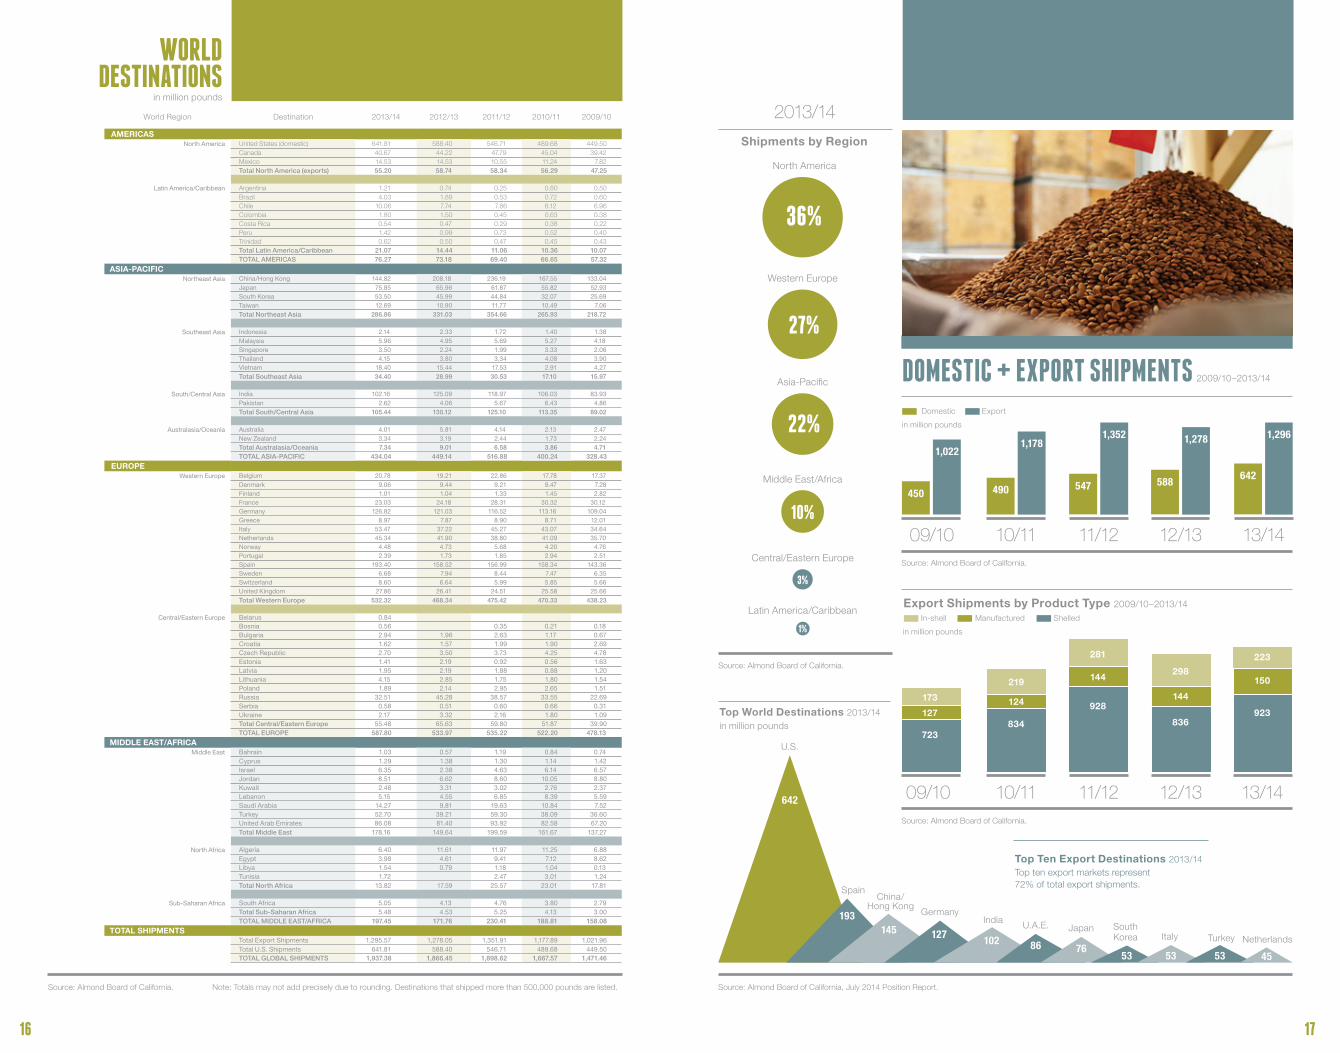
Note: Totals may not add precisely due to rounding. Destinations that shipped more than 500,000 pounds are listed.
WORLD DESTINATIONS
in million pounds
World Region Destination 2013/14 2012/13 2011/12 2010/11 2009/10
AMERICASNorth America United States (domestic) 641.81 588.40 546.71 489.68 449.50
Canada 40.67 44.22 47.79 45.04 39.42Mexico 14.53 14.53 10.55 11.24 7.82Total North America (exports) 55.20 58.74 58.34 56.29 47.25
Latin America/Caribbean Argentina 1.21 0.74 0.25 0.80 0.50Brazil 4.03 1.89 0.53 0.72 0.60Chile 10.06 7.74 7.86 6.12 6.96Colombia 1.80 1.50 0.45 0.63 0.38Costa Rica 0.54 0.47 0.29 0.38 0.22Peru 1.42 0.99 0.73 0.52 0.40Trinidad 0.62 0.50 0.47 0.45 0.43Total Latin America/Caribbean 21.07 14.44 11.06 10.36 10.07TOTAL AMERICAS 76.27 73.18 69.40 66.65 57.32
ASIA-PACIFICNortheast Asia China/Hong Kong 144.82 208.18 236.19 167.55 133.04
Japan 75.85 65.96 61.87 55.82 52.93South Korea 53.50 45.99 44.84 32.07 25.69Taiwan 12.69 10.90 11.77 10.49 7.06Total Northeast Asia 286.86 331.03 354.66 265.93 218.72
Southeast Asia Indonesia 2.14 2.33 1.72 1.40 1.38Malaysia 5.96 4.95 5.69 5.27 4.18Singapore 3.50 2.24 1.99 3.33 2.06Thailand 4.15 3.80 3.34 4.08 3.90Vietnam 18.40 15.44 17.53 2.91 4.27Total Southeast Asia 34.40 28.99 30.53 17.10 15.97
South/Central Asia India 102.16 125.09 118.97 106.03 83.93Pakistan 2.62 4.06 5.67 6.43 4.86Total South/Central Asia 105.44 130.12 125.10 113.35 89.02
Australasia/Oceania Australia 4.01 5.81 4.14 2.13 2.47New Zealand 3.34 3.19 2.44 1.73 2.24Total Australasia/Oceania 7.34 9.01 6.58 3.86 4.71TOTAL ASIA-PACIFIC 434.04 449.14 516.88 400.24 328.43
EUROPEWestern Europe Belgium 20.78 19.21 22.86 17.78 17.37
Denmark 9.06 9.44 9.21 9.47 7.28Finland 1.01 1.04 1.33 1.45 2.82France 23.03 24.18 28.31 30.32 30.12Germany 126.82 121.03 116.52 113.16 109.04Greece 8.97 7.87 8.90 8.71 12.01Italy 53.47 37.22 45.27 43.07 34.64Netherlands 45.34 41.90 38.80 41.09 35.70Norway 4.48 4.73 5.68 4.20 4.76Portugal 2.39 1.73 1.85 2.94 2.51Spain 193.40 158.52 156.99 158.34 143.36Sweden 6.68 7.94 8.44 7.47 6.35Switzerland 8.60 6.64 5.99 5.85 5.66United Kingdom 27.86 26.41 24.51 25.58 25.66Total Western Europe 532.32 468.34 475.42 470.33 438.23
Central/Eastern Europe Belarus 0.84Bosnia 0.56 0.35 0.21 0.18Bulgaria 2.94 1.96 2.63 1.17 0.67Croatia 1.62 1.57 1.99 1.90 2.69Czech Republic 2.70 3.50 3.73 4.25 4.78Estonia 1.41 2.19 0.92 0.56 1.63Latvia 1.95 2.19 1.88 0.88 1.20Lithuania 4.15 2.85 1.75 1.80 1.54Poland 1.89 2.14 2.95 2.65 1.51Russia 32.51 45.28 38.57 33.55 22.69Serbia 0.58 0.51 0.60 0.66 0.31Ukraine 2.17 3.32 2.16 1.80 1.09Total Central/Eastern Europe 55.48 65.63 59.80 51.87 39.90TOTAL EUROPE 587.80 533.97 535.22 522.20 478.13
MIDDLE EAST/AFRICAMiddle East Bahrain 1.03 0.57 1.19 0.84 0.74
Cyprus 1.29 1.38 1.30 1.14 1.42Israel 6.35 2.38 4.63 6.14 6.57Jordan 8.51 6.62 8.60 10.05 8.80Kuwait 2.48 3.31 3.02 2.76 2.37Lebanon 5.15 4.55 6.85 8.39 5.59Saudi Arabia 14.27 9.81 19.63 10.84 7.52Turkey 52.70 39.21 59.30 38.09 36.60United Arab Emirates 86.08 81.40 93.92 82.58 67.20Total Middle East 178.16 149.64 199.59 161.67 137.27
North Africa Algeria 6.40 11.61 11.97 11.25 6.88Egypt 3.98 4.61 9.41 7.12 8.62Libya 1.54 0.79 1.18 1.04 0.13Tunisia 1.72 2.47 3.01 1.24Total North Africa 13.82 17.59 25.57 23.01 17.81
Sub-Saharan Africa South Africa 5.05 4.13 4.76 3.80 2.79Total Sub-Saharan Africa 5.48 4.53 5.25 4.13 3.00TOTAL MIDDLE EAST/AFRICA 197.45 171.76 230.41 188.81 158.08
TOTAL SHIPMENTSTotal Export Shipments 1,295.57 1,278.05 1,351.91 1,177.89 1,021.96 Total U.S. Shipments 641.81 588.40 546.71 489.68 449.50TOTAL GLOBAL SHIPMENTS 1,937.38 1,866.45 1,898.62 1,667.57 1,471.46
Shipments by Region
2013/14
Asia-Pacific
North America
27%
36%
Western Europe
22%
Middle East/Africa
Central/Eastern Europe
Latin America/Caribbean
10%
1%
3%
DOMESTIC + EXPORT SHIPMENTS 2009/10–2013/14
1,0221,178
1,352 1,278 1,296
450 490 547 588642
in million pounds
Domestic Export
12/13 13/1410/1109/10 11/12
JapanU.A.E.IndiaGermany
South Korea Italy
Spain
Turkey Netherlands
U.S.
China/ Hong Kong
86 7653
193145 127 102
Top World Destinations 2013/14in million pounds
Top Ten Export Destinations 2013/14Top ten export markets represent 72% of total export shipments.
Export Shipments by Product Type 2009/10–2013/14
12/13
836
144
298
13/14
923
150
223
10/11
834
219
124
09/10
723
173
127
11/12
928
144
281
in million pounds
In-shell Manufactured Shelled
Source: Almond Board of California, July 2014 Position Report. Source: Almond Board of California.
Source: Almond Board of California.
Source: Almond Board of California.
Source: Almond Board of California.
642
53 53 45
18 19
Dairy and
Products
Dairy and
Products
Pistachios
Grapes, Wine and Raisins
AlmondsSource: Bureau of the Census, U.S. Department of Commerce, Foreign Trade Statistics.*Calendar year January through December 2013.
$4,163
$1,507 $1,380 $1,244 $1,107 $939 $912$542 $500 $412
$3,387
9,583
$2,085
5,824
$1,313
3,612
$1,112
2,096
$1,073
1,782
$688
1,345
$664
542
$574
406
$483
397
Almonds
Rice
Walnuts
Tomatoes,Processed
Pistachios
Grapes, Wine and Raisins
Rice Oranges and
Products
Cotton
Tomatoes,Processed
Walnuts
Cotton
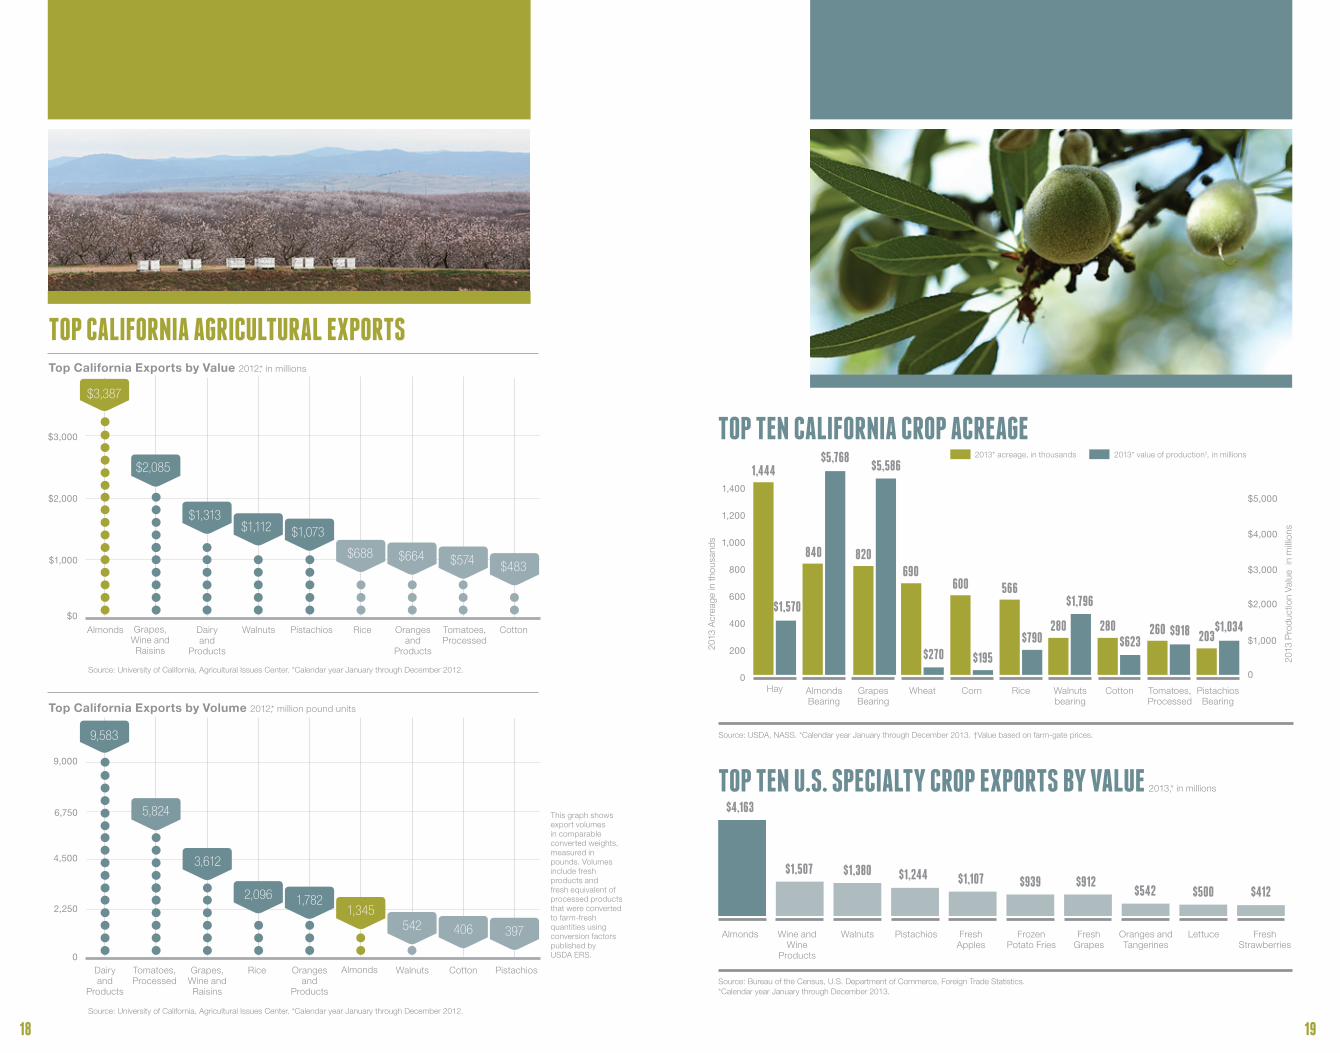
This graph shows export volumes in comparable converted weights, measured in pounds. Volumes include fresh products and fresh equivalent of processed products that were converted to farm-fresh quantities using conversion factors published by USDA ERS.
$1,000
$2,000
$3,000
9,000
6,750
4,500
2,250
$0
0
400
200$1,000
0
$2,000
$3,000
$4,000
$5,000
800
600
1,200
1,400
1,000
0
Source: University of California, Agricultural Issues Center. *Calendar year January through December 2012.
Source: University of California, Agricultural Issues Center. *Calendar year January through December 2012.
TOP CALIFORNIA AGRICULTURAL EXPORTS
Top California Exports by Volume 2012,* million pound units
Top California Exports by Value 2012,* in millions
PistachiosAlmonds Wine and Wine
Products
Walnuts Fresh Apples
Frozen Potato Fries
Fresh Grapes
Oranges and Tangerines
Lettuce Fresh Strawberries
TOP TEN U.S. SPECIALTY CROP EXPORTS BY VALUE 2013,* in millions
Oranges and
Products
1,444
$1,570
Hay
840
$5,768
AlmondsBearing
$5,586
820
GrapesBearing
$270
690
Wheat
$195
600
Corn
$790
566
Rice
$1,796
280
Walnutsbearing
$623280
Cotton
$918260
Tomatoes,Processed
$1,034203
PistachiosBearing
Source: USDA, NASS. *Calendar year January through December 2013. †Value based on farm-gate prices.
TOP TEN CALIFORNIA CROP ACREAGE2013* acreage, in thousands 2013* value of production†, in millions
2013
Acr
eage
in th
ousa
nds
2013
Pro
duc
tion
Valu
e in
mill
ions

20 21
CALIFORNIA CLASSIFICATION This marketing classification was established in June 1972 by the USDA, Federal-State Inspection Service, Sacramento, at the request of the almond industry.
In addition to the varieties listed on page 20, the variety Nonpareil may be included in the California classification but not to exceed 25% by weight of the lot.
Similar Varietal Characteristics
United States Standards for Grades of Shelled Almonds, §51.2116 (b):
• When a lot is specified and carton marked as California, kernels present may include any one or a combination of blanchable varieties within the California marketing classification. In addition, Nonpareil or similar types may be included provided that it does not exceed 25%, by weight, of the lot.
• Further, with the exception of Nonpareil, Sonora and Independence varieties, other varieties included in the California classification shall not be permitted in the Nonpareil classification.
This group has become the marketing outlet for kernels of many almond varieties with a wide range of shapes and sizes. Despite this diversity, the almonds in this classification are known for their ease of blanching. As mentioned above, caution must be exercised by growers not to deliver mixed varieties, even when they are in the same market classification.
ALMOND MARKET VARIETY CLASSIFICATIONS Due to changes in the varieties produced within the industry, some older varieties are contributing very low volumes to the overall production and marketing numbers. At the same time, newer varieties have come into production. Based on current crop production, the Industry Services Committee has updated the market classifications. Because the market classification affects the price received, it is important for growers to consult their handler before planting and delivering new varieties. It is also important not to mix varieties at harvest, even when these varieties are in the same marketing category, as this will make handling more difficult and will reduce marketability and value.
Marketing classifications are grouped by general size and shape. Only varieties producing in excess of 1,000,000 pounds as of July 2014 are listed. Other varieties that are not listed are still produced; if you have any questions about where they are classified for marketing purposes, please contact your handler.
Of the five classifications listed, most almond production falls into the three major classifications: Nonpareil, California and Mission. Beyond these standard classifications are numerous “minor varieties” whose use and, therefore, market classification will vary among almond handlers. The physical characteristics of some varieties vary from year to year, which also may affect how they are marketed. It is important to remember that these classifications are for reference only. Your handler can provide specific information since they may classify market varieties differently.
All varieties can be blanched; those classified as California type are known for their ease of blanching. Although some varieties fall under a like classification, they can vary slightly in shape, color from variety to variety and should not be mixed. Always consult your handler when purchasing a mix of more than one variety.
NONPAREIL CLASSIFICATION
In essence this group is the Nonpareil variety, which has the widest range of uses of all the marketing categories, from use as whole natural kernels to manufactured products. The attractive kernels are a medium shape and size, uniform, fairly flat and light (blond) colored. Nonpareil is often used where the nut is visible and also in manufactured products because the kernels are readily blanched and/or mechanically cut to produce a variety of forms. Furthermore, the thin shell allows maximum yield of undamaged kernels after cracking. Nonpareil is the major producing variety of the California Almond industry. Because Nonpareil receives a premium price, it is most critical that this variety not be mixed with any other varieties. Sonora and Independence are also included in this classification for their similar use and acceptability as a substitute for Nonpareil variety for whole natural kernels to manufactured products.
Shelled Types Inshell Types Appearance
Va
riet
y
Non
pare
il Ty
pe
Cal
iforn
ia T
ype
Car
mel
Typ
e
Mis
sion
Typ
e
Oth
er T
ypes
Insh
ell H
ard
She
ll
Insh
ell S
oft S
hell
Long
and
Fla
t
Sho
rt a
nd P
lum
p
Aldrich • • • •
Avalon • • • •
Butte • • • •
Butte/Padre • • • •
Carmel • • • •
Fritz • • • •
Independence • • • •
Livingston • • • •
Marcona • • • •
Mission • • •
Monterey • • • •
Nonpareil • • • •
Padre • • • •
Peerless • • •
Price • • • •
Ruby • • • •
Sonora • • • •
Winters • • •
Wood Colony • • • •
CARMEL CLASSIFICATION
Processors have been offering Carmel as a separate item and this action is based on sufficient volume received; handling and processing facilities, which can accommodate such a separation and marketing opportunities. Carmel is a relatively long, narrow, large, light-colored kernel. The Carmel variety has lost 50% of its production in the last 10 years while the Monterey variety has doubled in volume and is commonly sold as a Carmel type. All Carmel types are also listed as California types.
MISSION CLASSIFICATION
Mission type kernels are small, wide and often thick (round) and their pellicles (skins) are brown. This type is often used as whole brown-skin forms. Blanching is possible, although not as efficiently as California/Nonpareil and Carmel type.
INSHELL HARD SHELL CLASSIFICATION
Peerless is the principal variety sold to consumers as an inshell hard shell product, although it can be cracked out and blanched. These inshell varieties are characterized by an attractive closed shell with a firm outer “cork”, which both protects the kernel against worm damage and other contamination. The inshell hard shell market is firmly established, but has a relatively limited volume in relation to other marketing outlets.
INSHELL SOFT SHELL CLASSIFICATION
This group is market specific. The snack market prefers soft shell with greater suture openings to allow seasons to permeate the shell. Hand-crack market that will be sold as kernels also prefers soft shell to allow for manual cracking. Please consult your handler to determine the right inshell soft shell variety for your needs.
To learn more about Almond Market Variety Classifications, contact Sue Olson at [email protected] or 209.343.3224.

22 23
Source: Almond Board of California.Source: USDA, Economic Research Service, Fruit & Treenut Situation and Outlook.
998912
1,117
1,383
1,615
1,406
1,628
2,020
1.361.48
1.60
1.802.00
1.21 1.151.28 1.25 1.28
0.47 0.550.45 0.42 0.470.49 0.47 0.53
0.36 0.44
0.09 0.17 0.18 0.25 0.29
0.04 0.05 0.05 0.06 0.0604/05 05/06 06/07 07/08 08/09 09/10 10/11 11/12 12/13 13/14
1.46%
1.76%
2.15%
0.87%
1.11%
0.80%
1,884
2,010
1.23%
1.05%
CALIFORNIA ALMOND CROP-SIZE HISTORY VS. INEDIBLE PERCENTAGE crop years 2004/05–2013/14
COMPETING NUTS
Gross crop size, including inedibles, in million pounds
Inedible gross percentage
ALMONDS WALNUTS HAZELNUTS PECANS PISTACHIOS OTHER NUTS*
CROP YEAR Crop Imports Crop Imports Crop Imports Crop Imports Crop Imports Crop Imports
2002/03 1,063.5 1.9 240.5 0.2 15.3 16.4 78.4 41.7 149.5 0.8 26.7 301.7
2003/04 1,011.1 2.8 281.5 0.4 29.5 10.9 117.0 62.7 56.2 1.5 21.2 352.4
2004/05 972.8 5.7 288.4 0.8 27.2 12.8 82.6 81.2 170.5 0.8 18.7 402.4
2005/06 888.7 9.2 288.2 1.1 20.0 12.1 125.3 75.4 139.0 0.9 51.4 334.9
2006/07 1,087.8 8.1 294.6 2.3 36.4 13.5 91.4 57.0 119.0 1.4 27.8 358.8
2007/08 1,358.3 7.1 295.0 9.0 28.6 13.4 180.3 79.9 207.0 0.9 16.4 378.3
2008/09 1,571.9 4.2 395.5 2.0 26.2 10.0 94.3 61.9 135.4 0.9 32.7 360.4
2009/10 1,379.0 5.6 381.5 3.2 37.4 8.0 127.5 80.1 174.8 1.3 19.1 366.4
2010/11 1,600.3 8.1 436.8 0.5 21.3 11.0 140.4 82.8 250.1 0.5 18.2 379.5
2011/12 1,979.9 15.9 399.8 4.9 29.1 9.7 124.6 74.6 222.0 0.9 22.3 339.0
2012/13† 1,848.4 39.4 440.4 8.0 29.1 15.3 141.0 79.3 275.5 2.5 20.0 351.5
Source: USDA, Economic Research Service, Fruit & Tree Nut Situation and Outlook. *Other Nuts includes Brazil nuts, macadamia nuts, pine nuts, chestnuts, cashews and mixed nuts. †Preliminary.Note: Marketable production is utilized production minus inedibles and noncommercial use.
Almond Advertising Share of Voice
Overall, ABC U.S. advertising spending
represents 1% of entire snacking category and
22% of the nut category.Note: All brands, including Almond Board of California, are reported based on Nielsen reported spending for 2013 not actual negotiated spending.
Source: U.S. Nielsen AdViews.
1.39%
1.24%Domestic Per Capita Consumption of Competing Snack Nuts 2008/09–2012/13, pounds per capita
U.S. Marketable Production and Imports of Competing Nuts 2002/03–2012/13, in million pounds (shelled basis)
08/09 09/10 10/11 11/12 12/13
Almonds Peanuts Walnuts Pecans Pistachios Hazelnuts

24 25
Revised AQFS mission:
RESEARCH OVERVIEW
Initiated: 1995Key Research Areas: Heart Health & Beyond, Diabetes/Metabolic Syndrome, Weight Management, Satiety/Gut Health, Composition—Content/Action, Allergens, Other Areas
Projects Funded: 80Total Investment: $18.3M
Initiated: 2003*Key Research Areas: Air Quality, Stewardship/Crop Protection, Water Quality
Projects Funded: 37Total Investment: $4.7M
Research funded since: 2001Key Research Areas: Prevalence/Monitoring, Safety, Quality
Projects Funded: 79Total Investment: $5.9M
NUTRITION RESEARCH COMMITTEEALMOND QUALITY + FOOD SAFETY COMMITTEE
Initiated: 1973Key Research Areas: Pest Management/Entomology, Horticulture/Crop Research, Plant Pathology/Nematology, Bee Health/Pollination
Projects Funded: 271Total Investment: $20.3M
The almond industry is a leader in California agriculture and has a long-standing history of research investment to support the quality of our crop and food product. In addition to providing nutrients consumers need and delivering benefits that support the health of the population, almonds are also a sustainable commodity. In our 40-plus years of research exploration we realized that using simple metrics was not appropriate for dealing with the complexity and the natural variability of the physical and biological systems that farming takes place in.
Any practice that a grower chooses to use will have trade-offs in terms of impacts on the environment, humans and economics. It’s essential to support these good agricultural and manufacturing practices with sound science. We recognize how interconnected all the research we support is and that the almond industry must collaborate with a wide range of research partners in state and federal research centers, government labs and universities to ensure the sustainability of the U.S. food supply to optimize use of natural resources and minimize environmental impacts.
*Environmental research was underway prior to the initiation of this committee, activities conducted under the Production Research Committee.
PRODUCTION RESEARCH COMMITTEE
ALMOND QUALITY + FOOD SAFETY PROGRAMThe Almond Quality and Food Safety (AQFS) Committee’s original and sole responsibility was to administer a compliance program—“inedible” disposal based on incoming inspection. This quality control program also had an important food safety aspect. Research in the early 1970s indicated an association between aflatoxin occurrence and the percentage of inedible, especially insect-damaged kernels. Removal of “inedible” from the distribution channel minimizes aflatoxin occurrence. In 1995 the Committee began to fund aflatoxin testing. After the first Salmonella outbreak associated with raw almonds in 2001, the role of the Committee was broadened to develop and implement food safety programs while supporting research projects in almond safety and quality.
From the mid-2000s the AQFS Committee began to manage a sophisticated almond quality and food safety system including: (1) mandatory compliance programs: mandatory treatment rule, inedible disposal, and voluntary aflatoxin sampling plan (i.e., a voluntary plan implemented with compliance mode); (2) almond quality and safety research program; (3) educational programs: Hazard Analysis and Critical Control Points (HACCP), Good Agricultural Practices (GAPs), Good Manufacturing Practices (GMPs), Sanitation Standard Operating Procedures (SSOPs), Pathogen Environmental Monitoring (PEM), and the annual quality and safety symposium; and (4) survey and monitoring: pesticide residue, pathogen, heavy metals and aflatoxin.
Continued advancements in food safety technology and implementation steps will help us to build a quality reputation among our buyers, food manufacturers and, ultimately, the consumers around world.
Food Safety: 58 projects
Almond Quality: 21 projects
Pathogen: >16,000 samples
Pesticide Residues: 3420 samples
Aflatoxin: 1443 samples, >10,000 VASP analyses per year
Heavy metals: 140 samples
Inedible Disposal
Pasteurization
Voluntary Aflatoxin Sampling Plan (VASP)
Annual AQFS Symposia: 14
Ongoing Industry Workshops and Seminars
Educational Programs: GAPs, GMPs, HACCP, PEM, SSOPs
Tools and Factsheets
PROGRAM DEVELOPMENT + COMPLIANCESURVEY + MONITOR
EDUCATIONRESEARCH
ENVIRONMENTAL COMMITTEE
MRLs Management Food Safety Modernization Act
Pasteurization Almond Quality
To ensure the quality and safety of California Almonds, through science, research, leadership and industry-wide education.
2014 Long-Term Strategic Plan Meeting
Strategic priorities:

26 27
TM
CALIFORNIA ALMOND SUSTAINABILITY PROGRAM Following more than 30 years of research aimed at improving production practices, in 2009 the almond industry established the California Almond Sustainability Program (CASP). Sustainability is about continuous improvement to show respect for the environment, neighbors, employees, as well as for profit. The program is based on grower and handler self-assessments that benchmark the ongoing status in practices of growers related to the following aspects in their operations:
• Water (usage and quality)• Land (nutrient management, pest management and bee health)• Air quality• Energy
With more than 10 percent of California Almond acreage assessed, each practice was analyzed for its relative impact on the environment or grower economics. This value analysis helped identify which practices with the most impact are most widely in use, and which our industry could use more effectively. The results of the analysis have directly impacted the ongoing Almond Board research and grower education programs run by the Almond Board. Having growers document what they are doing daily on their farms also has another important benefit—allows us to share the real story of what is involved in growing and handling almonds.
Sustainability is about understanding the integrated nature of farming. For example, a number of the key practices almond growers are already using in their orchards—careful fertilizer and irrigation management—not only mean efficient use of water and fertilizers but also efficient energy use and a reduction in air and water quality impacts.
There is no single sustainable way to grow almonds in California; each location has different resources and issues. But in the end, CASP helps demonstrate the many ways California Almond growers are supporting and caring for people and the resources that make California unique for growing almonds.
To learn more about the California Almond Sustainability Program and how you can participate, visit Almonds.com/Sustainability or contact Jenny Nicolau at [email protected] or 209.343.3248.
Current status: Most almond growers use water efficiently by properly scheduling irrigation and the optimal setup of irrigation system infrastructure.
Opportunities: Almond growers could further refine irrigation efficiency by accounting for real-time crop evapotranspiration and using managed deficit irrigation, where appropriate. While cover crops can improve soil water holding capacity, they also need water to grow. Almond Board outreach is focused on these refinements.
What defines California Almond sustainability?
Sustainable almond farming utilizes
production practices that are economically viable and are based
upon scientific research, common sense and
a respect for the environment, neighbors
and employees. The result is a
plentiful, nutritious, safe food product.
YES
YES
Integrated fertilization and irrigation
Real-time crop evapotranspiration (ETC)
Demand-based irrigation
Managed deficit irrigation
Optimized irrigation infrastructure
Cover cropping
Water Usage Strengths
The top three ways that almond growers increase water efficiency while protecting the environment (percentage of assessed orchards):
Water Usage Opportunities
The top three ways that growers could increase water efficiency and protect the environment (percentage of assessed orchards):
73%
43%
83%
35%
80%
35%
The CASP logo
Sources: Almond Board of California, California Almond Sustainability Program 2014.

28 29
ALMONDS + CALIFORNIA
CALIFORNIA’S WATER IS A SHARED AND MANAGED RESOURCE
For over 100 years, Californians have been developing water infrastructure to effectively capture and transport surface water for use throughout the year and to store for dry years. While a majority of California’s precipitation falls in the north of the state, it is moved through a network of canals and aqueducts to urban population centers and agricultural land.2
All Californians, not just agriculture, rely on water captured and stored during wet winter months to access in dry summer months.
With population growth and increased regulatory demands, California’s water resources are more stretched than ever.
CALIFORNIA’S MANAGED WATER DISTRIBUTION1
10% 50% 40%
Urban Agriculture Environment
83% of growers practice demand-based irrigation, tracking items like soil moisture, tree water status or weather conditions to determine when to irrigate their orchards rather than watering on a predetermined schedule.
70% of almond orchards use micro irrigation systems, decreasing water runoff, putting water directly in the root zone and allowing for precise timing and rate of irrigation.
62% of growers use soil maps while designing their irrigation systems to best match the soil characteristics of their orchards for optimal water infiltration and distribution.
1. California Department of Water Resources (DWR), 2014. 2. Public Policy Institute of California, 2011. 3. United States Department of Agriculture (USDA), 1910-2012. 4. California Department of Finance, 2013. 5. DWR, 2014 (updated version published by source, Feb. 2015). 6. National Agricultural Statistics Service, 2014. 7. USDA, 2012. 8. Almond Board of California (ABC), 2014. 9. California Almond Sustainability Program.
Through Almond Board of California (ABC), almond farmers have been funding water efficiency research since 1982.
Since the early 1990s, advanced production practices have helped almond growers improve their water efficiency by 33%, producing more crop per drop.8
The water almond farmers use grows more than just almonds. Almond hulls, the fuzzy green outer covering, feed dairy cows and are a part of a cow’s balanced diet.
Almond by products don’t go to waste—in fact, shells are used for energy production through cogeneration and as animal bedding.
CALIFORNIA + WATER ALMONDS + WATER
Almond Board of California invests over $2 million a year researching production and environmental issues. Current research projects include:
THE CALIFORNIA ALMOND INDUSTRY IS COMMITTED TO WATER EFFICIENCY
LOOKING TO THE FUTURE
THE FACTS ABOUT WATER + ALMONDS
AND OUR GROWERS AREN’T STOPPING THERE9
California contributes over 50% of fruits, vegetables and nuts in U.S. agriculture, allowing for a diversity of healthy foods in Americans’ daily diet.
California produces 100% of the U.S. domestic supply of almonds.
California’s Mediterranean climate, with its cool wet winters and hot dry summers, offers ideal growing conditions for many diverse crops.
California’s top ten crops in acreage are hay, almonds, grapes, wheat, corn, rice, walnuts, cotton, tomatoes and pistachios, and they all need water to grow. Combined, they cover 76% of California’s irrigated land.6,7
CALIFORNIA IS THE NUT, FRUIT AND VEGETABLE BASKET OF THE U.S.
Bloom season doesn’t have a large threat of frost, meaning optimal pollination of delicate almond blossoms.
Ideal climate combined with the Central Valley’s rich soil, water availability and infrastructure, innovative technology and research makes California the most productive almond growing region in the world.
GLOBAL MEDITERRANEAN CLIMATES
Despite population growth and decreased acreage dedicated to agriculture, the output of California agriculture has continually increased.
In the last 40 years the value of California agriculture has increased by more than 85%. During that period, the total California crop-applied water use fell by more than 5%, from 31.2 million acre-feet, to 29.6 million acre-feet.5
CALIFORNIA AGRICULTURE PRODUCES MORE WITH LESS
Pop
ulat
ion
(in m
illion
s)
CHANGES IN CALIFORNIA POPULATION AND FARM ACREAGE3, 4
LAND IN FARMS POPULATION
Land
in F
arm
s (a
cres
in m
illion
s)
40
35
30
25
20
15
10
5
0
40
35
30
25
20
15
10
5
0
1912
1902
1922
1932
1942
1952
1962
1972
1982
1992
2002
2012
Soil can vary significantly; therefore, ABC is funding
research to manage irrigation and production practices that can match the different soil types within one orchard.
ABC started funding traditional almond breeding research
in 1974. Over the years, this research has added focus on traits that require less water and can withstand higher salinity.
Ongoing research will increase irrigation efficiency by improving
understanding of complex factors like tree size that impact evapotranspiration (water lost through soil, air and leaves).
Cool winters provide adequate chilling without damaging trees.
Warm, dry summers mean perfect weather for almond kernel development and harvest.

30 31
0
500,000
1,000,000
2,000,000
2,500,000
3,000,000
3,500,000
4,000,000
1,500,000
Number of U.S. Honey Bee Colonies. 4
90 91 92 93 94 95 96 97 98 99 00 01 02 03 04 05 06 07 08 09 10 11 12
Average acceptable overwintering losses at 15% Percentage Total Colony Winter Loss
06/07 07/08 08/09 09/10 10/11 11/12 12/13 13/14Pe
rce
nta
ge
To
tal C
olo
ny
Win
ter
Lo
ss
0%
5%
10%
15%
20%
25%
30%
35%
40%
Managed Honey Bee Overwinter Losses in the U.S.3
THE POLLINATION PARTNERSHIP
ALMONDS AND HONEY BEES ARE ESSENTIAL TO EACH OTHER
ALMONDS NEED HONEY BEES Almond trees require cross-pollination between varieties, and orchards
are planted with multiple almond varieties in alternating rows. Honey bees are necessary to move pollen between varieties (and within
flowers) to pollinate almond blossoms, which, when fertilized, become the almond kernels that we all love to eat.
ALMOND BOARD OF CALIFORNIA IS COMMITTED TO IMPROVING HONEY BEE HEALTH
Almond Board of California (ABC) has and continues to fund more research on bee health than any other crop or commodity group.
ABC has funded research in pollination since 1976, investing almost $2,500,000 of almond industry dollars.
Honey bee health has been a focus since 1995, with almost $1,600,000 devoted to several different research areas (i.e., nutrition, stock improvement, pest/disease management, impact of pesticides, technical assistance for beekeepers).
ABC is a thought leader in honey bee health initiatives and engages with several government and private organizations, the research community and beekeeping associations.
And ABC recommends grower best practices for honey bee health through grower education programs. See Almonds.com/Pollination for more information.
HONEY BEES BENEFIT FROM ALMONDS Almond bloom is the first natural pollen source for bees after winter.
Almond bloom pollen is very nutritious for honey bees.
Honey bee hives grow stronger from almond bloom, and many hives are then split to grow beekeeper apiaries.
HONEY BEES ARE VITAL TO AGRICULTURE
BASED ON THE RESEARCH, ABC DEVELOPS BEST
PRACTICES FOR HONEY BEE HEALTH AND EDUCATES ALL
POLLINATION PARTNERS
Beekeeper
Bee Broker
Owner-Lessee
Farm Manager
Pest Control Adviser (PCA)
Applicator
KNOW THE FACTS ON HONEY BEE HEALTHThe decline in honey bee health has been linked to
a variety of complex factors, including those influenced by the activities associated with
both beekeeping and crop production5:
Varroa mitesLack of forage and nutritionOther pests and diseases
Pesticide exposureLack of genetic diversity in breeding
But all of us want better than just stable, we want healthier bees.
The number of hives in the U.S. remains relatively stable.
However, overwintering honey bee losses are of concern, requiring beekeepers to put in more work to maintain their hives.
More than 90 crops are pollinated by commercial honey bees.
of global food production volume relies on pollinators to some degree.1
per year = U.S. agricultural production supported by honey bee pollination.2
HOWEVER, A DECLINE IN HONEY BEE HEALTH HAS PUT AGRICULTURE AT RISK
1. Klein, 2007. 2. USDA. 3. Apiary Inspectors of America and USDA-ARS Beltsville Lab. 4. USDA NASS Honey Production Report. 5. Honey Bee Health Coalition, 2014.
901/3 $18,000,000,000

32 33
0 grams of almonds
Research shows that snacking has become a nearly universal behavior, with an estimated 97% of Americans reporting snacking at least once a day. Almond Board of California has funded a number of studies looking at the health effects of choosing almonds as a snack. Many of these studies focus on the impact of choosing almonds on satiety.
In fact, a new study published in late 2014 in the European Journal of Nutrition showed that for healthy women, a mid-morning snack of almonds helped control appetite and resulted in reduced calorie intake over the rest of the day. The study suggests that almonds may be a smart snack option since they helped enhance satiety without increasing daily calorie consumption.
This study helps address the growing need to identify snacks that are desirable and satisfying that also help people manage calorie intake and stay on track with their health and nutrition goals.
The results of our research projects help consumers, health professionals, food professionals, government officials and many others make informed choices and recommendations.
Results of our research are used to:
• Help the almond growers and industry better understand their product.
• Educate consumers and help promote public health by providing additional reasons to choose nutritious, whole-food snack options.
Since 1995, almond growers have funded approximately $18.3 million in nutrition research and continue to dedicate $1.6 million per year to better understand the nutrient composition and potential health benefits of almonds.
• There are currently 12 human clinical studies ongoing in three key areas that build the sound science to support snacking on 1-2 ounces of almonds daily for cardiometabolic health: heart health, diabetes prevention and weight management.
• 12 new research papers were published in 2014 to add to the growing body of almond nutrition research, comprising just over 116 scientific publications.
Almond Board of California is committed to understanding as much as possible about the product we grow and provide to consumers.
• This includes not only understanding almonds’ potential health benefits, but also the nutrient composition.
Almond Board of California funds research in health areas that consumers care about around the world.
• Historically, much of this research has been in the area of heart health. However, the growing interest in weight management among consumers globally has prompted a shift in emphasis toward weight management and satiety research.
• Currently, a growing body of research supports the role of almonds in promoting satiety or the feeling of fullness.
Source: Almond Board Global Perceptions Study, 2013.
NUTRITION RESEARCH:UNDERSTANDING THE IMPACT OF CALIFORNIA ALMONDS ON HUMAN HEALTH AND WELLNESS
COMMITMENT TO HEALTH + NUTRITION RESEARCH
UNDERSTANDING NUTRIENT COMPOSITION
RESEARCH RESULTS IN ACTION
ALMONDS: MAKING THE SMART CHOICE THE EASY CHOICE
HEALTH RESEARCH ALIGNS WITH CONSUMER CONCERNS
Almond Board research has helped reshape consumer and health professional understanding and perceptions of nuts and almonds, in particular. Countries around the world are adopting research-based dietary guidance. Almond nutrition research is made publicly available and has helped inform recommendations for nut intake around the world.
• For example, South Korea recently moved nuts from the “eat sparingly” category to the “protein” category, emphasizing to consumers that nuts are now a recommended protein source.
• Language around nut intake in the U.S. Dietary Guidelines has been increasingly positive over the past 15 years. These guidelines are currently being revised for 2015 with a new focus on sustainability and how to define sustainable diet patterns.
RESEARCH HELPS ADVANCE DIETARY GUIDANCE AROUND THE WORLD
IMPACT OF HEALTH CONDITION
22%
64%
57%52% 50% 50%
42%
26%
31%
31%
21%
23%
27%
23%
27%
• There is also great interest around the world in understanding how to prevent and manage diabetes, an area ABC is exploring with several ongoing research projects, both domestic and international.
• Almond Board continues to fund research in emerging areas of interest to identify other potential health benefits.
• ABC analyzes almond samples for macronutrients and key vitamins and minerals. These analyses are done using accredited independent testing laboratories in the U.S. The data is submitted to the U.S. Department of Agriculture (USDA) for use in their National Nutrient Database and is available for use in nutrient databases globally.
• Educate health professionals.
• Inform the international scientific community at conferences and symposia. This not only leads to more questions and more independent research, but also makes current health and nutrition information available to policymakers who make recommendations for national dietary guidelines.
• Make nutrient analysis data available to government agencies around the world for use in updating nutrient databases.
Source: Hull, S., R. Re, L. Chambers, A. Echaniz, M.S.J. Wickham. 2014. A mid- morning snack of almonds generates satiety and appropriate adjustment of subse-quent food intake in healthy women. Eur. J. Nutr. DOI 10.1007/s00394-014-0759-z.
Overweight High Cholesterol
Hunger and fullness ratings from pre mid-morning snack (no snack, 28g almonds or 42g almonds) to immediately following lunch.
Visual representation of the Korean Dietary Guidelines Endorsed by the Korean Nutrition Society
Heart Disease Obesity Diabetes
Health Concern for FuturePersonal/Family Condition
DIETARY FIBER 3.5g
PROTEIN 6.0g
FOLATE 14mgc
CALCIUM 75mg
RIBOFLAVIN 0.3mg
CALORIES 163POTASSIUM 200mg
VITAMIN E 7.4mg
IRON 1.1mg
1.0mgNIACIN
BASED ON A ONE-OUNCE PORTION.
A Mid-Morning Snack of Almonds Generates Satiety
How Hungry Are You?
0
-10
10
20
30
40
50
0 120906030
-20
-30
-40
-50
Hun
ger
Rat
ing
s
Time in minutes
28 grams of almonds 42 grams of almonds
34 35
CRUNCH ON
POWERTO KEEP YOU ROLLINGRIGHT ALONG
Energize your day with the crunch of almonds. Get 6g of energy-giving protein, 4g of hunger-slaying fi ber and essential nutrients in every heart-healthy handful, ready whenever you need it most.
Learn more at Almonds.com.
Scie
nti
fi c e
vid
en
ce s
ug
gest
s, b
ut
do
es
no
t p
rove, th
at
eati
ng
1.5
ou
nces
per
day o
f m
ost
nu
ts, su
ch
as
alm
on
ds,
as
part
of
a d
iet
low
in
satu
rate
d
fat
an
d c
ho
lest
ero
l m
ay r
ed
uce t
he r
isk o
f h
eart
dis
ease
. A
on
e-o
un
ce h
an
dfu
l h
as
13g
of
un
satu
rate
d f
at
an
d o
nly
1g
of
satu
rate
d f
at.
© 2013 Almond Board of California. All rights reserved. CRUNCH ON
AN EXCELLENTSOURCE OFCAN-DO IN EVERY CRUNCH
Whatever you take on, take it on with almonds.Get 6g of energy-giving protein and 4g of hunger-slaying fi ber to really bring it all day, every day.
Learn more at Almonds.com.
On
e s
erv
ing
of
alm
on
ds
(28
g)
has
13g
of
un
satu
rate
d f
at
an
d o
nly
1g
of
satu
rate
d f
at.
© 2013 Almond Board of California. All rights reserved.
NORTH AMERICAIn North America, consumers like almonds and believe they are nutritious and a smart choice. However, many snack occasions are fun and include foods that are indulgent and big on flavor (salty and sweet). That’s the opportunity for almonds to show their versatility and other unique characteristics, like their satisfying crunch!
CRUNCH ON
Scie
nti
fic e
vid
en
ce s
ug
gest
s, b
ut
do
es
no
t p
rove, th
at
eati
ng
1.5
ou
nces
per
day o
f m
ost
nu
ts,
such
as
alm
on
ds,
as
part
of
a d
iet
low
in
satu
rate
d f
at
an
d c
ho
lest
ero
l m
ay r
ed
uce t
he r
isk o
f h
eart
dis
ease
. A
on
e-o
un
ce h
an
dfu
l h
as
13g
of
un
satu
rate
d f
at
an
d o
nly
1g
of
satu
rate
d f
at.
HEARTHEALTHFOR THOSEWITH HEART
There’s a passion for life in the crunch of almonds. Get 6g of protein, 4g of fiber and essential nutrients in every heart-healthy handful to really bring it all day, every day.
Learn more at Almonds.com.
© 2013 Almond Board of California. All rights reserved.
Per one-ounce serving.
CRUNCH ON
Scie
nti
fi c e
vid
en
ce s
ug
gest
s, b
ut
do
es
no
t p
rove, th
at
eati
ng
1.5
ou
nces
per
day o
f m
ost
nu
ts,
such
as
alm
on
ds,
as
part
of
a d
iet
low
in
satu
rate
d f
at
an
d c
ho
lest
ero
l m
ay r
ed
uce t
he r
isk o
f h
eart
dis
ease
. A
on
e-o
un
ce h
an
dfu
l h
as
13g
of
un
satu
rate
d f
at
an
d o
nly
1g
of
satu
rate
d f
at.
There’s extended playtime in the crunch of almonds. Not to mention 6g of energy-giving protein, 4g of hunger-slaying fi ber and essential nutrients in every heart-healthy, one-ounce handful.
Learn more at Almonds.com.
© 2013 Almond Board of California. All rights reserved.
THE CRUNCHTHAT KEEPS YOU IN THE
GAMEThere’s extended playtime in the crunch of almonds. Not to mention 6g of energy-giving protein, 4g of hunger-slaying fi ber and essential nutrients in every
THE CRUNCHAT KEEPS
THE
GAME
The Crunch On campaign features high-energy, vibrant situations that demonstrate how snacking on almonds helps consumers get the most out of every day. The media campaign included television, print and online advertising in targeted, lifestyle content. An exciting, high-impact integration was featured on The Ellen Degeneres Show. California Almonds were included in a “live commercial” to communicate the Crunch On message in a fun and comedic way, leveraging Ellen DeGeneres’s likability and dedicated following.
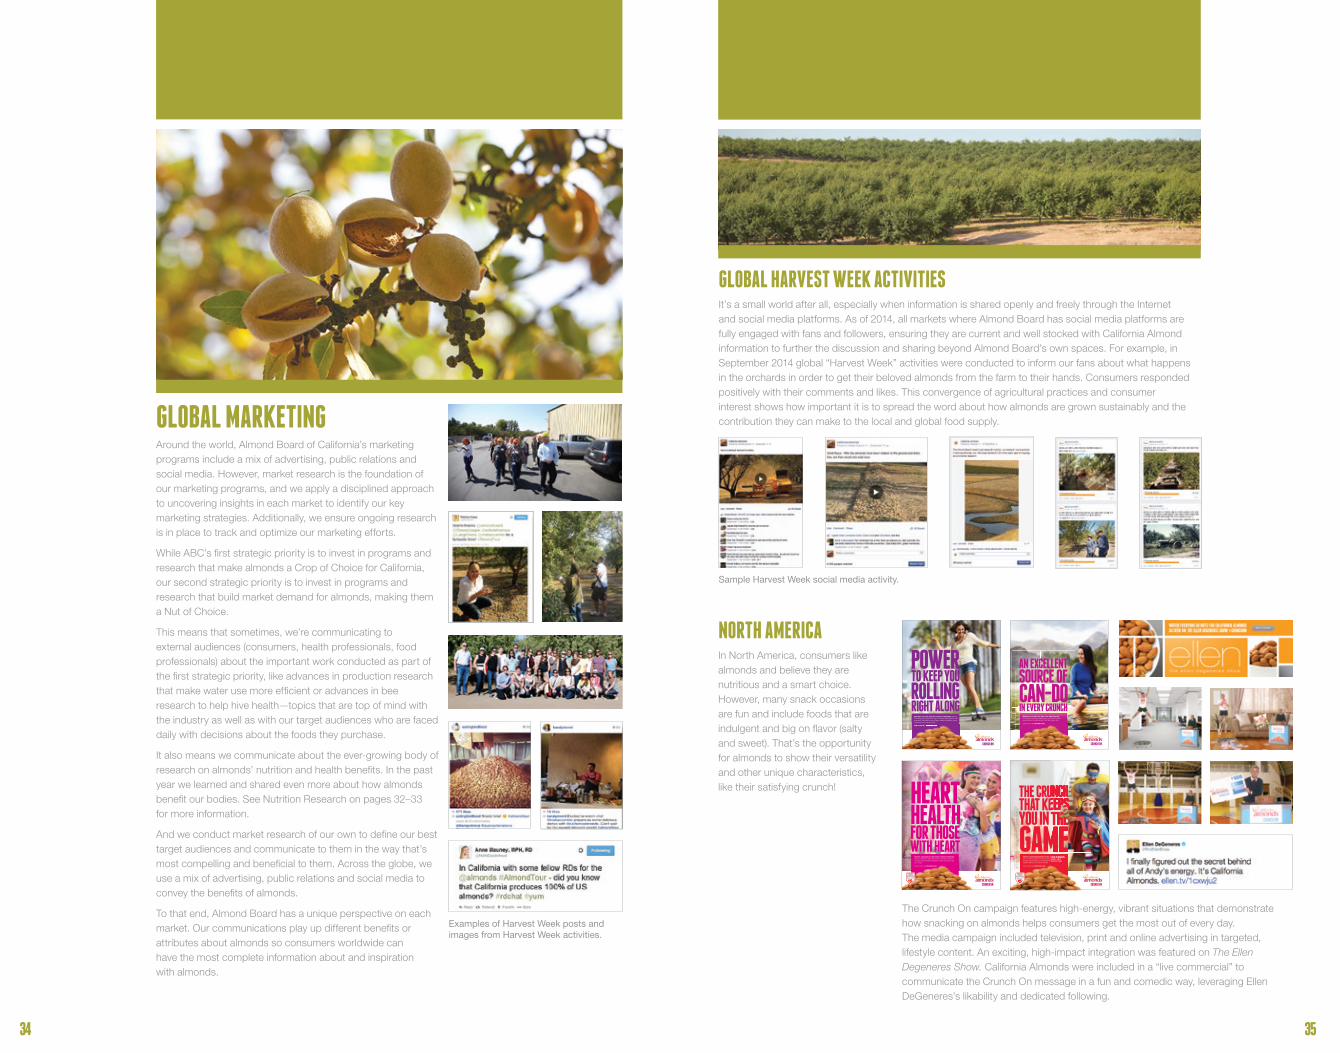
GLOBAL MARKETINGAround the world, Almond Board of California’s marketing programs include a mix of advertising, public relations and social media. However, market research is the foundation of our marketing programs, and we apply a disciplined approach to uncovering insights in each market to identify our key marketing strategies. Additionally, we ensure ongoing research is in place to track and optimize our marketing efforts.
While ABC’s first strategic priority is to invest in programs and research that make almonds a Crop of Choice for California, our second strategic priority is to invest in programs and research that build market demand for almonds, making them a Nut of Choice.
This means that sometimes, we’re communicating to external audiences (consumers, health professionals, food professionals) about the important work conducted as part of the first strategic priority, like advances in production research that make water use more efficient or advances in bee research to help hive health—topics that are top of mind with the industry as well as with our target audiences who are faced daily with decisions about the foods they purchase.
It also means we communicate about the ever-growing body of research on almonds’ nutrition and health benefits. In the past year we learned and shared even more about how almonds benefit our bodies. See Nutrition Research on pages 32–33 for more information.
And we conduct market research of our own to define our best target audiences and communicate to them in the way that’s most compelling and beneficial to them. Across the globe, we use a mix of advertising, public relations and social media to convey the benefits of almonds.
To that end, Almond Board has a unique perspective on each market. Our communications play up different benefits or attributes about almonds so consumers worldwide can have the most complete information about and inspiration with almonds.
GLOBAL HARVEST WEEK ACTIVITIESIt’s a small world after all, especially when information is shared openly and freely through the Internet and social media platforms. As of 2014, all markets where Almond Board has social media platforms are fully engaged with fans and followers, ensuring they are current and well stocked with California Almond information to further the discussion and sharing beyond Almond Board’s own spaces. For example, in September 2014 global “Harvest Week” activities were conducted to inform our fans about what happens in the orchards in order to get their beloved almonds from the farm to their hands. Consumers responded positively with their comments and likes. This convergence of agricultural practices and consumer interest shows how important it is to spread the word about how almonds are grown sustainably and the contribution they can make to the local and global food supply.
Sample Harvest Week social media activity.
Examples of Harvest Week posts and images from Harvest Week activities.

36 37
NORTHAMERICA UK FRANCE CHINA SOUTH
KOREA GLOBAL
REGION MEDIA CREATIVE
North America
China
India
UK
France
CRUNCH ON
POWERTO KEEP YOU ROLLINGRIGHT ALONG
Energize your day with the crunch of almonds. Get 6g of energy-giving protein, 4g of hunger-slaying fi ber and essential nutrients in every heart-healthy handful, ready whenever you need it most.
Learn more at Almonds.com.
Scie
nti
fi c e
vid
en
ce s
ug
gest
s, b
ut
do
es
no
t p
rove, th
at
eati
ng
1.5
ou
nces
per
day o
f m
ost
nu
ts, su
ch
as
alm
on
ds,
as
part
of
a d
iet
low
in
satu
rate
d
fat
an
d c
ho
lest
ero
l m
ay r
ed
uce t
he r
isk o
f h
eart
dis
ease
. A
on
e-o
un
ce h
an
dfu
l h
as
13g
of
un
satu
rate
d f
at
an
d o
nly
1g
of
satu
rate
d f
at.
Learn more at Almonds.com.
Scie
nti
fi c e
vid
en
ce s
ug
gest
s, b
ut
do
es
no
t p
rove, th
at
eati
ng
1.5
ou
nces
per
day o
f m
ost
nu
ts, su
ch
as
alm
on
ds,
as
part
of
a d
iet
low
in
satu
rate
d
fat
an
d c
ho
lest
ero
l m
ay r
ed
uce t
he r
isk o
f h
eart
dis
ease
. A
on
e-o
un
ce h
an
dfu
l h
as
13g
of
un
satu
rate
d f
at
an
d o
nly
1g
of
satu
rate
d f
at.
© 2013 Almond Board of California. All rights reserved. CRUNCH ON
AN EXCELLENTSOURCE OFCAN-DO IN EVERY CRUNCH
Whatever you take on, take it on with almonds.Get 6g of energy-giving protein and 4g of hunger-slaying fi ber to really bring it all day, every day.
Learn more at Almonds.com.
On
e s
erv
ing
of
alm
on
ds
(28
g)
has
13g
of
un
satu
rate
d f
at
an
d o
nly
1g
of
satu
rate
d f
at.
© 2013 Almond Board of California. All rights reserved. CRUNCH ON
Scie
nti
fic e
vid
en
ce s
ug
gest
s, b
ut
do
es
no
t p
rove, th
at
eati
ng
1.5
ou
nces
per
day o
f m
ost
nu
ts,
such
as
alm
on
ds,
as
part
of
a d
iet
low
in
satu
rate
d f
at
an
d c
ho
lest
ero
l m
ay r
ed
uce t
he r
isk o
f h
eart
dis
ease
. A
on
e-o
un
ce h
an
dfu
l h
as
13g
of
un
satu
rate
d f
at
an
d o
nly
1g
of
satu
rate
d f
at.
HEARTHEALTHFOR THOSEWITH HEART
There’s a passion for life in the crunch of almonds. Get 6g of protein, 4g of fiber and essential nutrients in every heart-healthy handful to really bring it all day, every day.
Learn more at Almonds.com.
© 2013 Almond Board of California. All rights reserved.
Per one-ounce serving.
CRUNCH ON
Scie
nti
fi c e
vid
en
ce s
ug
gest
s, b
ut
do
es
no
t p
rove, th
at
eati
ng
1.5
ou
nces
per
day o
f m
ost
nu
ts,
such
as
alm
on
ds,
as
part
of
a d
iet
low
in
satu
rate
d f
at
an
d c
ho
lest
ero
l m
ay r
ed
uce t
he r
isk o
f h
eart
dis
ease
. A
on
e-o
un
ce h
an
dfu
l h
as
13g
of
un
satu
rate
d f
at
an
d o
nly
1g
of
satu
rate
d f
at.
There’s extended playtime in the crunch of almonds. Not to mention 6g of energy-giving protein, 4g of hunger-slaying fi ber and essential nutrients in every heart-healthy, one-ounce handful.
Learn more at Almonds.com.
© 2013 Almond Board of California. All rights reserved.
THE CRUNCHTHAT KEEPS YOU IN THE
GAMEThere’s extended playtime in the crunch of almonds. Not to mention 6g of energy-giving protein, 4g of hunger-slaying fi ber and essential nutrients in every
THE CRUNCHAT KEEPS
THE
GAME
ASIAIn Asia, there are centuries-old traditions with food and how food impacts health and vitality. From Chinese traditional medicine to Ayurvedic texts, there is a place for almonds. And it’s not all about serious health concerns; food is an integral part of socializing, celebrating, indulging, the beauty regime, and fun as well. An almond snack fits conveniently into this culture.
EUROPEIn Europe, consumers are looking for natural, convenient snacks, and almonds naturally fit the bill. Almonds are in their pantries, but they don’t often think of them as a snack. That’s why the emphasis in Europe is getting almonds out of the baking cupboards and into daily snacking scenarios.
China
Take your almonds along. Leave your hunger behind.Face your day armed with the extra confidence a well-placed stash of almonds brings.Exceptionally delicious and naturally nutritious, almonds are a source of protein and are rich in fibre, calcium and lots of other key nutrients you won’t want to leave home without. So they satisfy you best when you need it most.
Learn more about almonds, the on-the-go essential, at AlmondBoard.co.uk
© 2
013
Alm
on
d B
oard
of
Calif
orn
ia. A
ll ri
gh
ts r
ese
rved
.
Lorsque la faim vous appelle, répondez-y avec des amandes.Vous connaissez le petit creux de fin de matinée ou d’après-midi ? Pour garder votre tonus, rien de tel qu’une poignée d’amandes ! Riches en magnésium, vitamine E, calcium et fibres, elles sont aussi une source naturelle de protéines. Savoureuses et croquantes, n’oubliez pas vos amandes... Dès que vous en avez besoin, les amandes sont à vos côtés.
Découvrez tous les bienfaits des amandes sur Almonds.fr
© 2
014
Alm
on
d B
oard
of
Calif
orn
ia. T
ou
s d
roit
s ré
serv
és.
ALMFR143102D_BeigeHandbagAd_FemAct_9_14.indd 1 8/6/14 1:39 PM
© 2
014
Alm
on
d B
oard
of
Calif
orn
ia. A
ll ri
gh
ts r
ese
rved
.
Almonds. If you carry them, they’ll carry you.No matter where your day takes you, a handy helping of almonds is the perfect portablesnack that always takes you further. Exceptionally delicious and naturally nutritious,almonds are a source of protein and are rich in fibre, calcium and lots of other key nutrients you won’t want to leave home without. So they satisfy you best when you need it most.
Learn more about almonds, the on-the-go essential, at Almonds.co.uk
Découvrez tous les bienfaits des amandes sur Almonds.fr
Des amandes… Pour être au top et y rester !Destination lointaine ou court déplacement ?
Pour garder votre vitalité, croquez une poignée
d’amandes. Riches en magnésium, vitamine E,
calcium et fibres, elles sont aussi une source
naturelle de protéines. Saines et délicieuses…
Tout au long du trajet, vous pouvez compter
sur les amandes.
© 2
014
Alm
on
d B
oard
of
Calif
orn
ia. T
ou
s d
roit
s ré
serv
és.
DATE: 8.20.14 CLIENT: ALMFR Consumer TRIM SIZE: 225 x 285 APPROVAL INITIAL/DATE/TIME APPROVAL INITIAL/DATE/TIME
FILE NAME: ALMFR143102B Brown Handbag PREPARED BY: Dave LIVE SIZE: -10 mm all 1 ART DIRECTOR 4 PROD. MGR
PUB/ISSUE: Maxi 9/22 OS INTERNAL ROUND: Final BLEED SIZE: None 2 COPYWRITER 5 PROJ. MGR
FILE TYPE: INDD CC CLIENT ROUND: Final LASER SCALE: 100% 3 COPYEDITOR 6 ACCOUNT MGR
LOGO: CA Almonds.fr ® YEAR: 2014 UNIQUE IDENTIFYING COPY:
WEBSITE: Almonds.fr DISCLAIMER (DOUBLE-CHECKED AGAINST SPREADSHEET):
MESSAGE: Des amandes… Pour être au top et y rester !
NOTES:
United Kingdom
Découvrez tous les bienfaits des amandes sur AlmondBoard.fr
Des amandes… Pour être au top et y rester !Destination lointaine ou court déplacement ?
Pour garder votre vitalité, croquez une poignée
d’amandes. Riches en magnésium, vitamine E,
calcium et fibres, elles sont aussi une source
naturelle de protéines. Saines et délicieuses…
Tout au long du trajet, vous pouvez compter
sur les amandes.
© 2
013
Alm
on
d B
oard
of
Calif
orn
ia. T
ou
s d
roit
s ré
serv
és.
France
SNACK AND GOMIT MANDELN!
Why we love almonds_k1.indd 1 18.06.14 17:54
Als der perfekte Snack für unterwegs bieten
Mandeln mit jedem Biss natürlich Gutes und
als Quelle von Ballaststoffen enthalten sie 15
wichtige Nährstoffe, darunter Vitamin E. Ihr
unvergleichlicher Geschmack, ihre Vielseitigkeit
und die enthaltenen Nährstoffe sorgen dafür,
dass diese kleinen Kraftpakete für jede
Alltagssituation geeignet sind — z. B. als
morgendlicher Snack auf dem Weg zum Büro
oder als Energiespender für die Shoppingtour.
VITAMIN E: Eine Handvoll Mandeln
(30 g) deckt 65 % des täglichen
Bedarfs an Vitamin E, ein Antioxidans,
das die Zellen vor oxidativem Stress beschützt.
BALLASTSTOFFE:
Mandeln sind reich an Ballast-
stoffen, die den Hunger
zwischen den Mahlzeiten
stillen. Komm gut durch den
Tag mit Mandeln als
Snack ohne lästige
Heißhunger-
attacken.
WENIGER KALORIEN
ALS GEDACHT*
20%*Novotny JA, Gebauer SK, Baer DJ. Discrepancy between the Atwater factor predicted and empirically measured energy values of almonds in human diets. American Journal of Clinical Nutrition. Am J
Eine 30 g-Portion Mandeln hat 138 Kalorien anstelle der 173 Kalorien, die auf Verpackungen angegeben sind.
Nicht nur pur ein Genuss, sondern z. B. auch mit Chili
gewürzt oder Honig umhüllt, überzeugen sie jeden
Geschmackstypen. Warum also nicht mitmachen
und gesunde Tage voller Vitalität erleben? Einfach
die bisherigen Snacks gegen eine tägliche Handvoll
Mandeln austauschen und diese großartige Nuss
völlig neu erleben. Mehr Informationen und
Inspirationen gibt es auf Almonds.de
MACH MIT UND ERLEBE GESUNDE TAGE VOLLER VITALITÄT!
BALLASTSTOFFE:
Mandeln sind reich an Ballast-
stoffen, die den Hunger
zwischen den Mahlzeiten
stillen. Komm gut durch den
Tag mit Mandeln als
Snack ohne lästige
“Ein Kraftpaket an NÄHRSTOFFEN“
“Endlos snacken mit GANZ VIEL CRUNCH“
“Leckeres snacken ohne SCHLECHTS GEWISSEN“
“Perfekt für jede HANDTASCHE“
Why we love almonds_k1.indd 2 18.06.14 17:54
Germany
India
South Korea
Snapshot of Global Consumer Advertising
Snapshot of Global Social Media Activity
TelevisionPrint Billboard (out of home)Digital Social
GLOBAL MARKETING continued
Journal des Femme
Wallpaper skin 1260x
Logo flagship 90x30
Box partner 100x50

38 39
TRADE STEWARDSHIPTrade stewardship at Almond Board of California supports global market
development efforts in established and emerging markets around the globe. Targeting
food professionals in research and development, procurement, marketing, product
development and, of course, chefs. Trade stewardship programs educate these
target audiences about the many forms and benefits of almonds both in new product
development and new menu items.
The importance of getting noticed by these core groups of individuals is crucial.
Communication with these groups provides us the opportunity to share consumer
research, educate about technical information and share published reports about
almond nutrition. Activities such as; trade shows, seminars, advertising and outreach
through social media, public relations and face-to-face conversations are employed
to keep these stakeholders informed.
Participation in Strategic Seminars + Trade Shows
Attending strategic seminars and trade shows, such as the National Confectioners
Association (NCA) and An International Association of Confectioners (PMCA),
allows the Almond Board to interact with companies we specifically target. Trade
stewardship’s participation, whether hosting a session or engaging our guests
who visit our booth, is invaluable in understanding and solving company product
development needs and allows for the forging of new relationships.
Continued Growth in Global New Almond Product Introductions
Innova Market Insights is a research partner with Almond Board of California. In 2013/14, Innova published its annual new products report with a key measure for the level of new product development being conducted with almonds globally. In 2013, the report highlighted that product developers continued to innovate with this essential ingredient, as almonds were the number one nut in new product introductions for the eighth year in a row. Almond snack introductions continued to grow; the number of almond snack products increased by 52% in 2013 versus 2012.
Expanding Almond Usage in Global Chocolate
Trade stewardship champions the use of almonds in any type or form of chocolate
on a global basis. Research studies about global chocolate to understand consumer
chocolate and snacking occasions. During 2013/14, Trade Stewardship fielded a
second global chocolate study; this online study conducted among 5,400 consumers
in 10 markets informs the program.
■ Globally, chocolate is eaten about
11 times per month.
■ Globally, nearly two-thirds of respondents
(65%) prefer nuts in chocolate and believe
that nuts make chocolate products crunchier,
more nutritious and more filling.
■ Similar to the perceptions of nuts in chocolate,
most respondents believed that almonds in
particular make chocolate products crunchier,
more nutritious, more filling and more satisfying.
■ Globally, almonds continue to be the
number one ingredient included in
respondents’ ideal chocolate product.
■ Almonds are also the top ingredient included
across milk, dark and white chocolate.
■ Almonds are in the top five ingredients
selected across nine out of 10 countries
and are the number one ingredient selected
in India, Japan and South Korea.
Advertising, both print and online, is used
by Trade Stewardship to support our global
chocolate program. Our strategic publications showcase almonds as a key
ingredient. Another way trade stewardship supports global chocolate is through
the quarterly Chocolate Spotlight, which showcases new and interesting
chocolate-with-almonds products developed and introduced globally.
2005 2006 2007 2008 2009 2010 2011 2012 2013#1Almonds are the leading ingredient nut for 8 years running.
They’re also the most popular nut for new product introductions around the world and over multiple categories.1
New product introductions with almonds globally, 2013.1
+35%
A natural fit worldwide
The gap widens
between almonds
and other nuts1
12013 Innova Global New Products Report
LATIN AMERICATop nut in new confectionery, bakery, cereal and dessert products.1
ASIANew products with almonds increased 54% 2012-2013, second only to Europe.1
NORTH AMERICA#1 nut in new confectionery products, surpassing peanuts.1
EUROPE45% share of new product introductions.1
AFRICA & MIDDLE EAST43% of new almond introductions are in the confectionery category.1
2013 Innova Global New Products Report
National Confectioners Association logo
An International Association of Confectioners
Chocolate Spotlight
Europe North America Asia-Pacific Middle East & Africa Latin America Total % of Almond Intros by Category
Confectionery 36% 19% 24% 43% 32% 30%
Bakery 24% 10% 33% 11% 13% 22%
Cereals 6% 8% 6% 9% 11% 7%
Snacks 20% 47% 26% 26% 26% 27%
Desserts & Ice Cream
5% 3% 5% 6% 5% 5%
Others 9% 13% 6% 5% 13% 9%
Total Number of Introductions
3,425 2,016 1,470 493 489 7,893
2013 Almond Introductions within Each Region – Distribution by Category
Source: 2013 Innova Global New Products Report.
Source: Almond Board of California, Global Chocolate Study 2014.
Almonds continue to be the number one ingredient included
in respondents’ ideal chocolate product.
Highlighted cells show the largest category of almond introductions within each region.

40 41
CALIFORNIA ALMOND INDUSTRY RELATIONSNew Web sites: In August, ABC launched two new Web sites for California Almond growers and processors. The new Web sites offer a fresh look and improved functionality to provide a more user-friendly experience. Both sites feature new and improved databases, including an Industry Resource Map and Newsletter Database, which allow users to easily search and find information. To view the new Web sites, visit Almonds.com/Growers or Almonds.com/Processors.
New Collateral: To strive for continual improvement of the California Almond industry, ABC has added two new resources to aid growers and processors: a Stockpile Management Best Practices guide and Honey Bee Best Management Practices (BMPs) for California Almonds. The Stockpile Management guide was developed to promote awareness of best stockpiling practices to ensure safety and quality. The goal of the Honey Bee BMPs is to give the wide range of almond pollination stakeholders the best tools to ensure both pollinators safety and successful pollination.
Almond Leadership Program: In its sixth year, the Almond Leadership Program continues to offer young industry members an opportunity to come together, engage and become leaders for the future of the California Almond industry. The year-long program seeks to educate participants through connecting with industry professionals and through educational seminars focused on almond production, marketing and industry issues.
Ag in the Classroom: Agricultural awareness is more important than ever. As a result, ABC is dedicated to educating students throughout California about the lifecycle and end-use of almonds by participating in the Ag in the Classroom program. ABC readily provides resources, such as An Almond Story activity books and An Almond Story video, to grade-school teachers and industry members who partake in Ag in the Classroom.
The Almond Conference: With more than 2,500 attendees and greater representation from all growing regions, research updates and time to interact with industry experts are at the top of the list of priorities when planning this exciting event. The Almond Conference offers industry members a unique opportunity to visit the country’s only trade show dedicated to the business of almonds. Visit AlmondConference.com for more information.
New Collateral: Honey Bee Best Management Practices for California Almonds.
An Almond Story DVD.
New Collateral: Stockpile Management Practices Guide.
New Web sites: New and improved Industry Resource Map found on Almonds.com/Processors.
TECHNICAL ISSUES + INTERNATIONAL TRADEThe challenges of regulatory requirements and global trade continue to grow more complex. Ensuring unimpeded movement of almonds worldwide requires not only addressing but also finding solutions to a number of issues, including the following:
■ Trade barriers – tariffs and duties, labeling requirements and even an unexpected name change
■ Food safety – PPO acceptance and new food legislation
■ Crop protectants – reregistration, approval and harmonization of residue levels
A New Voice for the Almond Industry
Almond Board of California is a recognized resource for information on almond production and trade, providing factual, science-based information to regulatory and legislative contacts. But sometimes the implications of that information have to be delivered more directly and specifically. ABC and the Almond Hullers & Processors Association (AHPA) entered a Memorandum of Agreement (MOA) whereby Almond Board staff expertise can be leveraged by AHPA on specific areas of mutual concern, which provides the almond industry with an advocacy capability on key issues. AHPA has utilized ABC staff expertise on proposed rule comments to the FDA on new food safety regulations, to prepare talking points regarding the proposed Water Bond and to provide testimony for a Congressional hearing on bee health. The MOA will continue to be a vehicle for ensuring a unified voice for the almond industry on critical issues.
Harmonized science-based Maximum Residue Limits (MRLs) for crop protectants and pesticides are essential to the production and trade of almonds. ABC works closely with growers, handlers, registrants and international organizations to encourage adoption of consistent standards.
MRLs AROUND THE WORLD
96 MRLs
108 MRLs
170 MRLs
59 MRLs59 MRLs59 MRLs
45 MRLs
29 MRLs
China Canada Korea India U.A.E. Japan EU U.S.
4 5 22 22 22 18
39
MRLs consistent with the U.S.
MRLs not harmonized with the U.S.
The Almond Conference: With more than 200 exhibitors at The Almond Conference, the trade show offers everything from nurseries to harvest equipment, software to crop production inputs and everything in between.
Almond Leadership Program: 2014 Almond Leadership Program participants learning about the honey bee extraction process.

Almond Board of California 1150 Ninth Street, Suite 1500
Modesto, CA 95354 USA Almonds.com
Document #2014IR0170 © 2014 Almond Board of California
Printed in Modesto, California