alon usa partners, lp · alon usa partners, lp ... financial statements and supplementary data 44...
TRANSCRIPT

UNITED STATES SECURITIES AND EXCHANGE COMMISSIONWashington, D.C. 20549
FORM 10-K(Mark One)
þ ANNUAL REPORT PURSUANT TO SECTION 13 OR 15(d) OF THE SECURITIES EXCHANGE ACT OF 1934 FOR THE FISCAL YEAR ENDED DECEMBER 31, 2016
OR
o ANNUAL REPORT PURSUANT TO SECTION 13 OR 15(d) OF THE SECURITIES EXCHANGE ACT OF 1934 FOR THE TRANSITION PERIOD FROM __________TO __________
Commission file number: 001-35742
ALON USA PARTNERS, LP(Exact name of Registrant as specified in its charter)
Delaware(State of incorporation)
46-0810241(I.R.S. Employer Identification No.)
12700 Park Central Dr., Suite 1600, Dallas, Texas(Address of principal executive offices)
75251(Zip Code)
Registrant’s telephone number, including area code: (972) 367-3600Securities registered pursuant to Section 12 (b) of the Act:
Title of each class Name of each exchange on which registered
Common Limited Partner Units New York Stock ExchangeSecurities registered pursuant to Section 12 (g) of the Act: NoneIndicate by check mark if the registrant is a well-known seasoned issuer, as defined in Rule 405 of the Securities Act. Yes o No þIndicate by check mark if the registrant is not required to file reports pursuant to Section 13 or Section 15(d) of the Act. Yes o No þIndicate by check mark whether the registrant: (1) has filed all reports required to be filed by Section 13 or 15(d) of the Securities Exchange Act of 1934during the preceding 12 months (or for such shorter period that the registrant was required to file such reports), and (2) has been subject to such filingrequirements for the past 90 days. Yes þ No oIndicate by check mark whether the registrant has submitted electronically and posted on its corporate Web site, if any, every Interactive Data Filerequired to be submitted and posted pursuant to Rule 405 of Regulation S-T (§ 232.405 of this chapter) during the preceding 12 months (or for suchshorter period that the registrant was required to submit and post such files). Yes þ No oIndicate by check mark if disclosure of delinquent filers pursuant to Item 405 of Regulation S-K is not contained herein, and will not be contained, to thebest of registrant’s knowledge, in definitive proxy or information statements incorporated by reference in Part III of this Form 10-K or any amendmentto this Form 10-K. oIndicate by check mark whether the registrant is a large accelerated filer, an accelerated filer, a non-accelerated filer, or a smaller reporting company.See the definitions of “large accelerated filer,” “accelerated filer” and “smaller reporting company” in Rule 12b-2 of the Exchange Act. (Check one):
Large accelerated filer o Accelerated filer þ Non-accelerated filer o Smaller reporting company oIndicate by check whether the registrant is a shell company (as defined in Rule 12b-2 of the Exchange Act). Yes o No þThe aggregate market value for the registrant’s common units held by non-affiliates as of June 30, 2016, the last day of the registrant’s most recentlycompleted second fiscal quarter was $115,962,352 based on the closing price of Alon USA Partners, LP’s common units as reported on the New YorkStock Exchange of $10.09.The number of the Registrant’s common limited partner units outstanding as of February 21, 2017, was 62,520,220.

TABLE OF CONTENTS
PagePART I
ITEMS 1. AND 2. BUSINESS AND PROPERTIES 1ITEM 1A. RISK FACTORS 7ITEM 1B. UNRESOLVED STAFF COMMENTS 25ITEM 3. LEGAL PROCEEDINGS 25ITEM 4. MINE SAFETY DISCLOSURES 25
PART II ITEM 5. MARKET FOR REGISTRANT'S COMMON EQUITY, RELATED STOCKHOLDER MATTERS AND
ISSUER PURCHASES OF EQUITY SECURITIES 26ITEM 6. SELECTED FINANCIAL DATA 29ITEM 7. MANAGEMENT'S DISCUSSION AND ANALYSIS OF FINANCIAL CONDITION AND RESULTS
OF OPERATIONS 30ITEM 7A. QUANTITATIVE AND QUALITATIVE DISCLOSURES ABOUT MARKET RISK 43ITEM 8. FINANCIAL STATEMENTS AND SUPPLEMENTARY DATA 44ITEM 9. CHANGES IN AND DISAGREEMENTS WITH ACCOUNTANTS ON ACCOUNTING AND
FINANCIAL DISCLOSURE 44ITEM 9A. CONTROLS AND PROCEDURES 44ITEM 9B. OTHER INFORMATION 44
PART III ITEM 10. DIRECTORS, EXECUTIVE OFFICERS AND CORPORATE GOVERNANCE 45ITEM 11. EXECUTIVE COMPENSATION 50ITEM 12. SECURITY OWNERSHIP OF CERTAIN BENEFICIAL OWNERS AND MANAGEMENT AND
RELATED STOCKHOLDER MATTERS 57ITEM 13. CERTAIN RELATIONSHIPS AND RELATED TRANSACTIONS AND DIRECTOR
INDEPENDENCE 58ITEM 14. PRINCIPAL ACCOUNTANT FEES AND SERVICES 59
PART IV ITEM 15. EXHIBITS AND FINANCIAL STATEMENT SCHEDULES 60
i

GLOSSARY OF TERMS
The following are definitions of certain industry terms used in this Annual Report on Form 10-K:
“3-2-1 crack spread” The approximate refining margin resulting from processing three barrels of crude oil to produce two barrels ofgasoline and one barrel of distillate.
“Alkylation” A process that chemically combines isobutane with other hydrocarbons through the control of temperature and pressure in thepresence of an acid catalyst. This process produces alkylates, which have a high octane value and are blended into gasoline to improveoctane values.
“Backwardation” A market is in backwardation when at a point in time the forward price is lower than the current (spot) price.
“Barrel” A common unit of measurement in the oil industry, which equates to 42 gallons.
“Biodiesel” A renewable fuel produced from vegetable oils or animal fats that can be blended with petroleum-derived diesel to producebiodiesel blends for use in diesel engines. Pure biodiesel is referred to as B100, whereas blends of biodiesel are referenced by how muchbiodiesel is in the blend (e.g., a B5 blend contains five volume percent biodiesel and 95 volume percent ULSD).
“Blendstocks” The various compounds that are combined with gasoline or diesel from the crude oil refining process to make finishedgasoline and diesel; these may include natural gasoline, fluid catalytic cracking unit or FCCU gasoline, ethanol, reformate or butane,among others.
“Bpd” An abbreviation for barrels per calendar day, which is defined by the EIA as the amount of input that a distillation facility canprocess under usual operating conditions reduced for regular limitations that may delay, interrupt, or slow down production such asdowntime due to such conditions as mechanical problems, repairs, and slowdowns.
“Brent crude oil” A light sweet crude oil characterized by an API gravity of approximately 38 degrees, and a sulfur content ofapproximately 0.4 weight percent.
“Catalyst” A substance that alters, accelerates, or instigates chemical changes, but is neither produced, consumed nor altered in the process.
“Contango” A market is in contango when at a point in time the forward price is higher than the current (spot) price.
“Cracking” The process of breaking down larger hydrocarbon molecules into smaller molecules, using catalysts and/or elevatedtemperatures and pressures.
“Crack spread” A simplified calculation that measures the difference between the price for light products and crude oil.
“Delayed Coking Unit (Coker)” A refinery unit that processes (“cracks”) heavy oils, such as the bottom cuts of crude oil from the crude orvacuum units, to produce blendstocks for light transportation fuels or feedstocks for other units and petroleum coke.
“Distillates” Primarily diesel, kerosene and jet fuel.
“EPA” An abbreviation for the U.S. Environmental Protection Agency.
“Feedstocks” Hydrocarbons, such as crude oil, that are processed and blended into refined products.
“Fluid Catalytic Cracking” A process that breaks down larger, heavier, and more complex hydrocarbon molecules into simpler and lightermolecules (LPG, gasoline, light cycle oil, etc.) through the use of a catalytic agent and is used to increase the yield of gasoline. Fluidcatalytic cracking uses a catalyst in the form of very fine particles, which behave as a fluid when aerated with a vapor.
“Gulf Coast (WTI) 3-2-1 crack spread” The 3-2-1 crack spread calculated using the market value of Gulf Coast conventional gasoline andultra-low sulfur diesel against the market value of NYMEX Cushing WTI.
“Heavy Crude Oil” Crude oil with an API gravity of 24 degrees or less. Heavy crude oil is typically sold at a discount to lighter crude oil.
“Heavy Fuel Oils, Residual Products, Internally Produced Fuel and Other” Products other than gasoline, jet fuel and diesel fuelproduced in the refining process. These products include residual fuels, gas oils, propane, petroleum coke, asphalt and internally producedfuel.
ii
“Hydrocracking” A process that uses a catalyst to crack heavy hydrocarbon molecules in the presence of hydrogen. Major products fromhydrocracking are distillates, naphtha, propane and gasoline components such as butane.
“Hydrotreating” A process that removes sulfur from refined products in the presence of catalysts and substantial quantities of hydrogen toreduce sulfur dioxide emissions that result from the use of the products.
“Isomerization” A process that alters the fundamental arrangement of atoms in the molecule without adding or removing anything fromthe original material. The process is used to convert normal butane into isobutane and normal pentane into isopentane and hexane intoisohexane.
“Light Crude Oil” Crude oil with an API gravity greater than 24 degrees. Light crude oil is typically sold at a premium to heavy crude oil.
“Light/Medium/Heavy Crude Oil” Terms used to describe the relative densities of crude oil, normally represented by their API gravities.Light crude oils (those having relatively high API gravities) may be refined into a greater amount of valuable products and are typicallymore expensive than a heavier crude oil.
“Liquefied Petroleum Gas” or “LPG” Gas mainly composed of propane and butane, which has been liquefied at low temperatures andmoderate pressures. The gas is obtainable from refinery gases or after the cracking process of crude oil. At atmospheric pressure, it is easilyconverted into gas and can be used industrially or domestically.
“Merger Agreement” refers to the Agreement and Plan of Merger, referred to as the “merger agreement”, dated as of January 2, 2017, byand among Delek US Holdings, Inc. (“Delek”), Alon USA Energy, Inc. (“Alon Energy”), Delek Holdco, Inc., a wholly-owned subsidiary ofDelek (“HoldCo”), Dione Mergeco, Inc., a wholly-owned subsidiary of HoldCo (“Delek Merger Sub”) and Astro Mergeco, Inc., a wholly-owned subsidiary of HoldCo (“Alon Merger Sub”), under which Delek Merger Sub will merge with and into Delek (the “Delek Merger”),with Delek surviving as a wholly-owned subsidiary of HoldCo, a new holding company formed by Delek, and Astro Mergeco, Inc. willmerge with and into Alon Energy (the “Alon Merger”), with Alon Energy surviving. We refer to the Delek Merger and the Alon Mergertogether as the “Mergers.”
“Naphtha” A hydrocarbon fraction that is used as a gasoline blending component, a feedstock for reforming and as a petrochemicalfeedstock.
“Nelson complexity” A measure of secondary conversion capacity of a refinery relative to its primary distillation capacity. Generally, morecomplex refineries have a higher index number.
“NYMEX” The New York Mercantile Exchange. A commodities futures exchange.
“Refined products” Petroleum products, such as gasoline, diesel and jet fuel, which are produced by a refinery.
“Refining margin” A metric used in the refining industry to assess a refinery’s product margins by comparing the difference between theprice of refined products produced at the refinery and the price of crude oil required to produce those products.
“Reforming” A process that uses controlled heat and pressure with catalysts to rearrange certain hydrocarbon molecules into petrochemicalfeedstocks and higher octane stocks suitable for blending into finished gasoline.
“Renewable Fuels Standard 2 (RFS-2)” An EPA regulation promulgated pursuant to the Energy Independence and Security Act of 2007,which requires most refineries to blend increasing amounts of renewable fuels (including biodiesel and ethanol) with refined products.
“Renewable Identification Number (RINs)” A serial number assigned to a batch of biofuel for the purpose of tracking its production, use,and trading as required by the United States Environmental Protection Agency's Renewable Fuel Standard 2 (RFS-2).
“Sour crude oil” A crude oil that is relatively high in sulfur content, requiring additional processing to remove the sulfur. Sour crude oil istypically less expensive than sweet crude oil.
“Sweet crude oil” A crude oil that is relatively low in sulfur content, requiring less processing to remove the sulfur. Sweet crude oil istypically more expensive than sour crude oil.
“Throughput” The volume processed through a unit or a refinery.
“Turnaround” A periodically required standard procedure to refurbish and maintain a refinery that involves the shutdown and inspectionof major processing units and occurs every three to four years on industry average.
“Ultra-Low Sulfur Diesel” Diesel fuel produced with lower sulfur content to lower emissions, which is required for on-road use in the U.S.
iii

“Utilization” Average daily crude oil throughput divided by crude oil capacity, excluding planned periods of downtime for maintenanceand turnarounds.
“Vacuum Distillation” Distillation under reduced pressure, which lowers the boiling temperature of crude oil in order to distill crude oilcomponents that have high boiling points.
“WTI” West Texas Intermediate crude oil, a light, sweet crude oil, characterized by an API gravity between 39° and 41° and a sulfurcontent of approximately 0.3 weight percent that is used as a benchmark for other crudes.
“WTS” West Texas Sour crude oil, a sour crude oil, characterized by an API gravity between 30° and 33° and a sulfur content ofapproximately 1.28 weight percent that is used as a benchmark for other sour crudes.
“Yield” The percentage of refined products that is produced from crude oil and other feedstocks.
iv

Table of Contents
PART I
ITEMS 1. AND 2. BUSINESS AND PROPERTIES.
Statements in this Annual Report on Form 10-K, including those in Items 1 and 2, “Business and Properties,” and Item 3, “LegalProceedings,” that are not historical in nature should be deemed forward-looking statements that are inherently uncertain. See “Forward-Looking Statements” in “Management’s Discussion and Analysis of Financial Condition and Results of Operations” in Item 7 for adiscussion of forward-looking statements and of factors that could cause actual outcomes and results to differ materially from thoseprojected.
Company Overview
In this Annual Report, the words “Alon,” the “Partnership,” “we,” “our” and “us” or like terms refer to Alon USA Partners, LP and itsconsolidated subsidiaries or Alon USA Partners, LP or an individual subsidiary and not to any other person. References in this AnnualReport to our “General Partner” refer to Alon USA Partners GP, LLC, a Delaware limited liability company and the general partner of thePartnership. Unless the context otherwise requires, references in this Annual Report to “Alon Energy” refer to Alon USA Energy, Inc., ourparent company and the owner of our General Partner, and its consolidated subsidiaries other than us.
We are engaged principally in the business of operating a crude oil refinery in Big Spring, Texas, with a crude oil throughput capacityof 73,000 barrels per day. We refine crude oil into finished products, which are marketed primarily in Central and West Texas, Oklahoma,New Mexico and Arizona through our integrated wholesale distribution network to both Alon Energy’s retail convenience stores and otherthird-party distributors.
We are a limited partnership formed in August 2012 under Delaware law. Our principal executive offices are located at 12700 ParkCentral Drive, Suite 1600, Dallas, Texas 75251, and our telephone number is (972) 367-3600. Our website can be found atwww.alonpartners.com.
Our common units representing limited partner interests trade on the New York Stock Exchange under the trading symbol “ALDW.”
We are managed and operated by the board of directors and executive officers of our General Partner, an indirect, wholly-ownedsubsidiary of Alon Energy. Alon Energy also owns, directly or indirectly, 81.6% of our outstanding common units. Our General Partnermanages our operations and activities subject to the terms and conditions specified in our partnership agreement. The operations of ourGeneral Partner in its capacity as general partner are managed by its board of directors. As the owner of our General Partner, Alon Energyis responsible for appointing all of the members of the board of directors of our General Partner, including all of our General Partner’sindependent directors.
Alon Energy is an independent refiner and marketer of petroleum products, operating primarily in the South Central, Southwestern andWestern regions of the United States. In addition to owning 100% of our General Partner and 81.6% of our limited partner interests, AlonEnergy directly owns a crude oil refinery in Krotz Springs, Louisiana, with a crude oil throughput capacity of 74,000 bpd. Alon Energyalso owns crude oil refineries in California, which have not processed crude oil since 2012, as well as a majority interest in a renewablefuels facility with a throughput capacity of 3,000 bpd. Alon Energy is a leading marketer of asphalt, which it distributes primarily throughasphalt terminals located predominately in the Southwestern and Western United States. Alon Energy is the largest 7-Eleven licensee in theUnited States and operates approximately 300 convenience stores which also market motor fuels in Central and West Texas and NewMexico.
We file annual, quarterly and current reports, and file or furnish other information, with the Securities Exchange Commission (“SEC”).Our SEC filings are available to the public at the SEC’s website at www.sec.gov. In addition, we make our SEC filings available, free ofcharge, through our website at www.alonpartners.com as soon as reasonably practicable after we file with or furnish such material to theSEC. We will provide copies of our filings free of charge to our unitholders upon written request to Alon USA Partners, LP, Attention:Investor Relations, 12700 Park Central Drive, Suite 1600, Dallas, Texas 75251. We have also made the following documents available freeof charge through our website:
• Audit CommitteeCharter;
• Corporate Governance Guidelines;and
• Code of Business Conduct andEthics.
1

Table of Contents
Business
Our Big Spring refinery has a crude oil throughput capacity of 73,000 bpd and is located on 1,306 acres in the Permian Basin in WestTexas. Major processes at our refinery include fluid catalytic cracking, naphtha reforming, vacuum distillation, hydrotreating, aromaticextraction and alkylation.
Our refinery has a Nelson complexity of 10.5, which allows us the flexibility to process a variety of crudes into higher-value refinedproducts. The refinery has a sulfur processing capability of approximately two tons per thousand bpd of crude oil capacity, which providesthe capability to process significant volumes of high-sulfur, or sour, crude oil to produce a high percentage of light, high-value refinedproducts. Our refinery is also capable of processing significant volumes of light, sweet crude as market conditions dictate. All of the crudeoil processed at our refinery is West Texas crude oil priced in Midland, Texas (“Midland”), which has generally traded at a discount toCushing, Oklahoma (“Cushing”) prices.
Our Big Spring refinery produces ultra-low sulfur gasoline, ultra-low sulfur diesel, jet fuel, petrochemicals, liquefied petroleum gas,asphalt and other petroleum products. This refinery typically converts approximately 90% of its feedstock into high-value products such asgasoline, diesel, jet fuel and petrochemicals, with the remaining 10% primarily converted to asphalt and liquefied petroleum gas. In 2016,the Big Spring refinery achieved a liquid recovery of 100.0%.
Raw Material Supply
West Texas crudes have historically been transported to Cushing for sale. Over the last few years, strong growth in Permian Basin oilproduction and logistical constraints with moving oil to end markets had depressed prices for Midland crudes resulting in significantdiscounts to WTI Cushing. However, new pipeline takeaway capacity to the Texas Gulf Coast has been added to alleviate those constraints.The lower price of crude during 2015 and 2016 has reduced production growth in the Permian Basin, and existing takeaway capacity issufficient for current oil production. As a result, discounts in Midland crudes relative to WTI Cushing have contracted.
The Big Spring refinery is the closest refinery to Midland, Texas, which allows us to efficiently source WTS and WTI Midland crudes.Additionally, the refinery has the ability to source locally-trucked crudes, which enables us to better control quality and eliminate the costof transporting our crude supply from Midland. During 2016, our total refinery throughput was comprised of 43.4% WTS, 51.7% WTI and4.9% blendstocks.
Our Big Spring refinery receives WTS and WTI crudes by truck from local gathering systems and regional common carrier pipelines,such as the Mesa Interconnect, Centurion, Sunrise, Medallion and Navigator pipelines.
Other feedstocks, including butane, isobutane and asphalt blending components, are delivered by truck and railcar. A majority of thenatural gas we use to run the refinery is delivered by a pipeline in which we own a 63.0% interest.
Refinery Production
Transportation Fuels. We produce various grades of gasoline, which comply with the EPA’s current ultra-low sulfur gasoline standardof 30 ppm including boutique fuels supplied to the El Paso, Texas, and Phoenix, Arizona, markets. We produce both on-road and off-roaddiesel which complies with the EPA’s ultra-low sulfur diesel standard of 15 ppm. Our jet fuel production conforms to the JP-8 grademilitary specifications.
Asphalt. We have an asphalt supply agreement with a subsidiary of Alon Energy, under which Alon Energy purchases all of the asphaltproduced at our refinery at prices substantially determined by reference to the cost of crude and Rocky Mountain asphalt, which is intendedto approximate bulk wholesale market prices.
Petrochemicals. Liquefied Petroleum Gas and Other. We produce propane, propylene, certain aromatics, specialty solvents andbenzene for use as petrochemical feedstocks, along with other by-products such as sulfur and carbon black oil.
Transportation Fuel Marketing
We sell refined products from our refinery in both the wholesale rack and bulk markets. Our marketing of transportation fuelsproduced at our refinery is focused on Central and West Texas, Oklahoma, New Mexico and Arizona. We refer to our operations in theseregions as our “physically integrated system” because we primarily supply our customers in this region with motor fuels produced at ourrefinery and distributed through a network of pipelines and terminals that we own or access through leases or long-term throughputagreements.
2

Table of Contents
Branded Transportation Fuel Marketing. We sell motor fuels under the Alon brand through various terminals to supply 639 locations,including Alon Energy’s retail convenience stores. We provide substantially all of our branded customers motor fuels, brand support andpayment processing services in addition to the license of the Alon brand name and associated trade dress. In 2016, we sold 315.9 milliongallons of gasoline and 87.1 million gallons of diesel as branded fuels, which represented 58% of the gasoline and 25% of the dieselproduced at the refinery.
We have a fuel supply agreement with a subsidiary of Alon Energy, under which we supply substantially all of the motor fuelrequirements of Alon Energy’s retail convenience stores. In 2016, we sold 153.7 million gallons of gasoline and 26.3 million gallons ofdiesel to Alon Energy’s retail convenience stores, which represented 28% of the gasoline and 8% of the diesel produced at the refinery.
Unbranded Transportation Fuel Marketing . We sell motor fuels on an unbranded basis through terminals. Including purchases forresale, in 2016, we sold 139.9 million gallons of gasoline and 245.4 million gallons of diesel as unbranded fuels, which were largely soldthrough our physically integrated system. These unbranded fuel sales represented 26% of the gasoline and 72% of the diesel produced atthe refinery.
Jet Fuel Marketing. We market substantially all the jet fuel produced at our refinery as JP-8 grade to the Defense Energy SupplyCenter (“DESC”). All DESC contracts are for a one-year term and are awarded through a competitive bidding process. We havetraditionally bid for contracts to supply Dyess Air Force Base in Abilene, Texas, and Sheppard Air Force Base in Wichita Falls, Texas. Jetfuel production in excess of existing contracts is sold through unbranded terminal sales.
Product Supply Sales. We sell transportation fuel production in excess of our branded and unbranded marketing needs through bulksales and exchange channels. These bulk sales and exchange arrangements are entered into with various oil companies and tradingcompanies and are transported through a product pipeline network or truck deliveries. The petrochemical feedstocks and other petroleumproducts we produce are sold to a wide customer base and transported by truck and railcars.
Distribution Network and Distributor Arrangements . We sell motor fuel to Alon Energy’s retail locations and to 21 third-partydistributors, who then supply and sell to retail outlets. The supply agreements we maintain with our third-party distributors are generallyfor three-year terms and usually include 10-day payment terms and contain incentives and penalties based on the consistency of theirpurchases.
Refined Product Pipelines
The product pipelines we utilize to deliver refined products from our refinery are linked to the major third-party product pipelines inthe geographic area around the refinery. These pipelines provide us flexibility to optimize product flows into multiple regional markets.This product pipeline network can also (1) receive additional transportation fuel products from the Gulf Coast, (2) deliver products to theMagellan system, our connection to the Group III, or mid-continent markets, and (3) deliver products to the New Mexico and Arizonamarkets through third-party systems.
Product Terminals
We primarily utilize three product terminals in Big Spring, Abilene, and Wichita Falls, Texas to market transportation fuels producedat our refinery, as well as a terminal in Duncan, Oklahoma. All four of these terminals are physically integrated with our refinery throughthe product pipelines we utilize. The Big Spring, Abilene and Wichita Falls terminals are equipped with truck loading racks. The Duncan,Oklahoma terminal is used for delivering shipments into third-party pipeline systems. We also have direct access to three other terminalslocated in El Paso, Texas and Tucson and Phoenix, Arizona.
Supply and Offtake Agreement
J. Aron and Company (“J. Aron”), through arrangements with various oil companies, is one of the largest crude suppliers to ourrefinery.
We have entered into a Supply and Offtake Agreement and other associated agreements (together the “Supply and OfftakeAgreement”), with J. Aron. Pursuant to the Supply and Offtake Agreement, (i) J. Aron agreed to sell to us, and we agreed to buy from J.Aron, at market prices, crude oil for processing at our refinery and (ii) we agreed to sell, and J. Aron agreed to buy, at market prices,certain refined products produced at our refinery.
The Supply and Offtake Agreement also provided for the sale, at market prices, of our crude oil and certain refined product inventoriesto J. Aron, the lease to J. Aron of crude oil and refined product storage facilities, and the identification of prospective purchasers of refinedproducts on J. Aron’s behalf.
3

Table of Contents
For additional information on our Supply and Offtake Agreement, see Note 7 to the consolidated financial statements in Item 8,“Financial Statements and Supplementary Data,” of this Annual Report on Form 10-K.
Competition
The petroleum refining and marketing industry continues to be highly competitive. Our principal competitors include majorindependent refining and marketing companies such as Valero, Phillips 66, HollyFrontier and Tesoro. Our industry is also impacted bycompetition from integrated multi-national oil companies, including ExxonMobil, Chevron and Royal Dutch Shell. Because of theirdiversity, integration of operations and larger capitalization, these major competitors may have greater financial support and may have abetter ability to bear the economic risks, operating risks and volatile market conditions associated with the petroleum industry.
Profitability in the refining and marketing industry depends on the difference between refined product prices and the prices for crudeand other feedstocks, also referred to as refining margins. Refining margins are impacted by, among other things, levels of crude andrefined product inventories, balance of supply and demand, utilization rates of refineries and global economic and political events.
All of our crude oil and feedstocks are purchased from third-party sources, while some of our vertically integrated competitors havetheir own sources of crude oil that they may use to supply their refineries. However, our refinery is in close proximity to Midland, which isthe largest origination terminal for West Texas crude oil. We believe this provides us with transportation cost advantages.
The markets for our refined products are generally supplied by a number of competitors, including large integrated oil companies andindependent refiners. These larger companies typically have greater resources and may have greater flexibility in responding to volatilemarket conditions or absorbing market changes.
The principal competitive factors affecting our marketing businesses are price and quality of products, reliability and availability ofsupply and location of distribution points.
Government Regulation and Legislation
Environmental Controls and Expenditures
Our operations are subject to extensive and frequently changing federal, state, regional and local laws, regulations and ordinancesrelating to the protection of the environment, including those governing emissions or discharges to the air, water, and land, the handlingand disposal of solid and hazardous waste and the remediation of contamination. We believe our operations are generally in compliancewith these requirements. Over the next several years, our operations will have to meet new requirements recently promulgated by the EPAand the states and jurisdictions in which we operate, as well as requirements which may be promulgated in the future.
Fuels. The federal Clean Air Act and its implementing regulations require, among other things, significant reductions in the sulfurcontent in gasoline and diesel. These regulations required most refineries to reduce the sulfur content in gasoline to 30 ppm and diesel to 15ppm.
Gasoline and diesel produced at our refinery currently meet the low sulfur gasoline and diesel standards. In April 2014, the EPApromulgated new “Tier 3” motor vehicle emission and fuel standards. Under the final rule, gasoline must contain no more than 10 ppmsulfur on an annual average basis beginning on January 1, 2017; however, approved small volume refineries have until January 1, 2020 tomeet the standard. The EPA has approved the Big Spring refinery as a “small volume refinery” under the Tier 3 rule. We estimate that thecapital investment to upgrade the ultra-low sulfur gasoline unit at our refinery to meet these new required sulfur levels will be less thanapproximately $12 million.
The EPA has issued renewable fuel standards mandates requiring refiners to blend renewable fuels into the transportation fuels theyproduce and sell in the United States. To the extent refiners do not or cannot blend renewable fuels into the transportation fuels theyproduce in the quantities required to satisfy their obligations under the RFS-2 program, those refiners must purchase RINs to demonstratecompliance. Under the RFS-2 program, the volume of renewable fuels that obligated parties are required to blend into their transportationfuels increases annually over time until 2022. Our refinery first became subject to the RFS-2 program in 2013. We are able to blendrenewable fuel into some of the transportation fuels produced at our refinery, generating RINs for compliance. In 2016, we were able tomeet 79% of the refinery’s required renewable volume obligation using RINs separated from renewable fuel blending during the period.
On December 14, 2015, the EPA published a final rule in the Federal Register establishing the renewable fuel volume mandates for2014, 2015 and 2016, and the biomass-based diesel mandate for 2017. On December 12, 2016, the EPA
4

Table of Contents
published a final rule in the Federal Register establishing the renewable fuel volume mandates for 2017, and the biomass-based dieselmandate for 2018. The volumes included in the EPA’s final rules increase each year, but are lower, with the exception of the volumes forbiomass-based diesel, than the volumes required by the Clean Air Act. The EPA used its waiver authorities to lower the volumes, but itsdecision to do so in the December 14, 2015 rule has been challenged in the U.S. Court of Appeals for the District of Columbia Circuit. Inaddition, in the December 14, 2015 final rule, the EPA articulated a policy to incentivize additional investments in renewable fuel blendingand distribution infrastructure by increasing the price of RINs.
Air Emissions. Conditions may develop that require additional capital expenditures at the refinery and product terminals forcompliance with the Clean Air Act and other federal, state and local requirements, including recently promulgated regulations by the EPA.We cannot currently determine the amounts of such future expenditures.
The EPA has begun adopting and implementing regulations to restrict emissions of greenhouse gases (“GHG”) under existingprovisions of the Clean Air Act including rules that require a reduction in emissions of GHGs from motor vehicles and another rule thatestablished GHG emissions thresholds that determine when certain stationary sources must obtain construction or operating permits underthe Clean Air Act. Under these rules, facilities already subject to the Prevention of Significant Deterioration and Title V operatingpermitting process that increase their emissions of GHGs by 75,000 tons per year are required to limit GHG emissions through applicationof control technology, known as “Best Available Control Technology.”
In December 2010, the EPA reached a settlement agreement with numerous parties under which it agreed to promulgate New SourcePerformance Standards (“NSPS”) to regulate greenhouse gas emissions from petroleum refineries. In September 2014, the EPA indicatedthat the Petroleum Refinery Sector Risk and Technology Review, proposed in May 2014 to address air toxics and volatile organiccompounds from refineries, may make it unnecessary for EPA to regulate GHG emissions from petroleum refineries at this time. The finalrule, published in December 2015, places additional emission control requirements and work practice standards on FCCUs, storage tanks,flares, coking units and other equipment at petroleum refineries.
In October 2006, we were contacted by Region 6 of the EPA and invited to enter into discussions under the EPA’s National PetroleumRefinery Initiative. This initiative addresses what the EPA deems to be the most significant Clean Air Act compliance concerns affectingthe petroleum refining industry. According to the EPA, as of September 2016, approximately 95% of the nation’s refinery capacity is underlodged or entered “global” settlements. The Big Spring refinery is currently in negotiations with the EPA under the initiative. Based onprior settlements that the EPA has reached with other petroleum refineries under the initiative, we anticipate that we would be required topay a civil penalty, install air pollution controls and enhance certain operations in consideration for a broad release from liability. At thistime, we expect the costs of controls or civil penalties to be comparable to other settling refiners. The civil penalty will likely exceed$100,000 and other costs that may be required under the settlement for pollution controls or environmentally beneficial projects could besignificant.
In May 2013, the EPA issued a partial compliance evaluation to the Big Spring refinery related to an inspection of the refinery’scompliance with the Clean Air Act’s Risk Management Program conducted in March 2013 and requested that we enter into a settlementarrangement with the agency. Settlement discussions with the EPA are ongoing, and the costs of any such settlement or enforcement, iffinalized, are not expected to be material.
Remediation Efforts. We are currently remediating historical soil and groundwater contamination at our refinery. We spent$1.0 million in 2016 for remediation costs and we estimate an additional $0.8 million will be spent during 2017. We are also remediatinghistorical soil and groundwater contamination at the Abilene, Southlake and Wichita Falls, Texas, terminals that were in existence at thetime they were acquired. As a result of the completed remediation efforts, we have submitted a request to TCEQ requesting closure of thewells at the Southlake terminal.
In addition, we may be required by the federal Resource Conservation and Recovery Act or the Comprehensive EnvironmentalResources Compensation and Liability Act and the Texas Solid Waste Disposal Act to pay for remediation of hazardous substancecontamination on our property or on other property where wastes from our operations have been released into the environment, regardlessof fault or the legality of the original conduct, and to pay for damages to natural resources.
Environmental Indemnity to Sunoco. In connection with the sale of the Amdel and White Oil crude oil pipelines, we entered into aPurchase and Sale Agreement with Sunoco Pipeline, LP (“Sunoco”) pursuant to which we agreed to indemnify Sunoco against costs andliabilities incurred by Sunoco resulting from the existence of environmental conditions at the pipelines prior to March 1, 2006 or fromviolations of environmental laws with respect to the pipelines occurring prior to such date.
5

Table of Contents
Occupational Safety and Health Regulation. We are subject to the requirements of OSHA and comparable state statutes that regulatethe protection of the health and safety of workers. In addition, OSHA requires that we maintain information about hazardous materialsused or produced in our operations and that we provide this information to employees, state and local governmental authorities, and localresidents.
Other Government Regulation
The pipelines owned or operated by us and located in Texas are regulated by Department of Transportation rules and our intrastatepipelines are regulated by the Texas Railroad Commission. Within the Texas Railroad Commission, the Pipeline Safety Section of the GasServices Division administers and enforces the federal and state requirements on our intrastate pipelines. All of our pipelines within Texasare permitted and certified by the Texas Railroad Commission’s Gas Services Division.
The Petroleum Marketing Practices Act (“PMPA”) is a federal law that governs the relationship between a refiner and a distributor.Under PMPA, the refiner permits a distributor to use a trademark in connection with the sale or distribution of motor fuel. We may notterminate or fail to renew branded distributor contracts unless certain enumerated preconditions or grounds for termination or non-renewalare met and we also comply with the prescribed notice requirements.
Employees
Alon USA Partners, LP does not have any employees. We are managed and operated by the directors and officers of our GeneralPartner. All of our executive management personnel are employees of our General Partner, Alon Energy or an affiliate of Alon Energy anddevote the portion of their time to our business and affairs that is required to manage and conduct our operations. We have a servicesagreement with Alon Energy, under which we agree to reimburse Alon Energy for the provision of various general and administrativeservices for our benefit and for direct expenses incurred by Alon Energy on our behalf.
As of December 31, 2016, Alon Energy had approximately 2,830 employees, of which, approximately 210 are employed at our refineryand approximately 25 are employed in our wholesale marketing operations. Approximately 135 of the 210 employees at our refinery arecovered by a collective bargaining agreement that expires in April 2019.
Properties and Insurance
Our principal properties are described under the caption “Business” in Item 1. We believe that our properties and facilities aregenerally adequate for our operations and are maintained in a good state of repair in the ordinary course of business.
As of December 31, 2016, we were the lessee under a number of cancelable and non-cancelable leases for certain properties. Foradditional information on our leases, see Note 15 to the consolidated financial statements in Item 8, “Financial Statements andSupplementary Data,” of this Annual Report on Form 10-K.
We maintain property damage and business interruption insurance policies that cover the Big Spring refinery that have a combinedlimit of $950 million. Claims for physical damage at our refinery are subject to a $10 million deductible. The business interruptioninsurance policies that cover our refinery have a $550 million limit and are subject to a 45-day waiting period. We also maintain third-partyliability insurance policies that cover third-party claims with a $300 million limit, subject to a $5 million deductible.
6

Table of Contents
ITEM 1A. RISK FACTORS.
The occurrence of any of the events described in this Risk Factors section and elsewhere in this Annual Report on Form 10-K or inany other of our filings with the SEC could have a material adverse effect on our business, financial position, results of operations and cashflows. In evaluating an investment in any of our securities, you should consider carefully, among other things, the factors and the specificrisks set forth below. This Annual Report on Form 10-K contains forward-looking statements that involve risks and uncertainties. See“Forward-Looking Statements” in “Management’s Discussion and Analysis of Financial Condition and Results of Operations” in Item 7 fora discussion of the factors that could cause actual results to differ materially from those projected.
Risks Inherent in Our Business
Our General Partner is owned by Alon Energy, which recently entered into a definitive agreement pursuant to which HoldCo, anaffiliate of Delek US Holdings, Inc., would acquire Alon Energy. The consummation of the Mergers could materially impact ourstrategic direction, business and results of operations.
Alon Energy entered into a definitive agreement with Delek US Holdings, Inc. (“Delek”) and HoldCo, which provide for a series oftransactions whereby HoldCo will acquire Alon Energy. The closing of the Mergers is subject to various conditions precedent. As a result,there is a risk that the acquisition may not be completed. In addition, prior to closing, various restrictions are imposed in the definitiveagreements, which could restrict certain of our activities prior to the closing of the Mergers.
After the Mergers, HoldCo will own the general partner of Delek Logistics Partners, LP, and the directors and officers of our GeneralPartner and its affiliates will have duties to manage our General Partner in a manner that is beneficial to HoldCo who would be the ownerof our General Partner. At the same time, our General Partner will have duties to manage us in a manner that is beneficial to ourunitholders. Therefore, following the completion of the Mergers, our General Partner’s duties to us may conflict with the duties of itsofficers and directors to HoldCo in the future. As a result of these conflicts of interest following the Mergers, our General Partner mayfavor its own interest or the interests of HoldCo or Delek Logistics Partners, LP, or their owners or affiliates over the interest of ourunitholders.
In addition, management of Delek have made public statements regarding a desire to simplify the post-merger structure of HoldCo andhave called into question the long-term viability of our structure as a variable MLP. As a result, the consummation of the Mergers couldmaterially impact the strategic direction of the Partnership as well as its business and results of operations.
Additional conflicts may also arise in the future following the Mergers associated with (1) the allocation of capital and the allocation ofcosts among Delek Logistics Partners, LP and us, (2) the amount of time devoted by the officers and directors of HoldCo to the business ofDelek Logistics Partners, LP in relation to us and (3) the future business opportunities, if any, that are pursued in Delek Logistics Partners,LP and us.
The price volatility of crude oil and other feedstocks and refined products may have a material adverse effect on our earnings,profitability and cash flows, and our ability to make distributions to unitholders.
Our earnings, profitability, cash flows from operations and our ability to make distributions to unitholders depend primarily on themargin between refined product prices and the prices for crude oil and other feedstocks. When the margin between refined product pricesand crude oil and other feedstock prices contracts, as has been the case in recent periods and may be the case in the future, our results ofoperations and cash flows are negatively affected. Refining margins historically have been volatile, and are likely to continue to be volatileas a result of a variety of factors including fluctuations in the prices of crude oil, other feedstocks and refined products. The direction andtiming of changes in prices for crude oil and refined products do not necessarily correlate with one another, and it is the relationshipbetween such prices that has the greatest impact on our results of operations and cash flows.
Prices of crude oil and other feedstocks, and the relationships between such prices and prices for refined products, depend on numerousfactors beyond our control, including the supply of and demand for crude oil, other feedstocks, gasoline, diesel, asphalt and other refinedproducts and the relative magnitude and timing of such changes. Supply and demand are affected by, among other things:
• changes in general economicconditions;
• changes in the underlying demand for ourproducts;
• the availability, costs and price volatility of crude oil, other refinery feedstocks and refinedproducts;
7

Table of Contents
• worldwide political conditions, particularly in significant oil producing regions such as the Middle East, West Africa and LatinAmerica;
• the level of foreign and domestic production of crude oil and refined products and the volume of crude oil, feedstock and refinedproducts imported in the United States;
• refinery utilizationrates;
• infrastructurelimitations;
• the ability of the Organization of Petroleum Exporting Countries (“OPEC”) to affect oil prices and maintain productioncontrols;
• the actions of customers andcompetitors;
• disruptions due to equipment interruption, pipeline disruptions or failure at our or third-party facilities and other factors affectingtransportation infrastructure;
• the effects of transactions involving forward contracts and derivative instruments and general commoditiesspeculation;
• the execution of planned capital projects, including the build out of additional pipelineinfrastructure;
• the effects and costs of compliance with current and future federal, state and local environmental, economic, safety and other laws,policies and regulations;
• operating hazards, natural disasters, casualty losses and other matters beyond ourcontrol;
• the impact of global economic conditions on our business;and
• the development and marketing of alternative and competingfuels.
Although we continually analyze our operating margins and seek to adjust throughput volumes and product slates to optimize ouroperating results based on market conditions, there are inherent limitations on our ability to offset the effects of adverse market conditions.For example, reductions in throughput volumes in a negative operating margin environment may reduce operating losses, but it would noteliminate them because we would still be incurring fixed costs and certain levels of variable costs.
The price volatility of crude oil and refined products will affect the market value of our inventories, which could have a materialadverse effect on our earnings, profitability and cash flows and our ability to service our indebtedness and make distributions tounitholders.
The nature of our business has historically required us to maintain substantial quantities of crude oil and refined product inventories.Because crude oil and refined products are commodities, we have no control over the changing market value of these inventories. Ourinventory is valued at the lower of cost or market value under the last-in, first-out (“LIFO”) inventory valuation methodology. As a result, ifthe market value of our inventory were to decline to an amount less than our LIFO cost, we would record a write-down of inventory and anon-cash charge to cost of sales. Our investment in inventory is affected by the general level of crude oil prices, and significant increases incrude oil prices could result in substantial working capital requirements to maintain inventory volumes. Changes in the value of ourinventory or increases in the amount of our working capital necessary to maintain our inventory volumes could have a material adverseeffect on our earnings, profitability and cash flows.
The price volatility of fuel and utility services may have a material adverse effect on our earnings, profitability and cash flows, and ourability to service our indebtedness and make distributions to unitholders.
The volatility in costs of natural gas, electricity and other utility services used by our refinery and other operations affect our operatingcosts. Utility prices have been, and will continue to be, affected by factors outside our control, such as supply and demand for utilityservices in both local and regional markets. Future increases in utility prices that result in increased operating costs may have a negativeeffect on our earnings, profitability and cash flows.
8

Table of Contents
Changes in the Brent–WTI Cushing, WTI Cushing–WTS or WTI Cushing–WTI Midland differentials could adversely affect the crudeoil cost advantage that has been in our favor, which could negatively affect our profitability.
Our profit margins depend primarily on the spread between the price of crude oil and the price of our refined products. Our ability topurchase and process less expensive crudes, such as WTS and WTI, which currently trade at discounts to imported waterborne crudes, suchas Brent, has provided us with a significant cost advantage relative to many of our competitors.
Because our refinery is able to process substantial volumes of WTS, our overall feedstock costs are generally lower than those ofrefineries that lack this capability and therefore must utilize a greater percentage of sweeter crudes, such as WTI. Any narrowing of theWTI Cushing–WTS differential in the future would also result in a reduction of our crude oil source cost advantage.
Future adverse changes in the Brent–WTI Cushing, WTI Cushing–WTS or WTI Cushing–WTI Midland differentials could adverselyimpact our earnings and profitability.
Midland crude discounts, compared to WTI-Cushing, could contract, which would adversely affect our profitability.
Over the last three years, pipeline capacity additions and expansions have significantly increased takeaway capacity from the PermianBasin. Meanwhile, the lower crude price environment in 2015 and 2016 has slowed production growth in the region. For these reasons,takeaway capacity from the Permian Basin is adequate for current oil production. As such, we may not be able to purchase WTS and WTIat discounted prices to Cushing as we have historically and any discount to Cushing may decrease, which could adversely impact ourearnings and profitability.
Commodity derivative contracts may limit our potential gains, exacerbate potential losses, result in period-to-period earnings volatilityand involve other risks.
We may enter into commodity derivatives contracts intended to mitigate our crack spread risk. We enter into these arrangements withthe intent to secure a minimum fixed cash flow stream on the volume of products hedged during the hedge term. However, our hedgingarrangements may fail to fully achieve these objectives for a variety of reasons, including our failure to have adequate hedging contracts, ifany, in effect at any particular time and the failure of our hedging arrangements to produce the anticipated results. We may not be able toprocure adequate hedging arrangements due to a variety of factors. Moreover, while intended to reduce the adverse effects of fluctuationsin crude oil and refined product prices, such transactions may limit our ability to benefit from favorable changes in margins. In addition,our hedging activities may expose us to the risk of financial loss in certain circumstances, including instances in which:
• the volumes of our actual use of crude oil or production of the applicable refined products is less than the volumes subject to thehedging arrangement;
• accidents, interruptions in feedstock transportation, inclement weather or other events cause unscheduled shutdowns or otherwiseadversely affect our refinery, or those of our suppliers or customers;
• the counterparties to our futures contracts fail to perform under the contracts;or
• a sudden, unexpected event materially impacts the commodity or crack spread subject to the hedgingarrangement.
As a result, the effectiveness of our risk mitigation strategy could have a material adverse impact on our financial results. See“Management’s Discussion and Analysis of Financial Condition and Results of Operations-Quantitative and Qualitative Disclosures AboutMarket Risk.”
Our operating results are seasonal and generally lower in the first and fourth quarters of the year.
Demand for gasoline products is generally higher during summer months than during winter months due to seasonal increases inhighway traffic. As a result, our operating results for the first and fourth calendar quarters are generally lower than those for the second andthird calendar quarters. The effects of seasonal demand for gasoline are partially offset by seasonality in demand for diesel, which in ourregion is generally higher in winter months as east-west trucking traffic moves south to avoid winter conditions on northern routes.
Competition in the refining and marketing industry is intense, and an increase in competition in the markets in which we sell ourproducts could adversely affect our earnings and profitability.
We compete with a broad range of companies in our refining and marketing operations. Many of these competitors are integrated,multinational oil companies that are substantially larger than we are. Because of their diversity, integration of operations, largercapitalization, larger and more complex refineries and greater resources, these companies may be better
9

Table of Contents
able to withstand disruptions in operations and volatile market conditions, to offer more competitive pricing during times of intense pricefluctuations and to obtain crude oil in times of shortage.
We are not engaged in the business of exploration and production of oil and therefore do not produce any of our crude oil or otherfeedstocks. Certain of our competitors, however, obtain a portion of their feedstocks from company-owned production. Competitors thathave their own crude production are at times able to offset losses from refining operations with profits from oil producing operations andmay be better positioned to withstand periods of depressed refining margins or feedstock shortages. In addition, we compete with otherindustries, such as wind, solar and hydropower that provide alternative means to satisfy the energy and fuel requirements of our industrial,commercial and individual customers. If we are unable to compete effectively with these competitors, both within and outside our industry,there could be a material adverse effect on our business, financial condition, results of operations and cash flows.
The wholesale motor fuel distribution industry is characterized by intense competition and fragmentation, and our failure to effectivelycompete could adversely affect our business and results of operations.
The market for distribution of wholesale motor fuel is highly competitive and fragmented. We have numerous competitors, some ofwhich have significantly greater resources and name recognition than us. We rely on our ability to provide reliable supply and value-addedservices and to control our operating costs in order to maintain our margins and competitive position. If we were to fail to maintain thequality of our services, customers could choose alternative distribution sources, and our competitive position could be adversely affected.Furthermore, we compete against major oil companies with integrated marketing businesses. Through their greater resources and access tocrude oil, these companies may be better able to compete on the basis of price or offer lower wholesale and retail pricing which couldnegatively affect our fuel margins. The occurrence of any of these events could have a material adverse effect on our business and resultsof operations.
We may not have sufficient available cash to pay any quarterly distribution on our common units.
We may not have sufficient available cash each quarter to enable us to pay any distribution to our unitholders. The amount we will beable to distribute on our common units principally depends on the amount of cash we generate from our operations, which is primarilydependent upon operating margins. Our operating margins, and thus, the cash we generate from operations have been volatile, and weexpect that they will fluctuate from quarter to quarter based on, among other things:
• the cost of refining feedstocks, such as crude oil, that are processed and blended into refinedproducts;
• the prices at which we are able to sell refinedproducts;
• the level of our direct operating expenses, including expenses such as maintenance and energycosts;
• seasonality and weatherconditions;
• overall economic and local market conditions;and
• non-payment or other non-performance by our customers andsuppliers.
The actual amount of cash we will have available for distribution will depend on other factors, some of which are beyond our control,including:
• our operatingmargins;
• the level of capital expenditures wemake;
• our debt servicerequirements;
• the amount of any accrued but unpaidexpenses;
• the amount of any reimbursement of expenses incurred by our General Partner and itsaffiliates;
• fluctuations in our working capitalneeds;
• our ability to borrow funds and access capitalmarkets;
• planned and unplanned maintenance at our facility that, based on determinations by the board of directors of our General Partnerto maintain reserves, may negatively impact our cash flows in the quarter in which such maintenance occurs;
• restrictions on distributions and on our ability to make working capitalborrowings;
10

Table of Contents
• the amount of cash reserves established by our General Partner, including for turnarounds, catalyst replacement and relatedexpenses; and
• Our partnership agreement does not require us to pay a minimum quarterly distribution. The amount of distributions that we pay, ifany, and the decision to pay any distribution at all, is determined by the board of directors of our General Partner. Our quarterlydistributions, if any, are subject to significant fluctuations based on the above factors.
The amount of our quarterly cash distributions, if any, will vary significantly both quarterly and annually and will be directly dependenton the performance of our business. Unlike most publicly traded partnerships, we will not have a minimum quarterly distribution oremploy structures intended to consistently maintain or increase distributions over time.
Investors who are looking for an investment that will pay regular and predictable quarterly distributions should not invest in ourcommon units. We expect our business performance will be more volatile, and our cash flows will be less stable, than the businessperformance and cash flows of most publicly traded partnerships. As a result, our quarterly cash distributions will be volatile and areexpected to vary quarterly and annually. Unlike traditional master limited partnerships, we will not have a minimum quarterly distributionor employ structures intended to consistently maintain or increase distributions over time. The amount of our quarterly cash distributionswill be directly dependent on the performance of our business, which has been historically volatile and seasonal, and which we expect willcontinue to be volatile and seasonal. Because our quarterly distributions will significantly correlate to the cash we generate each quarterafter payment of our fixed and variable expenses, future quarterly distributions paid to our unitholders will vary significantly from quarterto quarter and may be zero.
The board of directors of our General Partner may modify or revoke our cash distribution policy at any time at its discretion. Ourpartnership agreement does not require us to make any distributions at all.
The board of directors of our General Partner has adopted a cash distribution policy pursuant to which we distribute all of the availablecash we generate each quarter, as defined in the partnership agreement, to unitholders of record on a pro rata basis. However, the boardmay change such policy at any time at its discretion and could elect not to make distributions for one or more quarters. Our partnershipagreement does not require us to make any distributions at all. Accordingly, investors are cautioned not to place undue reliance on thepermanence of such a policy in making an investment decision. Any modification or revocation of our cash distribution policy couldsubstantially reduce or eliminate the amounts of distributions to our unitholders.
Our indebtedness could adversely affect our financial condition or make us more vulnerable to adverse economic conditions.
Our level of indebtedness could have significant effects on our business, financial condition and results of operations and cash flowsand, consequently, important consequences to your investment in our securities, such as:
• we may be limited in our ability to obtain additional financing to fund our working capital needs, capital expenditures and debtservice requirements or our other operational needs;
• we may be limited in our ability to use operating cash flows in other areas of our business because we must dedicate a portion ofthese funds to make principal and interest payments on our debt;
• we may be at a competitive disadvantage compared to competitors with less leverage since we may be less capable of respondingto adverse economic and industry conditions; and
• we may not have sufficient flexibility to react to adverse changes in the economy, our business or the industries in which weoperate.
Our ability to service our indebtedness will depend on our ability to generate cash in the future.
Our ability to make payments on our indebtedness will depend on our ability to generate cash in the future. Our ability to generate cashis subject to general economic and market conditions and financial, competitive, legislative, regulatory and other factors that are beyond ourcontrol. We cannot assure you that our business will generate sufficient cash to fund our working capital requirements, capitalexpenditures, debt service and other liquidity needs, which could result in our inability to comply with financial and other covenantscontained in our debt agreements, our being unable to repay or pay interest on our indebtedness and our inability to fund our other liquidityneeds. If we are unable to service our debt obligations, fund our other liquidity needs and maintain compliance with our financial and othercovenants, we could be forced to curtail our operations, our creditors could accelerate our indebtedness and exercise other remedies and wecould be required to pursue
11

Table of Contents
one or more alternative strategies, such as selling assets or refinancing or restructuring our indebtedness. However, we cannot assure youthat any such alternatives would be feasible or prove adequate.
Changes in our credit profile could affect our relationships with our suppliers, which could have a material adverse effect on ourliquidity and our ability to operate our refinery at full capacity.
Changes in our credit profile could affect the way crude oil and other suppliers view our ability to make payments and induce them toshorten the payment terms for our purchases or require us to post security prior to payment. Due to the large dollar amounts and volume ofour crude oil and other feedstock purchases, any imposition by our suppliers of more burdensome payment terms on us may have a materialadverse effect on our liquidity and our ability to make payments to our suppliers. This, in turn, could cause us to be unable to operate ourrefinery at full capacity. A failure to operate our refinery at full capacity could adversely affect our profitability and cash flows.Alternatively, these more burdensome payment terms may require us to incur additional indebtedness under our revolving credit facility,which could increase our interest expense and adversely affect our cash flows.
Covenants in the credit agreements governing our indebtedness could limit our ability to undertake certain types of transactions andadversely affect our liquidity.
The credit agreements governing our indebtedness may contain negative and financial covenants and events of default that may limitour financial flexibility and ability to undertake certain types of transactions. For example, we may be subject to negative covenants thatrestrict our activities, including restrictions on creating liens, engaging in mergers, consolidations and sales of assets, incurring additionalindebtedness, entering into certain lease obligations, making certain capital expenditures, and making certain distributions, debt and otherrestricted payments, including distributions to our unitholders. Should we desire to undertake a transaction that is prohibited or limited bythe credit agreements governing our indebtedness, we may need to obtain the consent of our lenders or refinance our credit facilities. Suchconsents or refinancings may not be possible or may not be available on commercially acceptable terms, or at all.
A recession and credit crisis and related turmoil in the global financial system could have an adverse impact on our business, results ofoperations and cash flows.
Our business and profitability are affected by the overall level of demand for our products, which in turn is affected by factors such asoverall levels of economic activity and business and consumer confidence and spending. Declines in global economic activity andconsumer and business confidence and spending have in the past, and may in the future, significantly reduce the level of demand for ourproducts, including by consumers and our wholesale customers. In the past, severe reductions in the availability and increases in the cost ofcredit have adversely affected our ability to fund our operations and operate our refinery at full capacity and have adversely affected ouroperating margins. Together, these factors have had and may in the future have an adverse impact on our business, financial condition,results of operations and cash flows.
We may have capital needs for which our internally generated cash flows and other sources of liquidity may not be adequate.
If we cannot generate sufficient cash flows or otherwise secure sufficient liquidity to support our short-term and long-term capitalrequirements, we may not be able to meet our payment obligations, comply with certain deadlines related to environmental laws,regulations and standards or pursue our business strategies, any of which could have a material adverse effect on our results of operations orliquidity. We have substantial short-term working capital needs and may have substantial long-term capital needs. Our short-term workingcapital needs are primarily related to financing our inventory and accounts receivable. Our long-term needs for cash include those to supportongoing capital expenditures for equipment maintenance and upgrades during turnarounds at our refinery and for costs of catalystreplacement and to complete our routine and normally scheduled maintenance, regulatory and security expenditures. We expect to performour next major turnaround in 2019. In addition, from time to time, we are required to spend significant amounts for repairs when one ormore processing units experience temporary shutdowns. We continue to utilize significant capital to upgrade equipment, improve facilities,and reduce operational, safety and environmental risks. We may incur substantial compliance costs in connection with any new or amendedenvironmental, health and safety laws and regulations.
In addition, the board of directors of our General Partner has adopted a distribution policy pursuant to which we will distribute all ofthe available cash we generate each quarter, as defined in the partnership agreement, to unitholders. As a result, we will need to rely onexternal financing sources, including commercial bank borrowings and the issuance of debt and equity securities, to fund our growth. Theboard of directors of our General Partner may change our cash distribution policy at any time at its discretion. Our partnership agreementdoes not require us to pay distributions to our unitholders on a quarterly or other basis. Our liquidity will affect our ability to satisfy any ofthese needs.
12

Table of Contents
The costs, scope, timelines and benefits of our refining projects may deviate significantly from our original plans and estimates.
We may experience unanticipated increases in the cost, scope and completion time for our improvement, maintenance and repairprojects at our refinery. Refinery projects are generally initiated to increase the yields of higher-value products, increase our ability toprocess a variety of crude oils, increase production capacity, meet new regulatory requirements or maintain the safe and reliable operationsof our existing assets. Equipment that we require to complete these projects may be unavailable to us at expected costs or within expectedtime periods. Additionally, employee or contractor labor expense may exceed our expectations. Due to these or other factors beyond ourcontrol, we may be unable to complete these projects within anticipated cost parameters and timelines. In addition, the benefits we realizefrom completed projects may take longer to achieve and/or be less than we anticipated. Our inability to complete and/or realize the benefitsof refinery projects in a cost-efficient and timely manner could have a material adverse effect on our business, financial condition andresults of operations.
Our relationship with Alon Energy and its financial condition subjects us to potential risks that are beyond our control.
Due to our relationship with Alon Energy, adverse developments or announcements concerning Alon Energy could materiallyadversely affect our financial condition, even if we have not suffered any similar development. As a result, downgrades of the credit ratingsof Alon Energy could increase our cost of capital and collateral requirements and could impede our access to the capital markets.
The credit and business risk profiles of Alon Energy may be factors considered in credit evaluations of us. This is because we rely onAlon Energy for various services, including management services. Another factor that may be considered is the financial condition of AlonEnergy, including the degree of its financial leverage and its dependence on cash flows from us to service its indebtedness. The credit andrisk profile of Alon Energy could adversely affect our credit ratings and risk profile, which could increase our borrowing costs or hinderour ability to raise capital. Our credit rating may be adversely affected by the leverage of Alon Energy, as credit rating agencies mayconsider the leverage and credit profile of Alon Energy and its affiliates because of their ownership interest in and joint control of us andthe strong operational links between Alon Energy’s business and us. Any adverse effect on our credit rating would increase our cost ofborrowing or hinder our ability to raise financing in the capital markets, which could impair our ability to grow our business, service ourindebtedness and make distributions to unitholders.
We are parties to a fuel supply agreement with Alon Energy under which we will supply substantially all of the motor fuelrequirements of Alon Energy’s retail convenience stores through 2032. We are also parties to an asphalt supply agreement with AlonEnergy through 2032. We currently sell approximately 20% of our motor fuels production and 100% of our asphalt production from therefinery to Alon Energy. Because a significant percentage of our sales are to Alon Energy, adverse developments concerning AlonEnergy’s financial condition could adversely impact our net sales. This would in turn have an adverse effect on our results of operations andcash flows, and as a result, our ability to service our indebtedness and make distributions to unitholders.
Our arrangement with J. Aron exposes us to J. Aron related credit and performance risk.
We have a supply and offtake agreement with J. Aron, who is one of our largest suppliers of crude oil and one of our largest customersof refined products. In the future, we could purchase up to 100% of our refinery supply needs from J. Aron pursuant to this agreement.Additionally, we are obligated to repurchase all consigned inventories and certain other inventories upon termination or expiration of thisagreement, which may be terminated by J. Aron as early as May 2018. Relying on J. Aron’s ability to honor its fuel requirements purchaseobligations exposes us to J. Aron’s credit and business risks. An adverse change in J. Aron’s business, results of operations, liquidity orfinancial condition could adversely affect its ability to perform its obligations, which could consequently have a material adverse effect onour business, results of operations or liquidity and, as a result, our ability to make distributions. In addition, we may be required to usesubstantial capital to repurchase inventories from J. Aron upon termination or expiration of this agreement, which could have a materialadverse effect on our financial condition.
We may incur significant costs to comply with new or changing environmental laws and regulations.
Our operations are subject to extensive regulatory controls on air emissions, water discharges, waste management and the clean-up ofcontamination that can require costly compliance measures. If we fail to comply with environmental requirements, we may be subject toadministrative, civil and criminal proceedings by state and federal authorities, as well as civil proceedings by non-governmentalenvironmental groups and other individuals, which could result in substantial fines and penalties against us as well as governmental orcourt orders that could alter, limit or suspend our operations.
13

Table of Contents
In October 2006, we were contacted by Region 6 of the EPA and invited to enter into discussions under the EPA’s National PetroleumRefinery Initiative. This initiative addresses what the EPA deems to be the most significant Clean Air Act compliance concerns affectingthe petroleum refining industry. According to the EPA, as of September 2016, approximately 95% of the nation’s refinery capacity is underlodged or entered “global” settlements. The Big Spring refinery is currently in negotiations with the EPA under the initiative. Based onprior settlements that the EPA has reached with other petroleum refineries under the initiative, we anticipate that we would be required topay a civil penalty, install air pollution controls and enhance certain operations in consideration for a broad release from liability. At thistime, we expect the costs of controls or civil penalties to be comparable to other settling refineries. The civil penalty will likely exceed$100,000 and other costs that may be required under the settlement for pollution controls or environmentally beneficial projects could besignificant and collectively could have a material adverse effect on our business, financial condition, results of operations and cash flows.
In addition, new laws and regulations, new interpretations of existing laws and regulations, increased governmental enforcement orother developments could require us to make additional unforeseen expenditures. Many of these laws and regulations are becomingincreasingly stringent, and the cost of compliance with these requirements can be expected to increase over time. For example, in April2014, the EPA promulgated final new “Tier 3” motor vehicle emission and fuel standards. Under the final rule, gasoline must contain nomore than 10 ppm sulfur on an annual average basis beginning as early as January 1, 2017; however, approved small volume refinerieshave until January 1, 2020 to meet the standard. The EPA has approved our Big Spring refinery as a “small volume refinery” under the Tier3 rule. We estimate that the capital investment associated with the upgrade necessary to meet these new required sulfur levels will be lessthan approximately $12 million. Also, the Petroleum Refinery Sector Risk and Technology Review, which was published in the FederalRegister on December 1, 2015, places additional emission control requirements and work practice standards on FCCUs, storage tanks,flares, coking units and other equipment at petroleum refineries. We are currently assessing the costs of compliance with the EPA’s finalrule. We are not able to predict the impact of other new or changed laws or regulations or changes in the ways that such laws or regulationsare administered, interpreted or enforced but we may incur increased operating costs and capital expenditures to comply, which could bematerial. To the extent that the costs associated with meeting any of these requirements are substantial and not adequately provided for, ourresults of operations and cash flows could suffer.
Climate change legislation or regulations restricting emissions of greenhouse gases could result in increased operating costs and areduced demand for our refining services.
In December 2009, the EPA determined that emissions of carbon dioxide, methane and other GHGs present an endangerment to publichealth and the environment because emissions of such gases are, according to the EPA, contributing to the warming of the earth’satmosphere and other climatic changes. Based on its findings, the EPA has adopted regulations to restrict emissions of GHGs under existingprovisions of the Clean Air Act, such as rules that require a reduction in GHG emissions from motor vehicles. Another rule requiresfacilities already subject to the Prevention of Significant Deterioration and Title V operating permitting programs that increase their GHGemissions by 75,000 tons per year to reduce GHG emissions through control technology, known as “Best Available Control Technology.”The EPA has also adopted rules that require specified large GHG emission sources in the United States, including petroleum refineries, tomonitor and report GHG emissions on an annual basis.
In addition, the U.S. Congress has from time to time considered adopting legislation to reduce emissions of GHGs, and a number of thestates have already taken legal measures to reduce emissions of GHGs primarily through the planned development of GHG emissioninventories and/or regional GHG cap and trade programs. The adoption of legislation or regulatory programs to reduce emissions of GHGscould require us to incur increased operating costs, such as costs to purchase and operate emissions control systems, to acquire emissionsallowances or comply with new regulatory or monitoring and reporting requirements or result in reduced demand for refined petroleumproducts we produce. One or more of these developments could have an adverse effect on our business, financial condition and results ofoperations.
Finally, it should be noted that some scientists have concluded that increasing concentrations of GHGs in the Earth’s atmosphere mayproduce climate changes that have significant physical effects, such as increased frequency and severity of storms, droughts and floods andother climatic events; if any such effects were to occur, they could have an adverse effect on our financial condition and results ofoperations.
We may incur significant costs and liabilities with respect to environmental lawsuits and proceedings and any investigation andremediation of existing and future environmental conditions.
We are currently investigating and remediating, in some cases pursuant to government orders, soil and groundwater contamination atour refinery and terminals arising from our or predecessor operators’ handling of petroleum hydrocarbons and wastes. We anticipatespending $6.6 million in investigation and remediation expenses over the next 15 years in connection with historical soil and groundwatercontamination at our Big Spring refinery and the Abilene, Southlake and
14
Table of Contents
Wichita Falls terminals, which we formerly owned and operated. There can be no assurances, however, that we will not have to spend morethan these anticipated amounts. Our handling and storage of petroleum and hazardous substances may lead to additional contamination atour facilities and facilities to which we send or sent wastes or by-products for treatment or disposal, in which case we may be subject toadditional cleanup costs, governmental penalties, and third-party suits alleging personal injury and property damage. Joint and several strictliability may be incurred in connection with such releases of petroleum hydrocarbons, hazardous substances and/or wastes. Although wehave sold two of our pipelines pursuant to a transaction with Sunoco, we have agreed, subject to certain limitations, to indemnify Sunocofor costs and liabilities that may be incurred by Sunoco as a result of environmental conditions existing at the time of the sale. If we areforced to incur costs or pay liabilities in connection with such releases and contamination or any associated third-party proceedings andinvestigations, or in connection with any of our indemnification obligations to Sunoco, such costs and payments could be significant andcould adversely affect our business, results of operations and cash flows.
We could incur substantial costs or disruptions in our business if we cannot obtain or maintain necessary permits and authorizations orotherwise comply with worker health and safety, environmental and other laws and regulations.
From time to time, we have been sued or investigated for alleged violations of worker health and safety, environmental and other laws.If a lawsuit or enforcement proceeding were commenced or resolved against us, we could incur significant costs and liabilities. In addition,our operations require numerous permits and authorizations under environmental and various other laws and regulations. Theseauthorizations and permits are subject to revocation, renewal or modification and can require operational changes to limit impacts orpotential impacts on the environment and/or worker health and safety. A violation of authorization or permit conditions or of other legal orregulatory requirements could result in substantial fines, criminal sanctions, permit revocations, injunctions, and/or facility shutdowns. Inaddition, major modifications of our operations could require modifications to our existing permits or upgrades to our existing pollutioncontrol equipment. Any or all of these matters could have an adverse effect on our business, results of operations or cash flows.
The renewable fuels standards program may reduce demand for the petroleum fuels we produce and could result in significantcompliance costs, which could have a material adverse effect on our results of operations and financial condition.
The EPA has issued renewable fuel standards mandates requiring refiners to blend renewable fuels into the transportation fuels theyproduce and sell in the United States. To the extent refiners do not or cannot blend renewable fuels into the transportation fuels theyproduce in the quantities required to satisfy their obligations under the RFS-2 program, those refiners must purchase RINs to demonstratecompliance. Under the RFS-2 program, the volume of renewable fuels that obligated parties are required to blend into their transportationfuels increases annually over time until 2022. Our refinery first became subject to the RFS-2 program in 2013. We are able to blendrenewable fuel into some of the transportation fuels produced at our refinery, generating RINs. RINs costs were $14.3 million and $11.5million for 2016 and 2015, respectively.
On December 14, 2015, the EPA published a final rule in the Federal Register establishing the renewable fuel volume mandates for2014, 2015 and 2016, and the biomass-based diesel mandate for 2017. On December 12, 2016, the EPA published a final rule in theFederal Register establishing the renewable fuel volume mandates for 2017, and the biomass-based diesel mandate for 2018. The volumesincluded in the EPA’s final rules increase each year, but are lower, with the exception of the volumes for biomass-based diesel, than thevolumes required by the Clean Air Act. The EPA used its waiver authorities to lower the volumes, but its decision to do so in the December14, 2015 final rule has been challenged in the U.S. Court of Appeals for the District of Columbia Circuit. In addition, in the December 14,2015 final rule, the EPA articulated a policy to incentivize additional investments in renewable fuel blending and distribution infrastructureby increasing the price of RINs. The price of RINs has been extremely volatile and has increased over the last year. If the price of RINsincreases, as predicted by the EPA, the impact could be material. We cannot predict the future prices of RINs and, thus, the expensesrelated to RINs compliance have the potential to be material. Existing laws and regulations could change, and the minimum volumes ofrenewable fuels that must be blended with refined petroleum fuels may increase. Because we do not produce renewable fuels, increasing thevolume of renewable fuels that must be blended into our products displaces an increasing volume of our refinery’s product pool. If thedemand for our transportation fuel decreases as a result of the use of increasing volumes of renewable fuels, increased fuel economy as aresult of new EPA fuel economy standards, or other factors, it could have an adverse effect on our business, results of operations or cashflows.
The adoption of regulations implementing recent financial reform legislation could impede our ability to manage business and financialrisks by restricting our use of derivative instruments as hedges against fluctuating commodity prices.
The U.S. Congress adopted the Dodd-Frank Wall Street Reform and Consumer Protection Act in 2010 (the “Dodd-Frank Act”). Thiscomprehensive financial reform legislation establishes federal oversight and regulation of the over-the-counter derivatives market andentities, such as us, that participate in that market. The Dodd-Frank Act requires the Commodity
15

Table of Contents
Futures Trading Commission (“CFTC”), the SEC and other regulators to promulgate rules and regulations implementing the newlegislation. The CFTC has proposed regulations to set position limits for certain futures and option contracts in the major energy marketsand for swaps that are their economic equivalents. Certain bona fide hedging transactions or derivative instruments would be exempt fromthese position limits. As these proposed position limit rules are not yet final, the effect of those provisions on us is uncertain at this time.The Dodd-Frank Act may also require compliance with margin requirements and with certain clearing and trade-execution requirements inconnection with certain derivative activities, although the application of those provisions to us, and the impact of such provisions upon us,is uncertain at this time. The legislation may also require certain counterparties to our commodity derivative contracts to spin off some oftheir derivatives activities to a separate entity, which may not be as creditworthy as the current counterparty, or cause the entity to complywith the capital requirements, which could result in increased costs to counterparties such as us. The final rules will be phased in over timeaccording to a specified schedule which is dependent on finalization of certain other rules to be promulgated by the CFTC and the SEC.
The Dodd-Frank Act and any new regulations could significantly increase the cost of some commodity derivative contracts (includingthrough requirements to post collateral, which could adversely affect our available liquidity), materially alter the terms of some commodityderivative contracts, reduce the availability of some derivatives to protect against risks we encounter, reduce our ability to monetize orrestructure our existing commodity derivative contracts and potentially increase our exposure to less creditworthy counterparties. If wereduce our use of derivatives as a result of the Dodd-Frank Act and any new regulations, our results of operations may become morevolatile and our cash flows may be less predictable, which could adversely affect our ability to plan for and fund capital expenditures.Increased volatility may make us less attractive to certain types of investors. Finally, the Dodd-Frank Act was intended, in part, to reducethe volatility of oil and natural gas prices, which some legislators attributed to speculative trading in derivatives and commodity instrumentsrelated to oil and natural gas. If the Dodd-Frank Act and any new regulations result in lower commodity prices, our operating income couldbe adversely affected. Any of these consequences could adversely affect our business, financial condition and results of operations. Inaddition, the European Union and other non-U.S. jurisdictions are implementing regulations with respect to the derivatives market. To theextent we transact with counterparties subject to such foreign jurisdictions, we may become subject to such regulations. At this time, theimpact of such regulations is not clear.
The dangers inherent in our operations could cause disruptions and expose us to potentially significant costs and liabilities. We areparticularly vulnerable to disruptions in our operations because all of our refining operations are conducted at a single facility.
Our operations are subject to significant hazards and risks inherent in refining operations and in transporting and storing crude oil,intermediate products and refined products. These hazards and risks include, but are not limited to, natural disasters, fires, explosions,pipeline ruptures and spills, third-party interference and mechanical failure of equipment at our or third-party facilities and other eventsbeyond our control. The occurrence of any of these events could result in production and distribution difficulties and disruptions,environmental pollution, personal injury or wrongful death claims and other damage to our properties and the properties of others.
In addition, our refinery, pipelines and terminals are located in populated areas and any release of hazardous material or catastrophicevent could affect our employees and contractors as well as persons outside our property. Our pipelines, trucks and rail cars carryflammable and toxic materials on public railways and roads and across populated and/or environmentally sensitive areas and waterwaysthat could be severely impacted in the event of a release. An accident could result in significant personal injuries and/or cause a release thatresults in damage to occupied areas as well as damage to natural resources. It could also affect deliveries of crude oil to our refineriesresulting in a curtailment of operations. The cost to remediate such an accidental release and address other potential liabilities as well as thecosts associated with any interruption of operations could be substantial. Although we maintain significant insurance coverage for suchevents, it may not cover all potential losses or liabilities.
Because all of our refining operations are conducted at a single refinery, any such event at our refinery could significantly disrupt ourproduction and distribution of refined products. Any sustained disruption could have a material adverse effect on our business, financialcondition, results of operations and cash flows, and as a result, our ability to service our indebtedness and make distributions.
We are subject to interruptions of supply and distribution as a result of our reliance on pipelines for transportation of crude oil andrefined products.
Our refinery receives a substantial percentage of its crude oil and delivers a substantial percentage of its refined products throughpipelines. We could experience an interruption of supply or delivery, or an increased cost of receiving crude oil and delivering refinedproducts to market, if the ability of these pipelines to transport crude oil or refined products is disrupted
16

Table of Contents
because of accidents, earthquakes, hurricanes, governmental regulation, terrorism or other third-party action. Our prolonged inability to useany of the pipelines that we use to transport crude oil or refined products could have a material adverse effect on our business, results ofoperations and cash flows.
Terrorist attacks, threats of war or actual war may negatively affect our operations, financial condition and results of operations.
Terrorist attacks, threats of war or actual war, as well as events occurring in response to or in connection with them, may adverselyaffect our operations, financial condition and results of operations. Energy-related assets (which could include refineries, terminals andpipelines such as ours) may be at greater risk of terrorist attacks than other possible targets in the United States. A direct attack on ourassets or assets used by us could have a material adverse effect on our business, financial condition and results of operations. In addition,any terrorist attack, threats of war or actual war could have an adverse impact on energy prices, including prices for our crude oil andrefined products, and could have a material adverse effect on our business, financial condition and results of operations. In addition,disruption or significant increases in energy prices could result in government-imposed price controls.
Our insurance policies do not cover all losses, costs or liabilities that we may experience.
We maintain significant insurance coverage, but it does not cover all potential losses, costs or liabilities. Our property damage andbusiness interruption insurance policies that cover the Big Spring refinery have a combined limit of $950 million. Claims for physicaldamage at our refinery are subject to a $10 million deductible. The business interruption insurance policies that cover the Big Springrefinery have a $550 million limit and are subject to a 45-day waiting period. We are fully exposed to all losses in excess of the applicablelimits and sub-limits, a $10 million deductible due to property damage and for losses due to business interruptions of fewer than 45 days.
We maintain third-party liability insurance policies that cover third-party claims with a $300 million limit subject to a $5 milliondeductible. We are fully exposed to third-party claims in excess of the applicable limit and sub-limits and a $5 million deductible.
Additionally, we could suffer losses for uninsurable or uninsured risks or insurable events in amounts in excess of our existinginsurance coverage. Our ability to obtain and maintain adequate insurance may be affected by conditions in the insurance market overwhich we have no control. The occurrence of an event that is not fully covered by insurance could have a material adverse effect on ourbusiness, financial condition, results of operations and cash flows.
We rely on information technology in our operations, and any material failure, inadequacy, interruption or security failure of thattechnology could harm our business.
We rely on information technology systems across our operations, including management of our supply chain and various otherprocesses and transactions. We rely on commercially available systems, software, tools and monitoring to provide security for processing,transmission and storage of confidential customer information.
The regulatory environment surrounding information security and privacy is increasingly demanding, with the frequent imposition ofnew and constantly changing requirements. A compromise of our internal data network at any of our refining or terminal locations mayhave disruptive impacts, which could range from inconvenience in accessing business information to a disruption in our refining operations.Cost increases may be incurred in this area to combat the continued escalation of cyber attacks and/or disruptive criminal activity.
Also, we utilize information technology systems and controls that monitor the movement of petroleum products through our pipelinesand terminals. An undetected failure of these systems could result in environmental damage, operational disruptions, regulatoryenforcement or private litigation. Further, the failure of any of our systems to operate effectively, or problems we may experience withtransitioning to upgraded or replacement systems, could significantly harm our business and operations and cause us to incur significantcosts to remediate such problems.
A significant interruption related to our information technology systems could adversely affect our business.
Our information technology systems and network infrastructure may be subject to unauthorized access or attack, which could result ina loss of sensitive business information, systems interruption, or the disruption of our business operations. There can be no assurance thatour infrastructure protection technologies and disaster recovery plans can prevent a technology systems breach or systems failure, whichcould have a material adverse effect on our financial position or results of operations.
17

Table of Contents
We may not be able to successfully execute our strategy of growth.
A component of our strategy is to selectively pursue organic growth within our refining and wholesale marketing assets. Our ability todo so will be dependent upon a number of factors, including our ability to identify accretive projects, obtain financing to fund these projectsand many other factors beyond our control. Risks associated with implementing accretive projects include those relating to:
• diversion of management time and attention from our existingbusiness;
• challenges in managing the increased scope and complexity ofoperations;
• our ability to understand and capitalize on supply/demand balances in ourmarkets;
• greater than anticipated expenditures required for compliance with environmental or other regulatory standards or for investmentsto improve operating results;
• difficulties in achieving anticipated operationalimprovements;
• incurrence of additional indebtedness to finance these growth projects;and
• issuance of additional equity, which could result in further dilution of the ownership interest of existing unitholders.
We may not be successful in implementing our strategy and any growth projects that we do pursue may not produce the anticipatedbenefits or may have adverse effects on our business and operating results.
If we lose any key personnel at our General Partner, our ability to manage our business and continue our growth could be negativelyaffected.
Our future performance depends to a significant degree upon the continued contributions of our General Partner’s senior managementteam and key technical personnel. We do not currently maintain key man life insurance with respect to any member of the seniormanagement team. The loss or unavailability to us of any member of the General Partner’s senior management team or a key technicalemployee could significantly harm us. We face competition for these professionals from our competitors, our customers and othercompanies operating in our industry. To the extent that the services of members of the senior management team and key technical personnelwould be unavailable to us for any reason, our General Partner would be required to hire other personnel to manage and operate our assetsand to develop our products and technology. We cannot assure you that our General Partner would be able to locate or employ suchqualified personnel on acceptable terms or at all.
A substantial portion of the workforce at our refinery is unionized, and we may face labor disruptions that would interfere with ouroperations.
As of December 31, 2016, Alon Energy employed approximately 210 people at our refinery, approximately 135 of whom were coveredby a collective bargaining agreement that expires in April 2019. The current labor agreement may not prevent a strike or work stoppage inthe future, and any such work stoppage could have a material adverse effect on our results of operations and financial condition.
It may be difficult to serve legal process on or enforce a United States judgment against certain directors of our General Partner.
Certain directors of our General Partner reside in Israel. In addition, a substantial portion of the assets of these directors are locatedoutside of the United States. As a result, you may have difficulty serving legal process within the United States upon any of these persons.You may also have difficulty enforcing, both in and outside the United States, judgments you may obtain in United States courts againstthese persons in any action, including actions based upon the civil liability provisions of United States federal or state securities laws.Furthermore, there is substantial doubt that the courts of the State of Israel would enter judgments in original actions brought in those courtspredicated on United States federal or state securities laws.
Risks Inherent in an Investment in Us
Our General Partner, an indirect subsidiary of Alon Energy, has fiduciary duties to Alon Energy and its stockholders, and the interestsof Alon Energy and its stockholders may differ significantly from, or conflict with, the interests of our public common unitholders.
Our General Partner is responsible for managing us. Although our General Partner has a duty to manage us in a manner that is in ourbest interests, its duties are specifically replaced by the express terms of our partnership agreement, and the
18

Table of Contents
directors and officers of our General Partner also have fiduciary duties to manage our General Partner in a manner beneficial to AlonEnergy and its stockholders. The interests of Alon Energy and its stockholders may differ from, or conflict with, the interests of ourcommon unitholders. In resolving these conflicts, our General Partner may favor its own interests or the interests of Alon Energy andholders of Alon Energy’s common stock over our interests and those of our common unitholders.
The potential conflicts of interest include, among others, the following:
• The affiliates of our General Partner, including Alon Energy, have fiduciary duties to make decisions in their own best interestsand in the best interest of holders of Alon Energy’s common stock, which may be contrary to our interests. In addition, our GeneralPartner is allowed to take into account the interests of parties other than us or our unitholders, such as its owners or Alon Energy,in resolving conflicts of interest, which has the effect of limiting its duties to our unitholders.
• Our General Partner has limited its liability and duties under our partnership agreement and has also restricted the remediesavailable to our unitholders for actions that, without the limitations, might constitute breaches of fiduciary duty under applicablelaw. As a result of purchasing common units, unitholders consent to certain actions and conflicts of interest that might otherwiseconstitute a breach of fiduciary or other duties under applicable state law.
• The board of directors of our General Partner determines the amount and timing of asset purchases and sales, capital expenditures,borrowings, repayment of indebtedness and issuances of additional partnership interests, each of which can affect the amount ofcash that is available for distribution to our common unitholders.
• Our partnership agreement does not restrict our General Partner from causing us to pay it or its affiliates for any services renderedto us or entering into additional contractual arrangements with any of these entities on our behalf. There is no limitation on theamounts our General Partner can cause us to pay it or its affiliates.
• Our General Partner may exercise its rights to call and purchase all of our common units if at any time it and its affiliates ownmore than 90% of the common units (if our General Partner and its affiliates reduce their ownership percentage to below 70% ofthe outstanding common units, the ownership threshold to exercise the call right will be permanently reduced to 80%).
• Our General Partner controls the enforcement of obligations owed to us by it and its affiliates. In addition, our General Partnerdecides whether to retain separate counsel or others to perform services for us.
• Our General Partner determines which costs incurred by it and its affiliates are reimbursable byus.
• The executive officers of our General Partner, and the directors of our General Partner, also serve as directors and/or executiveofficers of Alon Energy. The executive officers who work for both Alon Energy and our General Partner, including our chiefexecutive officer and chief financial officer, divide their time between our business and the business of Alon Energy. Theseexecutive officers will face conflicts of interest from time to time in making decisions which may benefit either us or Alon Energy.
Our partnership agreement restricts the remedies available to us and our common unitholders for actions taken by our General Partnerthat might otherwise constitute breaches of fiduciary duty under applicable law.
Our partnership agreement limits the liability and duties of our General Partner, while also restricting the remedies available to ourcommon unitholders for actions that, without these limitations and reductions, might constitute breaches of fiduciary duty under applicablelaw. Delaware partnership law permits such contractual limitations of fiduciary duty. By purchasing common units, common unitholdersconsent to some actions that might otherwise constitute a breach of fiduciary or other duties applicable under state law. Our partnershipagreement contains provisions that replace the standards to which our General Partner would otherwise be held by state fiduciary duty law.For example:
• Our partnership agreement permits our General Partner to make a number of decisions in its individual capacity, as opposed to itscapacity as general partner. This entitles our General Partner to consider only the interests and factors that it desires, and it has noduty or obligation to give any consideration to any interest of, or factors affecting, our common unitholders. Decisions made byour General Partner in its individual capacity will be made by Alon Energy, which owns the sole member of our General Partner,and not by the board of directors of our General Partner. Examples include the exercise of the General Partner’s call right, itsvoting rights with respect to any common units it may own, its registration rights and its determination whether or not to consent toany merger or consolidation or amendment to our partnership agreement. In addition, our General Partner may decline toundertake any transaction that it believes would materially adversely affect Alon Energy’s ability to continue to comply with thecovenants contained in its debt agreements.
19

Table of Contents
• Our partnership agreement provides that our General Partner will not have any liability to us or our unitholders for decisions madein its capacity as General Partner so long as it acted in good faith, meaning it believed that the decisions were not adverse to theinterests of the Partnership and, except as specifically provided by our partnership agreement, our General Partner will not besubject to any other or different standard imposed by our partnership agreement, Delaware law, or any other law, rule orregulation, or at equity.
• Our partnership agreement provides that our General Partner and the officers and directors of our General Partner will not beliable for monetary damages to us for any acts or omissions unless there has been a final and non-appealable judgment entered by acourt of competent jurisdiction determining that our General Partner or those persons acted in bad faith or, in the case of a criminalmatter, acted with knowledge that such person’s conduct was unlawful.
• Our partnership agreement provides that our General Partner will not be in breach of its obligations under the partnershipagreement or its duties to us or our limited partners if a transaction with an affiliate or the resolution of a conflict of interest is:
◦ Approved by the conflicts committee of the board of directors of our General Partner, although our General Partner is notobligated to seek such approval; or
◦ Approved by the vote of a majority of the outstanding units, excluding any units owned by our General Partner and itsaffiliates.
By purchasing a common unit, a unitholder will become bound by the provisions of our partnership agreement, including theprovisions described above.
Alon Energy has the power to appoint and remove our General Partner’s directors.
Alon Energy has the power to elect all of the members of the board of directors of our General Partner. Our General Partner hascontrol over all decisions related to our operations. Our public unitholders do not have an ability to influence any operating decisions andare not able to prevent us from entering into any transactions. Furthermore, the goals and objectives of Alon Energy, as the indirect ownerof our General Partner, may not be consistent with those of our public unitholders.
Common units are subject to our General Partner’s call right.
If at any time our General Partner and its affiliates own more than 90% of the common units, our General Partner will have the right,which it may assign to any of its affiliates or to us, but not the obligation, to acquire all, but not less than all, of the common units held bypublic unitholders at a price not less than their then-current market price, as calculated pursuant to the terms of our partnership agreement.If our General Partner and its affiliates reduce their ownership percentage to below 70% of the outstanding units, the ownership threshold toexercise the call right will be permanently reduced to 80%. As a result, unitholders may be required to sell their common units at anundesirable time or price and may not receive any return on their investment. Unitholders may also incur a tax liability upon a sale of theircommon units. Our General Partner is not obligated to obtain a fairness opinion regarding the value of the common units to be repurchasedby it upon exercise of the call right. There is no restriction in our partnership agreement that prevents our General Partner from issuingadditional common units and then exercising its call right. Our General Partner may use its own discretion, free of fiduciary dutyrestrictions, in determining whether to exercise this right.
Our unitholders have limited voting rights and are not entitled to elect our General Partner or our General Partner’s directors.
Unlike the holders of common stock in a corporation, our unitholders have only limited voting rights on matters affecting our businessand, therefore, limited ability to influence management’s decisions regarding our business. Unitholders have no right to elect our GeneralPartner or our General Partner’s board of directors on an annual or other continuing basis. The board of directors of our General Partner,including the independent directors, is chosen entirely by Alon Energy as the indirect owner of the General Partner and not by our commonunitholders. Unlike publicly traded corporations, we do not hold annual meetings of our unitholders to elect directors or conduct othermatters routinely conducted at annual meetings of stockholders. Furthermore, even if our unitholders are dissatisfied with the performanceof our General Partner, they have no practical ability to remove our General Partner. As a result of these limitations, the price at which thecommon units will trade could be diminished.
20

Table of Contents
Our public unitholders do not have sufficient voting power to remove our General Partner without Alon Energy’s consent.
Alon Energy indirectly owns approximately 81.6% of our common units, which means holders of common units are not able to removethe General Partner, under any circumstances, unless Alon Energy sells some of the common units that it owns or we sell additional units tothe public.
Our partnership agreement restricts the voting rights of unitholders owning 20% or more of our common units (other than our GeneralPartner and its affiliates and permitted transferees).
Our partnership agreement restricts unitholders’ voting rights by providing that any units held by a person that owns 20% or more ofany class of units then outstanding, other than our General Partner, its affiliates, their transferees and persons who acquired such units withthe prior approval of the board of directors of our General Partner, may not vote on any matter. Our partnership agreement also containsprovisions limiting the ability of common unitholders to call meetings or to acquire information about our operations, as well as otherprovisions limiting the ability of our common unitholders to influence the manner or direction of management.
Cost reimbursements due to our General Partner and its affiliates will reduce cash available for distribution to unitholders.
Prior to making any distribution on our outstanding units, we reimburse our General Partner for all expenses it incurs on our behalfincluding, without limitation, our pro rata portion of management compensation and overhead charged by Alon Energy in accordance withour services agreement. The services agreement does not contain any cap on the amount we may be required to pay pursuant to thisagreement. The payment of these amounts, including allocated overhead, to our General Partner and its affiliates could adversely affect ourability to make distributions to unitholders.
Unitholders may have liability to repay distributions and in certain circumstances may be personally liable for the obligations of thePartnership.
Under certain circumstances, unitholders may have to repay amounts wrongfully returned or distributed to them. Under Section 17-607of the Delaware Revised Uniform Limited Partnership Act (the “Delaware Act”), we may not make a distribution to our unitholders if thedistribution would cause our liabilities to exceed the fair value of our assets. Delaware law provides that for a period of three years from thedate of the impermissible distribution, limited partners who received the distribution and who knew at the time of the distribution that itviolated Delaware law will be liable to the limited partnership for the distribution amount. Liabilities to partners on account of theirpartnership interests and liabilities that are non-recourse to the partnership are not counted for purposes of determining whether adistribution is permitted.
It may be determined that the right, or the exercise of the right by the limited partners as a group, to (i) remove or replace our GeneralPartner, (ii) approve some amendments to our partnership agreement or (iii) take other action under our partnership agreement constitutes“participation in the control” of our business. A limited partner that participates in the control of our business within the meaning of theDelaware Act may be held personally liable for our obligations under the laws of Delaware, to the same extent as our General Partner. Thisliability would extend to persons who transact business with us under the reasonable belief that the limited partner is a General Partner.Neither our partnership agreement nor the Delaware Act specifically provides for legal recourse against our General Partner if a limitedpartner were to lose limited liability through any fault of our General Partner.
Our General Partner’s interest in us and the control of our General Partner may be transferred to a third party without unitholderconsent.
Our General Partner may transfer its General Partner interest in us to a third party in a merger or in a sale of all or substantially all ofits assets without the consent of the unitholders. Furthermore, there is no restriction in our partnership agreement on the ability of theowners of our General Partner to transfer their equity interests in our General Partner to a third party. The new equity owner of our GeneralPartner would then be in a position to replace the board of directors and the officers of our General Partner with its own choices and toinfluence the decisions taken by the board of directors and officers of our General Partner.
If control of our General Partner were transferred to an unrelated third party, the new owner of the General Partner would have nointerest in Alon Energy. We rely substantially on the senior management team of Alon Energy and have entered into a number ofsignificant agreements with Alon Energy, including a services agreement pursuant to which Alon Energy provides us with the services ofits senior management team. If our General Partner were no longer controlled by Alon Energy, Alon Energy could be more likely toterminate the services agreement, which it may do upon 180 days’ prior written notice.
21

Table of Contents
We may issue additional common units and other equity interests without our unitholders’ approval, which would dilute ourunitholders’ existing ownership interests.
Under our partnership agreement, we are authorized to issue an unlimited number of additional interests without a vote of theunitholders. The issuance by us of additional common units or other equity interests of equal or senior rank will have the following effects:
• the proportionate ownership interest of unitholders immediately prior to the issuance willdecrease;
• the amount of cash distributions on each unit willdecrease;
• the ratio of our taxable income to distributions mayincrease;
• the relative voting strength of each previously outstanding unit will be diminished;and
• the market price of the common units maydecline.
In addition, our partnership agreement does not prohibit the issuance by our subsidiaries of equity interests, which may effectively ranksenior to our common units.
As a publicly traded partnership we qualify for, and are relying on, certain exemptions from the NYSE’s corporate governancerequirements.
As a publicly traded partnership, we qualify for, and are relying on, certain exemptions from the NYSE’s corporate governancerequirements, including:
• the requirement that a majority of the board of directors of our General Partner consist of independentdirectors;
• the requirement that the board of directors of our General Partner have a nominating/corporate governance committee that iscomposed entirely of independent directors; and
• the requirement that the board of directors of our General Partner have a compensation committee that is composed entirely ofindependent directors.
As a result of these exemptions, our General Partner’s board of directors is not required to be comprised of a majority of independentdirectors, and our General Partner’s board of directors does not currently intend to establish a compensation committee or anominating/corporate governance committee. Accordingly, unitholders will not have the same protections afforded to equity holders ofcompanies that are subject to all of the corporate governance requirements of the NYSE.
Tax Risks to Common Unitholders
Our tax treatment depends on our status as a partnership for federal income tax purposes, as well as us not being subject to a materialamount of entity-level taxation by individual states. If the Internal Revenue Service were to treat us as a corporation for federal incometax purposes, or we become subject to entity-level taxation for state tax purposes, our cash available for distribution to our unitholderswould be substantially reduced.
The anticipated after-tax economic benefit of an investment in our common units depends largely on our being treated as a partnershipfor federal income tax purposes.
Despite the fact that we are organized as a limited partnership under Delaware law, we would be treated as a corporation for U.S.federal income tax purposes unless we satisfy a “qualifying income” requirement. Based upon our current operations, we believe we satisfythe qualifying income requirement. However, no ruling has been or will be requested regarding our treatment as a partnership for U.S.federal income tax purposes. Failing to meet the qualifying income requirement or a change in current law could cause us to be treated as acorporation for U.S. federal income tax purposes or otherwise subject us to taxation as an entity.
If we were treated as a corporation for federal income tax purposes, we would pay federal income tax on our taxable income at thecorporate tax rate. Distributions to our unitholders would generally be taxed again as corporate distributions, and no income, gains, losses,or deductions would flow through to our unitholders. Because a tax would be imposed upon us as a corporation, cash distributions to ourunitholders would be substantially reduced. In addition, changes in current state law may subject us to additional entity-level taxation byindividual states. Because of widespread state budget deficits and other reasons, several states are evaluating ways to subject partnershipsto entity-level taxation through the imposition of state income, franchise, and other forms of taxation. Imposition of any of those taxes maysubstantially reduce the cash distributions to our unitholders. Therefore, treatment of us as a corporation or the assessment of a materialamount of entity-
22

Table of Contents
level taxation would result in a material reduction in the anticipated cash generated from operations and after-tax return to the unitholders,likely causing a substantial reduction in the value of our common units.
The tax treatment of publicly traded partnerships or an investment in our units could be subject to potential legislative, judicial oradministrative changes or differing interpretations, possibly applied on a retroactive basis.
The present U.S. federal income tax treatment of publicly traded partnerships, including us, or an investment in our common units maybe modified by administrative, legislative or judicial changes or differing interpretations at any time. From time to time, members ofCongress propose and consider substantive changes to the existing U.S. federal income tax laws that affect publicly traded partnerships.Although there is no current legislative proposal, a prior legislative proposal would have eliminated the qualifying income exception to thetreatment of all publicly traded partnerships as corporations upon which we rely for our treatment as a partnership for U.S. federal incometax purposes.
In addition, on January 24, 2017, final regulations regarding which activities give rise to qualifying income within the meaning ofSection 7704 of the Code (the “Final Regulations”) were published in the Federal Register. The Final Regulations are effective as ofJanuary 19, 2017, and apply to taxable years beginning on or after January 19, 2017. We do not believe the Final Regulations affect ourability to be treated as a partnership for U.S. federal income tax purposes.
However, any modification to the U.S. federal income tax laws may be applied retroactively and could make it more difficult orimpossible for us to meet the exception for certain publicly traded partnerships to be treated as partnerships for U.S. federal income taxpurposes. We are unable to predict whether any of these changes or other proposals will ultimately be enacted. Any similar or futurelegislative changes could negatively impact the value of an investment in our common units.
If the IRS were to contest the federal income tax positions we take, it may adversely impact the market for our common units, and thecosts of any such contest would reduce cash available for distribution to our unitholders.
We have not requested a ruling from the IRS with respect to our treatment as a partnership for U.S. federal income tax purposes. TheIRS may adopt positions that differ from the positions we take in the future. It may be necessary to resort to administrative or courtproceedings to sustain some or all of the positions we take. A court may not agree with some or all of the positions we take. Any contestwith the IRS may materially and adversely impact the market for our common units and the price at which they trade. Moreover, the costsof any contest between us and the IRS will result in a reduction in cash available for distribution to our unitholders and thus will be borneindirectly by our unitholders.
If the IRS makes audit adjustments to our income tax returns for tax years beginning after December 31, 2017, it (and some states) mayassess and collect any taxes (including any applicable penalties and interest) resulting from such audit adjustment directly from us, inwhich case our cash available for distribution to our unitholders might be substantially reduced.
Pursuant to the Bipartisan Budget Act of 2015, for tax years beginning after December 31, 2017, if the IRS makes audit adjustments toour income tax returns, it (and some states) may assess and collect any taxes (including any applicable penalties and interest) resulting fromsuch audit adjustment directly from us. To the extent possible under the new rules, our general partner may elect to either pay the taxes(including any applicable penalties and interest) directly to the IRS or, if we are eligible, issue a revised Schedule K-1 to each unitholderwith respect to an audited and adjusted return. Although our general partner may elect to have our unitholders take such audit adjustmentinto account in accordance with their interests in us during the tax year under audit, there can be no assurance that such election will bepractical, permissible or effective in all circumstances. As a result, our current unitholders may bear some or all of the tax liability resultingfrom such audit adjustment, even if such unitholders did not own units in us during the tax year under audit. If, as a result of any such auditadjustment, we are required to make payments of taxes, penalties and interest, our cash available for distribution to our unitholders might besubstantially reduced. These rules are not applicable for tax years beginning on or prior to December 31, 2017.
Our unitholders are required to pay taxes on their share of our income even if they do not receive any cash distributions from us.
Our unitholders are required to pay any U.S. federal income taxes and, in some cases, state and local income taxes on their share of ourtaxable income whether or not they receive cash distributions from us. For example, if we sell assets and use the proceeds to repay existingdebt or fund capital expenditures, unitholders may be allocated taxable income and gain resulting from the sale and our cash available fordistribution would not increase. Similarly, taking advantage of opportunities to reduce our existing debt, such as debt exchanges, debtrepurchases, or modifications of our existing debt could result in “cancellation of indebtedness income” being allocated to our unitholdersas taxable income without any increase in our cash
23

Table of Contents
available for distribution. Our unitholders may not receive cash distributions from us equal to their share of our taxable income or evenequal to the actual tax liability that results from that income.
A tax gain or loss on the disposition of our common units could be more or less than unitholders expect.
If a unitholder sells common units, the unitholder will recognize a gain or loss equal to the difference between the amount realized andthat unitholder’s tax basis in those common units. Because distributions in excess of unitholders’ allocable share of our net taxable incomedecrease their tax basis in their common units, the amount, if any, of such prior excess distributions with respect to the units unitholders sellwill, in effect, become taxable income to our unitholders if they sell such units at a price greater than their tax basis in those units, even ifthe price they receive is less than their original cost. In addition, because the amount realized includes a unitholder’s share of ournonrecourse liabilities, if they sell their units, unitholders may incur a tax liability in excess of the amount of cash they receive from thesale.
A substantial portion of the amount realized from the sale of a unitholder’s units, whether or not representing gain, may be taxed asordinary income to the unitholder due to potential recapture items, including depreciation recapture. Thus, the unitholder may recognizeboth ordinary income and capital loss from the sale of the unitholder’s units if the amount realized on a sale of units is less than theunitholder’s adjusted basis in the units. Net capital loss may only offset capital gains and, in the case of individuals, up to $3,000 ofordinary income per year. In the taxable period in which a unitholder sells common units, the unitholder may recognize ordinary incomefrom our allocations of income and gain to the unitholder prior to the sale and from recapture items that generally cannot be offset by anycapital loss recognized upon the sale of units.
Tax-exempt entities and non-U.S. persons face unique tax issues from owning common units that may result in adverse taxconsequences to them.
Investments in common units by tax-exempt entities, such as employee benefit plans and individual retirement accounts (or “IRAs”),and non-U.S. persons raise issues unique to them. For example, virtually all of our income allocated to organizations that are exempt fromfederal income tax, including IRAs and other retirement plans, will be unrelated business taxable income and will be taxable to them.Distributions to non-U.S. persons are subject to withholding taxes imposed at the highest effective tax rate applicable to such non-U.S. persons, and each non-U.S. person will be required to file U.S. federal tax returns and pay tax on its share of our taxable income. Anytax-exempt entity or a non-U.S. person should consult its tax advisor before investing in our common units.
We treat each purchaser of our common units as having the same tax benefits without regard to the common units actually purchased.The IRS may challenge this treatment, which could adversely affect the value of the common units.
Because we cannot match transferors and transferees of common units, we have adopted depreciation and amortization positions thatmay not conform to all aspects of existing Treasury Regulations. A successful IRS challenge to those positions could adversely affect theamount of tax benefits available to our unitholders. It also could affect the timing of these tax benefits or the amount of gain from any saleof common units and could have a negative impact on the value of our common units or result in audit adjustments to a unitholder’s taxreturns.
We generally prorate our items of income, gain, loss and deduction between transferors and transferees of our units each month basedupon the ownership of our units on the first day of each month, instead of on the basis of the date a particular unit is transferred. TheIRS may challenge this treatment, which could change the allocation of items of income, gain, loss and deduction among ourunitholders.
We generally prorate our items of income, gain, loss and deduction between transferors and transferees of our units each month basedupon the ownership of our units on the first day of each month (the “Allocation Date”), instead of on the basis of the date a particular unitis transferred. Similarly, we generally allocate certain deductions for depreciation of capital additions, gain or loss realized on a sale orother disposition of our assets and, in the discretion of the general partner, any other extraordinary item of income, gain, loss or deductionbased upon ownership on the Allocation Date. Treasury Regulations allow a similar monthly simplifying convention, but such regulationsdo not specifically authorize all aspects of our proration method. If the IRS were to challenge our proration method, we may be required tochange the allocation of items of income, gain, loss and deduction among our unitholders.
A unitholder whose units are the subject of a securities loan (e.g., a loan to a “short seller” to cover a short sale of units) may beconsidered to have disposed of those units. If so, he would no longer be treated for tax purposes as a partner with respect to those unitsduring the period of the loan and may recognize gain or loss from the disposition.
Because there are no specific rules governing the U.S. federal income tax consequence of loaning a partnership interest, a unitholderwhose units are the subject of a securities loan may be considered as having disposed of the loaned units. In that
24

Table of Contents
case, the unitholder may no longer be treated for tax purposes as a partner with respect to those units during the period of the loan to theshort seller and the unitholder may recognize gain or loss from such disposition. Moreover, during the period of the loan, any of ourincome, gain, loss or deduction with respect to those units may not be reportable by the unitholder and any cash distributions received bythe unitholder as to those units could be fully taxable as ordinary income. Unitholders desiring to assure their status as partners and avoidthe risk of gain recognition from a securities loan are urged to modify any applicable brokerage account agreements to prohibit theirbrokers from borrowing their units.
We have adopted certain valuation methodologies in determining a unitholder’s allocations of income, gain, loss and deduction. TheIRS may challenge these methodologies or the resulting allocations, which could adversely affect the value of our common units.
In determining the items of income, gain, loss and deduction allocable to our unitholders, we must routinely determine the fair marketvalue of our assets. Although we may, from time to time, consult with professional appraisers regarding valuation matters, we make manyfair market value estimates using a methodology based on the market value of our common units as a means to measure the fair marketvalue of our assets. The IRS may challenge these valuation methods and the resulting allocations of income, gain, loss and deduction.
A successful IRS challenge to these methods or allocations could adversely affect the timing or amount of taxable income or loss beingallocated to our unitholders. It also could affect the amount of gain from our unitholders’ sale of common units and could have a negativeimpact on the value of the common units or result in audit adjustments to our unitholders’ tax returns without the benefit of additionaldeductions.
The sale or exchange of 50% or more of our capital and profits interests during any twelve-month period will result in the terminationof our partnership for federal income tax purposes.
We will be considered to have terminated our partnership for federal income tax purposes if there is a sale or exchange of 50% or moreof the total interests in our capital and profits within a twelve-month period. As of December 31, 2016, Alon Energy indirectly owns 81.6%of the total interests in our capital and profits. Therefore, a transfer by Alon Energy of all or a portion of its interests in us could, inconjunction with the trading of common units held by the public, result in a termination of our partnership for federal income tax purposes.For purposes of determining whether the 50% threshold has been met, multiple sales of the same interest will be counted only once.
Our termination would, among other things, result in the closing of our taxable year for all unitholders, which would result in us filingtwo tax returns for one calendar year and could result in a significant deferral of depreciation deductions allowable in computing ourtaxable income. In the case of a unitholder reporting on a taxable year other than a calendar year, the closing of our taxable year may alsoresult in more than twelve months of our taxable income or loss being includable in taxable income for the unitholder’s taxable year thatincludes our termination. Our termination would not affect our classification as a partnership for federal income tax purposes, but it wouldresult in our being treated as a new partnership for U.S. federal income tax purposes following the termination. If we were treated as a newpartnership, we would be required to make new tax elections and could be subject to penalties if we were unable to determine that atermination occurred. The IRS has announced a relief procedure whereby if a publicly traded partnership that has technically terminatedrequests and the IRS grants special relief, among other things, the partnership may be permitted to provide only a single Schedule K-1 tounitholders for the two short tax periods included in the year in which the termination occurs.
Our unitholders will likely be subject to state and local taxes and income tax return filing requirements in jurisdictions where they donot live as a result of investing in our common units.
In addition to U.S. federal income taxes, our unitholders may be subject to other taxes, including foreign, state and local taxes,unincorporated business taxes and estate, inheritance or intangible taxes that are imposed by the various jurisdictions in which we conductbusiness or own property now or in the future, even if they do not live in any of those jurisdictions. Our unitholders will likely be requiredto file state and local income tax returns and pay state and local income taxes in some or all of these various jurisdictions. Further, ourunitholders may be subject to penalties for failure to comply with those requirements.
We currently own assets and conduct business in multiple states, some of which currently impose a personal income tax on individuals,corporations and other entities. As we make acquisitions or expand our business, we may own assets or conduct business in additionalstates that impose a personal income tax. It is our unitholders’ responsibility to file all United States federal, foreign, state and local taxreturns.
ITEM 1B. UNRESOLVED STAFF COMMENTS.
None.
ITEM 3. LEGAL PROCEEDINGS.
In the ordinary conduct of our business, we are subject to periodic lawsuits, investigations and claims, including environmental claimsand employee related matters. Although we cannot predict with certainty the ultimate resolution of lawsuits, investigations and claimsasserted against us, we do not believe that any currently pending legal proceeding or proceedings to which we are a party will have amaterial adverse effect on our business, results of operations, cash flows or financial condition.
ITEM 4. MINE SAFETY DISCLOSURES.
None.
25

Table of Contents
PART II
ITEM 5. MARKET FOR REGISTRANT’S COMMON EQUITY, RELATED STOCKHOLDER MATTERS AND ISSUERPURCHASES OF EQUITY SECURITIES.
Market Information
Our common units representing limited partner interests are traded on the New York Stock Exchange under the symbol “ALDW.”
The following table sets forth the quarterly high and low sales prices of our common units and distributions declared during eachquarterly period within the two most recently completed fiscal years:
Sales Prices of our Common Units Cash Available forDistributions perCommon Unit (1)Quarterly Period High Low
2016 Fourth Quarter $ 10.35 $ 7.63 $ 0.11Third Quarter 12.44 8.07 0.15Second Quarter 13.03 9.07 0.14First Quarter 23.14 9.71 —
2015 Fourth Quarter $ 26.67 $ 20.08 $ 0.08Third Quarter 26.16 13.84 0.98Second Quarter 22.26 17.50 1.04First Quarter 20.25 12.26 0.71
_______________________
(1) Represents the cash available for distribution per unit attributable to the quarter indicated. Pursuant to our partnership agreement,this amount is declared and paid within 60 days of each quarter end.
Holders
As of February 21, 2017, there were six unitholders of record.
Our Cash Distribution Policy
The board of directors of our General Partner adopted a policy pursuant to which distributions for each quarter will equal the amount ofavailable cash we generate in such quarter. Available cash for each quarter will be determined by the board of directors of our GeneralPartner following the end of the quarter. We expect within 60 days after the end of each quarter to make distributions to unitholders ofrecord on the applicable date. Distributions on our units will be paid in cash.
We expect that available cash for each quarter will generally equal our cash flow from operations for the quarter, less cash needed formaintenance capital expenditures, debt service and other contractual obligations and reserves for future operating or capital needs that theboard of directors of our General Partner deems necessary or appropriate, including reserves for our expenses in the quarters in which ourplanned major turnarounds and catalyst replacements occur. In advance of scheduled turnarounds at our refinery, the board of directors ofour General Partner reserves amounts to fund expenditures associated with such scheduled turnarounds. Actual turnaround and relatedexpenses will be funded with cash reserves or borrowings under our revolving credit facility. We do not intend to maintain excessdistribution coverage for the purpose of maintaining stability or growth in our quarterly distributions or otherwise to reserve cash fordistributions, nor do we intend to incur debt to pay quarterly distributions. We expect to finance substantially all of our growth externally,either by debt issuances or additional issuances of equity.
Because our policy is to distribute all available cash generated each quarter, without reserving cash for future distributions orborrowing to pay distributions during periods of low cash flow from operations, our unitholders have direct exposure to fluctuations in theamount of cash generated by our business. We expect that the amount of our quarterly distributions, if any, will vary based on our operatingcash flow during each quarter. Our quarterly cash distributions, if any, will not be stable and will vary from quarter to quarter as a directresult of variations in our operating performance and cash flow caused by fluctuations in our refining margins, which will be affected byprices of feedstock and refined products as well as our working capital requirements and capital expenditures. Such variations may besignificant. Unlike traditional
26

Table of Contents
master limited partnerships, we do not have a minimum quarterly distribution or employ structures intended to consistently maintain orincrease distributions over time. The board of directors of our General Partner may change the foregoing distribution policy at any time andfrom time to time. Our partnership agreement does not require us to pay cash distributions on a quarterly or other basis.
Recent Sales of Unregistered Securities
None.
Purchases of Equity Securities by the Issuer and Affiliated Purchasers
None.
27

Table of Contents
Unitholder Return Performance Graph
The following performance graph and related information shall not be deemed “soliciting material” or “filed” with the SEC, nor shallsuch information be incorporated by reference into any future filings under the Securities Act of 1933 or the Securities Exchange Act of1934, each as amended, except to the extent we specifically incorporate it by reference into such filing.
The following performance graph compares the cumulative total unitholder return on the Partnership’s common units as traded on theNYSE with the Standard & Poor’s 500 Stock Index (the “S&P 500”) and our peer group as selected by management for the cumulativeperiod from November 20, 2012 to December 31, 2016, assuming an initial investment of $100 dollars in our common units at $18.40 perunit (the closing price at the end of our first trading day), the S&P 500 on November 20, 2012 (our first day of trading) and the peer groupon January 17, 2013 (our peer’s first day of trading) and the reinvestment of all distributions, if any. The peer group is comprised of CVRRefining, LP (NYSE:CVRR), which is a master limited partnership engaged in refining operations. The stock performance shown on thegraph below is historical and not necessarily indicative of future price performance.
11//12 12/12 12/13 12/14 12/15 12/16
Alon USA Partners $ 100.00 $ 130.82 $ 102.15 $ 88.38 $ 185.41 $ 80.86S&P 500 100.00 101.50 134.37 152.76 154.88 173.40Peer Group 100.00 100.00 100.75 84.24 110.37 60.64
28

Table of Contents
ITEM 6. SELECTED FINANCIAL DATA.
The following table sets forth selected consolidated financial data as of and for each of the five years ending December 31, 2016. Theselected historical statement of operations data for the years ended December 31, 2016, 2015 and 2014 and the selected consolidatedbalance sheet data as of December 31, 2016 and 2015 are derived from our audited consolidated financial statements included elsewhere inthis Annual Report on Form 10-K. The selected historical consolidated statement of operations data for the years ended December 31, 2013and 2012 and the selected historical consolidated balance sheet data as of December 31, 2014, 2013 and 2012 are derived from our auditedconsolidated financial statements, which are not included in this Annual Report on Form 10-K.
The following selected historical consolidated financial data should be read in conjunction with Item 7 “Management’s Discussion andAnalysis of Financial Condition and Results of Operations” and the consolidated financial statements and notes thereto included elsewherein this Annual Report on Form 10-K.
Year Ended December 31,
2016 2015 2014 2013 2012 (in thousands, except per unit data)STATEMENTS OF OPERATIONS DATA (1): Net sales $ 1,807,732 $ 2,157,191 $ 3,221,373 $ 3,430,287 $ 3,476,817Operating income 32,668 203,506 217,979 178,677 423,352Net income (loss) (4,404) 156,899 169,135 136,222 381,898
Less: Net income attributable to predecessoroperations — — — — 344,778
Net income (loss) attributable to Alon USA Partners,LP (4,404) 156,899 169,135 136,222 37,120Earnings (loss) per unit $ (0.07) $ 2.51 $ 2.71 $ 2.18 $ 0.59Weighted average common units outstanding (inthousands) 62,516 62,509 62,505 62,502 62,500Cash distribution per unit $ 0.37 $ 3.43 $ 2.02 $ 2.76 $ — BALANCE SHEET DATA: Cash and cash equivalents $ 73,524 $ 132,953 $ 106,325 $ 153,583 $ 66,001Working capital (73,563) (53,804) (4,561) 18,007 1,702Total assets 695,637 748,584 765,859 844,628 756,166Total debt 236,319 292,082 297,989 339,026 288,054Total debt less cash and cash equivalents 162,795 159,129 191,664 185,443 222,053Partners’ equity 103,503 130,957 188,402 145,442 181,726_______________________
(1) Earnings (loss) per unit information presented for the year ended December 31, 2012 represents earnings subsequent to thecompletion of the Partnership’s initial public offering in November 2012.
29
Table of Contents
ITEM 7. MANAGEMENT’S DISCUSSION AND ANALYSIS OF FINANCIAL CONDITION AND RESULTS OFOPERATIONS.
The following discussion of our financial condition and results of operations is provided as a supplement to, and should be read inconjunction with, our consolidated financial statements and the notes thereto included elsewhere in this Annual Report on Form 10-K andthe other sections of this Annual Report on Form 10-K, including Items 1. and 2. “Business and Properties,” and Item 6. “SelectedFinancial Data.”
Forward-Looking Statements
Certain statements contained in this report and other materials we file with the SEC, or in other written or oral statements made by us,other than statements of historical fact, are “forward-looking statements” as defined in the Private Securities Litigation Reform Act of1995. Forward-looking statements relate to matters such as our industry, business strategy, goals and expectations concerning our marketposition, future operations, margins, profitability, capital expenditures, liquidity and capital resources and other financial and operatinginformation. We have used the words “anticipate,” “assume,” “believe,” “budget,” “continue,” “could,” “estimate,” “expect,” “intend,”“may,” “plan,” “potential,” “predict,” “project,” “will,” “future” and similar terms and phrases to identify forward-looking statements.
Forward-looking statements reflect our current expectations of future events, results or outcomes. These expectations may or may notbe realized. Some of these expectations may be based upon assumptions or judgments that prove to be incorrect. In addition, our businessand operations involve numerous risks and uncertainties, many of which are beyond our control, which could result in our expectations notbeing realized or otherwise materially affect our financial condition, results of operations and cash flows. See Item 1A “Risk Factors.”
Actual events, results and outcomes may differ materially from our expectations due to a variety of factors. Although it is not possibleto identify all of these factors, they include, among others, the following:
• changes in general economic conditions and capitalmarkets;
• changes in the underlying demand for ourproducts;
• the availability, costs and price volatility of crude oil, other refinery feedstocks and refinedproducts;
• changes in the spread between WTI Cushing crude oil and WTS crude oil or WTI Midland crudeoil;
• changes in the spread between Brent crude oil and WTI Cushing crudeoil;
• the effects of transactions involving forward contracts and derivativeinstruments;
• actions of customers andcompetitors;
• termination of our Supply and Offtake Agreement with J. Aron & Company (“J. Aron”), under which J. Aron is one of our largestsuppliers of crude oil and one of our largest customers of refined products. Additionally, upon termination of the Supply andOfftake Agreement, we are obligated to purchase the crude oil and refined product inventories then owned by J. Aron at thencurrent market prices;
• changes in fuel and utility costs incurred by ourrefinery;
• disruptions due to equipment interruption, pipeline disruptions or failures at our or third-partyfacilities;
• the execution of planned capitalprojects;
• adverse changes in the credit ratings assigned to our trade credit and debtinstruments;
• the effects and cost of compliance with the RFS-2 program, including the availability, cost and price volatility ofRINs;
• the effects and cost of compliance with current and future state and federal environmental, economic, safety and other laws,policies and regulations;
• the effects of seasonality on demand for ourproducts;
• the level of competition from other petroleumrefiners;
• operating hazards, accidents, fires, severe weather, floods and other natural disasters, casualty losses and other matters beyond ourcontrol, which could result in unscheduled downtime;
• the effect of any national or international financial crisis on our business and financial condition;and

30

Table of Contents
• the other factors discussed in this Annual Report on Form 10-K under the caption “RiskFactors.”
Any one of these factors or a combination of these factors could materially affect our future results of operations and could influencewhether any forward-looking statements ultimately prove to be accurate. Our forward-looking statements are not guarantees of futureperformance, and actual results and future performance may differ materially from those suggested in any forward-looking statements. Wedo not intend to update these statements unless we are required by the securities laws to do so.
Company Overview
We are a limited partnership formed in August 2012 and engaged principally in the business of operating a crude oil refinery in BigSpring, Texas, with a crude oil throughput capacity of 73,000 barrels per day. We refine crude oil into finished products, which aremarketed primarily in Central and West Texas, Oklahoma, New Mexico and Arizona through our integrated wholesale distribution networkto both Alon Energy’s retail convenience stores and other third-party distributors. We distribute fuel products through a network ofpipelines and terminals that we own or access through leases or long-term throughput agreements.
For additional information, see Items 1. and 2. “Business and Properties.”
2016 Operational and Financial Highlights
Our operational and financial highlights for 2016 include the following:
• Operating income for 2016 was $32.7 million, compared to $203.5 million in2015.
• Big Spring refinery average throughput for 2016 was 71,363 bpd compared to 74,906 bpd for 2015. The reduced throughputduring 2016 was the result of a reformer regeneration during the first quarter of 2016 and third quarter of 2016. Additionally,throughput was reduced as a result of a catalyst replacement for our diesel hydrotreater unit in the first quarter of 2016 andunplanned downtime during the second quarter of 2016 due to a power outage caused by inclement weather, which affectedmultiple units.
• Refinery operating margin was $8.28 per barrel for 2016, compared to $14.43 per barrel for 2015. This decrease in operatingmargin was primarily due to a lower Gulf Coast 3/2/1 crack spread, a narrowing of the WTI Cushing to WTI Midland spread andincreased RINs costs, partially offset by a widening of the WTI Cushing to WTS spread and an increased benefit from thecontango market environment which reduced the cost of crude.
• The average Gulf Coast 3/2/1 crack spread was $12.64 per barrel for 2016 compared to $17.02 per barrel for2015.
• The average WTI Cushing to WTI Midland spread for 2016 was $0.15 per barrel compared to $0.39 per barrel for 2015. Theaverage WTI Cushing to WTS spread for 2016 was $0.73 per barrel compared to $(0.06) per barrel for 2015. The average Brent toWTI Cushing spread for 2016 was $0.21 per barrel compared to $3.54 per barrel for 2015.
• The average RINs cost effect on refinery operating margin was $0.55 per barrel in 2016, compared to $0.42 per barrel in2015.
• The contango environment in 2016 created an average cost of crude benefit of $1.24 per barrel, compared to an average cost ofcrude benefit of $1.01 per barrel in 2015.
• During 2016, we generated cash available for distribution of $0.40 per unit compared to $2.81 per unit during2015.
Major Influences on Results of Operations
Earnings and cash flows are primarily affected by the difference between refined product prices and the prices for crude oil and otherfeedstocks. These prices depend on numerous factors beyond our control, including the supply of, and demand for, crude oil, gasoline andother refined products which, in turn, depend on, among other factors, changes in domestic and foreign economies, weather conditions,domestic and foreign political affairs, production levels, the availability of imports, the marketing of competitive fuels and governmentregulation. While our sales and operating revenues fluctuate significantly with movements in crude oil and refined product prices, it is thespread between crude oil and refined product prices, not necessarily fluctuations in those prices, that affects our earnings.
In order to measure our operating performance, we compare our per barrel refinery operating margin to certain industry benchmarks.We calculate this margin for the Big Spring refinery by dividing the refinery’s gross margin by its throughput
31

Table of Contents
volumes. Gross margin is the difference between net sales and cost of sales (exclusive of certain inventory adjustments and inclusive ofRINs costs).
We compare our refinery’s operating margin to the Gulf Coast 3/2/1 crack spread, which is intended to approximate the refinery’scrude slate and product yield. A Gulf Coast 3/2/1 crack spread is calculated assuming that three barrels of WTI Cushing crude oil areconverted, or cracked, into two barrels of Gulf Coast conventional gasoline and one barrel of Gulf Coast ultra-low sulfur diesel.
Our refinery is capable of processing substantial volumes of sour crude oil, which has historically cost less than intermediate and sweetcrude oils. We measure the cost advantage of refining sour crude oil by calculating the difference between the price of WTI Cushing crudeoil and the price of WTS, a medium, sour crude oil. We refer to this differential as the WTI Cushing/WTS, or sweet/sour, spread. Awidening of the sweet/sour spread can favorably influence the operating margin for our refinery. The Big Spring refinery’s crude oil inputis primarily comprised of WTS and WTI Midland.
In addition, the location of the Big Spring refinery near Midland, the largest origination terminal for West Texas crude oil, providesreliable crude sourcing with a relatively low transportation cost. Additionally, we have the ability to source locally produced crude at BigSpring by truck, which enables us to better control quality and eliminate the cost of transporting our crude supply from Midland. The WTICushing less WTI Midland spread represents the differential between the average per barrel price of WTI Cushing crude oil and theaverage per barrel price of WTI Midland crude oil. A widening of the WTI Cushing less WTI Midland spread will favorably influence theoperating margin for our refinery. Alternatively, a narrowing of this differential will have an adverse effect on our operating margin.
Global product prices are influenced by the price of Brent crude which is a global benchmark crude. Global product prices influenceproduct prices in the U.S. As a result, our refinery is influenced by the spread between Brent crude and WTI Cushing. The Brent less WTICushing spread represents the differential between the average per barrel price of Brent crude oil and the average per barrel price of WTICushing crude oil. A widening of the spread between Brent and WTI Cushing will favorably influence the operating margin for ourrefinery.
Our results of operations are also significantly affected by our refinery’s operating costs, particularly the cost of natural gas used forfuel and the cost of electricity. Natural gas prices have historically been volatile. Typically, electricity prices fluctuate with natural gasprices.
Demand for gasoline products is generally higher during summer months than during winter months due to seasonal increases inhighway traffic. As a result, our operating results for the first and fourth calendar quarters are generally lower than those for the second andthird calendar quarters. The effects of seasonal demand for gasoline are partially offset by seasonality in demand for diesel, which in ourregion is generally higher in winter months as east-west trucking traffic moves south to avoid winter conditions on northern routes.
Safety, reliability and the environmental performance of our refinery is critical to our financial performance. The financial impact ofplanned downtime, such as a turnaround or major maintenance project, is mitigated through a diligent planning process that considersexpectations for product availability, margin environment and the availability of resources to perform the required maintenance.
The nature of our business requires us to maintain crude oil and refined product inventories. Crude oil and refined products arecommodities, and we have no control over the changing market value of these inventories. Because our inventory is valued at the lower ofcost or market value under the last-in, first-out (“LIFO”) inventory valuation methodology, price fluctuations generally have little effect onour financial results.
Factors Affecting Comparability
Our financial condition and operating results over the three-year period ended December 31, 2016 have been influenced by thefollowing factors, which are fundamental to understanding comparisons of our period-to-period financial performance.
Maintenance and Turnaround Impact on Crude Oil Throughput
During 2016, refinery throughput was reduced as a result of a reformer regeneration during the first quarter of 2016 and third quarter of2016. Additionally, throughput was reduced as a result of a catalyst replacement for our diesel hydrotreater unit in the first quarter of 2016and unplanned downtime during the second quarter of 2016 due to a power outage caused by inclement weather, which affected multipleunits.
During the second quarter of 2014, we completed both the planned major turnaround and the vacuum tower project at the refinery,which increased our distillate yield, improved energy efficiency and allowed us to better optimize our crude slate. Due to these events,refinery throughput and earnings were reduced during 2014.
32

Table of Contents
Results of Operations
The period-to-period comparisons of our results of operations have been prepared using the historical periods included in ourconsolidated financial statements. We refer to our financial statement line items in the explanation of our period-to-period changes inresults of operations. Below are general definitions of what those line items include and represent.
Net sales. Net sales consist principally of sales of refined petroleum products, and are mainly affected by refined product prices,changes to the product mix and volume changes caused by operations. Product mix refers to the percentage of production represented byhigher value motor fuels, such as gasoline, rather than lower value finished products.
Cost of sales. Cost of sales includes principally crude oil, blending materials and RINs, other raw materials and transportation costs,which include costs associated with our crude oil and product pipelines. Cost of sales excludes depreciation and amortization, which ispresented separately in the consolidated statements of operations.
Direct operating expenses. Direct operating expenses include costs associated with the actual operations of the refinery, such as energyand utility costs, routine maintenance, labor, insurance and environmental compliance costs.
Selling, general and administrative expenses. Selling, general and administrative expenses, or SG&A, primarily include corporateoverhead costs and marketing expenses. These costs also include actual costs incurred by Alon Energy and allocated to us.
Depreciation and amortization. Depreciation and amortization represents an allocation of the cost of capital assets to expense withinthe consolidated statements of operations. The cost is expensed based on the straight-line method over the estimated useful life of therelated asset. Depreciation and amortization also includes deferred turnaround and catalyst replacement costs. Turnaround and catalystreplacement costs are currently deferred and amortized on a straight-line basis beginning the month after the completion of the turnaroundand ending immediately prior to the next scheduled turnaround.
Operating income. Operating income represents our net sales less our total operating costs and expenses.
Interest expense. Interest expense includes interest expense, letters of credit, financing costs associated with crude oil purchases,financing fees, and amortization of both original issuance discount and deferred debt issuance costs but excludes capitalized interest.
33

Table of Contents
ALON USA PARTNERS, LP AND SUBSIDIARIES CONSOLIDATED
Summary Financial Tables. The following tables provide summary financial data and selected key operating statistics for the yearsended December 31, 2016, 2015 and 2014. The following data should be read in conjunction with our consolidated financial statements andthe notes thereto included elsewhere in this Annual Report on Form 10-K.
Year Ended December 31,
2016 2015 2014
(dollars in thousands, except per unit data, per barrel data
and pricing statistics)STATEMENTS OF OPERATIONS DATA: Net sales (1) $ 1,807,732 $ 2,157,191 $ 3,221,373Operating costs and expenses:
Cost of sales 1,588,219 1,767,291 2,823,694Direct operating expenses 97,338 98,929 105,760Selling, general and administrative expenses 31,983 32,353 26,446Depreciation and amortization 57,524 55,112 47,494
Total operating costs and expenses 1,775,064 1,953,685 3,003,394Operating income 32,668 203,506 217,979Interest expense (37,128) (45,987) (46,706)Other income, net 593 52 646Income (loss) before state income tax expense (3,867) 157,571 171,919State income tax expense 537 672 2,784Net income (loss) $ (4,404) $ 156,899 $ 169,135Earnings (loss) per unit $ (0.07) $ 2.51 $ 2.71Weighted average common units outstanding (in thousands) 62,516 62,509 62,505Cash distribution per unit $ 0.37 $ 3.43 $ 2.02CASH FLOW DATA: Net cash provided by (used in):
Operating activities $ 78,115 $ 239,745 $ 196,504Investing activities (33,351) (29,550) (74,800)Financing activities (104,193) (183,567) (168,962)
OTHER DATA: Adjusted EBITDA (2) $ 90,785 $ 258,670 $ 266,119Capital expenditures 23,587 23,566 16,064Capital expenditures for turnarounds and catalysts 9,764 5,984 58,736KEY OPERATING STATISTICS: Per barrel of throughput:
Refinery operating margin (3) $ 8.28 $ 14.43 $ 16.69Refinery direct operating expense (4) 3.73 3.62 4.39
PRICING STATISTICS: Crack spreads (per barrel):
Gulf Coast 3/2/1 $ 12.64 $ 17.02 $ 14.52WTI Cushing crude oil (per barrel) $ 43.24 $ 48.68 $ 93.10Crude oil differentials (per barrel):
WTI Cushing less WTI Midland $ 0.15 $ 0.39 $ 6.93WTI Cushing less WTS 0.73 (0.06) 6.04Brent less WTI Cushing 0.21 3.54 6.19
Product price (dollars per gallon): Gulf Coast unleaded gasoline $ 1.34 $ 1.56 $ 2.49Gulf Coast ultra-low sulfur diesel 1.32 1.58 2.71Natural gas (per MMBtu) 2.55 2.63 4.26
34

Table of Contents
As of December 31,
2016 2015 (dollars in thousands)BALANCE SHEET DATA (end of period): Cash and cash equivalents $ 73,524 $ 132,953Working capital (73,563) (53,804)Total assets 695,637 748,584Total debt 236,319 292,082Total debt less cash and cash equivalents 162,795 159,129Total partners’ equity 103,503 130,957
THROUGHPUT AND PRODUCTION DATA:For the Year Ended December 31,
2016 2015 2014
bpd % bpd % bpd %Refinery throughput:
WTS crude 31,000 43.4 33,647 44.9 30,323 45.9WTI crude 36,862 51.7 38,632 51.6 32,429 49.1Blendstocks 3,501 4.9 2,627 3.5 3,281 5.0
Total refinery throughput (5) 71,363 100.0 74,906 100.0 66,033 100.0Refinery production:
Gasoline 35,220 49.4 37,519 50.0 32,932 49.7Diesel/jet 25,739 36.1 27,651 36.8 23,252 35.1Asphalt 2,767 3.9 2,639 3.5 2,716 4.1Petrochemicals 3,872 5.4 4,579 6.1 3,756 5.7Other 3,740 5.2 2,678 3.6 3,565 5.4
Total refinery production (6) 71,338 100.0 75,066 100.0 66,221 100.0Refinery utilization (7) 96.1% 99.0% 97.2%_____________________
(1) Includes sales to related parties of $307,497, $358,194 and $563,008 for the years ended December 31, 2016, 2015 and 2014,respectively.
(2) See “Reconciliation of Amounts Reported Under Generally Accepted Accounting Principles” for information regarding ourdefinition of Adjusted EBITDA, its limitations as an analytical tool and a reconciliation of net income to Adjusted EBITDA for theperiods presented.
(3) Refinery operating margin is a per barrel measurement calculated by dividing the margin between net sales and cost of sales(exclusive of certain inventory adjustments) by the refinery’s throughput volumes. Industry-wide refining results are driven andmeasured by the margins between refined product prices and the prices for crude oil, which are referred to as crack spreads. Wecompare our refinery operating margin to these crack spreads to assess our operating performance relative to other participants inour industry.
The refinery operating margin for the years ended December 31, 2016, 2015 and 2014 excludes gains (losses) related to inventoryadjustments of $3,183, $(4,746) and $(4,650), respectively.
(4) Refinery direct operating expense is a per barrel measurement calculated by dividing direct operating expenses by total throughputvolumes.
(5) Total refinery throughput represents the total barrels per day of crude oil and blendstock inputs in the refinery productionprocess.
(6) Total refinery production represents the barrels per day of various refined products produced from processing crude and otherrefinery feedstocks through the crude units and other conversion units.
(7) Refinery utilization represents average daily crude oil throughput divided by crude oil capacity, excluding planned periods ofdowntime for maintenance and turnarounds.
35

Table of Contents
Year Ended December 31, 2016 Compared to Year Ended December 31, 2015
Net sales. Net sales for the year ended December 31, 2016 were $1,807.7 million, compared to $2,157.2 million for the year endedDecember 31, 2015, a decrease of $349.5 million, or 16.2%. This decrease was primarily due to lower refined product prices and lowerrefinery throughput. The average per gallon price of Gulf Coast gasoline for the year ended December 31, 2016 decreased $0.22, or 14.1%,to $1.34, compared to $1.56 for the year ended December 31, 2015. The average per gallon price of Gulf Coast ultra-low sulfur diesel forthe year ended December 31, 2016 decreased $0.26, or 16.5%, to $1.32, compared to $1.58 for the year ended December 31, 2015.
Refinery throughput for the year ended December 31, 2016 was 71,363 bpd, compared to 74,906 bpd for the year ended December 31,2015, a decrease of 4.7%. The reduced throughput at our refinery during the year ended December 31, 2016 was the result of a reformerregeneration during the first quarter of 2016 and third quarter of 2016. Additionally, throughput was reduced as a result of a catalystreplacement for our diesel hydrotreater unit in the first quarter of 2016 and unplanned downtime during the second quarter of 2016 due to apower outage caused by inclement weather, which affected multiple units.
Cost of Sales. Cost of sales for the year ended December 31, 2016 were $1,588.2 million, compared to $1,767.3 million for the yearended December 31, 2015, a decrease of $179.1 million, or 10.1%. This decrease was primarily due to reduced crude oil prices and lowerrefinery throughput. The average price of WTI Cushing decreased 11.2% to $43.24 per barrel for the year ended December 31, 2016 from$48.68 per barrel for the year ended December 31, 2015.
Direct Operating Expenses. Direct operating expenses for the year ended December 31, 2016 were $97.3 million, compared to $98.9million for the year ended December 31, 2015, a decrease of $1.6 million, or 1.6%.
Selling, General and Administrative Expenses. SG&A expenses for the year ended December 31, 2016 were $32.0 million, comparedto $32.4 million for the year ended December 31, 2015, a decrease of $0.4 million, or 1.2%.
Depreciation and Amortization. Depreciation and amortization for the year ended December 31, 2016 was $57.5 million, compared to$55.1 million for the year ended December 31, 2015, an increase of $2.4 million, or 4.4%.
Operating Income. Operating income was $32.7 million for the year ended December 31, 2016, compared to $203.5 million for theyear ended December 31, 2015, a decrease of $170.8 million, or 83.9%. This decrease was primarily due to lower refinery operating marginand lower refinery throughput. Refinery operating margin for the year ended December 31, 2016 was $8.28 per barrel, compared to $14.43per barrel for the year ended December 31, 2015. This decrease in operating margin was primarily due to a lower Gulf Coast 3/2/1 crackspread, a narrowing of the WTI Cushing to WTI Midland spread and increased RINs costs, partially offset by a widening of the WTICushing to WTS spread and an increased benefit from the contango market environment which reduced the cost of crude.
The average Gulf Coast 3/2/1 crack spread decreased 25.7% to $12.64 per barrel for the year ended December 31, 2016, compared to$17.02 per barrel for the year ended December 31, 2015. The average WTI Cushing to WTI Midland for the year ended December 31,2016 was $0.15 per barrel, compared to $0.39 per barrel for the year ended December 31, 2015. The average WTI Cushing to WTS spreadfor the year ended December 31, 2016 was $0.73 per barrel, compared to $(0.06) per barrel for the year ended December 31, 2015. Theaverage Brent to WTI Cushing spread for the year ended December 31, 2016 was $0.21 per barrel, compared to $3.54 per barrel for theyear ended December 31, 2015. The contango environment for the year ended December 31, 2016 created an average cost of crude benefitof $1.24 per barrel compared to an average cost of crude benefit of $1.01 per barrel for the year ended December 31, 2015. The averageRINs cost effect on refinery operating margin was $0.55 per barrel for the year ended December 31, 2016, compared to $0.42 per barrel forthe year ended December 31, 2015.
Interest Expense. Interest expense was $37.1 million for the year ended December 31, 2016, compared to $46.0 million for the yearended December 31, 2015, a decrease of $8.9 million, or 19.3%. This decrease was primarily due to the effect of crude oil prices movingfurther into contango on our supply and offtake agreements.
State Income Tax Expense. State income tax expense was $0.5 million for the year ended December 31, 2016, compared to $0.7million for the year ended December 31, 2015, a decrease of $0.2 million.
Net Income (Loss). Net loss for the year ended December 31, 2016 was $4.4 million, compared to net income of $156.9 million for theyear ended December 31, 2015, a decrease of $161.3 million. This decrease was attributable to the factors discussed above.
36

Table of Contents
Year Ended December 31, 2015 Compared to Year Ended December 31, 2014
Net sales. Net sales for the year ended December 31, 2015 were $2,157.2 million, compared to $3,221.4 million for the year endedDecember 31, 2014, a decrease of $1,064.2 million, or 33.0%. This decrease was primarily due to lower refined product prices, partiallyoffset by higher refinery throughput. The average per gallon price of Gulf Coast gasoline for the year ended December 31, 2015 decreased$0.93, or 37.3%, to $1.56, compared to $2.49 for the year ended December 31, 2014. The average per gallon price of Gulf Coast ultra-lowsulfur diesel for the year ended December 31, 2015 decreased $1.13, or 41.7%, to $1.58, compared to $2.71 for the year ended December31, 2014. Refinery throughput for the year ended December 31, 2015 was 74,906 bpd, compared to 66,033 bpd for the year endedDecember 31, 2014, an increase of 13.4%. During 2014, refinery throughput was reduced as we completed both the planned majorturnaround and the vacuum tower project.
Cost of Sales. Cost of sales for the year ended December 31, 2015 were $1,767.3 million, compared to $2,823.7 million for the yearended December 31, 2014, a decrease of $1,056.4 million, or 37.4%. This decrease was primarily due to reduced crude oil prices, partiallyoffset by higher refinery throughput. The average price of WTI Cushing decreased 47.7% to $48.68 per barrel for the year ended December31, 2015 from $93.10 per barrel for the year ended December 31, 2014.
Direct Operating Expenses. Direct operating expenses for the year ended December 31, 2015 were $98.9 million, compared to $105.8million for the year ended December 31, 2014, a decrease of $6.9 million, or 6.5%. This decrease was primarily due to lower utility costs.
Selling, General and Administrative Expenses. SG&A expenses for the year ended December 31, 2015 were $32.4 million, comparedto $26.4 million for the year ended December 31, 2014, an increase of $6.0 million, or 22.7%. This increase was primarily due to highercosts associated with operating leases at our refinery.
Depreciation and Amortization. Depreciation and amortization for the year ended December 31, 2015 was $55.1 million, compared to$47.5 million for the year ended December 31, 2014, an increase of $7.6 million, or 16.0%. This increase was primarily due to increasedamortization of turnaround and catalyst replacement costs during the year ended December 31, 2015 resulting from the completion of theplanned major turnaround during the second quarter of 2014.
Operating Income. Operating income was $203.5 million for the year ended December 31, 2015, compared to $218.0 million for theyear ended December 31, 2014, a decrease of $14.5 million, or 6.7%. This decrease was primarily due to lower refinery operating marginand lower SG&A expenses, partially offset by higher refinery throughput and lower utility costs. Refinery operating margin for the yearended December 31, 2015 was $14.43 per barrel, compared to $16.69 per barrel for the year ended December 31, 2014. This decrease inoperating margin was primarily due to the less favorable industry margin environment. The unfavorable contraction in the WTI Cushing toWTI Midland and the WTI Cushing to WTS spreads was greater than the improvement in the Gulf Coast 3/2/1 spread and the cost of crudebenefit from the market moving from backwardation into contango.
The average WTI Cushing to WTI Midland spread for the year ended December 31, 2015 was $0.39 per barrel, compared to $6.93 perbarrel for the year ended December 31, 2014. The average WTI Cushing to WTS spread for the year ended December 31, 2015 was $(0.06)per barrel, compared to $6.04 per barrel for the year ended December 31, 2014. The average Brent to WTI Cushing spread for the yearended December 31, 2015 was $3.54 per barrel, compared to $6.19 per barrel for the year ended December 31, 2014. The average GulfCoast 3/2/1 crack spread increased 17.2% to $17.02 per barrel for the year ended December 31, 2015, compared to $14.52 per barrel for theyear ended December 31, 2014. The contango environment for the year ended December 31, 2015 created an average cost of crude benefitof $1.01 per barrel compared to the backwardated environment creating an average cost of crude detriment of $0.73 per barrel for the yearended December 31, 2014.
Interest Expense. Interest expense was $46.0 million for the year ended December 31, 2015, compared to $46.7 million for the yearended December 31, 2014, a decrease of $0.7 million, or 1.5%.
State Income Tax Expense. State income tax expense was $0.7 million for the year ended December 31, 2015, compared to $2.8million for the year ended December 31, 2014, a decrease of $2.1 million, or 75.0%. This decrease was primarily due to the State of Texaspermanently reducing the Texas Margin Tax from 1.0% to 0.75% during 2015, which generated a deferred tax credit in the period.
Net Income. Net income for the year ended December 31, 2015 was $156.9 million, compared to $169.1 million for the year endedDecember 31, 2014, a decrease of $12.2 million, or 7.2%. This decrease was attributable to the factors discussed above.
37

Table of Contents
Liquidity and Capital Resources
Our primary sources of liquidity are cash on hand, cash generated from our operating activities, borrowings under our revolving creditfacility, inventory supply and offtake arrangement and other credit lines. Additionally, we have the ability to utilize a $60.0 million letter ofcredit facility through Alon Energy for our crude oil and product purchases.
We have an agreement with J. Aron for the supply of crude oil that supports the operations of the Big Spring refinery. Thisarrangement substantially reduces our physical inventories and the associated need to issue letters of credit to support crude oil purchases.In addition, the structure allows us to acquire crude oil without the constraints of a maximum facility size during periods of high crude oilprices.
We believe that the aforementioned sources of funds and other sources of capital available to us will be sufficient to satisfy theanticipated cash requirements associated with our existing operations for at least the next twelve months. However, future capitalexpenditures and other cash requirements could be higher than we currently expect as a result of various factors. Additionally, our ability togenerate sufficient cash from our operating activities depends on our future performance, which is subject to general economic, political,financial, competitive, and other factors beyond our control.
Depending upon conditions in the capital markets and other factors, we will from time to time consider the issuance of debt or equitysecurities, or other possible capital markets transactions, the proceeds of which could be used to refinance current indebtedness, extend orreplace our existing revolving credit facility or for other Partnership purposes.
Cash Flows
The following table sets forth our consolidated cash flows for the years ended December 31, 2016, 2015 and 2014:
Year Ended December 31,
2016 2015 2014 (dollars in thousands)Cash provided by (used in):
Operating activities $ 78,115 $ 239,745 $ 196,504Investing activities (33,351) (29,550) (74,800)Financing activities (104,193) (183,567) (168,962)
Net increase (decrease) in cash and cash equivalents $ (59,429) $ 26,628 $ (47,258)
Cash Flows Provided By Operating Activities
Net cash provided by operating activities was $78.1 million for the year ended December 31, 2016 compared to $239.7 million for theyear ended December 31, 2015. The decrease in net cash provided by operating activities of $161.6 million was primarily due to decreasednet income after adjusting for non-cash items of $158.6 million, increased cash used for inventories of $24.0 million, lower cash collectedon accounts receivable of $36.5 million and increased cash used on other non-current liabilities of $1.5 million, partially offset by reducedcash used for accounts payable and accrued liabilities of $50.5 million and reduced cash used for non-current assets of $9.1 million.
Net cash provided by operating activities was $239.7 million for the year ended December 31, 2015 compared to $196.5 million for theyear ended December 31, 2014. The increase in net cash provided by operating activities of $43.2 million was primarily due to reducedcash used for accounts payable and accrued liabilities of $86.9 million, reduced cash used for inventories of $5.7 million and reduced cashused for prepaid expenses and other current assets of $6.9 million, partially offset by lower net income after adjusting for non-cash items of$5.8 million, lower cash collected on accounts receivable of $50.0 million and reduced cash provided by other non-current liabilities of$9.8 million.
Cash Flows Used In Investing Activities
Net cash used in investing activities was $33.4 million for the year ended December 31, 2016 compared to $29.6 million for the yearended December 31, 2015. The increase in net cash used in investing activities of $3.8 million was due to higher capital expenditures forturnarounds and catalysts of $3.8 million related to a catalyst replacement for our diesel hydrotreater unit in the first quarter of 2016.
38

Table of Contents
Net cash used in investing activities was $29.6 million for the year ended December 31, 2015 compared to $74.8 million for the yearended December 31, 2014. The decrease in net cash used in investing activities of $45.2 million was primarily due to a reduction in capitalexpenditures for turnarounds and catalysts of $52.8 million, partially offset by an increase in capital expenditures of $7.5 million. Thedecrease in capital expenditures for turnarounds and catalysts is related to the completion of the planned major turnaround at our refineryduring 2014.
Cash Flows Used In Financing Activities
Net cash used in financing activities was $104.2 million for the year ended December 31, 2016 compared to $183.6 million for the yearended December 31, 2015. The decrease in net cash used in financing activities of $79.4 million was primarily due to lower distributions tounitholders of $191.3 million, partially offset by reduced proceeds from RINs financing transactions of $63.7 million and increasedrepayments on our revolving credit facility of $50.0 million for the year ended December 31, 2016 compared to the year ended December31, 2015.
Net cash used in financing activities was $183.6 million for the year ended December 31, 2015 compared to $169.0 million for the yearended December 31, 2014. The increase in net cash used in financing activities of $14.6 million was primarily due to higher distributions tounitholders of $88.1 million, partially offset by increased proceeds from RINs financing transactions of $40.3 million and reducedrepayments on our revolving credit facility of $35.0 million for the year ended December 31, 2015 compared to the year ended December31, 2014.
Indebtedness
Partnership Term Loan Credit Facility. In November 2012, we entered into a $250.0 million term loan (the “Partnership Term Loan”).The Partnership Term Loan requires principal payments of $2.5 million per annum paid in quarterly installments until maturity inNovember 2018. The Partnership Term Loan bears interest at a rate equal to the sum of (i) the Eurodollar rate (with a floor of 1.25% perannum) plus (ii) a margin of 8.00% per annum. Based on Eurodollar market rates at December 31, 2016, the interest rate was 9.25% perannum.
The Partnership Term Loan is secured by a first priority lien on all of our fixed assets and other specified property, as well as on ourgeneral partner interest held by the General Partner, and a second lien on our cash, accounts receivables, inventories and related assets. ThePartnership Term Loan contains restrictive covenants, such as restrictions on liens, mergers, consolidations, sales of assets, additionalindebtedness, different businesses, certain lease obligations and certain restricted payments. The Partnership Term Loan does not containany maintenance financial covenants.
At December 31, 2016 and 2015, the Partnership Term Loan had an outstanding balance, net of unamortized issuance costs andissuance discount, of $236.3 million and $237.1 million, respectively.
Revolving Credit Facility. We have a $240.0 million revolving credit facility (the “Revolving Credit Facility”) that will mature inMarch 2019. The Revolving Credit Facility can be used both for borrowings and the issuance of letters of credit subject to a limit of thelesser of the facility amount or the borrowing base amount under the facility. Borrowings under the Revolving Credit Facility bear interestat the Eurodollar rate plus 3.00% per annum.
The Revolving Credit Facility is secured by a first lien on our cash, accounts receivables, inventories and related assets and a secondlien on our fixed assets and other specified property. The Revolving Credit Facility contains maintenance financial covenants. AtDecember 31, 2016, we were in compliance with these covenants.
At December 31, 2016, there were no outstanding borrowings under our Revolving Credit Facility, compared to borrowings of $55.0million at December 31, 2015. At December 31, 2016 and 2015, we had letters of credit outstanding of $100.6 million and $48.6 million,respectively.
Capital Spending
Each year the board of directors of our General Partner approves capital projects, including sustaining maintenance, regulatory andplanned turnaround and catalyst projects that our management is authorized to undertake in our annual capital budget. Additionally, ourmanagement assesses opportunities for growth and profit improvement projects on an ongoing basis and any related projects require furtherapproval from the board of directors of our General Partner. Our total capital expenditure plan for 2017 is $46.0 million, which includesexpenditures for catalysts and turnarounds and approximately $14.0 million of special regulatory projects.
39

Table of Contents
Our estimated capital expenditures are subject to change due to unanticipated increases/decreases in the cost, scope and completiontime for our capital projects. For example, we may experience increases/decreases in labor or equipment costs necessary to comply withgovernment regulations or to complete projects that sustain or improve the profitability of our refinery.
Contractual Obligations
Information regarding our known contractual obligations of the types described below as of December 31, 2016 is set forth in thefollowing table:
Payments Due by Period
Contractual Obligations Less than
1 Year 1 - 3 Years 3 - 5 Years More Than
5 Years Total
(dollars in thousands) Long-term debt obligations $ 2,500 $ 237,500 $ — $ — $ 240,000Operating lease obligations 18,484 18,500 6,128 3,883 46,995Pipelines and terminals agreements (1) 43,425 59,597 33,869 8,930 145,821Other commitments (2) 3,741 7,482 4,676 — 15,899
Total obligations $ 68,150 $ 323,079 $ 44,673 $ 12,813 $ 448,715_____________________
(1) Balances represent the minimum committed volume multiplied by the tariff and terminal rates pursuant to the terms of thePipelines and Terminals Agreement with Holly Energy Partners, LP, as well as our minimum requirements with Sunoco Pipeline,LP, Centurion Pipeline L.P. and Navigator Energy Services, LLC.
(2) Other commitments include refinery maintenance servicescosts.
As of December 31, 2016, we did not have any material capital lease obligations or any agreements to purchase goods or services,other than those included in the table above, that were binding on us.
Off-Balance Sheet Arrangements
We have no material off-balance sheet arrangements.
Critical Accounting Policies
The preparation of financial statements in conformity with U.S. GAAP requires management to select appropriate accounting policiesand to make estimates and assumptions that affect the reported amounts in the consolidated financial statements and accompanying notes.See Note 2 - Summary of Significant Accounting Policies, in the Notes to Consolidated Financial Statements, for descriptions of oursignificant accounting policies. Certain of these accounting policies involve judgments and uncertainties to such an extent that there is areasonable likelihood that materially different amounts would have been reported under different conditions or if different assumptions hadbeen used. Actual results could differ significantly from those estimates. We believe that the following discussion addresses our mostcritical accounting policies, which are those that are most important to the presentation of our financial condition and results of operationsand require management’s most difficult, subjective and complex judgments.
LIFO Inventory Valuation. Crude oil, refined products and blendstocks (including crude oil consignment inventory) are priced at thelower of cost or market. Cost is determined using the LIFO valuation method. Under the LIFO valuation method, we charge the mostrecent acquisition costs to cost of sales, and we value inventories at the earliest acquisition costs. We selected this method because webelieve it more accurately reflects the cost of our current sales. If the market value of inventory is less than the inventory cost on a LIFObasis, then the inventory is written down to market value. An inventory write-down to market value results in a non-cash accountingadjustment, decreasing the value of our inventory and increasing our cost of sales. In addition, the use of the LIFO inventory method mayresult in increases or decreases to cost of sales in years when inventory volumes decline and result in charging cost of sales with LIFOinventory costs generated in prior periods.
Environmental and Other Loss Contingencies. We expense or capitalize environmental expenditures depending on their futureeconomic benefit. We expense costs that relate to an existing condition caused by past operations and that have no future economic benefit.Liabilities for expenditures of a non-capital nature are recorded when environmental assessment and/or remediation is probable, and thecosts can be reasonably estimated. Environmental liabilities represent the estimated costs to investigate and remediate contamination at ourproperties. These estimates are based on internal and third-party
40

Table of Contents
assessments of the extent of the contaminations, the selected remediation technology and review of applicable environmental regulations.We do not discount environmental liabilities to their present value unless payments are fixed or reliably determinable. At December 31,2016, for those payments we considered fixed or reliably determinable, payments were discounted at a 2.62% rate. We recordenvironmental liabilities without considering potential recoveries from third parties. Recoveries of environmental remediation costs fromthird parties are recorded as assets when receipt is deemed probable. We update our estimates to reflect changes in factual information,available technology or applicable laws and regulations. Substantially all amounts accrued are expected to be paid out over the next 15years. The amount of future expenditures for environmental remediation obligations is impossible to determine with any degree ofreliability.
Turnarounds and Catalysts Costs. Our refinery units require regular major maintenance and repairs that are commonly referred to as“turnarounds.” Catalysts used in certain refinery process units are typically replaced in conjunction with planned turnarounds. The requiredfrequency of the maintenance varies by unit and by catalyst but generally is every three to five years. In order to minimize downtime duringturnarounds, we often utilize contract labor as well as our maintenance personnel on a continuous 24 hour basis. Whenever possible,turnarounds are scheduled so that some units continue to operate while others are down for maintenance. We record the turnaround andcatalysts costs as deferred charges and amortize the deferred costs on a straight-line basis over the period of time estimated until the nextturnaround occurs (generally 3 to 5 years).
Impairment of Long-Lived Assets. Our long-lived assets and certain identifiable intangible assets are reviewed for impairmentwhenever events or changes in circumstances indicate that the carrying amount of such assets may not be recoverable. An impairment losswould be recorded if it is determined that the assets are not recoverable and the carrying amount of the asset exceeds its fair value, which isbased on discounted cash flows.
In order to test our long-lived assets for recoverability, we must make estimates of projected cash flows related to the asset beingevaluated that include, but are not limited to, assumptions about the use or disposition of the asset, its estimated remaining life and futureexpenditures necessary to maintain its existing service potential. In order to determine fair value, management must make certain estimatesand assumptions including, among other things, an assessment of market conditions, projected cash flows, investment rates, interest/equityrates and growth rates that could significantly impact the estimated fair value of the asset being tested for impairment.
Allocation of Costs. We are a subsidiary of Alon Energy and are operated as a component of the integrated operations of Alon Energyand its other subsidiaries. As such, the executive officers of Alon Energy, who are employed by another subsidiary of Alon Energy, alsoserve as executive officers of the General Partner and Alon Energy’s other subsidiaries.
Alon Energy performs general corporate and administrative services and functions for us and their other subsidiaries, which includeaccounting, treasury, cash management, tax, information technology, insurance administration and claims processing, legal, environmental,risk management, audit, payroll and employee benefit processing, and internal audit services. Alon Energy allocates the expenses actuallyincurred in performing these services to us based primarily on the estimated amount of time the individuals performing such servicesdevote to our business and affairs relative to the amount of time they devote to the business and affairs of Alon Energy’s other subsidiaries.The management of Alon Energy and the General Partner consider these allocations to be reasonable, however, these allocations may notbe indicative of the cost of future operations or the amount of future allocations.
Compensation related expenses for Alon Energy employees working in our operations are allocated to us based on percentagesdetermined by management of Alon Energy and the General Partner to be reasonable and in line with the nature of an individual’s roles andresponsibilities.
Insurance costs, included in direct operating expenses, are allocated to us based on estimated insurance premiums on a stand-alonebasis relative to Alon Energy’s total insurance premium.
If any of these shared costs were to change, or the method by which these shared costs are allocated changes, additional expenses couldbe allocated to us.
41

Table of Contents
Reconciliation of Amounts Reported Under Generally Accepted Accounting Principles
Reconciliation of Adjusted EBITDA to amounts reported under generally accepted accounting principles in financial statements.
Adjusted EBITDA represents earnings before state income tax expense, interest expense and depreciation and amortization. AdjustedEBITDA is not a recognized measurement under GAAP; however, the amounts included in Adjusted EBITDA are derived from amountsincluded in our consolidated financial statements. Our management believes that the presentation of Adjusted EBITDA is useful toinvestors because it is frequently used by securities analysts, investors, and other interested parties in the evaluation of companies in ourindustry. In addition, our management believes that Adjusted EBITDA is useful in evaluating our operating performance compared to thatof other companies in our industry because the calculation of Adjusted EBITDA generally eliminates the effects of state income taxexpense, interest expense and the accounting effects of capital expenditures and acquisitions, items that may vary for different companiesfor reasons unrelated to overall operating performance.
Adjusted EBITDA has limitations as an analytical tool, and you should not consider it in isolation, or as a substitute for analysis of ourresults as reported under GAAP. Some of these limitations are:
• Adjusted EBITDA does not reflect our cash expenditures or future requirements for capital expenditures or contractualcommitments;
• Adjusted EBITDA does not reflect the interest expense or the cash requirements necessary to service interest or principalpayments on our debt;
• Adjusted EBITDA does not reflect changes in or cash requirements for our working capital needs;and
• Our calculation of Adjusted EBITDA may differ from EBITDA calculations of other companies in our industry, limiting itsusefulness as a comparative measure.
Because of these limitations, Adjusted EBITDA should not be considered a measure of discretionary cash available to us to invest inthe growth of our business. We compensate for these limitations by relying primarily on our GAAP results and using Adjusted EBITDAonly supplementally.
The following table reconciles net income (loss) to Adjusted EBITDA for the years ended December 31, 2016, 2015 and 2014:
Year Ended December 31,
2016 2015 2014 (dollars in thousands)Net income (loss) $ (4,404) $ 156,899 $ 169,135State income tax expense 537 672 2,784Interest expense 37,128 45,987 46,706Depreciation and amortization 57,524 55,112 47,494Adjusted EBITDA $ 90,785 $ 258,670 $ 266,119
42

Table of Contents
ITEM 7A. QUANTITATIVE AND QUALITATIVE DISCLOSURES ABOUT MARKET RISK.
Changes in commodity prices, purchased fuel prices and interest rates are our primary sources of market risk. Alon Energy’s riskmanagement committee oversees all activities associated with the identification, assessment and management of our market risk exposure.
Commodity Price Risk
We are exposed to market risks related to the volatility of crude oil and refined product prices, as well as volatility in the price ofnatural gas used in our refinery operations. Our financial results can be affected significantly by fluctuations in these prices, which dependon many factors, including demand for crude oil, gasoline and other refined products, changes in the economy, worldwide productionlevels, worldwide inventory levels and governmental regulatory initiatives. Alon Energy’s risk management strategy identifiescircumstances in which we may utilize the commodity futures market to manage risk associated with these price fluctuations.
In order to manage the uncertainty relating to inventory price volatility, we have consistently applied a policy of maintaininginventories at or below a targeted operating level. In the past, circumstances have occurred, such as timing of crude oil cargo deliveries,turnaround schedules or shifts in market demand that have resulted in variances between our actual inventory level and our desired targetlevel. Upon the review and approval of Alon Energy’s risk management committee, we may utilize the commodity futures market tomanage these anticipated inventory variances.
We maintain inventories of crude oil, refined products and blendstocks, the values of which are subject to wide fluctuations in marketprices driven by world economic conditions, regional and global inventory levels and seasonal conditions. At December 31, 2016, themarket value of our refined products and blendstock inventories was less than inventories valued on a LIFO cost basis which resulted in alower of cost or market reserve of $6.2 million. At December 31, 2016, the market value of our crude oil inventories exceeded LIFO costs,net of the fair value hedged item, by $5.2 million.
As of December 31, 2016, we held 0.4 million barrels of refined products and blendstock inventories and 0.4 million barrels of crudeoil inventories valued under the LIFO valuation method. If the market value of refined products and blendstock inventories would havebeen $1.00 per barrel lower, the lower of cost or market recovery recorded for the year ended December 31, 2016 would have been $0.4million lower. If the market value of crude oil would have been $1.00 per barrel lower, the market value of crude oil inventories wouldhave exceeded LIFO costs, net of the fair value hedged item, by $4.8 million.
All commodity derivative contracts are recorded at fair value and any changes in fair value between periods is recorded in the profitand loss section of our consolidated financial statements. “Forwards” represent physical trades for which pricing and quantities have beenset, but the physical product delivery has not occurred by the end of the reporting period. “Futures” represent trades which have beenexecuted on the New York Mercantile Exchange which have not been closed or settled at the end of the reporting period. A “long”represents an obligation to purchase product and a “short” represents an obligation to sell product.
43

Table of Contents
The following table provides information about our commodity derivative instruments as of December 31, 2016:
Description of Activity
ContractVolume
(in barrels)
Wtd AvgPurchase
Price/BBL Wtd Avg Sales
Price/BBL Contract Value Market Value Gain (Loss)
(in thousands)
Forwards-short (Crude) (176,995) $ — $ 52.17 $ (9,233) $ (9,508) $ (275)Forwards-long (Gasoline) 26,205 64.97 — 1,702 1,806 104Forwards-short (Distillate) (186,601) — 70.33 (13,123) (14,093) (970)Forwards-long (Jet) 4,398 65.31 — 287 304 17Forwards-long (Slurry) 601 42.84 — 26 28 2Forwards-long (Catfeed) 43,550 61.57 — 2,682 2,870 188Forwards-long (Slop) 28,931 42.17 — 1,220 1,292 72Forwards-short (Propane) (50,000) — 25.58 (1,279) (1,481) (202)Forwards-long (Butane) 52,595 41.90 — 2,204 2,549 345Futures-long (Crude) 21,000 53.18 — 1,117 1,128 11Futures-short (Crude) (21,000) — 52.83 (1,109) (1,128) (19)Futures-short (Gasoline) (55,000) — 66.49 (3,657) (3,860) (203)Futures-long (Distillate) 138,000 70.84 — 9,776 10,017 241
Interest Rate Risk
As of December 31, 2016, our outstanding debt balance of $240.0 million, excluding discounts and issuance costs, was subject tofloating interest rates, all of which was charged interest at the Eurodollar rate (with a floor of 1.25%) plus a margin of 8.00%.
An increase of 1% in the Eurodollar rate on indebtedness would result in an increase in our interest expense of approximately $1.1million per year.
ITEM 8. FINANCIAL STATEMENTS AND SUPPLEMENTARY DATA.
The Consolidated Financial Statements are included as an annex of this Annual Report on Form 10-K. See the Index to ConsolidatedFinancial Statements on page F-1.
ITEM 9. CHANGES IN AND DISAGREEMENTS WITH ACCOUNTANTS ON ACCOUNTING AND FINANCIALDISCLOSURE.
None.
ITEM 9A. CONTROLS AND PROCEDURES.
Disclosure Controls and Procedures
Our management has evaluated, with the participation of our principal executive and principal financial officers, the effectiveness ofthe design and operation of our disclosure controls and procedures (as defined in Rules 13a-15(e) and 15d-15(e) under the SecuritiesExchange Act of 1934 as amended (the “Exchange Act”)) as of the end of the period covered by this report, and has concluded that ourdisclosure controls and procedures were effective as of December 31, 2016 to provide reasonable assurance that information required to bedisclosed by us in the reports that we file or furnish under the Exchange Act is recorded, processed, summarized and reported, within thetime periods specified in the SEC’s rules and forms including, without limitation, controls and procedures designed to provide reasonableassurance that information required to be disclosed by us in the reports that we file or furnish under the Exchange Act is accumulated andcommunicated to our management, including our principal executive and principal financial officers, as appropriate to allow timelydecisions regarding required disclosures and is recorded, processed, summarized and reported within the time periods specified in the rulesand forms of the SEC.
Management Report on Internal Control over Financial Reporting
Our management is responsible for establishing and maintaining adequate “internal control over financial reporting” (as defined inRule 13a-15(f) under the Exchange Act) for the Partnership. The Partnership evaluated the effectiveness of its internal control overfinancial reporting based on the framework in the 2013 Internal Control - Integrated Framework issued by the Committee of SponsoringOrganizations of the Treadway Commission (“COSO”). Based on that evaluation, our management has concluded that the Partnership’sinternal control over financial reporting was effective as of December 31, 2016.
The independent registered public accounting firm of KPMG LLP, as auditors of our consolidated financial statements, has issued anattestation report on the effectiveness of our internal control over financial reporting, included with the Consolidated Financial Statementsas an annex of this Annual Report on Form 10-K.
Changes in Internal Control over Financial Reporting
There has been no change in our internal control over financial reporting during the quarter ended December 31, 2016 that hasmaterially affected, or is reasonably likely to materially affect, our internal control over financial reporting.
ITEM 9B. OTHER INFORMATION.
None.

44

Table of Contents
PART III
ITEM 10. DIRECTORS, EXECUTIVE OFFICERS AND CORPORATE GOVERNANCE.
We are managed and operated by the board of directors and executive officers of our General Partner, Alon USA Partners GP, LLC, anindirect subsidiary of Alon Energy. Our General Partner manages our operations and activities subject to the terms and conditions specifiedin our partnership agreement. Alon Energy owns, directly or indirectly, 81.6% of our outstanding common units. The operations of ourGeneral Partner in its capacity as general partner are managed by its board of directors. Our unitholders are not entitled to elect our generalpartner or its directors or otherwise directly participate in our management or operations. As a result of owning our General Partner, AlonEnergy has the right to appoint all of the members of the board of directors of our General Partner, including all of our General Partner’sindependent directors. Eitan Raff, Sheldon Stein, Ella Ruth Gera and Yeshayahu Pery currently serve as our independent directors. Ourdirectors serve until the earlier of their resignation or removal.
Actions by our General Partner that are made in its individual capacity are made by Alon Energy as the owner of the sole member ofour General Partner and not by the board of directors of our General Partner. Our General Partner is not elected by our unitholders and isnot subject to re-election on a regular basis in the future. The officers of our General Partner manage the day-to-day affairs of our business.
Whenever our General Partner makes a determination or takes or declines to take an action in its individual, rather than representative,capacity, it is entitled to make such determination or to take or decline to take such other action free of any fiduciary duty or obligationwhatsoever to us, any limited partner or assignee, and it is not required to act in good faith or pursuant to any other standard imposed by ourpartnership agreement or under Delaware law or any other law. Examples include the exercise of its call right or its registration rights, itsvoting rights with respect to the units it owns and its determination whether or not to consent to any merger or consolidation of thepartnership. In addition, our General Partner may decline to undertake any transaction that it believes would materially adversely affectAlon Energy’s ability to continue to comply with the covenants contained in its debt agreements. Decisions by our General Partner that aremade in its individual capacity will be made by Alon Energy, as the owner of the sole member of our General Partner, not by the board ofdirectors of our General Partner.
Limited partners are not entitled to elect the directors of our General Partner or directly or indirectly participate in our management oroperation. Our partnership agreement contains various provisions which replace default fiduciary duties with contractual corporategovernance standards. Our General Partner is liable, as a general partner, for all of our debts (to the extent not paid from our assets), exceptfor indebtedness or other obligations that are made expressly non-recourse to it. Our General Partner therefore may cause us to incurindebtedness or other obligations that are non-recourse to it.
As a publicly traded partnership, we qualify for, and are relying on, certain exemptions from the NYSE’s corporate governancerequirements, including:
• the requirement that a majority of the board of directors of our General Partner consist of independent directors;
• the requirement that the board of directors of our General Partner have a nominating/corporate governance committee that iscomposed entirely of independent directors; and
• the requirement that the board of directors of our General Partner have a compensation committee that is composed entirely ofindependent directors.
As a result of these exemptions, our General Partner’s board of directors does not consist of a majority of independent directors and ourGeneral Partner’s board of directors does not currently intend to establish a nominating/corporate governance committee or a compensationcommittee. Accordingly, unitholders do not have the same protections afforded to equity holders of companies that are subject to all of thecorporate governance requirements of the NYSE.
The board of directors of our General Partner currently consists of seven directors.
Audit Committee
The board of directors of our General Partner established an audit committee consisting of members who meet the independence andexperience standards established by the NYSE and the Exchange Act. The audit committee’s responsibilities are to review our accountingand auditing principles and procedures, accounting functions, financial reporting and internal controls; to oversee the qualifications,independence, appointment, retention, compensation and performance of our independent registered public accounting firm; to recommendto the board of directors the engagement of our independent registered public accounting firm; to review with the independent registeredpublic accounting firm the plans
45

Table of Contents
and results of the auditing engagement; and to oversee “whistle-blowing” procedures and certain other compliance matters. The auditcommittee currently consists of Messrs. Eitan Raff, Sheldon Stein and Ms. Ella Ruth Gera. Mr. Raff currently serves as the Chairman and isan audit committee financial expert.
Conflicts Committee
The conflicts committee of the board of directors of our General Partner consists entirely of independent directors. Pursuant to ourpartnership agreement, the board may, but is not required to, seek the approval of the conflicts committee whenever a conflict arisesbetween our General Partner or its affiliates, on the one hand, and us or any public unitholder, on the other, including any related partytransactions. The board of directors determines whether to seek approval of the conflicts committee on a case by case basis. The conflictscommittee will then determine whether the resolution of the conflict of interest is in the best interests of the partnership. The members ofthe conflicts committee may not be officers or employees of our General Partner or directors, officers or employees of its affiliates, andmust meet the independence standards established by the NYSE and the Exchange Act to serve on an audit committee of a board ofdirectors. The conflicts committee currently consists of Messrs. Eitan Raff and Sheldon Stein and Ms. Ella Ruth Gera, with Mr. Raffcurrently serving as the Chairman. Any matters approved by the conflicts committee will be conclusively deemed to be in our best interests,approved by all of our partners and not a breach by the General Partner of any duties it may owe us or our unitholders.
In determining whether to seek approval from the conflicts committee, the board of directors of our General Partner considers a varietyof factors, including the size and dollar amount involved in the potential transaction, the type of assets involved in the potential transaction,the various parties to the transaction, the interests of the various board members (if any) in the potential transaction, the interests of AlonEnergy and its affiliates (if any) in the potential transaction, and any other factors the board of directors deems relevant in determiningwhether it should seek approval from the conflicts committee.
Executive Officers and Directors
Generally, the executive officers of our General Partner are also executive officers of Alon Energy, and are providing their services toour General Partner and us pursuant to the services agreement entered into among us, Alon Energy and our General Partner. The executiveofficers listed below divide their working time between the management of Alon Energy and us. The approximate weighted averagepercentages of the amount of time the executive officers spent on management of our business in 2016 are as follows: David Wiessman(25%), Jeff D. Morris (25%), Paul Eisman (25%), Shai Even (25%), Jimmy C. Crosby (25%), Alan Moret (25%), Claire Hart (25%),Michael Oster (25%), James Ranspot (25%) and Kyle McKeen (25%). Jeff Brorman, our Vice President of Refining, devotes 100% of histime to our operations.
The table below sets forth the names, positions and ages of the executive officers and directors of our General Partner.
Name Age Position With Our General PartnerDavid Wiessman 62 Executive Chairman of the Board of DirectorsJeff D. Morris 65 Vice Chairman of the Board of DirectorsSnir Wiessman 35 DirectorEitan Raff 75 DirectorSheldon Stein 63 DirectorElla Ruth Gera 60 DirectorYeshayahu Pery 83 DirectorAlan Moret 62 Chief Executive OfficerShai Even 48 President and Chief Financial OfficerJimmy C. Crosby 57 Senior Vice President and Chief Operating OfficerClaire Hart 61 Senior Vice PresidentMichael Oster 45 Senior Vice President of Mergers and AcquisitionsJames Ranspot 46 Senior Vice President, General Counsel & SecretaryKyle McKeen 53 Vice President of Wholesale MarketingJeff Brorman 48 Vice President of Refining
46
Table of Contents
David Wiessman-Executive Chairman . Mr. D. Wiessman was appointed Chairman of the board of directors of our General Partner inAugust 2012. Mr. D. Wiessman served as Executive Chairman of the Board of Directors of Alon Energy from July 2000 until May 2015and served as President and Chief Executive Officer of Alon Energy from its formation in 2000 until May 2005. Mr. D. Wiessman has over30 years of oil industry and marketing experience. From 1994 to 2015, Mr. D. Wiessman served as a director of Alon Israel OilCompany, Ltd., or Alon Israel, and served as its Chief Executive Officer and President from 1994 to 2014. In 1987, Mr. D. Wiessmanbecame Chief Executive Officer of, and a stockholder in, Bielsol Investments (1987) Ltd., or Bielsol. In 1976, after serving in the IsraeliAir Force, he became Chief Executive Officer of Bielsol Ltd., a privately-owned Israeli company that owns and operates gasoline stationsand owns real estate in Israel. Mr. D. Wiessman served as Chief Executive Officer of Alon Blue Square-Israel, Ltd., which is listed on theNYSE and the Tel Aviv Stock Exchange, or TASE, from 2013 to 2015, and was its Executive Chairman of the Board of its Directors from2003 to 2013. Mr. Wiessman also served as Chairman of Blue Square Real Estate Ltd., which is listed on the TASE, from 2006 to 2015,and Executive Chairman of the Board and President of Dor-Alon Energy Israel (1988) Ltd., which is listed on the TASE, from 2005 to2015, and all of which are subsidiaries of Alon Israel. We believe Mr. D. Wiessman’s vision, business expertise, industry experience,leadership skills and devotion to community service qualify him to serve as Executive Chairman of the board of directors of our GeneralPartner. David Wiessman is the father of Snir Wiessman, who joined the board of directors of our General Partner in November 2012.
Jeff D. Morris-Vice Chairman. Mr. Morris was appointed Vice Chairman of the board of directors of our General Partner inNovember 2012. Mr. Morris served as Vice Chairman of the Board of Directors of Alon Energy from May 2011 to May 2015 and adirector from May 2005 to May 2016. Mr. Morris served as Alon Energy’s Chief Executive Officer from May 2005 to May 2011, as ChiefExecutive Officer of Alon Energy’s subsidiaries from July 2000 to May 2011, Alon Energy’s President from May 2005 until March 2010and President of its operating subsidiaries from July 2000 until March 2010. Prior to joining Alon, he held various positions at Fina, Inc.,where he began his career in 1974. Mr. Morris served as Vice President of Fina, Inc.’s SouthEastern Business Unit from 1998 to 2000 andas Vice President of its SouthWestern Business Unit from 1995 to 1998. In these capacities, he was responsible for both the Big Springrefinery and Fina’s Port Arthur refinery and the crude oil gathering assets and marketing activities for both business units. Mr. Morris hasalso been a director of Krotz Springs since 2008. We believe that Mr. Morris’ position as Chief Executive Officer of Alon Energy, detailedknowledge of Alon Energy’s operations and assets, expertise in oil refining and marketing, devotion to community service and managementskills qualify him to serve as a member of the board of directors of our General Partner.
Snir Wiessman-Director. Mr. S. Wiessman joined the board of directors of our General Partner in November 2012. Mr. S. Wiessmanhas served as a director of Alon Brands, Inc., a subsidiary of Alon Energy, since November 2008. Mr. S. Wiessman serves as a director inSonol Israel Ltd., an Israeli gas station and convenience store operator, since July 2016. Mr. S. Wiessman served as a BusinessDevelopment and M&A Manager of Alon Israel from August 2007 to 2015. Mr. Wiessman has also served as a Director of Dor-Alon FuelStations Operation Ltd., an Israeli gas station and convenience store operator, from August 2003 to October 2010 and AM:PM, an Israeliconvenience store operator, from January 2008 to October 2010. AM:PM and Dor-Alon Fuel Station Operation Ltd. merged in October2010 and Mr. S. Wiessman served as a director in the merged entity, Dor-Alon Retail Sites Management, until 2015. Dor-Alon Retail SitesManagement is a subsidiary of Dor-Alon Energy in Israel (1988) Ltd., which is listed on the TASE. Mr. S. Wiessman holds a Bachelors inScience in Electrical Engineering from Ben Gurion University and a Masters of Business Administration from Tel Aviv University. SnirWiessman is the son of David Wiessman, who is also a member of the board of directors of our General Partner. We believe Mr. S.Wiessman’s broad business background and experience qualify him to serve as a member of the board of directors of our General Partner.
Eitan Raff-Director. Mr. Raff joined the board of directors of our General Partner in November 2012. Mr. Raff has served as a directorof Verifone Systems, Inc. since October 2007. Mr. Raff currently serves as a financial consultant to Wolfson Clore Mayer Ltd. and as asenior advisor to Morgan Stanley. Mr. Raff is also chairman of the public board of Youth Leading Change, a non-profit association, andpreviously served as the Accountant General (Treasurer) in the Israeli Ministry of Finance. Mr. Raff currently serves on the boards ofdirectors of a number of privately-held corporations. Mr. Raff previously served as chairman of the board of directors of Bank Leumi leIsrael B.M., Bank Leumi USA and Bank Leumi UK plc from 1995 until 2010. While serving on the Bank Leumi le Israel B.M. board, Mr.Raff served on a number of committees of the board of directors, including the committees on credit, finance, administration, conflicts ofinterest and risk management. Mr. Raff holds a B.A. and M.B.A. from the Hebrew University of Jerusalem. We have concluded that Mr.Raff’s experience gained while serving as a director on a number of companies’ boards, including several chairman positions, qualifies himto serve as a member of the board of directors of our General Partner.
Sheldon Stein-Director. Mr. Stein joined the board of directors of our General Partner in February 2013. Mr. Stein also serves as thePresident of Southern Glazer’s Wine and Spirits, the nation’s largest distributor of wine and spirits, a position he has held since July 2016.From July 2010 to June 2016 Mr. Stein was President and Chief Executive Officer of Glazer’s
47

Table of Contents
Distributors and from February 2008 until July 2010, Mr. Stein was a Vice Chairman and Head of Southwest Investment Banking for Bankof America, Merrill Lynch. Prior to joining Merrill Lynch, Mr. Stein was a Senior Managing Director and ran Bear Stearns’ SouthwestInvestment Banking Group for over 20 years. Mr. Stein received a Bachelor’s degree Magna Cum Laude with honors from BrandeisUniversity where he was a member of Phi Beta Kappa and a J.D. from Harvard Law School. He is a director of Tailored Brands, Inc. andAce Cash Express and is also on the advisory board of Amegy Bank. We have concluded that Mr. Stein’s broad business background andexperience gained while serving as a director on a number of companies’ boards qualify him to serve as a member of the board of directorsof our General Partner.
Ella Ruth Gera-Director. Ms. Gera joined the board of directors of our General Partner in November 2013. Ms. Gera is a corporateattorney, economist and founding partner of Gottlieb, Gera, Engel & Co., Advocates, a law firm specializing in international and cross-border transactions. Ms. Gera is a member of the Israel Bar and holds an LL.B. from the Tel Aviv University and a B.A. in Economics fromthe Hebrew University of Jerusalem. Ms. Gera also serves as a director of Danred Ltd., a family-owned company. Ms. Gera served for 8years as a director of Tadbik Ltd, a publicly-traded company listed on the Tel Aviv Stock Exchange, where she also chaired the audit andbalance sheet committee. In addition to her legal and corporate work, Ms. Gera serves as the chair of the Haifa and Galilee Music Centreand is the founder and chair of the Friends of the Women’s Network. Ms. Gera has previously served as Deputy Mayor of the Town of KfarShmaryahu, as the executive director of The Israel Women’s Network, (R.A.), as founder and director of the Business Circle at The IsraelDemocracy Institute, Israel’s leading non-partisan think tank, and has held leadership positions for numerous other civic and legalorganizations. We have concluded that Ms. Gera’s experience gained while serving as a director on a number of companies’ boards andexperience as audit committee chairperson qualify her to serve as a member of the board of directors of our General Partner.
Yeshayahu Pery-Director. Mr. Pery joined the board of directors of our General Partner in June 2016. Mr. Pery served as a director ofAlon USA Energy, Inc. from 2003 to 2016 and of Alon Israel Oil Company, Ltd. from 1997 until 2010. He is Chairman of MIGAL INC., atechnology institute in the biotechnology field, a position he has held since 1998. From 1997 until 2004, Mr. Pery served as Chairman andChief Executive Officer of Galilee Cooperative Organization, a purchasing and finance organization of the Kibbutz movement. In addition,Mr. Pery served as Chairman of Agricultural Insurance Association and the Atudot pension fund between 1995 and 2004. We haveconcluded that Mr. Pery’s experience gained while serving as a director on a number of companies’ boards, including several chairmanpositions, qualifies him to serve as a member of the board of directors of our General Partner.
Alan Moret-Chief Executive Officer. Mr. Moret was appointed Chief Executive Officer of our General Partner in January 2017. Mr.Moret was appointed Senior Vice President of Supply of our General Partner in August 2012. Mr. Moret has served as Senior VicePresident of Supply of Alon Energy since August 2008. Mr. Moret served as Alon Energy’s Senior Vice President of Asphalt Operationsfrom August 2006 to August 2008, with responsibility for asphalt operations and marketing at Alon Energy’s refineries and asphaltterminals. Mr. Moret has also served as an officer of Alon Refining Krotz Springs, Inc. since July 2008. Prior to joining Alon Energy, Mr.Moret was President of Paramount Petroleum Corporation from November 2001 to August 2006. Prior to joining Paramount PetroleumCorporation, Mr. Moret held various positions with Atlantic Richfield Company, most recently as President of ARCO Crude Trading, Inc.from 1998 to 2000 and as President of ARCO Seaway Pipeline Company from 1997 to 1998.
Shai Even-President and Chief Financial Officer. Mr. Even was appointed President and Chief Financial Officer of our GeneralPartner in January 2017. Mr. Even previously held the position of Senior Vice President, Chief Financial Officer and Director of ourGeneral Partner since August 2012. Mr. Even has served as Senior Vice President of Alon Energy since August 2008, Vice President ofAlon Energy from May 2005 to August 2008 and as Alon Energy’s Chief Financial Officer since December 2004. Mr. Even also served asAlon Energy’s Treasurer from August 2003 until March 2007. Prior to joining Alon Energy, Mr. Even served as Chief Financial Officer ofDCL Technologies, Ltd. from 1996 to July 2003 and prior to that worked for KPMG LLP from 1993 to 1996. Mr. Even has also been adirector of Alon Refining Krotz Springs, Inc. since July 2008 and Alon Brands, Inc. since November 2008. Mr. Even was selected to serveas a director of our General Partner because of his financial education and expertise, financial reporting background, public accountingexperience, management experience and detailed knowledge of our operations. Mr. Even stepped down as a director of our General Partnerin November 2012.
Jimmy C. Crosby-Senior Vice President and Chief Operating Officer. Mr. Crosby was appointed Senior Vice President of ourGeneral Partner in March 2013 and the Chief Operating Officer of our General Partner in November 2012. Mr. Crosby served as VicePresident of Refining of our General Partner from August 2012 to March 2013. Mr. Crosby has served as Vice President of Refining-BigSpring of Alon Energy since January 2010, with responsibility for operations at the Big Spring refinery. Prior to this, Mr. Crosby served asVice President of Refining-California Refineries of Alon Energy from March 2009 until January 2010, as Vice President of Refining andSupply from May 2007 to March 2009, as Vice President of
48

Table of Contents
Supply and Planning from May 2005 to May 2007 and as General Manager of Business Development and Planning from August 2000 toMay 2005. Prior to joining Alon Energy, Mr. Crosby worked with FINA from 1996 to August 2000 where he last held the position ofManager of Planning and Economics for the Big Spring refinery.
Claire Hart-Senior Vice President . Mr. Hart was appointed Senior Vice President of our General Partner in August 2012. Mr. Harthas served as Senior Vice President of Alon Energy since January 2004 and also served as Alon Energy’s Chief Financial Officer and VicePresident from August 2000 to January 2004. In addition, Mr. Hart has been an officer of Alon Refining Krotz Springs, Inc. since July2008. Prior to joining Alon Energy, Mr. Hart held various positions in the Finance, Accounting and Operations departments of FINA for 13years, serving as Treasurer from 1998 to August 2000 and as General Manager of Credit Operations from 1997 to 1998.
Michael Oster-Senior Vice President of Mergers and Acquisitions . Mr. Oster was appointed Senior Vice President of Mergers andAcquisitions of our General Partner in August 2012. Mr. Oster has served as Senior Vice President of Mergers and Acquisitions of AlonEnergy since August 2008 and has served as an officer of Alon Refining Krotz Springs, Inc. since August 2009. Prior to joining AlonEnergy, Mr. Oster was a partner in the Israeli law firm of Yehuda Raveh and Co.
James Ranspot-Senior Vice President, General Counsel & Secretary . Mr. Ranspot was appointed to the position of Senior VicePresident, General Counsel and Secretary of our General Partner in March 2013 and previously served as its Chief Legal Counsel -Corporate from August 2012. Mr. Ranspot has served as Alon Energy’s Senior Vice President, General Counsel and Secretary since March2013, and prior thereto as Alon Energy’s Chief Legal Counsel - Corporate from August 2012 until March 2013, and Assistant GeneralCounsel from June 2006. Prior to joining Alon, Mr. Ranspot practiced corporate and securities law, with a focus on public and privatemerger and acquisition transactions and public securities offerings.
Kyle McKeen-Vice President of Wholesale Marketing. Mr. McKeen was appointed Vice President of Wholesale Marketing of ourGeneral Partner in August 2012. Mr. McKeen has served as President and Chief Executive Officer of Alon Brands, Inc., Alon Energy’ssubsidiary that manages retail and branded marketing operations, since May 2008. From 2005 to 2008, Mr. McKeen served as Presidentand Chief Operating Officer of Carter Energy, an independent energy marketer supporting over 600 retailers by providing fuel supply,merchandising and marketing support, and consulting services. Prior to joining Carter Energy in 2005, Mr. McKeen was a member of theBoard of Managers of Alon USA Interests, LLC from September 2002 to 2005 and held numerous positions of increasing responsibilitieswith Alon Energy, including Vice President of Marketing.
Jeff Brorman-Vice President of Refining. Mr. Brorman was appointed Vice President of Refining of our General Partner in March2013. Prior to being appointed to this position, Mr. Brorman has served in the following positions at the Big Spring Refinery: OperationsManager from January 2009 to March 2013, Technical Manager from May 2005 to January 2009 including Refinery Rebuild Manager fromFebruary 2008 to October 2008, Capital Projects Manager from May 2004 to May 2005, Southside Operations Superintendent from August2000 to May 2004. Prior to joining Alon, Mr. Brorman worked with Atofina Petrochemicals, Inc. from August 1996 to August 2000 as amechanical engineer.
Communications with Directors
Any unitholder or other interested party who wishes to communicate directly with the board of directors of our General Partner, or anycommittee thereof, or any member or group of members of the board of directors of our general party or any committee thereof, may do soby writing to the board or the applicable committee thereof (or one or more named individuals) in care of the Secretary of Alon USAPartners GP, LLC, 12700 Park Central Drive, Suite 1600, Dallas, Texas 75251. All communications received will be collected by theSecretary of Alon USA Partners GP, LLC, and forwarded to the appropriate director or directors.
Non-Management Director Executive Sessions
The New York Stock Exchange listing standards require the non-management directors of the board of director of our General Partnerto meet at regularly scheduled executive sessions without management. These non-management directors met four times in such executivesessions in 2016. Mr. Eitan Raff presided over the executive sessions.
Section 16(a) Beneficial Ownership Reporting Compliance
Section 16(a) of the Exchange Act requires directors, executive officers and persons who beneficially own more than 10% of ourcommon units to file certain reports with the SEC and New York Stock Exchange concerning their beneficial ownership of our equitysecurities. Based on a review of these reports, other information available to us and written
49

Table of Contents
representations from reporting persons indicating that no other reports were required, all such reports concerning beneficial ownership werefiled in a timely manner by reporting persons during the year ended December 31, 2016.
Code of Ethics
We have adopted a code of business ethics and conduct that applies to our principal executive officer, principal financial officer,principal accounting officer or controller or persons performing similar functions, as well as other employees. Additionally, the board ofdirectors of our General Partner has adopted corporate governance guidelines for the directors and the board. The code of business ethicsand conduct and the corporate governance guidelines may be found on our website at www.alonpartners.com under the Governance tab.
ITEM 11. EXECUTIVE COMPENSATION.
Compensation Discussion and Analysis
Neither we nor our General Partner directly employ any of the persons responsible for managing our business. All of the executiveofficers that are currently responsible for managing our day to day affairs are also current officers of our parent, Alon Energy, and thereforehave responsibilities for both us and Alon Energy. The individuals that are considered to be “named executive officers” at Alon Energy andwhich will also provide management services to us are as follows:
• Paul Eisman - President and Chief ExecutiveOfficer
• Shai Even - Senior Vice President and Chief FinancialOfficer
• Jeff Morris - Vice Chairman of the Board of Directors
• David Wiessman - Executive Chairman of the Board of Directors, Alon Partners
• Michael Oster - Senior Vice President, Mergers and Acquisitions
Objectives of Compensation Program
The objectives of Alon Energy’s compensation policies are to attract, motivate and retain qualified management and personnel who arehighly talented while ensuring that executive officers and other employees are compensated in a manner that advances both the short- andlong-term interests of unitholders. In pursuing these objectives, Alon Energy’s compensation committee believes that compensation shouldreward executive officers and other employees for both their personal performance and the performance of Alon Energy and itssubsidiaries. For a detailed discussion of the compensation and benefits that Alon Energy provides to the officers noted above, please seeAlon Energy’s most recent proxy statement as filed with the SEC.
The officers and all other personnel necessary for our business to function are employed and compensated by our parent Alon Energy,subject to the administrative services fee or reimbursement by us in accordance with the terms of the omnibus agreement. Under theomnibus agreement, none of Alon Energy’s long-term incentive compensation expense will be allocated to us. However, we will beresponsible for paying the long-term incentive compensation expense associated with our long-term incentive plan described below. Theexecutive officers that perform services for us who are also direct employees of Alon Energy will continue to participate in employeebenefit plans and arrangements sponsored by Alon Energy, including plans that may be established in the future. Neither we nor ourGeneral Partner have entered into any additional employment or benefit-related agreements with any of the individuals who provideexecutive officer services to us, and we do not anticipate entering into any such agreements in the near future.
Compensation paid by or awarded by us in 2016 with respect to the executive officers of Alon Energy that also provide services to uswill reflect only the portion of compensation paid by Alon Energy that is allocated to us pursuant to Alon Energy’s allocation methodologyand subject to the terms of the omnibus agreement. The compensation expenses that we incur pursuant to the omnibus agreement are basedupon the amount of time spent by such officers managing our business and operations during the applicable fiscal year. Responsibility andauthority for compensation-related decisions for Alon Energy’s executive officers resides with the board of directors of Alon Energy and itscommittees (other than compensation under our long-term incentive plan should we choose to issue awards directly to those individuals).Any such compensation decisions by Alon Energy will not be subject to any approvals by the board of directors of our General Partner orany committees thereof.
The board of directors of our General Partner may grant awards to individuals who support our operations, whether or not they alsoprovide services to Alon Energy, pursuant to the long-term incentive plan described below. Our General Partner
50

Table of Contents
adopted our long-term incentive plan to provide us with maximum flexibility with respect to the design of compensatory arrangements forindividuals providing services to us; however, neither we nor our General Partner have made any grants to our employees under the long-term incentive plan.
Compensation Program Elements
Alon Energy compensates its employees and named executive officers through a combination of base salary, annual bonuses andawards granted pursuant to its 2005 Incentive Compensation Plan. The Compensation Committee of Alon Energy considers each element ofAlon Energy’s overall compensation program applicable to an employee or named executive officer when making any decision affectingthat employee’s or named executive officer’s compensation. The particular elements of Alon Energy’s compensation program areexplained below.
Base Salaries. Base salary levels are designed to attract and retain highly qualified individuals. Each executive officer is eligible toparticipate with Alon Energy’s other employees in an annual program for merit increases to the executive’s base salary. Pursuant to thisprogram, each officer’s performance is evaluated annually utilizing a number of factors divided into three categories: (i) individualperformance objectives and results, (ii) competencies in core skills and knowledge, and (iii) professional development. Each executiveofficer reviews his evaluation with Mr. Eisman and individualized performance objectives for the following year are established. TheCompensation Committee considers the results of these evaluations when determining any increase in base compensation. The preciseamount of any increase in base compensation varies based on the executive’s current level of compensation when compared to others in theCompany at the same pay grade and the results of the annual evaluation. The Compensation Committee of Alon Energy may also consideravailable information on prevailing compensation levels for executive-level employees at comparable companies in Alon Energy’sindustry.
The range of various compensation elements for our named executive officers will be discussed in further detail within the“Compensation Discussion and Analysis” section of Alon Energy’s 2017 proxy statement.
Annual Bonuses. Executive officers and key employees may be awarded bonuses outside the plans described herein based onindividual performance and contributions.
Bonus Plans. The board of directors of Alon Energy has approved three annual bonus plans pursuant to the 2005 IncentiveCompensation Plan (collectively, the “ALJ Bonus Plans”). Annual cash bonuses under the ALJ Bonus Plans are distributed to eligibleemployees each year based on the previous year’s performance. Bonuses were paid to certain eligible employees in the second quarter of2016 based on performance during Alon Energy’s 2015 fiscal year and if bonuses are payable based on performance during Alon Energy’s2016 fiscal year, we expect such bonuses to be paid in the second or third quarter of 2017. Each of the ALJ Bonus Plans contain the sameplan elements, which are described below. Participation in the ALJ Bonus Plans is based on the location of each employee as follows: (i)Big Spring refinery employees and wholesale employees are eligible to participate in one plan based primarily on the performance of AlonEnergy’s Big Spring refinery, (ii) the California refineries and West Coast asphalt operations employees of Alon Energy are eligible toparticipate in a second plan based primarily on the performance of Alon Energy’s California refineries, and (iii) the employees at the KrotzSprings, Louisiana, refinery are eligible to participate in the third plan based primarily on the performance of Alon Energy’s Krotz Springsrefinery. Under each of the ALJ Bonus Plans, bonus payments are based 33% on meeting or exceeding target reliability measures, 34% onmeeting or exceeding target free cash flow measures and 33% on meeting or exceeding target safety and environmental objectives. Thebonus potential for Alon’s corporate employees, including the named executive officers, is based on a combination of the bonus plans forAlon’s Big Spring refinery, California refineries, and Krotz Springs refinery. Bonus payments are subject to the approval of the board ofdirectors of Alon Energy. The bonus potential for Alon’s named executive officers ranges from 65% to 100% of the respective executiveofficer’s base salary, as established in each executive officer’s employment agreement or by the Compensation Committee of Alon Energy.
The Compensation Committee of Alon Energy believes that the ALJ Bonus Plans provide motivation for the eligible employees toattain Alon Energy’s financial objectives as well as refinery reliability and environmental and safety objectives, which have been designedto benefit Alon Energy in both the long- and short-term.
In addition to cash bonuses paid under the ALJ Bonus Plans, the Compensation Committee of Alon Energy awards cash bonuses fromtime to time to recognize exemplary results achieved by employees, including the named executive officers. The amount of any such cashbonus is determined based on the recipient’s pay grade, contribution to the project or result and the benefit to Alon Energy from therecipient’s efforts.
2005 Incentive Compensation Plan. In July 2005, the board of directors of Alon Energy approved the Alon USA Energy, Inc. 2005Incentive Compensation Plan (as thereafter amended, the “2005 Incentive Compensation Plan”), and Alon Energy’s stockholders approvedsuch plan at Alon Energy’s 2006 annual meeting of stockholders. In 2010, the board of directors of Alon Energy approved an amendmentand restatement to such plan and the stockholder approved such amendment and
51
Table of Contents
restatement at Alon Energy’s 2010 annual meeting of stockholders. In 2012 the board of directors of Alon Energy approved a furtheramendment to such plan and this amendment was approved by the stockholders at Alon Energy’s 2012 annual meeting of stockholders.Alon Energy refers to such amended and restated plan as the 2005 Incentive Compensation Plan. The 2005 Incentive Compensation Plan isa component of Alon Energy’s overall executive incentive compensation program. The 2005 Incentive Compensation Plan permits thegranting of awards in the form of options to purchase common stock, stock appreciation rights, restricted shares of common stock, restrictedstock units, performance shares, performance units and senior executive plan bonuses to Alon Energy’s directors, officers and keyemployees. The Compensation Committee of Alon Energy believes that the award of equity-based compensation pursuant to the 2005Incentive Compensation Plan aligns executive and stockholder long-term interests by creating a strong and direct link between executivecompensation and stockholder return.
The Compensation Committee of Alon Energy also utilizes equity-based compensation with multi-year vesting periods for purposes ofexecutive officer retention. The specific amount of equity-based grants is determined by the Compensation Committee of Alon Energyprimarily by reference to an employee’s level of authority within Alon Energy. Typically, all executive officers of the same level receiveawards that are comparable in amount. The grant of restricted shares of common stock and similar equity-based awards also allows AlonEnergy’s directors, officers and key employees to develop and maintain a long-term ownership position in Alon Energy. The 2005Incentive Compensation Plan is currently administered, in the case of awards to participants subject to Section 16 of the Exchange Act, bythe board of directors of Alon Energy and, in all other cases, by the Compensation Committee of Alon Energy. Subject to the terms of the2005 Incentive Compensation Plan, the Compensation Committee of Alon Energy and the board of directors of Alon Energy have the fullauthority to select participants to receive awards, determine the types of awards and terms and conditions of awards, and interpretprovisions of the 2005 Incentive Compensation Plan. Awards may be made under the 2005 Incentive Compensation Plan to eligibledirectors, officers and employees of Alon Energy and its subsidiaries, provided that awards qualifying as incentive stock options, as definedunder the Internal Revenue Code of 1986, as amended, or the Code, may be granted only to employees.
Perquisites. Alon Energy’s use of perquisites as an element of compensation is limited in scope and amount. Alon Energy does notview perquisites as a significant element of compensation but does believe that in certain circumstances they can be used in conjunctionwith other elements to attract, motivate and retain qualified management and personnel in a competitive environment.
Retirement Benefits. Retirement benefits to Alon Energy’s senior management, including Alon Energy’s named executive officers, arecurrently provided through one of Alon Energy’s 401(k) plans and one of Alon Energy’s pension plans, each of which are available to mostAlon Energy employees, and the Alon USA Energy, Inc. Benefits Restoration Plan, or Benefits Restoration Plan, which provides additionalpension benefits to Alon Energy’s highly-compensated employees. Non-represented employees, including senior management, are eligibleto receive matching of employee contributions into the 401(k) plan in which they participate of up to 3% of the employee’s base salary. Aspreviously noted, employment benefits, including pension benefits, for our Named Executive Officers are provided by Alon Energy andwill be reported in Alon Energy’s proxy statement for its 2017 annual meeting of stockholders.
Employment Agreements
As discussed more fully below in “Employment Agreements and Change of Control Arrangements,” Alon Energy has entered intoemployment agreements with each of its named executive officers. Alon Energy’s decision to enter into employment agreements and theterms of those agreements were based on the facts and circumstances at the time and an analysis of competitive market practices.
Methodology of Establishing Compensation Packages
The Compensation Committee of Alon Energy does not adhere to any specified formula for determining the apportionment ofexecutive compensation between cash and non-cash awards. The Compensation Committee of Alon Energy attempts to design eachcompensation package to provide incentive to achieve Alon Energy’s performance objectives, appropriately compensate individuals fortheir experience and contributions and secure the retention of qualified employees. This is accomplished through a combination of thecompensation program elements and, in certain instances, through specific incentives not generally available to all Alon Energy’semployees.
Chief Executive Officer Compensation
The annual compensation of Alon Energy’s Chief Executive Officer is determined by the Compensation Committee of Alon Energybased on the compensation principles and programs described above. All cash compensation paid to and equity-
52

Table of Contents
based awards granted to Mr. Eisman in 2016 will be reflected in the “Summary Compensation Table” set forth in Alon Energy’s 2017proxy statement.
Stock Ownership Policy
Neither Alon Energy nor our General Partner require its directors or executive officers to own shares of Alon Energy stock or commonunits representing limited partner interest in us.
Section 162(m)
Under Section 162(m) of the Code, compensation paid to the Chief Executive Officer or any of the other four most highlycompensated individuals in excess of $1,000,000 may not be deducted by Alon Energy in determining its taxable income. This deductionlimitation does not apply to certain “performance based” compensation. The board of directors of Alon Energy does not currently intend toaward levels of non-performance based compensation that would exceed $1,000,000; however, it may do so in the future if it determinesthat such compensation is in the best interest of Alon Energy and its stockholders.
Long-Term Incentive Plan
We, through our General Partner, have adopted the Alon USA Partners, LP 2012 Long-Term Incentive Plan (the “LTIP”) for theemployees, consultants and the directors of us, our General Partner and its affiliates who perform services for us. The description of theLTIP set forth below is a summary of the material features of the plan. This summary, however, does not purport to be a completedescription of all the provisions of the LTIP. This summary is qualified in its entirety by reference to the LTIP, a copy of which is includedas an exhibit to this Annual Report. The purpose of the LTIP is to provide a means to attract and retain individuals who will provideservices to us by affording such individuals a means to acquire and maintain ownership of awards, the value of which is tied to theperformance of our common units.
The LTIP provides grants of (1) unit options (“Options”), (2) unit appreciation rights (“UARs”), (3) restricted units (“RestrictedUnits”), (4) phantom units (“Phantom Units”), (5) unit awards (“Unit Awards”), (6) substitute awards, (7) other unit-based awards (“Unit-Based Awards”), (8) cash awards, (9) performance awards, and (10) distribution equivalent rights (“DERs”) (collectively referred to as“Awards”).
Administration
The LTIP is administered by the board of directors of our General Partner or an alternative committee appointed by the board ofdirectors of our General Partner, which we refer to together as the committee for purposes of this summary. The committee administers theLTIP pursuant to its terms and all applicable state, federal or other rules or laws. The committee has the power to determine to whom andwhen Awards will be granted, determine the amount of Awards (measured in cash or in shares of our common units), proscribe andinterpret the terms and provisions of each Award agreement (the terms of which may vary), accelerate the vesting provisions associatedwith an Award, delegate duties under the LTIP, and execute all other responsibilities permitted or required under the LTIP. In the event thatthe committee is not comprised of “non-employee directors” within the meaning of Rule 16b-3 under the Exchange Act, a subcommittee oftwo or more non-employee directors will administer all Awards granted to individuals that are subject to Section 16 of the Exchange Act.
Securities To Be Offered
The maximum aggregate number of shares of common units that may be issued pursuant to any and all Awards under the LTIP shallnot exceed 3,125,000 units, subject to adjustment due to recapitalization or reorganization, or related to forfeitures or the expiration ofAwards, as provided under the LTIP.
If a common unit subject to any Award is not issued or transferred, or ceases to be issuable or transferable for any reason, including(but not exclusively) because units are withheld or surrendered in payment of taxes or any exercise or purchase price relating to an Awardor because an Award is forfeited, terminated, expires unexercised, is settled in cash in lieu of common units or is otherwise terminatedwithout a delivery of units, those common units will again be available for issue, transfer or exercise pursuant to Awards under the LTIP tothe extent allowable by law.
Options. We may grant Options to eligible persons. Option Awards are options to acquire common units at a specified price. Theexercise price of each option granted under the LTIP will be stated in the option agreement and may vary; provided, however, that, theexercise price for an Option must not be less than 100% of the fair market value per common unit as of the date of grant of the Optionunless that Option is intended to otherwise comply with the requirements of Section 409A of the Internal Revenue Code of 1986, asamended (the “Internal Revenue Code”). Options may be exercised in the
53

Table of Contents
manner and at such times as the committee determines for each Option, unless that Option is determined to be subject to Section 409A ofthe Code, where the Option will be subject to any necessary timing restrictions imposed by the Code or federal regulations. The committeewill determine the methods and form of payment for the exercise price of an Option and the methods and forms in which common units willbe delivered to a participant.
UARs. A UAR is the right to receive, in cash or in common units, as determined by the committee, an amount equal to the excess of thefair market value of one common unit on the date of exercise over the grant price of the UAR. The committee is able to make grants ofUARs and will determine the time or times at which a UAR may be exercised in whole or in part. The exercise price of each UAR grantedunder the LTIP will be stated in the UAR agreement and may vary; provided, however, that, the exercise price must not be less than 100%of the fair market value per common unit as of the date of grant of the UAR unless that UAR Award is intended to otherwise comply withthe requirements of Section 409A of the Code.
Restricted Units. A Restricted Unit is a grant of a common unit subject to a risk of forfeiture, performance conditions, restrictions ontransferability, and any other restrictions imposed by the committee in its discretion. Restrictions may lapse at such times and under suchcircumstances as determined by the committee. The committee shall provide, in the Restricted Unit agreement, whether the Restricted Unitwill be forfeited upon certain terminations of employment. Unless otherwise determined by the committee, a common unit distributed inconnection with a unit split or unit dividend, and other property distributed as a dividend, will generally be subject to restrictions and a riskof forfeiture to the same extent as the Restricted Unit with respect to which such common unit or other property has been distributed.
Phantom Units. Phantom Units are rights to receive common units, cash, or a combination of both at the end of a specified period. Thecommittee may subject Phantom Units to restrictions (which may include a risk of forfeiture) to be specified in the Phantom Unit agreementthat may lapse at such times determined by the committee. Phantom Units may be satisfied by delivery of common units, cash equal to thefair market value of the specified number of common units covered by the Phantom Unit, or any combination thereof determined by thecommittee. Except as otherwise provided by the committee in the Phantom Unit agreement or otherwise, Phantom Units subject toforfeiture restrictions may be forfeited upon termination of a Participant’s employment prior to the end of the specified period. Cashdividend equivalents may be paid during or after the vesting period with respect to a Phantom Units, as determined by the committee.
Unit Awards. The committee is authorized to grant common units that are not subject to restrictions. The committee may grant UnitAwards to any eligible person in such amounts as the committee, in its sole discretion, may select.
Substitute Awards. The LTIP permits the grant of Awards in substitution for similar awards held by individuals who becomeemployees or directors as a result of a merger, consolidation or acquisition by us, an affiliate of another entity or the assets of anotherentity. Such substitute Awards that are Options or UARs may have exercise prices less than 100% of the fair market value per commonunit on the date of the substitution if such substitution complies with Section 409A of the Code and its regulations, and other applicablelaws and exchange rules.
Unit-Based Awards. The LTIP permits the grant of other Unit-Based Awards, which are Awards that may be based, in whole or in part,on the value or performance of a common unit or are denominated or payable in common units. Upon settlement, the Unit-Based Awardmay be paid in common units, cash or a combination thereof, as provided in the Award agreement.
Cash Awards. The LTIP permits the grant of Awards denominated and settled in cash. Cash Awards may be based, in whole or in part,on the value or performance of a common unit.
Performance Awards. The committee may condition the right to exercise or receive an Award under the LTIP, or may increase ordecrease the amount payable with respect to an Award, based on the attainment of one or more performance conditions deemed appropriateby the committee.
DERs. The committee may grant DERs in tandem with Awards under the LTIP (other than an award of Restricted Units or UnitAwards), or they may be granted alone. DERs entitle the participant to receive cash equal to the amount of any cash distributions made byus during the period the DER is outstanding. Payment of a DER issued in connection with another Award may be subject to the samevesting terms as the Award to which it relates or different vesting terms, in the discretion of the committee.
Miscellaneous
Tax Withholding. At our discretion, subject to conditions that the committee may impose, a participant’s minimum statutory taxwithholding with respect to an Award may be satisfied by withholding from any payment related to an Award or by the withholding ofcommon units issuable pursuant to the Award based on the fair market value of the common units.
54

Table of Contents
Anti-Dilution Adjustments. If any “equity restructuring” event occurs that could result in an additional compensation expense underFinancial Accounting Standards Board Accounting Standards Codification Topic 718 (“FASB ASC Topic 718”) if adjustments to Awardswith respect to such event were discretionary, the committee will equitably adjust the number and type of units covered by eachoutstanding Award and the terms and conditions of such Award to equitably reflect the restructuring event, and the committee will adjustthe number and type of units with respect to which future Awards may be granted. With respect to a similar event that would not result in aFASB ASC Topic 718 accounting charge if adjustment to Awards were discretionary, the committee shall have complete discretion toadjust Awards in the manner it deems appropriate. In the event the committee makes any adjustment in accordance with the foregoingprovisions, a corresponding and proportionate adjustment shall be made with respect to the maximum number of units available under theLTIP and the kind of units or other securities available for grant under the LTIP. Furthermore, in the case of (i) a subdivision orconsolidation of the common units (by reclassification, split or reverse split or otherwise), (ii) a recapitalization, reclassification or otherchange in our capital structure or (iii) any other reorganization, merger, combination, exchange or other relevant change in capitalization ofour equity, then a corresponding and proportionate adjustment shall be made in accordance with the terms of the LTIP, as appropriate, withrespect to the maximum number of units available under the LTIP, the number of units that may be acquired with respect to an Award, and,if applicable, the exercise price of an Award in order to prevent dilution or enlargement of Awards as a result of such events.
Change in Control. Upon a “change of control” (as defined in the LTIP), the committee may, in its discretion, (i) remove any forfeiturerestrictions applicable to an Award, (ii) accelerate the time of exercisability or vesting of an Award, (iii) require Awards to be surrenderedin exchange for a cash payment, (iv) cancel unvested Awards without payment or (v) make adjustments to Awards as the committee deemsappropriate to reflect the change of control.
Summary Compensation Table
As previously noted, the cash compensation and benefits for Named Executive Officers were not paid by us, but rather by AlonEnergy. Information regarding the compensation paid to Named Executive Officers as consideration for the services they perform for uswill be reported in Alon Energy’s proxy statement for its 2017 annual meeting of stockholders.
2016 Grants of Plan-Based Awards
No grants of plan-based awards were made to any of the Named Executive Officers during the last completed fiscal year.
Outstanding Equity Awards at Fiscal Year-End 2016
There are no restricted or performance units held by any of our Named Executive Officers as of December 31, 2016.
2016 Option Exercises and Units Vested
No unit awards were held by our Named Executive Officers and therefore no vesting occurred during 2016.
Pension Benefits
As previously noted, employment benefits, including pension benefits, for our Named Executive Officers are provided by Alon Energyand will be reported in Alon Energy’s proxy statement for its 2017 annual meeting of stockholders.
Employee Agreements and Change of Control Agreements
Each of our Named Executive Officers has an employment agreement with Alon Energy. The details of such employment agreements,including payments triggered upon the occurrence of death, disability, termination, resignation, retirement or a change of control will bedescribed in Alon Energy’s proxy statement for its 2017 annual meeting of stockholders.
Officers or employees of Alon Energy or its subsidiaries who also serve as directors of our General Partner do not receive additionalcompensation for such service. Directors of our General Partner who are not also officers or employees of Alon Energy or its subsidiariesreceive compensation for service on the board of directors and its committees.
We pay each director who is not also an officer or employee of Alon Energy or its subsidiaries an annual retainer of $50,000. Inaddition, each independent director and each other non-employee director will receive $25,000 annually in restricted equity interests whichvest in three equal installments on each of the first, second and third anniversaries of the grant date. In addition, each such director isreimbursed for out-of-pocket expenses in connection with attending meetings of the board and committee meetings. We pay meeting fees tosuch directors in the amount of $1,500 for each in-person board or committee meeting, and $900 for each telephonic board or committeemeeting. We pay the audit committee chairman an
55

Table of Contents
annual amount of $10,000. Each director is fully indemnified by us for actions associated with being a director to the fullest extentpermitted under Delaware law pursuant to our partnership agreement.
The table below sets forth the compensation earned during the year ended December 31, 2016 by each director who was not also anofficer or employee of Alon Energy or its subsidiaries:
Name Fees Earned Equity Awards All Other
Compensation Total
Eitan Raff $ 71,400 $ 25,000 $ — $ 96,400Sheldon Stein 61,400 25,000 — 86,400Snir Wiessman 58,400 — — 58,400Ella Ruth Gera 64,400 25,000 — 89,400Yeshayahu Pery 36,633 25,000 — 61,633
56

Table of Contents
ITEM 12. SECURITY OWNERSHIP OF CERTAIN BENEFICIAL OWNERS AND MANAGEMENT AND RELATEDSTOCKHOLDER MATTERS.
The following table presents information regarding the number of common units representing limited partner interests of thePartnership beneficially owned as of February 21, 2017 by each director and named executive officer of our General Partner, and alldirectors and executive officers of our General Partner as a group. In addition, the table presents information about each person known bythe Partnership to beneficially own 5% or more of our common units. Unless otherwise indicated by footnote, the beneficial ownerexercises sole voting and investment power over the units. Additionally, unless otherwise indicated by footnote, the percentage ofoutstanding common units is calculated on the basis of 62,520,220 of our common units outstanding as of February 21, 2017.
Beneficial Unit Ownership
Directors, Executive Officers and 5% Unitholders Number of Units
Percentage ofOutstanding
Common Units
Directors and Executive Officers: David Wiessman — —Jeff D. Morris — —Snir Wiessman — —Eitan Raff 6,638 *Sheldon Stein 5,979 *Ella Ruth Gera 5,075 *Yeshayahu Pery 2,528 *Alan Moret — —Shai Even 7,200 *Jimmy C. Crosby — —Claire Hart — —Michael Oster — —James Ranspot — —Kyle McKeen — —Jeff Brorman — —All directors and executive offers as a group (14 persons) 27,420 *5% or more Unitholders: Alon USA Energy, Inc. (1) 51,000,000 81.6%_____________________________
* Indicates less than 1%
(1) Alon Energy holds its common units through one of its subsidiaries, Alon Assets, Inc. Alon Energy owns 100% of the Class Avoting common stock in Alon Assets, Inc. and 99.79% of all outstanding common stock. The remaining 0.21% of outstandingcommon stock, which is Class B non-voting common stock, is owned by Jeff Morris. Alon Energy also indirectly owns Alon USAPartners GP, LLC, which is our general partner and manages and operates our business and has a non-economic general partnerinterest in us. Voting and investment determinations of Alon Energy are made by its board of directors, which is comprised of thefollowing members: Ezra Uzi Yemin, Assaf Ginsburg, Frederec Green, Avigal Soreq, Mark Smith, David Wiessman, William Kacal,Zalman Segal, Franklin Wheeler, Ron Haddock and Ilan Cohen. As a result of, and by virtue of the relationships described above,each of the members of the Alon Energy board of directors may be deemed to exercise voting and dispositive power with respect tosecurities held by Alon Assets, Inc.
57

Table of Contents
ITEM 13. CERTAIN RELATIONSHIPS AND RELATED TRANSACTIONS AND DIRECTOR INDEPENDENCE.
Related Party Transactions
Alon Energy is an independent refiner and marketer of petroleum products operating primarily in the South Central, Southwestern andWestern regions of the United States. Alon Energy owns 100% of the voting interests in our General Partner and 81.6% of our commonunits. Our ongoing relationship with Alon Energy provides us with secure fuel distribution outlets and marketing expertise, which webelieve provides us with a competitive advantage. Given its significant ownership in us, we believe Alon Energy is motivated to promoteand support the successful execution of our business plan and to pursue projects and/or acquisitions that enhance the value of our business.
As of December 31, 2016, we have the following agreements with Alon Energy.
Omnibus Agreement
Under the terms of the omnibus agreement between us and Alon Energy, we have the right of first refusal if Alon Energy or any of itscontrolled affiliates has the opportunity to acquire a controlling interest in any refinery and related crude oil and refined product logisticassets, including non-retail transportation terminal sales, and that operate in Arizona, Arkansas, Colorado, Kansas, New Mexico, Oklahomaor Texas. In addition, pursuant to the terms of the omnibus agreement, we will have a 60-day exclusive right of negotiation if Alon Energyor any of its controlled affiliates decide to attempt to sell any refinery and related crude oil and refined product logistic assets, includingnon-retail transportation terminal sales, that operate in Arizona, Arkansas, Colorado, Kansas, New Mexico, Oklahoma or Texas.
Services Agreement
The Services Agreement among the Partnership, the General Partner and Alon Energy addresses certain aspects of the Partnership’srelationship with the General Partner and Alon Energy, including the provision by Alon Energy or its service subsidiary to the Partnershipof certain general and administrative services and its agreement to reimburse Alon Energy for such services; and the provision by AlonEnergy or its service subsidiary to the Partnership of such employees as may be necessary to operate and manage the Partnership’sbusiness, and its agreement to reimburse Alon Energy for the expenses associated with such employees.
Pursuant to the Services Agreement, the Partnership has agreed to reimburse Alon Energy or its service subsidiary for (i) all reasonabledirect and indirect costs and expenses incurred by it in connection with the performance of these services and (ii) all other reasonableexpenses allocable to the Partnership or the General Partner or otherwise incurred by Alon Energy in connection with the operation of thePartnership’s business.
Tax Sharing Agreement
Under the terms of the Tax Sharing Agreement by and among the Partnership and Alon Energy, the Partnership must reimburse AlonEnergy for the Partnership’s share of state and local income and other taxes borne by Alon Energy due to our results being included in acombined or consolidated tax return filed by Alon Energy.
Fuel Supply Agreement
Pursuant to the terms of the 20-year Fuel Supply Agreement between the Partnership and Southwest Convenience Stores, LLC(“Southwest”), a subsidiary of Alon Energy, the Partnership supplies substantially all of the motor fuel requirements of Alon Energy’sretail convenience stores. The volume of motor fuels sold under the Fuel Supply Agreement is determined monthly based upon Southwest’sestimated requirements. Southwest purchases such motor fuels at a price equal to the market price per unit in effect at the time of deliveryless applicable terminal discounts plus all applicable freight, taxes, pipeline tariff and delivery place differentials.
The Fuel Supply Agreement additionally provides for (i) Southwest’s mandatory participation in the Partnership’s credit card paymentnetwork, (ii) Southwest’s use of the “Alon” name and related marks in connection with the use of the credit card payment network and theresale of the motor fuels purchased pursuant to the Fuel Supply Agreement, and (iii) marketing services for the benefit of Southwest (at anadditional cost).
58

Table of Contents
Asphalt Supply Agreement
The Partnership also entered into a 20-year Asphalt Supply Agreement with Alon Asphalt Company (“Alon Asphalt”), a subsidiary ofAlon Energy, under which Alon Asphalt purchases all of the asphalt produced by the Partnership. The volume of asphalt sold pursuant tothe Asphalt Supply Agreement is based upon actual production, but the Partnership is required to provide good faith non-binding forecastsof its monthly production estimates for each contract year.
Products are sold under the Asphalt Supply Agreement at prices equal to the three day average price for such product, determined byreference to the value derived from the pricing formula set forth in the Asphalt Supply Agreement for such product on the day of deliveryor lifting and for the two business days prior to the date of delivery or lifting. Products with a contract term exceeding one year require theparties to meet annually to reexamine the price for such product.
Leasing Agreements
In June 2014, we entered into six-year lease agreements with a subsidiary of Alon Energy to lease equipment at the Big Springrefinery. The lease agreements were effective July 1, 2014 and require fixed monthly payments amounting to $4.9 million annually. Theseagreements were reviewed and approved by the Conflicts Committee of the General Partner.
ITEM 14. PRINCIPAL ACCOUNTANT FEES AND SERVICES.
Audit Fees. The aggregate fees billed by KPMG LLP (“KPMG”) for professional services rendered for the audit of Alon’s annualfinancial statements, the review of the financial statements included in this Annual Report on Form 10-K and quarterly reports on Form 10-Q were $0.4 million and $0.4 million for the years ended December 31, 2016 and 2015, respectively.
Audit-Related Fees. There were no fees billed by KPMG for assurance and related services related to the performance of audits orreview of our financial statements and not described above under “Audit Fees” in 2016 and 2015.
Tax Fees. No fees were billed by KPMG for professional services rendered for tax compliance, tax advice and tax planning in 2016and 2015.
All Other Fees. No fees were billed by KPMG for products and services not described above in 2016 and 2015.
Pre-Approval Policies and Procedures. In general, all engagements of our outside auditors, whether for auditing or non-auditingservices, must be pre-approved by the Audit Committee of our General Partner. During 2016, all of the services performed for us byKPMG were pre-approved by the Audit Committee of our General Partner. The Audit Committee has considered the compatibility of non-audit services with KPMG’s independence and believes the provision of such non-audit services is compatible with KPMG maintaining itsindependence.
59

Table of Contents
PART IV
ITEM 15. EXHIBITS AND FINANCIAL STATEMENT SCHEDULES.
The following documents are filed as part of this report:
1. Financial Statements. See “Index to Consolidated Financial Statements” on page F-1.
2. Financial Statement Schedules and Other Financial Information. All financial statement schedules are omitted because either theyare not applicable or the required information is included in the consolidated financial statements or notes included herein.
3. Exhibits. Exhibits filed as part of this Form 10-K are asfollows:
Exhibit No. Description of Exhibit
3.1
Certificate of Limited Partnership of Alon USA Partners, LP (incorporated by reference to Exhibit 3.1 to Form S-1, filedby the Partnership on August 31, 2012, SEC File No. 333-183671).
3.2
First Amended and Restated Agreement of Limited Partnership of Alon USA Partners, LP, dated November 26, 2012(incorporated by reference to Exhibit 3.1 to Form 8-K, filed by the Partnership on November 26, 2012, SEC File No.001-35742).
10.1
Omnibus Agreement by and among Alon USA Partners, LP, Alon USA Partners GP, LLC, Alon Assets, Inc. and AlonUSA Energy, Inc., dated November 26, 2012 (incorporated by reference to Exhibit 10.1 to Form 8-K, filed by thePartnership on November 26, 2012, SEC File No. 001-35742).
10.2
Services Agreement by and among Alon USA Partners, LP, Alon USA Partners GP, LLC by and Alon USA Energy,Inc., dated November 26, 2012 (incorporated by reference to Exhibit 10.2 to Form 8-K, filed by the Partnership onNovember 26, 2012, SEC File No. 001-35742).
10.3
Tax Sharing Agreement by and among Alon USA Partners, LP and Alon USA Energy, Inc., dated November 26, 2012(incorporated by reference to Exhibit 10.3 to Form 8-K, filed by the Partnership on November 26, 2012, SEC File No.001-35742).
10.4
Distributor Sales Agreement by and among Alon USA, LP and Southwest Convenience Stores, LLC, dated November26, 2012 (incorporated by reference to Exhibit 10.4 to Form 8-K, filed by the Partnership on November 26, 2012, SECFile No. 001-35742).
10.5
Offtake Agreement by and among Alon USA, LP and Paramount Petroleum Corporation, dated November 26, 2012(incorporated by reference to Exhibit 10.5 to Form 8-K, filed by the Partnership on November 26, 2012, SEC File No.001-35742).
10.6
Contribution, Conveyance and Assumption Agreement by and among Alon Assets, Inc., Alon USA Partners GP, LLC,Alon USA Partners, LP, Alon USA Energy, Inc., Alon USA Refining, LLC, Alon USA Operating, Inc., Alon USA, LPand Alon USA GP, LLC, dated November 26, 2012 (incorporated by reference to Exhibit 10.6 to Form 8-K, filed by thePartnership on November 26, 2012, SEC File No. 001-35742).
10.7*
Alon USA Partners, LP 2012 Long-Term Incentive Plan, adopted as of November 26, 2012 (incorporated by reference toExhibit 10.7 to Form 8-K, filed by the Partnership on November 26, 2012, SEC File No. 001-35742).
10.8
Credit and Guaranty Agreement, dated as of November 26, 2012, among Alon USA Partners, LP, Alon USA PartnersGP, LLC and certain subsidiaries of Alon USA Partners, LP, as Guarantors, the lenders party thereto and Credit SuisseAG, as Administrative Agent and Collateral Agent (incorporated by reference to Exhibit 10.1 to Form 8-K, filed by thePartnership on November 30, 2012, SEC File No. 001-35742).
10.9†
Second Amended and Restated Supply and Offtake Agreement dated as of February 1, 2015 between J. Aron &Company and Alon USA, LP (incorporated by reference to Exhibit 10.1 to Alon USA Energy, Inc.’s Quarterly Report onForm 10-Q filed on May 8, 2015, File No. 001-32567).
10.10
Pipelines and Terminals Agreement, dated February 28, 2005, between Alon USA, LP and Holly Energy Partners, L.P.(incorporated by reference to Exhibit 10.8 to Alon USA Energy, Inc.’s Registration Statement on Form S-1, filed May11, 2005, Registration No. 333-124797).
10.11
First Amendment of Pipelines and Terminals Agreement, effective as of September 1, 2008, between Holly EnergyPartners, L.P. and Alon USA, LP (incorporated by reference to Exhibit 10.24 to Form S-1, filed by the Partnership onOctober 26, 2012, SEC File No. 333-183671).
10.12
Second Amendment to Pipelines and Terminals Agreement, dated as of March 1, 2011, between Holly Energy Partners,L.P. and Alon USA, LP (incorporated by reference to Exhibit 10.25 to Form S-1, filed by the Partnership on October 26,2012, SEC File No. 333-183671).
60

Table of Contents
Exhibit No. Description of Exhibit
10.13
Third Amendment to Pipelines and Terminals Agreement, dated as of June 6, 2011, between Holly Energy Partners, L.P.and Alon USA, LP (incorporated by reference to Exhibit 10.26 to Form S-1, filed by the Partnership on October 26,2012, SEC File No. 333-183671).
10.14
Pipeline Lease Agreement, dated as of December 12, 2007, between Plains Pipeline, L.P. and Alon USA, L.P.(incorporated by reference to Exhibit 10.1 to Alon USA Energy, Inc.’s Current Report on Form 8-K filed on February 5,2008, File No. 001-32567).
10.15
Pipelines Lease Agreement, dated as of February 21, 1997, between Navajo Pipeline Company and American PetrofinaPipe Line Company (incorporated by reference to Exhibit 10.6 to Alon USA Energy, Inc.’s Registration Statement onForm S-1, filed May 11, 2005, Registration No. 333-124797).
10.16
Connection and Shipping Agreement, dated June 14, 2006, by and between Centurion Pipeline L.P. and Alon USA, LP(incorporated by reference to Exhibit 10.29 to Form S-1, filed by the Partnership on October 26, 2012, SEC File No.333-183671).
10.17
Amendment No. 1 to Connection and Shipping Agreement, effective as of April 1, 2012, by and between Alon USA, LPand Centurion Pipeline L.P. (incorporated by reference to Exhibit 10.30 to Form S-1, filed by the Partnership on October26, 2012, SEC File No. 333-183671).
10.18
Second Amended Revolving Credit Agreement, dated as of May 23, 2013, by and among Alon USA, LP, Israel DiscountBank of New York, Bank Leumi USA and certain other guarantor companies and financial institutions from time to timenamed therein (incorporated by reference to Exhibit 10.1 to Form 8-K, filed by the Partnership on May 24, 2013, SECFile No. 001-35742).
10.19*
Second Amendment to Second Amended Revolving Credit Agreement and Partial Release, dated May 6, 2015, by andamong Alon USA, LP, Alon USA Energy, Inc., the lenders party thereto, Alon Israel Discount Bank of New York, asAdministrative Agent, Co-Arranger and Collateral Agent for the Lenders and Bank Leumi USA, as Co-Arranger for theLenders (incorporated by reference to Exhibit 10.4 to Alon USA Energy, Inc.’s Form 10-Q filed on May 8, 2015, FileNo., 001-32567).
10.20*
Directors’ Compensation Summary (incorporated by reference to Exhibit 10.22 to Form S-1, filed by Alon USAPartners, LP on October 31, 2012, SEC File No. 333-183671).
10.21*
Form of Restricted Unit Agreement (incorporated by reference to Exhibit 10.34 to Form S-1, filed by Alon USAPartners, LP on October 31, 2012, SEC File No. 333-183671).
21.1 List of Subsidiaries of Alon USA Partners, LP.23.1 Consent of KPMG LLP.31.1 Certifications of Chief Executive Officer pursuant to §302 of the Sarbanes-Oxley Act of 2002.31.2 Certifications of Chief Financial Officer pursuant to §302 of the Sarbanes-Oxley Act of 2002.32.1
Certification of Chief Executive Officer and Chief Financial Officer pursuant to 18 U.S.C. §1350, as adopted pursuant to§906 of the Sarbanes-Oxley Act of 2002.
101
The following financial information from Alon USA Partners, LP's Annual Report on Form 10-K for the year endedDecember 31, 2016, formatted in XBRL (Extensible Business Reporting Language): (i) Consolidated Balance Sheets,(ii) Consolidated Statements of Operations, (iii) Consolidated Statement of Partners' Equity, (iv) ConsolidatedStatements of Cash Flows and (v) Notes to Consolidated Financial Statements.
______________________
* Identifies management contracts and compensatory plans orarrangements.
† Filed under confidential treatmentrequest.
61

Table of Contents
ALON USA PARTNERS, LP AND SUBSIDIARIESINDEX TO CONSOLIDATED FINANCIAL STATEMENTS
PageAudited Consolidated Financial Statements: Reports of Independent Registered Public Accounting Firm F-2Consolidated Balance Sheets as of December 31, 2016 and 2015 F-4Consolidated Statements of Operations for the Years Ended December 31, 2016, 2015 and 2014 F-5Consolidated Statement of Partners’ Equity for the Years Ended December 31, 2016, 2015 and 2014 F-6Consolidated Statements of Cash Flows for the Years Ended December 31, 2016, 2015 and 2014 F-7Notes to Consolidated Financial Statements F-8

Table of Contents
Report of Independent Registered Public Accounting Firm
The Board of Directors of Alon USA Partners GP, LLC andUnit Holders of Alon USA Partners, LP:
We have audited the accompanying consolidated balance sheets of Alon USA Partners, LP and subsidiaries as of December 31,2016 and 2015, and the related consolidated statements of operations, partners’ equity, and cash flows for each of the years in thethree‑year period ended December 31, 2016. These consolidated financial statements are the responsibility of the Partnership’smanagement. Our responsibility is to express an opinion on these consolidated financial statements based on our audits.
We conducted our audits in accordance with the standards of the Public Company Accounting Oversight Board (United States).Those standards require that we plan and perform the audit to obtain reasonable assurance about whether the financial statementsare free of material misstatement. An audit includes examining, on a test basis, evidence supporting the amounts and disclosuresin the financial statements. An audit also includes assessing the accounting principles used and significant estimates made bymanagement, as well as evaluating the overall financial statement presentation. We believe that our audits provide a reasonablebasis for our opinion.
In our opinion, the consolidated financial statements referred to above present fairly, in all material respects, the financialposition of Alon USA Partners, LP and subsidiaries as of December 31, 2016 and 2015, and the results of their operations andtheir cash flows for each of the years in the three‑year period ended December 31, 2016, in conformity with U.S. generallyaccepted accounting principles.
We also have audited, in accordance with the standards of the Public Company Accounting Oversight Board (United States),Alon USA Partners, LP’s internal control over financial reporting as of December 31, 2016, based on criteria established inInternal Control - Integrated Framework (2013) issued by the Committee of Sponsoring Organizations of the TreadwayCommission (COSO), and our report dated February 27, 2017 expressed an unqualified opinion on the effectiveness of thePartnership’s internal control over financial reporting.
/s/ KPMG LLP
Dallas, TexasFebruary 27, 2017
F-2

Table of Contents
Report of Independent Registered Public Accounting Firm
The Board of Directors of Alon USA Partners GP, LLC andUnit Holders of Alon USA Partners, LP:
We have audited Alon USA Partners, LP’s internal control over financial reporting as of December 31, 2016, based on criteriaestablished in Internal Control - Integrated Framework (2013) issued by the Committee of Sponsoring Organizations of theTreadway Commission (COSO). Alon USA Partners, LP’s management is responsible for maintaining effective internal controlover financial reporting and for its assessment of the effectiveness of internal control over financial reporting, included in theaccompanying Management’s Report on Internal Control over Financial Reporting. Our responsibility is to express an opinionon the Partnership’s internal control over financial reporting based on our audit.
We conducted our audit in accordance with the standards of the Public Company Accounting Oversight Board (United States).Those standards require that we plan and perform the audit to obtain reasonable assurance about whether effective internalcontrol over financial reporting was maintained in all material respects. Our audit included obtaining an understanding of internalcontrol over financial reporting, assessing the risk that a material weakness exists, and testing and evaluating the design andoperating effectiveness of internal control based on the assessed risk. Our audit also included performing such other proceduresas we considered necessary in the circumstances. We believe that our audit provides a reasonable basis for our opinion.
A company’s internal control over financial reporting is a process designed to provide reasonable assurance regarding thereliability of financial reporting and the preparation of financial statements for external purposes in accordance with generallyaccepted accounting principles. A company’s internal control over financial reporting includes those policies and procedures that(1) pertain to the maintenance of records that, in reasonable detail, accurately and fairly reflect the transactions and dispositionsof the assets of the company; (2) provide reasonable assurance that transactions are recorded as necessary to permit preparationof financial statements in accordance with generally accepted accounting principles, and that receipts and expenditures of thecompany are being made only in accordance with authorizations of management and directors of the company; and (3) providereasonable assurance regarding prevention or timely detection of unauthorized acquisition, use, or disposition of the company’sassets that could have a material effect on the financial statements.
Because of its inherent limitations, internal control over financial reporting may not prevent or detect misstatements. Also,projections of any evaluation of effectiveness to future periods are subject to the risk that controls may become inadequatebecause of changes in conditions, or that the degree of compliance with the policies or procedures may deteriorate.
In our opinion, Alon USA Partners, LP maintained, in all material respects, effective internal control over financial reporting asof December 31, 2016, based on criteria established in Internal Control - Integrated Framework (2013) issued by the Committeeof Sponsoring Organizations of the Treadway Commission (COSO).
We also have audited, in accordance with the standards of the Public Company Accounting Oversight Board (United States), theconsolidated balance sheets of Alon USA Partners, LP and subsidiaries as of December 31, 2016 and 2015, and the relatedconsolidated statements of operations, partners’ equity, and cash flows for each of the years in the three‑year period endedDecember 31, 2016, and our report dated February 27, 2017 expressed an unqualified opinion on those consolidated financialstatements.
/s/ KPMG LLP
Dallas, TexasFebruary 27, 2017
F-3

Table of Contents
ALON USA PARTNERS, LP AND SUBSIDIARIESCONSOLIDATED BALANCE SHEETS
(dollars in thousands)
As of December 31,
2016 2015
ASSETS Current assets:
Cash and cash equivalents $ 73,524 $ 132,953Accounts and other receivables, net 82,292 59,581Accounts and other receivables, net - related parties 11,425 8,005Inventories 49,682 35,444Prepaid expenses and other current assets 4,949 6,745
Total current assets 221,872 242,728Property, plant and equipment, net 420,554 434,619Other assets, net 53,211 71,237
Total assets $ 695,637 $ 748,584LIABILITIES AND PARTNERS’ EQUITY
Current liabilities: Accounts payable $ 249,835 $ 253,325Accrued liabilities 43,100 40,707Current portion of long-term debt 2,500 2,500
Total current liabilities 295,435 296,532Other non-current liabilities 62,880 31,513Long-term debt 233,819 289,582
Total liabilities 592,134 617,627Commitments and contingencies (Note 15) Partners’ equity:
General Partner— —
Common unitholders - 62,520,220 and 62,510,039 units issued and outstanding at December31, 2016 and 2015, respectively 103,503 130,957
Total partners’ equity 103,503 130,957Total liabilities and partners’ equity $ 695,637 $ 748,584
The accompanying notes are an integral part of these consolidated financial statements.
F-4

Table of Contents
ALON USA PARTNERS, LP AND SUBSIDIARIESCONSOLIDATED STATEMENTS OF OPERATIONS
(dollars in thousands, except per unit data)
Year Ended December 31,
2016 2015 2014
Net sales (1) $ 1,807,732 $ 2,157,191 $ 3,221,373Operating costs and expenses:
Cost of sales 1,588,219 1,767,291 2,823,694Direct operating expenses 97,338 98,929 105,760Selling, general and administrative expenses 31,983 32,353 26,446Depreciation and amortization 57,524 55,112 47,494
Total operating costs and expenses 1,775,064 1,953,685 3,003,394Operating income 32,668 203,506 217,979Interest expense (37,128) (45,987) (46,706)Other income, net 593 52 646Income (loss) before state income tax expense (3,867) 157,571 171,919State income tax expense 537 672 2,784Net income (loss) $ (4,404) $ 156,899 $ 169,135Earnings (loss) per unit $ (0.07) $ 2.51 $ 2.71Weighted average common units outstanding (in thousands) 62,516 62,509 62,505Cash distribution per unit $ 0.37 $ 3.43 $ 2.02
___________(1) Includes sales to related parties of $307,497, $358,194 and $563,008 for the years ended December 31, 2016, 2015 and 2014,
respectively.ALON USA PARTNERS, LP AND SUBSIDIARIES
CONSOLIDATED STATEMENT OF PARTNERS’ EQUITY(dollars in thousands)
Common
Unitholders General Partner Total Partners’
EquityBalance at December 31, 2013 $ 145,442 $ — $ 145,442Unit-based compensation 87 — 87Distributions paid to unitholders (126,262) — (126,262)Net income 169,135 — 169,135Balance at December 31, 2014 188,402 — 188,402Unit-based compensation 61 — 61Distributions paid to unitholders (214,405) — (214,405)Net income 156,899 — 156,899Balance at December 31, 2015 130,957 — 130,957Unit-based compensation 82 — 82Distributions paid to unitholders (23,132) — (23,132)Net loss (4,404) — (4,404)Balance at December 31, 2016 $ 103,503 $ — $ 103,503
The accompanying notes are an integral part of these consolidated financial statements.
F-5
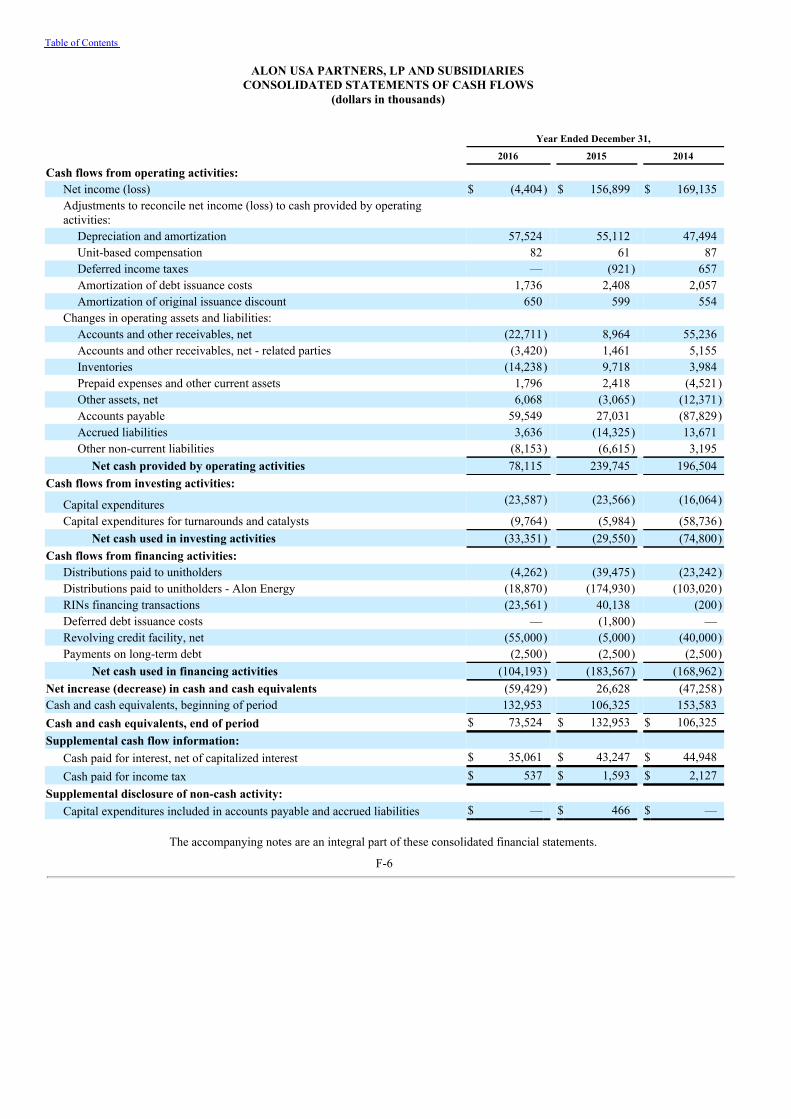
Table of Contents
ALON USA PARTNERS, LP AND SUBSIDIARIESCONSOLIDATED STATEMENTS OF CASH FLOWS
(dollars in thousands)
Year Ended December 31,
2016 2015 2014
Cash flows from operating activities: Net income (loss) $ (4,404) $ 156,899 $ 169,135Adjustments to reconcile net income (loss) to cash provided by operatingactivities:
Depreciation and amortization 57,524 55,112 47,494Unit-based compensation 82 61 87Deferred income taxes — (921) 657Amortization of debt issuance costs 1,736 2,408 2,057Amortization of original issuance discount 650 599 554
Changes in operating assets and liabilities: Accounts and other receivables, net (22,711) 8,964 55,236Accounts and other receivables, net - related parties (3,420) 1,461 5,155Inventories (14,238) 9,718 3,984Prepaid expenses and other current assets 1,796 2,418 (4,521)Other assets, net 6,068 (3,065) (12,371)Accounts payable 59,549 27,031 (87,829)Accrued liabilities 3,636 (14,325) 13,671Other non-current liabilities (8,153) (6,615) 3,195
Net cash provided by operating activities 78,115 239,745 196,504Cash flows from investing activities:
Capital expenditures (23,587) (23,566) (16,064)
Capital expenditures for turnarounds and catalysts (9,764) (5,984) (58,736)Net cash used in investing activities (33,351) (29,550) (74,800)
Cash flows from financing activities: Distributions paid to unitholders (4,262) (39,475) (23,242)Distributions paid to unitholders - Alon Energy (18,870) (174,930) (103,020)RINs financing transactions (23,561) 40,138 (200)Deferred debt issuance costs — (1,800) —Revolving credit facility, net (55,000) (5,000) (40,000)Payments on long-term debt (2,500) (2,500) (2,500)
Net cash used in financing activities (104,193) (183,567) (168,962)Net increase (decrease) in cash and cash equivalents (59,429) 26,628 (47,258)Cash and cash equivalents, beginning of period 132,953 106,325 153,583Cash and cash equivalents, end of period $ 73,524 $ 132,953 $ 106,325Supplemental cash flow information:
Cash paid for interest, net of capitalized interest $ 35,061 $ 43,247 $ 44,948Cash paid for income tax $ 537 $ 1,593 $ 2,127
Supplemental disclosure of non-cash activity: Capital expenditures included in accounts payable and accrued liabilities $ — $ 466 $ —
The accompanying notes are an integral part of these consolidated financial statements.
F-6

Table of Contents
ALON USA PARTNERS, LPNOTES TO CONSOLIDATED FINANCIAL STATEMENTS
(dollars in thousands)
(1) Description and Nature ofBusiness
As used in this report, the terms “Alon,” the “Partnership,” “we,” “our” and “us” or like terms refer to Alon USA Partners, LP, and itsconsolidated subsidiaries or to Alon USA Partners, LP or an individual subsidiary. References in this report to “Alon Energy” refercollectively to Alon USA Energy, Inc. and any of its subsidiaries, other than Alon USA Partners, LP, its subsidiaries and its general partner.
We are a Delaware limited partnership formed in August 2012 by Alon Energy and Alon USA Partners GP, LLC (the “GeneralPartner”). The General Partner, a wholly-owned subsidiary of Alon Energy, owns 100% of our general partner interest, which is a non-economic interest.
We are engaged principally in the business of operating a crude oil refinery in Big Spring, Texas, with a crude oil throughput capacityof 73,000 barrels per day. We refine crude oil into finished products, which are marketed primarily in Central and West Texas, Oklahoma,New Mexico and Arizona through our integrated wholesale distribution network to both Alon Energy’s retail convenience stores and otherthird-party distributors. We distribute fuel products through a network of pipelines and terminals that we own or access through leases orlong-term throughput agreements.
For financial reporting purposes, we operate in a single reportable segment based on how our business is managed.
(2) Summary of Significant AccountingPolicies
(a) Basis of PresentationThe consolidated financial statements and related notes include the accounts of Alon USA Partners, LP and its consolidated
subsidiaries. All significant intercompany balances and transactions have been eliminated.
(b) Use of EstimatesThese consolidated financial statements have been prepared in accordance with accounting principles generally accepted in the United
States of America (“U.S. GAAP”), which requires management to make estimates and assumptions that affect the reported amounts ofassets and liabilities and disclosure of contingent assets and liabilities at the date of the consolidated financial statements and the reportedamounts of revenues and expenses during the reporting period. Actual results could differ from those estimates.
(c) Revenue RecognitionSubstantially all of our revenues are derived from the sale of refined products. Revenues from sales of refined products are earned and
realized upon transfer of title to the customer based on the contractual terms of delivery (including payment terms and prices). Generally,title transfers at the refinery or terminal when the refined product is loaded into the common carrier pipelines, trucks or railcars (free onboard origin). In some situations, title transfers at the customer’s destination (free on board destination).
We occasionally enter into refined product buy/sell arrangements, which involve linked purchases and sales related to refined productsales contracts entered into to address location, quality or grade requirements. These buy/sell transactions are included on a net basis insales in the consolidated statements of operations and profits are recognized when the exchanged product is sold.
Revenue from our inventory financing agreement (Note 7) is reported on a gross basis as we are considered a principal in thisagreement.
In the ordinary course of business, logistical and refinery production schedules necessitate the occasional sale of crude oil to thirdparties. All purchases and sales of crude oil are recorded net in cost of sales in the consolidated statements of operations.
(d) Cost ClassificationsCost of sales includes principally crude oil, blending materials, RINs, other raw materials and transportation costs, which include costs
associated with our crude oil and product pipelines. Cost of sales excludes depreciation and amortization, which is presented separately inthe consolidated statements of operations.
Direct operating expenses include costs associated with the actual operations of the refinery, such as energy and utility costs, routinemaintenance, labor, insurance and environmental compliance costs. These costs also include actual costs incurred by Alon Energy andallocated to us.
F-7

Table of Contents
ALON USA PARTNERS, LPNOTES TO CONSOLIDATED FINANCIAL STATEMENTS—Continued
(dollars in thousands)
Selling, general and administrative expenses primarily include corporate overhead costs and marketing expenses. These costs alsoinclude actual costs incurred by Alon Energy and allocated to us.
Interest expense includes interest expense, letters of credit, financing costs associated with crude oil purchases, financing fees andamortization of both original issuance discount and deferred debt issuance costs but excludes capitalized interest. Original issuancediscount and debt issuance costs are amortized over the term of the related debt using the effective interest method.
(e) Cash and Cash Equivalents
All highly-liquid instruments with a maturity of three months or less at the time of purchase are considered to be cash equivalents.Cash equivalents are stated at cost, which approximates market value.
(f) Accounts Receivable
Financial instruments that potentially subject us to concentration of credit risk consist primarily of trade accounts receivables. Credit isextended based on evaluation of the customer’s financial condition. We perform ongoing credit evaluations of our customers and requireletters of credit, prepayments or other collateral or guarantees as management deems appropriate. Allowance for doubtful accounts is basedon a combination of current sales and specific identification methods.
Credit risk is minimized as a result of the ongoing credit assessment of our customers and a lack of concentration in our customer base.Credit losses are charged to allowance for doubtful accounts when deemed uncollectible. Our allowance for doubtful accounts is reflectedas a reduction of accounts receivable in the consolidated balance sheets.
The balance in allowance for doubtful accounts was $172, $172 and $220 for the years ended December 31, 2016, 2015 and 2014,respectively.
(g) Inventories
Crude oil, refined products and blendstocks (including crude oil consignment inventory) are stated at the lower of cost or market. Costis determined under the last-in, first-out (“LIFO”) valuation method and market is determined using current estimated selling prices. Underthe LIFO valuation method, the most recently incurred costs are charged to cost of sales and inventories are valued at the earliestacquisition costs. In periods of rapidly declining prices, LIFO inventories may have to be written down to market value due to the highercosts assigned to LIFO layers in prior periods. An inventory write-down to market value results in a non-cash accounting adjustment,decreasing the value of our inventory and increasing our cost of sales. Such charges are subject to reversal in subsequent periods, not toexceed LIFO cost, if prices recover. In addition, the use of the LIFO inventory method may result in increases or decreases to cost of salesin years when inventory volumes decline and result in charging cost of sales with LIFO inventory costs generated in prior periods. Materialsand supplies are stated at average cost.
Crude oil inventory consigned to others represents inventory that was sold to third parties, which we are obligated to repurchase at theend of the respective agreements (Note 7). As a result of this requirement to repurchase the inventory, no revenue was recorded on thesetransactions and the inventory volumes remain valued under the LIFO method.
(h) Hedging Activity
We participate in Alon Energy’s company-wide risk management program. Under Alon Energy’s risk management program, allcommodity forwards, futures, swaps and option contracts are considered to be part of the risk management strategy. All derivativeinstruments are recorded in the consolidated balance sheets as either assets or liabilities measured at their fair value. For commodityderivative contracts not designated as cash flow hedges, the net unrealized gains and losses for changes in fair value are recognized in costof sales in the consolidated statements of operations.
The derivative transaction related to our inventory financing agreement has been designated as a fair value hedge of inventory. Thegain or loss on the derivative instrument designated and qualifying as a fair value hedge, as well as the offsetting gain or loss on the hedgeditem attributable to the hedged risk, is recognized in earnings in the same period.
(i) Property, Plant and Equipment
The carrying value of property, plant and equipment includes the fair value of the asset retirement obligation and has been reflected inthe consolidated balance sheets at cost, net of accumulated depreciation.
Property, plant and equipment, net of salvage value, are depreciated using the straight-line method at rates based on the estimateduseful lives for the assets or groups of assets, beginning in the first month of operation following acquisition or completion. The usefullives of depreciable assets used to determine depreciation expense range from 3 to 20 years. We
F-8

Table of Contents
ALON USA PARTNERS, LPNOTES TO CONSOLIDATED FINANCIAL STATEMENTS—Continued
(dollars in thousands)
capitalize interest costs associated with major construction projects based on the effective interest rate on aggregate borrowings. Leaseholdimprovements are depreciated on the straight-line method over the shorter of the contractual lease terms or the estimated useful lives.
Expenditures for major replacements and additions are capitalized. Expenditures for routine repairs and maintenance costs are chargedto direct operating expense as incurred. The applicable costs and accumulated depreciation of assets that are sold, retired, or otherwisedisposed of are removed from the accounts and the resulting gain or loss is recognized as a gain or loss on disposition of assets in theconsolidated statements of operations.
(j) Impairment of Long-Lived Assets and Assets to be Disposed Of
We review long-lived assets and certain identifiable intangible assets for impairment whenever events or changes in circumstancesindicate that the carrying amount of such assets may not be recoverable. Recoverability of assets to be held and used is measured by acomparison of the carrying value of an asset to future net cash flows expected to be generated by the asset. If the carrying value of an assetexceeds its expected future cash flows, an impairment loss is recognized based on the excess of the carrying value of the impaired assetover its fair value. The future cash flows and fair values used in this assessment are estimates based on management’s judgment andassumptions. Assets to be disposed of are reported at the lower of the carrying amount or fair value less costs of disposition.
(k) Asset Retirement Obligations
We have asset retirement obligations with respect to our refinery due to various legal obligations to clean and/or dispose of these assetsat the time they are retired. However, the majority of these assets can be used for extended and indeterminate periods of time provided thatthey are properly maintained and/or upgraded. It is our practice and intent to continue to maintain these assets and make improvementsbased on technological advances. When a date or range of dates can reasonably be estimated for the retirement of these assets or anycomponent of these assets, we will estimate the cost of performing the retirement activities and record a liability for the fair value of thatcost using established present value techniques (Note 10).
(l) Turnarounds and Catalysts Costs
Our refinery units require regular major maintenance and repairs that are commonly referred to as “turnarounds.” Catalysts used incertain refinery process units are typically replaced in conjunction with planned turnarounds. We record the turnaround and catalysts costsas deferred charges in other assets in the consolidated balance sheets. We amortize the deferred costs on a straight-line basis over theperiod of time estimated until the next turnaround occurs (generally 3 to 5 years), beginning the month after the completion of theturnaround. The amortization of deferred turnaround and catalysts costs are presented in depreciation and amortization in our consolidatedstatements of operations.
(m) Earnings (Loss) per Unit
Earnings (loss) per unit applicable to limited partners is computed by dividing limited partners’ interest in net income (loss) by theweighted average number of outstanding common units.
(n) Income Taxes
We are a partnership for U.S. federal income tax purposes and thus our income is taxed directly to our owners. As a result, we do notincur U.S. federal income taxes.
Alon Energy is subject to the Texas franchise tax and our operations are included in the consolidated Texas franchise tax return ofAlon Energy. For financial reporting purposes, Texas franchise tax is calculated as if a separate return was filed.
Net income for financial statement purposes may differ significantly from taxable income reportable to unitholders as a result ofdifferences between the tax and financial reporting bases of assets and liabilities and the taxable income allocation requirements under thepartnership agreement.
(o) Environmental Expenditures
Environmental expenditures are expensed or capitalized depending on their future economic benefit. Expenditures that relate to anexisting condition caused by past operations and that have no future economic benefit are expensed. Liabilities for expenditures of a non-capital nature are recorded when environmental assessment and/or remediation is probable, and the costs can be reasonably estimated.Environmental liabilities represent the estimated costs to investigate and remediate contamination at our properties. These estimates arebased on internal and third-party assessments of the extent of the contaminations, the selected remediation technology and review ofapplicable environmental regulations.
F-9

Table of Contents
ALON USA PARTNERS, LPNOTES TO CONSOLIDATED FINANCIAL STATEMENTS—Continued
(dollars in thousands)
Costs of future expenditures for environmental remediation obligations are not discounted to their present value unless payments arefixed or reliably determinable. Estimates are updated to reflect changes in factual information, available technology or applicable laws andregulations (Note 15).
Substantially all amounts accrued are expected to be paid out over the next 15 years. The amount of future expenditures forenvironmental remediation obligations cannot be determined with any degree of reliability.
(p) Commitments and Contingencies
Liabilities for loss contingencies arising from claims, assessments, litigation, fines and penalties and other sources are recorded when itis probable that a liability has been incurred and the amount of the assessment and/or remediation can be reasonably estimated. Legal costsincurred in connection with loss contingencies are expensed as incurred.
(q) New Accounting Pronouncements
In May 2014, the Financial Accounting Standards Board (“FASB”) and the International Accounting Standards Board jointly issued acomprehensive new revenue recognition standard that provides accounting guidance for all revenue arising from contracts to provide goodsor services to customers. This standard is intended to improve comparability of revenue recognition practices across entities, industries,jurisdictions and capital markets. The standard allows for either full retrospective adoption or modified retrospective adoption. In August2015, the FASB updated the guidance to include a one-year deferral of the effective date for the new revenue standard, making therequirements of the standard effective for interim and annual periods beginning after December 15, 2017, with early adoption permitted forinterim and annual periods beginning after December 15, 2016. We are evaluating the guidance to determine the method of adoption andthe impact this standard will have on our consolidated financial statements and related disclosures. Based on our initial evaluation, thoughnot currently quantified, the adoption of the standard is not expected to have a material impact on the timing of revenue recognized,statements of operations or cash flows.
In February 2016, the FASB issued new guidance on the accounting for leases, which requires lessees to recognize assets and liabilitieson the balance sheet for the present value of the rights and obligations created by all leases with terms of more than 12 months. The ASUalso will require disclosures designed to give financial statement users information on the amount, timing, and uncertainty of cash flowsarising from leases. The requirements from this guidance are effective for interim and annual periods beginning after December 31, 2018.We are evaluating the guidance to determine the impact this standard will have on our consolidated financial statements.
In June 2016, the FASB issued an accounting standards update requiring the measurement of all expected credit losses for financialassets held at the reporting date based on historical experience, current conditions, and reasonable and supportable forecasts. Financialinstitutions and other organizations will now use forward-looking information to better inform their credit loss estimates. The requirementsfrom the updated standard are effective for interim and annual periods beginning after December 15, 2019. We are evaluating the guidanceto determine the impact this standard will have on our consolidated financial statements.
In August 2016, the FASB issued an accounting standards update addressing eight specific cash flow issues with the objective ofeliminating the existing diversity in practice. The amendments from this update are effective for interim and annual periods beginning afterDecember 15, 2017. We do not expect application of this standard to have a material effect on our consolidated financial statements.
In January 2017, the FASB issued new guidance that changes the definition of a business to assist entities with evaluating when a set oftransferred assets and activities is a business. The amendments from this update are effective for interim and annual periods beginning afterDecember 15, 2017. We do not expect application of this standard to have a material effect on our consolidated financial statements.
F-10

Table of Contents
ALON USA PARTNERS, LPNOTES TO CONSOLIDATED FINANCIAL STATEMENTS—Continued
(dollars in thousands)
(3) FairValue
We determine fair value as the price that would be received to sell an asset or paid to transfer a liability in an orderly transactionbetween market participants at the measurement date. We classify financial assets and financial liabilities into the following fair valuehierarchy:
• Level 1 - valued based on quoted prices in active markets for identical assets andliabilities;
• Level 2 - valued based on quoted prices for similar assets and liabilities in active markets, and inputs other than quoted pricesthat are observable for the asset or liability; and
• Level 3 - valued based on unobservable inputs that are supported by little or no market activity and that are significant to thefair value of the assets or liabilities.
As required, we utilize valuation techniques that maximize the use of observable inputs (levels 1 and 2) and minimize the use ofunobservable inputs (level 3) within the fair value hierarchy. We generally apply the “market approach” to determine fair value. Thismethod uses pricing and other information generated by market transactions for identical or comparable assets and liabilities. Assets andliabilities are classified within the fair value hierarchy based on the lowest level (least observable) input that is significant to themeasurement in its entirety.
The carrying amounts of our cash and cash equivalents, receivables, payables and accrued liabilities approximate fair value due to theshort-term maturities of these assets and liabilities. The reported amounts of long-term debt approximate fair value. Derivative instrumentsare carried at fair value, which are based on quoted market prices. Derivative instruments are our only assets and liabilities measured at fairvalue on a recurring basis.
The following table sets forth the assets and liabilities measured at fair value on a recurring basis, by input level, in the consolidatedbalance sheets as of December 31, 2016 and 2015:
Level 1 Level 2 Level 3 Total
As of December 31, 2016 Assets:
Fair value hedge of consigned inventory $ — $ 4,389 $ — $ 4,389Liabilities:
Commodity contracts (futures and forwards) 689 — — 689 As of December 31, 2015 Assets:
Fair value hedge of consigned inventory $ — $ 11,564 $ — $ 11,564Liabilities:
Commodity contracts (futures and forwards) 40 — — 40
(4) Derivative FinancialInstruments
We selectively utilize crude oil and refined product commodity derivative contracts to reduce the risk associated with potential pricechanges on committed obligations as well as to reduce earnings volatility. We do not speculate using derivative instruments. Credit risk onour derivative instruments is mitigated by transacting with counterparties meeting established collateral and credit criteria.
Mark to Market
We have certain contracts that serve as economic hedges, which are derivatives used for risk management but not designated as hedgesfor financial accounting purposes. All economic hedge transactions are recorded at fair value and any changes in fair value betweenreporting periods are recognized in earnings.
We have contracts that are used to fix prices on forecasted purchases of inventory, which we refer to as futures and forwards. Futuresrepresent trades executed on the New York Mercantile Exchange which have not been closed or settled at the end of the reporting period.Forwards represent physical trades for which pricing and quantities have been set, but the physical product delivery has not occurred by theend of the reporting period.
F-11

Table of Contents
ALON USA PARTNERS, LPNOTES TO CONSOLIDATED FINANCIAL STATEMENTS—Continued
(dollars in thousands)
Fair Value Hedge
Fair value hedges are used to hedge price volatility of certain refining inventories and firm commitments to purchase inventories. Thegain or loss on a derivative instrument designated and qualifying as a fair value hedge, as well as the offsetting gain or loss on the hedgeditem attributable to the hedged risk, is recognized in earnings in the same period.
We have certain commodity contracts associated with the Supply and Offtake Agreement discussed in Note 7 that have been accountedfor as a fair value hedge, which had purchase volumes of 126 thousand barrels of crude oil as of December 31, 2016.
The following tables present the effect of derivative instruments on the consolidated balance sheets:
As of December 31, 2016
Asset Derivatives Liability Derivatives
Balance Sheet Balance Sheet Location Fair Value Location Fair Value
Derivatives not designated as hedging instruments:
Commodity contracts (futures and forwards)Accountsreceivable $ 30 Accrued liabilities $ 719
Total derivatives not designated as hedging instruments 30 719 Derivatives designated as hedging instruments: Fair value hedge of consigned inventory Other assets $ 4,389 $ —
Total derivatives designated as hedging instruments 4,389 —Total derivatives $ 4,419 $ 719
As of December 31, 2015
Asset Derivatives Liability Derivatives
Balance Sheet Balance Sheet Location Fair Value Location Fair Value
Derivatives not designated as hedging instruments:
Commodity contracts (futures and forwards)Accountsreceivable $ 59 Accrued liabilities $ 99
Total derivatives not designated as hedging instruments 59 99 Derivatives designated as hedging instruments: Fair value hedge of consigned inventory Other assets $ 11,564 $ —
Total derivatives designated as hedging instruments 11,564 —Total derivatives $ 11,623 $ 99
The following tables present the effect of derivative instruments on the consolidated statements of operations:
Derivatives in fair value hedging relationships:
Gain (Loss) Recognized in Income Year Ended December 31,
Location 2016 2015 2014
Fair value hedge of consigned inventory (1) Interest expense $ (7,175) $ 1,341 $ 12,527Total derivatives $ (7,175) $ 1,341 $ 12,527
_______________________
(1) Changes in the fair value hedge are substantially offset in earnings by changes in the hedgeditem.
F-12
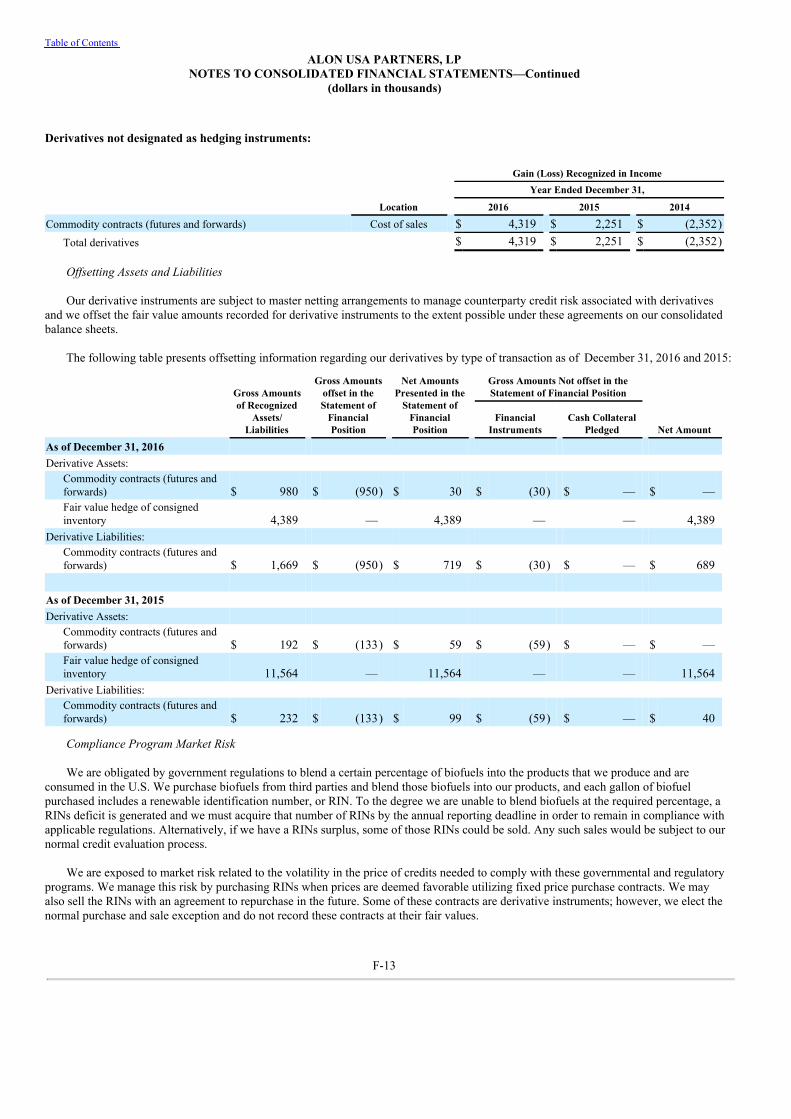
Table of Contents
ALON USA PARTNERS, LPNOTES TO CONSOLIDATED FINANCIAL STATEMENTS—Continued
(dollars in thousands)
Derivatives not designated as hedging instruments:
Gain (Loss) Recognized in Income Year Ended December 31,
Location 2016 2015 2014
Commodity contracts (futures and forwards) Cost of sales $ 4,319 $ 2,251 $ (2,352)Total derivatives $ 4,319 $ 2,251 $ (2,352)
Offsetting Assets and Liabilities
Our derivative instruments are subject to master netting arrangements to manage counterparty credit risk associated with derivativesand we offset the fair value amounts recorded for derivative instruments to the extent possible under these agreements on our consolidatedbalance sheets.
The following table presents offsetting information regarding our derivatives by type of transaction as of December 31, 2016 and 2015:
Gross Amountsof Recognized
Assets/Liabilities
Gross Amounts
offset in theStatement of
FinancialPosition
Net Amounts
Presented in theStatement of
FinancialPosition
Gross Amounts Not offset in theStatement of Financial Position
Net Amount Financial
Instruments Cash Collateral
Pledged As of December 31, 2016 Derivative Assets:
Commodity contracts (futures andforwards) $ 980 $ (950) $ 30 $ (30) $ — $ —Fair value hedge of consignedinventory 4,389 — 4,389 — — 4,389
Derivative Liabilities: Commodity contracts (futures andforwards) $ 1,669 $ (950) $ 719 $ (30) $ — $ 689
As of December 31, 2015 Derivative Assets:
Commodity contracts (futures andforwards) $ 192 $ (133) $ 59 $ (59) $ — $ —Fair value hedge of consignedinventory 11,564 — 11,564 — — 11,564
Derivative Liabilities: Commodity contracts (futures andforwards) $ 232 $ (133) $ 99 $ (59) $ — $ 40
Compliance Program Market Risk
We are obligated by government regulations to blend a certain percentage of biofuels into the products that we produce and areconsumed in the U.S. We purchase biofuels from third parties and blend those biofuels into our products, and each gallon of biofuelpurchased includes a renewable identification number, or RIN. To the degree we are unable to blend biofuels at the required percentage, aRINs deficit is generated and we must acquire that number of RINs by the annual reporting deadline in order to remain in compliance withapplicable regulations. Alternatively, if we have a RINs surplus, some of those RINs could be sold. Any such sales would be subject to ournormal credit evaluation process.
We are exposed to market risk related to the volatility in the price of credits needed to comply with these governmental and regulatoryprograms. We manage this risk by purchasing RINs when prices are deemed favorable utilizing fixed price purchase contracts. We mayalso sell the RINs with an agreement to repurchase in the future. Some of these contracts are derivative instruments; however, we elect thenormal purchase and sale exception and do not record these contracts at their fair values.
F-13

Table of Contents
ALON USA PARTNERS, LPNOTES TO CONSOLIDATED FINANCIAL STATEMENTS—Continued
(dollars in thousands)
The cost of meeting our obligations under these compliance programs was $14,262, $11,500 and $6,697 for the years endedDecember 31, 2016, 2015 and 2014, respectively. These amounts are reflected in cost of sales in the consolidated statements of operations.
(5) SignificantCustomers
For the year ended December 31, 2016, we had two third-party customers and related party customers which account forapproximately 43% of net sales. Individually, third-party customers accounted for 14% and 12% of net sales and related party customersaccounted for 17% of net sales for the year ended December 31, 2016.
For the year ended December 31, 2015, we had one third-party customer and related party customers which account for approximately27% of net sales. Individually, third-party customer accounted for 12% of net sales and related party customers accounted for 15% of netsales for the year ended December 31, 2015.
For the year ended December 31, 2014, we had two third-party customers and related party customers which account forapproximately 43% of net sales. Individually, third-party customers accounted for 13% and 13% of net sales and related party customersaccounted for 17% of net sales for the year ended December 31, 2014.
At December 31, 2016 and 2015, 33% and 21%, respectively, of total third-party and related party accounts and other receivables, netwere from significant customers discussed above.
(6) Inventories
Carrying value of inventories consisted of the following:
As of December 31,
2016 2015
Crude oil, refined products and blendstocks $ 36,259 $ 24,548Crude oil consignment inventory (Note 7) (1) 1,850 (95)Materials and supplies 11,573 10,991
Total inventories $ 49,682 $ 35,444_______________________
(1) The fair value of the hedged item designated in our fair value hedge reduced the carrying value of our consigned inventory valuedat LIFO below zero at December 31, 2015.
Reductions of crude oil inventory volumes during 2015 resulted in a liquidation of LIFO inventory layers. The liquidations increasedcost of sales by $7,878. There were no liquidations of LIFO inventory layers during 2016 and 2014.
At December 31, 2016 and 2015, the market value of our refined products and blendstock inventories was less than inventories valuedon a LIFO cost basis which resulted in a lower of cost or market reserve of $6,213 and $9,396, respectively. At December 31, 2016 and2015, the market value of our crude oil inventories exceeded LIFO costs, net of the fair value hedged item, by $5,236 and $6,387,respectively.
(7) Inventory FinancingAgreement
We have entered into a Supply and Offtake Agreement and other associated agreements (together the “Supply and OfftakeAgreement”), with J. Aron & Company (“J. Aron”). Pursuant to the Supply and Offtake Agreement, (i) J. Aron agreed to sell to us, and weagreed to buy from J. Aron, at market prices, crude oil for processing at our refinery and (ii) we agreed to sell, and J. Aron agreed to buy, atmarket prices, certain refined products produced at our refinery.
The Supply and Offtake Agreement also provided for the sale, at market prices, of our crude oil and certain refined product inventoriesto J. Aron, the lease to J. Aron of crude oil and refined product storage facilities, and the identification of prospective purchasers of refinedproducts on J. Aron’s behalf.
The Supply and Offtake Agreement has an initial term that expires in May 2021. J. Aron may elect to terminate the Supply and OfftakeAgreement prior to the expiration of the initial term beginning in May 2018 and upon each anniversary thereof, on six months prior notice.We may elect to terminate in May 2020 on six months prior notice.
Following expiration or termination of the Supply and Offtake Agreement, we are obligated to purchase the crude oil and refinedproduct inventories then owned by J. Aron and located at the Big Spring refinery at then current market prices.
F-14

Table of Contents
ALON USA PARTNERS, LPNOTES TO CONSOLIDATED FINANCIAL STATEMENTS—Continued
(dollars in thousands)
Associated with the Supply and Offtake Agreement, we have a fair value hedge of our inventory purchase commitment with J. Aronand crude oil inventory consigned to J. Aron (“crude oil consignment inventory”). Additionally, financing charges related to the Supplyand Offtake Agreement are recorded as interest expense in the consolidated statements of operations.
At December 31, 2016 and 2015, we had net current receivables of $10,569 and $4,975, respectively, with J. Aron for sales andpurchases, and a consignment inventory receivable representing a deposit paid to J. Aron of $6,290 and $6,290, respectively. AtDecember 31, 2016 and 2015, we had non-current liabilities for the original financing of $7,550 and $9,761, respectively, net of the relatedfair value hedge.
Additionally, we had net current payables of $719 and $99 at December 31, 2016 and 2015, respectively, for forward commitmentsrelated to month-end consignment inventory target levels differing from projected levels and the associated pricing with these inventorylevel differences.
(8) Property, Plant and Equipment,Net
Property, plant and equipment, net consisted of the following:
As of December 31,
2016 2015
Refining facilities $ 732,697 $ 709,779Accumulated depreciation (312,143) (275,160)
Property, plant and equipment, net $ 420,554 $ 434,619
Depreciation expense for the years ended December 31, 2016, 2015 and 2014 was $36,983, $35,830 and $35,185, respectively.
(9) Other Assets,Net
Other assets, net consisted of the following:
As of December 31,
2016 2015
Deferred turnaround and catalyst costs $ 34,252 $ 43,021Receivable from supply and offtake agreement (Note 7) 6,290 6,290Fair value hedge of consigned inventory (Note 4) 4,389 11,564Other 8,280 10,362
Total other assets $ 53,211 $ 71,237
(10) Accounts Payable, Accrued Liabilities and Other Non-CurrentLiabilities
(a) AccountsPayable
Included in accounts payable was $78,565 and $91,179 related to RINs financing transactions as of December 31, 2016 and 2015,respectively.
F-15

Table of Contents
ALON USA PARTNERS, LPNOTES TO CONSOLIDATED FINANCIAL STATEMENTS—Continued
(dollars in thousands)
(b) Accrued Liabilities and Other Non-CurrentLiabilities
As of December 31,
2016 2015
Accrued Liabilities: Taxes other than income taxes, primarily excise taxes $ 31,882 $ 25,018Accrued finance charges 372 394Environmental accrual (Note 15) 796 1,716Commodity contracts 719 99Other 9,331 13,480
Total accrued liabilities $ 43,100 $ 40,707 Other Non-Current Liabilities:
Consignment inventory obligation (Note 7) $ 11,939 $ 21,325Environmental accrual (Note 15) 5,796 4,725Asset retirement obligations 3,131 2,927RINs financing transactions 39,478 —Other 2,536 2,536
Total other non-current liabilities $ 62,880 $ 31,513
The following table summarizes the activity relating to the asset retirement obligations for the years ended December 31, 2016 and2015:
As of December 31,
2016 2015
Balance at beginning of year $ 2,927 $ 2,084Accretion expense 204 85Revisions in estimated cash flows — 758Retirements — —Additions — —Balance at end of year $ 3,131 $ 2,927
The revisions in estimated cash flows during 2015 include increased tank retirement costs partially offset by changes in expectedinflationary rates.
(11) Indebtedness
Debt consisted of the following:
As of December 31,
2016 2015
Term loan credit facility $ 236,319 $ 237,082Revolving credit facility — 55,000
Total debt 236,319 292,082Less: Current portion 2,500 2,500
Total long-term debt $ 233,819 $ 289,582
F-16
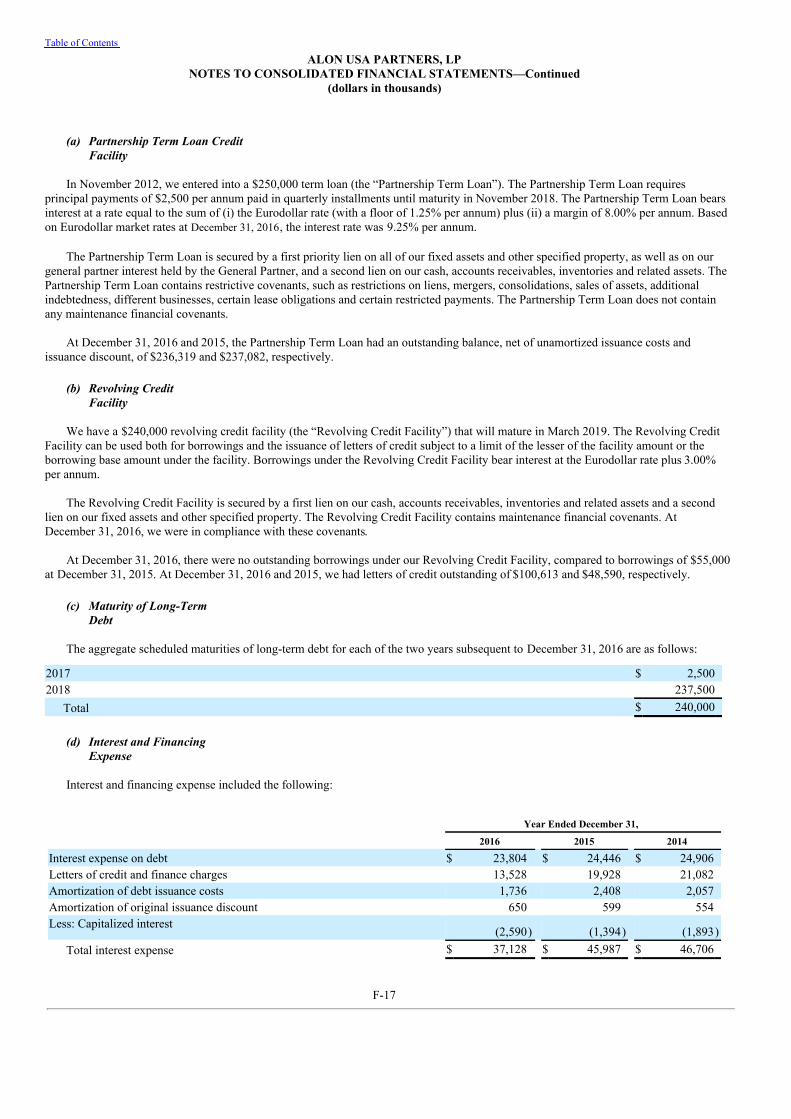
Table of Contents
ALON USA PARTNERS, LPNOTES TO CONSOLIDATED FINANCIAL STATEMENTS—Continued
(dollars in thousands)
(a) Partnership Term Loan CreditFacility
In November 2012, we entered into a $250,000 term loan (the “Partnership Term Loan”). The Partnership Term Loan requiresprincipal payments of $2,500 per annum paid in quarterly installments until maturity in November 2018. The Partnership Term Loan bearsinterest at a rate equal to the sum of (i) the Eurodollar rate (with a floor of 1.25% per annum) plus (ii) a margin of 8.00% per annum. Basedon Eurodollar market rates at December 31, 2016, the interest rate was 9.25% per annum.
The Partnership Term Loan is secured by a first priority lien on all of our fixed assets and other specified property, as well as on ourgeneral partner interest held by the General Partner, and a second lien on our cash, accounts receivables, inventories and related assets. ThePartnership Term Loan contains restrictive covenants, such as restrictions on liens, mergers, consolidations, sales of assets, additionalindebtedness, different businesses, certain lease obligations and certain restricted payments. The Partnership Term Loan does not containany maintenance financial covenants.
At December 31, 2016 and 2015, the Partnership Term Loan had an outstanding balance, net of unamortized issuance costs andissuance discount, of $236,319 and $237,082, respectively.
(b) Revolving CreditFacility
We have a $240,000 revolving credit facility (the “Revolving Credit Facility”) that will mature in March 2019. The Revolving CreditFacility can be used both for borrowings and the issuance of letters of credit subject to a limit of the lesser of the facility amount or theborrowing base amount under the facility. Borrowings under the Revolving Credit Facility bear interest at the Eurodollar rate plus 3.00%per annum.
The Revolving Credit Facility is secured by a first lien on our cash, accounts receivables, inventories and related assets and a secondlien on our fixed assets and other specified property. The Revolving Credit Facility contains maintenance financial covenants. AtDecember 31, 2016, we were in compliance with these covenants.
At December 31, 2016, there were no outstanding borrowings under our Revolving Credit Facility, compared to borrowings of $55,000at December 31, 2015. At December 31, 2016 and 2015, we had letters of credit outstanding of $100,613 and $48,590, respectively.
(c) Maturity of Long-TermDebt
The aggregate scheduled maturities of long-term debt for each of the two years subsequent to December 31, 2016 are as follows:
2017 $ 2,5002018 237,500
Total $ 240,000
(d) Interest and FinancingExpense
Interest and financing expense included the following:
Year Ended December 31,
2016 2015 2014
Interest expense on debt $ 23,804 $ 24,446 $ 24,906Letters of credit and finance charges 13,528 19,928 21,082Amortization of debt issuance costs 1,736 2,408 2,057Amortization of original issuance discount 650 599 554Less: Capitalized interest
(2,590) (1,394) (1,893)Total interest expense $ 37,128 $ 45,987 $ 46,706
F-17

Table of Contents
ALON USA PARTNERS, LPNOTES TO CONSOLIDATED FINANCIAL STATEMENTS—Continued
(dollars in thousands)
(12) IncomeTaxes
We are a partnership for U.S. federal income tax purposes and thus our income is taxed directly to our owners. As a result, we do notincur U.S. federal income taxes.
We are unable to readily determine the net difference in the bases of our assets and liabilities for financial and tax reporting purposesbecause individual unitholders have different investment bases depending upon the timing and price of acquisition of their partnershipunits.
(13) Partners' Equity (unit values indollars)
Our limited partner interests are represented as common units outstanding. As of December 31, 2016 and 2015, we had 62,520,220 and62,510,039 common units issued and outstanding, respectively. As of December 31, 2016, the 11,520,220 common units held by the publicrepresent 18.4% of our common units outstanding. Alon Energy owns the remaining 51,000,000 common units and the General Partner, awholly-owned subsidiary of Alon Energy, owns 100% of our general partner interest, which is a non-economic interest.
Cash Distributions. We have adopted a policy pursuant to which we will distribute all of the available cash generated each quarter, asdefined in the partnership agreement, subject to the approval of the board of directors of the General Partner. The per unit amount ofavailable cash to be distributed each quarter, if any, will be distributed within 60 days following the end of such quarter.
The following table summarizes our cash distribution activity for the years ended December 31, 2016, 2015 and 2014:
Cash Available forDistribution per
Unit (1) Distributions Paid
Per Unit Total Distributions
Paid2016 $ 0.40 $ 0.37 $ 23,1322015 2.81 3.43 214,4052014 2.54 2.02 126,262_______________________
(1) Represents the aggregate cash available for distribution per unit attributable to the period indicated. This represents the differencebetween cash available for distribution and distributions paid in the table above.
Restricted Units. We, through our General Partner, have adopted the Alon USA Partners, LP 2012 Long-Term Incentive Plan (the“LTIP”) for the employees, consultants and the directors of the Partnership, the General Partner and its affiliates who perform services forus. The LTIP provides grants of options, unit appreciation rights, restricted units, phantom units, unit awards, substitute awards, other unit-based awards, cash awards, performance awards and distribution equivalent rights. The maximum aggregate number of common units thatmay be issued under the LTIP shall not exceed 3,125,000 units. As of December 31, 2016, we have issued 20,220 common units under theLTIP.
Non-employee directors of the General Partner are awarded an annual grant of $25 in restricted units, which vest over a period of threeyears, assuming continued service at vesting. During the year ended December 31, 2016, we granted awards of 10,181 restricted commonunits at an average grant date price of $9.82 per unit. During the year ended December 31, 2015, we granted awards of 3,489 restrictedcommon units at an average grant date price of $21.50 per unit.
(14) Related PartyTransactions
Sales and Receivables
Sales to related parties include motor fuels and asphalt sold to other Alon Energy subsidiaries at prices substantially determined byreference to market commodity pricing information. These sales are included in net sales in the consolidated statements of operations.Accounts receivable from related parties includes sales of motor fuels and is shown separately on the consolidated balance sheets.
F-18

Table of Contents
ALON USA PARTNERS, LPNOTES TO CONSOLIDATED FINANCIAL STATEMENTS—Continued
(dollars in thousands)
Costs Allocated from Alon Energy
The Partnership is a subsidiary of Alon Energy and is operated as a component of the integrated operations of Alon Energy. As such,the executive officers of Alon Energy, who are employed by another subsidiary of Alon Energy, also serve as executive officers of theGeneral Partner and Alon Energy’s other subsidiaries.
(a) Corporate OverheadAllocations
Alon Energy performs general corporate and administrative services and functions for us and their other subsidiaries, which includeaccounting, treasury, cash management, tax, information technology, insurance administration and claims processing, legal, environmental,risk management, audit, payroll and employee benefit processing, and internal audit services. Alon Energy allocates the expenses actuallyincurred in performing these services to the Partnership based primarily on the estimated amount of time the individuals performing suchservices devote to our business and affairs relative to the amount of time they devote to the business and affairs of Alon Energy’s othersubsidiaries. The management of Alon Energy and the General Partner consider these allocations to be reasonable. We record the amountof such allocations as selling, general and administrative expenses within our consolidated statements of operations. Our allocation forselling, general and administrative expenses was $14,172, $12,055 and $11,229 for the years ended December 31, 2016, 2015 and 2014,respectively.
(b) LaborCosts
As we are operated as a component of Alon Energy’s integrated operations, we have no employees. As a result, employee expensecosts for Alon Energy employees working in our operations have been allocated to us and recorded as payroll expense in direct operatingexpenses and selling, general and administrative expenses. The allocated portion of Alon Energy’s employee expense costs included indirect operating expenses was $28,840, $27,204 and $26,473 for the years ended December 31, 2016, 2015 and 2014, respectively. Theallocated portion of Alon Energy’s employee expense costs included in selling, general and administrative expenses were $4,424, $4,103and $4,311 for the years ended December 31, 2016, 2015 and 2014, respectively.
(c) InsuranceCosts
Insurance costs related to the Big Spring refinery and wholesale marketing operations are allocated to us by Alon Energy based onestimated insurance premiums on a stand-alone basis relative to Alon Energy’s total insurance premium. Our allocation for insurance costsincluded in direct operating expenses was $4,422, $6,405 and $7,270 for the years ended December 31, 2016, 2015 and 2014, respectively.
Distributions
During the year ended December 31, 2016, we paid cash distributions of $23,132, or $0.37 per unit, of which $18,870 was paid toAlon Energy. During the year ended December 31, 2015, we paid cash distributions of $214,405, or $3.43 per unit, of which $174,930 waspaid to Alon Energy. During the year ended December 31, 2014, we paid cash distributions of $126,262, or $2.02 per unit, of which$103,020 was paid to Alon Energy.
Agreements with Alon Energy
As of December 31, 2016, we have the following agreements with Alon Energy:
(a) OmnibusAgreement
Under the terms of the omnibus agreement between us and Alon Energy, we have the right of first refusal if Alon Energy or any of itscontrolled affiliates has the opportunity to acquire a controlling interest in any refinery and related crude oil and refined product logisticassets, including non-retail transportation terminal sales, and that operate in Arizona, Arkansas, Colorado, Kansas, New Mexico, Oklahomaor Texas. In addition, pursuant to the terms of the omnibus agreement, we will have a 60-day exclusive right of negotiation if Alon Energyor any of its controlled affiliates decide to attempt to sell any refinery and related crude oil and refined product logistic assets, includingnon-retail transportation terminal sales, that operate in Arizona, Arkansas, Colorado, Kansas, New Mexico, Oklahoma or Texas.
(b) ServicesAgreement
The Services Agreement among the Partnership, the General Partner and Alon Energy addresses certain aspects of our relationshipwith the General Partner and Alon Energy, including the provision by Alon Energy or its service subsidiary to us of certain general andadministrative services and our agreement to reimburse Alon Energy for such services; and the provision by Alon Energy or its servicesubsidiary to us of such employees as may be necessary to operate and manage our business, and our agreement to reimburse Alon Energyfor the expenses associated with such employees.
F-19
Table of Contents
ALON USA PARTNERS, LPNOTES TO CONSOLIDATED FINANCIAL STATEMENTS—Continued
(dollars in thousands)
Pursuant to the Services Agreement, we have agreed to reimburse Alon Energy or its service subsidiary for (i) all reasonable direct andindirect costs and expenses incurred by it in connection with the performance of these services and (ii) all other reasonable expensesallocable to the Partnership or the General Partner or otherwise incurred by Alon Energy in connection with the operation of our business.
(c) Tax SharingAgreement
Under the terms of the Tax Sharing Agreement by and among the Partnership and Alon Energy, we must reimburse Alon Energy forour share of state and local income and other taxes borne by Alon Energy due to our results being included in a combined or consolidatedtax return filed by Alon Energy.
(d) Fuel SupplyAgreement
Pursuant to the terms of the 20-year Fuel Supply Agreement between the Partnership and Southwest Convenience Stores, LLC(“Southwest”), a subsidiary of Alon Energy, we supply substantially all of the motor fuel requirements of Alon Energy’s retail conveniencestores. The volume of motor fuels sold under the Fuel Supply Agreement is determined monthly based upon Southwest’s estimatedrequirements. Southwest purchases such motor fuels at a price equal to the market price per unit in effect at the time of delivery lessapplicable terminal discounts plus all applicable freight, taxes, pipeline tariff and delivery place differentials.
The Fuel Supply Agreement additionally provides for (i) Southwest’s mandatory participation in our credit card payment network,(ii) Southwest’s use of the “Alon” name and related marks in connection with the use of the credit card payment network and the resale ofthe motor fuels purchased pursuant to the Fuel Supply Agreement and (iii) marketing services for the benefit of Southwest (at an additionalcost).
(e) Asphalt SupplyAgreement
We also entered into a 20-year Asphalt Supply Agreement with Alon Asphalt Company (“Alon Asphalt”), a subsidiary of Alon Energy,under which Alon Asphalt purchases all of the asphalt that we produce. The volume of asphalt sold pursuant to the Asphalt SupplyAgreement is based upon actual production, but we are required to provide good faith non-binding forecasts of our monthly productionestimates for each contract year.
Products are sold under the Asphalt Supply Agreement at prices equal to the three day average price for such product, determined byreference to the value derived from the pricing formula set forth in the Asphalt Supply Agreement for such product on the day of deliveryor lifting and for the two business days prior to the date of delivery or lifting. Products with a contract term exceeding one year require theparties to meet annually to reexamine the price for such product.
(f) LeasingAgreements
In June 2014, we entered into six-year lease agreements with a subsidiary of Alon Energy to lease equipment at the Big Springrefinery. The lease agreements were effective July 1, 2014 and require fixed monthly payments amounting to $4,920 annually. Related tothese agreements, we recorded selling, general and administrative expense of $4,920, $4,920 and $2,460 for the years ended December 31,2016, 2015 and 2014, respectively.
Transactions with Delek US Holdings, Inc.
In May 2015, Delek US Holdings, Inc. (“Delek”) completed the purchase of approximately 48% of Alon Energy’s outstandingcommon stock from Alon Israel Oil Company, Ltd. (“Alon Israel”). We have transactions with Delek that occur in the ordinary course ofbusiness. Including amounts prior to the transaction, we purchased refined products from Delek of $995, $11,406 and $5,486 for the yearsended December 31, 2016, 2015 and 2014, respectively.
F-20

Table of Contents
ALON USA PARTNERS, LPNOTES TO CONSOLIDATED FINANCIAL STATEMENTS—Continued
(dollars in thousands)
(15) Commitments andContingencies
(a) Leases
We have long-term lease commitments for land, office facilities and related equipment and various equipment and facilities used in thestorage and transportation of refined products. In most cases we expect that in the normal course of business, our leases will be renewed orreplaced by other leases. We have commitments under long-term operating leases for certain buildings, land, equipment, and pipelinesexpiring at various dates over the next seven years. Certain long-term operating leases relating to buildings, land and pipelines includeoptions to renew for additional periods. At December 31, 2016, minimum lease payments on operating leases were as follows:
Year ending December 31, 2017 $ 18,4842018 12,7892019 5,7112020 3,5112021 2,6172022 and thereafter 3,883
Total $ 46,995
Total rental expense was $22,065, $22,397 and $15,546 for the years ended December 31, 2016, 2015 and 2014, respectively.Contingent rentals and subleases were not significant.
(b) Commitments
In the normal course of business, we have long-term commitments to purchase, at market prices, utilities such as natural gas, electricityand water for use by our refinery, terminals and pipelines. We are also party to various refined product and crude oil supply and exchangeagreements, which are typically short-term in nature or provide terms for cancellation.
We have a pipelines and terminals agreement with Holly Energy Partners (“HEP”) through February 2020 with three additional five-year renewal terms exercisable at our sole option. Pursuant to the pipelines and terminals agreement, we have committed to transport andstore minimum volumes of refined products in these pipelines and terminals. The tariff rates applicable to the transportation of refinedproducts on the pipelines are variable, with a base fee which is reduced for volumes exceeding defined volumetric targets. The agreementprovides for the reduction of the minimum volume requirement under certain circumstances. Our minimum commitment under thisagreement is $24,573 for 2017. The service fees for the storage of refined products in the terminals are initially set at rates competitive inthe marketplace.
We have a throughput and deficiency agreement with Sunoco Pipeline, LP (“Sunoco”) that gives us the option to transport crude oilthrough the Amdel Pipeline either (1) westbound from the Nederland Terminal to the Big Spring refinery, or (2) eastbound from the BigSpring refinery to the Nederland Terminal for further barge transportation to Alon Energy’s Krotz Springs, Louisiana refinery. Ourminimum throughput commitment is 15,645 bpd which is a $14,254 commitment for 2017. The agreement is for five years from theoperational date of September 2012 with an option to extend the agreement by four additional thirty-month periods.
We have an arrangement with Centurion Pipeline L.P. (“Centurion”) through June 2021. This arrangement gives us transportationpipeline capacity to ship crude oil from Midland to the Big Spring refinery using Centurion’s approximately forty-mile long pipelinesystem from Midland to Roberts Junction and our three-mile pipeline from Roberts Junction to the Big Spring refinery which we lease toCenturion. Our minimum throughput commitment is 25,000 bpd which is a $2,454 commitment for 2017.
We have entered into a transportation services agreement with Navigator Energy Services, LLC (“Navigator”), which provides for theconstruction and operation of a pipeline system to facilitate delivery of crude oil to the Big Spring refinery from a number of injectionpoints in the area of the refinery. The term of the agreement begins upon the commencement of shipments and continues for an initialperiod of ten years, with two additional five-year renewal terms exercisable at our sole option. Our minimum throughput commitment is10,000 bpd which is a $2,144 commitment for 2017.
(c) Contingencies
We are involved in various legal actions arising in the ordinary course of business. We believe the ultimate disposition of these matterswill not have a material effect on our financial position, results of operations or liquidity.
F-21

Table of Contents
ALON USA PARTNERS, LPNOTES TO CONSOLIDATED FINANCIAL STATEMENTS—Continued
(dollars in thousands)
(d) Environmental
We are subject to loss contingencies pursuant to federal, state, and local environmental laws and regulations. These laws andregulations govern the discharge of materials into the environment and may require us to incur future obligations to investigate the effectsof the release or disposal of certain petroleum, chemical, and mineral substances at various sites; to remediate or restore these sites and tocompensate others for damage to property and natural resources. These contingent obligations relate to sites owned by the Partnership andare associated with past or present operations. We are currently participating in environmental investigations, assessments and cleanupspertaining to the refinery, pipelines and terminals. We may be involved in additional future environmental investigations, assessments andcleanups. The magnitude of future costs are unknown and will depend on factors such as the nature and contamination at many sites, thetiming, extent and method of the remedial actions which may be required, and the determination of our liability in proportion to otherresponsible parties.
We have an environmental agreement with HEP pursuant to which we agreed to indemnify HEP against costs and liabilities incurredby HEP to the extent resulting from the existence of environmental conditions at the pipelines or terminals or from violations ofenvironmental laws with respect to the pipelines and terminals occurring prior to February 28, 2005. Our environmental indemnificationobligations under the environmental agreement expired on March 1, 2015. However, with respect to any remediation required forenvironmental conditions existing prior to February 28, 2005, we have the option under the environmental agreement to perform suchremediation ourselves in lieu of indemnifying HEP for their costs of performing such remediation. Pursuant to this option, we continue toperform the ongoing remediation at the Abilene and Wichita Falls terminals. Any remediation required under the terms of theenvironmental agreement is limited to the standards under the applicable environmental laws as in effect at February 28, 2005.
We have an environmental agreement with Sunoco pursuant to which we agreed to indemnify Sunoco against costs and liabilitiesincurred by Sunoco to the extent resulting from the existence of environmental conditions at the pipelines or from violations ofenvironmental laws with respect to the pipelines occurring prior to March 1, 2006. With respect to any remediation required forenvironmental conditions existing prior to March 1, 2006, we have the option to perform such remediation ourselves in lieu ofindemnifying Sunoco for their costs of performing such remediation.
We have accrued environmental remediation obligations of $6,592 ($796 current liability and $5,796 non-current liability) atDecember 31, 2016 and $6,441 ($1,716 current liability and $4,725 non-current liability) at December 31, 2015. Environmental liabilitieswith payments that are fixed or reliably determinable have been discounted to present value at a rate of 2.62%.
The table below summarizes our environmental liability accruals:
As of December 31,
2016 2015
Discounted environmental liabilities $ 6,365 $ 5,366Undiscounted environmental liabilities 227 1,075
Total accrued environmental liabilities $ 6,592 $ 6,441
As of December 31, 2016, the estimated future payments of environmental obligations for which discounts have been applied are asfollows:
Year ending December 31, 2017 $ 6862018 6342019 6142020 6142021 6132022 and thereafter 4,409
Discounted environmental liabilities, gross 7,570Less: Discount applied 1,205
Discounted environmental liabilities $ 6,365
F-22

Table of Contents
ALON USA PARTNERS, LPNOTES TO CONSOLIDATED FINANCIAL STATEMENTS—Continued
(dollars in thousands)
(16) Quarterly Information(unaudited)
Selected financial data by quarter is set forth in the table below:
Quarters
First Second Third Fourth
2016 Net sales $ 368,009 $ 468,457 $ 462,257 $ 509,009Operating income 2,117 10,998 10,191 9,362Net income (loss) (8,562) 1,191 2,083 884Earnings (loss) per unit $ (0.14) $ 0.02 $ 0.03 $ 0.01 2015 Net sales $ 542,442 $ 625,064 $ 551,813 $ 437,872Operating income 48,535 69,851 65,766 19,354Net income 36,451 59,426 53,776 7,246Earnings per unit $ 0.58 $ 0.95 $ 0.86 $ 0.12
(17) SubsequentEvent
Distribution Declared
On February 9, 2017 the board of directors of the General Partner declared a cash distribution to our common unitholders of $6,877, or$0.11 per common unit. The cash distribution will be paid on February 28, 2017 to unitholders of record at the close of business onFebruary 21, 2017.
F-23

Table of Contents
EXHIBITS
Exhibit No. Description of Exhibit
3.1
Certificate of Limited Partnership of Alon USA Partners, LP (incorporated by reference to Exhibit 3.1 to Form S-1, filedby the Partnership on August 31, 2012, SEC File No. 333-183671).
3.2
First Amended and Restated Agreement of Limited Partnership of Alon USA Partners, LP, dated November 26, 2012(incorporated by reference to Exhibit 3.1 to Form 8-K, filed by the Partnership on November 26, 2012, SEC File No.001-35742).
10.1
Omnibus Agreement by and among Alon USA Partners, LP, Alon USA Partners GP, LLC, Alon Assets, Inc. and AlonUSA Energy, Inc., dated November 26, 2012 (incorporated by reference to Exhibit 10.1 to Form 8-K, filed by thePartnership on November 26, 2012, SEC File No. 001-35742).
10.2
Services Agreement by and among Alon USA Partners, LP, Alon USA Partners GP, LLC by and Alon USA Energy,Inc., dated November 26, 2012 (incorporated by reference to Exhibit 10.2 to Form 8-K, filed by the Partnership onNovember 26, 2012, SEC File No. 001-35742).
10.3
Tax Sharing Agreement by and among Alon USA Partners, LP and Alon USA Energy, Inc., dated November 26, 2012(incorporated by reference to Exhibit 10.3 to Form 8-K, filed by the Partnership on November 26, 2012, SEC File No.001-35742).
10.4
Distributor Sales Agreement by and among Alon USA, LP and Southwest Convenience Stores, LLC, dated November26, 2012 (incorporated by reference to Exhibit 10.4 to Form 8-K, filed by the Partnership on November 26, 2012, SECFile No. 001-35742).
10.5
Offtake Agreement by and among Alon USA, LP and Paramount Petroleum Corporation, dated November 26, 2012(incorporated by reference to Exhibit 10.5 to Form 8-K, filed by the Partnership on November 26, 2012, SEC File No.001-35742).
10.6
Contribution, Conveyance and Assumption Agreement by and among Alon Assets, Inc., Alon USA Partners GP, LLC,Alon USA Partners, LP, Alon USA Energy, Inc., Alon USA Refining, LLC, Alon USA Operating, Inc., Alon USA, LPand Alon USA GP, LLC, dated November 26, 2012 (incorporated by reference to Exhibit 10.6 to Form 8-K, filed by thePartnership on November 26, 2012, SEC File No. 001-35742).
10.7*
Alon USA Partners, LP 2012 Long-Term Incentive Plan, adopted as of November 26, 2012 (incorporated by reference toExhibit 10.7 to Form 8-K, filed by the Partnership on November 26, 2012, SEC File No. 001-35742).
10.8
Credit and Guaranty Agreement, dated as of November 26, 2012, among Alon USA Partners, LP, Alon USA PartnersGP, LLC and certain subsidiaries of Alon USA Partners, LP, as Guarantors, the lenders party thereto and Credit SuisseAG, as Administrative Agent and Collateral Agent (incorporated by reference to Exhibit 10.1 to Form 8-K, filed by thePartnership on November 30, 2012, SEC File No. 001-35742).
10.9†
Second Amended and Restated Supply and Offtake Agreement dated as of February 1, 2015 between J. Aron &Company and Alon USA, LP (incorporated by reference to Exhibit 10.1 to Alon USA Energy, Inc.’s Quarterly Report onForm 10-Q filed on May 8, 2015, File No. 001-32567).
10.10
Pipelines and Terminals Agreement, dated February 28, 2005, between Alon USA, LP and Holly Energy Partners, L.P.(incorporated by reference to Exhibit 10.8 to Alon USA Energy, Inc.’s Registration Statement on Form S-1, filed May11, 2005, Registration No. 333-124797).
10.11
First Amendment of Pipelines and Terminals Agreement, effective as of September 1, 2008, between Holly EnergyPartners, L.P. and Alon USA, LP (incorporated by reference to Exhibit 10.24 to Form S-1, filed by the Partnership onOctober 26, 2012, SEC File No. 333-183671).
10.12
Second Amendment to Pipelines and Terminals Agreement, dated as of March 1, 2011, between Holly Energy Partners,L.P. and Alon USA, LP (incorporated by reference to Exhibit 10.25 to Form S-1, filed by the Partnership on October 26,2012, SEC File No. 333-183671).
10.13
Third Amendment to Pipelines and Terminals Agreement, dated as of June 6, 2011, between Holly Energy Partners, L.P.and Alon USA, LP (incorporated by reference to Exhibit 10.26 to Form S-1, filed by the Partnership on October 26,2012, SEC File No. 333-183671).
10.14
Pipeline Lease Agreement, dated as of December 12, 2007, between Plains Pipeline, L.P. and Alon USA, L.P.(incorporated by reference to Exhibit 10.1 to Alon USA Energy, Inc.’s Current Report on Form 8-K filed on February 5,2008, File No. 001-32567).
10.15
Pipelines Lease Agreement, dated as of February 21, 1997, between Navajo Pipeline Company and American PetrofinaPipe Line Company (incorporated by reference to Exhibit 10.6 to Alon USA Energy, Inc.’s Registration Statement onForm S-1, filed May 11, 2005, Registration No. 333-124797).
10.16
Connection and Shipping Agreement, dated June 14, 2006, by and between Centurion Pipeline L.P. and Alon USA, LP(incorporated by reference to Exhibit 10.29 to Form S-1, filed by the Partnership on October 26, 2012, SEC File No.333-183671).

Table of Contents
Exhibit No. Description of Exhibit
10.17
Amendment No. 1 to Connection and Shipping Agreement, effective as of April 1, 2012, by and between Alon USA, LPand Centurion Pipeline L.P. (incorporated by reference to Exhibit 10.30 to Form S-1, filed by the Partnership on October26, 2012, SEC File No. 333-183671).
10.18
Second Amended Revolving Credit Agreement, dated as of May 23, 2013, by and among Alon USA, LP, Israel DiscountBank of New York, Bank Leumi USA and certain other guarantor companies and financial institutions from time to timenamed therein (incorporated by reference to Exhibit 10.1 to Form 8-K, filed by the Partnership on May 24, 2013, SECFile No. 001-35742).
10.19*
Second Amendment to Second Amended Revolving Credit Agreement and Partial Release, dated May 6, 2015, by andamong Alon USA, LP, Alon USA Energy, Inc., the lenders party thereto, Alon Israel Discount Bank of New York, asAdministrative Agent, Co-Arranger and Collateral Agent for the Lenders and Bank Leumi USA, as Co-Arranger for theLenders (incorporated by reference to Exhibit 10.4 to Alon USA Energy, Inc.’s Form 10-Q filed on May 8, 2015, FileNo., 001-32567).
10.20*
Directors’ Compensation Summary (incorporated by reference to Exhibit 10.22 to Form S-1, filed by the Partnership onOctober 31, 2012, SEC File No. 333-183671).
10.21*
Form of Restricted Unit Agreement (incorporated by reference to Exhibit 10.34 to Form S-1, filed by Alon USAPartners, LP on October 31, 2012, SEC File No. 333-183671).
21.1 List of Subsidiaries of Alon USA Partners, LP.23.1 Consent of KPMG LLP.31.1 Certifications of Chief Executive Officer pursuant to §302 of the Sarbanes-Oxley Act of 2002.31.2 Certifications of Chief Financial Officer pursuant to §302 of the Sarbanes-Oxley Act of 2002.32.1
Certification of Chief Executive Officer and Chief Financial Officer pursuant to 18 U.S.C. §1350, as adopted pursuant to§906 of the Sarbanes-Oxley Act of 2002.
101
The following financial information from Alon USA Partners, LP's Annual Report on Form 10-K for the year endedDecember 31, 2016, formatted in XBRL (Extensible Business Reporting Language): (i) Consolidated Balance Sheets,(ii) Consolidated Statements of Operations, (iii) Consolidated Statement of Partners' Equity, (iv) ConsolidatedStatements of Cash Flows and (v) Notes to Consolidated Financial Statements.
______________________
* Identifies management contracts and compensatory plans orarrangements.
† Filed under confidential treatmentrequest.

Table of Contents
SIGNATURES
Pursuant to the requirements of Section 13 or 15(d) of the Securities and Exchange Act of 1934, the registrant has duly caused thisreport to be signed on its behalf by the undersigned, thereunto duly authorized.
Alon USA Partners, LP By: Alon USA Partners GP, LLC its general partner Date: February 27, 2017 By: /s/ Alan Moret Alan Moret Chief Executive Officer
Pursuant to the requirements of the Securities Exchange Act of 1934, the Registrant has duly caused this report to be signed on itsbehalf by the undersigned, thereunto duly authorized.
Date: February 27, 2017 By: /s/ David Wiessman David Wiessman Executive Chairman of the Board Date: February 27, 2017 By: /s/ Jeff D. Morris Jeff D. Morris Vice Chairman of the Board Date: February 27, 2017 By: /s/ Alan Moret Alan Moret Chief Executive Officer (Principal Executive Officer) Date: February 27, 2017 By: /s/ Shai Even Shai Even President and Chief Financial Officer (Principal Accounting Officer) Date: February 27, 2017 By: /s/ Snir Wiessman Snir Wiessman Director Date: February 27, 2017 By: /s/ Eitan Raff Eitan Raff Director Date: February 27, 2017 By: /s/ Sheldon Stein Sheldon Stein Director
Date: February 27, 2017 By: /s/ Ella Ruth Gera Ella Ruth Gera Director Date: February 27, 2017 By: /s/ Yeshayahu Pery Yeshayahu Pery Director

Exhibit 21.1
Alon USA Partners, LP List of Subsidiaries
Alon USA GP II, LLC, a Delaware limited liability companyAlon USA Delaware, LLC, a Delaware limited liability companyAlon USA Refining, LLC, a Delaware limited liability company Alon USA, LP, a Texas limited partnership

Exhibit 23.1
Consent of Independent Registered Public Accounting Firm
The Board of Directors of Alon USA Partners GP, LLC andUnit Holders of Alon USA Partners, LP:
We consent to the incorporation by reference in the registration statement (No. 333-185598) on Form S-8 of Alon USA Partners,LP of our reports dated February 27, 2017, with respect to the consolidated balance sheets of Alon USA Partners, LP andsubsidiaries as of December 31, 2016 and 2015, and the related consolidated statements of operations, partners’ equity, and cashflows for each of the years in the three-year period ended December 31, 2016, and the effectiveness of internal control overfinancial reporting as of December 31, 2016, which reports appear in the December 31, 2016 annual report on Form 10-K ofAlon USA Partners, LP.
/s/ KPMG LLP
Dallas, TexasFebruary 27, 2017

Exhibit 31.1CERTIFICATIONS
I, Alan Moret, certify that:
1. I have reviewed this Annual Report on Form 10-K of Alon USA Partners,LP;
2. Based on my knowledge, this report does not contain any untrue statement of a material fact or omit to state a material factnecessary to make the statements made, in light of the circumstances under which such statements were made, not misleading withrespect to the period covered by this report;
3. Based on my knowledge, the financial statements, and other financial information included in this report, fairly present in allmaterial respects the financial condition, results of operations and cash flows of the registrant as of, and for, the periods presentedin this report;
4. The registrant's other certifying officer and I are responsible for establishing and maintaining disclosure controls and procedures(as defined in Exchange Act Rules 13a-15(e) and 15d-15(e)) and internal control over financial reporting (as defined in ExchangeAct Rules 13a-15(f) and 15d-15(f)) for the registrant and have:
a) Designed such disclosure controls and procedures, or caused such disclosure controls and procedures to be designedunder our supervision, to ensure that material information relating to the registrant, including its consolidated subsidiaries,is made known to us by others within those entities, particularly during the period in which this report is being prepared;
b) Designed such internal control over financial reporting, or caused such internal controls over financial reporting to bedesigned under our supervision, to provide reasonable assurance regarding the reliability of financial reporting and thepreparation of financial statements for external purposes in accordance with generally accepted accounting principles;
c) Evaluated the effectiveness of the registrant's disclosure controls and procedures and presented in this report ourconclusions about the effectiveness of the disclosure controls and procedures, as of the end of the period covered by thisreport based on such evaluation; and
d) Disclosed in this report any change in the registrant's internal control over financial reporting that occurred during theregistrant's most recent fiscal quarter (the registrant's fourth fiscal quarter in the case of an annual report) that hasmaterially affected, or is reasonably likely to materially affect, the registrant's internal control over financial reporting;and
5. The registrant's other certifying officer and I have disclosed, based on our most recent evaluation of internal control over financialreporting, to the registrant's auditors and the audit committee of the registrant's board of directors (or persons performing theequivalent functions):
a) All significant deficiencies and material weaknesses in the design or operation of internal control over financial reportingwhich are reasonably likely to adversely affect the registrant's ability to record, process, summarize and report financialinformation; and
b) Any fraud, whether or not material, that involves management or other employees who have a significant role in theregistrant's internal control over financial reporting.
Date: February 27, 2017 By: /s/ Alan Moret Alan Moret Chief Executive Officer of Alon USA Partners GP, LLC (the general partner of Alon USA Partners, LP)
Exhibit 31.2CERTIFICATIONS
I, Shai Even, certify that:
1. I have reviewed this Annual Report on Form 10-K of Alon USA Partners,LP;
2. Based on my knowledge, this report does not contain any untrue statement of a material fact or omit to state a material factnecessary to make the statements made, in light of the circumstances under which such statements were made, not misleading withrespect to the period covered by this report;
3. Based on my knowledge, the financial statements, and other financial information included in this report, fairly present in allmaterial respects the financial condition, results of operations and cash flows of the registrant as of, and for, the periods presentedin this report;
4. The registrant's other certifying officer and I are responsible for establishing and maintaining disclosure controls and procedures(as defined in Exchange Act Rules 13a-15(e) and 15d-15(e)) and internal control over financial reporting (as defined in ExchangeAct Rules 13a-15(f) and 15d-15(f)) for the registrant and have:
a) Designed such disclosure controls and procedures, or caused such disclosure controls and procedures to be designedunder our supervision, to ensure that material information relating to the registrant, including its consolidated subsidiaries,is made known to us by others within those entities, particularly during the period in which this report is being prepared;
b) Designed such internal control over financial reporting, or caused such internal controls over financial reporting to bedesigned under our supervision, to provide reasonable assurance regarding the reliability of financial reporting and thepreparation of financial statements for external purposes in accordance with generally accepted accounting principles;
c) Evaluated the effectiveness of the registrant's disclosure controls and procedures and presented in this report ourconclusions about the effectiveness of the disclosure controls and procedures, as of the end of the period covered by thisreport based on such evaluation; and
d) Disclosed in this report any change in the registrant's internal control over financial reporting that occurred during theregistrant's most recent fiscal quarter (the registrant's fourth fiscal quarter in the case of an annual report) that hasmaterially affected, or is reasonably likely to materially affect, the registrant's internal control over financial reporting;and
5. The registrant's other certifying officer and I have disclosed, based on our most recent evaluation of internal control over financialreporting, to the registrant's auditors and the audit committee of the registrant's board of directors (or persons performing theequivalent functions):
a) All significant deficiencies and material weaknesses in the design or operation of internal control over financial reportingwhich are reasonably likely to adversely affect the registrant's ability to record, process, summarize and report financialinformation; and
b) Any fraud, whether or not material, that involves management or other employees who have a significant role in theregistrant's internal control over financial reporting.
Date: February 27, 2017 By: /s/ Shai Even Shai Even
President and Chief Financial Officer of Alon USA PartnersGP, LLC
(the general partner of Alon USA Partners, LP)

Exhibit 32.1CERTIFICATION PURSUANT TO 18 U.S.C. §1350,
AS ADOPTED PURSUANT TO §906OF THE SARBANES-OXLEY ACT OF 2002
In connection with the filing of the Annual Report on Form 10-K of Alon USA Partners, LP, a Delaware limited partnership (the“Partnership”), for the period ended December 31, 2016, as filed with the Securities and Exchange Commission on the date hereof (the“Report”), each of the undersigned officers of Alon USA Partners GP, LLC, the general partner of the Partnership certifies, pursuant to 18U.S.C. §1350, as adopted pursuant to §906 of the Sarbanes-Oxley Act of 2002, that, to such officer's knowledge:
1) The Report fully complies with the requirements of Section 13(a) or 15(d) of the Securities Exchange Act of 1934;and
2) The information contained in the Report fairly presents, in all material respects, the financial condition and results of operations ofthe Partnership as of the dates and for the periods expressed in the Report.
Date: February 27, 2017 By: /s/ Alan Moret Alan Moret Chief Executive Officer of Alon USA Partners GP, LLC (the general partner of Alon USA Partners, LP) Date: February 27, 2017 By: /s/ Shai Even Shai Even
President and Chief Financial Officer of Alon USA PartnersGP, LLC
(the general partner of Alon USA Partners, LP)