alternative beta strategies: an evaluation of different
TRANSCRIPT

Schwab Center for Financial Research
AlternAtive BetA StrAtegieS: An evAluAtion of Different ApproAcheS
Anthony B. Davidow, ciMA®Vice President, Alternative Beta and Asset Allocation Strategist, Schwab Center for Financial Research®
the last several years have seen a proliferation of alternative beta strategies. Alternative beta strategies are designed to provide market exposure based on non-price-weighted fundamentals. often referred to as “smart beta” or “strategy beta,” these strategies offer the potential for attractive risk-adjusted returns relative to traditional market-cap indexes.
In this paper:We will discuss several different types of alternative beta strategies available in the market today. We will provide a high-level comparison of their weighting methodologies and explore the biases or tilts introduced as a result of each methodology. In addition, we will cover the following topics:
• How alternative beta and market-cap strategies compare
• Notable academic findings regarding historical results of alternative beta strategies
• The current landscape of alternative beta strategies and how the strategies differ
• What to consider when implementing alternative beta strategies in client portfolios
Journal of Investment research
for institutional use only. not for further Distribution.

Schwab Center for Financial Research Journal of Investment research
2 for institutional use only. not for further Distribution.
Market-Cap IndexesMost of the major indexes (e.g., S&P 500® Index, Russell 1000® Index, Russell 2000® Index, MSCI EAFE Index) are market-cap weighted, meaning that the largest companies have the largest weight in the underlying index (see Fundamental Indexing: Weighing the Difference). In addition to their larger-cap bias, market-cap indexes often have growth biases and tend to overweight overpriced securities.
Market-cap indexes serve valuable benchmarking roles: Active managers can tout their history of outperforming a benchmark as a gauge of their value, or the index can provide a barometer of a particular market’s performance. The first wave of index-based mutual funds and exchange traded funds (ETFs) sought to mimic the various market indexes. The extraordinary growth of ETFs has been fueled in part by many active mutual fund managers’ inability to consistently outperform their benchmarks.1
Institutions were early adopters of index-based strategies. In fact, the first index-based strategy was developed in 1971 by Wells Fargo for the Samsonite Corporation.2 For years, institutions have been challenging the conventional wisdom that market-cap indexes are the only way to own the market. Institutional demand and academic research have led to the development of alternative beta strategies.
Alternative BetaIf beta is defined as the market risk of a basket of stocks, then alternative beta represents a different way of constructing the basket. Popular alternative beta strategies include equal weighting, fundamental weighting, minimum variance, and low volatility. These strategies vary based on the underlying indexes, economic factors screened, and weighting methodologies.
Increased interest and the growing number of investable solutions give advisors many options for alternative beta strategies. According to a recent Ignites article, these strategies are gaining tremendous interest among investors.3 BlackRock estimates that the assets under management of U.S. smart-beta ETFs are approaching $175 billion ($37 billion of inflows in the first half of 2013).4
Among alternative beta strategies, fundamental strategies have been a major focus of research studies, especially in comparison with market-cap indexes. Rob Arnott and his colleagues at Research Affiliates LLC have long championed the use of Fundamental Index® methodologies. In an article published in Financial Analysts Journal, Arnott et al. criticize the capital asset pricing model (CAPM) and some of the assumptions used, most notably the use of cap-weighted indexes as the market benchmark. Research Affiliates has shown significant outperformance of multiple fundamental strategies relative to their respective market-cap indexes over various periods: “[Research Affiliates] believe[s] these results are not mere accidents of history but are likely to persist into the future. The mean–variance superiority of the Fundamental Indexes is robust and significant.”5
Rob Arnott and Research Affiliates may have started the alternative beta debate with the introduction of their Fundamental Index® methodology, but others have joined in the discussion. According to Noël Amenc, director of the EDHEC-Risk Institute, “[T]he reason behind the new indices for the vast majority of investors, and doubtless their promoters, is probably the superiority of their performance compared to traditional cap-weighted indices. . . . Alternative beta, advanced beta or smart beta is therefore a response from the market to a question that forms the basis of modern portfolio theory since
1. Aye Soe and Frank Luo, “Does Past Performance Matter? The Persistence Scorecard,” S&P Dow Jones Indices, Dec. 2012, www.spindices.com/documents/spiva/persistence-scorecard-december-2012.pdf.
2. Frank J. Fabozzi, Perspectives on Equity Indexing. Hoboken: Wiley, 2000, 41–42.3. Paul Bouchey, “Are Smart-Beta Funds Passive or Active Products?” Ignites, 18 July 2013.4. BlackRock, “Dividend Deluge,” ETP Quarterly Flow Report, July 2013, http://www2.blackrock.com/ca/en/InstitutionalInvestors/MarketInsight/etflandscape/index.htm.5. Robert D. Arnott, Jason C. Hsu, and Philip Moore, “Fundamental Indexation,” Financial Analysts Journal, vol. 61, no. 2, March/April 2005, 83–97.
Alternative Beta Strategies: An Evaluation of Different Approaches
3for institutional use only. not for further Distribution.
the work of the Nobel Prize winner Harry Markowitz: how to construct an optimally diversified portfolio.”6
In “A Survey of Alternative Equity Index Strategies,” Hsu et al. divide alternative beta strategies into two broad categories: heuristic-based and optimization-based weighting methods.7 Heuristic-based strategies use simple and sensible weighting rules; they include equal weighting, risk-cluster equal weighting, low volatility, and fundamental weighting. Optimization-based strategies, which attempt to optimize portfolios based on expected risk and return assumptions, include minimum variance, maximum diversification, and low volatility.
In “An Evaluation of Alternative Equity Indices,” Cass Consulting analyzes various alternative weighting strategies. Part 1 evaluates heuristic and optimized
weighting; Part 2 focuses on fundamental weighting. Their data shows that many of the alternative weighting strategies delivered excess returns relative to the market-cap indexes: “[B]etween 1968 and 2011 the fundamental index alternatives that we consider have out-performed a comparable index constructed on the basis of the market capitalisation of the index constituents, in risk-adjusted terms. Our Monte Carlo experiments show that this superior risk-adjusted performance cannot be attributed easily to luck.”8
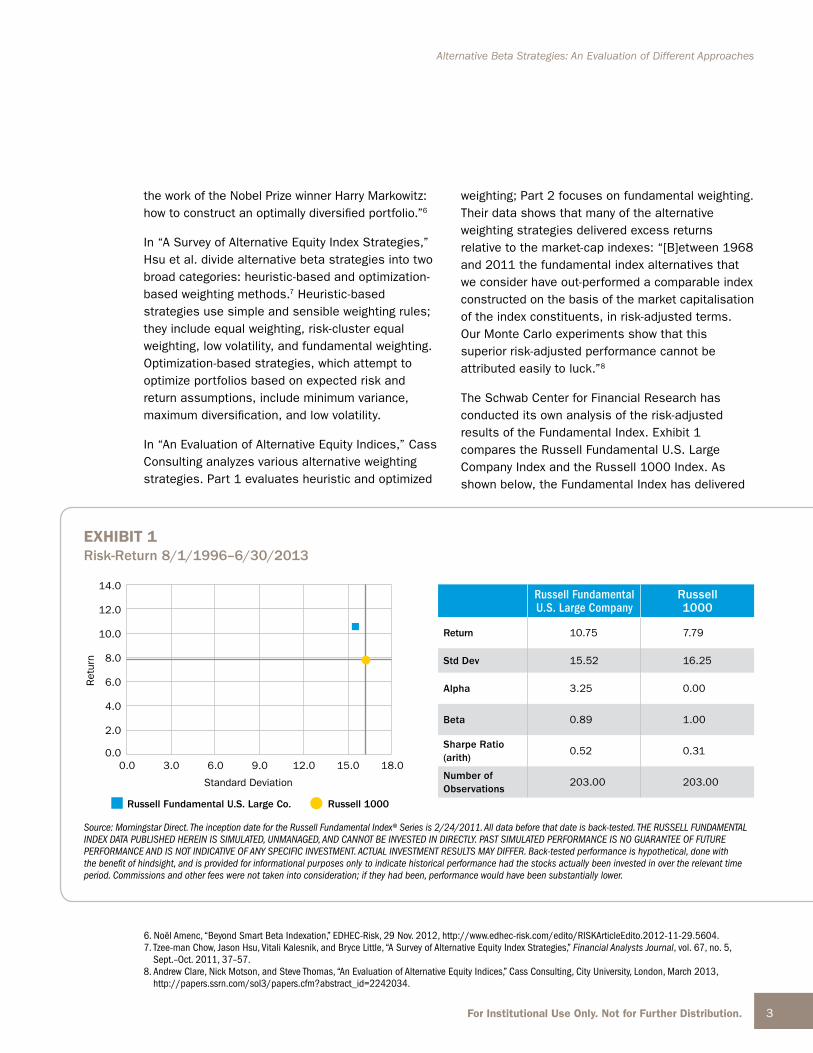
The Schwab Center for Financial Research has conducted its own analysis of the risk-adjusted results of the Fundamental Index. Exhibit 1 compares the Russell Fundamental U.S. Large Company Index and the Russell 1000 Index. As shown below, the Fundamental Index has delivered
0.0
2.0
4.0
6.0
0.0 3.0 6.0 9.0
Standard Deviation
Ret
urn
12.0 15.0 18.0
8.0
10.0
12.0
14.0
Russell Fundamental U.S. Large Co. Russell 1000
exhiBit 1risk-return 8/1/1996–6/30/2013
Source: Morningstar Direct. The inception date for the Russell Fundamental Index® Series is 2/24/2011. All data before that date is back-tested. THE RUSSELL FUNDAMENTAL INDEX DATA PUBLISHED HEREIN IS SIMULATED, UNMANAGED, AND CANNOT BE INVESTED IN DIRECTLY. PAST SIMULATED PERFORMANCE IS NO GUARANTEE OF FUTURE PERFORMANCE AND IS NOT INDICATIVE OF ANY SPECIFIC INVESTMENT. ACTUAL INVESTMENT RESULTS MAY DIFFER. Back-tested performance is hypothetical, done with the benefit of hindsight, and is provided for informational purposes only to indicate historical performance had the stocks actually been invested in over the relevant time period. Commissions and other fees were not taken into consideration; if they had been, performance would have been substantially lower.
6. Noël Amenc, “Beyond Smart Beta Indexation,” EDHEC-Risk, 29 Nov. 2012, http://www.edhec-risk.com/edito/RISKArticleEdito.2012-11-29.5604.7. Tzee-man Chow, Jason Hsu, Vitali Kalesnik, and Bryce Little, “A Survey of Alternative Equity Index Strategies,” Financial Analysts Journal, vol. 67, no. 5,
Sept.–Oct. 2011, 37–57.8. Andrew Clare, Nick Motson, and Steve Thomas, “An Evaluation of Alternative Equity Indices,” Cass Consulting, City University, London, March 2013,
http://papers.ssrn.com/sol3/papers.cfm?abstract_id=2242034.
russell fundamental u.s. large company
russell 1000
return 10.75 7.79
std Dev 15.52 16.25
alpha 3.25 0.00
Beta 0.89 1.00
sharpe ratio (arith)
0.52 0.31
number of observations
203.00 203.00

Schwab Center for Financial Research Journal of Investment research
4 for institutional use only. not for further Distribution.
stronger returns than its market-cap-weighted equivalent (10.75% versus 7.79%). The Fundamental Index has also delivered lower beta (risk) and higher alpha (excess return) than the Russell 1000 Index.
Gaining Exposure to Alternative Beta Strategies
As alternative beta strategies have been embraced by institutions and individual investors, the number of alternative weighting strategies and the flows into them have increased dramatically. Advisors should understand the differences among the strategies, including how varying market conditions may affect their use within client portfolios. Certain strategies introduce biases through their weighting methodologies. Advisors should evaluate both a strategy’s weighting methodology and the underlying index used, which may vary the security, sector, and market-capitalization exposures.
Exhibit 2 compares a few of the largest alternative beta strategies. The differences in the weighting methodologies and the underlying indexes could
lead to dramatically different risks and returns over time.
Exhibit 3 provides a sector analysis of six alternative weighting strategies and two market-cap indexes. These allocations differ because of their weighting methodologies. For example, look at the PowerShares S&P Low Volatility strategy, which has a 29.54% allocation to utilities and 20.32% to consumer staples. This is in stark contrast to the other alternative beta strategies, whose allocations to utilities range from 3.50% to 6.12% and allocations to consumer staples range from 7.92% to 15.45%. The low-volatility strategy has a greater emphasis on utilities and consumer staples because historically they have had less volatility than other sectors. The low-volatility strategy also makes big bets on these two sectors relative to its benchmark: utilities (29.54% versus 3.31%) and consumer staples (20.32% versus 10.49%). The difference in sector allocations may lead to dramatically different results over time—either helping or hindering performance.
exhiBit 2sample alternative Beta strategies
name type of strategy tilt or Bias Weighting methodology
Schwab Fundamental U.S. Large Company (FNDX and SFLNX)
Fundamental ValueRetained operating cash flow, adjusted sales, and dividends + buybacks
DFA US Core Equity 1 Portfolio I (DFEOX)
Fundamental Value and smallBook value, price-cash flow, PE ratios
Guggenheim S&P 500 Equal Weight (RSP)
Equal weight Value and mid Equal-weight index constituents
PowerShares FTSE RAFI US 1000 (PRF)
Fundamental ValueBook value, cash flow, sales, and dividends
PowerShares S&P 500 Low Volatility (SPLV)
Low volatilityValue (may have sector over/underweights)
Lowest realized volatility over preceding 12 months
WisdomTree Large Cap Dividend (DLN)
Fundamental Value/dividend Dividend weighted
See the appendix for a complete description of weighting methodologies.

Alternative Beta Strategies: An Evaluation of Different Approaches
5for institutional use only. not for further Distribution.
Other differences across these strategies and relative to the benchmarks (S&P 500 Index and Russell 1000 Index) are byproducts of the weighting methodologies and the underlying indexes rather than any intended bets on the markets. Advisors should carefully consider the underlying portfolios and some of the unintended bets.
Market capitalization is another important consideration when evaluating these strategies. Exhibit 4 on page 6 provides a market-capitalization breakdown across the strategies and the two market-cap indexes. As shown, the DFA strategy has the highest allocation to small-cap and microcap stocks (12.33% and 4.80%, respectively). DFA relies on work conducted by Eugene Fama and Ken French.
Fama and French attempted to better measure market returns and found that value stocks have tended to outperform growth stocks; similarly,
small-cap stocks have tended to outperform large-cap stocks over time.9 There is a lot of debate about the outperformance tendency: Is it caused by market efficiency or inefficiency? On the efficiency side of the debate, the outperformance may be generally explained by the excess risk that value and small-cap stocks face as a result of their higher cost of capital and greater business risk. On the inefficiency side, the outperformance could be explained by market participants mispricing the value of these companies, which provides excess return in the long run as the value adjusts.
The Guggenheim S&P Equal Weight strategy has the highest allocation to mid-cap stocks and the lowest allocation to mega-cap stocks. Equal-weight strategies, like the Guggenheim strategy, provide the same weight to every company in an index. Equal-weight strategies will have a smaller capitalization than their market-cap equivalents because of the weighting methodology.
name materials consumer Discretionary financials consumer
stapleshealth care utilities telecommunica-
tion services energy Industrials Information technology
Schwab Fundamental U.S. Large Company (SFLNX)
3.43 12.07 14.76 11.76 10.83 4.30 4.11 15.61 10.78 12.36
DFA US Core Equity 1 Portfolio I (DFEOX)
4.75 14.08 17.22 8.09 11.14 3.50 2.44 10.42 12.79 15.58
Guggenheim S&P 500 Equal Weight (RSP)
5.88 16.82 16.39 7.92 10.64 6.12 1.17 8.50 12.37 14.20
PowerShares FTSE RAFI US 1000 (PRF)
3.58 11.29 22.03 9.88 10.53 4.84 4.14 11.92 10.66 11.13
PowerShares S&P 500 Low Volatility (SPLV)
2.72 1.98 19.40 20.32 9.95 29.54 1.75 2.87 8.63 2.84
WisdomTree LargeCap Dividend (DLN)
3.50 8.21 13.49 15.45 11.91 5.63 6.08 10.66 10.76 14.30
Russell 1000 Index 3.58 12.96 17.25 9.75 12.41 3.36 2.68 9.90 10.94 17.16
S&P 500 Index 3.27 12.21 16.66 10.49 12.72 3.31 2.84 10.53 10.16 17.79
Source: Morningstar Direct as of June 30, 2013. Sector allocations are subject to change without notice.
exhiBit 3sector allocations (%)
9. Eugene F. Fama and Kenneth R. French, “Common Risk Factors in the Returns on Stocks and Bonds,” Journal of Financial Economics, vol. 33, no. 1, 1993, 3–56.

Schwab Center for Financial Research Journal of Investment research
6 for institutional use only. not for further Distribution.
Exhibit 4 also provides a breakdown of allocations across value, core, and growth. The two PowerShares strategies have the highest allocations to value (51.42% and 49.23%), and the Guggenheim strategy is the closest to a neutral weight between value and growth (34.11% versus 33.99%). The underlying major market indexes—S&P 500 Index and Russell 1000 Index—are close to neutral weighting across value, growth, and core.
The information contained in Exhibits 3 and 4 helps explain the differences in returns over time. The portfolio characteristics may vary, but the difference in the underlying index and construction methodologies likely means that the differences will persist. Advisors should seek to better understand the weighting methodology, which ultimately leads to differences in the underlying portfolio. The sector
allocations, market capitalization, and value-growth bias will culminate in different returns and risks over time.
Implementing Alternative Beta StrategiesSchwab believes in the value of alternative beta strategies. As noted above, however, we see a high degree of variability across the types of strategies. Advisors should understand the weighting methodologies, underlying indexes, sector allocations, market capitalizations, and value-growth tilts, and should keep in mind that portfolio characteristics will change over time.
Schwab believes that alternative beta strategies may serve as a nice complement to both market-cap and active management options (see An Evolutionary Approach to Portfolio Construction).
exhiBit 4market-capitalization comparison
name mega cap large cap mid cap small cap microcap value core Growth
Schwab Fundamental U.S. Large Company (SFLNX)
45.15 35.25 17.47 1.99 0.15 48.11 35.51 16.39
DFA US Core Equity 1 Portfolio I (DFEOX) 30.64 22.53 29.71 12.33 4.80 37.31 32.19 30.50
Guggenheim S&P 500 Equal Weight (RSP) 11.36 41.49 46.37 0.78 0.00 34.11 31.90 33.99
PowerShares FTSE RAFI US 1000 (PRF) 42.41 33.18 19.09 4.84 0.49 49.23 32.40 18.37
PowerShares S&P 500 Low Volatility (SPLV) 16.61 49.58 33.81 0.00 0.00 51.42 34.53 14.05
WisdomTree LargeCap Dividend (DLN) 57.37 36.39 6.24 0.01 0.00 42.05 39.79 18.16
Russell 1000 Index 45.07 33.10 20.06 1.75 0.03 32.68 33.43 33.89
S&P 500 Index 50.78 36.57 12.57 0.09 0.00 32.94 33.97 33.09
Source: Morningstar Direct as of June 30, 2013. Market capitalization may vary without notice. Market-capitalization breakpoints, determined by Morningstar Direct: Mega Cap, over 61.6 billion; Large Cap, between 13.8 and 61.6 billion; Mid Cap, between 2.9 and 13.8 billion; Small Cap, between 944 million and 2.9 billion.

Alternative Beta Strategies: An Evaluation of Different Approaches
7for institutional use only. not for further Distribution.
As shown in Exhibit 5, there are four key levers that can help determine an appropriate weighting among these types of strategies: tracking error, loss aversion, alpha, and cost.
Market cap provides little or no tracking error (fees could provide a small drag), no downside protection, and no alpha. Alternative beta strategies have historically delivered alpha and have a relatively high tracking error compared with market cap. Active managers seek to deliver alpha and may provide some downside protection. Although there are merits to index-based strategies, such strategies are unable to deviate from their rules-based discipline. Active managers have greater flexibility and can adapt to changing market dynamics.
Depending on investors’ sensitivity to the levers above, they could choose to overweight or underweight each of these strategies.
• Market cap: Investors who seek a cost-effective way of owning the market and want to limit tracking error may want to consider an overweight to market-cap strategies.
• Alternative beta: Investors who are seeking alpha and have no concerns about tracking error may choose to overweight alternative beta strategies.
• Active: Investors who are concerned about the ever-changing market environment and want an active manager to be able to alter their strategy over time may want to consider a larger allocation to active management. Advisors should seek to identify managers that have historically delivered better downside capture ratios.
ConclusionIn recent years, alternative beta strategies have evolved significantly, providing a range of strategies that offer different return and risk characteristics. These strategies provide different ways of accessing the various market segments.
Alternative beta strategies, or smart beta strategies, represent a sophisticated way of building index-based portfolios. These solutions apply logic and academic research to the weighting methodologies used in index construction, leading to a different client experience.
Caveat emptor: Let the buyer beware. Not all alternative beta strategies are created equal, and there are important differences among the strategies available in the market. Before investing, advisors and individual investors should gain an understanding of the weighting methodology and any tilts or biases that may be introduced.
Key lever market cap alternative Beta activetracking error Little or no tracking error Higher tracking error Varies by manager
loss aversion No downside protection No downside protection May provide downside protection
alpha No Potential alpha Varies
cost Lowest cost Low cost Varies by manager and vehicle
exhiBit 5Portfolio construction levers

Schwab Center for Financial Research Journal of Investment research
8 for institutional use only. not for further Distribution.
Appendix
name methodology
Schwab Fundamental U.S. Large Company (SFLNX and FNDX)
The Schwab Fundamental U.S. Large Company Index Mutual Fund and Schwab Fundamental U.S. Large Company ETF seek investment results that correspond generally (before fees and expenses) to the total return of the Russell Fundamental U.S. Large Company Index. The mutual fund and ETF will typically invest in stocks that are included in the index. The index measures the performance of the large company size segment by fundamental overall company scores, which are created using as the universe the companies in the Russell 3000 Index. The Russell Fundamental methodology utilizes three fundamental metrics of company scale and success: retained operating cash flow, adjusted sales, and dividends plus buybacks. Influence: Rob Arnott and Research Affiliates.
DFA US Core Equity 1 Portfolio I (DFEOX)
The portfolio seeks to purchase a broad and diverse group of securities of U.S. companies with an increased exposure to small-cap companies and those Dimensional considers value companies relative to the U.S. market universe. The universe comprises U.S. operating companies listed on the New York Stock Exchange, Nasdaq Global Market®, or such other securities exchanges deemed appropriate by Dimensional. Increased exposure to small and value companies may be achieved by decreasing the allocation of the portfolio’s assets in large growth companies relative to their weight in the U.S. universe. Securities are considered value stocks primarily because a company’s shares have a high book value in relation to their market value (BtM). In assessing value, factors such as price to cash flow or price to earnings ratios may be considered, as well as economic conditions and developments in the issuer’s industry. The criteria for assessing value are subject to change from time to time. Influence: Eugene Fama and Ken French.
Guggenheim S&P 500® Equal Weight (RSP)
Guggenheim S&P 500® Equal Weight ETF (RSP) seeks to provide investment results that correspond to the daily performance of the S&P 500 Equal Weight Index (SPXEW), an index developed by Standard & Poor’s in collaboration with Guggenheim Investments. In the S&P 500 Equal Weight Index, each of the stocks that make up the index is “equally weighted.” To maintain composition, the S&P 500 Equal Weight Index rebalances quarterly.

Alternative Beta Strategies: An Evaluation of Different Approaches
9for institutional use only. not for further Distribution.
name methodology
PowerShares FTSE RAFI US 1000 (PRF)
The PowerShares FTSE RAFI US 1000 Portfolio is based on the FTSE RAFI 1000 Index. The fund will normally invest at least 90% of its total assets in common stocks that the index comprises. The index is designed to track the performance of the largest U.S. equities, selected based on the following four fundamental measures of firm size: book value, cash flow, sales, and dividends. The 1,000 equities with the highest fundamental strength are weighted by their fundamental scores. The fund and the index are reconstituted annually. Influence: Rob Arnott and Research Affiliates.
PowerShares S&P 500 Low Volatility (SPLV)
The PowerShares S&P 500® Low Volatility Portfolio is based on the S&P 500 Low Volatility Index. The fund will invest at least 90% of its total assets in common stocks that the index comprises. The index is compiled, maintained, and calculated by Standard & Poor’s and consists of the 100 stocks from the S&P 500 Index with the lowest realized volatility over the past 12 months. Volatility is a statistical measurement of the magnitude of up and down asset price fluctuations over time. The fund and the index are rebalanced and reconstituted quarterly in February, May, August, and November.
WisdomTree LargeCap Dividend (DLN)
WisdomTree LargeCap Dividend Fund seeks investment results that closely correspond to the price and yield performance, before fees and expenses, of the WisdomTree LargeCap Dividend Index. The WisdomTree LargeCap Dividend Index is a fundamentally weighted index that measures the performance of the large-capitalization segment of the U.S. dividend-paying market. The index is composed of the 300 largest companies ranked by market capitalization from the WisdomTree Dividend Index. The index is dividend weighted annually to reflect the proportionate share of the aggregate cash dividends each component is projected to pay in the coming year, based on the most recently declared dividend per share. Influence: Jeremy Siegel.

Schwab Center for Financial Research Journal of Investment research
10 for institutional use only. not for further Distribution.
Glossary of TermsAlpha. A performance measure on a risk-adjusted basis. Alpha takes the volatility (risk) of a mutual fund, or other type of investment, and compares its risk-adjusted performance with a benchmark index. The excess return of the fund relative to the return of the benchmark index is a fund’s alpha.
Alternative beta. Also known as smart beta and strategy beta. Alternative beta strategies attempt to deliver a better risk and return trade-off than conventional market-cap-weighted indexes by using alternative weighting schemes based on measures such as volatility. Alternative beta strategies include a range of alternative weighting methods: fundamentally weighted, equal weighting, minimum variance, and low volatility, among others.
Beta. A measure of the volatility, or systematic risk, of a security or a portfolio in comparison with the market as a whole. Beta is used in the capital asset pricing model (CAPM), which calculates the expected return of an asset based on its beta and expected market returns.
correlation. Correlation measures the relationship and movement of two or more securities, ranging between -1 and +1. Perfect positive correlation (a correlation of +1) implies that as one security moves, either up or down, the other security will move in lockstep in the same direction. Alternatively, perfect negative correlation means that if one security moves in either direction the security that is perfectly negatively correlated will move in the opposite direction. If the correlation is 0, the movements of the securities are said to have no correlation; they are completely random.
fundamentally weighted index. A type of equity index in which components are chosen based on fundamental criteria as opposed to market capitalization. Fundamentally weighted indexes may be based on fundamental metrics such as sales, cash flow, and dividends. Proponents of these indexes claim that they are a more accurate
aggregate measure of the market because market-capitalization figures tend to overweight companies that are richly valued while underweighting companies with low valuations. Fundamentally weighted indexes are sometimes referred to as alternative beta or smart beta.
Market-cap weighting. Most of the broadly used market indexes today are “cap-weighted” indexes, such as the S&P 500, Russell, and MSCI indexes. In a cap-weighted index, large price moves in the largest components can have a dramatic effect on the value of the index. Some investors feel that this overweighting toward the larger companies gives a distorted view of the market.
Sharpe ratio. A ratio developed by Nobel laureate William F. Sharpe to measure risk-adjusted performance. The Sharpe ratio measures the excess return (or risk premium) per unit of deviation (risk) in an investment. The Sharpe ratio characterizes how well the return of an asset compensates the investor for the risk taken. When comparing two assets versus a common benchmark, the one with a higher Sharpe ratio provides better return for the same risk (or, equivalently, the same return for lower risk).
Standard deviation. Standard deviation is a statistical measurement that sheds light on historical volatility. For example, a volatile portfolio will have a higher standard deviation than a less volatile portfolio. A large dispersion tells us how much the return on the fund is deviating from the expected normal returns.

Alternative Beta Strategies: An Evaluation of Different Approaches
11for institutional use only. not for further Distribution.
This page intentionally left blank.

Schwab Center for Financial Research Journal of Investment research
Anthony B. Davidow, ciMA®Vice President, Alternative Beta and Asset Allocation Strategist Schwab Center for Financial Research
Anthony Davidow is responsible for providing Schwab’s point of view on asset allocation and portfolio construction. He is also responsible for providing research and analysis on alternative beta strategies and how investors should incorporate them in their portfolios.
Before joining Schwab, Davidow was a managing director, portfolio strategist, and head of the ETF Knowledge Center for Guggenheim Investments. Before joining Guggenheim, Davidow was executive vice president and head of distribution for IndexIQ. Previously, he spent 15 years at Morgan Stanley, where he served as managing director and head of sales and training for the Consulting Services Group. While at Morgan Stanley, he worked with many of the firm’s largest clients in developing and implementing asset allocation strategies, incorporating active and passive strategies, and using alternative investments as risk management tools.
Davidow has authored several white papers and strategy pieces and spoken at industry conferences on a range of topics, including “The Merits of Core-Satellite Investing,” “Asset Allocation and Manager Selection: Adaptive Allocation,” “Alpha-Beta Separation,” “Alternative Weighting Strategies,” “The Role and Use of Alternative Investments,” “Currency as an Asset Class,” and “An Evolutionary Approach to Portfolio Construction.”
Davidow holds a B.B.A. degree in finance and investments from Bernard M. Baruch College and has earned the Certified Investment Management Analyst (CIMA®) designation from the Investment Management Consultants Association (IMCA) and the Wharton School of the University of Pennsylvania. He sits on the board of directors for IMCA. He holds Series 7, 24, and 63 registrations.
For more informationcontact schwab Investment solutions at (877) 824-5615 or [email protected] to learn more.
Investors should carefully consider information contained in the prospectus, including investment objectives, risks, charges, and expenses. You can request a prospectus by visiting schwab.com or calling 877-824-5615. Please read the prospectus carefully before investing.
The information provided here is for general informational purposes only and should not be considered an individualized recommendation or personalized investment advice. The investment strategies mentioned here may not be suitable for everyone. Each investor needs to review an investment strategy for his or her own particular situation before making any investment decision. Data here is obtained from what are considered reliable sources; however, its accuracy, completeness, or reliability cannot be guaranteed.
Past performance is no guarantee of future results. Indexes are unmanaged, do not incur management fees, costs, and expenses, and cannot be invested in directly.
“Fundamental Index” is a registered trademark of Research Affiliates LLC. All other marks are the property of their respective owners.
The Schwab Center for Financial Research is a division of Charles Schwab & Co., Inc. Schwab Investment Solutions is a specific group within Charles Schwab & Co., Inc.
None of the firms referenced in this paper are affiliated with Schwab.
©2013 Charles Schwab & Co., Inc. All rights reserved. Member SIPC.
HNW (0913-5648) MKT73814ABS-00 (10/13)
for institutional use only. not for further Distribution.