alternative disposal feasibility - metro waste … disposal feasibility ... the metro waste...
TRANSCRIPT

Alternative Disposal Feasibility
FINAL
2013
HDR Project No. 000000000188844

Executive Summary
Alternative Disposable Feasibility 2013 ES-1
Alternative Disposal Feasibility Executive Summary
ES-1 Introduction
The Metro Waste Authority (MWA) is currently disposing municipal solid waste (MSW) in it’s landfill facility. As an alternative means of disposal, MWA is considering alternatives to landfilling as a long term solid waste disposal option. This Study reviews the feasibility of building and operating a waste to energy (WTE) facility.
MWA has also expressed interest in Plastics to Oil technology; this technology will also be evaluated as a part of this Study.
ES-2 Service Area
ES-2.1 Planning Area
MWA is an independent government agency comprised of 17 member communities, one county, and six planning members. The largest community in the area is the City of Des Moines. MWA operates many facilities including;
• The Metro Park East Landfill, • The Metro Park West Landfill, • The Metro Compost Center, • The Metro Transfer Station, • The Metro Hazardous Waste Drop-Off, and • The Metro Recycling Centers.
ES-2.2 Current Waste Management Practices
Within the MWA Planning Area, residential and commercial solid waste collection is principally provided by private hauling companies.
MWA uses hauler contracts to manage its control over the flow of solid waste within its planning area MWA offers a decreased landfill tipping fee if the haulers operating in the MWA Planning Area sign a contract agreeing to bring all landfilled solid waste (commercial, construction and demolition, and residential waste) from the MWA Planning Area to one of MWA’s facilities or, with special permission, to other MWA approved facilities. This contractual arrangement has been directed primarily at capturing solid waste collected for landfill disposal by private haulers.
Two transfer stations exist within the MWA Planning Area; one transfer station is owned and operated by MWA, and the other is privately owned and operated. MWA owns and operates the Metro Transfer Station (MTS). The MTS consolidates and transports the majority of all residential solid waste collected within MWA’s service area. The MTS primarily handles residential waste and a limited amount of commercial waste. The second permitted transfer station in the MWA Planning Area is operated by Waste Management of Iowa, Inc. Because it is within MWA’s planning area, this private facility is required to haul all waste to the MWA facilities.
The Metro Recycling Center (MRC) serves the residents and businesses within MWA’s Planning Area communities as its single designated drop-off site.

Executive Summary
Alternative Disposable Feasibility 2013 ES-2
MWA provides recycling programs for specific targeted material streams, which include:
� Tires � White goods (appliances) � Scrap metal recovery � Toxic reduction programs
MWA owns and operates a Regional Collection Center (RCC) to collect and properly dispose of or recycle household hazardous waste (HHW), waste oil, lead acid batteries, universal wastes, and electronic wastes.
MWA also owns and operates a yard waste composting operation. Diversion of C&D waste material has principally been provided by private companies. Two private companies have permits to process and recycle C&D waste in the MWA Planning Area.
Disposal of solid waste in central Iowa is largely managed with landfills. The City of Ames Resource Recovery Plant uses solid waste to create a refuse-derived fuel product that is co-combusted with coal and burned for energy. This is the only WTE or conversion technology facility in the region.
ES-2.3 Solid Waste Disposal and Composition
Waste accepted by MWA for landfill disposal is identified by one of four different categories of solid waste based on the generation sources:
� Residential Waste � Commercial Waste � C&D Waste � Special Waste including:
o Commercial/industrial waste o Petroleum contaminated soils o Other waste that requires special handling
Of these waste types, principally the residential and commercial quantities were considered for diversion and the composition was derived primarily from the residential and commercial material sampled in the recent 2011 Iowa Statewide Waste Characterization Study prepared for the Iowa Department of Natural Resource and dated September 14, 2011 (Characterization Study).
ES-2.4 MSW Quantity and Projections
MWA tonnage levels and tipping fees have remained relatively constant in recent years Figure 1 provides summary data. This data includes all types of waste disposed.

Executive Summary
Alternative Disposable Feasibility 2013 ES-3
Figure 1. MWA Historic Tonnage and Tipping Fees
Source: MWA 2012-2013 Strategic Business Plan
The quantity of residential and commercial waste used for analysis purposes was obtained from the Characterization Study (identified as “MSW” within the Study) and is 400,161 tons per year. The waste quantities have been relatively flat in recent years therefore this value was used as the approximate available tonnage for sizing and comparison purposes for the thermal alternatives considered.
Solid waste quantity disposal rates (tons per day) available for a project are based on total annual disposal quantities divided by 365 days per year and an availability factor for the plant to account for any downtime occurring throughout the year for maintenance or unexpected outages.
It is important to have an understanding of the composition of the waste stream, particularly for diversion technologies that only address a portion of the waste stream such as plastics to oil technology.
The Characterization Study is the most recent and complete waste composition study for the region. Data from this study was used in the development of this alternative disposal analysis. Table 1 represents the composition of waste disposed at the MWA landfill.
Table 1. MWA MSW Estimated Composition
Material Estimated Quantity
Paper 25%
Metal 5%
Glass 1%
Organic 25%
C&D 15%
Plastic 18%
Durable 3%
HHMS 0%
Other 8%
Source: 2011 Iowa Statewide Waste Characterization Study
0
100,000
200,000
300,000
400,000
500,000
600,000
$0.00
$5.00
$10.00
$15.00
$20.00
$25.00
$30.00
$35.00
1985 1990 1995 2000 2005 2010 2015
To
ns
Dis
po
sed
$ /
To
n
Year
Tipping Fee
Contracted Fee
Tons

Executive Summary
Alternative Disposable Feasibility 2013 ES-4
ES-2.5 Conceptual Project Parameters
Conceptual development of the alternatives was kept as consistent as possible for comparison purposes. Each concept was based on a typical facility, not necessarily around a particular vendor. If the project were to develop special features and performance of each vendor will result in changes to the facility design and economic performance.
In some cases plant excess capacity is included, however, for this study future annual waste disposal requirements are assumed to stay consistent with current numbers due to very slow growth in the region as well as other factors. For the waste to energy or thermal alternatives the same overall annual throughput capacity was maintained for each option. Adjustments to physical size and capacity for each option were applied to maintain the annual throughput. For instance the RDF alternative will require a larger footprint when compared to the mass burn or gasification options in order to provide space for the front end processing system. Some gasification facilities have a lower capacity factor or availability; therefore the gasification system will require slightly larger units (on a ton per day basis) in order to process the same annual quantity.
For the gasification alternative, HDR has assumed a design based upon a technology that does not require front end processing. This approach was taken because these technologies may be slightly more developed. Generally these technologies have a smaller unit size and likely require three or four combustion units. For the mass burn and RDF options two combustion units and one turbine generator were proposed as this would be more cost effective.
Generic site with access to utilities, electrical interconnect, roadways, etc are assumed for all the alternatives. A specific site will result in adjustment of the site development costs.
ES-2.6 Low Grade Plastics Projections
Again the concept was not necessarily developed around a specific facility or vendor. This technology like gasification is younger and commercial operations are limited.
A different approach was taken for sizing of the plastics to oil facility because it targets a particular material within the waste stream. Well established recycling markets for PET (No.1) and HDPE (No.2) containers are in place and these materials are assumed not eligible for use at a plastics to oil facility. If the market stays consistent, economics for recycling of the No 1 and 2 plastics are more favorable than the additional oil that could be produced from these plastics. The facility size was therefore established based upon assumptions for the quantity of “low grade” plastics that could conceivably be extracted from the waste stream. Factors for the capture efficiency and process rejects were applied to establish a facility size in tons of plastics processed per day.

Executive Summary
Alternative Disposable Feasibility 2013 ES-5
Table 2. Plastics in MSW Disposal Stream
Material Estimated
Percentage Estimated Quantity
Total Plastic in MSW Disposal Stream (1) 100.0% 71,629
#1 PET IA Deposit Beverage Containers 1% 400
#1 PET Beverage Containers 3% 2,001
#2 HDPE Containers Natural 1% 800
#2 HDPE Containers Colored 2% 1,601
Retail Shopping Bags 1% 800
Other Film Plastic 36% 26,010
Other #1 PET Containers 2% 1,200
Plastic Containers #3-#7 3% 2,401
Other Plastic Containers 10% 7,203
Expanded Polystyrene 12% 8,403
Other Plastic Products 29% 20,808
Estimated Total of Low Grade Plastics Disposed 64,826
Note:
(1) Quantities do not include recycled plastics.
A number of options were considered for how the low grade plastics might be segregated from the mixed waste. Some of these options are discussed below:
� Capture through recycling programs: o This option would result in significant issues at the MRF with separating these materials
from the other recyclables currently processed. The residue material from the MRF however may be a good source of low grade plastics but the quantity of material would not be economical by itself.
� Recyclables processing line: o The processing line could be located on the tipping floor of a new facility or an existing
facility as a means of providing access to the waste material and to minimize double handling of reject material. MWA has a transfer station within its system, however, it is understood that the transfer station tipping floor is well utilized and would not be practical.
� Capture at the landfill: o This method raises numerous operational and safety concerns. Select routes/loads may
be able to be targeted to tip at a designated location at the landfill to be sorted. The materials captured and the residue would then need to be re-handled to take the recyclables to a consolidation location, the low grade plastics to the processing facility and residue to the landfill face.
� Dirty MRF within the region: o A dirty MRF would require a tipping floor for receiving waste, a loadout area for removal
of the rejected material, process line(s), and storage space for captured materials as well as support facilities. Complexity of a dirty MRF can vary depending on the recovery
efficiencies desired. � A simple sorting line with picking stations may be arranged that allow sorters to
positively sort specific products. Magnets may be used for ferrous metal capture. Diversion rates for similar facilities are generally less than 15 percent for all products and capture of low grade plastics would be limited.
� More sophisticated dirty MRFs, will utilize more screens, optical sorters, and other equipment as a means of increasing efficiency. Higher capture rates would be possible and plastics could be sorted into recyclable and low grade plastics. The remaining residue would be about fifty percent of the incoming material.

Executive Summary
Alternative Disposable Feasibility 2013 ES-6
The plastic to oil analysis was highly reliant on information provided by vendors. Due to the developmental state of this technology, the quality of the vendor information provided is not as proven or demonstrated as with the WTE options. A conservative capacity factor was included because of the limited demonstration of this technology.
Different end products are claimed from the various vendors, such as, diesel fuel, No. 6 fuel oil, synthetic fuel and crude oil. This analysis assumed the oil would be sold as a crude material for further off site processing.
ES-3 Environmental Considerations
Environmental factors associated with the proposed waste-to-energy (WTE) facility including major considerations related to air emissions, solid waste management, and stormwater and water discharge. Floodplain and zoning considerations are also discussed..
ES-3.1 Permitting
ES-3.1.1 Air Permitting
Depending upon the type of air permit required, either the Iowa Department of Natural Resources (IDNR) Air Quality Division or the Polk County Public Works Air Quality Division (Polk County) has jurisdictional authority to regulate and permit the proposed WTE facility’s air emissions. The type of air permit required will depend on the type of waste, the quantity of waste, and the technology used to process the waste, and the facility’s potential air emissions.
ES-3.1.2 Solid Waste Permitting
The Solid and Hazardous Waste Division of IDNR would permit the facility under the Section 567, Chapter 102 regulations which were promulgated through the authority of the Iowa Environmental Quality Act. This permitting process could take approximately 12 to 18 months to complete.
ES-3.1.3 Stormwater and Water Discharge Permitting
It is likely that the facility will need an industrial stormwater discharge permit that will regulate stormwater discharge activities depending on the design and planned operation of the facility. IDNR will review the design and operation prior to issuing the permit to determine the specific requirements of the permit. The state will also require an Iowa Pollution Discharge Elimination System (IPDES) permit if any washing or other operational activities will be discharging to waters of the state or to the storm sewer.
Discharge of process waste water to the sanitary sewer may require a pretreatment permit. Des Moines Metropolitan Wastewater Reclamation Authority will need to be contacted prior to facility construction and operation in order to determine the specific requirements of the sanitary sewer pretreatment permit.
ES-3.1.4 Floodplain Considerations
Floodplains would need to be considered as potential sites are investigated. If the final site selected is within a floodplain, the U.S. Army Corps of Engineers would need to approve the filling of soil in the floodplain prior to any soil being placed in that area.
ES-3.1.5 Zonal Approval
The facility will need to receive zoning approval to build depending on the final location selected. Applicable zoning approval documents will likely need to be submitted with air permitting and solid waste permitting applications indicating that zoning approval has been received.

Executive Summary
Alternative Disposable Feasibility 2013 ES-7
ES-3.2 Anticipated Emissions ES-3.2.1 Emissions Impacts
Emissions from energy recovery systems will vary somewhat based on variations in the processing requirements for each technology. However, there are significant similarities among the thermal technologies. Air emissions of concern include:
• Particulate matter • NOx • CO • SO2 • HCL • Dioxins and Furans • Mercury • GHG’s (not considered a pollutant) • Syngas NOx (applicable if syngas generated from gasification option is combusted in internal
combustion engine or combustion turbine).
ES-3.2.2 Air Pollution Control Technologies
Air pollution control technologies have been developed to try to minimize air pollution emissions. Table 3 summaries these technologies.
Table 3. Air Pollution Control Technologies
ES-4 Energy Markets
The recovery of energy is one of the most important factors in determining financial and environmental viability of a proposed system. Depending on the technology, energy could conceivably be recovered in the form of heat, steam, electricity, and/or synthetic gas. For example, conventional mass burn will provide good opportunities for the production of electricity, process steam and district heat, while anaerobic digestion offers the generation of natural gas-like fuels.
WTE options have the potential to produce electricity through the use of a steam turbine-generator. In some cases, the steam produced in the WTE process can be sold to a nearby commercial or industrial facility in lieu of producing electricity. Sale of steam greatly enhances the efficiency of a facility and would improve the overall economics. Sites near a steam customer with a high consistent steam demand would be preferred over other sites. Detailed analysis should be conducted if actual customers are identified.
For the purposes of this analysis electrical sales are assumed for the WTE options, assuming that a reliable steam customer is not available. Potential steam production and sales are provided, but not included in the cost evaluation.
In regards to plastics to oil, crude oil is assumed as the end product for sales to a refinery.
Air Emission ConcernAnticipated Control
Technology
Particulate Matter Fabric FilterNOx SNCR or SCRCO Good CombustionSO2 Dry ScrubberHCL Dry ScrubberDioxins and Furans Carbon InjectionMercury Carbon InjectionNOx (Syngas Combustion ) SCR

Executive Summary
Alternative Disposable Feasibility 2013 ES-8
ES-4.1 Facility Sizing Considerations
Based on the waste area reviewed, the waste-to-energy (WTE) facility will need to be able to manage a projected waste stream of 303,122 tons per year (tpy). The projected waste stream takes into account factors for non processable or unacceptable wastes and seasonal fluctuations. The plastics to oil facility would need to manage about 11,000 tpy.
The facility capacity should also be large enough to allow for facility downtime. Typically, a capacity factor of 85 to 90% is assumed for a facility of this size. The capacity factor is defined as the actual materials processed as a percentage of the capacity of the facility. At an 85% capacity factor, a 977 tpd facility would process 303,122 tons annually and will be the size considered for the mass burn and RDF facilities. Gasification facilities are assumed to have a slightly lower capacity factor at 80%, resulting in a larger daily throughput requirement of 1,038 tpd to meet the annual disposal requirement of 303,122 tons.
For this analysis the plastics to oil facility included a lower capacity factor of 60 percent due to the limited commercial demonstration of the technology. resulting in a facility size of about 50.5 tpd.
ES-5 Technology Overview
This overview defines the general MSW technologies to be investigated for this study. Technologies included in the review are those that have been implemented successfully, technologies that have been tried but have yet to successfully and/or economically handle an MSW stream on a commercial scale, and those that are currently considered theoretical.
The following technologies are evaluated in this study:
� Anaerobic digestion � Mechanical biological treatment (MBT) � Refuse-derived fuel (RDF) with stoker firing � RDF with fluidized bed combustion � Mass-burn combustion � Catalytic depolymerization � Hydrolysis � Pyrolysis � Gasification � Plasma arc gasification � Plastics to Oil
ES-5.1 Anaerobic Digestion
Anaerobic digestion (AD) is the process of decomposing the organic portion of MSW in a controlled oxygen-deficient environment. Bacteria produce a biogas that consists mainly of methane, water vapor, and carbon dioxide (CO2). The gas produced can be used as a fuel for boilers, directly in an internal combustion engine or, possibly in sufficient quantities, in a gas turbine to produce electricity
Two of the only known commercial-scale plants in North America that are designed specifically for processing source separated organics (SSO) are in the Greater Toronto Area; the Dufferin Organic Processing Facility in Toronto and the CCI Energy Facility in Newmarket. There are a number of smaller demonstration facilities in the U.S. operating on either mixed MSW, SSO, or in some cases co-digested with biosolids.
Vendors include Urbaser (Valorga International), Mustang Renewable Power Ventures, Ecocorp, Organic Waste Systems, and Greenfinch.
ES-5.2 Mechanical Biological Treatment (MBT)
Mechanical biological treatment (MBT) is a variation on composting and materials recovery. This technology is generally designed to process a fully commingled MSW stream. Processed materials include marketable metals, glass, other recyclables, and a refuse-derived fuel (RDF) that can be used for combustion. Limited composting is used to break the MSW down and dry the fuel. The order of mechanical separating, shredding, and composting can vary.
Executive Summary
Alternative Disposable Feasibility 2013 ES-9
This technology has been used in Europe, including Herhof GmbH facilities in Germany and Greece. , but not in the U. S. commercially.
ES-5.3 RDF Processing
An RDF processing system prepares MSW by using shredding, screening, air classifying and other equipment to produce a fuel product for either on-site combustion, off site combustion, or use in another conversion technology that requires a prepared feedstock. RDF plants with onsite combustion produce steam and electricity. Economics can be improved if a steam customer with a relatively continuous demand for steam can be identified.
RDF technology is a proven technology that is used at a number of plants in the U.S., Europe and Asia (generally larger plants with capacities greater than 1,500 tons per day). Example plants include; The Dongara facility located in York Region in Canada, Ames, IA; Southeastern Public Service Authority, VA; French Island, WI; Mid-Connecticut; Honolulu, HI; and West Palm Beach, FL.
Vendors/System Designers: Energy Answers; RRT; Dongara; Westroc Energy; Ambient Eco Group; and, Cobb Creations
ES-5.1.1 RDF with Stoker Firing
This technology uses a spreader stoker type boiler to combust RDF. A front-end processing system is required to produce a consistently sized feedstock. The RDF is typically blown or mechanically injected into a boiler for semi-suspension firing. Combustion is completed on a traveling grate. This technology is used at the following facilities mentioned above: Southeastern Public Service Authority, VA; Mid-Connecticut; Honolulu, HI; and West Palm Beach, FL.
Boiler Vendors: Alstom; Babcock and Wilcox; Babcock Power
ES-5.1.2 RDF with Fluidized Bed Combustion
This technology uses a bubbling or circulating fluidized bed of sand to combust RDF. A front-end processing system is required to produce a consistently sized feedstock.
This technology is in limited commercial use in North America for waste applications with one operating facility in Wisconsin.
Fluidized Bed Boiler Vendors: Environmental Products of Idaho (EPI), Von Roll Inova, Foster Wheeler, and Ebara.
ES-5.4 Mass-burn combustion
Mass Burn combustion technology can be divided into two main types: (a) grate based, waterwall boiler installations; and (b) modular, shop erected combustion units with shop fabricated waste heat recovery boilers. The modular units are typically limited to less than 200 ton per day and are historically used in facilities where the total throughput is under 500 tpd. The larger mass burn combustion process with waterwall boilers feed MSW directly into a boiler system with no preprocessing. The MSW is typically pushed onto a grate by a ram connected to hydraulic cylinders. Mass burn plants produce steam and electricity. Economics can be improved if a steam customer with a relatively continuous demand for steam can be identified.
Large-scale and modular mass burn combustion technology is used in commercial operations at more than 80 facilities in the U.S., two in Canada, and more than 500 in Europe, as well as a large number in Asia.
Examples of larger-scale grate system technology vendors (some offer more than one design) include: Martin GmbH, Hitachi Zosen Inova (von Roll), Keppel Seghers, Steinmuller, Fisia Babcock, Volund, Takuma, and Detroit Stoker. Some examples of smaller-scale and modular mass burn combustion vendors include: Enercon, Laurent Bouillet, Consutech, and Pioneer Plus.

Executive Summary
Alternative Disposable Feasibility 2013 ES-10
ES-5.5 Catalytic Depolymerization
In a catalytic depolymerization process, the plastics, synthetic-fibre components and water in the MSW feedstock react with a catalyst under non-atmospheric pressure and temperatures to produce a crude oil. This crude oil can then be distilled to produce a boiler fuel, synthetic gasoline or fuel-grade diesel.
There are no large-scale commercial catalytic depolymerization facilities operating in North America that use a purely mixed MSW stream as a feedstock. There are some facilities in Europe that have utilized this or a similar process to convert waste plastics, waste oils, and other select feedstocks.
Some examples of vendors that provide catalytic depolymerization-type technologies include: ConFuel K2, AlphaKat/KDV, Enerkem, Changing World Technologies, and Green Power Inc.
ES-5.6 Hydrolysis
The hydrolysis process involves the reaction of the water and cellulose fractions in the MSW feedstock (e.g., paper, food waste, yard waste, etc.) with a strong acid (e.g., sulfuric acid) to produce sugars. In the next process step, these sugars are fermented to produce an organic alcohol. This alcohol is then distilled to produce a fuel-grade ethanol solution.
There have been some demonstration and pilot-scale hydrolysis applications completed using mixed MSW and other select waste streams. However, there has been no widespread commercial application of this technology in North America or abroad.
Some examples of vendors that offer some form of the hydrolysis technology include: Masada OxyNol; Biofine; and, Arkenol Fuels. A process flow diagram is provided in Figure A.5 in Appendix A.
ES-5.7 Pyrolysis
Pyrolysis is generally defined as the process of heating MSW in an oxygen-deficient environment to produce a combustible gaseous or liquid product and a carbon-rich solid residue. The feedstock can be the entire municipal waste stream, but, in some cases, pre-sorting or processing is used to obtain a refuse-derived fuel. The gas or liquid derived from the process can generally be used in an internal combustion engine or theoretically a gas turbine or as a feedstock for chemical production. Generally, pyrolysis occurs at a lower temperature than gasification, although the basic processes are similar.
There are several pilot projects at various stages of development. There have been some commercial-scale pyrolysis facilities in operation in Europe (e.g. Germany) on select waste streams.
Some examples of vendors that offer the pyrolysis technology include: Brightstar Environmental, Mitsui, Compact Power, PKA, Thide Environmental, WasteGen UK, International Environmental Solutions (IES), SMUDA Technologies (plastics only), and Utah Valley Energy
ES-5.8 Gasification
Gasification converts carbonaceous material into a synthesis gas or “syngas” composed primarily of carbon monoxide and hydrogen. This syngas can be used as a fuel to generate electricity directly in a combustion turbine or engine, or more likely fired in a heat recovery steam generator (HRSG) to create steam that can be used to generate electricity via steam condensing turbine. The syngas generated could also be used as a chemical building block in the synthesis of gasoline, diesel fuel, for generation of hydrogen, or other chemical feedstock gases.
The technology did not have a lot of commercial-scale success using mixed MSW when attempted in the U.S. and Europe. Japan has several operating commercial-scale gasification facilities that claim to process at least some MSW.
The remainder of this report addresses single or two chamber gasification processes that does not required front end processing of MSW to produce an RDF and utilizes the gas produced in a waste heat boiler to produce steam. This is generally the simplest, most developed, and cost effective of the gasification approaches and is offered by several vendors in the U.S.

Executive Summary
Alternative Disposable Feasibility 2013 ES-11
Examples of a number of potential gasification vendors include: Thermoselect, Ebara, Primenergy, Brightstar Environmental, Erergos, Taylor Biomass Energy, SilvaGas, Conanta Energy, Technip, Compact Power, PKA, and New Planet Energy.
ES-5.9 Plasma Arc Gasification
Plasma arc technology uses carbon electrodes to produce a very high temperature arc ranging between 5,000 to 13,000 degrees Fahrenheit that “vaporizes” the feedstock. The high-energy electric arc that is struck between the two carbon electrodes creates a high temperature ionized gas (or “plasma”). The intense heat of the plasma breaks the MSW and the other organic materials fed to the reaction chamber into basic elemental compounds while the inorganic fractions (glass, metals, etc.) of the MSW stream are melted to form a liquid slag material.
Plasma technology produces a low Btu syngas; this fuel can be combusted and the heat recovered in a heat recovery steam generator (HRSG), or the syngas can be cleaned and combusted directly in an internal combustion engine or theoretically a gas turbine. Electricity and/or thermal energy (i.e. steam, hot water) can be produced by this technology
There are several large-scale projects being planned in North America. In addition, there are a number of commercial scale demonstration facilities in North America.
There are a number of Plasma Arc technology vendors, including Startech, Geoplasma, PyroGenesis Canada, Inc., Westinghouse, Alter NRG, Plasco Energy, Integrated Environmental Technologies and Coronal.
ES-5.10 Plastics to Oil
Plastics to oil systems convert recovered plastics into oil which can be further refined by a third party into a gasoline, diesel fuel, other industrial fuel or converted to a fuel directly within the system.
Several vendors have pilot scale or research and development (R&D) facilities in operation. There are a few commercial scale facilities in the United States in varying levels of construction, permitting, or operation.
There are a few plants operating outside of the United States including two systems in Thailand and one in India.
A number of vendors are in various stages of development including: Agilyx, Climax Global Energy, Cynar, Envion, GEEP, Green EnviroTech Holdings, Green Mantra Recycling Technology, Natural State Research (NSR), Nexus Fuels, Plastic2Oil (JBI), Polyflow, Recarbon Corp., Vadxx.
ES-5.11 Technologies Evaluated
The thermal technologies that will be further evaluated in this report include mass burn, RDF or processed fuel with stoker grate technology, and gasification utilizing a single or dual chamber for thermal conversion without front end processing and with an attached HRSG waste heat boiler for energy recovery. These technologies were selected based on viability of development due to current state of commercialization and discussions with MWA.
Of these technologies, mass burn combustion is the most commercially utilized around the world. RDF technology has been used in a number of plants in the U.S. that have been in commercial operation for many years. One or two stage gasification with steam production is less developed, but is one of the least complicated and most commercially developed of the gasification approaches.
In addition plastic to oil is reviewed. Plastic to oil is of special interest and may be approaching commercial performance in certain applications. The remaining technologies presently are either less commercially developed or considered not applicable to MWA’s current interests.

Executive Summary
Alternative Disposable Feasibility 2013 ES-12
ES-6 Economic Evaluation
ES-6.1 Methodology and Assumptions
The financial analysis models the capital and operating costs of the three WTE options for comparison. The approach is to provide a common basis to explore and examine the financial implications of each of the waste to energy options. For example, site acquisition required for each option, site development of a generic site, annual waste processing capacity is equal for each option, MSW is the feedstock delivered to the site, ash produced will be disposed at the landfill, recovered material sales are included, and electrical production and sales are assumed for each option.
The total costs for each option was divided by the tons processed to estimate a cost per ton for operation of the facility. This cost per ton number is the approximate “break even” tipping fee required for the facility to operate without a loss.
A separate analysis is provided for the plastics to oil alternative. The economic evaluation assumes that plastic feedstock is source separated and delivered to the site at no cost and crude oil is produced for sales to a refinery that will provide further refining.
The plastic to oil “break even” cost of operation was calculated slightly differently compared to the WTE options. The total annual cost of operation was divided by the annual barrels of oil produced in order to estimate required dollars per barrel of oil revenue needed to offset operating costs.
The economic analysis assumes no incentives within the State of Iowa are currently available to help offset development costs. Examples of previous incentives applicable to WTE type facilities included; Renewable Energy Production Tax Credit and Clean Renewable Energy Bonds (CREB’s) both of which have or will expire by the time a plant could be developed. A bill had been proposed but not passed to incentivize plastics to oil plants.
ES-6.2 Cost Evaluation
The following table provides a summary of the estimated capital cost each option.
Table 4. Capital Cost Summary
RDF Processing
and Combustion
Mass Burn Gasification Plastic to Oil
Component 2012$’s 2012$’s 2012$’s 2012$’s
Land acquisition $225,000 $150,000 $150,000 $90,000
Sitework $240,000 $240,000 $240,000 $78,000
Site improvements (1) $2,600,000 $1,900,000 $2,000,000 $2,100,000
Pre-processing equipment $18,700,000 $0 $0 $300,000
Buildings $34,700,000 $17,500,000 $18,200,000 $10,500,000
Power block equipment (2) $162,540,000 $183,090,000 $210,520,000 $18,360,000
Design / engineering $17,500,000 $16,200,000 $18,500,000 $2,500,000
Construction Management $10,900,000 $10,100,000 $11,600,000 $1,600,000
Permitting $1,090,000 $1,010,000 $1,160,000 $160,000
Startup and Testing $8,800,000 $8,100,000 $9,200,000 $1,300,000
Capital contingency $43,800,000 $40,500,000 $46,200,000 $6,300,000
Total Capital Cost $301,100,000 $278,800,000 $317,800,000 $43,300,000
Note:
(1) Site improvements for plastic to oil option include product storage tanks, and other infrastructure required for oil truck loadout.
(2) Cost represents “Process Equipment” for Plastics to Oil.
Operating costs were developed on an annual basis for each of the options as shown in Table 5

Executive Summary
Alternative Disposable Feasibility 2013 ES-13
Table 5. Annual Operating Cost Summary
RDF with
Combustion Mass Burn Gasification
Plastics to Oil Item
ANNUAL O&M COSTS
Labor $6,780,000 $4,751,000 $4,751,000 $2,314,000
Facilities maintenance $407,000 $118,000 $128,000 $128,000
Stationary equip maintenance/replace $2,146,000 $2,231,000 $2,564,000 $352,000
Rolling stock maintenance $220,000 $36,000 $36,000 $17,000
Equipment replacement costs $378,000 $293,000 $293,000 $81,000
Utilities $105,000 $105,000 $108,000 $161,000
Reagents $1,580,000 $1,580,000 $1,580,000 $13,000
Fuel (1) $704,000 $128,000 $128,000 $352,000
Ash Disposal $1,910,000 $1,591,000 $1,591,000 $76,000
General & administration/legal,/accnt. $284,600 $216,700 $223,600 $69,900
Overhead & profit (10%) $1,451,000 $1,105,000 $1,140,000 $356,000
Insurance $150,000 $150,000 $150,000 $75,000
Subtotal $16,116,000 $12,305,000 $12,693,000 $3,995,000
Contingency (10%) $1,611,600 $1,230,500 $1,269,300 $399,500
Total O&M costs $17,727,600 $13,535,500 $13,962,300 $4,394,500
Note:
(1) For the plastic to oil option, this line item includes shipment of the produced oil product.
This analysis assumes that revenue bonds will be required to finance any of the options. The bond issue would need to provide for the capital cost, issuance costs, debt coverage, interest during construction, and similar costs. Table 6 provides an estimate of debt service required to fund the project. Capital costs were escalated by four percent for three years for the waste to energy options and by two years for the plastics to oil option to account for time to development each of the options.
Table 6. Debt Service Summary
Sources RDF and
Combustion Mass Burn
Combustion Gasification
Plastics to Oil Facility
Bond Sale Proceeds $ 415,230,000 $ 384,477,000 $ 438,260,000 $ 54,560,000
Interest earnings during construction
$ 10,547,000 $ 9,766,000 $ 11,132,000 $ 581,000
Total $ 425,777,000 $ 394,243,000 $ 449,393,000 $ 55,141,000
Uses
Construction Cost $ 338,697,000 $ 313,612,000 $ 357,482,000 $ 46,833,000
Issuance Costs $ 16,609,000 $ 15,379,000 $ 17,530,000 $ 2,182,000
Capitalized Interest $ 42,561,000 $ 39,409,000 $ 44,922,000 $ 2,455,000
Debt Service Reserve Fund $ 27,910,000 $ 25,843,000 $ 29,458,000 $ 3,667,000
Total $ 425,777,000 $ 394,243,000 $ 449,392,000 $ 55,138,000

Executive Summary
Alternative Disposable Feasibility 2013 ES-14
Table 7 shows WTE estimated annual total expenditures and revenues and presents a cost per ton figure. The net unit cost as shown in the table indicates the “break even” amount for operation of the facility. This cost per ton figure represents the required tipping fee to fully offset the operational costs.
Table 8 provides an estimated annual cost summary for the plastics to oil plant. The table provides a “break even” required revenue from oil sales. This value represents the required cost per barrel to offset operational costs.
Table 7. WTE Annual Cost Summary
Annual Cost Summary RDF and
Combustion Mass Burn
Combustion Gasification
Total Waste Disposed (ton/yr) 303,122 303,122 303,122
Expenditures
Capital $27,352,000 $25,326,000 $28,869,000
Operating $17,728,000 $13,536,000 $13,962,000
Total Annual Expenditures $45,080,000 $38,862,000 $42,831,000
Gross Annual Unit Cost ($/ton) $149 $128 $141
Revenues
Electricity Sales $5,456,000 $5,683,000 $5,456,000
Sale of Recyclables $1,440,000 $1,440,000 $1,440,000
Total Revenue $6,896,000 $7,123,000 $6,896,000
Net Annual Cost $38,184,000 $31,739,000 $35,935,000
Net Unit Cost ($/ton) $126 $105 $119
Table 8. Plastics to Oil Annual Cost Summary
Cost Summary Plastics to Oil
Total Plastics Processed (ton/yr) 11,060
Total Oil Produced (barrel/yr) 55,436
Expenditures
Capital $3,594,000
Operating $4,395,000
Total Annual Expenditures $7,989,000
Annual Unit Cost ($/Barrel) $144
Table 8 assumes zero cost for the plastic feedstock. However a means to separate plastics from the disposal waste stream will need to be implemented. The most likely method for plastics removal would be the addition of a dirty MRF to the system. A dirty MRF would require additional infrastructure including a building with about 70,000 to 100,000 square feet of floor space to accommodate a tipping floor, infeed and floor sort area, process lines, baler, production storage areas, and loadout areas for reject materials and products.
Estimates from equipment suppliers indicated equipment costs would likely be between $5 and $6 million plus installation for processing lines. Building costs would be approximately $10.5 to $15 million not including costs for site acquisition or improvements that may be required.

Executive Summary
Alternative Disposable Feasibility 2013 ES-15
ES-7 Implementation Keys
ES-7.1 General Siting
A new WTE facility will typically require approximately 10 - 15 acres for all of the facilities operations and support infrastructure. Ideal locations provide easy access for garbage haulers, have easy access to high voltage power lines that have ample capacity to receive electricity from the facility, and have a reliable nearby steam customer.
As a part of the site selection process investigation of potential environmental impacts and potential impacts to neighboring communities will be required. IDNR and local governing agencies will need to be included during the siting process.
ES-7.2 Implementation Issues
If it is determined to advance development of a facility, the following list of major implementation actions has been developed. These measures will help to facilitate the refinement of future planning, scheduling, and implementation and procurement strategies. .
1. Secure a commitment from a long-term viable energy market. This may involve developing a partnership with a utility interested in base load renewable power.
2. Secure a long-term supply of waste. This will likely require one or more forms of flow control. 3. Refine or confirm the sizing analysis and basis of design. 4. Identify the site permits and approval processes, and establish a timeline for critical approvals. 5. Determine the site location to be used, and confirm that it can be permitted at all levels of
required approval. 6. Identify site-specific environmental considerations (such as neighbor concerns) and establish
reasonable mitigation strategies. 7. Identify the scope of the facilities to be included in any proposed project and any land set-asides
for expansion or future management functions. 8. Identify the system implementation strategy related to procurement, ownership, operation, and
residuals haul and disposal. 9. Identify all utility locations and fire protection requirements, and refine the strategy for providing
such utilities and fire protection. 10. Re-assess project economics to confirm that all key assumptions remain valid. This may be
necessary at key implementation milestones.
ES-8 Summary
As part of this Study the amount and type of waste that could potentially be delivered to a proposed waste-to-energy (WTE) facility were reviewed. Three technologies were selected to be looked at in more depth (mass burn, refuse derived fuel, and gasification) based on their history and applicability to the MWA waste stream. The energy recovery potential from these three technologies was evaluated, as well as environmental considerations. This information was then used to evaluate the estimated cost of the proposed facility.
Plastics to oil technology producing crude oil was also evaluated in this study.
The three WTE technologies, as well as the plastics to oil facility, were evaluated for operation and maintenance (O&M) costs and capital costs. The expected tipping fee was estimated for each of the WTE technologies assuming a 20-year debt service period and taking into account the revenue from electricity that offsets the expenses of the project. Mass burn had the lowest calculated tipping fee at $105 per ton. Plastics to oil required oil revenue calculated to be $144 per barrel produced.
A couple of potential ways of lowering the tipping fee, including the following:
• Obtaining a grant to lower the capital cost and associated debt burden;
• Selling a portion of the available steam to nearby commercial/industrial customers at a higher
price than what the steam would be sold for if converted to electricity.

Executive Summary
Alternative Disposable Feasibility 2013 ES-16
With the assistance of grants and/or a steam customer the tipping fee for a WTE facility could be lowered, however, landfilling would likely still have a lower tipping fee making it necessary to exert control of the flow of waste to make a facility financially viable. Although incentives for the development of either the WTE options or the plastics to oil facility are not currently apparent, if MWA desires to move ahead with WTE or plastics to oil facility development it is recommended that MWA continually investigates the availability of state and federal grants that could help cover a portion of the proposed facility’s capital costs.
Furthermore, MWA should initiate discussions with potential steam customers (e.g. sites located near commercial and industrial that have a high energy demand).
Consideration of options of public versus private ownership to be evaluated if further project development is warranted; consideration should be given to economics, residual value, project control, risk, and financing security of ownership options.
If further project development is warranted, a site for the facility needs to be identified and thoroughly reviewed. State and local siting requirements and air permitting issues need to be assessed for an individual site; and further discussions with IDNR on the permitting requirements for the facility and the specific site need to be initiated.

Table of Contents
Alternative Disposal Feasibility 2012 i
Table of Contents Page
Executive Summary ............................................................................................................ ES-1
Acronyms, Abbreviations, and Short Forms ........................................................................... v
Chapter 1 Introduction .............................................................................................................. 1
Chapter 2 Service Area Data .................................................................................................... 2
2.1 Planning Area .................................................................................................................. 2
2.2 Current Waste Management Practices ............................................................................ 2
2.3 Solid Waste Disposal and Composition ........................................................................... 3
2.4 Waste Quantity and Projections....................................................................................... 4
2.5 Conceptual Project Parameters ....................................................................................... 5
2.6 Low Grade Plastics Projections ....................................................................................... 6
Chapter 3 Environmental Considerations ............................................................................... 8
3.1 Air Permitting ................................................................................................................... 8
3.2 Solid Waste Permitting .................................................................................................... 8
3.3 Stormwater and Water Discharge Permitting ................................................................... 9
3.4 Floodplan Considerations ................................................................................................ 9
3.5 Zoning Approval .............................................................................................................. 9
3.6 Anticipated Emissions ..................................................................................................... 9
3.6.1 Emissions Impacts .............................................................................................................. 9
3.6.2 Particulate Matter ................................................................................................................ 9
3.6.3 Sulfur Dioxide and Hydrogen Chloride.............................................................................. 10
3.6.4 Nitrogen Oxides ................................................................................................................ 10
3.6.5 Carbon Monoxide and Volatile Organic Compounds ........................................................ 10
3.6.6 Dioxins and Furans ........................................................................................................... 11
3.6.7 Heavy Metals .................................................................................................................... 11
3.6.8 Odor .................................................................................................................................. 11
3.6.9 Greenhouse Gases ........................................................................................................... 11
3.6.10 Syngas Clean-up and Combustion ................................................................................... 12
3.7 Air Pollution Control Technology .................................................................................... 12
3.7.1 Fabric Filter ....................................................................................................................... 12
3.7.2 Dry Scrubbing System ...................................................................................................... 12
3.7.3 Selective Non-Catalytic Reduction (SNCR) ...................................................................... 13
3.7.4 Activated Carbon Injection ................................................................................................ 13
3.7.5 Syngas Combustion .......................................................................................................... 13
Chapter 4 Energy Markets ...................................................................................................... 14
4.1 Facility Sizing Considerations ........................................................................................ 14
4.2 Electricity Production Efficiency of Thermal Technologies ............................................. 15
4.3 Steam Export ................................................................................................................. 16
4.3.1 Steam Available for Export ............................................................................................... 16

Table of Contents
Alternative Disposal Feasibility 2012 ii
4.3.2 Steam Export Considerations ........................................................................................... 16
4.4 Summary of Findings ..................................................................................................... 17
Chapter 5 Technology Overview ............................................................................................ 18
5.1 Anaerobic Digestion ...................................................................................................... 18
5.2 Mechanical Biological Treatment (MBT) ........................................................................ 19
5.3 RDF Processing ............................................................................................................ 20
5.3.1 RDF with Stoker Firing ...................................................................................................... 20
5.3.2 RDF with Fluidized Bed Combustion ................................................................................ 21
5.4 Mass-burn Combustion ................................................................................................. 21
5.5 Catalytic Depolymerization ............................................................................................ 22
5.6 Hydrolysis ...................................................................................................................... 23
5.7 Pyrolysis ........................................................................................................................ 23
5.8 Gasification ................................................................................................................... 24
5.9 Plasma Arc Gasification ................................................................................................ 25
5.10 Plastics to Oil ................................................................................................................. 25
5.11 Combined Technologies ................................................................................................ 27
5.12 Technologies Evaluated ................................................................................................ 27
Chapter 6 Economic Evaluation ............................................................................................. 28
6.1 Methodology and Assumptions ...................................................................................... 28
6.2 Capital and Operation Cost Estimates ........................................................................... 32
6.2.1 Capital Cost Estimates ...................................................................................................... 32
6.2.2 Operating Cost Estimates ................................................................................................. 32
6.2.3 Capital Funding Approach ................................................................................................ 33
6.2.3.1 Capital Funding ................................................................................................................. 33
6.2.3.2 Debt Structuring ................................................................................................................ 33
6.2.4 Mass Burn Economic Analysis .......................................................................................... 33
6.2.4.1 Capital Costs ..................................................................................................................... 33
6.2.4.2 Debt Service ...................................................................................................................... 34
6.2.4.3 Operating Costs ................................................................................................................ 35
6.2.4.4 Revenue Streams ............................................................................................................. 35
6.2.4.5 Cost Summary .................................................................................................................. 36
6.2.5 RDF Economic Analysis ................................................................................................... 37
6.2.5.1 Capital Costs ..................................................................................................................... 37
6.2.5.2 Debt Service ...................................................................................................................... 38
6.2.5.3 Operating Costs ................................................................................................................ 39
6.2.5.4 Revenue Streams ............................................................................................................. 39
6.2.5.5 Cost Summary .................................................................................................................. 40
6.2.6 Gasification Economic Analysis ........................................................................................ 41
6.2.6.1 Capital Costs ..................................................................................................................... 41
6.2.6.2 Debt Service ...................................................................................................................... 42
6.2.6.3 Operating Costs ................................................................................................................ 43
6.2.6.4 Revenue Streams ............................................................................................................. 43
6.2.6.5 Cost Summary .................................................................................................................. 44

Table of Contents
Alternative Disposal Feasibility 2012 iii
6.2.7 Potential Heat Sales.......................................................................................................... 45
6.2.8 Waste to Energy Financial Results Summary .................................................................. 46
6.2.9 Plastics to Oil Economic Analysis ..................................................................................... 47
6.2.9.1 Capital Costs ..................................................................................................................... 47
6.2.9.2 Debt Service ...................................................................................................................... 48
6.2.9.3 Operating Costs ................................................................................................................ 49
6.2.9.4 Revenue Streams ............................................................................................................. 49
6.2.9.5 Cost Summary .................................................................................................................. 50
6.2.9.6 Low Grade Plastics Collection .......................................................................................... 50
Chapter 7 Implementation Keys ............................................................................................. 52
7.1 General Siting ................................................................................................................ 52
7.2 Implementation Issues ................................................................................................... 52
Chapter 8 Summary of Evaluation ......................................................................................... 53
8.1 Other Considerations ..................................................................................................... 53
8.2 Recommendations......................................................................................................... 53
Chapter 9 References ............................................................................................................. 55
Appendix A Technology Flow Charts .................................................................................... 56
Appendix B Capital Cost Estimates ....................................................................................... 65
Appendix C O&M Cost Estimates .......................................................................................... 66
Tables Table 1. MWA MSW Estimated Composition ......................................................................................... ES-3
Table 2. Plastics in MSW Disposal Stream ............................................................................................. ES-5
Table 3. Air Pollution Control Technologies ............................................................................................ ES-7
Table 4. Capital Cost Summary ............................................................................................................ ES-12
Table 5. Annual Operating Cost Summary ........................................................................................... ES-13
Table 6. Debt Service Summary ........................................................................................................... ES-13
Table 7. WTE Annual Cost Summary ................................................................................................... ES-14
Table 8. Plastics to Oil Annual Cost Summary ..................................................................................... ES-14
Table 9. MWA Tonnage and Tipping Fees ................................................................................................... 4
Table 10. Anticipated Air Pollution Controls................................................................................................ 12
Table 11. Electrical Production Efficiency ................................................................................................... 15
Table 12. Potential Steam Available ........................................................................................................... 16
Table 13. Summary of Potential Energy Recovery ..................................................................................... 17
Table 14. Key Assumptions ....................................................................................................................... 30
Table 15. Capital Costs: Mass Burn Option ................................................................................................ 34
Table 16. Mass Burn Debt Service Estimate .............................................................................................. 34
Table 17. Mass Burn Operating Costs ........................................................................................................ 35
Table 18. Mass Burn Potential Revenue .................................................................................................... 36
Table 19. Mass Burn Option Cost Summary .............................................................................................. 37
Table 20. Capital Costs: RDF Option .......................................................................................................... 38

Table of Contents
Alternative Disposal Feasibility 2012 iv
Table 21. RDF Debt Service Estimate ........................................................................................................ 38
Table 22. RDF Operating Costs .................................................................................................................. 39
Table 23. RDF Potential Revenue .............................................................................................................. 40
Table 24. RDF Cost Summary .................................................................................................................... 41
Table 25. Capital Costs: Gasification Option .............................................................................................. 42
Table 26. Gasification Debt Service Estimate ............................................................................................. 42
Table 27. Gasification Operating Costs ...................................................................................................... 43
Table 28. Gasification Potential Revenue ................................................................................................... 44
Table 29. Gasification Cost Summary ........................................................................................................ 45
Table 30. Potential Heat Revenue .............................................................................................................. 46
Table 31. Waste to Energy Cost Comparison............................................................................................. 46
Table 32. Plastics to Oil Capital Cost Estimate........................................................................................... 48
Table 33. Plastics to Oil Debt Service Estimate.......................................................................................... 48
Table 34. Plastics to Oil Operating Costs ................................................................................................... 49
Table 35. Plastics to Oil Potential Revenue ................................................................................................ 50
Table 36. Plastics to Oil Cost Summary ..................................................................................................... 50
Figures Figure 1. MWA Historic Tonnage and Tipping Fees ............................................................................... ES-3
Figure 2. MWA MSW Waste Stream Composition ....................................................................................... 5
Figure 3. Anaerobic Digestion Facility, Spain ............................................................................................. 19
Figure 4. RDF Processing Facility, Virginia ............................................................................................... 20
Figure 5. Spreader Stoker Unit ................................................................................................................... 20
Figure 6. Fluidized Bed RDF Combustion, Wisconsin ................................................................................ 21
Figure 7. Mass Burn Facility, Florida ......................................................................................................... 21
Figure 8. Gasification Facility, Tokyo .......................................................................................................... 24
Figure 9. Plasma Arc Gasification, Ottawa ................................................................................................. 25
Figure 10. Gasification and Catalytic Synthesis, Alberta ............................................................................ 27
Figure 11. Financial Life Cycle for Waste to Energy Facility ...................................................................... 28

Acronyms, Abbreviations, and Short Forms
Alternative Disposal Feasibility 2012 v
Acronyms, Abbreviations, and Short Forms
AD – Anaerobic Digestion
APC – Air Pollution Control
BACT – Best Available Control Technology
Baghouse – Another name for a Fabric Filter
Btu – British thermal unit
CO – Carbon monoxide
EPA – Environmental Protection Agency
GHG – Greenhouse Gas
HCl – Hydrochloric acid
HDPE - High Density Polyethylene
HRSG – Heat recovery steam generator
IAC - Iowa Administrative Code
IDNR – Iowa Department of Natural ResourcsResources
IPDES - Iowa Pollution Discharge Elimination System
kW – kilo Watt
MBT – Mechanical Biological Treatment
MW – Mega Watt
NOx – Nitrogen oxides
NSPS - New Source Performance Standard
PET - Polyethylene Terephthalate
PM – Total Particulate Matter
PM10 – Particulate Matter less than 10 Microns
PM2.5 – Particulate Matter less than 2.5 Microns
PSD - Prevention of Significant Deterioration
RDF – Refuse derive fuel
SCR – Selective Catalytic Reduction
SNCR – Selective Non-Catalytic Reduction
SO2 - Sulfur dioxide
SSO – Source separated organics
Tpd - Tons per day
VOC – Volatile organic compounds
WTE – Waste to Energy

Introduction Chapter 1
Alternative Disposal Feasibility 2013 1
Chapter 1 Introduction
The Metro Waste Authority (MWA) is interested in evaluation of potential alternative disposal options for some or all the non-recycled municipal solid waste handled at its facilities. These alternatives include means of converting the waste to energy through a combustion, gasification, or fuel production process. Much interest in alternative technologies has developed however most technologies lack commercial development at this time. MWA is receiving unsolicited proposals and concepts for facilities and technologies intended to manage waste in ways other than landfilling to recover energy, fuels, or products from the waste. MWA is interested in understanding the current state of the art in the waste-to-energy (WTE) and waste conversion fields and staying abreast of potential commercially viable alternatives. This summary report presents information applicable to alternative disposal technologies but focuses on those technologies that are most developed and commercialized at this time. The technologies reviewed in greater detail include:
� Mass burn combustion � Processed fuel or refuse derived fuel (RDF) combustion � Gasification � Plastics to oil.
The first three of these alternatives are sometimes grouped as thermal diversion alternatives (or waste to energy (WTE)) and are discussed as a group because potential projects have some common features. The plastic to oil alternative is generally addressed separately due to the characteristics of this technology.
The information and projections presented in this report were prepared to establish a conceptual basis and economic analysis for the technologies indicated above.
This report is divided into eight chapters. This first chapter provides a brief introduction outlining the report and its purpose.
Chapter 2 provides background information on the service area. The waste management practices, solid waste disposal and composition and waste quantity and projections are provided for the planning area. Project parameters are presented for the WTE projects and a special focus is provided for waste plastics (non-recycled) for a conceptual plastic to oil project.
Chapter 3 presents environmental considerations. An overview of regulatory issues that would need to be considered for any project is addressed.
Chapter 4 addresses the energy markets in central Iowa. Potential alternatives are reviewed and consideration given for options in addition to electrical production.
Chapter 5 presents a brief overview of the general categories of alternative waste management that are commercial or in development. Since the intent of this report is to focus on viable solutions a more detailed summary is only provided for the thermal technologies of mass burn, processed fuel or RDF, and gasification technologies. In addition, information is provided for the fuel generation technology plastics to oil.
Chapter 6 presents an economic evaluation for the focus technologies. The information provide is non-vendor specific and provides capital and operating and maintenance (O&M) costs developed for generic site and facility.
Chapter 7 provides some keys to implementation. The information provided is presented as fundamental activities required to advance a project are provide a general guideline for any project to advance.
Lastly, Chapter 8 provides a summary and recommendations of the analysis.

Service Area Data Chapter 2
Alternative Disposal Feasibility 2013 2
Chapter 2
Service Area Data
This chapter provides a summary background to be used as a foundation for the development of the subsequent chapters. The intent of this chapter is to summarize data provided elsewhere and thus does not dwell on this background data. If a project were to advance, the information provided should be reviewed and refined to be specific to the needs of that project.
2.1 Planning Area
MWA is an independent government agency comprised of 17 member communities, one county, and six planning members. Established in 1969, MWA was designated to manage the landfill for the Polk County area after state law required all Iowa communities to properly dispose of their solid waste in a sanitary landfill. The largest community in the area is the City of Des Moines. MWA operates many facilities and programs recognized for excellence at the state and national levels. These facilities include the Metro Park East Landfill, the Metro Park West Landfill, the Metro Compost Center, the Metro Transfer Station, the Metro Hazardous Waste Drop-Off, and the Metro Recycling Centers. MWA’s curbside recycling program is the most comprehensive in the State of Iowa, servicing nearly 120,000 households.
MWA also operates various waste reduction and recycling programs including the Curb It!® Recycling Program, the Residential Scrap Tire Program, the Sharps Program, and a Special Waste Assistance Program for commercial/industrial businesses.
2.2 Current Waste Management Practices
Solid waste management generally encompasses the collection, transfer, recycling, reuse, and disposal of waste. The overall quantity of solid waste ultimately disposed at a given facility is a function of numerous variables including regulations, cost, convenience, contracts, business practices, and other factors. The overall relationship can be complicated and is often dynamic. Solid waste management practices start at the source of generation. Generation sources typically include residential, institutional, governmental, business, and industrial and construction sites. Generators make the decisions on whether a material minimization or if waste material is to be reused, recycled, collected, and/or sent to disposal. Following the waste generator’s decision to discard a material, solid waste collection companies (haulers or municipal service firms) typically become involved in the collection and transportation of solid waste to organized management and disposal sites.
Within the MWA Planning Area and service area, residential solid waste collection is principally provided by private hauling companies. Commercial collection throughout the MWA Planning Area is provided through open subscription service involving contracts between individual businesses and private hauling companies.
MWA uses hauler contracts to manage its control over the flow of solid waste within its planning area MWA offers a decreased landfill tipping fee if the haulers operating in the MWA Planning Area sign a contract agreeing to bring all solid waste (commercial, construction and demolition, and residential waste) from within the MWA Planning Area to one of MWA’s facilities or, with special permission, to other MWA approved facilities. This contractual arrangement has been directed primarily at capturing solid waste collected for landfill disposal by private haulers.
Hauling contracts generally do not include solid waste handled by small vehicles, construction and demolition (C&D) debris haulers, and small private (independent) hauling companies.
Two transfer stations exist within the MWA Planning Area; one transfer station is owned and operated by MWA, and the other is privately owned and operated. MWA owns and operates the Metro Transfer Station (MTS) at 4198 Delaware Avenue in Des Moines. The MTS is open to pre-approved customers only and is not open to the general public. The MTS consolidates and transports the majority of all residential solid waste collected within MWA’s service area. The MTS primarily handles residential waste and a limited amount of commercial waste. The second permitted transfer station in the MWA Planning Area is operated by Waste Management of Iowa, Inc. Because it is within MWA’s planning area, this private facility is required to haul all waste to the MWA facilities.

Service Area Data Chapter 2
Alternative Disposal Feasibility 2013 3
In 1996, MWA opened the Metro Recycling Center (MRC) to serve the residents and businesses of MWA's Planning Area communities as its single designated staffed "mega" drop-off site. This facility, located at 1817 Euclid Avenue in Des Moines, provides a supervised recycling drop-off center. The MRC accepts everything that MWA’s Curb It! program accepts as well as cardboard, scrap metal, scrap wood, old clothing, and for a fee, scrap tires and electronics. In addition to the MRC, MWA offers six other drop-off locations.
MWA owns and operates a Regional Collection Center (RCC) to collect and properly dispose of or recycle household hazardous waste (HHW), waste oil, lead acid batteries, universal wastes, and electronic wastes. Businesses that qualify as conditionally exempt small quantity generators (CESQGs) are also eligible to use the RCC, which is located along State Highway 65 at 225 Prairie Drive SW, south of the City of Bondurant. This facility also contains a swap shop that provides useable items via the RRC, at no cost to residents.
MWA owns and operates a yard waste composting operation located at 1601 Harriett Street in Des Moines. MWA assumed this operation from the City of Des Moines in March 2001. MWA also encourages grass reuse through either backyard composting or leaving the grass clipping on the yard.
MWA provides recycling programs for specific targeted material streams, which include:
� Tires � White goods (appliances) � Scrap metal recovery � Toxic reduction programs
Diversion of C&D waste material has principally been provided by private companies. Two private companies have permits to process and recycle C&D waste in the MWA Planning Area.
Disposal of solid waste in central Iowa is largely managed with landfills. The City of Ames Resource Recovery Plant uses solid waste to create a refuse-derived fuel product that is co-combusted with coal and burned for energy. This is the only WTE or conversion technology facility in the region.
2.3 Solid Waste Disposal and Composition
To allow for analysis of alternatives to landfill disposal an understanding of the approximate quantity and composition of the municipal solid waste is needed. This analysis is based upon historical records of disposal rates and studies completed within the state on the composition of the waste stream.
Waste accepted by MWA for landfill disposal is identified by one of four different categories of solid waste based on the generation sources:
� Residential Waste – Single-family residences and small apartment complexes of up to 4 to 6 units (depending on the individual community collection patterns)
� Commercial Waste – Commercial businesses, institutions and governmental agencies, large apartment complexes, and non-hazardous solid waste from industrial sources
� C&D Waste – Non-hazardous materials resulting from the construction, remodeling, repair, or demolition of buildings, bridges, pavements, or other structures.
� Special Waste – Commercial/industrial waste, petroleum contaminated soils, and other waste that requires special handling, as described below:
o Commercial/industrial waste – non-hazardous industrial process waste and treated infectious waste, including processed sludge, ash, filters, sandblast media, and dusty wastes (with no excess liquid and containerized if it can become airborne)
o Petroleum contaminated soils – non-hazardous and contaminated with fuel (treated by aeration and then used as a daily cover at the MPE site)
o Other waste that requires special handling – spill cleanup materials, off-spec products, animal carcasses, drums and pressurized containers, fluorescent lights, and asbestos
Of these waste types the residential and commercial quantities were considered for diversion and the composition was derived primarily from the residential and commercial material sampled in the recent 2011 Iowa Statewide Waste Characterization Study prepared for the Iowa Department of Natural Resource and dated September 14, 2011 (Characterization Study).

Service Area Data Chapter 2
Alternative Disposal Feasibility 2013 4
2.4 Waste Quantity and Projections
MWA tonnage levels and tipping fees have remained relatively constant in recent years Table 9 provides summary data. This data includes all types of waste disposed.
Table 9. MWA Tonnage and Tipping Fees
Year Tipping Fee Contracted Fee Tons
90-91 $16.50 $16.50 371,663
91-92 $17.75 $17.75 376,437 92-93 $20.00 $20.00 386,836 93-94 $20.00 $20.00 413,158 94-95 $25.00 $25.00 393,650 95-96 $29.00 $29.00 363,485 96-97 $30.00 $30.00 341,852 97-98 $30.00 $30.00 342,980 98-99 $30.00 $25.00 424,532 99-00 $30.00 $25.00 424,582 00-01 $30.00 $25.00 425,826 01-02 $31.00 $26.00 471,732 02-03 $31.00 $26.00 518,392 03-04 $31.00 $26.00 513,567 04-05 $31.00 $26.00 479,094 05-06 $32.00 $27.00 490,598 06-07 $32.00 $27.00 495,203 07-08 $32.00 $27.00 552,349 08-09 $32.00 $27.00 560,468 09-10 $32.00 $27.00 519,810
10-11 $33.00 $28.00 529,582
Source: MWA 2012-2013 Strategic Business Plan
Recyclable waste is diverted from disposal through a number of programs and sites. Examples include the Curb It! Program, drop-off sites, composting, and scrap tire collection. The materials collected for recycling were not included in the analysis for alternative disposal.
The residential waste category is generally generated by single-family homes and small apartment complexes (up to 4 to 6 units, depending on the definitions provided for in individual member community ordinances). Commercial waste is generated by businesses and large apartment complexes.
The quantity of residential and commercial waste used for analysis purposes was obtained from the Characterization Study and is 400,161 tons per year. As noted above the waste quantities have been relatively flat in recent years. No known significant changes to the wasteshed are anticipated that would alter this trend. Therefore this value was used as the approximate available tonnage for sizing and comparison purposes for the thermal alternatives considered. There is potential for additional tonnage from certain other waste streams and also from outside the region, however these materials were not considered since this would raise a number of additional questions and significantly complicate the economic analysis.
Solid waste quantity disposal rates are based on total annual disposal quantities divided by 365 days per year. There are generally significant seasonal variations in the quantity of waste generated and disposed within the region. Variations occur daily, weekly, and seasonally. Generally, waste quantities are lowest in the winter months with peaks in the summer and early fall. The capacity for the potential diversion projects were discounted slightly to account for this variability. Other factors that can create dramatic short term fluctuations in waste quantities included natural disasters such as floods, or other severe weather.
It is important to have an understanding of the composition of the waste stream, particularly for diversion technologies that only address a portion of the waste stream such as plastics to oil technology.

Service Area Data Chapter 2
Alternative Disposal Feasibility 2013 5
The Characterization Study is the most recent and complete waste composition study for the region. Residential and commercial waste composition has been slowly changing over time. Data from this study was used in the development of this alternative disposal analysis. The summary information for MWA from the Characterization Study is presented as Figure 2. The MSW composition includes residential and commercial waste disposed at the MWA landfill.
Figure 2. MWA MSW Waste Stream Composition
Quantities of some of these materials may change seasonality or vary for other reasons. While estimates of waste composition may be useful in evaluating alternative waste management systems, it is very important to recognize that waste is a heterogeneous mix of the above components and that most of these materials do not arrive at a landfill in a form conducive to large volume recovery. For example, much of the glass is broken and is often contaminated with other materials such as food waste; much of the paper waste has been contaminated with food waste, liquid, or by other uses and is not marketable, even if it were recovered. For an alternative disposal technology such as plastics to oil, impacts of recoverability of the desired waste materials as well as the potential contamination must be carefully considered.
2.5 Conceptual Project Parameters
The remainder of this summary report addresses the various options for alternative disposal. Conceptual development of the alternatives was kept as consistent as possible for comparison purposes. None of the concepts are designed around a particular vendor and if a project is pursued the special features and performance of each vendor will result in changes to the facility design and economic performance.
For the thermal alternatives the same overall throughput capacity was maintained. This however will result in changes to the facility size and capacity. For instance, an RDF facility will need a slightly larger site, all else being equal because of the need for a front end processing building to prepare the fuel. For the gasification alternative, HDR has assumed a design based upon a technology that does not require front end processing. This was done because these technologies may be slightly more developed but they generally have a smaller size and three or four combustion units would likely be required. For the mass burn and RDF options two combustion units and one turbine generator were proposed as this arrangement would be more cost effective. The overall facility size was kept as large as possible for the available waste to take advantage of economies of scale.
Some gasification facilities have in the past had a lower capacity factor or availability. This means that slight more processing capacity needs to be provided to reliably process the same quantity of waste. An adjustment for the reduced capacity with some technologies has been factored into the facility sizing.
A feature of some similar facilities is to provide for excess or merchant capacity. This excess capacity can be used to process waste imported to the facility and generally allows for a larger facility that has greater economic

Service Area Data Chapter 2
Alternative Disposal Feasibility 2013 6
potential. In some cases this excess capacity is designed for future growth. For various reasons including that growth has be very slow in the region, excess capacity was not assumed.
A generic site is assumed for all the alternatives since this has not been established at this time. A specific site will result in adjustment of some of the development costs. Ready access to required utilities such as water and natural gas are assumed. It is assumed that an electrical interconnection can be achieved near the site. Access to one or more major highways is also assumed. The site arrangement assumes reasonably acceptable terrain and no major wetlands or other issues need to be addressed.
2.6 Low Grade Plastics Projections
A different approach was taken for sizing and developing the economic analysis for the plastics to oil alternative. Again the concept was not developed around any specific facility or technology. This technology like gasification is younger and commercial operations are limited.
The facility size was established based upon assumptions for the quantity of “low grade” plastics that could conceivably be extracted from the waste stream. Recycling programs capture much of the polyethylene terephthalate (PET) commonly known as No. 1 containers, and the high density polyethylene (HDPE) commonly known as No. 2 containers and well established markets for these materials are in place. It is assumed that the markets for the No. 1 and No. 2 containers is a stronger market (more economical) as recycled containers than processing the plastics in a plastics to oil facility. Therefore the assume feedstock for the plastics to oil technology is based upon film plastics and Nos. 3 through 7 plastics. Since this these plastics must be removed from the mixed municipal solid waste a capture efficiency was applied. In addition, it is expected that some of the plastics captured may be too contaminated or for other reasons may not be processible and a sizing factor was applied for this consideration.
A number of options were considered for how the low grade plastics might be segregated from the mixed waste. Some of these options are discussed below:
� Capture through recycling programs would result in significant issues at the MWA material recovery facility (MRF) and the operator would have significant issues with separating these materials from the other recyclables currently processed. The residue material from the MRF however may be a good source of low grade plastics but the quantity of material would not be economical by itself.
� A few transfer stations and waste-to-energy facilities have simplified or full scale recyclables processing lines located at the facility. Often the processing line is located on the tipping floor as a means of providing access to some of all of the waste material and to minimize double handling of reject material. MWA has a transfer station within its system. However it is understood that the transfer station tipping floor is well utilized and locating even a simple processing line of the floor would be practical. The site layout is also not conducive to adding a “dirty MRF” easily
� Capture of the low grade plastics at the landfill also raises numerous operational and safety concerns without a controlled collection location. It may be possible to target select routes thought to be coming from sources rich in film plastic, low grade plastics and other recyclable materials such as cardboard and paper. These loads could possibly be tipped at a special location or area and the materials sorted through using small mobile equipment and by hand. Such operations however have very limited capacity and while some film plastic may be easy to spot and grab, questions remain regarding the cleanliness and quantity that can be obtained. Capture of other low grade plastics such as yogurt containers (Non-Nos. 1 and 2 plastics) would likely be even less efficient. The materials captured and the residue would then need to be re-handled to take the recyclables to a consolidation location, the low grade plastics to the processing facility and residue to the landfill face. If the operation were completed outdoors, weather would be a major factor and processing within a building would still likely still be very inefficient.
� A dirty MRF could be developed within the region. A dirty MRF would need to have a tipping floor for receiving waste to be sorted, a loadout area for removal of the rejected material, room for the process line(s), and storage space for captured materials as well as support facilities. Some materials such as cardboard may be sorted on the receiving floor.
o For a simple sorting line picking stations may be arranged that allow sorters to positively sort specific products. The products may be varied depending on what is anticipated to be most valuable at the time. Magnets may be used for ferrous metal capture. Diversion rates for similar
Service Area Data Chapter 2
Alternative Disposal Feasibility 2013 7
facilities are generally less than 15 percent for all products and capture of low grade plastics would be limited.
o There are vendors that offer more sophisticated dirty MRFs. These systems will utilize more screens, optical sorters and other equipment as a means of increasing efficiency. They may need to produce “products” that have with limited value to allow capture of more desirable products. For example, one vendor indicated that a low grade compostable material must be removed first to allow capture of paper, metal and plastics and the final product produced from remaining material would be a fuel pellet. The compostable material could only be used as alternative daily cover. The fuel pellets would require an agreement with a coal fired facility or cement kiln operation that might be able to process the material and revenue would likely be limited. Higher capture rates would be possible for plastics however the plastics could even be sorted in to recyclable and low grade plastics. The remaining residue would be about fifty percent of the incoming material.
Nearly all information available for this technology is provided by individual vendors and the quality of the data is not as demonstrated as for the other technologies reviewed in detail. This technology is not as well established and thus a more conservative capacity factor was applied to the analysis. It also should be understood that proceeding with this technology would carry more risk than some other alternatives.
Some vendors claim the oil can be used for fleets of vehicles or other high value transportation uses. Other vendors indicate the oil is a crude oil requiring further processing at a refinery where it could be further distilled into useable products. This analysis assumed the oil would be sold as a crude material for further off-site processing.

Environmental Considerations Chapter 3
Alternative Disposal Feasibility 2013 8
Chapter 3 Environmental Considerations
The purpose of this Section is to identify environmental factors associated with a waste-to-energy (WTE) facility. The following environmental permitting programs and their implications to the project are discussed in this Section: air, solid waste, and stormwater and water discharge. Floodplain and zoning considerations are also discussed.
3.1 Air Permitting
Depending upon the type of air permit required, either the Iowa Department of Natural Resources (IDNR) Air Quality Division or the Polk County Public Works Air Quality Division (Polk County) has jurisdictional authority to regulate and permit the proposed WTE facility’s air emissions. The type of air permit required will depend on the type of waste, the quantity of waste, and the technology used to process the waste, and the facility’s potential air emissions. The IDNR’s air permitting rules are found in Section 567 of the Iowa Administrative Code (IAC), Chapters 20 through 34, while Polk County’s air permitting rules are found in the Polk County Board of Health Rules and Regulations, Chapter V – Air Pollution.
Based on the proposed facility size of 977 tpd as determined in Section 2 of this Study, the facility will likely trigger new source performance standard (NSPS) requirements under 40 CFR Part 60. The NSPS requirements include completion of siting analysis and materials separation plans, both of which have extensive and rigid guidelines for public comment and involvement.
In order for the proposed WTE facility to not trigger NSPS, each unit would need to have a design tonnage of less than 35 tpd. Based on the waste volume anticipated it is unlikely that a facility designed with that small of units would be feasible. Further, the United States Environmental Protection Agency (EPA) intends to promulgate additional NSPS rules in the near future which will regulate units smaller than 35 tpd.
The facility would be anticipated to trigger the prevention of significant deterioration (PSD) preconstruction permitting rules (IAC 567, Chapter 33) for either a mass burn or RDF facility, which would be issued by the IDNR. PSD permits include EPA in the review process. By triggering PSD permitting rules, air dispersion modeling will need to be completed for each pollutant subject to an ambient air quality standard that triggers PSD review. For each pollutant triggering PSD, a best available control technology (BACT) review would be required which could push emissions limits beyond those required by the NSPS. Also, an additional impacts analysis would be required to determine the project’s impact on soils, vegetation, and any nearby threatened and endangered species in the surrounding area, as well as potential impacts on any nearby Class I areas. Based on the location of Des Moines, no Class I areas are close enough to warrant analysis.
A PSD permit can take approximately 18 to 24 months to complete. Much of this time is related to the preparation and review of the air modeling and the determination of best available control technology (BACT), as well as the public notification and comment period. Although not typically required, pre-application monitoring of on-site meteorological and/or pollutant concentration monitoring may be required at the discretion of IDNR and/or EPA. If such monitoring is required, at least one full year of data collection would most likely be required. However, if the proposed facility is designed to be small enough to not trigger PSD (either through operating limits, design capacity, control equipment, or some combination thereof), the project would require a minor construction permit, which would be issued by Polk County and which typically involves a shorter and simpler permitting process.
3.2 Solid Waste Permitting
The Solid and Hazardous Waste Division of IDNR would permit the facility under the Section 567, Chapter 102 regulations which were promulgated through the authority of the Iowa Environmental Quality Act. This permitting process could take approximately 12 to 18 months to complete. It may be possible
Environmental Considerations Chapter 3
Alternative Disposal Feasibility 2013 9
to reduce the time frame if the new facility is located on an existing permitted solid waste facility property. The reduction in time would be due to the reduction in public notice periods which could potentially be reduced from two to one.
3.3 Stormwater and Water Discharge Permitting
It is likely that the facility will need an industrial stormwater discharge permit that will regulate stormwater discharge activities depending on the design and planned operation of the facility. IDNR will review the design and operation prior to issuing the permit to determine the specific requirements of the permit. The state will also require an Iowa Pollution Discharge Elimination System (IPDES) permit if any washing or other operational activities will be discharging to waters of the state or to the storm sewer. In addition, prior to construction, a stormwater permit for construction activities will be needed.
Discharge of process waste water to the sanitary sewer may require a pretreatment permit. Des Moines Metropolitan Wastewater Reclamation Authority will need to be contacted prior to facility construction and operation in order to determine the specific requirements of the sanitary sewer pretreatment permit.
3.4 Floodplan Considerations
Floodplains would need to be considered as potential sites are investigated. If the final site selected is within a floodplain, the U.S. Army Corps of Engineers would need to approve the filling of soil in the floodplain prior to any soil being placed in that area. In most cases, Corps approval for such an activity will require a floodplain survey to determine the existing floodplain elevation at the location, as well as a study to determine the flood elevation in the area after the soil is filled in this area. Corps approval for this type of activity would likely take over a year to complete and would require coordination and approval from the City and County authorities.
3.5 Zoning Approval
The facility will need to receive zoning approval to build depending on the final location selected. Applicable zoning approval documents will likely need to be submitted with air permitting and solid waste permitting applications indicating that zoning approval has been received.
3.6 Anticipated Emissions
3.6.1 Emissions Impacts
Emissions from energy recovery systems will vary somewhat based on variations in the processing requirements for each technology. However, there are significant similarities among the thermal technologies. Mass burn and RDF combustion will generally have very similar emissions characteristics and will employ essentially the same emissions control equipment. For the gasification alternative, we are assuming direct combustion of the syngas to produce steam for electrical generation, which will require similar emissions control devices. If development of this technology proceeds to the point where other uses of the syngas becomes feasible, such as internal combustion engines or gas turbines, emission controls could include clean-up of the syngas prior to use as well as post combustion controls such as selective catalytic reduction for control of nitrogen oxides.
The most significant emissions for the technology options under consideration are discussed in the following sections.
3.6.2 Particulate Matter
Particulate matter is a critical pollutant that varies greatly in its composition, size and chemical makeup. Size ranges for particulate can vary from 0.001 to 500 microns. In many jurisdictions particulate matter is regulated based on various size ranges. Fine particulate matter, also known as PM2.5, is particulate matter with an aerodynamic particle diameter of less than 2.5 microns. PM10, is particulate matter with an aerodynamic particle diameter of less than 10 microns. And total suspended particulate (TSP) is

Environmental Considerations Chapter 3
Alternative Disposal Feasibility 2013 10
generally taken to be particulate matter with an aerodynamic particle diameter of less than 30 microns, although there is no such official definition.
Particulate matter can be generated by grading and excavation activities at landfills, biomass harvesting, feedstock processing, cooling tower drift, truck traffic on unpaved roads, and fuel combustion. For dust particulate, unless the processing activity is conducted in an enclosed area, it is difficult to control the particulate emissions from all of these activities, other than by adding moisture.
For solid fuel combustion processes, particulate emissions are typically 30 to 40 lb per ton of waste material processed, prior to any emission controls. This particulate is comprised of suspended flyash and condensable (vapor phase at stack temperature and particulate precursors such as NOx and SO2) constituents. The types of feedstock and combustion process affect the amount of uncontrolled emissions generated. RDF firing tends to entrain more particulate matter per ton processed due to the feedstock particle size, the need for two-stage processing and semi-suspension firing. However, fabric filter collection equipment is capable of reducing the uncontrolled particulate emissions by more than 99 percent.
3.6.3 Sulfur Dioxide and Hydrogen Chloride
Sulfur dioxide (SO2) and hydrogen chloride (HCl) emissions are acid gas byproducts of the combustion process. The concentration of the emissions in the combustion exhaust gases is a direct function of the concentrations of the sulfur and chlorine present in MSW. SO2 and HCl can be controlled through the use of a spray dry absorber also referred to as a dry scrubber.
3.6.4 Nitrogen Oxides
Nitrogen Oxides (NOx) are compounds generated during all fuel/air combustion processes as nitrogen and nitrogen compounds in the fuel and nitrogen in the combustion air oxidize. Due to relatively low temperatures during EFW combustion, the majority of the NOx will come from the nitrogen content of the MSW. The formation of NOx is dependent on the temperature, pressure and residence time of the gases in the boiler.
NOx from combustion processes is typically controlled via combustion control and flue gas treatment. NOx formation during combustion is reduced by boiler design and controlling the combustion flame temperature, the temperature throughout the combustion process, the residence time of the air and gas flows, and the air flow into the boiler. NOx control technologies include; selective non-catalytic reduction (SNCR) consists of injecting ammonia or urea directly into the furnace and selective catalytic reduction (SCR) system where NOx is reduced by injecting the reagent in the presence of a catalyst to cause a chemical reaction and form nitrogen and water. In a SNCR system, the reagent is injected into the boiler and relies on the appropriate reagent injection rate, temperature, gas mixing, and retention time rather than a catalyst surface to achieve the desired NOx reduction.
3.6.5 Carbon Monoxide and Volatile Organic Compounds
Carbon Monoxide (CO) and Volatile Organic Compounds (VOC) are formed during the incomplete combustion of carbon and organic compounds in the fuel. The formation of these gases in an WTE facility can be caused by overly wet fuel, large load swings in the fuel input, poor air distribution, inadequate or too great of air flow or low combustion temperatures. Combustor technology can make a difference in the level of CO due to varying levels of oxygen and air distribution.
The formation of CO and VOCs can be minimized by controlling the combustion process through careful consideration of the excess air and its input points and the combustion temperature. Excess air control is achieved by proper placement of boiler overfire air ports, the use of high-pressure overfire air to promote mixing in the combustion process, and combustion air control measures to control the furnace temperatures to achieve complete combustion. CO can also be managed through operational procedures that achieve an even fuel flow and reasonably homogenous mixture of waste feedstock.

Environmental Considerations Chapter 3
Alternative Disposal Feasibility 2013 11
3.6.6 Dioxins and Furans
Dioxins and furans are a family of toxic chemicals created by combustion of chlorine containing fuels and certain industrial chemical processes. Dioxins occur in low concentrations throughout the environment but are accumulated over time in body tissues and can result in an increased risk of cancer at certain levels.
Most dioxins are introduced into the air by the combustion of fuels such as biomass, MSW, and coal. One primary method of reducing dioxin levels is controlling the combustion process. Similar to CO and VOCs, dioxins can form during incomplete combustion, but are effectively destroyed at high temperatures. Dioxins may reform as the flue gas cools through certain temperatures. The method of limiting dioxin reformation is by reducing the flue gas temperature as quickly as possible, which is typically accomplished with the equipment used for flue gas desulfurization. In addition, activated carbon injected into the flue gas will control dioxin emissions. Wet or dry scrubbers and carbon injection operated in combination with baghouses for particulate control can control more than 99 percent of flue gas dioxins and furans.
3.6.7 Heavy Metals
Heavy metals emissions, primarily lead and cadmium, are due to the presence of these elements in the fuel source. A portion of the metals will be volatilized into the combustion exhaust stream and/or carried with particulate matter. Trace metal particles can be collected by air pollution control devices that collect particulate matter. Mercury however, can remain in the vapor phase at higher temperatures.
Mercury control can be accomplished with activated carbon injection systems which introduce powdered activated carbon into the flue gas stream. Retention time of the carbon in a baghouse system increases the adsorption of mercury. Mercury control is often enhanced through operational measures by keeping products that contain mercury out of the feedstock. The major products containing mercury are compact florescent light bulbs, mercury thermostats and switches, and dental amalgam. Many of these materials are already considered special wastes and are prohibited from being disposed with regular waste. Operator diligence and refusal to accept waste products containing mercury can enhance technical removal methods.
3.6.8 Odor
Waste and biosolids can create odors that can be a nuisance to people in the surrounding area. Decaying organic materials can release noxious gases such as hydrogen sulfide that can be carried by winds in to populated areas.
Odor is typically controlled by limiting waste storage times, aeration, negative pressure in buildings where waste is handled, and odor suppression systems to reduce the release of gases to the atmosphere. In general, raw waste feedstock, if of an odorous nature will always be stored and processed indoors. Combustion air can be drawn from waste storage and handling areas where practical to limit odors.
3.6.9 Greenhouse Gases
Since greenhouse gases (GHGs) are not currently a regulated pollutant, these emissions can be classified as more of a social concern rather than an environmental factor. Any time a new facility is implemented, it will have some impact on GHG emissions. These impacts can be categorized in three areas:
• Project or facility direct impacts (such as combustion of MSW for WTE options) • Material or product related impacts • Avoided or reduced emission impacts
WTE facilities also achieve GHG emission reductions primarily through four processes:

Environmental Considerations Chapter 3
Alternative Disposal Feasibility 2013 12
• Avoidance of landfill methane emissions from the continued landfilling of solid waste, including methane that would not have been captured by landfill collection systems in the absence of the WTE facility;
• Avoidance of CO2 emissions from fossil fuel fired power plants on the local grid resulting from the WTE facility generating renewable electrical power or steam;
• Avoidance of extraction and manufacturing GHG emissions due to enhanced ferrous and non-ferrous (aluminum) metal recovery and recycling at WTE facilities; and
• Avoidance of fuel use associated with landfill disposal operations and transportation GHGs from long hauling of MSW to landfills.
3.6.10 Syngas Clean-up and Combustion
There is little information available regarding practical applications of syngas clean-up and combustion. In general, the syngas would require clean-up to remove deleterious materials or compounds from the gas, prior to its introduction into downstream equipment. Such clean-up would be expected to remove moisture, carbon dioxide, tars, particulate matter, neutralize acid gases and mercury. Gasification vendors expect that dioxin formation is lower than other thermal technologies. Post combustion controls would be required for NOx.
3.7 Air Pollution Control Technology
Air emission limits for the various pollutant concerns associated with these types of facilities can be met through the application of various air pollution control (APC) technologies. Anticipated APC equipment for this facility is shown in Table 10
Table 10. Anticipated Air Pollution Controls
3.7.1 Fabric Filter
A fabric filter (or baghouse) will be utilized to collect particulate matter (PM) as well as for metals control when used in combination with dry scrubbing and carbon injection systems. The baghouse uses a series of cylindrical filter bags located in the flue gas stream. Filter bags collect the PM as flue gas passes through the system, creating a cake as the PM builds up on the filter bags. This cake creates an increase in pressure drop across the baghouse as it is built up on the filters. The cake has to be removed and collected once the pressure drop becomes excessive.
Air will be used to clean the bags once the preset pressure drop limit is reached. Baghouses typically can use either a reverse-air or a pulse jet type cleaning process. The reverse air baghouse blows air in the opposite direction, which cause the bags to collapse and the cake to drop off. The pulse jet baghouse injects compressed air into the inside of the bag causing the bag to expand and contract removing the cake.
3.7.2 Dry Scrubbing System
Acid gas removal systems can consist of either wet or dry scrubbing of the flue gas. Scrubbers use a chemical reaction between the acid gas in the flue gas and an alkaline agent to neutralize acid gasses.
Air Emission ConcernAnticipated Control
Technology
Particulate Matter Fabric FilterNOx SNCR or SCRCO Good CombustionSO2 Dry ScrubberHCL Dry ScrubberDioxins and Furans Carbon InjectionMercury Carbon InjectionNOx (Syngas Combustion ) SCR

Environmental Considerations Chapter 3
Alternative Disposal Feasibility 2013 13
Wet scrubbers use limestone as a reagent while dry scrubbers inject lime slurry prepared from slaked pebble lime. Wet scrubbers follow the particulate control device while dry scrubbers precede the baghouse. A wet scrubber circulates the limestone slurry through a tower. In a dry scrubber, called such because all of the injected water evaporates, the lime slurry is injected into the flue gas stream as a fine mist using atomizing nozzles or rotating disks. In either case, the acid gases react with the alkaline agent to form salts. In the wet scrubber, the residue can be used as gypsum. In a dry scrubber, the salts are collected together with the PM.
A wet scrubbing system is not anticipated to be used primarily due to additional cost and complexity associated with this type of system (when compared to a dry scrubbing system) as well as additional waste water disposal requirements. Wet scrubbing systems are primarily used when high sulfur fuels are used, such as, for combustion of some types of coals in order to provide additional SO2 removal. In a WTE facility, where the fuel has a relatively small sulfur content, dry scrubbing systems provide more than adequate SO2 removal to meet or exceed any anticipated air emission standard.
3.7.3 Selective Non-Catalytic Reduction (SNCR)
As described above, two types of systems are used to control NOx, Selective Non-Catalytic Reduction (SNCR) consists of injecting ammonia or urea directly into the furnace and a Selective Catalytic Reduction (SCR) system where NOx is reduced by injecting the reagent in the presence of a catalyst to cause a chemical reaction and form nitrogen and water.
In a SNCR system, the reagent is injected into the boiler and relies on the appropriate reagent injection rate, temperature, gas mixing, and retention time rather than a catalyst surface to achieve the desired NOx reduction.
When utilizing MSW as fuel source SNCR systems have typically been used due to the corrosive nature of the fuel and particulate characteristics leading to increased catalyst fouling, degradation, and replacement. Recent permit applications have been including an SCR system as the NOx control technology. SCR is used if additional NOx reduction is required, however precautions in the design would have to be incorporated in order to minimize the catalyst degradation. Because of these design precautions installation costs with the SCR system would be far greater compared to a SNCR system. Furthermore, SCR systems require much more energy to operate than SNCR systems. SCR would reduce the overall plant economics due to higher capital costs and less revenue from the sale of electricity.
3.7.4 Activated Carbon Injection
An activated carbon injection system is used to control mercury emissions by injected activated carbon into the flue gas stream. Mercury and dioxins would be adsorbed onto the carbon particle, and would then be collected in the baghouse.
3.7.5 Syngas Combustion
Post combustion controls would be required for NOx which would be expected to include SCR system. SNCR would not be available for use with combustion turbines or internal combustion engines. The SCR for an internal combustion engine would work on a similar principal to the catalytic converter in an automobile.

Energy Markets Chapter 4
Alternative Disposal Feasibility 2013 14
Chapter 4 Energy Markets
The recovery of energy is one of the most important factors in determining financial and environmental viability of a proposed system. Depending on the technology, energy could conceivably be recovered in the form of heat, steam, electricity, and/or synthetic gas. For example, conventional mass burn will provide good opportunities for the production of electricity, process steam and district heat, while gasification with gas cleaning may offer the generation of low Btu natural gas-like fuels.
Based on review and assessment of the technologies and their suitability to the MWA waste stream, mass burn combustion, refuse derived fuel (RDF) combustion, and gasification with power generation are recommended for further study as presented more fully in the following chapters. Plastics to Oil will be addressed separately. The potential for recovering energy from these three technologies as well as the value of that energy will be examined in this Section. Different quantities of varying forms of energy will be available from each of these technologies. The types and quantities of energy available will be tabulated together with the quantities of energy that can be recovered.
The value of the recovered energy is different in the various forms. In addition, the efficiency of the energy recovery is greater if steam and electricity are both sold (cogeneration). Markets for the various forms of energy recovered will have some bearing on which forms of energy will generate the highest revenues.
Typically, energy recovery is in the form of steam and subsequently electricity. This is similar to a coal or gas fired power plant. Potential rates for electricity sold are low in the Midwest and project economics may be significantly improved if a reliable steam customer(s) could be identified. In Europe and Japan lower grade heat in the form of steam or hot water is commonly used for district heating or industrial loads. This allows the use of energy that would otherwise be lost when steam used to generate electricity is condensed. Steam used for heating pr process greatly improves overall efficiency. In order to take advantage of this improved efficiency, a nearby steam market that provides a reasonably consistent load is required. This is discussed further in Section 6.2.7.
While markets for recovered energy are well defined if the energy is in the form of electricity, it is more difficult to locate a convenient, reliable and consistent steam customer. Markets for heat and steam are more complex and dependent on the availability of local users, who must be willing to sign long-term contracts for the purchase of this energy and be likely to remain in business for the term of the agreement. Steam users will be dependent on the sites being considered, however, it is not likely a reliable steam customer will be available. This study will look at a steam pipeline in concept as well as other considerations MWA and the end user would need to evaluate.
In order to make comparisons of the value of various alternatives the value of recovered energy must be determined. In the case of electricity, an assumed average market price of wholesale power will be used in the analysis. A value must also be established for steam or other energy products to be sold. In these conceptual cases, the value will be established by determining the value of natural gas as well as any associated capital and operating costs that would be required to provide backup energy. These economic considerations will be addressed below.
4.1 Facility Sizing Considerations
Section 2 includes discussion on the available waste streams. Based on the waste area reviewed, the waste-to-energy (WTE) facility will need to be able to manage a projected waste stream of 977 tpd. Both mass burn and RDF are suitable technologies for this size of waste stream. This size may be suitable for gasification technology depending on the vendor.
In sizing a facility to match an annual waste quantity several items are considered. If seasonal variations are significant, the facility should be sized to process the peak quantities. The facility capacity should also be large enough to allow for facility downtime. Typically, a capacity factor of 85 to 90% is assumed for a facility of this size. The capacity factor is defined as the actual materials processed as a percentage of the capacity of the facility. At an 85% capacity factor, a 977 tpd facility would process 303,122 tons annually and will be the size considered for the mass burn and RDF facilities. Gasification facilities are assumed to have a slightly lower capacity factor at

Energy Markets Chapter 4
Alternative Disposal Feasibility 2013 15
80%, resulting in a larger daily throughput requirement of 1,038 tpd to meet the annual disposal requirement of 303,122 tons.
For RDF and some gasification technologies, which require up front processing, the processing capacity is determined in a different manner. While an energy recovery facility operates continually, the processing system is typically designed to operate about half of the hours per week, to correspond with deliveries and to allow daily downtime for cleaning and maintenance. Storage of RDF is provided to allow the power generation to operate continually. The operating schedule is typically based on two 8-hour processing shifts Monday through Friday and a single shift on Saturday. Processing systems are typically rated in tons per hour (tph). To process 977 tpd would equate to 6,839 tons per week or 78 tph in an 88 hour week. Based on these sizing calculations the facility will manage 303,122 tpy, have a required processing throughput of 78 tph, and a nominal facility size of 977 tpd.
4.2 Electricity Production Efficiency of Thermal Technologies
In mass burn combustion, all of the waste is combusted in the boiler or steam generating unit. This limits losses and makes all of the energy in the waste available for recovery. Steam is produced and used in a steam turbine generator to produce electricity. Based on the state of the industry we would expect the efficiency of a field erected waterwall unit to range between 18% and 21%. For comparison purposes, the efficiency of a modern coal-fired facility would be in the neighborhood of 34%. The reason for the lower efficiency of a waste-fired unit is the nature of the fuel. Due to the corrosive nature of constituents in the fuel, a waste-fired unit must limit the steam pressure and temperature reducing efficiency. Similarly, corrosion concerns limit how much heat can be recovered by limiting the temperature to which the flue gasses can be cooled. In addition, waste requires greater quantities of air for combustion and has more ash and residue which also limits efficiency.
In RDF processing and combustion, some of the materials are typically removed from the waste stream prior to combustion. While the removed materials are relatively low in energy content there is some loss of energy. The trend for RDF processing systems is to remove only recyclable metals and send nearly all other materials to the combustion system. Processing equipment required to produce the RDF causes the parasitic power demand to be higher than a typical mass burn facility. In some cases, the boiler can operate more efficiently than a mass burn unit by using less air in the combustion process. The end result is an expected efficiency in the range of 16% to 20% for the common large scale facilities which is slightly lower than a similarly sized mass burn unit.
For gasification it is assumed that a two–stage combustion technology with a waste heat boiler or heat recovery steam generator (HRSG) will be used. This approach is more viable than other gasification technologies, however the energy recovery potential is lower that would be expected for a mass burn or RDF processing facility. Gasification efficiency will range typically from about 15% to 19%,
A summary of electrical generation estimates for the technologies is presented below. The electrical production is based on the calorific value of 5,200 Btu/lb, which is a typical MSW energy content. The actual calorific value of the MSW feedstock will vary depending on the actual waste being processed in the facility.
Table 11. Electrical Production Efficiency
Technology Throughput
(Tons/yr)
Facility Capacity
(Tons/day)
Calorific Value
(Btu/lbs)
Efficiency Range
Net Electrical Production
(MW)
RDF processing and combustion
303,122 977 5,200 16% to 19.7%
20.4 to 24.4
Gasification 303,122 977 5,200 14.8% to 18.9%
18.3 to 23.4
Mass Burn Combustion
303,122 977 5,200 18.0% to 20.5%
22.4 to 25.4

Energy Markets Chapter 4
Alternative Disposal Feasibility 2013 16
4.3 Steam Export
4.3.1 Steam Available for Export
In the production of electricity considered above, steam is produced and used in a turbine generator to produce electricity. The steam that is exhausted from the turbine is condensed and reused in the cycle as boiler feedwater. Thermodynamically, this is referred to as a Rankine cycle. Most of the inefficiency of the Rankine cycle is due to the heat rejected in the condensation process through the use of either an air-cooled condenser or a water-cooled condenser together with a cooling tower. Finding a use for the heat from the steam that would otherwise be lost during the condensation process greatly improves the thermal efficiency of the cycle.
The following table provides an estimate of the maximum quantity of steam that would be expected to be available from the three thermal technologies under consideration.
Table 12. Potential Steam Available
Technology Potential Steam
(lb/hr)
RDF processing and combustion
210,000 to
269,000
Gasification 200,000 to
252,000
Mass Burn Combustion 210.000 to
269,000
If a steam customer were identified, the steam turbine cycle would be designed to match the particulars of the customer. Where a reliable consistent customer is identified, the steam flow can be almost entirely dedicated to the customer. For example, the mass burn facility in Indianapolis, Indiana has only a small turbine generator sized for in-house electrical usage and supplies the rest of the steam to a continuously available industrial user. More commonly, the steam demand will be less than the steam production or will be less constant. Mass burn units in Europe typically provide steam to district heating systems. In this case the steam flows part way through the turbine and is extracted for export. The turbine is required to be sized to handle the entire steam flow when the district heating system has no load. Depending on the relative size of the steam flow and the consistency of demand, a number of cycle considerations are possible. In some cases, all or a portion of the steam flow can pass through a turbine that exhausts at the pressure required by the customer. Such a turbine is referred to as a “topping” turbine.
One important consideration for a steam customer is the long term viability. If the customer goes out of business, the economics of the facility operations changes dramatically. In addition, if the steam cycle cannot accept all of the steam generated, such an event would require considerable redesign.
4.3.2 Steam Export Considerations
The potential for sale of steam will be very site dependent. The decision regarding the feasibility of steam sales can not be determined definitively until a site is selected and discussions with a specific customer are initiated. However, some qualitative discussion can be made as to the likely radius steam customers could be economically located. The farther away from the facility a potential steam customer is located the less likely it will be economically viable to provide steam.
Because steam sales greatly improve the efficiency of a facility, the construction cost of a steam line is offset by the revenues associated with the sale of steam. The payback period of such a steam line depends on its cost, the

Energy Markets Chapter 4
Alternative Disposal Feasibility 2013 17
quantity of steam sold and the value of the steam sold. Actual parameters from any potential customers should be used to verify economics on a case by case basis. Based on the economics of steam supply and quantity of steam available it would be expected that steam customers would need to be located not more than two miles from the facility. If a continuous steady steam demand were available, somewhat longer distances could be economical.
4.4 Summary of Findings
Mass burn, gasification, and RDF have the potential to produce electricity through the use of a steam turbine-generator or in some cases of gasification possibly engines or even a combustion turbine. The expected electrical production efficiency and electrical production are included below. A portion of the steam produced could be sold to a customer in lieu of electrical production. The potential steam available for export is also indicated. Note that exporting steam will result in a reduced electrical output. In other words, if all of the potential steam is sold, the net electrical production will drop to near zero. However, the efficiency of the energy utilization from the export steam is generally much greater resulting in an overall improvement in economics and in some cases limiting the cost of electrical generation equipment. Sale of steam greatly enhances the efficiency of a facility and would improve the overall economics. Sites near a steam customer with a high consistent steam use profile would be preferred over other sites.
Table 13. Summary of Potential Energy Recovery
Technology
Electrical
Production
Efficiency Range
Net Electrical
Production
(MW)
Potential
Steam (lb/hr)
Calorific
Value
(Btu/lb)
RDF processing
and combustion 16.4% to 19.7% 20.4 to 24.4 293,000 to
343,000 5,200
Gasification 14.8% to 18.9% 18.3 to 23.4 292,000 to
342,000 5,200
Mass Burn
Combustion 18.1% to 20.5% 22.4 to 25.4 293,000 to
343,000 5,200
.

Technology Overview Chapter 5
Alternative Disposal Feasibility 2013 18
Chapter 5 Technology
Overview
The review of combustion technologies covers not only thermal technologies, but also assesses chemical and biological processes. This report evaluates proven, new, and emerging technologies in terms of their potential to process all or a portion of the MWA waste stream. The important considerations for MWA as it decides whether to adopt new technologies will be the stage of development and the demonstrated reliability of the processes associated with each technology, the costs, and the potential risks and benefits.
This overview defines the general MSW technologies to be investigated for this study. Technologies included in the review are those that have been implemented successfully, technologies that have been tried but failed to successfully and/or economically handle an MSW stream on a commercial scale, and those that are currently considered theoretical. While example vendors are listed that propose particular technologies, the listed vendors are neither represented as all vendors that offer the technology nor necessarily the better vendors that offer the technology. The specifics of individual vendors’ technology would be considered for a more in-depth review should a specific technology be selected for implementation.
The following technologies are evaluated in this study:
� Anaerobic digestion � Mechanical biological treatment (MBT) � Refuse-derived fuel (RDF) with stoker firing � RDF with fluidized bed combustion � Mass-burn combustion � Catalytic depolymerization � Hydrolysis � Pyrolysis � Gasification � Plasma arc gasification � Plastics to Oil
5.1 Anaerobic Digestion
Anaerobic digestion (AD) is the process of decomposing the organic portion of MSW in a controlled oxygen-deficient environment. It is widely used to digest sewage sludge and animal manures. Bacteria produce a biogas that consists mainly of methane, water vapor, and CO2 through a process called methanogenesis. This is the same process that generates methane naturally in landfills and wetlands. Usually the process is applied to food and green waste, agricultural waste, sludge, or other similarly limited segments of the waste stream. The availability of suitable feedstock can be a limiting factor in development of this technology. The gas produced can be used as a fuel for boilers, directly in an internal combustion engine or, possibly in sufficient quantities, in a gas turbine to produce electricity. The remaining residue or sludge (“digestate”), which can be more than 50% of the input, may have potential use as a soil amendment if suitable markets can be identified. A typical process flow diagram is provided in Figure A.1 in Appendix A.
Odor is a characteristic of AD. Site location and odor control would be a major factor in the implementation of this technology.

Technology Overview Chapter 5
Alternative Disposal Feasibility 2013 19
Figure 3. Anaerobic Digestion Facility, Spain
Ideally, the feedstock is source separated organic materials. However, anaerobic digestion has recently been used for MSW disposal. Typically, waste processing or sorting is required to provide an effective feedstock. Removal of metals for recycling together with a combination of shredding, screening, and/or air separation could be used to concentrate and separate organic materials from inorganic materials. Alternatively, a wet separation process as described below has been used by at least one vendor.
AD is widely used on a commercial-scale basis for industrial and agricultural wastes, as well as wastewater sludge. AD technology has been applied on a limited scale in Europe on mixed MSW and on a larger scale on source separated organics (SSO) or agricultural-based processes, but there is very limited commercial-scale application in any form in North America. Two of the only commercial-scale plants in North America that are designed specifically for processing SSO are in the Greater Toronto Area; the Dufferin Organic Processing Facility in Toronto and the CCI Energy Facility in Newmarket. There are a number of smaller demonstration facilities in the U.S. operating on either mixed MSW, SSO, or in some cases co-digested with biosolids.
Vendors include Urbaser (Valorga International), Mustang Renewable Power Ventures, Ecocorp, Organic Waste Systems, and Greenfinch.
5.2 Mechanical Biological Treatment (MBT)
Mechanical biological treatment (MBT) is a variation on composting and materials recovery. This technology is generally designed to process a fully commingled MSW stream. Processed materials include marketable metals, glass, other recyclables, and a refuse-derived fuel (RDF) that can be used for combustion. Limited composting is used to break the MSW down and dry the fuel. The order of mechanical separating, shredding, and composting can vary.
This technology has been used on a limited scale in Europe, but not in the U. S. commercially. It is a waste-management method that can be built in various sizes. The RDF produced by an MBT process must be handled in some way: fired directly in a boiler; converted to energy via some thermal process (e.g., combustion, gasification, etc.); selling it to a third party (e.g. Cement Kiln); or landfilling. Owing to its similarity to RDF processing and its use of composting rather than an energy recovery technology, this option will not be included for further analysis.
This technology has been used in Europe, including Herhof GmbH facilities in Germany and Greece. There has not been widespread commercial application of this technology on mixed MSW streams in Europe or North America. The majority of the applications for this technology are in the agricultural and meat processing industries. The Bedminster Bioconversion in-vessel, mechanical, rotating drum technology (also referred to as “rotary digesters”) used at the Edmonton Composting Facility is an example of a commercially available MBT technology that has experience processing residential waste.

Technology Overview Chapter 5
Alternative Disposal Feasibility 2013 20
5.3 RDF Processing
An RDF processing system prepares MSW by using shredding, screening, air classifying and other equipment to produce a fuel product for either on-site combustion, off site combustion, or use in another conversion technology that requires a prepared feedstock. As with mechanical biological treatment (MBT), the goal of this technology is to derive a better fuel (limited variations in size and composition) that can be used in a more conventional solid-fuel boiler as compared to a mass-burn boiler. The theory is
that the smaller boiler and associated equipment would offset the cost of the processing equipment. The fuel goes by various names but generally is categorized as a refuse-derived fuel (RDF).
All of the post-recycling municipal waste stream can be processed by this technology with limited presorting for bulky material or other materials that may damage the processing equipment or disrupt operations.
This same technology, perhaps with some differences such as finer shredding, is required to prepare MSW as a feedstock for other conversion technologies (discussed in later sections).
RDF technology is a proven technology that is used at a number of plants in the U.S., Europe and Asia (generally larger plants with capacities greater than 1,500 tons per day). There are
also a number of commercial-ready technologies that convert the waste stream into a stabilized RDF pellet that can be fired in an existing coal-boiler or cement kiln. The Dongara facility located in York Region in Canada is an example of such a RDF technology. Some other RDF plants are Ames, IA; Southeastern Public Service Authority, VA; French Island, WI; Mid-Connecticut; Honolulu, HI; and West Palm Beach, FL. There is limited use of this technology in Europe or Asia.
A process flow diagram is provided in Figure A.2 in Appendix A.
Vendors/System Designers: Energy Answers; RRT; Dongara; Westroc Energy; Ambient Eco Group; and, Cobb Creations
5.3.1 RDF with Stoker Firing
This technology uses a spreader stoker type boiler to combust RDF. A front-end processing system is required to produce a consistently sized feedstock. The RDF is typically blown or mechanically injected into a boiler for semi-suspension firing. Combustion is completed on a traveling grate. Thermal recovery occurs in an integral waterwall boiler. Air-pollution control (APC) equipment on existing units includes good combustion practices, dry scrubbers for acid gas neutralization, carbon injection for control of mercury and complex organics (e.g., dioxins), and fabric filters for particulate removal. These facilities are capable of meeting stringent air emission requirements. New units would likely require additional NOx control such as selective non-catalytic reduction (SNCR), selective catalytic reduction (SCR) or flue gas recirculation.
This technology is used at the following facilities mentioned above: Southeastern Public Service Authority, VA; Mid-Connecticut;
Figure 4. RDF Processing Facility, Virginia
Figure 5. Spreader Stoker Unit

Technology Overview Chapter 5
Alternative Disposal Feasibility 2013 21
Honolulu, HI; and West Palm Beach, FL.
Boiler Vendors: Alstom; Babcock and Wilcox; Babcock Power
5.3.2 RDF with Fluidized Bed Combustion
This technology uses a bubbling or circulating fluidized bed of sand to combust RDF. A front-end processing system is required to produce a consistently sized feedstock. Heat is recovered in the form of
steam from waterwalls of the fluidized bed unit as well as in downstream boiler convection sections. The required APC equipment is generally similar to that described above for spreader stoker units. Lime can be added directly to the fluidized bed to help control acid gases such as sulfur dioxide (SO2). RDF may be co-fired with coal, wood (as in the case of the French Island facility shown), or other materials.
This technology is in limited commercial use in North America for waste applications with one operating facility in Wisconsin. Fluidized bed combustion is more commonly used today for combustion of certain other biomass materials and coal than it was at the time most of the existing RDF facilities were developed. This
technology would be suitable for combustion of RDF alone or together with biomass and other combustible materials that are either suitably sized (nominally 8 cm) or can be processed to a suitable size.
Fluidized Bed Boiler Vendors: Environmental Products of Idaho (EPI), Von Roll Inova, Foster Wheeler, and Ebara.
5.4 Mass-burn Combustion
Mass Burn combustion technology can be divided into two main types: (a) grate based, waterwall boiler installations; and (b) modular, shop erected combustion units with shop fabricated waste heat recovery boilers. The modular units are typically limited to less than 200 ton per day and are historically used in facilities where the total throughput is under 500 tpd. The larger Mass Burn Combustion process with waterwall boilers feed MSW directly into a boiler system with no preprocessing other than the removal of large bulky items such as furniture and white goods. The MSW is typically pushed onto a grate by a ram connected to hydraulic cylinders. Air is admitted under the grates, into the bed of material, and additional air is supplied above the grates. The resulting flue gases pass through the boiler and the sensible heat energy is recovered in the boiler tubes to generate steam. This creates three streams of material: Steam, Flue Gases and Ash. The steam can be sold directly to an end-user such as a manufacturing facility or district heating loop, or sent to a turbine generator and converted into electrical power, or a combination of these uses. In the smaller modular mass burn systems, MSW is fed into a refractory lined combustor where the waste is combusted on
Figure 6. Fluidized Bed RDF Combustion, Wisconsin
Figure 7. Mass Burn Facility, Florida

Technology Overview Chapter 5
Alternative Disposal Feasibility 2013 22
refractory lined hearths, or within a refractory lined oscillating combustor (e.g. Laurent Bouillet in Maine). Typically there is no heat recovery in the refractory combustors, but rather, the flue gases exit the combustors and enter a heat recovery steam generator, or waste heat boiler, where steam is generated by the sensible heat in the flue gas, resulting in the same three streams: steam, flue gas, and ash.
The bottom ash from mass burn combustion may also be used as a construction base material, which is a common end-use for this by-product in Europe. The fly ash from the boiler and flue gas treatment equipment is collected separately and can either be treated or disposed of directly as a hazardous material in Canada. Typically in the U.S., fly ash and bottom ash are disposed togther in landfills or monofills. Some demonstration reuse projects have been completed, but general commercial use ouside of a landfill has not been accepted due to potential regulatory risks. Therefore no revenues or reduced costs were considered for ash disposal in cost analysis presented in later chapters.
Mass burn technologies utilize an extensive set of air pollution control (APC) devices for flue gas clean-up. The typical APC equipment used include: either selective catalytic reduction (SCR) or non-catalytic reduction (SNCR) for NOx emissions reduction; spray dryer absorbers (SDA) or scrubbers for acid gas reduction; activated carbon injection (CI) for mercury and dioxins reduction; and a fabric filter baghouse (FF) for particulate and heavy metals removal.
Large-scale and modular mass-burn combustion technology is used in commercial operations at more than 80 facilities in the U.S., two in Canada, and more than 500 in Europe, as well as a large number in Asia.
Examples of larger-scale grate system technology vendors (some offer more than one design) include: Martin GmbH, Hitachi Zosen Inova (von Roll), Keppel Seghers, Steinmuller, Fisia Babcock, Volund, Takuma, and Detroit Stoker. Some examples of smaller-scale and modular mass burn combustion vendors include: Enercon, Laurent Bouillet, Consutech, and Pioneer Plus. A process flow diagram is provided in Figure A.3 in Appendix A.
5.5 Catalytic Depolymerization
In a catalytic depolymerization process, the plastics, synthetic-fibre components and water in the MSW feedstock react with a catalyst under non-atmospheric pressure and temperatures to produce a crude oil. This crude oil can then be distilled to produce a synthetic gasoline or fuel-grade diesel. There are four major steps in a catalytic depolymerization process: Pre-processing, Process Fluid Upgrading, Catalytic Reaction, and Separation and Distillation. The Pre-processing step is very similar to the RDF process where the MSW feedstock is separated into process residue, metals and RDF. This process typically requires additional processing to produce a much smaller particle size with less contamination. The next step in the process is preparing this RDF. The RDF is mixed with water and a carrier oil (hydraulic oil) to create RDF sludge. This RDF sludge is sent through a catalytic turbine where the reaction under high temperature and pressure produces a light oil. The light oil is then distilled to separate the synthetic gasoline or diesel oil.
This catalytic depolymerization process is somewhat similar to that used at an oil refinery to convert crude oil into usable products. This technology is most effective with processing a waste stream with a high plastics content and may not be suitable for a mixed MSW stream. The need for a high-plastics-content feedstock also limits the size of the facility.
There are no large-scale commercial catalytic depolymerization facilities operating in North America that use a purely mixed MSW stream as a feedstock. There are some facilities in Europe that utilize this or a similar process to convert waste plastics, waste oils, and other select feedstocks. One vendor claims to have a commercial-scale facility in Spain that has been in operation since the second half of 2009. However, operating data or an update on the status of this facility could not be obtained.
There are also technology vendors that utilize a process that is thermal in nature (e.g., gasification, pyrolysis) to convert the MSW stream to a syngas that is further treated by a chemical process, such as depolymerization or an associated refining process (e.g., Fischer Tropsch synthesis), to generate a synthetic gasoline or diesel fuel. Plastics to Oil technologies are a subcategory that is closely related to catalytic depolymerization. The City of Edmonton project in Alberta, Canada that uses the Enerkem
Technology Overview Chapter 5
Alternative Disposal Feasibility 2013 23
technology is an example of a commercial-scale facility that will use such a process. The City of Edmonton has conducted some pilot testing, and the commercial-scale project is currently in construction (scheduled to be operational by 2013).
A process flow diagram is provided in Figure A.4 in Appendix A.
Some examples of vendors that provide catalytic depolymerization-type technologies include: ConFuel K2, AlphaKat/KDV, Enerkem, Changing World Technologies, and Green Power Inc.
5.6 Hydrolysis
There is much interest and development in the area of cellulosic ethanol technology to move from corn based ethanol production to the use of more abundant cellulosic materials. Applying these technologies to waste materials using hydrolysis is part of that development.
The hydrolysis process involves the reaction of the water and cellulose fractions in the MSW feedstock (e.g., paper, food waste, yard waste, etc.) with a strong acid (e.g., sulfuric acid) to produce sugars. In the next process step, these sugars are fermented to produce an organic alcohol. This alcohol is then distilled to produce a fuel-grade ethanol solution. Hydrolysis is a multi-step process that includes four major steps: Pre-treatment; Hydrolysis; Fermentation; and Distillation. Separation of the MSW stream is necessary to remove the inorganic/inert materials (glass, plastic, metal, etc.) from the organic materials (food waste, yard waste, paper, etc.). The organic material is shredded to reduce the size and to make the feedstock more homogenous. The shredded organic material is placed into a reactor where it is introduced to the acid catalyst. The cellulose in the organic material is converted into simple sugars. These sugars can then be fermented and converted into an alcohol which is distilled into fuel-grade ethanol. The byproducts from this process are carbon dioxide (from the fermentation step), gypsum (from the hydrolysis step) and lignin (non-cellulose material from the hydrolysis step). Since the acid acts only as a catalyst, it can be extracted and recycled back into the process.
There have been some demonstration and pilot-scale hydrolysis applications completed using mixed MSW and other select waste streams. However, there has been no widespread commercial application of this technology in North America or abroad. A commercial-scale hydrolysis facility has been permitted for construction in Monroe, New York, but this project is currently on-hold.
Some examples of vendors that offer some form of the hydrolysis technology include: Masada OxyNol; Biofine; and, Arkenol Fuels. A process flow diagram is provided in Figure A.5 in Appendix A.
5.7 Pyrolysis
Pyrolysis is generally defined as the process of heating MSW in an oxygen-deficient environment to produce a combustible gaseous or liquid product and a carbon-rich solid residue. This is similar to what is done to produce coke from coal or charcoal from wood. The feedstock can be the entire municipal waste stream, but, in some cases, pre-sorting or processing is used to obtain a refuse-derived fuel. (See 5.3 RDF Processing.) Some modular combustors use a two-stage combustion process in which the first chamber operates in a low-oxygen environment and the combustion is completed in the second chamber. Similar to gasification, once contaminants have been removed, the gas or liquid derived from the process can generally be used in an internal combustion engine or theoretically a gas turbine or as a feedstock for chemical production. Generally, pyrolysis occurs at a lower temperature than gasification, although the basic processes are similar.
Pyrolysis systems have had some success with wood waste feedstocks. Several attempts to commercialize large-scale MSW processing systems in the U.S. in the 1980’s failed, but there are several pilot projects at various stages of development. There have been some commercial-scale pyrolysis facilities in operation in Europe (e.g. Germany) on select waste streams. Vendors claim that the activated carbon byproduct from the pyrolysis is marketable, but this has not been demonstrated.
Some examples of vendors that offer the pyrolysis technology include: Brightstar Environmental, Mitsui, Compact Power, PKA, Thide Environmental, WasteGen UK, International Environmental Solutions (IES), SMUDA Technologies (plastics only), and Utah Valley Energy. A process flow diagram is provided in Figure A.6 in Appendix A.
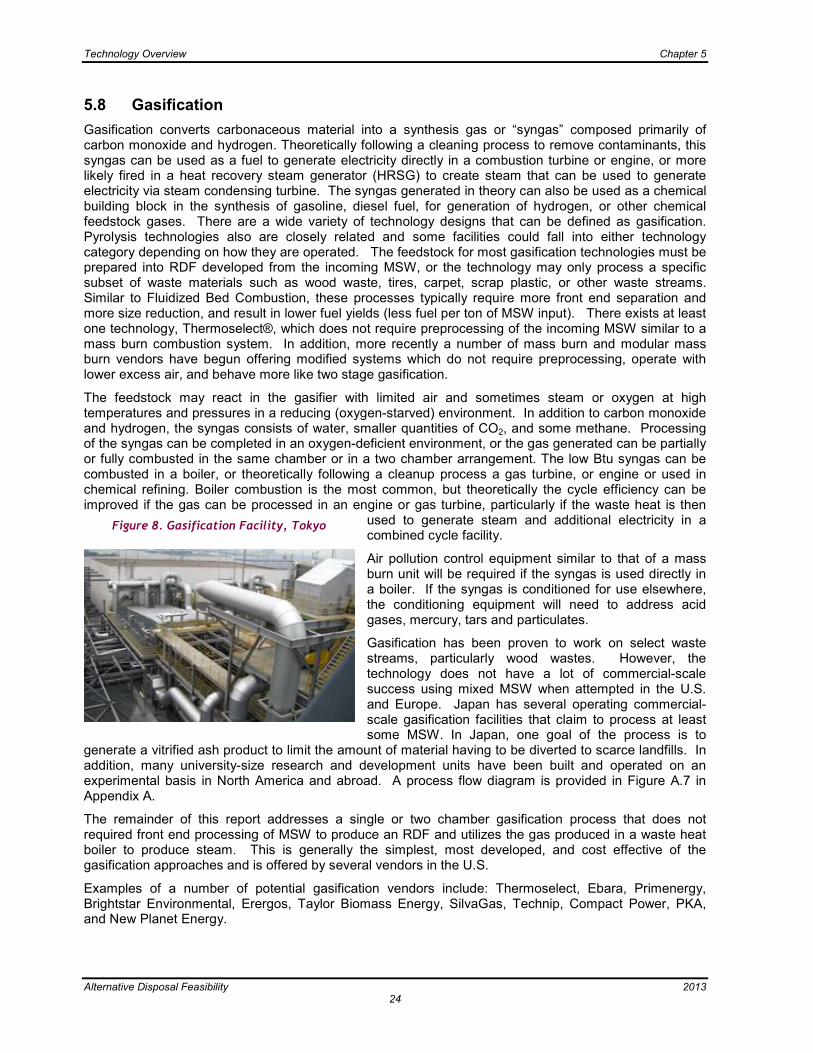
Technology Overview Chapter 5
Alternative Disposal Feasibility 2013 24
5.8 Gasification
Gasification converts carbonaceous material into a synthesis gas or “syngas” composed primarily of carbon monoxide and hydrogen. Theoretically following a cleaning process to remove contaminants, this syngas can be used as a fuel to generate electricity directly in a combustion turbine or engine, or more likely fired in a heat recovery steam generator (HRSG) to create steam that can be used to generate electricity via steam condensing turbine. The syngas generated in theory can also be used as a chemical building block in the synthesis of gasoline, diesel fuel, for generation of hydrogen, or other chemical feedstock gases. There are a wide variety of technology designs that can be defined as gasification. Pyrolysis technologies also are closely related and some facilities could fall into either technology category depending on how they are operated. The feedstock for most gasification technologies must be prepared into RDF developed from the incoming MSW, or the technology may only process a specific subset of waste materials such as wood waste, tires, carpet, scrap plastic, or other waste streams. Similar to Fluidized Bed Combustion, these processes typically require more front end separation and more size reduction, and result in lower fuel yields (less fuel per ton of MSW input). There exists at least one technology, Thermoselect®, which does not require preprocessing of the incoming MSW similar to a mass burn combustion system. In addition, more recently a number of mass burn and modular mass burn vendors have begun offering modified systems which do not require preprocessing, operate with lower excess air, and behave more like two stage gasification.
The feedstock may react in the gasifier with limited air and sometimes steam or oxygen at high temperatures and pressures in a reducing (oxygen-starved) environment. In addition to carbon monoxide and hydrogen, the syngas consists of water, smaller quantities of CO2, and some methane. Processing of the syngas can be completed in an oxygen-deficient environment, or the gas generated can be partially or fully combusted in the same chamber or in a two chamber arrangement. The low Btu syngas can be combusted in a boiler, or theoretically following a cleanup process a gas turbine, or engine or used in chemical refining. Boiler combustion is the most common, but theoretically the cycle efficiency can be improved if the gas can be processed in an engine or gas turbine, particularly if the waste heat is then
used to generate steam and additional electricity in a combined cycle facility.
Air pollution control equipment similar to that of a mass burn unit will be required if the syngas is used directly in a boiler. If the syngas is conditioned for use elsewhere, the conditioning equipment will need to address acid gases, mercury, tars and particulates.
Gasification has been proven to work on select waste streams, particularly wood wastes. However, the technology does not have a lot of commercial-scale success using mixed MSW when attempted in the U.S. and Europe. Japan has several operating commercial-scale gasification facilities that claim to process at least some MSW. In Japan, one goal of the process is to
generate a vitrified ash product to limit the amount of material having to be diverted to scarce landfills. In addition, many university-size research and development units have been built and operated on an experimental basis in North America and abroad. A process flow diagram is provided in Figure A.7 in Appendix A.
The remainder of this report addresses a single or two chamber gasification process that does not required front end processing of MSW to produce an RDF and utilizes the gas produced in a waste heat boiler to produce steam. This is generally the simplest, most developed, and cost effective of the gasification approaches and is offered by several vendors in the U.S.
Examples of a number of potential gasification vendors include: Thermoselect, Ebara, Primenergy, Brightstar Environmental, Erergos, Taylor Biomass Energy, SilvaGas, Technip, Compact Power, PKA, and New Planet Energy.
Figure 8. Gasification Facility, Tokyo

Technology Overview Chapter 5
Alternative Disposal Feasibility 2013 25
5.9 Plasma Arc Gasification
Plasma arc technology uses carbon electrodes to produce a very-high-temperature arc ranging between 5,000 to 13,000 degrees Fahrenheit that “vaporizes” the feedstock. The high-energy electric arc that is struck between the two carbon electrodes creates a high temperature ionized gas (or “plasma”). The intense heat of the plasma breaks the MSW and the other organic materials fed to the reaction chamber into basic elemental compounds. The inorganic fractions (glass, metals, etc.) of the MSW stream are melted to form a liquid slag material which when cooled and hardened encapsulates toxic metals. The ash material forms an inert glass-like slag material that may be marketable as a construction aggregate. Metals can be recovered from both feedstock pre-processing and from the post-processing slag material.
Similar to gasification and pyrolysis processes, the MSW feedstock is pre-processed to remove bulky waste and other undesirable materials, as well as for size reduction. Plasma technology also produces a low Btu syngas; this fuel can be combusted and the heat recovered in a heat recovery steam generator (HRSG), or the syngas can be cleaned and combusted directly in an internal combustion engine or theoretically a gas turbine. Electricity and/or thermal energy (i.e. steam, hot water) can be produced by this technology. Vendors of this technology claim efficiencies that are comparable to conventional mass burn technologies (550-650+ kWh/ton (net)). Some vendors are claiming even higher efficiencies (800-1,100 kWh/ton (net)). These higher efficiencies may be feasible if a combined cycle power system is proposed. However, the electricity required to generate the plasma arc, as well as the other auxiliary systems required, brings into question whether more electrical power or other energy products can be produced than what is consumed in the process. Plasma arc gasification syngas may also be used as a chemical feedstock.
This technology claims to achieve lower harmful emissions than more conventional technologies, such as mass burn and RDF processes. However, APC equipment similar to other technologies would still be required for the clean-up of the syngas or other off-gases.
Plasma technology has received considerable attention recently, and there are several large-scale projects being planned in North America (e.g. Koochaching County, Minnesota; and Atlantic County, New Jersey). In addition, there are a number of commercial-scale demonstration facilities in North America, including the Plasco Energy Facility in Ottawa, Ontario and the Alter NRG demonstration facility in Madison, Pennsylvania in the U.S. PyroGenesis Canada, Inc., based out of Montreal, Quebec, also has a demonstration unit (approximately 10 tpd) located on Hulburt Air Force Base in Florida that has been in various stages of start-up since 2010.
There are a number of Plasma Arc technology vendors, including Startech, Geoplasma, PyroGenesis Canada, Inc., Westinghouse, Alter NRG, Plasco Energy, Integrated Environmental Technologies and Coronal.
5.10 Plastics to Oil
Plastics to oil systems convert recovered plastics into oil which can be further refined by a third party into a gasoline, diesel fuel or other industrial fuel or converted to a fuel directly within the system. Typically Numbers 2, 4, 5, and 7 plastics are considered the best feedstock for plastic to oil production, however, depending on the vendor all types of plastic resins can be utilized in their process.
Process technologies vary from vendor to vendor with each having unique features and performance claims, but most share the same basic processes including;
� Some level of pre-processing will be required, which could involve sorting, cleaning, and / or shredding. This is particularly important for post consumer materials.
Figure 9. Plasma Arc Gasification, Ottawa

Technology Overview Chapter 5
Alternative Disposal Feasibility 2013 26
� Conversion of plastics to gas through heating typically through a pyrolytic process of direct or indirect heating with no or minimal oxygen. Some vendors will also incorporate a catalyst into the system similar to catalytic depolymerization and some other approaches have been proposed and some processes operate under a negative pressure.
� Residuals (e.g. metals, char) are pulled from the system. � Collection and condensing of gases into liquids. � Lightweight gases such as methane, butane, propane, hydrogen are removed and treated.
These gases may require cleaning to remove moisture and other contaminants. HCL may be produced if PVC is included in the feedstock. This may be removed through environmental controls such as a scrubber while the trace organics emitted may be controlled by thermal oxidation.
� The crude oil leaving the condensing system is sent to a coalescing system removing additional moisture.
� The crude oil is then either sent to storage to await shipment to a refinery or can be refined within the system to a fuel.
Processes can be either batch or considered a continuous process. The Agilyx system is an example of a batch process which includes loading shredded plastics into ‘cartridges,’ and multiple cartridges can be processed at one time. In their base 50 tpd system, each cartridge can hold approximately 13,000 lbs of ground or chipped plastic. The plastics are then heated using hot air circulated around the cartridge where the plastic is converted from a solid to liquid to a gas. Hot air is produced by an industrial burner that is fueled with natural gas until the system is warm. Theoretically, once the system process has had time to warm, off gases from the process can be used to offset the natural gas usage. This is a common approach with most of the technologies.
After the heating process residuals and contaminants in the waste stream are removed including metals and/or char. Char can be a powdery residue or a substance like sludge with a heavy oil component. Either material according to the vendors can be landfilled however no characteristics are available for this material. Process residuals estimates are in the range of 10 to 20 percent of the output but may be higher for mixed post consumer plastic feedstock.
Some of the vendors will use a catalyst at this point, as in the case of the JBI process which claims the ability to produce several different fuel products (e.g. No. 2 and No. 6 fuel oil, and naphtha). For this process the plastics are melted to a liquid (not taken to a gas yet), filtered and sent to a main reactor where the liquefied plastics are then cracked using additional heat and a catalyst leaving as various gases. A petcoke residue remains after this stage, and is approximate 2 – 4 percent of the output. Petcoke is a high Btu solid which could be sellable in certain markets.
The gases are then processed through a condensing unit or a distillation process. The distillation process can theoretically yield various fuels that can be sold as a final product such as a synthetic gasoline, No. 2 fuel oil, No. 6 fuel oil, or another synthetic fuel. Other processes will produce a crude oil that can be sold to a refinery for further production. Process off gases must pass through air pollution control devices to control emissions.
The oil production claims per unit of feed stock vary depending on the vendor and the composition of the plastic feedstock, ranging between 8 – 11 lbs of plastic to produce 1 gallon of liquid product assuming relatively clean feedstock. This represents a conversion rate of about 70 – 85 percent. Off-gas production is reported to typically range from 8 – 12 percent of the output. Vendor claims range from 30 to 100 percent of the natural gas fuel required at the burner can be offset by the off gases once the system is warm. Natural gas is utilized to supply the remaining fuel required during warmed up operation and fully during startup. A process flow diagram is provided in Figure A.8 in Appendix A.
Most systems are modular or expandable in design; however, a minimum input is required for each system ranging from about 10 tpd to 50 tpd.
Several vendors have pilot scale or research and development (R&D) facilities in operation. There are a few commercial scale facilities in the United States in varying levels of construction, permitting, or operation including Plastic2Oil (JBI) in Niagara Falls, New York permitted for up to 4,000 lbs per machine per hour and Agilyx in Minnesota which is a confidential facility operating at 50 tpd and reportedly selling
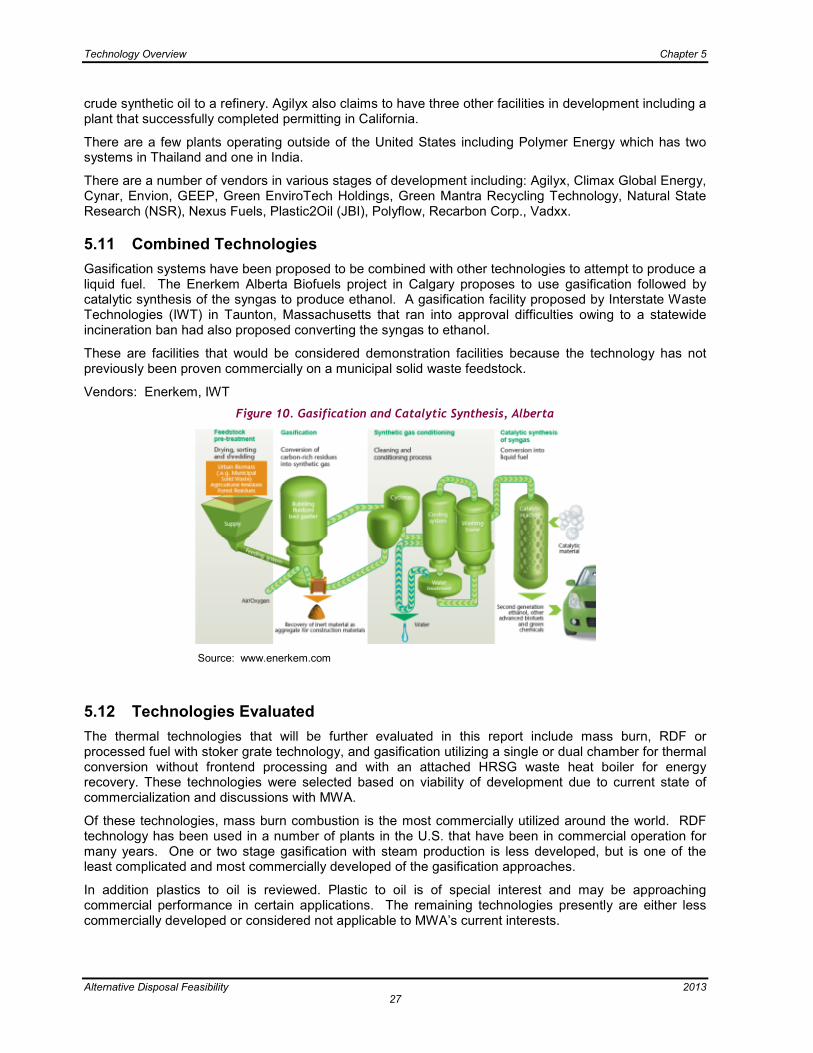
Technology Overview Chapter 5
Alternative Disposal Feasibility 2013 27
crude synthetic oil to a refinery. Agilyx also claims to have three other facilities in development including a plant that successfully completed permitting in California.
There are a few plants operating outside of the United States including Polymer Energy which has two systems in Thailand and one in India.
There are a number of vendors in various stages of development including: Agilyx, Climax Global Energy, Cynar, Envion, GEEP, Green EnviroTech Holdings, Green Mantra Recycling Technology, Natural State Research (NSR), Nexus Fuels, Plastic2Oil (JBI), Polyflow, Recarbon Corp., Vadxx.
5.11 Combined Technologies
Gasification systems have been proposed to be combined with other technologies to attempt to produce a liquid fuel. The Enerkem Alberta Biofuels project in Calgary proposes to use gasification followed by catalytic synthesis of the syngas to produce ethanol. A gasification facility proposed by Interstate Waste Technologies (IWT) in Taunton, Massachusetts that ran into approval difficulties owing to a statewide incineration ban had also proposed converting the syngas to ethanol.
These are facilities that would be considered demonstration facilities because the technology has not previously been proven commercially on a municipal solid waste feedstock.
Vendors: Enerkem, IWT
Figure 10. Gasification and Catalytic Synthesis, Alberta
Source: www.enerkem.com
5.12 Technologies Evaluated
The thermal technologies that will be further evaluated in this report include mass burn, RDF or processed fuel with stoker grate technology, and gasification utilizing a single or dual chamber for thermal conversion without frontend processing and with an attached HRSG waste heat boiler for energy recovery. These technologies were selected based on viability of development due to current state of commercialization and discussions with MWA.
Of these technologies, mass burn combustion is the most commercially utilized around the world. RDF technology has been used in a number of plants in the U.S. that have been in commercial operation for many years. One or two stage gasification with steam production is less developed, but is one of the least complicated and most commercially developed of the gasification approaches.
In addition plastics to oil is reviewed. Plastic to oil is of special interest and may be approaching commercial performance in certain applications. The remaining technologies presently are either less commercially developed or considered not applicable to MWA’s current interests.

Economic Evaluation Chapter 6
Alternative Disposal Feasibility 2013 28
Chapter 6 Economic Evaluation
6.1 Methodology and Assumptions
The financial analysis presented herein models the capital and operating costs of the three waste to energy options for comparison. A separate analysis is provided for the plastics to oil alternative. The purpose of this approach is to provide a common basis to explore and examine the financial implications of each of the waste to energy option. This report outlines a number of key assumptions that were required in this analysis.
The economic analysis will estimate costs for a proposed waste to energy based system, taking into account some of the life cycle profiles as generalized below in Figure 11. This report will focus on the capital and financing costs of a generic site and facility, the annualized operations and maintenance costs, and potential revenues for each of the options and will not include a full lifecycle analysis which may include costs for landfilling during construction and residual value of the plant.
Capital costs and refurbishments of the facility result in large expenditures over a short time period that must be balanced against the potential revenue streams. If certain revenue sources, such as sales of heat energy are not available, then other revenue sources must be increased to compensate. Likewise if the value of a revenue stream is limited this will apply additional pressure on the other revenue sources. For MWA it is likely that a reliable heat energy source will be hard to identify. In addition, the value obtained from electric sales is likely to be low putting pressure on the required tipping fee for any proposed facility.
Figure 11. Financial Life Cycle for Waste to Energy Facility

Economic Evaluation Chapter 6
Alternative Disposal Feasibility 2013 29
A waste to energy facility is a sub-component of a larger waste management system. For example there could be cost impacts associated with collection and transportation of MSW, transportation of low grade plastics from MRF, implementation of new programs, existing facility or infrastructure modifications (e.g. MRF), landfill operations, addition of a monofill for ash disposal, etc. Evaluating additional costs impacts such as these are not included as a part of this study.
Alternative scenarios are defined and analyzed for each of the technologies remaining under consideration, including:
� Refuse Derived Fuel (RDF) processing and combustion � Mass burn combustion � Gasification � Plastics to Oil
The following boundaries for the waste to energy or thermal options applied to the broad waste management system are being considered as the basis in this assessment:
� Feedstock for the waste to energy facility would be mixed municipal solid waste delivered directly to the facility or indirectly through the transfer station to the facility.
� Ferrous and non-ferrous metals would be recovered from the residue generating a revenue stream along with energy sales.
� Generally ash is disposed in ash monofills as assumed in this analysis. In some cases ash may be used as an aggregate fill material for construction of roads and similar applications within the landfill boundary. However the markets are not developed at this time and there are significant regulatory and logistical issues that have prevented the commercial use of ash from waste to energy facilities in the United States.
The following boundaries for the plastics to oil option applied to the broad waste management system are being considered as the basis in this assessment:
� Feedstock for the plastics to oil facility would be mixed Nos. 3-7 plastics delivered directly to the facility. Means of collecting of the plastics are not fully included in this analysis.
� Crude oil production for sale to a refinery is assumed. � Char will be disposed at a landfill. In some cases the char produced in the process may also be a
marketable product as a supplemental fuel for industries such as steel mills, however, it is likely that the char will be landfilled and thus not considered a source of revenue for this analysis. Char may also be combusted within a WTE facility if developed.

Economic Evaluation Chapter 6
Alternative Disposal Feasibility 2013 30
A number of other assumptions are required to allow preparation of financial models for each of the scenarios. Table 14 lists the comparative scenarios and assumptions forming the basis for the financial analysis.
Table 14. Key Assumptions
Waste to Energy Based Systems
Plastics to Oil RDF and Combustion
Mass Burn Combustion
Gasification
Waste available (ton/year) (1) (2)
404,163 64,826
Nominal facility size (3)
977
(ton/day)
977
(ton/day)
1,038
(ton/day)
50.5 (ton/day)
Capacity factor (%) 85 85 80 60
Waste disposed or processed (ton/year) (4)
303,122 11,060
Lifespan capacity (tons) 9.1 M 331,800
Facility operating lifespan (years)
30 30
Electricity revenue ($/MW·hr)
30.00 NA
Oil revenue ($/barrel)
NA See Note 5
Ferrous metals recovery ($/ton)
50 NA
Non-ferrous metals Recovery ($/ton)
1,000 NA
Potential heat recovery ($/1000lb steam) (6)
4.20 NA
NA = Not applicable
Note:
(1) Waste available is based on MSW Disposal Quantity per 2011 Iowa Statewide Waste Characterization Study Table 2-3 plus a 1 percent growth rate over the life of the facility.
(2) Plastic available is based on Disposal Quantities (see note 1) and Disposal Composition per 2011 Iowa Statewide Waste Characterization Study, Appendix B.
(3) Nominal facility size for the gasification system is larger due to the reduced capacity factor keeping annual processed tonnage equal to other WTE options.
(4) Waste disposed at WTE facility assumes 75 percent of waste currently disposed at the MWA landfill.
(5) Oil revenue required for a ‘break even’ scenario will be calculated based on annual operating costs.
(6) Assumes 90 percent of natural gas price.
These assumptions and this analysis are focused on providing a reasonable basis for the options available. In consideration of some of the fundamental differences between the options and information that remains unknown or uncertain, this analysis should not be interpreted as an optimized “business case” or “business plan” for any of the options. The assumptions made are necessary to allow estimation of costs and benefits on a common basis leading to cost comparison of the options to support decision-making. Detailed business planning for a specific facility is a subsequent activity that relies on additional information which can only be developed if MWA proceeds with waste to energy and/or plastics to oil regarding key matters such as technology selection, energy markets, and siting.
Key among the assumptions is selection of the nominal size of the facility to be assumed for the each scenario.

Economic Evaluation Chapter 6
Alternative Disposal Feasibility 2013 31
Waste to Energy facility size was calculated based on the ability to dispose of the estimated available annual tonnage. Capacity factors were applied to determine a daily throughput equating to a nominal value of 977 tons/day for the RDF and mass burn options and 1,083 for the gasification option.
The plastics to oil facility size was determined in a manner similar to the WTE options equating to a nominal value of 50.5 tons/day. This nominal size was based on the following key considerations:
� Current landfill disposal rates of Nos. 3-7 plastics; � Estimated recovery rate; and, � Practical operation efficiency for the current state of the technology;
It is generally recognized that for a larger facility size, the economic model can perform more efficiently by spreading costs out across the increased tonnage. However this assumes there is adequate acceptable waste available at a reasonable tipping fee and the other revenue markets are stable. If additional acceptable waste supplies could be identified, greater financial advantages could possibly be achieved. The assumptions used for this analysis are at the maximum throughput anticipated but refinements of a business plan would be necessary at a subsequent stage following the initial decision-making process.
In general terms the financial analysis approach involves calculation of costs (i.e. capital and operating) and revenues (i.e. electrical power and recovered recyclables, or oil sales) for each of the scenarios being considered. Financial carrying costs are included in the operating costs.
While greenhouse gas emission reductions would occur under each scenario, trading of emission reduction credits (“offsets”) has not been included as a revenue stream due to the volatility and uncertainty of the offset market.
Currently there are no incentives for the development of a WTE plant within the state of Iowa. Previous incentives for Renewable Energy and Energy Efficiency according to the Iowa Office of Energy Independence website applicable to WTE type facilities include:
• Renewable Energy Production Tax Credit – Provided a $0.015 / kWh incentive for renewable energy facilities including refuse conversion facilities under 60 MW nameplate capacity. Credit is only applicable for plants that will begin operation prior to January 1, 2015; it is not likely that a plant could be developed within this time period.
• Clean Renewable Energy Bonds (CREB’s) – The government allocated a total of $2.4 billion ($800 million in 2008 and addition $1.6 billion was added in 2009) to finance eligible renewable energy projects included WTE. The IRS is not longer accepting applications ending in November of 2010.
Similarly there are no incentives for the development of a plastics to oil facility. A bill was proposed to provide tax credits for oil produced from plastics. The “Plastics Recovery Act of 2009” would have provided $0.60 per gallon tax credit for ten years for facilities producing less than 84,000 gallons annually. This bill proposed in September of 2009 was not enacted.
For the waste to energy options the overall net costs are tallied and then divided by the total waste tonnage managed under each scenario to define the average net unit cost (i.e. $/ton) for each scenario. To reach this value, tipping fees were excluded from the revenue streams, allowing the average net unit cost to reflect a “break-even” condition.
For the plastics to oil option the overall net costs are tallied and then divided by the total oil production to define the average net unit cost (i.e. $/barrel). This average net unit cost is considered the ‘break-even’ condition and reflects the pricing needed for oil sales revenue.
As a simplifying assumption for the purpose of this comparison only, all dollar figures are presented as 2012 values. Development of a future, more detailed business case of a preferred technology should include adjustments to account for the time cost of money.

Economic Evaluation Chapter 6
Alternative Disposal Feasibility 2013 32
6.2 Capital and Operation Cost Estimates
Estimates, as shown in the following sections and included with more detail in Appendix B, were based on vendor budgetary quotations, RS Means Cost Estimating Guide, and HDR’s experience with recent studies and projects conducted for other clients. The estimates were developed for the following scenarios:
� A conceptual mass burn plant consisting of a two 489 tpd units � An RDF facility with two 488 tpd processing lines to provide a fuel feedstock for combustion. � A conceptual gasification plant consisting of a three 346 tpd units � A conceptual 50.5 tpd plastics to oil facility.
6.2.1 Capital Cost Estimates
Capital cost estimates have been prepared for the three waste to energy scenarios and plastic to oil scenario including the following major cost elements:
� Planning, approvals and procurement � Site acquisition � Supporting infrastructure � Facility design, construction, rolling stock, equipment and commissioning � Other miscellaneous capital costs
The estimates assume that site acquisition would be required for all options.
Contingencies have been used to account for undefined information at the time of the estimate. A contingency of 20 percent was included in the cost estimate, which is typical at this current conceptual level of design and complexity of the project, to account for items that can be difficult to define at this point of design such as:
� Specific site development costs. � Additional equipment that may be required due to an undefined design condition or requirement. � Specific variations of each vendor’s requirements. � Certain undefined building conditions.
The estimate includes design/engineering costs of 8 percent and a construction management cost of 5 percent both of which are typical of this type and size of project. Project development costs including permitting and start up and testing are included based on recent projects of similar type and size.
Note that these cost estimates assume a generic site and make other approximations representative of anticipated costs but a specific project will require refinement of these assumptions. The analysis also assumes the existing waste delivery infrastructure without addition of any new transfer stations or waste collection modifications.
6.2.2 Operating Cost Estimates
Operating and maintenance cost estimates, as shown in the following sections and included with more detail in Appendix C, have been prepared for each scenario including the following major cost elements:
� Labor � Consumables � Utilities � Maintenance � Ash management � Ash or char transfer and transport � Administration and finance � Debt service � Other miscellaneous operating costs

Economic Evaluation Chapter 6
Alternative Disposal Feasibility 2013 33
6.2.3 Capital Funding Approach
6.2.3.1 Capital Funding
It is assumed that MWA would issue bonds for all of the capital costs for the WTE options and for the plastics to oil option, including the permitting and public approval process expenditures.
A financial advisor should be consulted to determine the most appropriate financing strategy, such as bond anticipation notes or cash flow funding of up-front costs. If general obligation bonds were required instead by bond counsel, a bond referendum would also be needed, which would impact project timing and public information costs.
Capital costs for all options are presented in the following sections. All option cost estimates were escalated four percent based on an estimated start of construction date of three years for the WTE options and two years for the plastics to oil option from the 2012 cost estimate year.
6.2.3.2 Debt Structuring
For the purpose of this study, it is anticipated that the debt financing requirements would be funded through the use of tax-exempt revenue bonds and a small portion of taxable bonds to meet IRS rules with an assumed blended interest rate of 3 percent. The proceeds from the revenue bonds would be used to finance all of the direct costs included in the estimated construction costs as well as the indirect costs relating to the bond issuance, including a 1-year debt service reserve fund. Considering that the start of construction for these projects would require time to develop a partnering relationship, obtain permits, and procure the project contractor, the estimated capital cost was escalated three years for the WTE options and two years for the plastics to oil option to account for this development period.
6.2.4 Mass Burn Economic Analysis
Capital and operation costs were developed assuming a typical mass burn facility consisting of two 489 tpd units.
6.2.4.1 Capital Costs
The cost estimate includes; a refuse pit, ash storage and processing; waste-handling cranes; buildings including MSW receiving, pit and crane, boiler, turbine, administration, and scalehouse; power plant equipment including the boiler, grate, turbine, generator, condenser, cooling tower, and air pollution control equipment including SNCR technology; site upgrades and development; rolling equipment required for plant operations; and soft costs including engineering, construction management, project development costs, permitting, and contingency.
It was assumed that a greenfield site would be developed requiring construction of roads, utilities, drainage system, etc. however no design work has been completed as no preferred site has been identified. The estimates assume typical site and infrastructure requirements and typical features for the technology assuming a reasonable access to infrastructure and site conditions
Rolling equipment costs are included in the Power Block capital costs as shown in Table 15 which includes a total of: three front loaders, two forklifts, one bobcat, one sweeper and one pick-up. Equipment quantities are based on similar facilities of similar size. Rolling stock also includes the purchase of ash disposal trucks assuming a total of 4 each trucks and trailers are required. Equipment quantities are based on similar facilities of similar size, required ash trucks and trailers were calculated based on tonnages anticipated, trailer capacity, and round trip time. Additional equipment may be required and/or existing rolling equipment may be utilized depending on operations.
Table 15 shows the capital cost estimate for the mass burn option.

Economic Evaluation Chapter 6
Alternative Disposal Feasibility 2013 34
Table 15. Capital Costs: Mass Burn Option
Mass Burn
Component 2012$’s
Land acquisition $150,000
Sitework $240,000
Site improvements $1,900,000
Pre-processing equipment $0
Buildings $17,500,000
Power block equipment $183,090,000
Design / engineering $16,200,000
Construction Management $10,100,000
Permitting $1,010,000
Startup and Testing $8,100,000
Capital contingency $40,500,000
Total Capital Cost $278,800,000
Note:
(1) Capital costs account for soft costs including (assumption provided): design / engineering (8%), construction management (5%), permitting (0.5%), startup and testing (4%), and contingency (20%).
6.2.4.2 Debt Service
Using the capital cost requirements as shown in Table 15, a preliminary estimate of debt service requirements is provided in Table 16. A revenue bond financing based on a 41-month construction schedule is assumed.
Table 16. Mass Burn Debt Service Estimate
Sources Mass Burn
Combustion
Bond Sale Proceeds $ 384,477,000
Interest earnings during construction
$ 9,766,000
Total $ 394,243,000
Uses
Construction Cost $ 313,612,000
Issuance Costs $ 15,379,000
Capitalized Interest $ 39,409,000
Debt Service Reserve Fund $ 25,843,000
Total $ 394,243,000
Note:
(1) Based on an assumed 20-year revenue bond at an interest rate of 5.0 percent
(2) Capitalized interest during construction and one-year’s debt service for debt service reserves
(3) Assumed issuance costs of 4 percent.
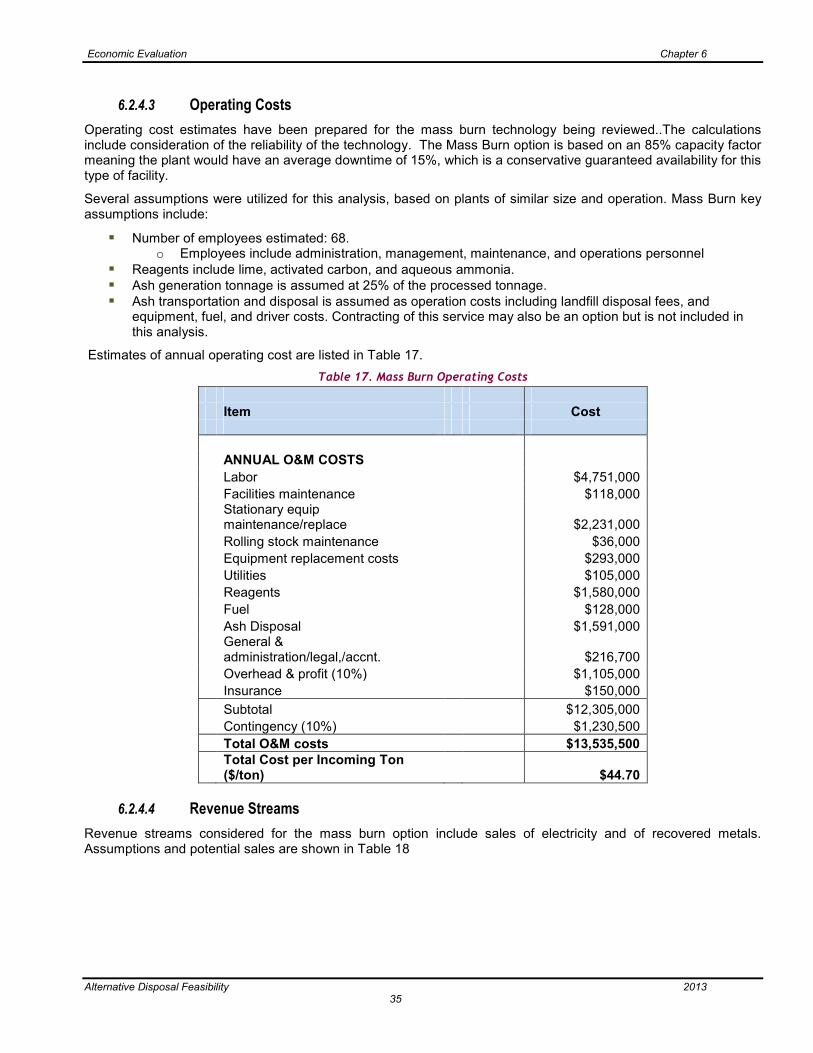
Economic Evaluation Chapter 6
Alternative Disposal Feasibility 2013 35
6.2.4.3 Operating Costs
Operating cost estimates have been prepared for the mass burn technology being reviewed..The calculations include consideration of the reliability of the technology. The Mass Burn option is based on an 85% capacity factor meaning the plant would have an average downtime of 15%, which is a conservative guaranteed availability for this type of facility.
Several assumptions were utilized for this analysis, based on plants of similar size and operation. Mass Burn key assumptions include:
� Number of employees estimated: 68. o Employees include administration, management, maintenance, and operations personnel
� Reagents include lime, activated carbon, and aqueous ammonia. � Ash generation tonnage is assumed at 25% of the processed tonnage. � Ash transportation and disposal is assumed as operation costs including landfill disposal fees, and
equipment, fuel, and driver costs. Contracting of this service may also be an option but is not included in this analysis.
Estimates of annual operating cost are listed in Table 17.
Table 17. Mass Burn Operating Costs
Item Cost
ANNUAL O&M COSTS
Labor $4,751,000
Facilities maintenance $118,000
Stationary equip maintenance/replace $2,231,000
Rolling stock maintenance $36,000
Equipment replacement costs $293,000
Utilities $105,000
Reagents $1,580,000
Fuel $128,000
Ash Disposal $1,591,000
General & administration/legal,/accnt. $216,700
Overhead & profit (10%) $1,105,000
Insurance $150,000
Subtotal $12,305,000
Contingency (10%) $1,230,500
Total O&M costs $13,535,500
Total Cost per Incoming Ton ($/ton) $44.70
6.2.4.4 Revenue Streams
Revenue streams considered for the mass burn option include sales of electricity and of recovered metals. Assumptions and potential sales are shown in Table 18

Economic Evaluation Chapter 6
Alternative Disposal Feasibility 2013 36
Table 18. Mass Burn Potential Revenue
Item Cost
ANNUAL POTENTIAL REVENUE
Power Revenue
Price ($/kW) 0.03
Power Production (kWh/ton) 625
Annual Production (kWh/yr) 189,446,406
Electric Revenue $5,683,392
Metals Recovery Revenue
Ferrous Recovery (%) 2.5%
Ferrous Recovery (ton/yr) 7,578
Ferrous Recovery ($/ton) $50
Ferrous Recovery Revenue
($/yr) $378,893
Non Ferrous Recovery (%) 0.35%
Non Ferrous Recovery (ton/yr) 1,061
Non Ferrous Recovery ($/ton) $1,000
Non Ferrous Recovery Revenue ($/yr) $1,060,900
Total Metals Recovery Revenue ($/yr) $1,439,793
Total Revenue ($/yr) $7,123,185
An additional revenue source is from the sale of steam. Steam sales can be a good source of revenue; however, sales are dependent on the presence of one or more heat energy consumers with compatible heat demand profiles located within a reasonable distance from the facility and thus are not an assured source of revenue. Steam sales are not considered for the base analysis, but are provided as a separate analysis shown in Section 6.2.6.5.
6.2.4.5 Cost Summary
Table 19 provides a summary of the estimated mass burn option annual costs as well as an anticipated cost per ton to operate the facility. This cost per ton represents a “break even” number.

Economic Evaluation Chapter 6
Alternative Disposal Feasibility 2013 37
Table 19. Mass Burn Option Cost Summary
Cost Summary Mass Burn
Combustion
Total Waste Disposed (ton/yr) 303,122
Expenditures
Capital $25,326,000
Operating $13,536,000
Total Annual Expenditures $38,862,000
Gross Annual Unit Cost ($/ton) $128
Revenues
Electricity Sales $5,683,000
Sale of Recyclables $1,440,000
Total Revenue $7,123,000
Net Annual Cost $31,739,000
Net Unit Cost ($/ton) $105
6.2.5 RDF Economic Analysis
Capital and operation costs were developed assuming a typical RDF facility consisting of two 489 tpd processing lines and combustion units.
6.2.5.1 Capital Costs
The RDF facility layout was based on a generic processing line. This may change as design requirements evolve. The number, or even types, of equipment on the processing line could change; however, the layout assumed would produce a functioning RDF facility.
The cost estimate presented in Table 20 for the RDF facility includes; new processing equipment including trommel screens, shredders, ferrous magnets, eddy current magnets, conveyors, picking cranes, and dust collection/filtration equipment, power block equipment, APC including SNCR technology; buildings including MSW receiving, processing, feedstock storage, boiler, turbine, administration, and scalehouse; site upgrades and development; rolling equipment required for plant operations; and soft costs including engineering, construction management, project development costs, permitting and contingency.
It was assumed that a greenfield site would be developed requiring construction of roads, utilities, drainage system, etc. however no design work has been completed as no preferred site has been identified. The estimates assume typical site and infrastructure requirements and typical features for the technology assuming a reasonable access to infrastructure and site conditions
Rolling equipment costs are included in the Power Block Equipment capital costs as shown in Table 20 which include; three - front loaders, two - forklifts, one - bobcat, one - sweeper, one - pick-up, and six (total) – residue and ash hauling trucks and trailers. Equipment quantities are based on similar facilities of similar size, required residue and ash trucks and trailers were calculated based on tonnages anticipated, trailer capacity, and round trip time. Quantity of equipment shown as a minimum requirement, additional equipment may be required depending on operations.
Table 20 shows the capital cost estimate for the RDF option.

Economic Evaluation Chapter 6
Alternative Disposal Feasibility 2013 38
Table 20. Capital Costs: RDF Option
RDF Processing and Combustion
Component 2012$’s
Land acquisition $225,000
Sitework $240,000
Site improvements $2,600,000
Pre-processing equipment $18,700,000
Buildings $34,700,000
Power block equipment $162,540,000
Design / engineering $17,500,000
Construction Management $10,900,000
Permitting $1,090,000
Startup and Testing $8,800,000
Capital contingency $43,800,000
Total Capital Cost $301,100,000
Note:
(1) Capital costs account for soft costs including (assumption provided): design / engineering (8%), construction management (5%), permitting (0.5%), startup and testing (4%), and contingency (20%).
6.2.5.2 Debt Service
Using the capital cost requirements as shown in Table 20, a preliminary estimate of debt service requirements is provided in Table 21. A revenue bond financing based on a 41-month construction schedule is assumed.
Table 21. RDF Debt Service Estimate
Sources RDF and
Combustion
Bond Sale Proceeds $ 415,230,000
Interest earnings during construction
$ 10,547,000
Total $ 425,777,000
Uses
Construction Cost $ 338,697,000
Issuance Costs $ 16,609,000
Capitalized Interest $ 42,561,000
Debt Service Reserve Fund $ 27,910,000
Total $ 425,777,000
Note:
(1) Based on an assumed 20-year revenue bond at an interest rate of 5.0 percent
(2) Capitalized interest during construction and one-year’s debt service for debt service reserves
(3) Assumed issuance costs of 4 percent.

Economic Evaluation Chapter 6
Alternative Disposal Feasibility 2013 39
6.2.5.3 Operating Costs
Operating cost estimates have been prepared for the RDF technology being reviewed. The RDF technology requires processing; additional labor, fuel, and maintenance costs would be incurred and is account for in the analysis. The calculations include consideration of the reliability of the technologies. The RDF option is based on an 85% capacity factor meaning the plant would have an average downtime of 15%, which is a typical guaranteed availability for this type of facility.
Several assumptions were utilized for this analysis, based on plants of similar size and operation. RDF key assumptions include:
� Number of employees estimated: 104. o Employees include administration, management, maintenance, processing, and operations
personnel � Reagents include lime, activated carbon, and aqueous ammonia. � Ash and residue disposal tonnage is assumed at 30% of the processed tonnage. � Ash and pre-processing rejects transportation and disposal is assumed as an operation costs including
landfill disposal fees, and equipment, fuel, and driver costs. Contracting of this service may also be an option but is not included in this analysis.
.Estimates of annual operating cost are listed in Table 22
Table 22. RDF Operating Costs
Item Cost
ANNUAL O&M COSTS
Labor $6,780,000
Facilities maintenance $407,000
Stationary equip maintenance/replace $2,146,000
Rolling stock maintenance $220,000
Equipment replacement costs $378,000
Utilities $105,000
Reagents $1,580,000
Fuel $704,000
Ash Disposal $1,910,000
General & administration/legal,/accnt. $284,600
Overhead & profit (10%) $1,451,000
Insurance $150,000
Subtotal $16,116,000
Contingency (10%) $1,611,600
Total O&M costs $17,727,600
Total Cost per Incoming Ton ($/ton) $58.50
6.2.5.4 Revenue Streams
Revenue streams considered for the RDF option include sales of electricity and of recovered metals. Assumptions and potential sales are shown in Table 23

Economic Evaluation Chapter 6
Alternative Disposal Feasibility 2013 40
Table 23. RDF Potential Revenue
Item Cost
ANNUAL POTENTIAL REVENUE
Power Revenue
Price ($/kW) 0.03
Power Production (kWh/ton) 600
Annual Production (kWh/yr) 181,868,550
Electric Revenue $5,456,057
Metals Recovery Revenue
Ferrous Recovery (%) 2.5%
Ferrous Recovery (ton/yr) 7,578
Ferrous Recovery ($/ton) $50
Ferrous Recovery Revenue
($/yr) $378,893
Non Ferrous Recovery (%) 0.35%
Non Ferrous Recovery (ton/yr) 1,061
Non Ferrous Recovery ($/ton) $1,000
Non Ferrous Recovery Revenue ($/yr) $1,060,900
Total Metals Recovery Revenue ($/yr) $1,439,793
Total Revenue ($/yr) $6,895,849
An additional revenue source is from the sale of steam. Steam sales can be a good source of revenue, however, sales are dependent on the presence of one or more heat energy consumers with compatible heat demand profiles located within a reasonable distance from the facility and thus are not an assured source of revenue. Steam sales are not considered for the base analysis, but are provided as a separate analysis shown in Section 6.2.6.5.
6.2.5.5 Cost Summary
Table 24 provides a summary of the estimated RDF option annual costs as well as an anticipated cost per ton to operate the facility. This cost per ton represents a “break even” number.

Economic Evaluation Chapter 6
Alternative Disposal Feasibility 2013 41
Table 24. RDF Cost Summary
Cost Summary RDF and
Combustion
Total Waste Disposed (ton/yr) 303,122
Expenditures
Capital $27,352,000
Operating $17,728,000
Total Annual Expenditures $45,080,000
Gross Annual Unit Cost ($/ton) $149
Revenues
Electricity Sales $5,456,000
Sale of Recyclables $1,440,000
Total Revenue $6,896,000
Net Annual Cost $38,184,000
Net Unit Cost ($/ton) $126
6.2.6 Gasification Economic Analysis
Capital and operation costs were developed assuming a gasification facility consisting of three 346 tpd gasification and boiler units. This option is based on utilization of an advanced technology that requires no front end processing of MSW. While this may have somewhat higher relative costs for the core gasification technology system and power block, other costs such as additional processing and storage are avoided. The technology also assumes the synthetic gas produced is combusted within the unit and a waste heat boiler is used to generate steam.
6.2.6.1 Capital Costs
The cost estimate includes; a refuse pit, ash storage and processing; waste-handling cranes; buildings including MSW receiving, pit and crane, boiler, turbine, administration, and scalehouse; power plant equipment including the gasifers, boiler, grate, turbine, generator, condenser, cooling tower, and air pollution control equipment with SNCR technology; site upgrades and development; rolling equipment required for plant operations; and soft costs including engineering, construction management, project development costs, permitting, and contingency.
It was assumed that a greenfield site would be developed requiring construction of roads, utilities, drainage system, etc., however no design work has been completed as no preferred site has been identified. The estimates assume typical site and infrastructure requirements and typical features for the technology assuming a reasonable access to infrastructure and site conditions
Rolling equipment costs are included in the Power Block capital costs as shown in Table 25 which includes a total of: three front loaders, two forklifts, one bobcat, one sweeper and one pick-up. Equipment quantities are based on similar facilities of similar size. Rolling stock also includes the purchase of ash disposal trucks assuming a total of 4 trucks and trailers. Equipment quantities are based on similar facilities of similar size, required ash trucks and trailers were calculated based on tonnages anticipated, trailer capacity, and round trip time. Additional equipment may be required and/or existing rolling equipment may be utilized depending on operations.
Table 25 shows the capital cost estimate for the Gasification option.

Economic Evaluation Chapter 6
Alternative Disposal Feasibility 2013 42
Table 25. Capital Costs: Gasification Option
Gasification
Component 2012$’s
Land acquisition $150,000
Sitework $240,000
Site improvements $2,000,000
Pre-processing equipment $0
Buildings $18,200,000
Power block equipment $210,520,000
Design / engineering $18,500,000
Construction Management $11,600,000
Permitting $1,160,000
Startup and Testing $9,200,000
Capital contingency $46,200,000
Total Capital Cost $317,800,000
Note:
(1) Capital costs account for soft costs including (assumption provided): design / engineering (8%), construction management (5%), permitting (0.5%), startup and testing (4%), and contingency (20%).
6.2.6.2 Debt Service
Using the capital cost requirements as shown in Table 25, a preliminary estimate of debt service requirements is provided in Table 26. A revenue bond financing based on a 41-month construction schedule is assumed.
Table 26. Gasification Debt Service Estimate
Sources Gasification
Bond Sale Proceeds $ 438,260,000
Interest earnings during construction
$ 11,132,000
Total $ 449,393,000
Uses
Construction Cost $ 357,482,000
Issuance Costs $ 17,530,000
Capitalized Interest $ 44,922,000
Debt Service Reserve Fund $ 29,458,000
Total $ 449,392,000
Note:
(1) Based on an assumed 20-year revenue bond at an interest rate of 5.0 percent
(2) Capitalized interest during construction and one-year’s debt service for debt service reserves
(3) Assumed issuance costs of 4 percent.

Economic Evaluation Chapter 6
Alternative Disposal Feasibility 2013 43
6.2.6.3 Operating Costs
Operating cost estimates have been prepared for the gasification technology being reviewed. As noted above for the capital cost estimate, the gasification estimate does not include MSW processing costs. At There are a number of technologies that do not require processing of the feedstock. The calculations include consideration of the reliability of the technologies. The gasification is based on a capacity factor of 80% meaning the plant would have an average downtime of 20%, which is a typical guaranteed availability for this type of facility.
Several assumptions were utilized for this analysis, based on plants of similar size and operation. Gasification key assumptions include:
� Number of employees estimated: 68. o Employees include administration, management, maintenance, and operations personnel
� Reagents include lime, activated carbon, and aqueous ammonia. � Ash generation tonnage is assumed at 25% of the processed tonnage. � Ash transportation and disposal is assumed as operation costs including landfill disposal fees, and
equipment, fuel, and driver costs. Contracting of this service may also be an option but is not included in this analysis.
Estimates of annual operating cost are listed in Table 27
Table 27. Gasification Operating Costs
Item Cost
ANNUAL O&M COSTS
Labor $4,751,000
Facilities maintenance $128,000
Stationary equip maintenance/replace $2,564,000
Rolling stock maintenance $36,000
Equipment replacement costs $293,000
Utilities $108,000
Reagents $1,580,000
Fuel $128,000
Ash Disposal $1,591,000
General & administration/legal,/accnt. $223,600
Overhead & profit (10%) $1,140,000
Insurance $150,000
Subtotal $12,693,000
Contingency (10%) $1,269,300
Total O&M costs $13,962,300
Total Cost per Incoming Ton ($/ton) $46.10
6.2.6.4 Revenue Streams
Revenue streams considered for the gasification option include sales of electricity and of recovered metals. Assumptions and potential sales are shown in Table 28

Economic Evaluation Chapter 6
Alternative Disposal Feasibility 2013 44
Table 28. Gasification Potential Revenue
Item Cost
ANNUAL POTENTIAL REVENUE
Power Revenue
Price ($/kW) 0.03
Power Production (kWh/ton) 575
Annual Production (kWh/yr) 174,290,274
Electric Revenue $5,228,708
Metals Recovery Revenue
Ferrous Recovery (%) 2.5%
Ferrous Recovery (ton/yr) 7,578
Ferrous Recovery ($/ton) $50
Ferrous Recovery Revenue
($/yr) $378,892
Non Ferrous Recovery (%) 0.35%
Non Ferrous Recovery (ton/yr) 1,061
Non Ferrous Recovery ($/ton) $1,000
Non Ferrous Recovery Revenue ($/yr) $1,060,897
Total Metals Recovery Revenue ($/yr) $1,439,789
Total Revenue ($/yr) $6,668,497
An additional revenue source is from the sale of steam. Steam sales can be a good source of revenue, however, sales are dependent on the presence of one or more heat energy consumers with compatible heat demand profiles located within a reasonable distance from the facility and thus are not an assure source of revenue. Steam sales are not considered for the base analysis, but are provided as a separate analysis shown in Section 6.2.6.5.
The gasification option also includes the potential of selling the syngas produced directly to a customer. Similar to steam sales, sales are dependent on the presence of one or more energy consumers with capable demands located within a reasonable distance from the facility.
6.2.6.5 Cost Summary
Table 29 provides a summary of the estimated gasification option annual costs as well as an anticipated cost per ton to operate the facility. This cost per ton represents a “break even” number.

Economic Evaluation Chapter 6
Alternative Disposal Feasibility 2013 45
Table 29. Gasification Cost Summary
Cost Summary Gasification
Total Waste Disposed (ton/yr) 303,122
Expenditures
Capital $28,869,000
Operating $13,962,000
Total Annual Expenditures $42,831,000
Gross Annual Unit Cost ($/ton) $141
Revenues
Electricity Sales $5,456,000
Sale of Recyclables $1,440,000
Total Revenue $6,896,000
Net Annual Cost $35,935,000
Net Unit Cost ($/ton) $119
6.2.7 Potential Heat Sales
Production of heat (steam) energy in combination with electrical power generation is often referred to as combined heat and power (CHP) or cogeneration. Each of the waste to energy technologies being considered provides the opportunity to recover marketable heat energy in the form of steam. In the production of electricity considered in the revenue estimates, steam is produced and used in a turbine generator to produce electricity while the steam that is exhausted from the turbine is condensed and reused in the cycle as boiler feedwater. Heat rejected in the condensation process represents a loss of energy. Recovery and use for the heat from the steam that would otherwise be lost during the condensation process increases the overall thermal efficiency of the system, however it should be recognized that this also typically reduces the electrical output potential of a facility.
The marketability of recovered steam heat is dependent on the presence of one or more heat energy consumers with compatible heat demand profiles, located within a reasonable distance from the waste to energy facility. A firm decision regarding the feasibility of steam sales can not be determined definitively until a site is selected and discussions with a specific customer(s) are initiated. Because of this and taking into consideration marketing opportunities in the area, electrical power should be considered the primary energy product of a potential MWA waste to energy facility. Sale of steam for heating purposes is an attractive supplementary energy output that should be considered if opportunities are available particularly due to low revenue potential from electricity sales.
The following analysis is provided to illustrate the potential benefit, should opportunities for recovery and sale of steam heat be realized. A hypothetical value of $4.20 per 1,000 lb of steam was developed. Section 4.3.1 also included ranges of potential steam available for each of these technologies which are reiterated below together with the maximum potential revenue calculated based on the expected capacity factor of each technology. Capital costs associated with infrastructure requirements for steam transport are not factored into revenue estimates.

Economic Evaluation Chapter 6
Alternative Disposal Feasibility 2013 46
Table 30. Potential Heat Revenue
Technology
Potential Steam
(1000’s lb/hr)
Potential Annual Revenue
Mass Burn Combustion 293 - 343 $9.2 - $10.7 Million
RDF processing and combustion
293 - 343 $9.2 - $10.7 Million
Gasification 291 - 342 $8.6 - $10.1 Million
It is unlikely that a steam customer could be identified that would be in a position to purchase all of the quantities of steam indicated above. Without identification of a specific steam customer and the associated usage profile, the estimates above have limited value other than to point out that locating a reliable steam customer with a consistent load profile would significantly improve facility economics.
6.2.8 Waste to Energy Financial Results Summary
Table 31 provides a summary comparison of the three waste to energy options.
Table 31. Waste to Energy Cost Comparison
Cost Summary RDF and
Combustion Mass Burn
Combustion Gasification
Total Waste Disposed (ton/yr) 303,122 303,122 303,122
Expenditures
Capital $27,352,000 $25,326,000 $28,869,000
Operating $17,728,000 $13,536,000 $13,962,000
Total Annual Expenditures $45,080,000 $38,862,000 $42,831,000
Gross Annual Unit Cost ($/ton) $149 $128 $141
Revenues
Electricity Sales $5,456,000 $5,683,000 $5,456,000
Sale of Recyclables $1,440,000 $1,440,000 $1,440,000
Total Revenue $6,896,000 $7,123,000 $6,896,000
Net Annual Cost $38,184,000 $31,739,000 $35,935,000
Net Unit Cost ($/ton) $126 $105 $119

Economic Evaluation Chapter 6
Alternative Disposal Feasibility 2013 47
Key information to note regarding this summary includes the following:
� Gross capital and operating costs and gross unit costs for all waste to energy options are much higher than for landfilling, however, these higher capital and operating costs are offset to varying degrees by revenue from sale of power and recovered recyclables.
� On average, net unit costs for the waste to energy options are higher than the net unit costs for landfill disposal.
� Among all scenarios and options being analyzed, mass burn waste to energy offers the lowest net unit cost. This is primarily due to the following:
o Lower costs of the facility o Highest electrical generation efficiency
� The estimated revenues for waste to energy options do not include potential steam heat sales nor sales of greenhouse gas emission reductions
Subject to the assumptions inherent in the analysis, this information suggests that indicates that mass burn waste to energy offers the lowest overall net costs of the waste to energy options considered.
6.2.9 Plastics to Oil Economic Analysis
6.2.9.1 Capital Costs
A capital cost estimate for the Plastics to Oil scenario was developed based on vendor information for plants of similar size.
The cost estimate includes; a shredder; feedstock conveyors; buildings including plastics receiving and storage building, process building, administration, and scalehouse; processing plant equipment including the heating vessel (including burners), condenser, coalescing system, and air pollution control equipment; product storage and truck loadout; site upgrades and development; rolling equipment required for plant operations; and soft costs including engineering, construction management, project development costs, permitting, and contingency.
It was assumed that a greenfield site would be developed requiring construction of roads, utilities, drainage system, etc. however no design work has been completed as no preferred site has been identified. The estimates assume typical site and infrastructure requirements and typical features for the technology assuming a reasonable access to infrastructure and site conditions
Rolling equipment costs are included in the Process Equipment capital costs as shown in Table 32 which includes a total of: two front loaders, one forklift, and one pick-up. Equipment quantities are based on similar facilities of similar size. Rolling stock also includes the purchase of char disposal trucks assuming a total of three trucks and trailers. Equipment quantities are based on similar facilities of similar size, required ash trucks and trailers were calculated based on tonnages anticipated, trailer capacity, and round trip time. Additional equipment may be required and/or existing rolling equipment may be utilized depending on operations.
Capital costs do not include purchasing of crude oil tanker trucks required for transportation of product to an end user. It is assumed that the product transportation will be contracted out and is included in the operation costs.
Table 32 shows the capital cost estimate for the Plastics to Oil option. It should be noted that the estimate for this option is based on the production of crude oil only. Further processing of the crude oil would be required at a separate refinery.

Economic Evaluation Chapter 6
Alternative Disposal Feasibility 2013 48
Table 32. Plastics to Oil Capital Cost Estimate
Plastic to Oil
Component 2012$’s
Land acquisition $90,000
Sitework $78,000
Site improvements $2,100,000
Pre-processing equipment $300,000
Buildings $10,500,000
Process Equipment $18,360,000
Design / engineering $2,500,000
Construction Management $1,600,000
Permitting $160,000
Startup and Testing $1,300,000
Capital contingency $6,300,000
Total Capital Cost $43,300,000
Note:
(1) Capital costs account for soft costs including (assumption provided): design / engineering (8%), construction management (5%), permitting (0.5%), startup and testing (4%), and contingency (20%).
6.2.9.2 Debt Service
Using the capital cost requirements as shown in Table 32, a preliminary estimate of debt service requirements is provided in Table 33. A revenue bond financing based on an 18-month construction schedule is assumed.
Table 33. Plastics to Oil Debt Service Estimate
Sources Plastics to Oil Facility
Bond Sale Proceeds $ 54,560,000
Interest earnings during construction
$ 581,000
Total $ 55,141,000
Uses
Construction Cost $ 46,833,000
Issuance Costs $ 2,182,000
Capitalized Interest $ 2,455,000
Debt Service Reserve Fund $ 3,667,000
Total $ 55,138,000
Note:
(1) Based on an assumed 20-year revenue bond at an interest rate of 5.0 percent
(2) Capitalized interest during construction and one-year’s debt service for debt service reserves
(3) Assumed issuance costs of 4 percent.

Economic Evaluation Chapter 6
Alternative Disposal Feasibility 2013 49
6.2.9.3 Operating Costs
Operating cost estimates have been prepared for the plastics to oil technology being reviewed. The calculations include consideration of the stage of development of the technology. The plastics to oil scenario is based on a capacity factor of 60%.
Several assumptions were utilized for this analysis, Plastic to Oil key assumptions include:
� Number of employees estimated: 32. o Employees include administration, management, maintenance, and operations personnel
� No costs are included for obtaining the plastic feedstock. � Plastics are shredded at the facility prior to entering process. � Natural gas is assumed as a supplemental fuel source. � Char generation tonnage is assumed at 15% of the processed tonnage. � Char transportation and disposal is assumed as operation costs including landfill disposal fees, and
equipment, fuel, and driver costs. Contracting of this service may also be an option but is not included in this analysis.
� Oil transportation is assumed as a contracted service at an estimated per shipment rate.
Estimates of annual operating cost are listed in Table 34
Table 34. Plastics to Oil Operating Costs
Item Cost
ANNUAL O&M COSTS
Labor $2,314,000
Facilities maintenance $128,000
Stationary equip maintenance/replace $352,000
Rolling stock maintenance $17,000
Equipment replacement costs $81,000
Utilities $161,000
Reagents $13,000
Fuel & Oil Haul $352,000
Ash Disposal $76,000
General & administration/legal,/accnt. $69,900
Overhead & profit (10%) $356,000
Insurance $75,000
Subtotal $3,995,000
Contingency (10%) $399,500
Total O&M costs $4,394,500
Total Cost per Oil Produced ($/Barrel) $79.30
Note:
(1) Assumes no cost for plastic feedstock.
6.2.9.4 Revenue Streams
The revenue stream for the plastic to oil option considered includes the sale of crude oil. The cost evaluation provides an analysis for determining the revenue per barrel of crude oil needed to ‘break even’ on an annual basis see Table 35. A potential sales case is provided in Table 35, which is based on $100 per barrel of oil produced.

Economic Evaluation Chapter 6
Alternative Disposal Feasibility 2013 50
Table 35. Plastics to Oil Potential Revenue
Item Cost
ANNUAL POTENTIAL REVENUE
Oil Revenue
Price ($/barrel) 100 Oil Production (lbs plastic / gallon) 9.5 Annual Production (barrels / yr) 55,436
Oil Revenue $5,543,609
Total Revenue ($/yr) $5,543,609
The revenue stream will depend on the plastic to oil technology selected. Systems are reported to produce a varying end product including crude oil, diesel fuel, No. 6 fuel oil, gasoline, and other industrial fuels however this analysis is based upon production of a crude oil for sale.
Char produced in the process may also be a marketable product as a supplemental fuel for industries such as steel mills, however, it is likely that the char will be landfilled and thus not considered a source of revenue for this analysis.
6.2.9.5 Cost Summary
Table 36 provides a summary of the estimated Plastics to Oil option annual costs as well as an anticipated cost per ton to operate the facility. This cost per ton represents a “break even” number.
Table 36. Plastics to Oil Cost Summary
Cost Summary Plastics to Oil
Total Plastics Processed (ton/yr) 11,060
Total Oil Produced (barrel/yr) 55,436
Expenditures
Capital $3,594,000
Operating $4,395,000
Total Annual Expenditures $7,989,000
Annual Unit Cost ($/Barrel) $144
6.2.9.6 Low Grade Plastics Collection
HDR’s review of MWA’s systems and available technologies for capture of low grade plastics from mixed municipal solid waste indicate that a dirty MRF with a higher technology sorting system would be the most reliable technology for capture of adequate quantities of low grade plastics from the waste stream. Select materials such as MRF rejects and certain routes thought to be higher in recyclables and low grade plastics may be targeted to help control costs.
It is likely in order to capture the plastics the processing line must first remove other materials, raising the processing costs to some extent. Extensive double handling of the residuals would be required. A dirty MRF may be expected to capture more than fifty percent of some paper products including cardboard. The paper product other than cardboard would likely only be sold as a mixed grade and all fiber products likely would have some discounts due to contamination.

Economic Evaluation Chapter 6
Alternative Disposal Feasibility 2013 51
More than half of the available plastics may be expected to be recovered. The Nos. 1 and 2 may be sorted and sold separately.
The dirty MRF would likely require a building with about 70,000 to 100,000 square feet of floor space to accommodate a tipping floor, infeed and floor sort area, process lines, baler, production storage areas, and loadout areas for reject materials and products.
Process lines are typically capable of processing about 30 tph. This would require two process lines to process the waste needed to recover enough low grade plastics for the plastics to oil process.
Estimates from equipment suppliers indicated equipment costs per line would likely be between $2.5 and $3 million plus installation. Building costs would be approximately $10.5 to $15 million not including any site improvements.

Implementation Keys Chapter 7
Alternative Disposal Feasibility 2013 52
Chapter 7 Implementation Keys
7.1 General Siting
A new WTE facility will typically require approximately 10 - 15 acres for all of the facilities operations and support infrastructure. Facilities have been built on smaller footprints, but in some cases at the expense of easy operational access. Ideal locations provide easy access for garbage haulers, have easy access to high voltage power lines that have ample capacity to receive electricity from the facility, and have a reliable nearby steam customer. Other site considerations include the facility’s location relative to an ash disposal site (i.e. a landfill), accessible utilities such as water and natural gas, and the potential site’s compliance to siting requirements.
As a part of the site selection process, investigation of potential environmental impacts and potential impacts to neighboring communities will be required. IDNR and local governing agencies will need to be included during the siting process.
7.2 Implementation Issues
Once decisions are made on system configuration, economics are confirmed, a site is selected and approved, and financial viability is established, the implementation of a waste-to-energy facility will take approximately 3 years. This timeline could be compressed or extended depending on the procurement methodology. The decision of whether to implement a waste-to-energy facility is beyond the scope of this study. However, if implementation of a waste-to-energy facility is eventually selected, the following list of major implementation actions has been developed to facilitate the refinement of future planning, scheduling, and implementation and procurement strategies.
1. Secure a commitment from a long-term viable energy market. This may involve developing a partnership with a utility interested in base load renewable power.
2. Secure a long-term supply of waste. This will likely require one or more forms of flow control. 3. Refine or confirm the sizing analysis and basis of design. 4. Identify the site permits and approval processes, and establish a timeline for critical approvals. 5. Determine the site location to be used, and confirm that it can be permitted at all levels of required
approval. 6. Identify site-specific environmental considerations (such as neighbor concerns) and establish reasonable
mitigation strategies. 7. Identify the scope of the facilities to be included in any proposed project and any land set-asides for
expansion or future management functions. 8. Identify the system implementation strategy related to procurement, ownership, operation, and residuals
haul and disposal. 9. Identify all utility locations and fire protection requirements, and refine the strategy for providing such
utilities and fire protection. 10. Re-assess project economics to confirm that all key assumptions remain valid. This may be necessary at
key implementation milestones.
Summary of Evaluation Chapter 8
Alternative Disposal Feasibility 2013 53
Chapter 8 Summary of Evaluation
As part of this Study the amount and type of waste that could potentially be delivered to a proposed waste-to-energy (WTE) facility were reviewed. Three technologies were selected to be looked at in more depth (mass burn, refuse derived fuel, and gasification) based on their history and applicability to the MWA waste stream. The energy recovery potential from these three technologies was evaluated, as well as environmental considerations. This information was then used to evaluate the estimated cost of the proposed facility.
Plastics to oil technology producing crude oil was also evaluated in this study.
The three WTE technologies, as well as the plastics to oil facility, were evaluated for operation and maintenance (O&M) costs and capital costs. The expected tipping fee was estimated for each of the WTE technologies assuming a 20-year debt service period and taking into account the revenue from electricity that offsets the expenses of the project. Mass burn had the lowest calculated tipping fee at $105 per ton. Plastics to oil required oil revenue calculated to be $136 per barrel produced.
A couple of potential ways of lowering the tipping fee, including the following:
• Obtaining a grant to lower the capital cost and associated debt burden;
• Selling a portion of the available steam to nearby commercial/industrial customers at a higher price than
what the steam would be sold for if converted to electricity;
8.1 Other Considerations
When evaluating the long term waste disposal strategy for MWA, having control of the overall disposal of the City’s waste should be something that MWA considers. There is benefit to having control of the disposal of the City’s waste in a MWA owned waste disposal facility. This benefit may justify paying a higher tipping for the waste’s disposal.
Job creation may also be considered when considering WTE. A mass burn facility described above would require approximately 65 - 70 full-time equivalent jobs to operate. Additional jobs would be created during the construction of the facility.
8.2 Recommendations
With the assistance of grants and/or a steam customer the tipping fee for a WTE facility could be lowered, however, landfilling would likely still have a lower tipping fee making it necessary to exert control of the flow of waste to make a facility financially viable. Although incentives for the development of either the WTE options or the plastics to oil facility are not apparent, if it desired to move ahead with WTE or plastics to oil facility development it is recommended that MWA continually investigates the availability of state and federal grants that could help cover a portion of the proposed facility’s capital costs.
Furthermore, MWA should create a task force that would initiate discussions with potential steam customers (e.g. sites located near commercial and industrial that have a high energy demand). These activities would help determine the viability of constructing a WTE facility.
Consideration of options of public versus private ownership to be evaluated if further project development is warranted; consideration should be given to economics, residual value, project control, risk, and financing security of ownership options.
If further project development is warranted, a site for the facility needs to be identified and thoroughly reviewed. State and local siting requirements and air permitting issues need to be assessed for an individual site; and further discussions with IDNR on the permitting requirements for the facility and the specific site need to be initiated.

Summary of Evaluation Chapter 8
Alternative Disposal Feasibility 2013 54
It would also be beneficial for members of the MWA staff to visit existing WTE or plastics to oil facilities to get a better understanding of the operation.
References Chapter 11
Alternative Disposal Feasibility 2013 55
Chapter 9 References
Iowa Department of Natural Resources. (2011). 2011 Iowa Statewide Waste Characterization Study, MSWConsultants.
Iowa Department of Natural Resources. www.iowadnr.com.
Metro Waste Authority. (2004, March) Needs Assessment, Metro Park East Landfill, HDR Engineering & Barker Lemar Engineering Consultants.
Metro Waste Authority. 2012 – 2013 Strategic Business Plan, Metro Waste Authority.

Technology Flow Charts Appendix A Technology Flow Charts
Alternative Disposal Feasibility 2013 56
Appendix A Technology Flow Charts

Technology Flow Charts Appendix A Technology Flow Charts
Alternative Disposal Feasibility 2013 57

Technology Flow Charts Appendix A Technology Flow Charts
Alternative Disposal Feasibility 2013 58

Technology Flow Charts Appendix A Technology Flow Charts
Alternative Disposal Feasibility 2013 59

Technology Flow Charts Appendix A Technology Flow Charts
Alternative Disposal Feasibility 2013 60

Technology Flow Charts Appendix A Technology Flow Charts
Alternative Disposal Feasibility 2013 61

Technology Flow Charts Appendix A Technology Flow Charts
Alternative Disposal Feasibility 2013 62

Technology Flow Charts Appendix A Technology Flow Charts
Alternative Disposal Feasibility 2013 63

Technology Flow Charts Appendix A Technology Flow Charts
Alternative Disposal Feasibility 2013 64

Capital Cost Estimates Appendix B
Alternative Disposal Feasibility 2013 65
Appendix B Capital Cost Estimates

Project: Metro Waste Authority
Estimator: JRN
Reviewer:
Date: December 2012
Estimate Basis: Conceptual
Costs: 2012$
Location: Greenfield Site
I. SITEWORK $240,000
II. SITE IMPROVEMENTS $2,600,000
III. PROCESSING EQUIPMENT $18,700,000
IV. BUILDINGS $34,700,000
V. POWER BLOCK EQUIPMENT $162,540,000
SUBTOTAL CONSTRUCTION $218,800,000
LAND ACQUISITION $225,000
DESIGN/ENGINEERING (8%) $17,500,000
CONSTRUCTION MANAGEMENT (5%) $10,900,000
PERMITTING (0.5%) $1,090,000
START UP AND TESTING (4%) $8,800,000
CONTINGENCY (20%) $43,800,000
TOTAL CAPITAL COST $301,100,000
CONCEPTUAL RDF FACILITY
CAPITAL COST ESTIMATE SUMMARY
Appendix B RDF Processing 1 of 4

Project: Metro Waste Authority
Estimator: JRN
Reviewer:
Date: December 2012
Estimate Basis: Conceptual
Costs: 2012$
Location: Greenfield Site
I. SITEWORK
Item Quantity Units Unit Price Item Cost Total
Geotechnical Services 1 LS $50,000 $50,000
Clear and Grub 1 LS $40,000 $40,000
Mobilization 1 LS $50,000 $50,000
Const. Access, Parking and Laydown 1 LS $100,000 $100,000
Subtotal I $240,000
II. SITE IMPROVEMENTS
Item Quantity Units Unit Price Item Cost Total
Earthwork
General Earthwork(1) 90,000 cy $7 $630,000
Finishing Grassing & Grading 15,000 sy $0.50 $7,500
Roadways (2) 10,560 sy $25 $264,000
Asphalt Pavement, Parking 2,000 sy $25 $50,000
Concrete pavement 533 sy $40 $21,300
Site Utilities(3)
Fire Protection Loop and Hydrants 3,000 lf $75 $225,000
Water Supply 2,000 lf $45 $90,000
Natural Gas Supply 4,000 lf $60 $240,000
Sewer System 1 LS $250,000 $250,000
Electrical 1 LS $200,000 $200,000
Site Drainage 1 LS $200,000 $200,000
Fencing 4,500 lf $15 $67,500
Landscaping 1 LS $60,000 $60,000
Truck Scales 3 EA $100,000 $300,000
Subtotal II $2,605,000
Notes:
(1) Assumes 3 FT of earthwork over 15 acres and 8 FT of fill for processing bldg
(2) 3/4 mile of 24FT wide asphalt road
(3) Utilities unit price includes excavation, bedding material, piping installed, backfill, etc.
Assumes water, electrical connection, and gas near site.
Appendix B RDF Processing 2 of 4

Project: Metro Waste Authority
Estimator: JRN
Reviewer:
Date: December 2012
Estimate Basis: Conceptual
Costs: 2012$
Location: Greenfield Site
III. PROCESSING EQUIPMENT
Item Quantity Units Unit Price Item Cost Total
Equipment Purchase 1 LS $9,000,000 $9,000,000
Equipment Installation 1 LS $7,200,000 $7,200,000
Electrical 1 LS $1,800,000 $1,800,000
Foundations 1 LS $720,000 $720,000
Subtotal III $18,720,000
Notes:
IV. BUILDINGS
Item Quantity Units Unit Price Item Cost Total
MSW Receiving Blgd 59,971 SF $150 $8,995,673
Processing Bldg 58,500 SF $180 $10,530,000
Feedstock Storage Bldg 63,598 SF $150 $9,539,731
Power Block 12,500 SF $300 $3,750,000
Turbine Bldg 6,000 SF $250 $1,500,000
Admin Bldg 2,000 SF $180 $360,000
Scale House 350 SF $200 $70,000
Subtotal IV $34,745,000
Appendix B RDF Processing 3 of 4

Project: Metro Waste Authority
Estimator: JRN
Reviewer:
Date: December 2012
Estimate Basis: Conceptual
Costs: 2012$
Location: Greenfield Site
V. POWER BLOCK EQUIPMENT
Item Quantity Units Unit Price Item Cost Total
RDF Conveyor 400 lf $3,700 $1,480,000
RDF Retrieval System 1 ls $500,000 $500,000
RDF Fired Fluidized Bed Boiler 2 ls $22,000,000 $44,000,000
Bottom Ash Handling 1 ls $2,400,000 $2,400,000
Flyash Handling/Conditioning 1 ls $1,000,000 $1,000,000
Aux Cooling Water System 1 ls $180,000 $180,000
Condensate System 1 ls $750,000 $750,000
Chem Feed 1 ls $150,000 $150,000
Circulating Water System 1 ls $500,000 $500,000
Waste Water System 1 ls $650,000 $650,000
Water Treatment 1 ls $600,000 $600,000
Fire Protection 1 ls $500,000 $500,000
Feedwater System 1 ls $400,000 $400,000
Compressed Air System 1 ls $120,000 $120,000
Service Water System 1 ls $100,000 $100,000
Steam Piping 1 ls $180,000 $180,000
Steam Turbine 1 ls $10,000,000 $10,000,000
Substation & Electrical System 1 ls $12,702,000 $12,702,000
Interconnect to Utility 1 Allowance $500,000 $500,000
AQCS(1)
2 ls $10,000,000 $20,000,000
Boiler Erection (Labor) 2 ls $17,600,000 $35,200,000
Mechanical Installation (Labor) 1 ls $15,608,000 $15,608,000
Electrical Installation (Labor) 1 ls $4,000,000 $4,000,000
Foundations 1 ls $7,740,000 $7,740,000
Rolling Stock 1 ls $2,537,000 $2,537,000
Shop Tools & Equip. 1 Allowance $200,000 $200,000
Office Furnishings 1 Allowance $40,000 $40,000
Spare Parts 1 Allowance $500,000 $500,000
Subtotal V $162,537,000
Subtotal I through V $218,847,000
Notes:
(1) Assumes SNCR system for control of NOx emissions.
Appendix B RDF Processing 4 of 4

Project: Metro Waste Authority
Estimator: JRN
Reviewer: 0
Date: December 2012
Estimate Basis: Conceptual
Costs: 2012$
Location: Greenfield Site
I. SITEWORK $240,000
II. SITE IMPROVEMENTS $1,900,000
III. PROCESSING EQUIPMENT $0
IV. BUILDINGS $17,500,000
V. POWER BLOCK EQUIPMENT $183,090,000
SUBTOTAL CONSTRUCTION $202,700,000
LAND ACQUISITION $150,000
DESIGN/ENGINEERING (8%) $16,200,000
CONSTRUCTION MANAGEMENT (5%) $10,100,000
PERMITTING (0.5%) $1,010,000
START UP AND TESTING (4%) $8,100,000
CONTINGENCY (20%) $40,500,000
TOTAL CAPITAL COST $278,800,000
CONCEPTUAL MASS BURN FACILITY
CAPITAL COST ESTIMATE SUMMARY
Appendix B Mass Burn 1 of 4

Project: Metro Waste Authority
Estimator: JRN
Reviewer: 0
Date: December 2012
Estimate Basis: Conceptual
Costs: 2012$
Location: Greenfield Site
I. SITEWORK
Item Quantity Units Unit Price Item Cost Total
Geotechnical Services 1 LS $50,000 $50,000
Clear and Grub 1 LS $40,000 $40,000
Mobilization 1 LS $50,000 $50,000
Const. Access, Parking and Laydown 1 LS $100,000 $100,000
Subtotal I $240,000
II. SITE IMPROVEMENTS
Item Quantity Units Unit Price Item Cost Total
Earthwork
General Earthwork(1) 60,000 cy $7 $420,000
Finishing Grassing & Grading 10,000 sy $0.50 $5,000
Roadways (2) 7,040 sy $25 $176,000
Asphalt Pavement, Parking 1,000 sy $25 $25,000
Concrete pavement 267 sy $40 $10,700
Site Utilities(3)
Fire Protection Loop and Hydrants 2,000 lf $75 $150,000
Water Supply 1,000 lf $45 $45,000
Natural Gas Supply 2,000 lf $60 $120,000
Sewer System 1 LS $200,000 $200,000
Electrical 1 LS $200,000 $200,000
Site Drainage 1 LS $200,000 $200,000
Fencing 2,500 lf $15 $37,500
Landscaping 1 LS $50,000 $50,000
Truck Scales 3 EA $100,000 $300,000
Subtotal II $1,939,000
Notes:
(1) Assumes 3 FT of earthwork over 10 acres and 8 FT of fill for processing bldg
(2) 1/2 mile of 24 FT wide asphalt road
(3) Utilities unit price includes excavation, bedding material, piping installed, backfill, etc.
Assumes water, electrical connection, and gas near site.
Appendix B Mass Burn 2 of 4

Project: Metro Waste Authority
Estimator: JRN
Reviewer: 0
Date: December 2012
Estimate Basis: Conceptual
Costs: 2012$
Location: Greenfield Site
III. PROCESSING EQUIPMENT
Item Quantity Units Unit Price Item Cost Total
Equipment Purchase 0 LS $0
Equipment Installation 0 LS $0
Electrical 0 LS $0
Foundations 0 LS $0
Subtotal III $0
Notes:
No shear shredder provided for bulky waste.
IV. BUILDINGS
Item Quantity Units Unit Price Item Cost Total
MSW Receiving Bldg 25,625 SF $150 $3,843,750
Storage Pit 3,919 CY $500 $1,959,259
Pit and crane bldg 12,300 SF $250 $3,075,000
Refuse Cranes 1 LS $3,000,000 $3,000,000
Power Block 12,500 SF $300 $3,750,000
Turbine Bldg 6,000 SF $250 $1,500,000
Admin Bldg 1,600 SF $180 $288,000
Scale House 350 SF $200 $70,000
Subtotal IV $17,486,000
Appendix B Mass Burn 3 of 4

Project: Metro Waste Authority
Estimator: JRN
Reviewer: 0
Date: December 2012
Estimate Basis: Conceptual
Costs: 2012$
Location: Greenfield Site
V. POWER BLOCK EQUIPMENT
Item Quantity Units Unit Price Item Cost Total
MSW fired Boiler 2 ls $28,000,000 $56,000,000
Bottom Ash Handling 1 ls $2,400,000 $2,400,000
Flyash Handling/Conditioning 1 ls $1,000,000 $1,000,000
Aux Cooling Water System 1 ls $180,000 $180,000
Condensate System 1 ls $750,000 $750,000
Chem Feed 1 ls $150,000 $150,000
Circulating Water System 1 ls $500,000 $500,000
Waste Water System 1 ls $650,000 $650,000
Water Treatment 1 ls $600,000 $600,000
Fire Protection 1 ls $500,000 $500,000
Feedwater System 1 ls $400,000 $400,000
Compressed Air System 1 ls $120,000 $120,000
Service Water System 1 ls $100,000 $100,000
Steam Piping 1 ls $180,000 $180,000
Steam Turbine 1 ls $10,000,000 $10,000,000
Substation & Electrical System 1 ls $14,706,000 $14,706,000
Interconnect to Utility 1 Allowance $500,000 $500,000
AQCS (1)
2 ls $10,000,000 $20,000,000
Boiler Erection (Labor) 2 ls $22,400,000 $44,800,000
Mechanical Installation (Labor) 1 ls $14,024,000 $14,024,000
Electrical Installation (Labor) 1 ls $4,000,000 $4,000,000
Foundations 1 ls $8,698,880 $8,698,880
Rolling Stock 1 ls $2,087,000 $2,087,000
Shop Tools & Equip. 1 Allowance $200,000 $200,000
Office Furnishings 1 Allowance $40,000 $40,000
Spare Parts 1 Allowance $500,000 $500,000
Subtotal V $183,086,000
Subtotal I through V $202,751,000
Notes:
(1) Assumes SNCR system for control of NOx emissions.
Appendix B Mass Burn 4 of 4

Project: Metro Waste Authority
Estimator: JRN
Reviewer: 0
Date: December 2012
Estimate Basis: Conceptual
Costs: 2012$
Location: Greenfield Site
I. SITEWORK $240,000
II. SITE IMPROVEMENTS $2,000,000
III. PROCESSING EQUIPMENT $0
IV. BUILDINGS $18,200,000
V. POWER BLOCK EQUIPMENT $210,520,000
SUBTOTAL CONSTRUCTION $231,000,000
LAND ACQUISITION $150,000
DESIGN/ENGINEERING (8%) $18,500,000
CONSTRUCTION MANAGEMENT (5%) $11,600,000
PERMITTING (0.5%) $1,160,000
START UP AND TESTING (4%) $9,200,000
CONTINGENCY (20%) $46,200,000
TOTAL CAPITAL COST $317,800,000
CONCEPTUAL GASIFICATION FACILITY
CAPITAL COST ESTIMATE SUMMARY
Appendix B Gasification 1 of 4

Project: Metro Waste Authority
Estimator: JRN
Reviewer: 0
Date: December 2012
Estimate Basis: Conceptual
Costs: 2012$
Location: Greenfield Site
I. SITEWORK
Item Quantity Units Unit Price Item Cost Total
Geotechnical Services 1 LS $50,000 $50,000
Clear and Grub 1 LS $40,000 $40,000
Mobilization 1 LS $50,000 $50,000
Const. Access, Parking and Laydown 1 LS $100,000 $100,000
Subtotal I $240,000
II. SITE IMPROVEMENTS
Item Quantity Units Unit Price Item Cost Total
Earthwork
General Earthwork(1) 61,000 cy $7 $427,000
Finishing Grassing & Grading 10,167 sy $0.50 $5,100
Roadways (2) 7,040 sy $25 $176,000
Asphalt Pavement, Parking 1,000 sy $25 $25,000
Concrete pavement 267 sy $40 $10,700
Site Utilities(3)
Fire Protection Loop and Hydrants 2,200 lf $75 $165,000
Water Supply 1,500 lf $45 $67,500
Natural Gas Supply 2,200 lf $60 $132,000
Sewer System 1 LS $200,000 $200,000
Electrical 1 LS $200,000 $200,000
Site Drainage 1 LS $200,000 $200,000
Fencing 2,750 lf $15 $41,300
Landscaping 1 LS $50,000 $50,000
Truck Scales 3 EA $100,000 $300,000
Subtotal II $2,000,000
Notes:
(1) Assumes 3 FT of earthwork over 10 acres and 8 FT of fill for processing bldg
(2) 1/2 mile of 24 FT wide asphalt road
(3) Utilities unit price includes excavation, bedding material, piping installed, backfill, etc.
Assumes water, electrical connection, and gas near site.
Appendix B Gasification 2 of 4

Project: Metro Waste Authority
Estimator: JRN
Reviewer: 0
Date: December 2012
Estimate Basis: Conceptual
Costs: 2012$
Location: Greenfield Site
III. PROCESSING EQUIPMENT
Item Quantity Units Unit Price Item Cost Total
Equipment Purchase 0 LS $0
Equipment Installation 0 LS $0
Electrical 0 LS $0
Foundations 0 LS $0
Subtotal III $0
Notes:
Cost estimate based on IWT technology that doesn't require processing
No shear shredder provided for bulky waste.
IV. BUILDINGS
Item Quantity Units Unit Price Item Cost Total
MSW Receiving Bldg 26,875 SF $150 $4,031,250
Storage Pit 4,141 CY $500 $2,070,370
Pit and crane bldg 12,900 SF $250 $3,225,000
Refuse Cranes 1 LS $3,000,000 $3,000,000
Power Block 13,500 SF $300 $4,050,000
Turbine Bldg 6,000 SF $250 $1,500,000
Admin Bldg 1,600 SF $180 $288,000
Scale House 350 SF $200 $70,000
Subtotal IV $18,235,000
Appendix B Gasification 3 of 4

Project: Metro Waste Authority
Estimator: JRN
Reviewer: 0
Date: December 2012
Estimate Basis: Conceptual
Costs: 2012$
Location: Greenfield Site
V. POWER BLOCK EQUIPMENT
Item Quantity Units Unit Price Item Cost Total
Gasification Unit 3 ls $22,400,000 $67,200,000
Bottom Ash Handling 1 ls $3,000,000 $3,000,000
Flyash Handling/Conditioning 1 ls $1,000,000 $1,000,000
Aux Cooling Water System 1 ls $180,000 $180,000
Condensate System 1 ls $750,000 $750,000
Chem Feed 1 ls $150,000 $150,000
Circulating Water System 1 ls $500,000 $500,000
Waste Water System 1 ls $650,000 $650,000
Water Treatment 1 ls $600,000 $600,000
Fire Protection 1 ls $500,000 $500,000
Feedwater System 1 ls $400,000 $400,000
Compressed Air System 1 ls $120,000 $120,000
Service Water System 1 ls $100,000 $100,000
Steam Piping 1 ls $180,000 $180,000
Steam Turbine 1 ls $10,000,000 $10,000,000
Substation & Electrical System 1 ls $17,066,000 $17,066,000
Interconnect to Utility 1 Allowance $500,000 $500,000
AQCS (1)
3 ls $7,500,000 $22,500,000
Boiler Erection (Labor) 3 ls $17,920,000 $53,760,000
Mechanical Installation (Labor) 1 ls $14,504,000 $14,504,000
Electrical Installation (Labor) 1 ls $4,000,000 $4,000,000
Foundations 1 ls $10,031,680 $10,031,680
Rolling Stock 1 ls $2,087,000 $2,087,000
Shop Tools & Equip. 1 Allowance $200,000 $200,000
Office Furnishings 1 Allowance $40,000 $40,000
Spare Parts 1 Allowance $500,000 $500,000
Subtotal V $210,519,000
Subtotal I through V $230,994,000
Notes:
(1) Assumes SNCR system for control of NOx emissions.
Appendix B Gasification 4 of 4
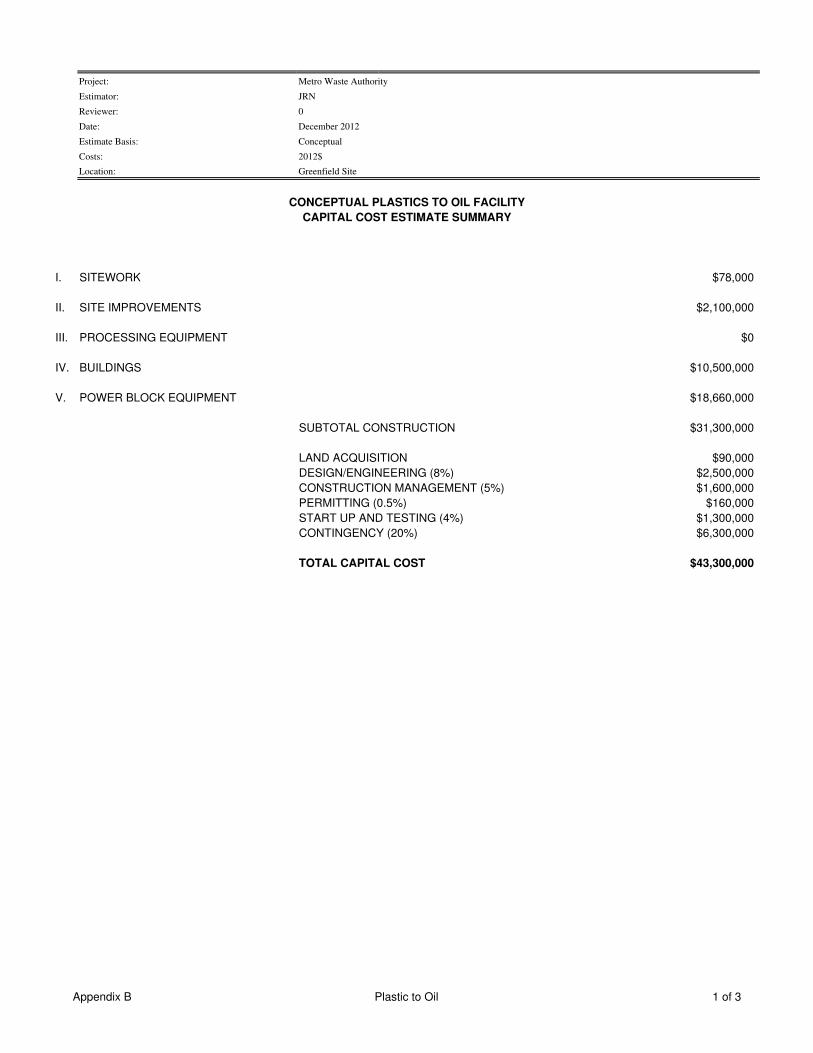
Project: Metro Waste Authority
Estimator: JRN
Reviewer: 0
Date: December 2012
Estimate Basis: Conceptual
Costs: 2012$
Location: Greenfield Site
I. SITEWORK $78,000
II. SITE IMPROVEMENTS $2,100,000
III. PROCESSING EQUIPMENT $0
IV. BUILDINGS $10,500,000
V. POWER BLOCK EQUIPMENT $18,660,000
SUBTOTAL CONSTRUCTION $31,300,000
LAND ACQUISITION $90,000
DESIGN/ENGINEERING (8%) $2,500,000
CONSTRUCTION MANAGEMENT (5%) $1,600,000
PERMITTING (0.5%) $160,000
START UP AND TESTING (4%) $1,300,000
CONTINGENCY (20%) $6,300,000
TOTAL CAPITAL COST $43,300,000
CONCEPTUAL PLASTICS TO OIL FACILITY
CAPITAL COST ESTIMATE SUMMARY
Appendix B Plastic to Oil 1 of 3

Project: Metro Waste Authority
Estimator: JRN
Reviewer: 0
Date: December 2012
Estimate Basis: Conceptual
Costs: 2012$
Location: Greenfield Site
I. SITEWORK
Item Quantity Units Unit Price Item Cost Total
Geotechnical Services 1 LS $30,000 $30,000
Clear and Grub 1 LS $12,000 $12,000
Mobilization 1 LS $30,000 $30,000
Const. Access, Parking and Laydown 1 LS $6,000 $6,000
Subtotal I $78,000
II. SITE IMPROVEMENTS
Item Quantity Units Unit Price Item Cost Total
Earthwork
General Earthwork(1) 38,000 cy $7 $266,000
Finishing Grassing & Grading 6,333 sy $0.50 $3,200
Roadways (2) 7,040 sy $25 $176,000
Asphalt Pavement, Parking 10,667 sy $25 $266,700
Concrete pavement 267 sy $40 $10,700
Site Utilities(3)
Fire Protection Loop and Hydrants 1,200 lf $75 $90,000
Water Supply 800 lf $45 $36,000
Natural Gas Supply 1,500 lf $60 $90,000
Sewer System 1 LS $120,000 $120,000
Electrical 1 LS $200,000 $200,000
Site Drainage 1 LS $120,000 $120,000
Fencing 3,000 lf $15 $45,000
Landscaping 1 LS $30,000 $30,000
Truck Scales 2 EA $100,000 $200,000
Fuel Storage Containment 1 LS $74,000 $74,000
Fuel Loadout Slab 2 EA $18,000 $36,000
Fuel Loadout Pump Skid 2 EA $150,000 $300,000
Tank Farm Fuel Piping 200 lf $200 $40,000
Subtotal II $2,104,000
Notes:
(1) Assumes 3 FT of earthwork over 6 acres and 8 FT of fill for processing bldg
(2) 1/2 mile of 24 FT wide asphalt road
(3) Utilities unit price includes excavation, bedding material, piping installed, backfill, etc.
Assumes water, electrical connection, and gas near site.
Appendix B Plastic to Oil 2 of 3

Project: Metro Waste Authority
Estimator: JRN
Reviewer: 0
Date: December 2012
Estimate Basis: Conceptual
Costs: 2012$
Location: Greenfield Site
III. PROCESSING EQUIPMENT
Item Quantity Units Unit Price Item Cost Total
Front End Processing / Sorting Equip Purchase 0 LS $9,000,000 $0
Equipment Installation 0 LS $1,800,000 $0
Electrical 0 LS $800,000 $0
Foundations 0 LS $720,000 $0
Subtotal III $0
Notes:
IV. BUILDINGS
Item Quantity Units Unit Price Item Cost Total
Plastics Receiving Blgd 31,900 SF $150 $4,785,000
Processing Bldg 30,000 SF $180 $5,400,000
Fuel Test Lab 400 SF $180 $72,000
Admin Bldg 1,200 SF $180 $216,000
Scale House 350 SF $200 $70,000
Subtotal IV $10,543,000
V. PROCESS EQUIPMENT
Item Quantity Units Unit Price Item Cost Total
Material Conveyor 50 lf $4,000 $200,000
Material Shredder 1 ls $300,000 $300,000
Plastic to Oil Processor Equipment 1 ls $15,500,000 $15,500,000
Product Storage Tanks / Related Equip 2 ea $193,000 $386,000
Fuel Testing Lab Equipment 1 Allowance $60,000 $60,000
Process Waste Handling 1 ls $100,000 $100,000
Fuel Additive Injection System 0 ls $150,000 $0
Waste Water System 1 ls $162,500 $162,500
Fire Protection 1 ls $218,000 $218,000
Compressed Air System 1 ls $30,000 $30,000
AQCS (included) 0 ls $4,500,000 $0
Equipment Erection (Labor) 1 ls $0 $0
Mechanical Installation (Labor) 1 ls $583,000 $583,000
Electrical Installation (Labor) 1 ls $200,000 $200,000
Foundations 1 ls $116,520 $116,520
Rolling Stock 1 ls $568,000 $568,000
Shop Tools & Equip. 1 Allowance $50,000 $50,000
Office Furnishings 1 Allowance $40,000 $40,000
Spare Parts 1 Allowance $150,000 $150,000
Subtotal V $18,664,000
Subtotal I through V $31,389,000
Appendix B Plastic to Oil 3 of 3

O&M Cost Estimates Appendix C
Alternative Disposal Feasibility 2013 66
Appendix C O&M Cost Estimates
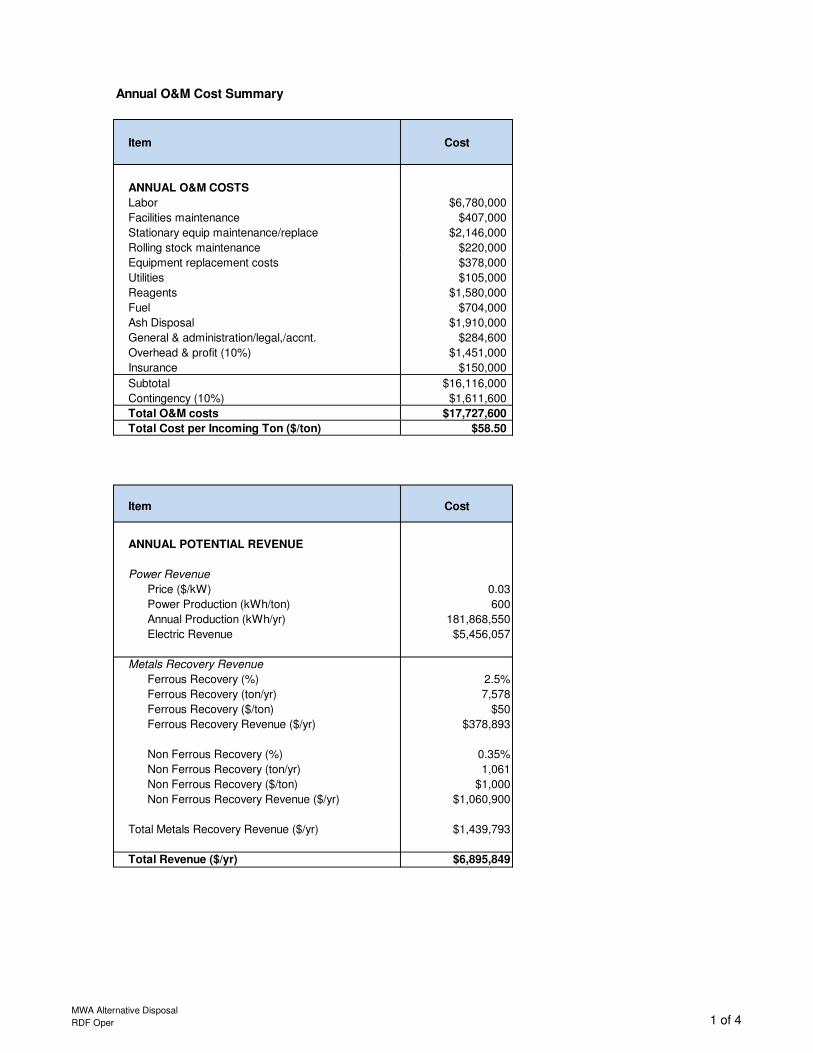
Annual O&M Cost Summary
Item Cost
ANNUAL O&M COSTS
Labor $6,780,000
Facilities maintenance $407,000
Stationary equip maintenance/replace $2,146,000
Rolling stock maintenance $220,000
Equipment replacement costs $378,000
Utilities $105,000
Reagents $1,580,000
Fuel $704,000
Ash Disposal $1,910,000
General & administration/legal,/accnt. $284,600
Overhead & profit (10%) $1,451,000
Insurance $150,000
Subtotal $16,116,000
Contingency (10%) $1,611,600
Total O&M costs $17,727,600
Total Cost per Incoming Ton ($/ton) $58.50
Item Cost
ANNUAL POTENTIAL REVENUE
Power Revenue
Price ($/kW) 0.03
Power Production (kWh/ton) 600
Annual Production (kWh/yr) 181,868,550
Electric Revenue $5,456,057
Metals Recovery Revenue
Ferrous Recovery (%) 2.5%
Ferrous Recovery (ton/yr) 7,578
Ferrous Recovery ($/ton) $50
Ferrous Recovery Revenue ($/yr) $378,893
Non Ferrous Recovery (%) 0.35%
Non Ferrous Recovery (ton/yr) 1,061
Non Ferrous Recovery ($/ton) $1,000
Non Ferrous Recovery Revenue ($/yr) $1,060,900
Total Metals Recovery Revenue ($/yr) $1,439,793
Total Revenue ($/yr) $6,895,849
MWA Alternative Disposal
RDF Oper 1 of 4

Maintenance & Fuel
STATIONARY EQUIPMENT
Total Capital Cost $107,312,000
Assume Maintenance at 2% of Capital $2,146,240
ROLLING STOCK
Item Hrs/Cost
OPS HRS per WEEK Availability
Roll-off Truck 80% 64
Loader 80% 300
Bobcat 35% 30
Forklift 50% 42
Sweeper 10% 8
Pick-up/Utility Truck 15% 14
ANNUAL MAINTENANCE COSTS $/hr
Roll-off Truck $5.00 $16,704
Loader $10.00 $156,134
Bobcat $7.00 $10,959
Forklift $8.00 $17,536
Sweeper $8.00 $3,341
Pick-up/Utility Truck $2.00 $1,461
Total Maintenance Costs $206,135
ANNUAL FUEL COSTS gal/hr
Roll-off Truck 4.0 $53,453
Loader 8.0 $499,630
Bobcat 4.0 $25,050
Forklift 6.0 $52,608
Sweeper 4.0 $6,682
Pick-up/Utility Truck 2.0 $5,843
Total Fuel Costs $643,265
RESIDUE TRAILERS
Item Quantity Cost / Yr
Miles per Year Miles
Residue Trucks 90,934
MAINTENANCE COSTS $/mile
Residue Trucks 1 0.15$ 14,003.88$
Fuel Costs $/mile
Residue Trucks 1 0.67$ 60,622.85$
Total Fuel / Maintenace Costs 75,000.00$
Assumptions:
Fuel Cost Assumptions
Res Truck Fuel econ 6 mpg
Fuel Cost 4.00$ per gal
MWA Alternative Disposal
RDF Oper 2 of 4

Labor
Hourly Hourly Hours Number Number
Personnel Rate w/o Rate w/ per of of Annual
Benefits Benefits Shift Shifts Personnel Cost
Receiving Facility
Supervisor per shift $37.00 $49.95 8 2.00 1 $207,792
Equipment operators per shift $27.00 $36.45 8 2.20 2 $333,590
Rolling stock operators per shift $22.00 $29.70 8 2.20 2 $271,814
Rolling stock operator per shift RDF Feed $22.00 $29.70 8 4.00 1 $247,104
Processing line sorters per shift $12.00 $16.20 8 2.20 2 $148,262
General laborer per shift $12.00 $16.20 8 4.00 2 $269,568
Night Cleaning and Maintenace $16.00 $21.60 8 1.10 6 $296,525
Rolling Stock and Equipment Maintenance
Mechanics per shift $29.00 $39.15 8 1.10 2 $179,150
Mechanics helper per shift $20.00 $27.00 8 1.10 1 $61,776
Electricians per shift $29.00 $39.15 8 1.10 1 $89,575
Water Treatment $29.00 $39.15 8 1.10 1 $89,575
Administration
Facility manager $45.00 $60.75 8 1.00 1 $126,360
Operations manager $37.00 $49.95 8 1.00 1 $103,896
Env Coord $37.00 $49.95 8 1.00 1 $103,896
Accounting/personnel manager $20.00 $27.00 8 1.00 1 $56,160
Secretary/receptionist $18.00 $24.30 8 1.00 1 $50,544
Power Block
Supervisor per shift $37.00 $49.95 8 4.00 1 $415,584
Mechanics per shift $29.00 $39.15 8 4.00 2 $651,456
Mechanics helper per shift $20.00 $27.00 8 4.00 2 $449,280
Electricians per shift $29.00 $39.15 8 4.00 2 $651,456
General laborer per shift $12.00 $16.20 8 4.00 2 $269,568
Operators per shift $32.00 $43.20 8 4.00 2 $718,848
Reject and Residue driver $22.00 $29.70 8 4.00 4 $988,416
Total Personnel 104 6,780,197$
(a) Labor rates include 35 percent for overhead, benefits. and worker's compensation.
(b) Facility personnel costs include no overtime.
(c) Adminstration staff works 260 days per year, 8 hours per day.
(d) Mechanics and helpers normally not available for operating shifts, 4 each on the maintenance shift; 4 total
ASSUMPTIONS:
Overhead and benefits 1.35
Overtime rate 1Administration Days/Year 260
MWA Alternative Disposal
RDF Oper 3 of 4

Utilities
Item
Annual Electric Usage (kwh)
Lighting 0
HVAC System 0
Air Compressor Electricity covered by generation
Processing Equipment 0
Total usage (kwh) 171,675Electric Usage Charge ($/kwh) $0.030
Total Electric Cost $5,000
Gas, water, sewer & telephone $100,000
Total Utility Costs $105,000
Reagents
Item Tons $/ton $/yr
Lime 3637.4 100 $363,737
Amonia 1137 1000 $1,136,678
Carbon 100.03 800 $80,022
Ash Disposal
Assumption
Cost per ton $21
Haul distance 20 miles
Percentage ask and bypass 30%
Ash and residue quantity 90934 Tons per yrDisposal Cost $1,909,620
MWA Alternative Disposal
RDF Oper 4 of 4

Annual O&M Cost Summary
Item Cost
ANNUAL O&M COSTS
Labor $4,751,000
Facilities maintenance $118,000
Stationary equip maintenance/replace $2,231,000
Rolling stock maintenance $36,000
Equipment replacement costs $293,000
Utilities $118,000
Reagents $1,580,000
Fuel $128,000
Ash Disposal $1,591,000
General & administration/legal,/accnt. $216,900
Overhead & profit (10%) $1,106,000
Insurance $150,000
Subtotal $12,319,000
Contingency (10%) $1,231,900
Total O&M costs $13,550,900
Total Cost per Incoming Ton ($/ton) $44.70
Item Cost
ANNUAL POTENTIAL REVENUE
Power Revenue
Price ($/kW) 0.03
Power Production (kWh/ton) 625
Annual Production (kWh/yr) 189,446,406
Electric Revenue $5,683,392
Metals Recovery Revenue
Ferrous Recovery (%) 2.5%
Ferrous Recovery (ton/yr) 7,578
Ferrous Recovery ($/ton) $50
Ferrous Recovery Revenue ($/yr) $378,893
Non Ferrous Recovery (%) 0.35%
Non Ferrous Recovery (ton/yr) 1,061
Non Ferrous Recovery ($/ton) $1,000
Non Ferrous Recovery Revenue ($/yr) $1,060,900
Total Metals Recovery Revenue ($/yr) $1,439,793
Total Revenue ($/yr) $7,123,185
MWA Alternative Disposal
Mass Burn Oper 1 of 4

Maintenance & Fuel
STATIONARY EQUIPMENT
Total Capital Cost $111,536,000
Assume Maintenance at 2% of Capital $2,230,720
ROLLING STOCK
Item Hrs/Cost
OPS HRS per WEEK Availability
80%
Loader 80% 38
Bobcat 10% 4
Forklift 10% 4
Sweeper 5% 2
Pick-up/Utility Truck 20% 8
ANNUAL MAINTENANCE COSTS $/hr
$5.00 $0
Loader $10.00 $19,968
Bobcat $7.00 $1,462
Forklift $8.00 $1,670
Sweeper $8.00 $835
Pick-up/Utility Truck $2.00 $835
Total Maintenance Costs $24,770
ANNUAL FUEL COSTS gal/hr
Loader 8.0 $63,898
Bobcat 4.0 $3,341
Forklift 6.0 $5,011
Sweeper 4.0 $1,670
Pick-up/Utility Truck 2.0 $3,341
Total Fuel Costs $77,261
RESIDUE TRAILERS
Item Quantity Cost / Yr
Miles per Year Miles
Residue Trucks 75,779
MAINTENANCE COSTS $/mile
Residue Trucks 1 0.15$ 11,670$
Fuel Costs $/mile
Residue Trucks 1 0.67$ 50,519$
Total Fuel / Maintenace Costs 62,000$
Assumptions:
Fuel Cost Assumptions
Res Truck Fuel econ 6 mpg
Fuel Cost 4.00$ per gal
MWA Alternative Disposal
Mass Burn Oper 2 of 4

Labor
Hourly Hourly Hours Number Number
Personnel Rate w/o Rate w/ per of of Annual
Benefits Benefits Shift Shifts Personnel Cost
Receiving Facility
Supervisor per shift $37.00 $49.95 8 1.00 0 $0
Equipment operators per shift $27.00 $36.45 8 1.10 0 $0
Rolling stock operators per shift $22.00 $29.70 8 1.10 1 $67,954
Processing line sorters per shift $12.00 $16.20 8 1.10 0 $0
General laborer per shift $12.00 $16.20 8 1.10 1 $37,066
Rolling Stock and Equipment Maintenance
Mechanics per shift $29.00 $39.15 8 1.10 1 $89,575
Mechanics helper per shift $20.00 $27.00 8 1.10 1 $61,776
Electricians per shift $29.00 $39.15 8 1.10 1 $89,575
Water Treatment $29.00 $39.15 8 1.10 1 $89,575
Administration
Facility manager $45.00 $60.75 8 1 1 $126,360
Operations manager $37.00 $49.95 8 1 1 $103,896
Env Coord $37.00 $49.95 8 1 1 $103,896
Accounting/personnel manager $20.00 $27.00 8 1 1 $56,160
Secretary/receptionist $18.00 $24.30 8 1 1 $50,544
Power Block
Supervisor per shift $37.00 $49.95 8 4.00 1 $415,584
Mechanics per shift $29.00 $39.15 8 4.00 2 $651,456
Mechanics helper per shift $20.00 $27.00 8 4.00 2 $449,280
Electricians per shift $29.00 $39.15 8 4.00 2 $651,456
General laborer per shift $12.00 $16.20 8 4.00 2 $269,568
Crane Operator $20.00 $27.00 8 4.00 1 $224,640
Operators per shift $32.00 $43.20 8 4.00 2 $718,848
Ash Truck Driver $22.00 $29.70 8 4.00 2 $494,208
Total Personnel 68 4,751,417$
(a) Labor rates include 35 percent for overhead, benefits. and worker's compensation.
(b) Facility personnel costs include no overtime.
(c) Adminstration staff works 260 days per year, 8 hours per day.
(d) Mechanics and helpers normally not available for operating shifts, 4 each on the maintenance shift; 4 total
ASSUMPTIONS:
Overhead and benefits 1.35
Overtime rate 1Administration Days/Year 260
MWA Alternative Disposal
Mass Burn Oper 3 of 4

Utilities
Item
Annual Electric Usage (kwh)
Lighting 0
HVAC System 0
Air Compressor Electricity covered by generation
Processing Equipment 0
Total usage (kwh) 599,023Electric Usage Charge ($/kwh) $0.030
Total Electric Cost $18,000
Gas, water, sewer & telephone $100,000
Total Utility Costs $118,000
Reagents
Item Tons $/ton $/yr
Lime 3637.4 100 $363,737
Amonia 1137 1000 $1,136,678
Carbon 100.03 800 $80,022
Ash Disposal
Assumption
Cost per ton $21
Haul distance 20 Miles
Percentage ash and bypass 25%
Ash and residue quantity 75779 Tons per yr
Disposal Cost $1,591,350
MWA Alternative Disposal
Mass Burn Oper 4 of 4

Annual O&M Cost Summary
Item Cost
ANNUAL O&M COSTS
Labor $4,751,000
Facilities maintenance $128,000
Stationary equip maintenance/replace $2,564,000
Rolling stock maintenance $36,000
Equipment replacement costs $293,000
Utilities $108,000
Reagents $1,580,000
Fuel $128,000
Ash Disposal $1,591,000
General & administration/legal,/accnt. $223,600
Overhead & profit (10%) $1,140,000
Insurance $150,000
Subtotal $12,693,000
Contingency (10%) $1,269,300
Total O&M costs $13,962,300
Total Cost per Incoming Ton ($/ton) $46.10
Item Cost
ANNUAL POTENTIAL REVENUE
Power Revenue
Price ($/kW) 0.03
Power Production (kWh/ton) 575
Annual Production (kWh/yr) 174,290,274
Electric Revenue $5,228,708
Metals Recovery Revenue
Ferrous Recovery (%) 2.5%
Ferrous Recovery (ton/yr) 7,578
Ferrous Recovery ($/ton) $50
Ferrous Recovery Revenue ($/yr) $378,892
Non Ferrous Recovery (%) 0.35%
Non Ferrous Recovery (ton/yr) 1,061
Non Ferrous Recovery ($/ton) $1,000
Non Ferrous Recovery Revenue ($/yr) $1,060,897
Total Metals Recovery Revenue ($/yr) $1,439,789
Total Revenue ($/yr) $6,668,497
MWA Alternative Disposal
Gasification Oper 1 of 4
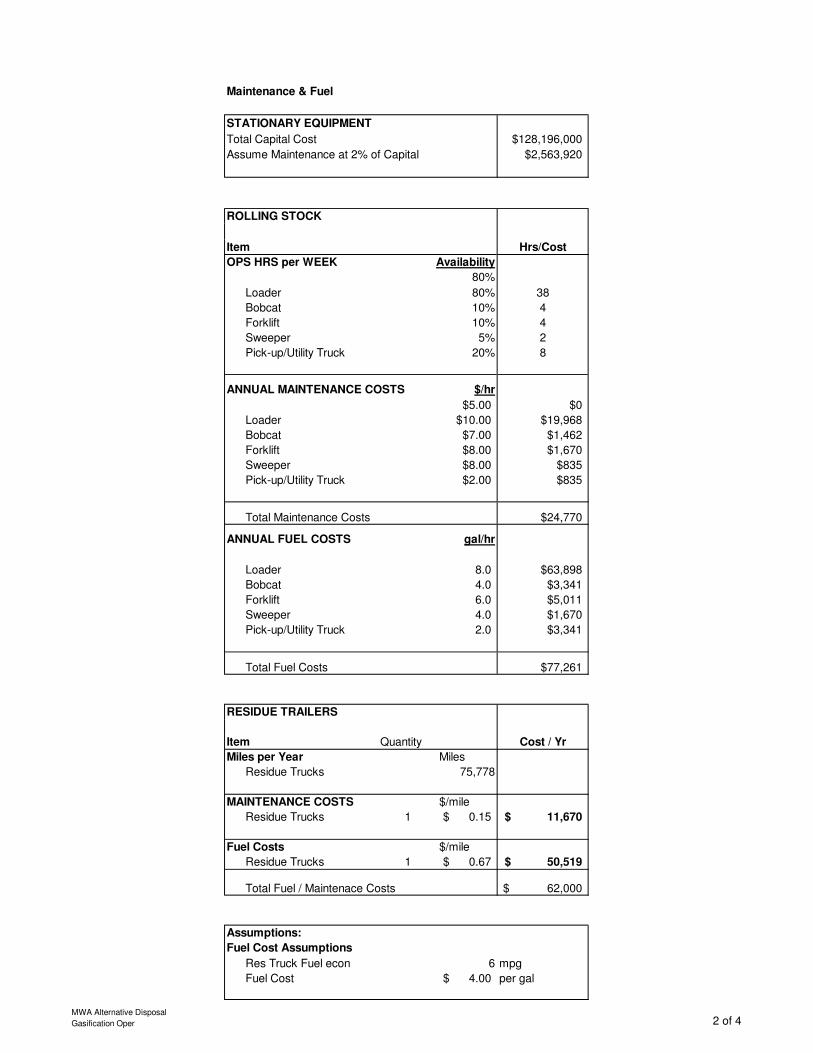
Maintenance & Fuel
STATIONARY EQUIPMENT
Total Capital Cost $128,196,000
Assume Maintenance at 2% of Capital $2,563,920
ROLLING STOCK
Item Hrs/Cost
OPS HRS per WEEK Availability
80%
Loader 80% 38
Bobcat 10% 4
Forklift 10% 4
Sweeper 5% 2
Pick-up/Utility Truck 20% 8
ANNUAL MAINTENANCE COSTS $/hr
$5.00 $0
Loader $10.00 $19,968
Bobcat $7.00 $1,462
Forklift $8.00 $1,670
Sweeper $8.00 $835
Pick-up/Utility Truck $2.00 $835
Total Maintenance Costs $24,770
ANNUAL FUEL COSTS gal/hr
Loader 8.0 $63,898
Bobcat 4.0 $3,341
Forklift 6.0 $5,011
Sweeper 4.0 $1,670
Pick-up/Utility Truck 2.0 $3,341
Total Fuel Costs $77,261
RESIDUE TRAILERS
Item Quantity Cost / Yr
Miles per Year Miles
Residue Trucks 75,778
MAINTENANCE COSTS $/mile
Residue Trucks 1 0.15$ 11,670$
Fuel Costs $/mile
Residue Trucks 1 0.67$ 50,519$
Total Fuel / Maintenace Costs 62,000$
Assumptions:
Fuel Cost Assumptions
Res Truck Fuel econ 6 mpg
Fuel Cost 4.00$ per gal
MWA Alternative Disposal
Gasification Oper 2 of 4

Labor
Hourly Hourly Hours Number Number
Personnel Rate w/o Rate w/ per of of Annual
Benefits Benefits Shift Shifts Personnel Cost
Receiving Facility
Supervisor per shift $37.00 $49.95 8 1.00 0 $0
Equipment operators per shift $27.00 $36.45 8 1.10 0 $0
Rolling stock operators per shift $22.00 $29.70 8 1.10 1 $67,954
Processing line sorters per shift $12.00 $16.20 8 1.10 0 $0
General laborer per shift $12.00 $16.20 8 1.10 1 $37,066
Rolling Stock and Equipment Maintenance
Mechanics per shift $29.00 $39.15 8 1.10 1 $89,575
Mechanics helper per shift $20.00 $27.00 8 1.10 1 $61,776
Electricians per shift $29.00 $39.15 8 1.10 1 $89,575
Water Treatment $29.00 $39.15 8 1.10 1 $89,575
Administration
Facility manager $45.00 $60.75 8 1.00 1 $126,360
Operations manager $37.00 $49.95 8 1.00 1 $103,896
Env Coord $37.00 $49.95 8 1.00 1 $103,896
Accounting/personnel manager $20.00 $27.00 8 1.00 1 $56,160
Secretary/receptionist $18.00 $24.30 8 1.00 1 $50,544
Power Block
Supervisor per shift $37.00 $49.95 8 4.00 1 $415,584
Mechanics per shift $29.00 $39.15 8 4.00 2 $651,456
Mechanics helper per shift $20.00 $27.00 8 4.00 2 $449,280
Electricians per shift $29.00 $39.15 8 4.00 2 $651,456
General laborer per shift $12.00 $16.20 8 4.00 2 $269,568
Crane Operator $20.00 $27.00 8 4.00 1 $224,640
Operators per shift $32.00 $43.20 8 4.00 2 $718,848
Ash Truck Driver $22.00 $29.70 8 4.00 2 $494,208
Total Personnel 68 4,751,417$
(a) Labor rates include 35 percent for overhead, benefits. and worker's compensation.
(b) Facility personnel costs include no overtime.
(c) Adminstration staff works 260 days per year, 8 hours per day.
(d) Mechanics and helpers normally not available for operating shifts, 4 each on the maintenance shift; 4 total
ASSUMPTIONS:
Overhead and benefits 1.35
Overtime rate 1Administration Days/Year 260
MWA Alternative Disposal
Gasification Oper 3 of 4
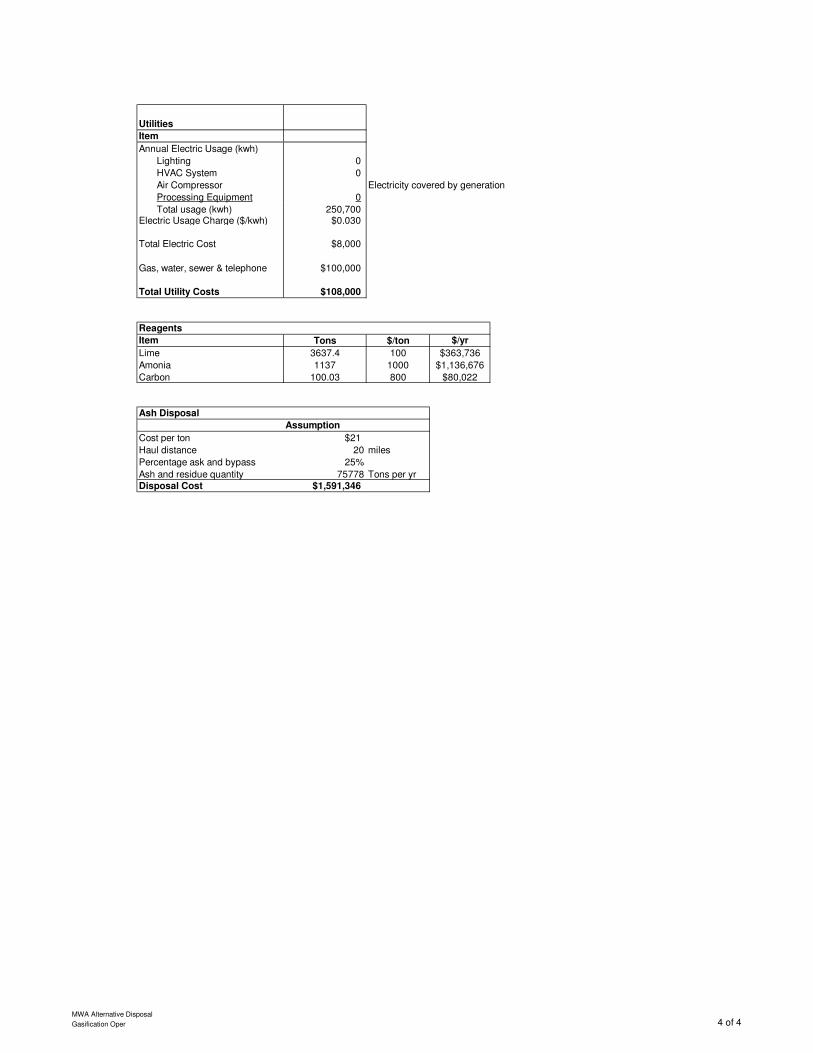
Utilities
Item
Annual Electric Usage (kwh)
Lighting 0
HVAC System 0
Air Compressor Electricity covered by generation
Processing Equipment 0
Total usage (kwh) 250,700Electric Usage Charge ($/kwh) $0.030
Total Electric Cost $8,000
Gas, water, sewer & telephone $100,000
Total Utility Costs $108,000
Reagents
Item Tons $/ton $/yr
Lime 3637.4 100 $363,736
Amonia 1137 1000 $1,136,676
Carbon 100.03 800 $80,022
Ash Disposal
Assumption
Cost per ton $21
Haul distance 20 miles
Percentage ask and bypass 25%
Ash and residue quantity 75778 Tons per yrDisposal Cost $1,591,346
MWA Alternative Disposal
Gasification Oper 4 of 4

Annual O&M Cost Summary
Item Cost
ANNUAL O&M COSTS
Labor $2,314,000
Facilities maintenance $128,000
Stationary equip maintenance/replace $352,000
Rolling stock maintenance $17,000
Equipment replacement costs $81,000
Utilities $161,000
Reagents $13,000
Fuel & Oil Haul $352,000
Ash Disposal $76,000
General & administration/legal,/accnt. $69,900
Overhead & profit (10%) $356,000
Insurance $75,000
Subtotal $3,995,000
Contingency (10%) $399,500
Total O&M costs $4,394,500
Total Cost per Oil Produced ($/Barrel) $79.30
Note:
Assumes no cost for plastic feedstock delivered to site.
Item Cost
ANNUAL POTENTIAL REVENUE
Oil Revenue
Price ($/barrel) 100
Oil Production (lbs plastic / gallon) 9.5
Annual Production (barrels / yr) 55,436
Oil Revenue $5,543,609
Total Revenue ($/yr) $5,543,609
MWA - Alternative Disposal Plastic to Oil Oper 1 of 4

Maintenance & Fuel
STATIONARY EQUIPMENT
Total Capital Cost $17,606,500
Assume Maintenance at 2% of Capital $352,130
ROLLING STOCK
Item Hrs/Cost
OPS HRS per WEEK Availability
80%
Loader 80% 32
Bobcat 10% 0
Forklift 10% 4
Sweeper 5% 0
Pick-up/Utility Truck 20% 8
ANNUAL MAINTENANCE COSTS $/hr
$5.00 $0
Loader $8.00 $13,312
Bobcat $7.00 $0
Forklift $8.00 $1,670
Sweeper $8.00 $0
Pick-up/Utility Truck $2.00 $835
Total Maintenance Costs $15,818
ANNUAL FUEL COSTS gal/hr
Loader 7.0 $46,592
Bobcat 4.0 $0
Forklift 6.0 $5,011
Sweeper 4.0 $0
Pick-up/Utility Truck 2.0 $3,341
Total Fuel Costs $54,944
RESIDUE TRAILERS
Item Quantity Cost / Yr
Miles per Year Miles
Residue Trucks 6,018
MAINTENANCE COSTS $/mile
Residue Trucks 1 0.15$ 927$
Fuel Costs $/mile
Residue Trucks 1 0.57$ 3,439$
Total Fuel / Maintenace Costs 4,000$
Assumptions:
Fuel Cost Assumptions
Res Truck Fuel econ 7 mpg
Fuel Cost 4.00$ per gal
MWA Alternative Disposal Plastics to Oil Oper 2 of 4
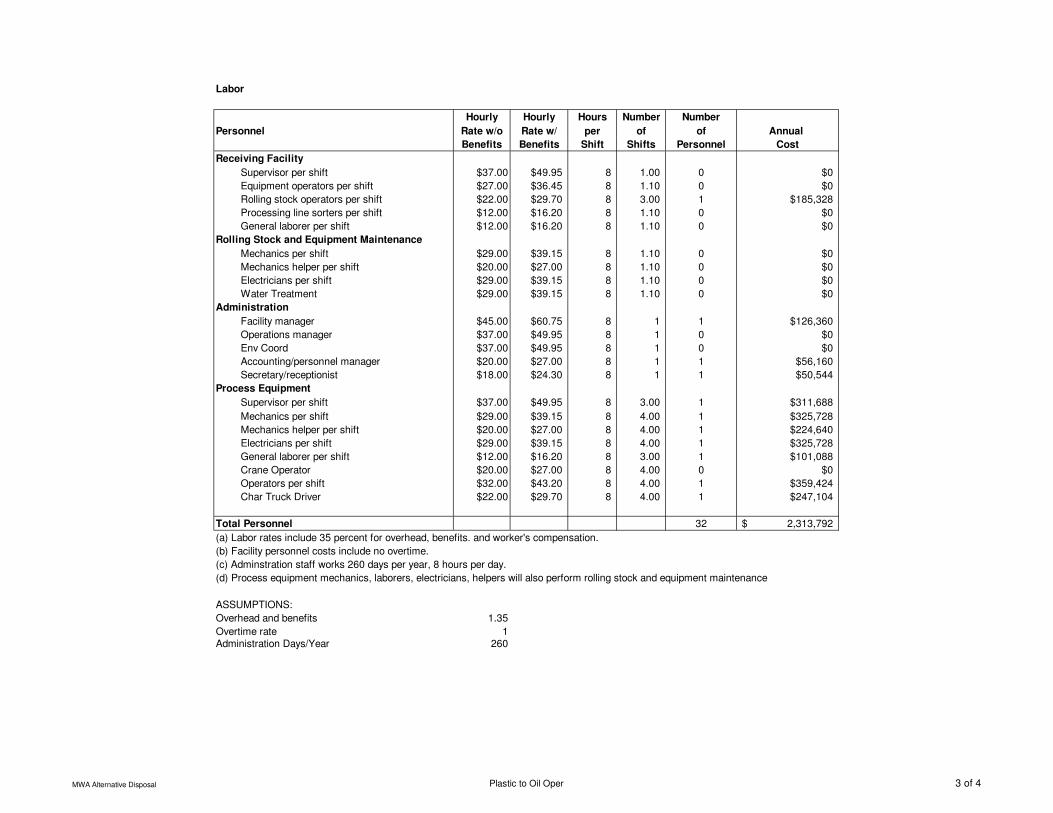
Labor
Hourly Hourly Hours Number Number
Personnel Rate w/o Rate w/ per of of Annual
Benefits Benefits Shift Shifts Personnel Cost
Receiving Facility
Supervisor per shift $37.00 $49.95 8 1.00 0 $0
Equipment operators per shift $27.00 $36.45 8 1.10 0 $0
Rolling stock operators per shift $22.00 $29.70 8 3.00 1 $185,328
Processing line sorters per shift $12.00 $16.20 8 1.10 0 $0
General laborer per shift $12.00 $16.20 8 1.10 0 $0
Rolling Stock and Equipment Maintenance
Mechanics per shift $29.00 $39.15 8 1.10 0 $0
Mechanics helper per shift $20.00 $27.00 8 1.10 0 $0
Electricians per shift $29.00 $39.15 8 1.10 0 $0
Water Treatment $29.00 $39.15 8 1.10 0 $0
Administration
Facility manager $45.00 $60.75 8 1 1 $126,360
Operations manager $37.00 $49.95 8 1 0 $0
Env Coord $37.00 $49.95 8 1 0 $0
Accounting/personnel manager $20.00 $27.00 8 1 1 $56,160
Secretary/receptionist $18.00 $24.30 8 1 1 $50,544
Process Equipment
Supervisor per shift $37.00 $49.95 8 3.00 1 $311,688
Mechanics per shift $29.00 $39.15 8 4.00 1 $325,728
Mechanics helper per shift $20.00 $27.00 8 4.00 1 $224,640
Electricians per shift $29.00 $39.15 8 4.00 1 $325,728
General laborer per shift $12.00 $16.20 8 3.00 1 $101,088
Crane Operator $20.00 $27.00 8 4.00 0 $0
Operators per shift $32.00 $43.20 8 4.00 1 $359,424
Char Truck Driver $22.00 $29.70 8 4.00 1 $247,104
Total Personnel 32 2,313,792$
(a) Labor rates include 35 percent for overhead, benefits. and worker's compensation.
(b) Facility personnel costs include no overtime.
(c) Adminstration staff works 260 days per year, 8 hours per day.
(d) Process equipment mechanics, laborers, electricians, helpers will also perform rolling stock and equipment maintenance
ASSUMPTIONS:
Overhead and benefits 1.35
Overtime rate 1Administration Days/Year 260
MWA Alternative Disposal Plastic to Oil Oper 3 of 4

Utilities
Item
Annual Electric Usage (kwh)
Lighting 0
HVAC System 0
Air Compressor
Processing Equipment 0
Total usage (kwh) 2,508,415Electric Usage Charge ($/kwh) $0.030
Total Electric Cost $75,000
Water, sewer & telephone $10,000
Natural Gas Charge ($/DTH) $2.7
Total Natural Gas Cost ($/yr) $75,647
Total Utility Costs $160,647
Reagents
Item Tons $/ton $/yr
Lime 132.7 100 $13,271
Amonia 0 600 $0
Carbon 0.00 800 $0
Char Disposal
Assumption
Cost per ton $21
Haul distance 20 miles
Percent rejects 15%
Percentage ask and bypass 15%
Char and residue quantity 3611 Tons per yrDisposal Cost $75,823
MWA Alternative Disposal Plastic to Oil Oper 4 of 4