alternative frameworks for insurance prison break · alternative frameworks for insurance ......
TRANSCRIPT
Martin F. Grace and Robert W. KleinSeptember 2009
Alternative Frameworks for InsuranceRegulation in the United States
Martin F. Grace and Robert W. KleinSeptember 2009
Alternative Frameworks for InsuranceRegulation in the United States
Prison BreakA New Approach to Public Cost and Safety
Simon Hakim, Research Fellow, The Independent InstituteProfessor of Economics and Director of the Center for Competitive Government,
Temple University
and
Erwin A. Blackstone, Research Fellow, The Independent Institute
Professor of Economics, Temple University
June 2014
Independent Policy Reports are published by The Independent Institute, a nonprofit, nonpartisan, scholarly research and educational organization that sponsors comprehensive studies on the political economy of critical social and economic issues. Nothing herein should be construed as necessarily reflecting the views of The Independent Institute or as an attempt to aid or hinder the passage of any bill before Congress.
Copyright © 2014 by The Independent InstituteAll rights reserved. No part of this report may be reproduced or transmitted in any form by electronic or mechanical means now known or to be invented, including photocopying, recording, or infor-mation storage and retrieval systems, without permission in writing from the publisher, except by a reviewer who may quote brief passages in a review.
The Independent Institute 100 Swan Way, Oakland, CA 94621-1428 Telephone: 510-632-1366 · Fax: 510-568-6040 Email: [email protected] Website: www.independent.org
ISBN 13: 978-1-59813-132-1
Contents
Executive Summary 3
Introduction 5
1. History of the Contract Prison Industry 6
2. Previous Studies on Cost and Performance of Public and Contract Prisons 9
3. The Structure of the Contract Prison Industry 16
4. A Model for Estimating the State’s Avoidable Costs 21
5. Direct Avoidable Costs for Public Prisons 23
6. Indirect Avoidable Costs for Public Prisons 24
7. Monitoring Costs 25
8. Capital and Finance Costs 25
9. Capital Flexibility Gained by Use of Contractor-Operated Prisons 27
10. Non-Cost Performance Measures 27
11. Unaccounted Cost and Benefits of Contract Prisons 28
12. A General Discussion of Individual State Costs and Performance 29
13. A General Discussion of Public Costs and Private Prices 41
14. Conclusions 49
Appendix 1: Data Sources for the Table on State Costs, Contract Prices, and Savings 54
Appendix 2: Avoidable Costs for Three Cases 58
Appendix 3: State Costs and Private Contractor Prices (Per Inmate Per Day) 60
References 65
Acknowledgements 70
About the Authors 71
The authors of the study were partially funded by members of the private corrections industry. No other funding was provided.


| 3Cost Analysis of Public and Contractor-Operated Prisons
Executive Summary
Considerable debate continues among state offi-cials, criminal justice experts, and the media about whether contract prisons provide sufficient savings and perform adequately to justify their use. This Independent Policy Report is designed to examine the evidence using publicly available state corrections cost data as the primary source.
How should analysts attempt to estimate the cost savings resulting from using contract prisons? We use economic models with state and some federal cost data to determine each state’s avoidable costs, which are the overall costs the state no longer incurs when using private contractors. We then compare the avoidable costs against the per-diem charges of the private prison operator. In cases where the private operator manages a state prison, avoidable costs include short-run costs, which are those costs incurred as a result of the day-to-day operation of a correctional facility. In situations where overcrowding exists or the state correctional institutions require significant modernization or re-placement, long-run costs, which are the short-run op-erating costs plus the capital costs associated with the financing, planning, and construction or rehabilitation of a facility, are appropriate. Our study considers all avoidable costs, including indirect costs such as under-funded pension and retiree health care costs, both of which are often ignored in other research in this area.
We analyzed individual states to understand the role of and issues associated with the use of contract prisons. We also conducted interviews with state
corrections officials and legislative oversight analysts were also conducted to provide an additional depth of understanding to this analysis.
There are three reasons for the use of contract pris-ons: (1) to generate cost savings and avoid large capital expenditures; (2) to relieve overcrowding, whether or-dered by the court system or required because of threat of litigation perceived by departments of correction (DOCs); and (3) the sale of a state prison to private operators for budgetary reasons. (See Appendix 2 for a chart of appropriate costs to consider for each situation.)
In reference to the first reason for the use of contract prisons, cost savings and avoidance of large capital expenditures, statutory requirements in some states mandate savings of at least 5 to 10 percent in order to contract out to private operators. States, however, are inconsistent in how they measure these savings and often fail to include important avoidable costs. In particular, there is ambiguity in the categories states use for their calculations and the measurements of the state costs that should be considered for the savings required from the private operators. The states usually do not specify whether the short- or long-run costs are considered. Also, often, avoidable state prison costs are imposed on other agencies within DOCs and on other departments of state government. These costs are therefore not included in the state’s calculations of cost per inmate per day. Clearly, these omissions estab-lish artificially lower costs for state-run prisons. This report includes some of these often-omitted costs, provided that the sources are from state government and/or academic reports and articles.
Prison BreakA New Approach to Public Cost and Safety
By Simon Hakim and Erwin A. Blackstone
3
the independent institute4 |
The savings required of private prison contracts by statute are as follows: Florida (7 percent), Kentucky (10 percent), Mississippi (10 percent), Ohio (5 percent), and Texas (10 percent). The statutory requirements apply both to contractor-operated, state-owned prisons and facilities that are contractor-owned and operated. In cases like Florida and Mississippi, the contractor manages state-owned prisons. Thus, short-run avoidable costs are relevant. In Kentucky and Oklahoma, the inmates are transferred to privately owned prisons. Thus, long-run avoidable costs are relevant. Texas uses both types of contract prisons. Thus, short-run avoidable costs are relevant when state-owned prisons are used, and long-run costs are appropriate when private prisons are used.
The relief of overcrowding is the second major reason for the use of private prisons and includes both out-of-state transfer of inmates and in-state use of private facilities. In California, for example, the courts required a timely reduction of overcrowding, which led directly to the use of out-of-state contract prisons, as California does not allow private facilities to be built within its borders for state use. Other examined states that have experienced overcrowding are Arizona, Kentucky, Ohio, Oklahoma, Tennessee, and Texas.
Whenever overcrowding exists, the statutory savings requirement is less relevant since the over-crowding must be alleviated in a timely fashion for the security and well-being of both inmates and staff. California is a classic example of the cost encountered in not avoiding substantial overcrowding. Over-crowding requires that the long-run avoidable costs be compared against the contractor’s price. The long-run consideration is also relevant when the state owns old prisons that need major renovations or prisons that are subject to demolition because of age or condition, or when the state faces difficulties in raising capital.
Finally, contracting out by selling a state prison to a private operator generates an immediate lump sum amount for state coffers. This occurred in Ohio, which sold the Lake Erie Correctional Institution to a private contractor to narrow a state budgetary deficit.
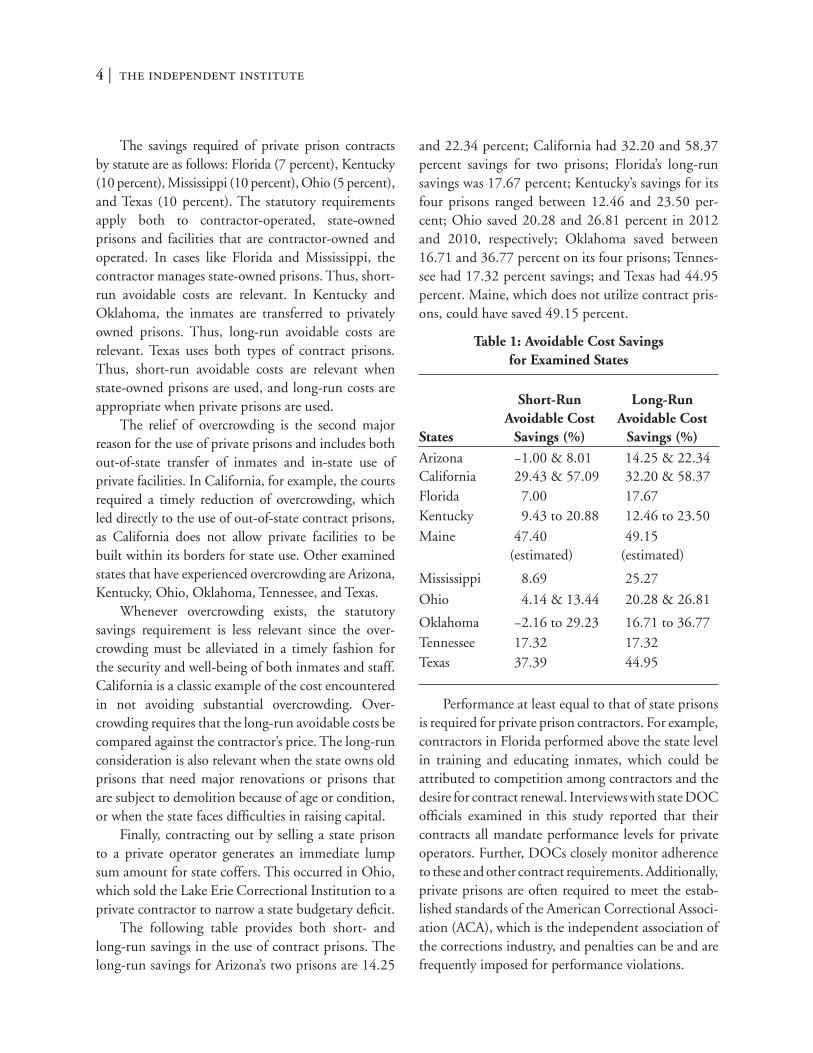
The following table provides both short- and long-run savings in the use of contract prisons. The long-run savings for Arizona’s two prisons are 14.25
and 22.34 percent; California had 32.20 and 58.37 percent savings for two prisons; Florida’s long-run savings was 17.67 percent; Kentucky’s savings for its four prisons ranged between 12.46 and 23.50 per-cent; Ohio saved 20.28 and 26.81 percent in 2012 and 2010, respectively; Oklahoma saved between 16.71 and 36.77 percent on its four prisons; Tennes-see had 17.32 percent savings; and Texas had 44.95 percent. Maine, which does not utilize contract pris-ons, could have saved 49.15 percent.
Table 1: Avoidable Cost Savings for Examined States
States
Short-Run Avoidable Cost
Savings (%)
Long-Run Avoidable Cost
Savings (%)
Arizona −1.00 & 8.01 14.25 & 22.34California 29.43 & 57.09 32.20 & 58.37Florida 7.00 17.67Kentucky 9.43 to 20.88 12.46 to 23.50
Maine 47.40 (estimated)
49.15 (estimated)
Mississippi 8.69 25.27
Ohio 4.14 & 13.44 20.28 & 26.81
Oklahoma −2.16 to 29.23 16.71 to 36.77Tennessee 17.32 17.32Texas 37.39 44.95
Performance at least equal to that of state prisons is required for private prison contractors. For example, contractors in Florida performed above the state level in training and educating inmates, which could be attributed to competition among contractors and the desire for contract renewal. Interviews with state DOC officials examined in this study reported that their contracts all mandate performance levels for private operators. Further, DOCs closely monitor adherence to these and other contract requirements. Additionally, private prisons are often required to meet the estab-lished standards of the American Correctional Associ-ation (ACA), which is the independent association of the corrections industry, and penalties can be and are frequently imposed for performance violations.
| 5Prison Break: A New Approach to Public Cost and Safety
A major finding from the cost analysis and interviews with state leaders and stakeholders is that competition yields savings and better performance across the prison industry. The economics of industrial organization demonstrates the important benefits derived from the presence of even a small competitor in an otherwise monopolistic market. In this case, even though private contractors comprise less than 7 percent of the industry, they have generated substantial competitive benefits.
These benefits emanate from two sources. First, as more contractors compete, the prices are lower, and the performance is better. Likewise, when private prisons become an available option, efforts are made by public prison managers to lower costs, and demands by em-ployees are constrained, since public employees realize that the legislature might favor private corrections as a more cost-effective option. Further, the greater the competition, the more managerial and technological innovations are introduced in both the public and private segments of the industry. Interestingly, the au-thors found that in several states where both public and private contract prisons operate, there was cooperation, mutual learning of new technologies, joint training, and adoption of efficient management practices.
Our study points to a possible moderate change that could be implemented to encourage even greater competition and thereby achieve more efficient deliv-ery of existing corrections services, which is the model of managed competition. This model was originally initiated by Mayor Stephen Goldsmith of Indianap-olis, Indiana, and encouraged public workers to par-ticipate in the bidding for their services, along with private competitors, to preserve their municipal jobs. Mayor Goldsmith initiated the “yellow pages” test where he enabled contracting out of all city services whenever several providers were listed. But, he went one step further and allowed city employees to com-pete. By so doing, public employees, as well as private contractors, had an incentive to search for managerial and technological innovations and offer their services at competitive prices.
Adopting managed competition also has impli-cations for the current statutory savings requirements. Where they are required, state legislators have established
seemingly arbitrary levels of required savings of 5, 7, and 10 percent. It is not clear why the percentages differ or what the basis is for these numbers. The bidding by con-tractors often just approaches the statutory requirement and, indeed, high percentage savings may discourage some bidders and be counterproductive. It would be more effective to allow competition to determine the price. By instituting managed competition where the public sector competes on a level field with the private sector, the market determines the savings. In such a case, the complicated calculations of what cost items should be considered as avoidable costs and how to measure these costs becomes unnecessary. Managed competition has worked for many local public services, and there is no reason why it cannot be successfully implemented in the prison industry. Our suggested managed competition model is relevant for managing existing state prisons.
As can be seen from this study, public and private competition and cooperation in the provision of prison services has worked in terms of cost savings and perfor-mance measures. Indeed, public-private competition and cooperation could even be extended to further these fiscally responsible goals.
Introduction
Considerable debate continues among state officials, criminal justice experts, and the media about whether contract prisons provide sufficient savings and per-form adequately to justify their use. This research is designed to examine the evidence using federal and state cost data and interviews with state officials as the primary sources. This study uses economic models to determine each state’s avoidable cost, which is then compared against the per-diem charge of the private operator. When a contractor manages a state prison, avoidable cost includes only short-run costs. Long-run costs are appropriate when overcrowding exists, when a public prison is acquired and managed by a contractor, or when a contractor is required to pay for capital outlays.
This research considers all avoidable costs includ-ing indirect costs and frequently ignored underfunded pension and retiree healthcare costs, both of which are
the independent institute6 |
often left out of research in this area. Individual states were analyzed to provide a more complete understand-ing of the role of and issues associated with use of private prisons. Interviews with state corrections officials and legislative oversight analysts were conducted to provide an additional depth of understanding to this analysis. Detailed calculations were provided and savings were determined using all of these data resources.
Statutory requirements in some states mandate sav-ings of at least 5 to 10 percent compared to state costs in order to contract out to private operators. States, how-ever, are inconsistent in how they measure these savings. In particular, there is ambiguity in the categories states use for their calculations and the measurements of the state costs that should be considered for the savings required from the private operators. When contractors manage an existing state prison, the short-term costs are relevant. When inmates are transferred to the contrac-tor’s prison while no other state prison cells are available, the long-term costs are appropriate.
Data published by government or provided by government leaders were used for this research, and the source for each item is provided in Appendix 1 to this report. The data were collected between 2012 and 2014. We believe that this exhaustive, multi-source examination on the costs of state prisons could help alleviate some of the ambiguity on this subject.
It is important to note that this research does not address any issues with relation to enforcement of laws or sentencing policy. For example, Benson (2003) argues that contracting out prisons could lead to decreased incarceration costs and, therefore, will encourage states and the court system to enact tougher sentencing policies and reduce early release for good behavior. These issues are not the focus of this work, which deals strictly with costs and performance of prisons. Further, anecdotally there was no observable data or information that supports this argument. To the contrary, states where contracting for correctional services is in place have and are pursuing a variety of alternatives to incarceration, including sentencing reform, community-based corrections, and reentry programs. It’s also worth noting that private operators are partnering with government agencies to provide such services.
Sections 5 and 6 discuss the concept of avoid-able cost and how it varies according to the reason for using contract prisons. These sections detail the avoidable direct, indirect, and miscellaneous cost items presented in Table Appendix 3.1, as well as the long-term avoidable cost, which includes the capital and financing costs for state prisons. When evaluat-ing whether private prisons are socially beneficial, the analysis continues with nonmonetary variables like the flexibility provided by private prisons and the performance or outcomes of both public and private prisons. For this analysis, the authors also incorporated in qualitative terms some tax considerations, as well as the costs and service considerations of overcrowding. The study concludes with some recommendations to improve the productivity and cost savings in the prison industry that are based on economic theory and empirical findings in industrial organization.
1 | History of the Contract Prison Industry
Even prior to the founding of this country, correc-tions systems in the United States were operated by private entities. Until the late eighteenth century, long-term imprisonment was somewhat rare. The usual punishment was death by hanging, whipping, banishment, or branding, among other corporal and social punishments.
Counties appointed jailors, and those jailors earned income from charging inmates for their food and lodging, as well as charging the county for oper-ating the jail. Sometimes the inmates were assigned to work in order to pay for their costs. Many of the inmates were held as debtors, and their work proceeds were also used to pay their debts. The jailor, who was often also the sheriff, operated in effect the first contract jail and enjoyed monopolistic power in each county (McCrie, 1993). In addition to rarely being used for long-term confinement, jails had no rehabil-itation attributes.
This early “model” of the jailor is of an unregu-lated, local monopolist that invited corruption and abuse of power. The county provided the jailors that monopolistic power. This enabled the jailors to charge prisoners for the services they received while in jail. In
| 7Prison Break: A New Approach to Public Cost and Safety
economic terms, the jailors charged inmates different prices according to their ability to pay. This is a classic case of a monopoly practicing price discrimination, which could maximize the profits of the jailors in the absence of government regulation of price or perfor-mance. Indeed, the jailors allowed rich inmates to enjoy greater privileges that poor inmates could not afford. Not surprisingly, abuse was common. There was no segregation by gender and age, the jails were highly overcrowded and unsanitary, and bribing the jailors was common. Escapes, too, were frequent (Shichor, 1995, p. 25).
All through the nineteenth century, incarcera-tion periods were extended for both deterrence and retribution reasons. Further, prisons were eventually perceived as profit units and even owned their own farms. For example, the Huntsville, TX, prison oper-ated its own cotton mill beginning in 1854. Prisoners were expected to generate a profit for the institution, at least covering their own way (McCrie, 1993).
In 1790, the first penitentiary was opened on Walnut Street in Philadelphia. It was originally built as a city jail in 1773 to alleviate overcrowding in the existing facility where criminals were held for short periods. The original building was U-shaped with large rooms holding groups of inmates. The Quakers of Philadelphia, however, developed the new concept of a penitentiary where rehabilitation of criminals became the goal. In the courtyard of the original complex, small cells with high windows were introduced. These were built to hold individual inmates so that no eye contact with other prisoners or the outside world was possible. The goal was for inmates to reflect and be remorseful about their crimes. The Quakers also believed that solitary confinement for the entire prison term would yield rehabilitation. For this reason, inmates were not allowed to work because it was believed labor helped them avoid quiet reflection about their deeds.
The Quaker concept of the penitentiary spread to other locations in Pennsylvania including Pittsburgh and the Eastern State Penitentiary (Cherry Hill) in eastern Philadelphia in 1821, as well as to New Jersey’s Trenton State Prison that same year. Based on Quaker teachings, inmates were kept in solitary confinement, which led to severe psychological problems and even
suicides. Later, inmates were required to work, mainly in textiles, in an effort to transform criminal behavior. Inmates were compensated for their work, out of which they paid for their upkeep and were allowed to keep the rest (McCrie, 1993, p. 24; Shichor, 1995, p. 27). The Quaker approach to inmates added for the first time the “correctional” or rehabilitative aspect to incarceration.
The penitentiary concept, including the work requirement, also spread to the state of New York. In 1797, the Newgate penitentiary was created in New York City where inmates were paid for their work and were still required to pay for their upkeep. The intent was not only to reform the inmates but also to help defray the operational costs of the prison. An interest-ing innovation initiated in Newgate was that inmates were provided a share of the profits upon their release as a reward for good behavior.
In 1819, a third penitentiary was opened in Au-burn, NY, where the solitude system was maintained, but inmates worked and ate together. Both the New York prisons contracted out prison labor to compa-nies, and their work was conducted either within the prison or elsewhere. This contracting out of prisoners was quite profitable to the state. With the Walnut Street Philadelphia prison and the two New York facilities, state government for the first time took over the operation of prisons.
The year 1825 ushered in a new era in the man-agement of corrections. At that time the Frankfort prison in Kentucky was incurring losses even though inmates were leased to businesses for in-prison pro-duction. A local businessman offered to operate the prison and use the inmates for work. He was offered a five-year contract in exchange for annual payment of $1,000. He found the prison to have insufficient security, so the businessman built a new 250-cell prison and paid the state the required $1,000 yearly resulting in the country’s first contract prison. The arrangement was similar to the current Build- Operate-Transfer (BOT) model where the private sector builds the prison, operates it, and after a period of time, transfers the ownership to the state. However, in the Frankfort case, there was no clear transfer of owner-ship to the state. The BOT concept will be discussed further at the end of this section.
the independent institute8 |
Since 1825, essentially all states relied on convict labor and some states even contracted out entire prisons. Following the Kentucky example, Alabama contracted out the management of an existing prison in 1846, and Louisiana also leased a prison for five years for $50,000 annually. Leasing of inmates to the private sector lasted until the end of the nineteenth century, and the contract prisons of this era ceased to exist in the beginning of the twentieth century (Shichor, 1995: 34–42).
The challenges with privatized prisons and public prisons at the turn of the twentieth century included abuse of leased inmates by both the private employers and the prison guards, lack of sufficient healthcare and food, and overwork. There were several reasons for these problematic conditions and outcomes. First, there was insufficient legal protection for inmates and news media provided little exposure to the injustice and abuse. There was also no organized oversight of prisons or the prison industry and no national standards of best practice. A key element for the lack of power held by inmates and the abuse by employers and guards was their absolute monopolistic power. Prisoner labor was the primary motivation for contract prisons. Not uncom-monly, prison contracts were awarded with no apparent competition for contracts or expertise in recommended correctional practice (Shichor, 1995: 41–42).
Prisoner abuse and the growing recognition of the importance of rehabilitation led state governments in the early twentieth century to reassert control of the prisons. However, even though private prisons no longer existed, private contracting of inmate labor continued. By 1940, contracting out prisoner labor finally ended (Jing, 2010, p. 13). However, today, state facilities still use prison labor to produce goods and services for the prison and to work on state proj-ects like removing litter from highways or building chairs for use by the state government.
Between the early 1940s and the early 1980s, state government monopolies replaced the private monopolistic prison operators. The states’ depart-ments of correction (DOCs) managed and operated their prisons, while some specific ancillary services like food, medical, and education were contracted out, much under competitive bidding.
The 1980s saw increases in state budgets for cor-rections and other state services that led constituents to revolt against increased taxes. At the same time, more drug-related activities were labeled crimes, and users of drugs were sent to prisons with sentence lengths previously unseen for these types of offenses. Interestingly, in this period, a new form of prison industry was suggested and partially implemented. Former Chief Justice Warren Berger advocated for “replacing warehouses with factories within fences,” a rehabilitation method of getting inmates to nor-mal work habits and skills. The intention was also for inmates to support their families and possibly help compensate their victims (Berger, 1992). Al-though incarceration increased, voters declined in referendums to fund new prisons. This led to a lack of sufficient prison construction and bed capacity throughout the United States. Limited capacity then led to prison overcrowding with no obvious solution available to governments. This situation created an opportunity for private participation in corrections. At the federal level, private contractors were used to hold illegal immigrants beginning in 1979. In 1984, Corrections Corporation of America (CCA) was formed and received a contract to operate a prison in Hamilton County, TN. This was the first entirely privately managed adult correctional facility in the modern sense. In 1985, CCA began operating the Bay County Florida jail and, in January 1986, U.S. Corrections Corporation began operating a prison in St. Mary’s, KY. By 1989, some forty-four adult correctional facilities were managed by prison com-panies for all three levels of government, housing about 15,000 inmates (Abt Associates, 1998, p. 6).
In terms of construction, private companies have been building prisons for many years under govern-ment design and supervision. However, during the 1980s, private companies’ role increased to include the selection of the sites, material, architectural design, and even financing (Brakel, 1992, p. 254–255).
This new trend of privatization differs signifi-cantly from the early privatization model that existed from 1825 through the end of the nineteenth century. In the twenty-first-century model, as will be discussed in Section 13, greater competition exists among

| 9Prison Break: A New Approach to Public Cost and Safety
correctional companies, contracts are bid competi-tively, and there is significantly greater oversight by state agencies, accreditation agencies, and liability insurers. Existing transparent competition prohibits abuse that was common in the early monopolistic markets.
Additionally, there is more involvement and exposure to the media, greater public concern for inmate rights, and better cooperation between the public and private sectors. The early model allowed for private monopolies of both the prison and the employing companies, which led to the undesired abuse and exploitation of inmates. Later, mostly in the twentieth century, public prisons created another monopoly that created inefficiency in prison opera-tion and monopolistic power for public employees. The latest model that started in the 1980s is charac-terized as competitive among the private contractors with added public competition in the relevant states with government oversight.
Currently, the common partnership models used are Build-Operate-Transfer (BOT) (Mississippi); Build-Transfer-Operate (BTO) of a new prison (Flor-ida) or contract out or manage an existing prison (Kentucky); sale of a public prison (Ohio); and contracting-out inmates or “pay for use” to private facilities (California, Oklahoma). BOT is where the private company builds a prison and operates it, and at the end of a specified period that usually allows the company to recover its capital outlays, the facility is transferred to the state ownership. Under BTO the private company transfers ownership of the facility immediately to the state and in turn is paid for operating the prison, including the annualized returns on its investment. The basic difference between these two methods of public-private partnership is that in BOT the facility is private with all attendant liabil-ities, while in BTO the facility is public and enjoys sovereign immunity.
The number of state prisoners in privately operated facilities was 71,845 in 2000, increasing to 95,249 in 2009. However, the share of state pris-oners in private facilities increased just slightly from 5.87 percent in 2000 to 6.87 percent in 2009 (Gilroy, 2011). In 2012, almost 7 percent of state inmates were housed in privately owned or managed facilities.
2 | Previous Studies on Cost and Performance of Public and Contract Prisons
There is much writing in both the popular and professional literature on the perceived merits and disadvantages of contract prisons. Many of these references are based on hypothetical or ideological grounds. On one hand, proponents of privatization stress the merits of competition and its effects on both increased efficiency in the production and quality of services rendered and in enhancing inno-vations. Indeed, this hypothesis has been supported in the analysis of many other industries. On the other hand, opponents of privatization base their claims on the public good aspect of correctional services where they hypothesize that the profit motives of the producers are not aligned with social welfare. For example, opponents of privatization have claimed that profit incentive leads to cutting the quantity and quality of food.
Economists generally support the benefits of competition. The question is whether such benefits are also evident in the private prison industry. A sec-ond question is, what elements in competition lead to efficiency and innovations in the private prison industry? We do not intend to judge such arguments but rather objectively observe the evidence while maintaining an academic and neutral approach. In this section we present research by scholars on costs and performance of public versus private prisons. We start with key articles that analyze the principles of evaluating costs and performance of prisons, fol-lowed by case studies of cost and performance, and ending with meta-analysis and other studies that include aggregated data.
Brakel and Gaylord (2003) evaluated the evidence on comparative costs of public and private prisons. They conclude that private prisons provide substantial and sustainable cost savings. Their con-clusion was based on almost three decades of U.S. experiences with privatization. They break down cost comparisons into the categories of (1) construction (renovation), (2) management, and (3) financing of construction. They report that private firms typically achieve construction cost savings of 15 to 25 percent.

the independent institute10 |
(A similar finding was reached by Thomas (2003)). They also build facilities faster than public entities. In part, private companies are able to build cheaper because of design and site differences. In terms of operating costs, Brakel and Gaylord conclude that private operation provides savings in the 10 to 15 percent range (see also Moore, 1999, and Thomas, 2003). The savings emanate from such factors as more efficient use of staff, lower pension costs, and purchasing efficiencies. Brakel and Gaylord also note some savings in terms of financing of facility construction. They conclude that the cost savings do not arise from cutting the quality of the private prisons. The authors also discuss other issues such as the morality and legality of private or contract pris-ons. In particular, they note that courts have clearly ruled that government can delegate its correctional responsibilities to private firms. As to the morality issue, the authors note that inmates themselves are less concerned with whether the institution is public or private but rather how fairly and lawfully they were being treated. Brakel and Gaylord also consider the important role of contracts and their provisions in terms of obtaining good contractor performance. They discuss the use of contracts to obtain desired performance but warn of excessive specification, which could reduce flexibility and hamper cost savings and innovation.
Gaes et al. (2004) also provide an analysis of public versus private prisons, concluding that most studies have significant defects, preventing definitive conclusion about relative costs. Much of the work is devoted to discussion of problems in the comparison of public versus private prison costs. The authors point out the importance of using avoidable cost for an appropriate comparison. They also note the necessity of considering unfunded liabilities such as pensions, as well as overhead costs in the avoidable cost. Gaes et al. indicate that the smaller the private portion of prison operations in a jurisdiction, the smaller the share of overhead costs that will tend to be avoided. Indication of their concern with the state of cost comparisons is the following statement: “Our sense is that a meta-analysis is premature until we have settled on a coherent method of measuring
the relative costs of publicly and privately managed institutions” (Gaes et al., 2004, p. 104). They also question whether any savings in prison labor costs come at the expense of quality of the service and whether privatization and competition will improve performance. Finally, they raise questions about measuring recidivism since offenders have differ-ent life-course criminal trajectories before prison, suggesting the great difficulty of using measures of recidivism in evaluating prison performance.
The U.S. Government Accounting Office (US GAO) (1996) reviewed five studies done by or for various states since 1991. The studies by Califor-nia, Tennessee, and Washington found little or no evidence of operational cost difference between sim-ilar public and private correctional facilities. Texas reported operation cost savings of between 14 and 15 percent, but the GAO noted that the Texas com-parison involved a hypothetical public facility and was based on various assumptions whose alteration could affect the comparison. The GAO concluded that the evidence that private facilities had lower operational costs was not proven. In terms of qual-ity, the GAO focused on studies by New Mexico and Tennessee, which examined issues of quality in great detail. Using structured data collection instruments to assess such issues as security and safety, healthcare, management, personnel, and inmate programs and activities, New Mexico yielded equivocal results, and Tennessee reported no difference in quality. Finally, the GAO noted in any event the compara-tive performance is subject to change over time for many reasons including competition between public and private facilities. Accordingly, studies based on multiyear data are preferable to those based on only one or two years.
Logan and McGriff (1989) were the first to calculate the costs for private versus public prisons. They compared the price paid to CCA for managing the 350-bed minimum-medium security Hamilton County Penal farm near Chattanooga, TN, to the county’s total costs if it would have maintained the operation of the prison. Contracting out prison management generated annual savings of at least 4 to 8 percent, and more likely in the range of 5 to 15

| 11Prison Break: A New Approach to Public Cost and Safety
percent, compared with direct county management. Logan and McGriff ’s innovation was the inclusion of “hidden costs” that do not appear in the correc-tion budget but do apply mostly to other agencies or are unidentified in the general fund. These omitted costs from the public correctional budgets amount to one-third of the included funds and include the categories of capital, finance, taxes and rent foregone, unemployment and workers’ compensation, exter-nal administration, external oversight, legal services, general liabilities, property insurance, training of staff, transportation services, food provided by other agencies, interagency personnel, and healthcare and education provided by other agencies. The authors quoted a 1985 survey of state correctional officials, which concluded that these hidden costs could add up to 13.5 percent of total operating costs. Based on these survey data from these 42 states, Logan and McGriff concluded that real incarceration costs were 20 to 35 percent higher than the DOC’s report.
Nelson (2005) analyzed the costs of a Taft, CA, federal contract prison with the cost of in-house op-eration of three similar government-operated facilities for the first five years of the Taft contract. Her findings suggest that the costs of routine contract operations were very similar to government costs. Over the first two years of full-scale operations, the observed cost of the contract prison was lower than the in-house avoidable costs and higher for the last two years. When the costs for all five years were estimated, the contract prison saved $4 million or 2.6 percent over the government facility. Nelson also suggested that when a prison is contracted out, savings could potentially be achieved in government centralized support, facility activation, and ongoing competition among service suppliers to the prison. In her report, she provided an extensive list of avoidable costs to be considered in the calculation of public costs.
Up to this point, we have concentrated mainly on cost to government compared with prices of con-tracted prisons based largely on case studies. Now, we turn to performance and cost comparisons using larger databases.
Logan (1992) in a later study analyzed the per-formance of three women’s state, federal, and private
prisons in New Mexico. He used an index developed by the Federal Bureau of Prisons, which is based on eight dimensions of prison performance aggregating a total of 333 measures of quality. The private prison outperformed to a quite substantial extent both the state and the federal prisons in six out of eight di-mensions including security, safety, order, activity, and management. The state prison modestly out-scored the private prison in the dimension of care, while the private and the federal prisons achieved equal scores in the dimension of justice. Logan concluded that the state of New Mexico benefited by privately contracting its women’s prison in both the quality of the operation and lowering the costs. Logan suggests that the high performance of the private prison emanates from better facility design, flexibility in operation, decentralization, higher morale and a sense of ownership among line staff, greater experience of top leaders, and strict rules of inmate governance.
Logan (1996) compared a privately managed New Mexico women’s prison against its previous operation as a state facility. The study sought to determine whether and to what extent private and public management contributed to differences in staff satisfaction, among other aspects. In the comparison of the prison under public and private management, the inmate populations were essen-tially unchanged, substantial continuity in staff existed, both prisons were trying for American Cor-rectional Association accreditation, and both teams were operating under the same court decree. Logan thus attributed any differences to management. He looked at job satisfaction, stress and burnout, staff and management relations, staff experience, and salary and overtime. Interestingly, he surveyed the twenty-two staff members who worked under both public and private management. Logan considered institutional records, surveys of staff working under private or public management, and as mentioned, surveys of those who worked under both. He found high scores for the private operation on a majority of the dimensions. He concluded that private man-agement operated a better designed facility and had greater flexibility and a decentralized style, good

the independent institute12 |
communication, more performance-based manage-ment, higher morale, more experienced management, a greater sense of ownership among staff, and a more formalized pattern of innate control.
Lanza-Kaduce et al. (1999) reviewed extensive literature on costs and performance of private and state prisons. They noted: “The general conclusion is that privatized correctional facilities are achieving economies and are doing so without compromising the caliber of correctional services.” The crucial issue related to performance of public and private prisons is what reduces recidivism. Contracts with private firms, whether limited to specific functions or full-scale management of a prison, can assure the quantity of inputs like number of hours devoted to education programs but not the outputs like the quality of education inmates gained. Several mea-sured outputs of correctional services eventually col-lapse into the extent of recidivism of inmates. Thus, according to this study, recidivism is the single most important output that should be compared in the evaluation of public and private prisons. Lanza-Kaduce et al. (1999) compared a group of inmates released from privately operated prisons in Florida with that of a matched group released from state- operated facilities. The inmates were matched on fac-tors that earlier research had shown to be associated with recidivism—type of offense, age, gender, race, security classification, and prior record. The con-clusion of the researchers was that: “Private prison releases were more successful than were their public prison matches.” This finding reflects substantive differences between public and private operations in Florida. Specifically, statutory and contractual requirements for private firms involved programs that are designed to reduce recidivism. The authors conclude that the internal culture and leadership at private facilities work to coordinate programming with other institutional demands, creating changed attitudes and behavior that are crucial to reducing recidivism. This is in contrast to the idea of “ware-housing” inmates.
Camp and Gaes (2002) report findings from a 1999 Federal Bureau of Prisons (BOP) survey of private and federal prisons intended to evaluate
dimensions of quality under both confinement systems. They note that private prisons tended to house fewer maximum-security inmates who are more costly and contribute to a disproportionate number of problems in correctional institutions. Unless care is taken in the interpretation of the information, data on inmate and guard victimization would tend to be biased in favor of contract prisons. The authors found that private prisons had high separation rates for employees, meaning that BOP prisons had staff that worked at the facility much longer than staff at contract prisons. About half of the contract prisons had to replace 50 percent of their staff during the same period that BOP had to replace at most 9 percent of its staff. The implication is that more experienced staff would provide more effective service and control. The authors further note that private prisons had higher custody staff-to-inmate ratios than BOP prisons. In terms of drug misconduct, a key indication of overall security control, the authors report that 20 percent of private prisons had a rate of 10 percent or more while only one BOP prison had a rate as high as 6 percent. The rate of 6 percent is for low- or medium-security prisons, which are comparable to the contract pris-ons. Homicide rates of inmates were about the same, and the results of the assault rate on inmates were ambiguous. The authors conclude that while many private prisons had security problems, some private prisons were operating effectively.
Camp and Daggett (2005) compared the perfor-mance of one private prison with three federal prisons for all misconduct, and specifically for violent behavior and drug use. They used data on all federal prisons for thirty-six months from January 1999 through December 2001 to form a general quantitative model to explain prisoner misconduct. The explanatory variables included the demographics of inmates and their criminal history, prison staff, and institutional characteristics. Then, they applied the estimated model to the four prisons in order to determine whether differences occur between the public and the private prisons. Overall, the private prison did not perform as well as the three public prisons. However, the private prison’s performance was exemplary on violent misconduct and security-related misconduct
| 13Prison Break: A New Approach to Public Cost and Safety
issues. For the other forms of misconduct, as captured by an overall category of misconduct, the performance of the public sector was better.
It is common to conduct meta-analyses when many studies are available on the same subject matter and where similar variables are included in these stud-ies. We identified such studies that directly compared private and public-managed prisons. The most recent such academic article was published by Lundahl et al. (2009), who empirically analyzed twelve studies on cost savings and confinement quality. They compared matching public and private prisons on the dimen-sions of cost and quality of confinement. The cost measure was per-inmate per-diem savings. Quality of confinement included, among other dimensions, security, safety, order, care, justice, and management. Studies included in the meta-analysis were deemed to be high quality. Fifty percent of the eight studies with cost confinement data showed that private prisons were lower cost with a range between 4.6 percent and 15.2 percent. In 25 percent of the studies, public pris-ons were less costly (10.0 and 14.2 percent). Overall, private prisons were 2.2 percent less costly. In terms of quality, the results were not clear. Of the quality indicators, 47 percent favored privately managed prisons and 44 percent favored the public prisons. The overall conclusion was that 50 percent were in favor of public and 30 percent for private. The au-thors state that “our conclusion is that privatization provides neither a clear advantage, nor disadvantage compared with publicity managed prisons.” (Lundahl et al., 2009: 392).
Pratt and Maahs (1999) analyzed thirty-three cost studies and found that on average, private pris-ons had lower cost by $2.45 per inmate per day. The best predictors of costs were the age of the facility, the level of security, and the number of inmates served. When these factors are explicitly introduced, private prison costs are modestly lower; however, shifting to private management will “not alleviate much of the financial burden on state correctional budgets.”
In a follow-up study, Perrone and Pratt (2003) again analyzed the cost-effectiveness of private ver-sus public prisons and added the matter of quality of confinement. The researchers, using nine stud-
ies, compared seven categories or domains for the quality of confinement. In each such study, a private prison was compared with a similar public prison. The results were inconclusive. Private prisons appear to be less expensive than public prisons by $3.40 per inmate per day. However, the researchers qualified their finding by suggesting poor matching techniques and not-accounted-for differences in fac-tors like security level, maximum capacity, and the number of programs the facility provided could help explain the differences. As for the quality of con-finement the results were also inconclusive. “In the domain of safety, private prisons performed equally as well or worse, whereas they performed equally as well or better in the order and care domains.”
Blumstein, Cohen, and Seth (2007, 2008) investigated the effects that the presence of private prisons in a state has on the costs of public prisons and the rate of growth in spending for prisoners in public prisons. Using all the states’ data over the six-year period 1999 through 2004, the study concluded that the rate of growth of housing costs for public-prison inmates was lower by approx-imately 2.64 to 3.125 percent per year in states where some of its prisoners were also housed in privately managed prisons. An average state’s DOC without private prisons could have saved on its own state-operated prisons between $13 million and $15 million on total operating spending of $493 million, or approximately 2.8 percent. These sav-ings are in addition to any savings that the private prisons themselves could provide. These savings on the state’s own operating prisons have a lag of two years, which may result from a lag between the time state prison officials feel the effects of the competi-tion and the time they can implement changes. An alternative explanation provided is that the learning takes two years. Blumstein et al. suggest that a com-prehensive social cost-benefit analysis be conducted on private versus public prisons. As often stated, a major benefit or performance variable that must be explicitly considered is the recidivism rates in both prison systems. The authors point out various stud-ies that showed significant evidence for lower costs and better performance of private prisons.

the independent institute14 |
Table 2.1. Summary of Prison Studies
Author Type of Analysis Data Examined Cost Comparison Performance Comparison Conclusions
1 Brakel & Gaylord, 2003
Review and analysis of studies comparing costs, performance, legal, and moral issues
No original data analysis
Private saved on: construction 15–25%; operations 10–15%. Private built faster.
None Contracts with private operators should allow flexibility.
2 Gaes et al. 2004
Review and analysis of stud-ies on costs and performance; emphasizing methodology used
No original data analysis
Emphasized impor-tance of including overheads and unfunded pensions.
Unsure whether lower labor costs of private prisons lead to differences in performance. Recidivism measurement is unreliable due to differences in backgrounds of inmates.
Uncertain whether case studies and meta studies yield valid findings due to incorrect mea-surement of costs and performance.
3 U.S. GAO, 1996
Review of five studies since 1991
No data analysis No evidence for lower operating costs of private facilities.
Equivocal results. Perfor-mance analysis requires multiyear data analysis.
No significant differences for costs or performance found.
4 Logan & McGriff, 1989
Case study of contract price versus the coun-ty’s total costs
Detailed cost esti-mates for county including hidden costs to other gov-ernment agencies
Contracting out saved at least 4 to 8% and likely 5 to 15%.
The contract assured at least equal performance.
Private management yields significant savings.
5 Logan, 1992
Quality com-parison of two public and one private women’s prisons
Records and surveys of staff and inmates for federal, state, and private prisons
Not applicable Private prison out-performed the two public prisons by substantial margins across all eight dimensions of quality.
Private prison was better managed.
6 Logan, 1996
Staff satisfaction under private prison that was previously pub-licly managed
Performance measures derived from staff surveys and institutional records
Not relevant Privately operated prison scored higher on majority of quantifiable comparisons.
Private prison preferred on performance.
7 Nelson, 2005
Cost compari-son of a private prison and three federal prisons
Operational costs emphasizing avoid-able costs over a five-year period
Private prison less expensive by $4 M or 2.6%.
Not applicable Modest private prison savings.
8 Lanza- Kaduce et al., 1999
Performance comparison of recidivism rates of releases
198 male inmates released from two private prisons in Florida were matched with public releases
Not applicable Private prison group had lower rates of recidivism using various measured alternatives. Reoffenders committed less serious crimes.
Statutory and contractual requirements for private firms in Florida include programs specifically designed to reduce recidivism.

| 15Prison Break: A New Approach to Public Cost and Safety
Author Type of Analysis Data Examined Cost Comparison Performance Comparison Conclusions
9 Camp & Gaes, 2002
Security and performance of private prisons
Survey of 91 of the 103 private prisons operating in the United States
Not applicable Problems in maintaining security procedures; unstable workforce in private prisons and less costly workers have not produced acceptable level of safety and inmate care. Drug misconduct higher in private than public federal prisons.
Private operators need to attract and retain quali-fied workers.
10 Camp & Daggett, 2005
Performance comparison of all misconduct and specifically violent and drug misconduct
Survey of all BOP prisons and one low-security contract prison, 1/1999-12/2001
Not applicable Private prison performed in low range for low security prisons.
Private prison exemplary only for violent and security -related misconduct; less favorable for all other and drug misconduct.
11 Lundahl et al., 2009
Meta-analysis on cost and performance
Based on twelve studies of matched public and private prisons
Private prisons saved 2.2%.
Mixed results No clear differences.
12 Pratt & Maahs, 1999
Meta-analysis on cost
Based on thir-ty-three studies
Cost per inmate per day lower in private by $2.45. Best predictors were facility age, size, and security level.
Not applicable Management type less important to explain cost than the three predictors.
13 Perrone & Pratt, 2003
Meta-analysis on cost and performance
Based on nine studies matched for quality of confinement
Cost per inmate per day lower in private by $3.40.
Qualities of confinement results were inconclusive.
Overall results were inconclusive.
14 Blum-stein et al., 2007, 2008
Impact of private prisons on state prison cost and growth
All state data over six years (1999–2004)
Public prison cost lower by 2.8% or $13M–$15M if private prisons op-erate in the state.
Not applicable Additional benefits of competition arise from private prisons operation.

the independent institute16 |
Our review of the literature shows the impor-tance of considering all avoidable costs, including, among others, costs to other government agencies besides DOCs and costs that are incurred but not paid immediately such as unfunded pensions and re-tiree costs. Further, the review suggests the difficulties in how to correctly compare costs of public versus private operation, guiding the design and data search for this current effort. Finally, performance measures analyzing recidivism are critical but their study is fraught with great difficulty.
3 | The Structure of the Contract Prison Industry
In this section, we analyze the market definition of the prison industry, the factors that determine the extent of competition, and the resulting inferences. We incorporated here six factors that are relevant for the prison industry. This analysis helps determine whether and how to further improve performance within the prison industry and, ultimately, whether and how social welfare could improve as a result. We analyze both the narrowly defined private prison industry and the industry as a whole, which also includes state prisons and county jails.
Concentration: As mentioned in Section 2, adult contract corrections in the modern sense began in 1984 when the then-new Corrections Corporation of America (CCA) obtained a contract to manage a prison in Hamilton County, TN. States soon followed in employing private contractors. Other early private prison entrants into the market included Management Training Corporation (MTC) and U.S. Corrections Corporation. The entry of these companies into the prison industry ended a state monopoly of corrections. By 1994, twenty companies were competing to provide adult correctional services (Culp, 2011). The number of firms has declined since the 1994 peak. At the end of December 1998, there were fourteen firms in the adult corrections segment, which is the focus of this study. In 2007, the number of competitors declined to six.
Economists often measure the extent of substi-tution (i.e., cross-price elasticity) between goods and
services, namely whether and the degree at which a change in the price of one good affects the demand for another good. The more buyers perceive two products as substitutes for one another, the more an increase in one product’s price will cause a greater increase in the demand for the other product. In our case, if public and private prisons are perceived as close substitutes, then the existence and the price charged by private prisons could constrain the cost of public prisons. Managers and workers of public prisons become more efficient and restrain cost and wages out of fear of being displaced by contract prisons. The question is how to define the relevant substitute products or services. It is intuitively clear that if a state allows ei-ther or both private prisons within its jurisdiction or sending inmates out-of-state then they are substitutes. Namely, a significant difference in favor of the price of housing an inmate per day in private prison against the same cost in the public prison may prompt state legislators to favor private prisons and thus force pub-lic managers and workers to become more efficient and avoid demands for improved working conditions and salaries. In other words, contract prisons reduce the monopolistic status of state prisons, and introduce competition in the industry. The definition of the relevant market for prisons is pertinent to determine whether, for example, a federally contracted private prison can have such an effect on state prisons’ costs.
The relevant market definition of adult correc-tions includes state and private facilities, which are close substitutes. In some cases, county jails, as in California and Texas, could also be considered sub-stitutes since state prisoners are sometimes placed there as well. Accordingly, the market share of inmates confined in contract prisons is nationally less than 7 percent. More relevant, however, the share of private adult corrections in individual states ranges between 0 and 44 percent (U.S. BJS, 2011, Appendix Table 20). Again, the appropriate market definition includes all good substitutes, which are or could be legally permis-sible. In at least thirty states, the use of private prisons is allowed so that substitution exists in those states.
A factor normally considered in market analysis is concentration, which for the purposes of this research is the number and share of private firms operating within
| 17Prison Break: A New Approach to Public Cost and Safety
the total corrections industry. We used a four-firm concentration ratio and the Herfinahl-Hirschman Index (HHI) as the two indicators of concentration for the industry. The four-firm ratio is calculated as the sum of the market shares of the largest four private companies in the industry. The HHI is the sum of the individual firms’ percentages of market shares squared with a maximum value for a monopoly of 10,000, while less than 1,500 is considered un-concentrated or competitive.
In the existing private segment, both indicators suggest high concentration. We find that the four-firm concentration ratio in the adult private corrections segment of the market at the end of December 1998 was 90.1, which means that the top four firms accounted for 90.1 percent of the U.S. private capacity. The HHI was 3,753, which can be interpreted to mean that in 1998 the industry was one with an equivalent of 2.7 equal-size firms. The data used for these calculations were obtained from the U.S. Bureau of Justice Statistics (U.S. BJS) (2001: 4).
Concentration in 2007 was not far different from 1998. The four-firm concentration ratio in that year was 93, which means that the top four firms accounted for 93 percent of the private adult capacity (Avondale Partners, LLC, 2009, p. 1). The HHI was 3,297, which means that the private industry segment had the equivalent of 3.03 equal-size firms.
High concentration has been criticized because it is often thought to contribute to noncompetitive behavior (Culp, 2011). However, economists, includ-ing one of the authors of this research, have pointed out that economic theory and behavior, including that of actual duopolies, suggest that high concentration by itself is insufficient to conclude that noncompetitive behavior is probable (Blackstone et al., 2011–2012). Indeed, the soft drink and mainframe aircraft indus-tries, among others, illustrate that high concentration and competitive behavior are quite possible.
Further, even in 2012, contractor-operated pris-ons comprised less than 7 percent of adult corrections. In other words, as mentioned, a good substitute, mainly state prisons, already exists. Moreover, states could and do send prisoners to other states. Private contract prisons face many alternatives so that con-
centration within the contract portion of the industry does not indicate any real monopolistic control of the market. Again, the market is actually all corrections facilities, and the private portion is small.
Entry: There are modest legal and financial barriers for new firms to enter the management of existing prison facilities. Licenses are not required for entry. Modest requirements exist for liability insurance, and experienced firms have some advan-tage in the choice of a contractor. Entry into the construction and management of prisons, however, requires significant financial commitments and involves considerable risk if a significant number of cells is not occupied. (For a detailed discussion on the lower risk for managing a prison see Tang, 2012). In the early 1980s, there was rapid entry of at least twenty firms into the burgeoning private corrections industry. Further, between 1996 and 2011, three additional small, regional firms (LaSalle Southwest Corrections, Louisiana Corrections Services (LCS), and Emerald Companies) were formed, suggesting that entry remained possible. Overall, large firms can more easily enter and build entirely new prisons. Nevertheless, LCS, a small entrant, has built a new facility, although it did so in stages. LCS started at about 200 beds and eventually reached a facility size of about 1,000 beds.
Economies of scale: The industry has some economies of scale both at the individual correctional facility level and at the firm level. The facility level includes the capital and operational outlays of the prison, while the firm level refers to any additional savings from operating more than one prison. Here we deal solely with the operation of one prison. A minimum efficient size (MES) prison, which is the smallest size facility to reach a baseline level of cost efficiency, has a capacity of about a 1,000 beds. At 750 beds, a facility’s cost per bed will be about 15 per-cent higher. An indication that a 1,000-bed facility is the approximate MES is that a cost- minimizing or profit-maximizing firm would presumably build an efficient size facility. Indeed, the 2008 phase II con-struction of LCS’s Pine Prairie Correctional Center had a bed capacity of 1,008, and its South Louisiana Correctional Center, which was completed in 2001,

the independent institute18 |
had 1,002 beds. The 1,000-bed threshold exists because up to this size, inmates can be added without adding much additional staff. Because labor comprises 70 percent of operating costs, such a threshold exists. Small states could thus have only a few efficient size facilities because of their smaller populations. This is especially likely because prisons normally are oper-ated at one level of custody (for example, minimum or maximum security).
Additional economies of scale are available at the firm level. Operating several facilities yields buying economies. This could be important for inputs like food or liability insurance. Moreover, a large firm may have advantages in terms of workers. For example, if a warden has to be temporarily unavailable, a large firm can move a deputy warden who is already familiar with the system operation from another facility.
Sensitivity to prices (price elasticity): Private firms face a highly elastic demand for their services. The reason is that states that consider using contract prisons, especially out-of-state transfers, have many close alternative providers including county jails and other states’ prisons. Further, the private share of total prison capacity is about 7 percent, so price reduction (or service quality improvement) could potentially enable private contractors to successfully compete with the public sector for a much larger share of the market. Existing government policies often prevent such entry. However, a threat of entry will force the operators of existing public prisons to become more efficient and for the state DOC to loosen bureaucratic procedures preventing cost reductions.
Mergers: Mergers have played an important part in the growth of private corrections compa-nies. For example, CCA acquired U.S. Corrections Corporation, the then-third largest company in the private contractor portion of the industry in 1998. U.S. Corrections owned five facilities with a bed capacity of 5,275 and managed other facilities with a combined 5,743 beds (Culp, 2011). In 2005, GEO Group acquired Correctional Services Corporation, the seventh largest company in the industry, and, in 2010, it acquired Cornell Companies, the fifth larg-est. Community Education Centers was a privately held company providing community based reentry
services and rehabilitation services for offenders mainly in New Jersey and Pennsylvania. In 2007, it acquired CiviGenics and, as such, became a partici-pant in adult corrections. Other firms in vertical- or horizontal-related industries are potential entrants to the contract adult prison segment.
Buying power: The states have considerable power in the purchasing of prison services from private corrections contractors. Obviously, the over-all demand versus supply of prison beds is a factor affecting buying power. If all states are operating at or above capacity, their choices are limited, and the high demand translates to higher prices for private prisons. In terms of buying prison services, the state, after all, can always provide the services itself or possibly contract with other states or county jails. Moreover, a few buyers account for a substantial percentage of the private companies’ revenues. For example, California alone accounted for 13 percent of CCA’s 2010 reve-nue and three federal agencies provided an additional 43 percent. Four government buyers accounted for 60 percent of GEO Group’s revenues (Culp, 2011). Such significant government buying power (oligopsony) can be used to obtain low prices and good quality service from private contractors.
At the same time, the government buying power subjects the contract prison companies that own their facilities to substantial risk. The contract pris-ons have no immediate alternative use, and therefore their dependence on a few government customers makes them quite risky and often vulnerable to pres-sures to lower their prices. Indicative of this are the follow-up negotiations after a contractor is selected in the bidding. Risk emanates from a possible decline in the number of inmates, a shift to self-incarceration by the state, or simply an increase in the supply of cells by competitors.
The structure of the prison industry requires that the private firms must keep prices low to attract and maintain business. It is an industry with con-siderable risk, as well as a history of mergers, which is probably indicative of the existence of economies of scale. It also has the continued possibility of new entry. Moreover, firms’ exit from the industry suggests substantial competition. For example, four

| 19Prison Break: A New Approach to Public Cost and Safety
companies exited the industry between 1996 and 2011 (Culp, 2011). The contract prison segment must also face the possibility that states could send inmates to other states or use county jails. Another indication of the competitiveness of the industry is the shifting of contracts among the companies. For example, GEO Group, which had operated the Moore Haven and Graceville prisons in Florida, lost the contracts in 2010 when CCA was awarded the contracts to operate the facilities as a result of rebidding (CCA of Tennessee vs. [Florida] Department of Management Services, 2013, p. 8). Competition is thus far more intense than the number of firms and concentration within the private segment indicates.
Impact of a “small firm”: Small firms often dis-rupt the quiet life of a monopolist or a highly concen-trated oligopoly (an industry with only a few firms). Their impact can be seen in many divergent types of industries and is often far greater than their small share of the involved markets. The private or contract prison segment collectively can be considered such a “small firm.”
In transparent tape, LePage, a small firm with about 10 percent of the market, challenged the monopoly of 3M’s Scotch Brand Tape in the 1990s. LePage introduced and promoted private-label trans-parent tape to large buyers like K-Mart and Sam’s Club. Such large buyers could put their own label on the tape, which was sold at prices below Scotch brand. The entry of LePage thus provided clear competition benefits. And 3M responded to the competitor’s threat by bundling rebates for six products including transparent tape, which led to a substantial antitrust victory for LePage.
Another example of the important competitive benefits provided by a small firm comes from the physicians’ services industry. There, osteopathic medicine (D.O.s) physicians, who are fully licensed and are not under the control of doctors of medicine (M.D.s), comprise about 6 percent of all physicians. D.O.s emphasized general or family practice, while M.D.s most often chose to practice specialties. D.O.s also frequently practice in urban and rural areas that are short of physicians. Most significantly, between 1980 and 2000, when M.D.s were concerned about
an impending physician surplus and maintained their output of new professionals at about 17,000 per year, D.O.s increased the number of their medical schools and more than doubled their graduates. By 2000, M.D.s recognized that a shortage of providers existed (Blackstone, 2003). Had the D.O.s not expanded their numbers, the shortage would have been far worse. In this case and many others, having even a small competitor in an otherwise monopolistic situa-tion can be most helpful.
In the 1980s, a small firm had a major impact in the cigarette industry. The firm Liggett had a market share of only 2.3 percent in the highly concentrated cigarette industry, where the top four had 88 percent of the industry sales. During the previous forty years, no major company sold any non-branded cigarette, and virtually all cigarettes were sold at the identical full list price. Liggett was under severe financial pres-sure, producing too few cigarettes to take advantage of economies of scale, which required 3 to 5 percent of industry output. The firm, in 1980, introduced generic cigarettes, which were then sold at discount prices by mass-market retailers. Other firms followed by introducing their own generics, whose share grew. A 1997 Federal Trade Commission (FTC) staff report on the industry noted: “This makes Liggett one of the most significant constraints on higher industry prices today” (Burnett, 1999, p. 262).
The soft drink or carbonated beverage indus-try, which Coca-Cola and Pepsi Cola have long dominated, also points out the desirability of small competitors. Both large firms have colas (and other flavored carbonated beverages) that have enjoyed a combined market share of almost 70 percent. How-ever, neither major company produced a caffeine-free cola until 7-UP, a company with a small market share of approximately 7 percent, introduced and heavily promoted Like Cola in 1982. Then 7-UP also intro-duced a diet version of its caffeine-free cola. Soon, Coca-Cola and Pepsi Cola introduced their own caffeine-free colas, and Like Cola disappeared from the market. Incidentally, another small firm, Royal Crown (RC), had introduced its own caffeine-free cola in 1980. Again, the small firm is often a maverick introducing important competition into the market.

the independent institute20 |
The cereals industry also illustrates the role of small firms that serve as mavericks. The cereals indus-try was long dominated by a few companies. In the 1970s, the top four had 85 percent of the market, and the top six had 95 percent. These entrenched com-panies did not respond to the increase in consumer demand for “healthy” food, including natural cereals. In the early 1970s, companies like Colgate, Interna-tional Multifoods, Pet, and Pillsbury introduced nat-ural cereals, which products were soon responded to by the leading companies. The share of natural foods increased from about 0.5 percent in 1972 to about 10 percent in 1974. All mavericks except for Pet soon exited the market (Schmalensee, 1978). Again, the role of small firms is often to do what entrenched and established firms fail to do.
The conclusion is that small, maverick firms can have an important competitive impact, eroding and constraining monopoly power. As these diverse exam-ples show, even a firm with a small market share can and often does have that impact. Indeed, the U.S. Merger Guidelines reflect the understanding that such a maver-ick can be an important competitive force, and its elim-ination through merger can substantially lessen compe-tition (Baker, 2002, p. 140). The impact of rivalry from a small firm is likely to have at least as great an impact on government monopolies as on private monopolies or concentrated oligopolies. After all, government lacks the profit incentive to innovate and is also encumbered by bureaucratic and other regulatory requirements.
Additional insights on market structure: One of the arguments against the use of contract prisons is that of supplier power. Suppose that a state suffers from significant overcrowding and depends upon the one prison company located within its borders. The prison company can use its market power and significantly raise its prices. Alternatively, suppose that the number of inmates within the state drops sharply, which may indeed occur (Section 14). Contract prisons will then own expensive facilities with no other use. Such possi-ble conditions may indeed occur for a short period of time and could cause severe difficulties and financial losses to either or both public and private sectors.
While these scenarios are possible, they could happen in any industry; it is not unique to correc-
tions. Also, one must recognize the power of compe-tition and the dynamics it creates to correct for such inevitable situations. A local contract prison company needs to maintain a good business relationship with the state and is unlikely to use its temporary market power to raise prices. Furthermore, the state DOC could always contract out inmates to other states, to other companies, or with county jails. Thus, even a monopoly contract prison within a state has limited, if any, power over the price.
If a local contract prison is suffering from over-supply of cells, then it could attract inmates from other states by lowering prices for its facility. In the short run, prices could be reduced to the marginal cost of additional inmates. It is important that state legislators and the courts allow easy transfer of inmates among states, which increases competition and thus improves efficiency, lowers prices, and improves the quality of service for inmates and the states. State prisons could be allowed to both send inmates to other states or private prisons and, if pos-sible, house inmates from other states. Information on varying market conditions and opportunities could appear in a comprehensive database that corrections officials could access.
Since significant investment may be required, especially in cases where facility construction is involved, long-term contracts for private contractors are generally necessary. The more states that par-ticipate in this market, including both public and private prisons, the more efficient prisons will be and the more prisoners’ conditions will improve. As a demonstration of what happens when competition is curtailed, legislators in California passed a law barring private prisons within the state, creating many chal-lenges in addressing the state’s prison overcrowding. Any such legislation that prevents private competition within a state or impedes interstate transfer of inmates is inefficient and exacerbates severe overcrowding which adversely affects inmates and correctional staff. Incidentally, in 2013 California allowed use of in-state private prisons for low security inmates with the stipulation that workers have to be state employees.
The effects of increased competition on the prison industry can also imply changes to government oversight

| 21Prison Break: A New Approach to Public Cost and Safety
and regulation. For most industries, if firm entry occurs and competition increases, government intervention to protect consumers’ interests becomes unnecessary. For example, in the competitive markets of the clothing or toy industries, customers “decide” what products are preferred, and producers that cannot deliver a quality product at the right price suffer. Thus, no government intervention is needed, and markets operate efficiently. At the same time, consumers are not familiar with the chemical contents of the clothes and toys, and usually no business entity has the incentive to conduct the necessary tests for all such products and make public their find-ings. Government is the only entity that would protect customers and conduct comprehensive tests on contents of both domestically produced and imported products. By contrast, the inmates are the consumer-equivalent in the prison industry. They have no power to choose the facility where they are sent and are not able to review information on the performance of the prison. Thus, even if strong competition among private and public prisons exists, government oversight on performance is necessary for both the public and private prison systems.
To conclude, in this section we saw that the prison industry as a whole has become more compet-itive since the reemergence of contract prisons in the 1980s. In Sections 5 through 13, we shall compute state costs versus the prices paid for contract prisons. Our calculations reflect all real costs, regardless of when they were incurred, rather than just annual out of pocket costs. We further suggested the possibility that even greater competition could yield greater sav-ings. The entry of the competitive contract firms to a state’s prison industry could not only provide cheaper services for its DOC but also may force state prisons to improve their service delivery. In the discussion that follows, we shall analyze whether states that face competition by private contractors are more efficient than states that rely merely on state prisons.
4 | A Model for Estimating the State’s Avoidable Costs
This study asks whether contracting out prisoners or prisons reduces a state’s costs and is beneficial to
the welfare of its citizens. Cost savings are usually re-quired in order for the state to contract out inmates. When the nonmonetary performance of prisons is incorporated into the analysis, it becomes more comprehensive, reflecting overall net benefits to the state’s citizens. The cost savings are all expressed in monetary terms. However, the performance will be captured in more general terms since quantifiable data are sometimes not available. This study relies on gov-ernment sources for all data. We imputed data, again relying on government sources, when direct data were missing. Appendix 1, the source appendix, provides information about where the data were obtained for each of the variables (entries) in Table Appendix 3.1.
The basis for a state’s decision to contract out the management of existing prisons or transfer inmates to private prisons should be based on budgetary savings while at least maintaining the same performance. Budgetary savings should reflect avoidable costs to the state. In the determination of avoidable costs, we distinguish between the short-run costs, or operating costs, and the long-run costs, which include operat-ing costs plus capital costs.
There are three scenarios for the use of contract prisons. In the first scenario, the facility is owned or financed by the state government, so that the avoid-able costs are merely those that occur in the short run—the operating costs—which is the situation in Ohio (except in the case where the facility was sold to the private contractor by the state) and Tennes-see. The second scenario occurs when the facility is privately owned or financed, and the avoidable costs include both the operating and capital costs. This includes cases of overcrowded facilities, facilities built under BOT, or privately built prisons. Examples of this scenario include California and Oklahoma. The third scenario occurs when a state facility is sold to a private operating company, as in Ohio, and thus both operating and capital costs are included. It is similar in concept to the second scenario. In all three cases, the state regulates and monitors the operation of the contract prisons. The following Glossary of Terms provides a brief description for the categories of costs. Appendix 2 provides a complete list of cost items included in each of the three scenarios.

the independent institute22 |
Glossary of Terms
TERM DEFINITION EXAMPLES
Avoidable Costs
Savings for the state emanating from the use of private contractor. The cost items included depend upon the reason for the use of the contractor.
See Appendix 2 for the types of costs considered avoidable for each scenario.
Direct Costs Costs directly associated with the handling of inmates. These costs are zero when no inmates are in custody. Usually defined as part of the short-run costs.
Labor, medical, utilities, employee pensions, food
Indirect Costs Costs that incur to other branches of DOCs and other state agencies, which are linked to inmate and state prison operation.
Central administrative functions like classification and assignment of inmates, adjudicating inmate grievances, parole hearings, inmate transfers, liability insurance, human resources
Short-Run Costs
Costs incurred as a result of the day-to-day operation of a correctional facility including both direct and indirect costs.
See examples above
Long-Run Costs
Short-run operating costs plus capital costs associated with the financing, planning, and construction of the facility or significantly large reconstruction or rehabilitation.
Short-run costs plus depreciation of facilities, interest on debt, significant repairs
Economists assume efficient use of freed-up re-sources even if the state chooses to under-employ such resources. For example, if inmates are transferred to a private prison and, as a result, a manager becomes idle, his or her salary is then an avoidable cost. We assume that the manager ceases duties in his or her obsolete position. We assume that the DOCs are efficient in their use of resources.
Also, in the calculation of avoidable costs, we distinguish between contracting out a prison (i.e., managed-only facilities) and the transfer of inmates to private prisons. In the first case, a private company takes over the management of a prison for some years and then the prison returns to the DOC. In such cases, the avoidable costs include all the direct costs plus the indirect costs to the DOC and other state agencies. Recovery of capital outlays and interest payments are not avoidable if the public sector bears the renovations
and rebuild of the old prison or the construction of a new prison. The issue of indirect costs will be consid-ered below.
There are several reasons states may choose to use contract prisons, and overcrowding is one major driver. Sometimes a court order or even a threat of such an order leads to the practice. For example, an appellate court found that California in 2008 was operating at 188 percent of its designed capacity, jeopardizing the health and safety of the inmates. In fact, the U.S. Supreme Court in Brown v. Plata (2011) determined that California was operating around 200 percent of designed capacity for at least 11 years. California has been ordered to reduce its capacity utilization to 137.5 percent by February 2014. California also lost control of the healthcare delivery in its prisons to a federal receiver after it was determined that the state was not delivering a constitutional level of inmate medical

| 23Prison Break: A New Approach to Public Cost and Safety
care because of the severe overcrowding in its pris-ons. Excessive overcrowding exists elsewhere, as well. Ohio, for example, in 2012 had prisons operating 31 percent above their capacity (Diroll, 2011).
When overcrowding exists, costs may appear lower as a result of lower performance. Overcrowding spreads at least the fixed costs over a larger number of prisoners, lowering costs per inmate. However, over-crowding significantly reduces prison performance, including creating greater security problems, lower-ing correctional officer and inmate safety, increasing violence among inmates, and consequently requiring long lockdowns. Overcrowding also reduces the space available for education, training, and recreational programs. This is likely to hinder the reentry of inmates to civil society.
Another driver for using contract prisons is when a state owns old, outdated facilities that require signif-icant and often unavailable resources for renovations. In these conditions, prisoners are likely to sue the states for cruel or unusual punishment. For example, in Texas, a prison built in 1856 is still being used. States can fund the construction of new prisons or modernize existing prisons by issuing general obliga-tion or revenue bonds. However, the state constitution usually limits the extent of borrowing general fund dollars for capital projects. For example, the state of Washington limits the debt service to 9 percent of general state revenues for the previous three years (State of Washington, 2012). Further, our examina-tion found that Arizona has a constitutional cap on general fund bonds of $325,000. Other states require voter approval for issuing of bonds. These constraints gear states to create public-private partnerships where the capital outlays of new or renovated prisons and other infrastructure are privately financed.
When the state does not have to bear necessary capital costs, the avoidable costs to the state include both short- and long-run costs. The short-run costs are direct and indirect costs. The long-run costs include capital costs, which involve modernization, significant repairs, depreciation, and financing costs. Depreciation incorporates the decline in the value of the facilities, while modernization and repair include renewed and improved conditions. For example, the
Legislative Budget Board of Texas recognized that in the case of overcrowding, state avoidable costs must include the long-run costs related to new construc-tion when calculating the per-diem charge (Gaes et al., 2004: 87–88). Clearly, when the state saves re-sources by contracting out the operation of a facility, more can be spent on other priorities. Because there can be a limited ability to issue bonds, when private contractors finance facilities, the state is able to bor-row more for other public infrastructure needs and save on interest payments.
When inmates are transferred to contractor- operated prisons due to overcrowding or governmental capital shortages, the avoidable costs also include long-run costs. In fact, the courts are likely to intervene and require the state to correct overcrowding, which reflects housing inmates in unsuitable conditions. These unsuit-able conditions translate to poor performance. Thus, both situations are unsustainable in the long term.
Appropriate measurement of avoidable costs will include the following categories of annual spending for each state on minimum- and medium-security male prisons, which are the most common alternative to private prisons. We have analyzed the professional literature to construct a comprehensive list of all avoidable costs. We considered in particular the work of Nelson (2005).
5 | Direct Avoidable Costs for Public Prisons
Personnel services (Table Appendix 3.1, rows 1a and 1b) include wages, salaries, and benefits for all prison employees. Benefits include health insurance, funded and unfunded pensions, and paid days off. When we analyzed personnel services, we recognized that some of the pension and retiree healthcare costs of the current personnel are paid by other state departments or are not paid in full. The Vera report (2012) provided data gath-ered from forty states, which we used to supplement re-ported personnel costs. The underfunded pensions and healthcare costs of correctional personnel are short-run costs that were not included in the financial reports of the DOCs, which were used to calculate the state costs versus private fees (Table Appendix 3. 1, rows 15a and

the independent institute24 |
15b). These underfunded personnel costs amounted to $4.3 billion out of the total unaccounted costs of $5.4 billion or 78 percent. The other unaccounted costs are capital and some inmate medical expenses.
Also unaccounted for are indirect costs, which appear for individual states but were not aggre-gated by Vera. More important is the fact that the unaccounted costs, even without the avoidable indirect costs, which were not aggregated by Vera, are 12.7 percent of the total correctional budgets. The unaccounted costs are not considered by the states in their comparison of the avoidable state correctional costs and private fees. However, these costs are ap-propriately included at the time they may occur, even though the actual outlays take place at a future date. Much of the critique on contracting out prisons rests on inadequate savings by the state government. How-ever, the inclusion of these unaccounted costs and the consideration of the more relevant long-run costs make the comparison more accurate. Accordingly, Table Appendix 3.1 includes the underfunded pen-sions and retiree healthcare benefits as real costs of public prisons. Vera provided these data for all the states we analyzed except Mississippi.
The underfunded information for Mississippi is available in another source (Pew, 2010) however, though not specifically for corrections employees. We maintained our conservative approach and excluded the underfunded amounts for Mississippi, since no concrete data are available.
The Pew study (2010 and 2012) stressed the sig-nificant amounts of underfunded retiree pensions and healthcare for the states. In 2010, a $1.38 trillion gap existed; $757 billion for pension promises and $627 billion for retiree healthcare, an increase of 9 percent from just 2009. In 2008, one-third of total obligations were unfunded. Noteworthy, of the states we analyzed Oklahoma and Kentucky had more than one-third of their liabilities unfunded, and Mississippi had more than 20 percent. On the other hand, Florida was one of only four states that were fully funded.
In terms of correctional medical care, the responsibility for services differs among the states. In general, off-site medical costs often include ceilings to safeguard the contractor from unanticipated medical
expenditures. On-site medical costs are normally the responsibility of the contractor, and the public-private partnership facilities often have physicians, nurses, and other medical personnel to provide care, which is included in the per-diem rate. For example, in Mis-sissippi, private contractors cover the first seventy-two hours of care for inmates receiving treatment in out-patient facilities and, beyond that, medical care is the state’s responsibility. In Oklahoma, the contractor is responsible for all medical costs per inmate under $100,000 with a $50,000 limit per episode. When we compare state costs and private fees, they should both reflect the appropriate medical expenses. However, comparisons across states are more difficult because of different practices (Table Appendix 3.1, rows 2a and 2b).
Maine provided full details on its public prison expenses for food, utilities, fuel, office supplies, tech-nology, rent, clothing of inmates, and minor repairs. However, for the other states we were able to obtain just an aggregate of such expenses. Contracted professional services include teachers, psychologists, and others. The inclusion of Maine in this study provides a benchmark for public managed prisons, as well as an example of a state that currently lacks private competition.
6 | Indirect Avoidable Costs for Public Prisons
This category includes some of the central adminis-trative functions that become avoidable when private prisons are used. Examples for such costs that become moot when contract prisons are used and should be incorporated in the calculation of the state cost per inmate per day include adjudicating some inmate grievances, liability insurance, human resources (background check of potential employees and hir-ing, training, and administering employee records), legal (shared between the DOC and the attorney general), and transfers of inmates among public pris-ons. These hierarchical and intergovernmental costs are often ignored when the DOC calculates its own costs per inmate per day. Contracting out inmates allows savings that could be directed to other activ-

| 25Prison Break: A New Approach to Public Cost and Safety
ities. Gaes et al. (2004: 95–96), argue that based on existing economic literature, if the state refers a small number of prisoners to private prisons, then there is no significant decline in these indirect avoidable costs. They add that even when prison services are contracted out, some of the overhead costs continue to burden the public sector (p. 98). For example, the state normally maintains control over classification, disciplinary, and other central office activities. Ten-nessee and Oklahoma calculated that when prisoners are transferred to contract prisons, approximately 75 percent of the indirect costs remain as state costs or 25 percent become avoidable costs (MGT of Amer-ica, 2007; Tennessee General Assembly, 2010). In the discussion on savings below, we shall maintain our conservative approach and incorporate only 25 per-cent of the indirect costs as indirect avoidable costs.
Moreover, indirect costs are difficult to measure and may not be fully accounted for by some states. The Government Accountability Office (US GAO, 2012: 17) figure for indirect costs is 11 percent of operating costs or calculated as $8.09 for low security federal prisons in 2011. The 11 percent serves as a standard for indirect costs. In fact, the reported range for most states was $3.72 to $6.64. Texas’ indirect costs of $1.30 seem far too low, and, to a lesser extent, this applies to Mississippi’s $2.96. The states that reported most comprehensively approximated the 11 percent of the GAO. We normally incorporated the reported figures for states that provided them, and 11 percent for the states that did not provide the indirect costs including Mississippi and Texas, which were unpredictably low. Vera provided some data on unaccounted indirect costs which we also incorporated. Unfortunately, Vera did not report for ten states including Mississippi, which may explain its reported low indirect costs.
7 | Monitoring Costs
Monitoring costs include contract development and procurement costs and contract compliance moni-toring costs of the contractor-operated prisons by the relevant DOC. These costs are normally included in the per-diem charge of the private contract price. If
not, they are added to the per-diem charge. In Ohio, the private contractors must reimburse the Ohio De-partment of Rehabilitation and Corrections (ODRC) for two monitors at their expense. In Kentucky for fiscal year 2009, the monitoring costs were $105,362 for 1,234 prisoners or $0.23 per inmate per day, a negligible amount that will not change the results even if added as an estimate for all the states. In Florida from 2009 to 2010, the annual monitoring costs for each contractor-operated prison ranged from $54,000 to $72,000, or $0.08 to $0.10 per inmate per day. In Florida and Ohio, the on-site monitoring costs are very small and are indeed included in the per-diem prices paid to the contractor.
8 | Capital and Finance Costs
Capital and finance costs should be included for all states that house inmates in private prisons to handle overcrowding or to avoid rebuilding or substantial maintenance costs. There are, after all, in excess of 290,000 prison beds in public facilities that are more than fifty years old (U.S. BJS, 2005). The necessity to include the capital costs as avoidable costs for the public sector is recognized by the state of California’s legislative research agency, which stated: “Many CDCR prisons are more than thirty years old. While still operational, many of these prisons require much greater levels of maintenance and some will require significant renovations. Long-term maintenance and renovations costs should be taken into consideration when identifying prisons to close” (California Legis-lative Analyst’s Office, 2012B, p. 16).
These costs should not be considered when a private company manages an existing public prison. The depreciation should be calculated for the period between major renovations. A prison, like a standard building, is assumed to be fully depreciated over a period of fifty years. In fact, a prison encounters both more wear and tear and requires more modernization, including incorporation of new technology, than a normal building. Even though prisons would be expected to require major renovations and upgrading periodically, we utilize the fifty years’ depreciation life as

the independent institute26 |
does the U.S. Bureau of Prisons (BOP). The exception is Arizona where its legislative research unit used twenty years (JLBC, 2012). Since capital outlays are funded normally through the issuance of bonds, the annual interest payments should be incorporated in the calcu-lation of public prison costs. The reason for Arizona’s twenty-year amortization is because contract prisons are transferred to state ownership after twenty years.
The US GAO (2012:13) concluded that the cap-ital costs, including modernization and repair projects and depreciation, for the fiscal years 2009 through 2011 ranged from $4.39 to $4.82 per inmate per day. These were the fees the states paid the BOP when state prisoners were housed in federal institutions. In our calculations of the costs for state prisons, we used the average of $4.61. Firms utilize numerous methods of depreciation for taxation purposes, but for a state such consideration is irrelevant. However, the real de-cline in capital assets or economic depreciation is im-portant to include in the evaluation of whether to use contract prisons or build a state prison. Depreciation is an avoidable cost when a contract prison is used. It reflects the consumption of the facility through its use and is real like any other direct or indirect cost item. Failure to include depreciation, like some states do in their calculation of state per inmate per day costs, is unjustified and biases significantly downward the public costs. Clearly, however, depreciation should be included only when the long-run costs are considered.
It is important to note that states issue bonds to finance prison construction, and the cost of principal and interest per inmate is a long-run variable cost to be imputed to obtain the avoidable inmate cost per day. The correct measure should be the current con-struction cost of a new prison, which would reflect avoidable costs. Then, the interest on such capital costs must be used to calculate the interest per inmate per day. We chose the average interest rate for 2012 of 3.75 percent for a twenty-year maturity bond. This is a conservative rate, which was especially low in 2012 (see, W M Financial Strategies (2014). Our research shows that construction cost for a 1,500-bed medium security prison in 2012 was $225 million (see, Brown, 2011). Thus, the annualized interest cost per inmate per day over a twenty-year life of the bond is $15.41.
Another calculation of interest costs comes from a 2007 study for the Oklahoma Legislature (MGT, 2007). The study estimated construction costs of $54,500,510 for a 660-bed maximum-security facility expansion. This yielded annual principle and interest costs of $15.37 per inmate per day for a twenty-five-year bond. This figure is essentially identical to our calculated principle and interest cost.
However, even if we use the 2011 sale price of the then eleven-year-old, 1,798-bed Lake Erie Correctional Institution in Ohio of $72.77 million, the annualized interest per inmate per day would be $4.16. We used the Construction Cost Index for buildings, utilities, and grounds of the U.S. Army Corps of Engineers (2011). The cost of construction increased by 57.9 percent since 2000, so that the 2011 cost would be $115 million or the interest cost would be $6.57 per inmate per day.
A problem arises because in recent years public prison construction was rare in the examined states. Thus, we used interest payments, when available, as reported by the individual states. As discussed above, the measure of $6.57 drawn from Ohio could be used.
Vera (2012) reported prison interest costs that should be attributed to correctional facilities rather than be part of other state budgets. The appropriate measure would be the current per inmate interest cost for the construction of a facility. Unfortunately, the Vera data refer to interest payments for prisons that might have been built long ago and do not reflect current costs. Also, the capital costs should correspond to the same number of inmates as in the relevant size prison. Since we divide by the total number of inmates, our measure of interest payment is understated. In maintaining our conservative approach, we chose to use Vera’s capital cost when the states do not report their own cost.
Florida built a new public prison in 2009, and the annual interest per inmate per day was $7.05. However, in the case of Florida where private vendors operate the existing public prisons, only the short-term costs are relevant. The other states showed lower costs. Except for Florida, imputed costs of interest were lower for all other examined states than the $6.57 updated interest costs. Maintaining our conser-vative approach, we used Vera or the state data for all examined states except California for which interest

| 27Prison Break: A New Approach to Public Cost and Safety
data from Vera were missing. Including the $6.57 for California would increase the long-run 2007–2008 savings from contracting out from 32.20 to 35.79 per-cent. However, we chose to be even more conservative by not including any interest costs for California.
9 | Capital Flexibility Gained by Use of Contractor-Operated Prisons
Use of private prisons increases the flexibility of government corrections in a variety of ways. First, demand for prison cells changes over time. When demand is high, public prisons lack cells, and over-crowding results. The courts can require timely alle-viation of overcrowding in such cases as California in 2013. In the absence of contract prisons, states need to build expensive new facilities while their borrow-ing capacity is low. On the other hand, the number of inmates is expected to diminish for such reasons as the declining cohort of young males, reduction in the use of “three strikes” sentencing, easing of drug laws as already occurred in the states of Washington and Colorado, and a possible reduction in recidivism. Prisons could then become under-occupied or even vacant, and it is difficult and expensive to transform them for other uses. Further, much of the expensive surveillance features will have to be abandoned.
For example, Florida, Texas, New York, and Michigan have seen a decline in the number of pris-oners and have already closed prisons. The only two states experiencing a significant increase in prisoners in 2011 were Kentucky and Tennessee, leading to an increase in the use of private prisons. However, the trend changed between 2011 and 2013, causing the closure of thirty-five adult state correctional facilities in fifteen states (Strumpf, 2013). Thus, contract prisons play the role of an equilibrating mechanism for equating supply and demand for cells. Regardless of the successful partnership between Kentucky’s DOC and CCA, with the decline in the number of prisoners, private prisons closed when public prisons had sufficient cells. The same phenomenon of reduced reliance on private prisons oc-curred in Texas in 2013, which has even closed one state prison. This flexibility translates into large savings for
state governments. When overcrowding occurs, the state saves by using private prisons instead of building new prisons that have little or no alternative use in periods of decline in the number of prisoners.
These significant savings for state governments are not accounted for in our calculations of inmate per-diem costs, even though they should be consid-ered state avoidable costs. This is again an indication of our conservative approach where avoidable costs are downward biased when savings exist but cannot be comfortably estimated.
Private prison construction yields savings in both time and costs compared to state governments contracting out the construction. Cumbersome pro-cedures in obtaining bids and selecting the winning contractor, possible rules for the use of unionized labor, and the inability to take advantage of buying power make the cost higher and often hinder timely completion. A private contractor built a 3,000-bed medium-security prison for California in Arizona and began housing its first inmate just fifteen months af-ter beginning construction. Because of the regulatory requirements in California, that process would have taken much longer. These issues are discussed more fully in the individual state section (see Section 12).
We do face here the typical peak load problem similar to the case of electricity. When a state faces excess demand for prison cells, then the private prison industry relieves the pressure by saving the public sector the full construction costs of building new facilities. In the electricity industry, excess demand in one region is usually satisfied by purchasing elec-tricity from other utilities that are experiencing excess capacity. The price reflects long-run costs. The same principle should apply to the prison industry.
10 | Non-Cost Performance Measures
Our discussion so far has concentrated on the com-parison of public costs and the fees paid for private prisons. Obviously, dimensions of quality should also be considered. To that end, there are some suggestions that the private facilities are performing at least equal to public correctional facilities.

the independent institute28 |
A robust and useful practical indicator of quality in the operations and management of prisons is ac-creditation by the American Correctional Association (ACA). ACA accreditation allows for a standardized quality measure, and the standards themselves are established and continually revised by a committee within the organization. Generally, public-private partnership prisons must obtain and maintain ac-creditation by the ACA. This accreditation is often required of private prisons as part of their contracts. In 2002, there were a total of 5,000 detention facilities in the United States, of which 532 were accredited. Of the 532, 465 were public and 67 were private. At most, 10 percent of government facilities were accredited, while 45 percent of private institutions were accredited (Segal and Moore, 2002, p. 12).
Contracts with private prisons also include per-formance measures to ensure quality performance is maintained, and monetary penalties are assessed for unsatisfactory performance. The contracts often require at least equal performance to that of the state facilities. An Ohio corrections official stated that their contracts include quantitative performance measures that ensure quality. Renewal of contracts is, of course, aided by good performance.
Private firms are often required by contract to provide measurable performance, a requirement that does not always apply for the public sector facilities. For example, in Florida, the Chamber of Commerce in 2012 provided data showing greater provision of education, training, and vocational services for in-mates in private facilities (see section 12 on Florida below). This higher level of rehabilitation and inter-vention services can be seen in other states as well. For example, in Kentucky, the Legislative Research Commission stated in a 2009 report (p. 19): “All three contracted prisons offer more programming than the comparable state prisons. In particular, the state-operated Little Sandy Correctional Complex and the contracted Lee Adjustment Center have little programming in common except for work, GED, Narcotics Anonymous/Alcoholics Anonymous, and prerelease programs. The Lee Adjustment Center provides a number of vocational training opportuni-ties not offered at Little Sandy.”
Beyond the efforts to assure quality through accreditation and contracts, the existence of com-petition by private prisons constrains price increases of labor and improves efficiency in the use of labor. For example, the existence of the private option has changed staffing patterns in Oklahoma public pris-ons, which has led to useful consolidation of some case manager roles and improved food services. In Ohio, private correctional officers are trained with public officers at the same academy. Their staff meet-ings include both private and public wardens. This indicates identical training of officers and collabora-tion between the public and private institutions that could suggest similar levels of staff knowledge, orien-tation, and performance. This is, indeed, a practice that is highly likely to improve mutual learning and performance by both sectors.
11 | Unaccounted Cost and Benefits of Contract Prisons
Private prisons provide additional benefits to state governments besides providing savings from their operation. Perhaps most significantly, private prisons pay income and property taxes while state facilities do not. In Arizona, for example, the economic consult-ing firm of Elliot Pollack and Company (2010, p. 1) determined that one private contractor paid over $26 million in taxes to the state and local governments in 2009 alone. Such state or local revenues could be used to reduce taxes or to finance other government functions. These taxes could increase the state income and employment by the familiar multiplier effect. We did not quantify such benefits, but their existence should be recognized.
Overcrowding diminishes both the short- and long-run inmate per day monetary costs. When prisons are operated over capacity, additional inmates added to the facility are significantly less expensive to house than in a facility that is operating at or below capacity. This is because in an overcrowded prison the fixed costs associated with the operation have already been accounted for. Therefore, the marginal cost of housing each additional inmate does not include

| 29Prison Break: A New Approach to Public Cost and Safety
any “overhead” costs. As prisons become more over-crowded, the lower marginal cost of each additional inmate drives down the facility per inmate average cost. Because state-run prisons are much more likely to operate under overcrowded conditions (for exam-ple, California), the average “per inmate cost” is un-derstated compared to private facilities operated at or even below capacity. While this is a highly significant factor in comparing costs, we have not accounted for this difference in our analysis.
In spite of achieved cost savings from overcrowd-ing, research has shown the quality of service and the level of security are substantially reduced. In the case of California, the courts have concluded that security problems and deficient medical care resulting from overcrowding led to unwarranted deaths and suffering of the inmate population. In addition to jeopardizing inmate and staff safety, the remedies mandated by the courts far outstrip the perceived savings achieved from operating overcrowded prisons. See the discussion of judicial decision in the case of California in the next section. Further, cost comparisons would tend to be biased against private facilities if their utilization rates were lower than public facilities.
Private prisons are monitored by state DOCs. In some states, contract prisons are monitored by on-site inspectors, while in other states inspectors monitor randomly during the week. In any event, this is more rigorous quality control than the monitoring of state prisons. Also, managers and employees in private prisons do not enjoy sovereign immunity like public prison officials, encouraging private personnel to be more cautious in dealing with inmates. Finally, un-like public prisons, private prisons bear all liabilities, including fines and damage payments. Hence, the private sector has a greater incentive for good perfor-mance, which is largely unaccounted for in this study.
Evaluation of private versus public prisons re-quires consideration of legal issues and their cost implications, as well. In private correctional facili-ties, disciplinary actions require involvement of the aforementioned state monitors, while this may not necessarily be the case in similar public facilities. Wardens in public facilities have greater autonomy to handle these claims, as they do not generally have
staff that serves in these oversight functions. This oversight (or lack thereof ) has legal cost implications. As mentioned above, private correctional officers lack sovereign immunity, which means they are more vul-nerable to litigation.
While the lack of sovereign immunity could be argued to reduce the willingness of officers to pursue escapees beyond the private facility (Sanders, 2012), in practice, both private and public correctional facilities normally request law enforcement involve-ment during such incidents. Furthermore, private companies are often required by contract to involve law enforcement agencies. In fact, this use of law enforcement and planned collaboration must be laid out clearly by private contractors not only in their contracts but also in the emergency plans required for the initial requests for proposal.
Further encouraging good performance of pri-vate contractors is the fact that the contract usually requires indemnifying the state for any malfeasance. On the other hand, the U.S. Supreme Court held that private correctional officers are less vulnerable for violating the Eighth Amendment to the U.S. Consti-tution against cruel and unusual punishment. In the case of private prisons, inmates charging violations must first exhaust any state remedies before claiming constitutional protections (see Minneci v. Pollard, 565 U.S. ___, 132 S. Ct. 187 (2012))
12 | A General Discussion of Individual State Costs and Performance
Thirty of the fifty states used private prisons in 2010. The extent of usage varies from New Mexico’s 43.6 percent of inmates confined in contract prisons to South Dakota at 0.1 percent. Overall, 6.8 percent of all state inmates were in contractor-operated prisons. The states that generally have a large number of pri-vate inmates were all in the south. The leading states in their overall number of private prisoners were Texas and Florida. After those two states, those with the highest number of privately held prisoners in de-scending order were Oklahoma, Arizona, Mississippi, Georgia, and Tennessee. These seven states accounted
the independent institute30 |
for 49 percent of all state-held prisoners in private facilities (U.S. BJS, 2011; Gilroy and Kenny, 2011).
In this study, we analyzed in detail six of the seven states, as well as California, which experienced a recent significant increase, and Ohio, which sold a large prison to a private contractor. A lack of avail-able data prevented us from including Georgia. We incorporated Maine, which did not contract out for corrections services. However, it had good data for comparison of its state-operated prisons. The US GAO (2012) report on the costs of federal prisons was included in order to supplement for missing data. Maine and the federal report also provided necessary benchmarks and standards to appraise the state data.
ArizonaArizona has employed contract prisons since
1986. State law requires that private providers deliver the same level of service at lower cost to the state or a superior level of service at essentially the same cost. Contracts with the Arizona DOC (ADOC) also re-quire that the state take ownership of a prison financed by the private sector when the contract term expires, typically after twenty years, and at no cost to the state (Arizona State Legislature (2014) and Harris (2013).
Until a 2010 state cost report, public-private partnership prisons in Arizona were shown to achieve cost savings. The reasons why the 2010 report reached a surprising and, we believe, incorrect conclusion includes inadequately addressing depreciation and correctional officer retirement costs.
The ADOC used depreciation based on original prison cost. This is significant because this approach underestimates the actual cost of public prisons, which should be based on what it would cost in 2010 to finance and build a public prison. The Arizona Joint Legislative Budget Committee Staff (JLBC, 2012) did such an analysis and employed a twenty-year life. This yielded a state per-diem per-inmate cost of $10.71 instead of the $1.41 the ADOC reported. The $10.71 also includes the interest payments for capital costs paid by the ADOC. However, the bud-get should still have included the $0.04 interest that other state agencies incurred but Vera determined were attributable to corrections. The JLBC also found
that the state retirement system was underfunding its pension contributions by overestimating expected investment returns. This correction added $2.67 per day per inmate to state costs.
Finally, medical costs were properly handled. The state provides all the required medical care at selected ADOC prisons, while private contractors have limits on the care they are required to provide as part of their contracts based on ADOC-requested RFP stipulations. Accordingly, the JLBC staff simply mimicked what the ADOC did and reduced state costs for medical services by $10.08 and private contractors’ by $7.64.
ADOC did not report any short-run indirect costs. Instead of incorporating from the Vera report the unaccounted $0.16 hierarchical costs, we included the 11 percent indirect costs calculated in the US GAO (2012) report. The range for such costs in our analyzed states is $1.30 to $8.09 with concentration in the $5 to $6 range. Taking into account that 75 percent of the indirect costs are not avoidable, the long-run savings would be 22.34 percent for the minimum-security prison and 14.25 percent for the medium-security prison. In the case of Arizona, which faces overcrowd-ing conditions, the long-run savings are relevant.
CaliforniaCalifornia contracts with private providers to
assist in housing its inmate population both in state through contracts with community correction facil-ities, as well as out of state to house approximately 9,000 medium-security inmates in prisons in Ari-zona, Oklahoma, and Mississippi. The utilization of public- private partnership prisons by California is done primarily to reduce severe overcrowding in state prisons but has the added benefit of providing significant operational savings to the state as well. We calculate that privatizing a portion of its inmate man-agement has saved California approximately $164 million a year. This is in addition to the billions of dollars that the state has saved by not financing con-struction costs to add additional prison capacity. As discussed below, the state has been able to utilize the flexibility that contract prisons provide to institute other policy measures to reduce overcrowding in its state prisons to help meet court mandates.

| 31Prison Break: A New Approach to Public Cost and Safety
California experienced a substantial increase in its prison population during the 1990s and 2000s, going from 76,000 in the late 1980s to 171,000 in 2008 to 2009. This increase was so great that by 2008, the system was operating at 188 percent of its designed capacity, and it operated at almost double capacity for at least 11 years (Brown v. Plata, 2011, p. 1924). The designed capacity is considered to be one inmate per cell, with no inmates housed in gyms or day rooms.
The overcrowding in California prisons led to problems in delivering adequate healthcare. In April 2001, Plata v. Brown plaintiffs claimed in a class action suit that California provided such inadequate medical care that it violated the cruel and unusual punishment amendment to the U.S. Constitution (CALAO, 2012a). The court held that the system was “broken beyond repair” and that death and suffering had resulted. California in 2002 agreed to improve the healthcare situation. However, in 2006 the court held that insufficient progress had been made, deter-mining that overcrowding led to security restrictions on inmate movements that prevented inmates from receiving appropriate and timely care. As a result, the court placed a federal receiver in control of inmate medical care, taking the state out of the manage-ment of the prison’s healthcare system. That receiver remains in place today.
In August 2009, a three-judge panel upheld the ruling and ordered that overcrowding be reduced to at most 137.5 percent of designed capacity within two years in order to provide adequate healthcare, a decision that was affirmed by the U.S. Supreme Court in May 2011. At that time, overcrowding and its re-lated severe medical consequences persisted. The U.S. Supreme Court in its 2011 Brown v. Plata decision (p. 1927) noted that on average one inmate died need-lessly every six to seven days because of the adverse consequences of overcrowding. The Supreme Court ordered that California reduce its prison population to the 137.5 percent figure by June 2013. This meant that the state had to reduce its inmate population by about 39,000 to comply with the ruling.
California responded by instituting a policy commonly referred to as “realignment,” which essentially shifted the responsibility of housing
inmates convicted of certain nonviolent crimes from the state prison system to county jails. Realignment, coupled with the continued utilization of contract prisons, has enabled the state to reduce its inmate population by approximately 37,000. However, in 2013, despite these reductions, the state was still op-erating its prison system at 150 percent of capacity. The U.S. Supreme Court in August 2013 upheld the lower court order to release by the end of December 2013 almost 10,000 inmates, which would finally reduce the number of inmates to 110,000 or 137.5 percent of designed capacity (Elias, 2013).
In 2010, the state housed 8,021 male inmates in five contracted facilities out of state (CALAO, 2010). The California State Auditor (2009) determined that the California Department of Corrections and Rehabilitation (CDCR) spent an average of between $3,200 and $7,800 less per inmate to house 2,226 inmates out of state than it would have spent in Cal-ifornia prisons during 2007 to 2008. These savings refer just to the short-run operating costs, while the correct savings in the case of overcrowding, as dis-cussed earlier, should relate to the long run and would be even higher. In any event, the Auditor noted the usual difficulty of determining comparable inmates. In 2013, California signed contracts with GEO and CCA to house over 3,000 low- and medium-security inmates in three private prisons within the state.
The issue of monitoring costs for out-of-state facilities is important. For example, the CALAO reported that the out-of-state program required seventy-three monitoring positions for five contract prisons. Given that other states have one or at most three monitors per prison, the figure of seventy-three is unusually high.
The CALAO reported that in 2011 California paid between $61 and $72 per day per inmate in out-of-state facilities. The relevant average cost for its in-state public prisons was $104, or about 55 percent more than the price paid to the public-private partnership prisons.
While the state has been able to enjoy substan-tial savings by contracting with private providers, it has begun to look at replacing older and expensive facilities through new construction. In the 2012 legislative session, California authorized its Public

the independent institute32 |
Works Board to sell $810 million of revenue bonds to build 2,400 dorm beds at existing state prisons at a cost of $337,500 per bed (California Public Works Board, 2012). Assuming a twenty-year amortization, as was the case in the Arizona example above, with an annual interest rate of 3.75 percent, the average annual interest rate for a municipal bond, principle and interest costs to the state equates to $66.70 per inmate per day without any costs for operating the prison. The cost to house an inmate out of state in a private facility averages $64.82.
Overcrowding has been costly to California. Med-ical care expenses doubled between 2007–2008 and 2011–2012, reaching $43.95 per inmate per day. This compares to Maine’s $16.67, which was the next high-est medical cost per inmate of the states we reviewed. All other examined states ranged between $6 and $11. The court order increased California’s medical costs over that period by $1.08 billion annually. The other high-cost item for California is personnel services, which are primarily security related. California’s per diem for personnel services is $67.01, which was sec-ond to Maine’s $79.25. Texas was third with $40.92. Florida’s was $38.83, while personnel services for all other states examined ranged between $20 and $30. (Oklahoma showed high costs just for its maximum- security prison, which was not a major part of our analysis.) Noteworthy, both California and Maine, which exhibit high medical and personnel services costs, are the only states in our sample that lacked competing contract prisons within their borders.
Florida Some states require private prisons to achieve
specified savings to obtain and maintain their con-tracts while still satisfying performance standards. For example, under Florida law a contractor must prom-ise and then achieve savings of at least seven percent over comparable public prisons. The Office of Pro-gram Policy Analysis and Government Accountability (OPPAGA) of the Florida Legislature conducted an analysis of four privately operated prison contracts and reported on April 20, 2010, that all four contracts achieved the required savings and recommended their consideration for renewal (OPPAGA, 2010a).
The privately operated Bay Correctional Facil-ity had a per-diem cost of $52.73 compared to the comparable public prisons of $56.98 for savings of 7.5 percent during the two-year study period. The privately operated Moore Haven Correctional Facil-ity had two-year savings of 12.5 percent, while the contract Graceville Correctional Facility had savings of 22.1 percent for the one year when a comparison could be made. Finally, the contract Gadsden Correc-tional Facility had two-year savings of 28.3 percent.
OPPAGA concluded that the contractors’ performance in dimensions other than costs was acceptable. Performance criteria included such security requirements as key control, perimeter cameras, and filling vacant positions in a timely manner. Health ser-vices in particular were found to be well delivered. It is also noteworthy to point out that contractor-operated prisons provided more substance abuse and education programs, according to OPPAGA, than the comparable public prisons, so much so that costs had to be added to the public prisons for appropriate comparison.
OPPAGA also noted that a major reason for the cost advantage of private prisons is the higher retire-ment expenses for public prison employees than those provided by private contractors. Public correction officers have an amount equal to about 21 percent of their salaries contributed to a retirement fund, whereas private correctional officers receive matching contri-butions to their 401K funds of up to 5 percent of their salaries. Other reasons for the cost advantage of private prisons include higher costs for providing educational and substance abuse programs at public facilities and a higher allocation of administrative costs.
Florida’s evaluation of private prisons has yielded some important evidence about performance. Specif-ically, OPPAGA’s Information Brief Comparing Cost of Public and Private Prisons of March 1997 noted that per-diem public prisons costs rose less than 1.5 percent annually between financial years (FYs) 1992–1993 and 1995–1996. OPPAGA noted that competition induced by the privatization of some prisons might have produced greater efficiency in the public prison system (OPPAGA, 1997: 6). In a study of private prisons in Florida including a comparison of other state systems prepared for the Florida Department of
| 33Prison Break: A New Approach to Public Cost and Safety
Management Services (MGT of America, 2006: 33), the three lowest per-diem inmate costs included Texas, Georgia, and Florida—all states with competing pri-vate prisons. The authors suggested that use of con-tract prisons lowered costs of state-operated prisons, as well. This finding is consistent with a later Vanderbilt University study conducted on all fifty states, which concluded that states with private prisons experienced 2.64 to 3.15 percent lower growth in public prison costs. These savings had a two-year lag. The study concluded that learning or possibly competition cause the public savings (Blumstein et al., 2007).
The Correctional Privatization Commission of Florida responded to OPPAGA’s brief by claiming that the private prisons must satisfy higher performance standards than state facilities. The Commission stated that private prisons must indemnify the state against any liability, are subject to greater monitoring, must achieve and maintain accreditation by the American Correctional Association, and must provide a broad range of education and technical programs. The Commission noted that the two private prisons had achieved earlier accreditation than required by their contract and their scores were the highest ever achieved by any Florida prison (OPPAGA, 1997: 9–10).
The Florida Chamber of Commerce reported in 2012 that the number of inmates per staff to provide rehabilitation services was 1 per 38 in private prisons and 1 per 272 in public prisons in DOC Region IV. In fact, 79.3 percent of inmates in the private cor-rectional facilities participated in such educational, vocational, and life skill training compared to 21.3 percent in public facilities (Florida Chamber of Commerce, 2012). At a minimum, these data show that private facilities can and do provide programs to reduce the likelihood of recidivism.
In a 2012 presentation by the Florida Depart-ment of Management Services (FLDMS) before the Florida House Appropriations committee, the per-diem costs of six contract prisons were compared with the most similar public prisons in Florida. Short-run savings from 2007 to 2009 ranged between 10 and 27 percent (Florida Department of Management Ser-vices, 2012, p. 9, and documents provided by Florida Department of Management Services, November 12,
2013). Indicative of Florida’s approval of the contract prisons, the presentation stated that in 1993 there was one contract prison of 800 beds, in 2004 there were five with 4,304 beds, and in 2012 there were seven with 10,128 beds (p. 3).
An earlier study conducted for the Florida Department of Management Services (MGT, 2006, p. 26) compared the costs for the private South Bay and Lake City Correctional Facilities against imputed costs for similar public facilities. The study showed that in the period from 2004 to 2006, the percentage savings were 19.4 and 11.2, respectively.
As for the long run, some states like Florida (and Texas) employ a BTO system for private prisons whereby the private firm bids to build a prison and the state finances it and pays the private firm for man-aging the construction process. The private firm then transfers ownership to the state and is given a lease to operate the facility for some years, usually renewable upon satisfactory performance. For Florida, the firm must save 7 percent both in operating or short-term costs and also in construction costs compared to a state-operated and built facility.
A 2010 study by Florida’s OPPAGA (2010b) has shown such additional construction benefits besides operating costs. The comparison was between a state prison for 3,288 inmates, Suwannee Correctional Institution (whose main unit was designed for 1,521 inmates), and a private prison, Blackwater River Cor-rectional Facility, designed for 2,000 inmates. Both facilities were designed and built for close custody in-mates and those with mental health problems. The state facility could accommodate more severely ill inmates.
Comparing the main unit of Suwannee and the comparable Blackwater River facility, OPPAGA deter-mined that the per-bed costs for the private and public facilities were, respectively, $57,682 and $64,277, so that the private facility was shown to have achieved about 10 percent savings, in excess of the required 7 percent. It is noteworthy that the facilities had about equal costs if the total facilities were compared. How-ever, OPPAGA concluded that this would not be a fair comparison because the public facility (i.e., Suwannee), among other reasons, included a work camp whose construction was far less costly than a regular prison.
the independent institute34 |
Additional site development is a major reason for public facilities having higher costs. With Suwanee and Blackwater, site infrastructure cost $12,070 per bed for the public facility compared to $4,512 for the private prison. Blackwater took advantage of Santa Rosa County’s interest in encouraging companies to locate there. The county charged no impact fee other than the $3.6 million land cost. Meanwhile, Suwan-nee required infrastructure to bring water, gas, and a sewer to the prison, which was seven miles from the City of Live Oak. The public prison had to reimburse the city $3 million for an impact fee to upgrade water facilities and replace the county sewer plant.
The contract prison was also built quicker than the public prison. The public prison was authorized by the legislature in 2006 but was not completed until October 2009, whereas the private prison was autho-rized in 2008 and completed in July 2010. In general, OPPAGA reported that private prisons are built in eighteen to twenty-four months compared to thirty-six months for public prisons. The private firms are not burdened by the cumbersome public sector require-ments involved in selection of contractors, subcontrac-tors, and the process of selecting site appraisers. There are also important differences in the construction itself of the prisons. Blackwater, the private prison, installed air conditioning, which obviously contributes to more comfortable living and working conditions and may alleviate inmate tensions in hot weather. The Suwanee public prison installed a less costly dehumidification system. In addition, the public prison employs a centrally located guard tower to watch over inmates, whereas the private prison employs cameras, reflecting the private prison’s greater reliance on technology. Finally, the private prison does not have a central din-ing room but provides food in the living quarters of the inmates. The private prison thereby reduces cost of construction, enhances inmate control, and may reduce staffing requirements (OPPAGA, 2010b).
KentuckyOvercrowding in state prisons during the 1970s
and 1980s led Kentucky to use private prisons. The first contract for use of private prisons occurred in 1986. The state also used county jails to house
inmates. The number of inmates in all correctional facilities increased from an average of 15,164 in fiscal year 2000 to 22,553 in fiscal year (FY) 2009 (KLRC, 2009). As we found in our analysis, the long-run savings realized by Kentucky through contractor- operated prisons has been significant, ranging from 12.46 and 23.50 percent.
In FY 2009, 54 percent of inmates were in state prisons, 34 percent were confined in local and regional jails, 5.5 percent were in three contract prisons, and the remaining 6 percent were in halfway houses or home custody. A rough indication of rela-tive cost is the fact that state prisons held 54 percent of the inmates and accounted for 64 percent of the DOC’s cost while contract prisons with 5.5 percent of inmates cost the state 5.3 percent.
Kentucky statutes and/or contract terms require the private prisons to achieve accreditation by the American Correctional Association. The contracted prisons must achieve savings of at least 10 percent compared to comparable state institutions and must provide similar education, training, and substance abuse programs as state facilities. The contracts have required that Kentucky guarantee and pay for mini-mum numbers of inmates. For example, at the Otter Creek Correctional Center, the FY 2009 contract required that the state pay for a minimum of 90 per-cent of the contracted beds or 429 beds of the 476 contracted beds. This means that the extra cost is zero for housing an inmate in a contracted prison when the state occupancy is below the guaranteed rate. Moreover, in the contracted Lee Adjustment Center, inmates from Vermont were housed to fill beds not contracted to Kentucky.
The required occupancy agreement is a common business practice. Kentucky saves capital outlays for building a prison when it has no unused capacity. Savings may also arise from avoiding labor costs, facility maintenance, and other operating costs when occupancy of the state prison is well below capacity. At the same time, the private contractor has to be protected against possible significant losses when occupancy is below a certain level. In the absence of such required occupancy, contractors may not build facilities and the state will bear higher costs.

| 35Prison Break: A New Approach to Public Cost and Safety
In 2013, the Kentucky Department of Cor-rections provided overall prison per-diem costs for contract and state prisons (Kentucky Department of Corrections, 2013). The public prison cost for FY 2012 was $60.14 compared with $46.80 for contract prisons. In any event, the savings from contract pris-ons were about $13 per inmate per day or 22 percent. This is not a comparison of comparable facilities.
In an earlier study, the Kentucky Legislative Re-search Commission (KLRC, 2009) noted that com-paring public and contracted prisons was difficult both because of differences in inmate characteristics and differences in the facilities themselves. In any event, the KLRC found for FY 2009 that the aver-age cost per inmate in the privately operated Marion Adjustment Center was $40.02 and the relevant state cost was $56.75. For privately operated Otter Creek, the cost to Kentucky was $53.60 compared to $77.96 for the most comparable state facility. Privately oper-ated Lee Adjustment Center’s cost was $58.04 com-pared to the relevant state cost of $47.53. However, it should be noted that only fifty beds were contracted at Lee compared to 826 at Marion and 476 at Otter Creek, the other two contract prisons. The annual savings for Marion was $5,043,928, $4,232,302 for Otter, and losses of $189,983 for Lee. For all three prisons combined, the short-term annual savings for the state were $9,086,251. Further, since Kentucky contracted out for overcrowding reasons, the long-term costs for public prisons should be considered and, thus, the savings for the state were even higher.
If only the per-diem rate were compared to the state costs, the private contractors appear more cost effective. This is because the state pays for some pre-scription drugs and hospital expenses for inmates of contract prisons, as well as the costs for monitoring contract compliance. Accordingly, the per diems for Marion were $34.54 and $43.62 for minimum and medium security, respectively. The blended rate at Lee was $43.62, and at Otter Creek, it was $51.17. In terms of performance, as discussed in Section 10, contracted prisons typically offer more programming than do state prisons (KLRC, 2009:19). In terms of safety, there is no clear difference (KLRC, 2009: 67–68). More grievances were filed in contracted prisons.
However, as the KLRC (p. 70) notes, this could be because inmates feel secure enough to complain. They do not fear retaliation or they are confident that their complaints will be addressed.
MaineMaine, which does not utilize private prisons,
has only 2,038 inmates. The state, however, main-tains detailed data for almost all categories of public corrections costs. Interestingly, the short-run prison costs are $117.36 per inmate and the long-run prison costs per inmate are $127.95, including an imputed depreciation figure of $4.61 from the US GAO (2012: 13). Maine’s costs for both short and long run are double that of most other states exam-ined. The reasons could be inability to exploit econ-omies of scale and high costs emanating from lack of competition provided by private prisons. Maine has four adult prisons, housing an average daily census in 2011 of 141, 147, 658, and 1,008 (Maine Office of Program Evaluation and Government Account-ability, 2012: 2). Thus, only one prison is efficient in size, while the others suffer from diseconomies of scale with higher costs for similar services of at least 15 percent. The short-run cost per inmate per day in the other examined states is approximately $50. Adding the 15 percent cost penalty yields $57.50, while the additional cost attributed to lack of com-petitive pressure provided by the private prisons imposes costs on Maine of up to $60 per day.
Maine’s neighboring state, Vermont, contracts out inmates to prisons in Arizona, Kentucky, and Massachusetts for $65.75 compared to $137.00 for housing inmates in its own state prisons. Vermont’s in-state costs are similar to those of Maine (Picard, 2011). Although Maine does not contract out in-mates, it seems important to show what Maine could save if it contracted out at its neighbor Vermont’s prices. In 2011, Maine was almost at capacity. Thus, if Maine chose to contract out existing inmates then the avoidable costs would be merely short run. The savings would be $69.93 per inmate per day or 51.54 percent. However, given the fact that Maine is already operating near capacity (capacity is considered in the range of 95 to 98 percent), savings resulting
the independent institute36 |
from contracting out of additional inmates would be $69.12 per inmate per day or 49.15 percent. These would be long-run savings because additional inmates would require public capital expansion.
MississippiMississippi’s contracting with private firms to
provide inmate correctional services began in 1994. Legislation allowed county boards to build and con-tract with the sheriff ’s department or for a private firm to operate and manage the facility. The first such facility was built in 1996 and was a combined jail and regional facility. An interview with a Mississippi DOC official revealed that in 2012, the DOC paid $29.54 per day to house 300 inmates in the original facility. Under this arrangement, Mississippi state government pays the debt services and, at the end of twenty years, the facility becomes state property. Pri-vate firms also built and operated their own prisons.
In 2012, five correctional facilities were man-aged and operated by private firms. They were built by counties and then leased to private firms. Four were 1,000-bed facilities, and one had 1,500 beds. A typical per-diem rate was $29.74 plus medical, since the state paid all hospital expenses beyond the first seventy-two hours. The latter was the responsibility of the contractors.
Mississippi is a statutory savings state, which means that it must obtain the required 10 percent savings over public prisons in order to have private firm operation. This constraint led to the 2011 vol-untary termination of CCA’s contract to operate the Delta Correctional Facility because CCA considered the required $31.16 per diem (10 percent less than the state’s $34.61 cost) to be unacceptable (Gilroy, 2011).
Mississippi was experiencing a decline in prison pop-ulation, so the closure of the Delta facility could be easily accommodated by moving inmates to other facilities.
The contract prisons have to meet other non-price requirements as well. They must attain Amer-ican Correctional Association accreditation within fourteen months of beginning operation. Further, each of the five contract facilities has a monitor who is a state employee but is paid as part of the contract per diem.
OhioOhio began the process of private participation
in correctional institutions in March 1998 when the state legislature passed a law mandating that the Ohio Department of Rehabilitation and Correc-tions (ODRC) engage private firms to operate and manage the North Coast Correctional Treatment Facility (NCCTF), a 552-inmate, minimum-security substance abuse treatment facility for adult males, and the Lake Erie Correctional Institution (LECI), a 1,380-inmate, minimum/medium-security facility (material supplied by ODRC).
The initial contractor for the NCCTF, Civigen-ics, held the contract from September 1999 until replaced by MTC in fiscal year 2002. MTC agreed to a per diem of $62.87 for fiscal years 2002 and 2003, and Ohio reported savings compared to state oper-ation of 5.02 and 5.92 percent, respectively, for the two years. Savings for subsequent years were about 17 percent, attributed to cost containment efforts by MTC. State operations would have cost $79.77 per inmate per day, according to Ohio officials.
More recent contracts provided additional sav-ings for inmate populations in excess of 552 up to the maximum of 612 inmates. The 2006 fiscal year rate, for example, was $42 instead of the $65.08 rate for the first 452 inmates. This is likely a result of economies of scale that extend to inmate popula-tions of at least 1,000 in minimum/medium-security prisons discussed elsewhere in this report. Moreover, subsequent contracts after 2006 held annual increases below the Consumer Price Index (CPI), and the ODRC reported savings to be about 16 percent.
The contracts required MTC to maintain staffing at or above a certain level and provide a full range of ed-ucation, health, rehabilitation, and training programs. The facility also had a Community Advisory Board and community volunteers, which help inmates and assured community member integration. The facility scored 100 percent on ACA accreditation standards.
It is important to note how Ohio determined some of its state cost data, which are compared with private prices. The ODRC uses a sophisticated model that includes program-specific costs (ODRC, 2007). State costs are estimated based upon local condi-

| 37Prison Break: A New Approach to Public Cost and Safety
tions, and the experience of similar ODRC facilities adjusted for inflation. ODRC indirect costs are based on recent departmental reports.
LECI opened in April 2000 with MTC as the contractor. The ODRC determined that the per-diem rate of $39.94 for fiscal year 2002 yielded savings of 12.55 percent compared to state operation. Addi-tional cost savings for fiscal year 2003 were achieved by cutting 1.2 full-time equivalent staff and reducing the annual increase of prices to 0.5 percent instead of the CPI increase. Cost savings for fiscal years 2003 and 2004 were determined by the ODRC to be 12.94 and 16.69 percent, respectively. Contracts for subse-quent years included lower rates for inmates between 1,380 and 1,480. Contracts for subsequent years also held per-diem rate increases below the increase in the CPI, and savings were determined by the ODRC to be about 6 percent. Similar to NCCTF, an advisory board, community volunteers, and a 100 percent score on ACA accreditation were achieved.
In September 2011 the ODRC announced the sale of LECI to CCA for $72.7 million. The firm would also operate the facility and expand the capac-ity by 304 inmates. Annual savings of 8 percent in operating costs were expected.
Turning to the findings, Ohio’s short-run savings from contracting out prisoners were 13.44 percent for 2010 and 4.14 percent for 2012. The respective savings for the long run were 26.81 percent and 20.28 percent. The statutory requirement in Ohio is 5 percent, and our calculations are in line with the ODRC. The ODRC provided us with its calculated savings, which ranged between 6 and 23.7 percent for the fiscal years 2002 through 2008 for one facility. For the other privately operated facility, the savings ranged between 8.5 and 18.1 percent for the fiscal years 2000 through 2008. All these savings related just to the short run. In any event, the appropriate comparison should be done on a long-run basis, since Ohio avoids construction of new prisons and enjoys flexibility for changing inmate population.
As for indirect costs, the only item available was Vera’s administrative cost, which we termed hierarchical costs of $1.4 million or $0.08 per inmate per day for fiscal year 2010. It is likely that other indirect costs are
missing, and the same discussion that we had for Ari-zona applies. We chose to be conservative in our calcula-tions and ignored these costs, since Ohio’s savings from contracting out were above the statutory requirements.
The difference between the public long-term costs and the price paid for private prisons in 2012 was $16 per inmate per day. This difference is attributed to cap-ital and interest costs of $9.63 per inmate per day and unaccounted pension and healthcare costs of $2.64 per inmate per day, totaling $12.27 per inmate per day. Thus, only $3.73 per inmate per day, or 23 percent of the savings, could be attributed to all other elements of cost including labor. In other words, lower pay to correctional officers by the contractor-operated pris-ons is a small component of the savings. Indeed, our interviews with ODRC personnel revealed that public correctional officers earn only $1 more per hour than their private counterparts. Differences in labor produc-tivity and purchasing power savings of private prisons are additional elements that comprise the 23 percent. Thus, differences in wage costs could not exceed 23 percent of total savings for contracting out.
OklahomaOklahoma began contracting out inmates to pri-
vate contractors in 1998 as a result of overcrowding in the state’s public prisons. The Oklahoma Department of Corrections (OKDOC) considers overcrowding to occur when capacity utilization reaches or exceeds 95 percent. Oklahoma statute 54, section 570, the Oklahoma Prison Overcrowding Emergency Powers Act, provides the authority for such contracting out to private contractors.
OKDOC in 1995 initially used county jails to house inmates, but capacity at county jails was soon exhausted. The OKDOC then contracted with pri-vate providers to house inmates in Texas. In Decem-ber 1995, OKDOC contracted for 510 male beds and 50 female beds with Texas. As of April 15, 1997, contracts for 2,285 male inmates and 423 female in-mates were in effect at eight Texas facilities operated by six companies. Monitoring of the Texas facilities proved difficult, and some problems occurred at one facility. Oklahoma had only two contract monitors and had to rely on volunteers (Oklahoma Depart-

the independent institute38 |
ment of Corrections, 2012). Accordingly, when space became available in Oklahoma private prisons, the inmates were relocated to Oklahoma. By October 1998, all inmates housed in Texas had been relocated to private prisons in Oklahoma. In December 2000, 5,824 male inmates were in five Oklahoma contract prisons operated by three companies, and 872 female inmates were in one private prison.
As of September 2011, 4,738 offenders were in Oklahoma private prisons. In 2011, the OKDOC determined that the $41.79 per-diem rate at the private facilities was comparable to the $42.41 daily cost in medium-security state prisons. The OKDOC cost comparison does not include capital costs and is evidently done on a short-term basis. However, even for the short run, public prison costs should incor-porate the unfunded pension and retiree healthcare for current employees. Moreover, the comparison should be done on a long-term basis. Indeed, as the OKDOC stated: “It appears continued housing in private facilities is a viable alternative to the massive capital outlay required for construction” (document provided by OKDOC). Thus, a true cost comparison between public and private beds in Oklahoma should consider capital costs to build a new facility, because the OKDOC currently operates close to 100 percent of capacity in its public prisons.
Of note, Oklahoma has not built a public prison since 1976; however, it did buy a 600-bed private prison in 2000 for about $27 million. Its public prisons in 2012 operated at 98 percent of capacity. Oklahoma in 2012 contracted with private prisons in the state which housed almost 7,000 inmates, including out-of-state and halfway house inmates, while its state prisons held 18,000 inmates. The state contracted out medium- and maximum-security inmates. Private prisons in Oklahoma also held prisoners from Hawaii, California, Colorado, and Idaho. An OKDOC official claims that inmates who commit crimes while in Oklahoma private prisons impose a cost for adjudication and punishment by the Oklahoma justice system. On the other hand, contract prisons pay state and local taxes, provide employment, and purchase local goods and services. Determining the net financial impact of out-of-state inmates on Oklahoma is beyond the scope of this study.
Oklahoma uses public-private partnership prisons for population management. Instead of building new prisons, Oklahoma contracts with private prisons, providing important flexibility so that new prisons are not needed. If capacity utilization is low, fewer inmates are sent to private prisons. Clearly, when comparing private and public costs, the public costs should incorporate all the long-run capital costs.
Contracts with prison operators require certain performance standards. For example, one such con-tract requires that 80 percent of inmates be involved in education and job training programs. Private prisons must pay for inmate medical costs under $100,000 with a cap of $50,000 for a single episode. The state covers the rest. As in other states, OKDOC classifies all inmates, including those with medical problems, and determines to which prison they are sent. Some contracts specify that the percentage of inmates with particular conditions mirror that in the public prisons.
A 2007 study of Oklahoma public and contractor- operated prisons conducted for the state legislature concluded that private prisons in fiscal year 2006 were less expensive than the most comparable public facilities (MGT, 2007: 3–21). Specifically, the per diems were $47.14 compared to $51.94. The report noted the difficulty of determining comparable facilities. It also stated that the cost difference was in part attributable to the older age of the public prisons, which added to their security problems, in requir-ing higher staffing levels than the newer contractor operated prisons. The study also noted that contractor operator prisons could be built more quickly because the leading contractors have greater experience and expertise in building prisons than almost all states.
The contracts also were shown to provide sub-stantial flexibility for Oklahoma. The state had the option in some of the contracts to buy the contractor- operated facility “at fair market value.” Under the contracts, Oklahoma can reserve beds for up to fifteen days, after which it has to pay for the beds even if it does not use them (MGT, 2007: 3–30).
The report showed that the contracted prices can be so low (as also in Mississippi above) that the private operator chooses to withdraw from the contract. This
| 39Prison Break: A New Approach to Public Cost and Safety
occurred in the case of the Cornell contract when Oklahoma raised the per diem by only 7 percent in the ten years ending in 2006 (MGT, 2007: 3–20).
We now turn to our results. To begin, the public short-term costs are understated since Oklahoma does not fully fund its employees’ retirement pensions. The Vera report (2012) stated that 2.6 percent of the total OKDOC budget, or $11.6 million, was unfunded, and our interview with an OKDOC official indicated that 20 percent of required pension contributions were underfunded. We applied the 2.6 percent to the total short-run cost per inmate per day and obtained the range of $0.99 to $1.99.
Comparing public costs with the private per-diem charges for 2011, we find that in the short run, one contractor-operated, medium-security prison was 2.16 percent more expensive while the other saved 4.35 percent. However, this is an inappropriate com-parison because Oklahoma’s prisons were operating at full capacity even with the use of private prisons. Thus, the only alternative for Oklahoma is to build more prisons and, therefore, the long-run state costs should be considered. The savings from the two medium-security prisons would then be 16.71 percent and 22.02 percent. For maximum-security facilities, the short-run savings from the two private prisons were 27.56, and 29.23 percent. Again, the more appropriate long-run savings were greater, in fact, 35.27 and 36.77 percent.
Salaries of correctional officers in public and private prisons are comparable. For example, be-ginning public correctional officers in 2012 earned $24,605, while private officers earned $24,190, a 1.7 percent difference. The total long-run savings by contracting out medium-security prisoners were $8.63 and $11.37 per inmate per day for the two prisons, which results mostly from capital savings. The two maximum-security prisons achieved savings of $31.58, and $32.92 per inmate per day. Additional savings arose from avoided unaccounted pensions and healthcare costs of $1.29. The cost advantage of public-private partnership facilities likely arises from their greater productivity and possibly greater pur-chasing power. This coincides with the 15 percent greater productivity of private prisons experienced in
Ohio. Thus, the long-run savings from contracting out to private prisons is only marginally attributed to wage differences.
Generally, the quality of private and public prisons is thought to be comparable. The coexistence of public and private prisons has also provided important addi-tional benefits. In response to private prisons, public prisons have changed staffing patterns to become more efficient. Public prisons have also consolidated case management and improved service as a result of the ex-perience with Public Private Partnership (PPP) prisons.
TennesseeTennessee is a statutory state with a 5 percent
required savings on private prison operations. The state owns the facilities, which are leased to private operators. Thus, like Florida, short-run or operational savings are relevant.
Tennessee began the use of contract prisons be-cause of overcrowding during the 1980s. The original 1986 law authorizing contract prisons allowed only one work camp. The legislation was amended in 1991 to allow one minimum- or medium-security contract prison. Tennessee then built three prisons, one of which was leased to a private firm under a three-year contract with a possibility of two-year renewal. This facility has between 1,500 and 1,600 beds. After the five years, the facility must be rebid. The contract prison must achieve 5 percent savings over a comparable public prison providing the same quality of service or higher quality at the same cost. The evaluation of contractor performance is done in the third contract year.
In 2013 and for some time prior, contractor operation has been evaluated through an annual in-spection, review of education services provided, the security level, and other indicia. Tennessee is still per-mitted to have only one contract prison. However, the state can contract with counties to house inmates, and the counties can then contract with private firms. As of 2013, Hardeman County has two contract prisons, one owned by the county and the other by the pri-vate contractor CCA. The one state-owned contract facility is South Central Correctional Center, which is leased to CCA. Each contract prison is overseen by

the independent institute40 |
two DOC monitors. The contract prison wardens par-ticipate in DOC meetings. One warden of a contract facility in 2013 was formerly a state prison warden. The contracts specify training requirements for cor-rectional officers. Some private prison administrative employees receive some training in state facilities. Noteworthy, the state recently considered whether to take over South Central, sell the facility, or continue to lease it. Tennessee decided to continue leasing, sug-gesting state satisfaction with the arrangement.
In terms of contract specifics, Tennessee guaran-tees payment for 90 percent of the contract capacity even if it uses less than the 90 percent. For utilization in excess of 90 percent, it pays the normal per diem. In county contract facilities, the state has termination language that enables the department to remove in-mates with notice as projected needs change.
In April 2010, the Fiscal Review Committee of the General Assembly of the State of Tennessee con-ducted a review of private and public prisons for the fiscal year ending in June 2009. The committee staff reported that the state costs were $53.32 per inmate per day, which meant that the contractor’s price including all state associated costs had to be below $50.65 per inmate per day. The state, after all, still incurred such administrative costs for contract pris-ons as inmate classification and record maintenance. The relevant figure for the private facilities (per diem plus associated state cost) was, in fact, $43.99 per inmate per day, which is $9.33 below the state cost, amounting to savings of 17.5 percent.
The report stated that it was difficult to do a dollar- to-dollar comparison because the relevant facilities have different levels of healthy inmates, although the DOC could not quantify the cost of these differences. Additionally, the report states that private facility had a relatively safer inmate popu-lation based on the number of close custody and maximum- security inmates in each facility. Again, the DOC could not quantify the cost difference.
Tennessee was the only one of our examined states that reported the maintenance and the central administration overheads to be added to the contract price to determine any savings. We followed Tennes-see and calculated the savings considering these costs.
TexasTexas began its legislative process of privatization
in the late 1980s because of prison overcrowding, and the state’s private prisons were built in the mid-1990s. The state also built public prisons the same period. Initially, privatization took the form of state finance by revenue bonds, later by general obligation bonds. Later, the privately operated prisons were built by the contractors, who typically received a seven-year lease, renewable at the end of every two years. The Texas Legislature required that private contractors achieve 10 percent lower costs without specifying whether the savings needed to be in operations or overall costs. In fact, Texas evaluates the savings on operating costs, which is appropriate in this particular case because the facilities are, in general, owned by the state and simply operated by private contractors. The data in Table Appendix 3.1 do not include medical services since Texas contracts with local medical schools for all inmate medical care. Further, if medical care requires more than seventy-two hours, the inmates will be transferred from the private prison to a state prison.
In 2012, Texas contracted with seventeen private prisons comprising one-third of its inmate popula-tion. Most private facilities are minimum security, while some are medium security. Most private pris-ons are small, built for 500 inmates while the one described as a prototype state prison in Table Appen-dix 3.1 is for 1,000 inmates. Of the seventeen private prisons, thirteen were owned by the state under the BTO arrangement, and four were built or renovated and owned by the private operators. Most of the pub-licly operated prisons in Texas are quite old, and the oldest was built in 1856. The prototype state prison is a hypothetical construct developed to compare pub-lic cost against private price by the Texas Legislative Budget Board.
In 2012, Texas had approximately 140,000 pris-oners housed in public and private facilities with a total capacity of 156,000. County jails are used as a relief valve to house prisoners when excess demand occurs. In addition, some of the private prisons specialize in certain types of offenders and are able to offer special treatment. For example, the private prison in Hender-son, TX, specializes in treatment of drunk drivers.
| 41Prison Break: A New Approach to Public Cost and Safety
As of 2012, except for two public prisons in Houston and Dallas, the remaining public and private prisons are located in rural areas or smaller cities, en-hancing the local economy. Positions in these prisons are typically filled by local residents, providing jobs for the local community. Contractor-operated prisons are typical export-based industries that yield income and employment generated from outside the region. These prisons provide jobs and purchase directly and indirectly local goods and services, contributing to the region income and employment by the usual multiplier effect. The contribution of a prison to the economy of a small city is more significant.
The direct costs per inmate in Texas public pris-ons in 2010 were $53.77, indirect were $1.30, and hierarchal were $0.19, reaching what Texas considers average variable costs of $55.26 per inmate per day. This figure is what Texas uses in its calculation for the required 10 percent savings. This would yield a price no higher than $49.73 per inmate per day for the pri-vate facilities. The appropriate avoidable costs should also include the underfunded pensions and retiree healthcare of $4.44, which means that the appropriate required price to reach is $53.73 per inmate per day for private facilities. The price paid to the contractor for the 1,000-bed prototype was $37.47. The con-tract varies for each prison, while prices are typically lower for larger prisons due to significant economies of scale. We learned from Florida that the costs per inmate are 15 percent higher for a 750- inmate prison than for a 1,000-inmate prison.
Our interviews have clearly shown the benefits of the competition among the private contractors. The private companies cannot go below the public perfor-mance standards detailed in the contracts. However, evidence suggests that competition often yields higher performance quality in order to maintain long-term contracts. In addition to competition in pricing, Texas gains additional concessions through individual ne-gotiations that follow the selection of the contractors. Thus, the states and inmates gain more than merely the statutory lower prices in the contract negotiations.
In addition to the actual savings, we learned from our interviews with officials of the Texas Department of Criminal Justice (TDCJ) that contractor-operated
prisons—to a greater extent than state facilities—have employed electronic tracking systems instead of the manual keyboard system. Electronic tracking systems provide greater security since access requires personal identification. In addition, some private prisons exceed the required standard eight-times-a-day count of prisoners. In terms of annual refresher training for correction officers, some private prisons train fifty-six hours annually instead of the standard forty hours for public prisons. Private and public wardens together attend the same monthly meeting held by the six regional TDCJ directors. This clearly indicates the strong partnership and cooperation between the public and private sectors.
13 | A General Discussion of Public Costs and Private Prices
The critical issue of this study is the finding for the savings state governments derived from contract-ing out prison services. When the state legislatures enacted the statutory requirements for savings, they usually did not specify the exact nature of the savings. In this study, we distinguished between the direct operating savings that relate to the short run and the overall savings, which relate to the long run. As indicated earlier in this report, long-run savings are the correct measure, except when a private contractor manages an existing public facility. The typical mo-tivation for public-private partnership prisons is to relieve overcrowding where the only viable alternative is for the state to build its own prisons. Further, given the aging of U.S. prisons, even without overcrowd-ing, some substantial rebuilding is often necessary, making long-run costs applicable. Another lesser but related motivation is to save state resources.
Our study found that contracting out inmates to private prisons saved state governments money while maintaining performance at least at the same quality as public prisons. A head of corrections of a large state suggested that compliance with the detailed contracts helps ensure this comparable performance. Addition-ally, the existence of private prisons fosters competi-tion and helps constrain spending on public prisons.

the independent institute42 |
Short-term savings run the gamut from Oklaho-ma’s loss for medium-security prisons of 2.16 percent all the way to California’s savings of 57.36 percent. Texas and Oklahoma’s maximum-security private prisons had relatively high short-run savings of 37.39 and 29.23 percent, respectively.
As discussed earlier in Section 6, the indirect costs are incorporated in the short-run costs. The reported indirect costs range from $3.72 per inmate per day to $6.64 per inmate per day. We used mostly the es-timates of the Vera report when available. Studies for the legislatures of Oklahoma and Tennessee concluded that about 75 percent of indirect costs continued even for the privatized inmates. In the long run, adjustments often occur and the private prisons might assume more of these currently government functions. Thus, in the long run, a greater percentage of the indirect costs may be avoided. In any case, the magnitude of the indirect costs is small and could not affect the results. As dis-cussed in Section 6, either the entire or only 25 percent of the indirect costs could be considered avoidable. We calculated in Table 1 both alternatives, however in our conclusions we maintained our conservative approach and considered only the 25 percent as avoidable costs. In any case, available data indicate that indirect costs are quite low, most in the range of $5 to $7.
Long-term savings ranged between Kentucky’s 12.46 percent and California’s 58.61 percent, while Maine was close to California with potential savings of 49.15 percent. Maine, which does not contract out to private prisons, was incorporated in this study because of the availability of its detailed data. The extent of the details for the direct and indirect short-run costs varies among the analyzed states. In the case of Maine, it is noteworthy that its lack of both private and public competition and its small prisons that cannot exploit economies of scale explain the state’s high costs and great potential for savings. Indeed, additional compe-tition among the states and private companies could be most beneficial. The extent of the savings including satisfying the statutory requirements did not change appreciably when just 25 percent avoidable indi-rect costs were employed. Only in the short run for medium- security prisons in Oklahoma and Arizona did the savings decline to −2.16 and −1 percent,
respectively. However, the long-run savings for both these states matter and those savings were maintained.
The following three factors led to lower costs of con-tract prisons; the issues of short- versus long-run avoidable costs (operating costs versus total costs), unfunded pen-sions and retiree healthcare, and employee benefit costs.
Short- Versus Long-Term CostsThe state legislatures enabled contracting out in
order to relieve overcrowding. In several states like Ohio, Florida, Mississippi, and Kentucky, a related objective was to achieve savings. The legislatures of these mandatory-savings states have determined that the required savings were obtained, even though they typically focused only on short-term costs.
In fact, the savings should reflect the avoidable costs to the state. In general, overcrowding, along with the aging of the state prison infrastructure, means that the only alternative is state construction or major renovations, modernization, or repair. Ac-cordingly, financing costs should be incorporated as the avoidable costs for government, an issue recog-nized by the Legislative Analyst’s Office in California (CALAO, 2012b: 16). However, the states do not report depreciation since they are not private entities.
Better data are available for the interest payments made on bonds floated to build major infrastructures. Depreciation was estimated at $4.61 by the US GAO (2012: 13), and we incorporated that figure in all the states that did not report depreciation. The Legislative Staff Report for Arizona determined that depreciation was $9.30, indicating that the use of $4.61 is conser-vative. This long-run cost added to the savings of con-tracting out in the range of 2 to 14 percentage points, with six of the thirteen observations at 10 or more.
Unfunded Pensions and Retiree HealthcareState spending on corrections is a significant
contributor to the underfunded pension and retiree healthcare problem that could lead to a national fiscal crisis. State and local governments have substantially underfunded pensions and retiree healthcare expenses since such obligations come due years down the road. Government officials tend to prefer current spending on services while creating future liabilities that come

| 43Prison Break: A New Approach to Public Cost and Safety
due much later, possibly under different administra-tions. In 2011, estimates of unfunded pension and retiree healthcare liabilities ranged between $730 billion and $4.4 trillion, which would amount to as much as 33 percent of the 2011 GDP.
Many economists believe that the correct figure is closer to $4.4 trillion (Healey et al., 2012: 3). The magnitude of the unfunded liabilities is negatively related to the performance of the stock market. In 2001, the 126 largest public pension funds had un-funded liabilities of 5 percent. In 2008, underfunding reached 36 percent, and in 2011, it was 26 percent (Healey et al., 2012: 8). Total state government pension debt is almost 4.5 times the state bond debt (Novy-Marx and Rauh, 2009). An indication of the magnitude of the underfunding problem is that every U.S. household would have to pay an additional tax of $1,098 per year for thirty years to eliminate the deficit using the more realistic treasury discount rate (Healey et al., 2012, p. 15). Some cities like Detroit have already filed for bankruptcy protection in part because of the underfunded pension problem.
The underfunded retiree healthcare challenge is of similar nature but much lower in magnitude (Munnell et al., 2013). The states assume 8 percent return on their pensions and healthcare funds. Thus, with the 8 percent assumed return, the states will not be considered underfunded. It is important to note that 8 percent return is very high under existing mar-ket conditions, and therefore more funds should be allocated towards these two items in order to be fully funded (Novy-Marx and Rauh, 2009).
In terms of corrections, shifting prison operations to the private sector could significantly lower states’ fiscal burdens with regard to underfunded pension and healthcare benefits. Additionally, existing calculations of state prison costs usually include just “out of pocket” items, neglecting to account for the underfunded pensions and retiree healthcare costs that will occur in future years, which are still avoidable costs. Thus, existing calculations of state prison costs are below ac-tual costs and therefore appear to favor the public sector.
Vera (2012) collected data from the forty states that responded to its inquiry about the total cost of correc-tions. Vera obtained results for all the states that we ex-
amined except for Mississippi. The Vera study includes amounts for which the state is liable but did not fully pay. It also includes short-run costs attributable to cor-rections but which were not in the corrections’ budgets. Capital costs, which relate to the long run and are not normally part of the corrections budget, were also enu-merated. For our purpose, these are avoidable costs when states contract out prisoners. These unfunded pensions and retiree healthcare contribute 1 to 13 percent of total long-run costs with a mode of 4 to 5 percent.
We now examine the contribution of correctional labor costs to the challenge of underfunded pensions and retiree healthcare benefits for state workers. Table Appendix 3.2 provides data on public employees and their wages for 2011 for the ten examined states and the United States as a whole. Correctional employment and wages are the highest in California, Arizona, and Florida where employee pay represents respectively 15.5 percent, 13.1 percent, and 13.0 percent of total state wages (Novy-Marx and Rauh, 2009). We also calculated for each state the number of years of total tax receipts necessary to eliminate the accumulated underfunded deficit. These figures demonstrate how significant this financial burden is. With correctional wages contributing a relatively high percent of state government wages, contracting for corrections services is one alternative that would help diminish the current unfunded liabilities and avoid some future under-funded pensions and retiree healthcare expenses alto-gether. Alternatively, the underfunded problem could be solved by simply raising taxes or reducing spending.
To conclude, the problem that the states are fac-ing for their underfunded pensions and retiree health-care may erupt as a result of temporary recession, as in 2008, or an unexpected increase in spending as a result of, for example, a natural disaster. This could cause states to default on bonds or pensions, result-ing in a significant increase in taxes (for example, a tax increase of $3,600 per person in Pennsylvania (Dreyfuss, 2013)) or significant reduction in major services including education and police. Indeed, the effects are already noticed where the rating of state bonds diminish, leading to an expected rise in interest rates (Dreyfuss, 2013). Contracting out correctional services could help ameliorate the problem.

the independent institute44 |
Labor Costs In the long run, labor costs were in the range of 43
to 71 percent of total costs. In general, contract prisons pay comparable wages but somewhat less in retirement benefits. For example, Ohio private correctional offi-cers are paid $1 less per hour. In Oklahoma in 2012, the beginning base salary for a correctional officer was $2,153 per month at the public Northeast Oklahoma Correctional Center. A comparable beginning private correctional officer at the Davis Correctional facility earned $2,068 per month, 3.95 percent less than a public officer. Our interviews with state DOC officials revealed that, on occasion, private correctional officers were paid higher wages but lower pensions. The ratio-nale provided is that young correctional officers are concerned more about their current wages than distant pensions and retiree healthcare benefits.
Private contractors typically offer workers match-ing contributions, or defined contribution, up to 5 percent of their salaries for their 401k accounts, which aligns with other private industries. Under this method, the market risk is borne by the employee. In fact, many workers choose not to contribute their share and thus lose the employer’s contribution. State employees, on the other hand, have defined benefits which shift the risk to the employer. Defined contribution plans re-quire the employer to contribute the specified amount in a timely fashion. A state’s defined benefit method enables non-timely or insufficient contributions which is a significant cause for the underfunding problem.
Private and public correctional officers are drawn from the same labor pool. Generally, the training is substantially the same, providing similar number of hours with a few course differences. See for example, Arizona Department of Corrections.
In Ohio, for example, they attend the same train-ing academy and, in another state, public correctional officers work part time in private facilities. It appears that private contractors are able to hire correctional officers of similar attributes to those hired by the state. Also, private contractors are more flexible than state governments to reflect specific market conditions and the specific preferences of employees. Private con-tractors provide a benchmark for labor costs for state correctional employees.
In California where until 2013 only private com-munity correctional facilities operated within the state, the wages and benefits package in the correctional pub-lic sector compared to other states is high. The starting minimum salary for public correctional employees in 2008 was $3,774 per month, and some officers earned more than $73,000 a year. The California State Auditor (2009: 49) reports that during fiscal year (FY) 2007–2008, beginning correctional officers were paid an average of $50,739 excluding any overtime. The annual pension contribution by California, including new offi-cers, was $12,000 for FY 2009–2010. This was $4,000 more than other state employees received. California has 30,000 unionized correctional officers and, each year, 130,000 candidates apply to become correctional officers (CALAO, 2008). Maine, which again has no competi-tion from private contractors and less efficient, smaller sized facilities, also had relatively high labor costs.
We wish to stress that government sources were pri-mary for this study. Also, when calculations were made, we were conservative (biased downwards) in the state costs. The long-run savings of contracting out prisoners are attributed, in declining importance, to the long-term consideration of costs, the inclusion of unfunded pensions and retiree healthcare, and the lower private costs of labor, specifically with respect to benefits. We found no evidence that the lower costs are associated with possible lower performance of private prisons. Actually, we encountered government evidence that the performance of contractor-operated prisons was, on occasion, higher than public prisons in Florida and Kentucky and comparable in the other examined states. An explanation for the at least comparable performance is the detailed contracts and the monitoring, on-site and otherwise, that emphasizes performance measures.
Other possible explanations for the savings are the purchasing power and flexibility in purchasing of the private firms. The contracting firms buy in large quantities for various prisons and can take advantage of opportunities that arise rather than be constrained by cumbersome state purchasing regulations. Also, in operation, private firms have greater flexibility in employment, perhaps taking greater advantage than government in using part-time workers (Interview with a Texas Department of Criminal Justice official,

| 45Prison Break: A New Approach to Public Cost and Safety
October 26, 2012). Private firms, in some cases, en-joy greater flexibility in hiring, which saves time and resources. Also, private firms can tailor their wages to specific labor market conditions, which is more diffi-cult for public employers. For example, private cor-rectional officers are paid less in rural communities, which usually have lower cost of living than in metro-politan areas. The state cannot differentiate wages to the same extent, and therefore overpays in rural areas or underpays in metropolitan areas. State officials in our examined states provided these explanations.
Two additional explanations for the savings achieved by the contracting firms are beyond the scope of this study. One relates to competition versus mo-nopoly, and the other is beyond the control of state governments. Several of the interviews with state offi-cials suggested significant competition among the firms in responding to the request for bids to operate prisons. Our interviews and a report prepared for the Florida Department of Management by MGT (2006) suggests that competition from private firms yield more efficient operation in public prisons. Blumstein, Cohen, and Seth (2007) found that states with contract prisons ex-perienced greater savings for public prisons than states that either do not contract out prisoners or contract out-of-state. Even though contract prisons house less than 7 percent of all inmates, their competitive effect is strong. The lack of such competition in government often leads to less efficient operations.
Texas provides a good example of the benefits of competition. Prices of privately operated prisons increased from $37.48 per inmate per day in FY 2010 to $39.13 in FY 2011, and then declined to $37.97 in FY 2012. Short-run costs for the prototype 1,000-bed state facility over the same period varied from $44.50 to $44.89, and then declined to $41.99 (Texas Legislative Budget Board, 2013). It is typical in competitive industries that prices and costs constantly vary. Indeed, in a three-year period, we witness fluctuations in private prices and state costs, which may indicate the effects of competition.
Interestingly, state governments could become competitive and reduce expenses if states were allowed to compete for inmates and use prisons as an export base for economic development for their distressed localities. The other explanation that is beyond the
control of state governments is the fact that private firms operate newer facilities, often enriched with technology, that are cheaper to operate than the older, labor-intensive public prisons. The Legislative Ana-lyst’s Office (CALAO) in California recognized this advantage of newer prisons (CALAO, 2012b: 16).
One qualification relates to medical costs. The con-tracts with the private contractors differ with respect to the private contractor’s responsibilities toward medical services. In some states, sick prisoners were not assigned to private prisons. In other cases, the state becomes responsible for medical costs above a certain threshold once a prisoner from a private prison is sent to another location for medical services. Florida and Arizona tried to correct the data for the greater responsibility of public prisons for medical costs. Since a similar correction for the other states is beyond our ability to determine, we calculated how high medical expenses could become in order to just maintain the legislative mandatory savings. Noteworthy, Arizona awarded a contract for a 1,000 medium- security beds beginning January 1, 2014, which is a full-risk medical contract for the private provider. (See Arizona Department of Corrections, 2012: 1.1.9.)
Given uncertainties about the exact financial respon-sibilities of the state for medical care of inmates in private correctional facilities, we determined the maximum level that medical expenses could be while the statutory requirements were just met. Then, we observed whether medical costs of that magnitude are reasonable. The actual range of per-diem reported medical expenses in public prisons is $5.97 in Texas to $43.95 in California (rows 2a and 2b). Our calculated range for maximum “allowable” additional unknown medical costs (rows 36a and 38b) is $11.23 in Kentucky to $100.62 in California. Thus, it appears that these “allowable” medical expenses are very high and therefore contracting out is still attrac-tive regardless of our “unknown” additional state medical responsibilities for inmates in private facilities.
Another indicator for the validity of the savings is the ratio of the maximum allowable medical expenses to the actual medical expenses. This ratio suggests the max-imum extent to which medical expenses could reach due to extra public support of contracted prisons’ medical costs, while still maintaining desirability of contracting out. The range of the ratios is 0.93 for Mississippi to 3.96

the independent institute46 |
for Texas. Intermediate ratios were for California and Oklahoma medium security, both at 1.8. Thus, Califor-nia could support the medical expenses of its inmates in contracted prisons by almost twice its existing level and still benefit from contracting out (rows 40a and 42b).
The following tables specify the short- and long-run public sector costs that are linked to the operation of state prisons. Again, to be conservative, we attributed only 25 percent of the indirect costs as avoidable. State costs per day in tables 13.1 and 13.2 are the same as subtracting 75 percent of the indirect cost. The long-run costs include the short-run costs, as well as depreciation and government principle and interest payments for the bonds used to
finance construction of a prison. These two items, which are also termed capital costs, become avoidable costs when a DOC avoids building new prisons by sending inmates to contract prisons. Our estimation of the avoidable costs includes a few categories of actual costs that were missing in prior studies. In the short run, costs included data on underfunded pensions and retiree healthcare of current employees. Neglecting these costs lowers the state’s apparent avoidable costs and most im-portantly distorts legislative intent. California has by far the highest underfunded costs at $15.18 per inmate per day, followed by Maine’s $6.86, while the others range from $0.55 in Florida to $4.44 in Texas.
Table 13.1. Short-Run State Prison Cost, Contractor Prices and Savings
StateCustody Level Year
State Costs per Day
Private Contractor Prices per
Day
% Savings with Use of Private Contractor
% Private InmatesPrison 1 Prison 2
AZ Min 2010 $50.61 $46.56 8.0 23.0
AZ Med 2010 $52.49 $53.02 −1.0 11.4
CA All 2007/8 $112.98 $79.73 29.4 1.3
CA All 2011/12 $152.01 $64.82 57.1 6.7
FL Min/Med 2008/9 $54.39 $50.58 7.0 11.3
KY Min/Med 2011 $58.13 $47.21 18.8 10.4
KY Min/Med 1012 $55.59 $43.98 20.9
KY Med 2011 $52.98 $44.14 16.7
KY Med 2012 $54.80 $49.63 9.4
ME All 2011 $125.59 $65.75 47.4 0.0
MS Min 2011 $36.26
MS Med/Max 2011 $34.11 $31.15 8.7 24.9
OH Min/Med 2010 $52.98 $45.86 13.4 5.9
OH Min/Med 2012 $47.84 $45.86 4.1
OK Min 2011 $41.64
OK Med 2011 $42.11 $43.02 4.4 −2.2 45.7
OK Max 2011 $80.01 $56.62 27.6 29.2 27.1
TN Med 2011 $53.21 $42.29 17.3 18.7
TX Prototype 2010 $59.85 $37.47 37.4 11.0
BOP/GAO Low 2011 $67.28
Legend Min = Minimum-security prison Med = Medium-security prison % Private Inmates = share of inmates in private prisons as percentage of all state inmates Prison 1, Prison 2 = In Oklahoma, there were two comparative prisons for each custody level, Med and Max

| 47Prison Break: A New Approach to Public Cost and Safety
$160.00
$140.00
$120.00
$100.00
$80.00
$60.00
$40.00
$20.00
$0.00
AZ
AZ
CA
CA FL KY
KY
KY
KY
ME
MS
MS
OH
OH
OK
OK
OK
TN TX
BOP/
GA
O
State
Private
Figure 13.1. Short-Run Public Sector Cost and Savings
Table 13.2. Long-Run Public Sector Cost, Contractor Prices and Savings
StateCustody Level Year
State Costs per Day
Private Contractor Prices per
Day
% Savings with Use of Private Contractor
% Private InmatesPrison 1 Prison 2
AZ Min 2010 $59.95 $46.56 22.3 23.0
AZ Med 2010 $61.83 $53.02 14.3 11.4
CA All 2007/8 $117.59 $79.73 32.2 1.3
CA All 2011/12 $156.62 $64.82 58.4 6.7
FL Min/Med 2008/9 $61.43 $50.58 17.7 11.3
KY Min/Med 2011 $60.03 $47.21 21.4 10.4
KY Min/Med 1012 $57.49 $43.98 23.5
KY Med 2011 $54.88 $44.14 19.6
KY Med 2012 $56.70 $49.63 12.5
ME All 2011 $129.90 $65.75 49.2 0.0
MS Min 2011 $47.52
MS Med/Max 2011 $41.68 $31.15 25.3 24.9
OH Min/Med 2010 $62.66 $45.86 26.8 5.9
OH Min/Med 2012 $57.52 $45.86 20.3
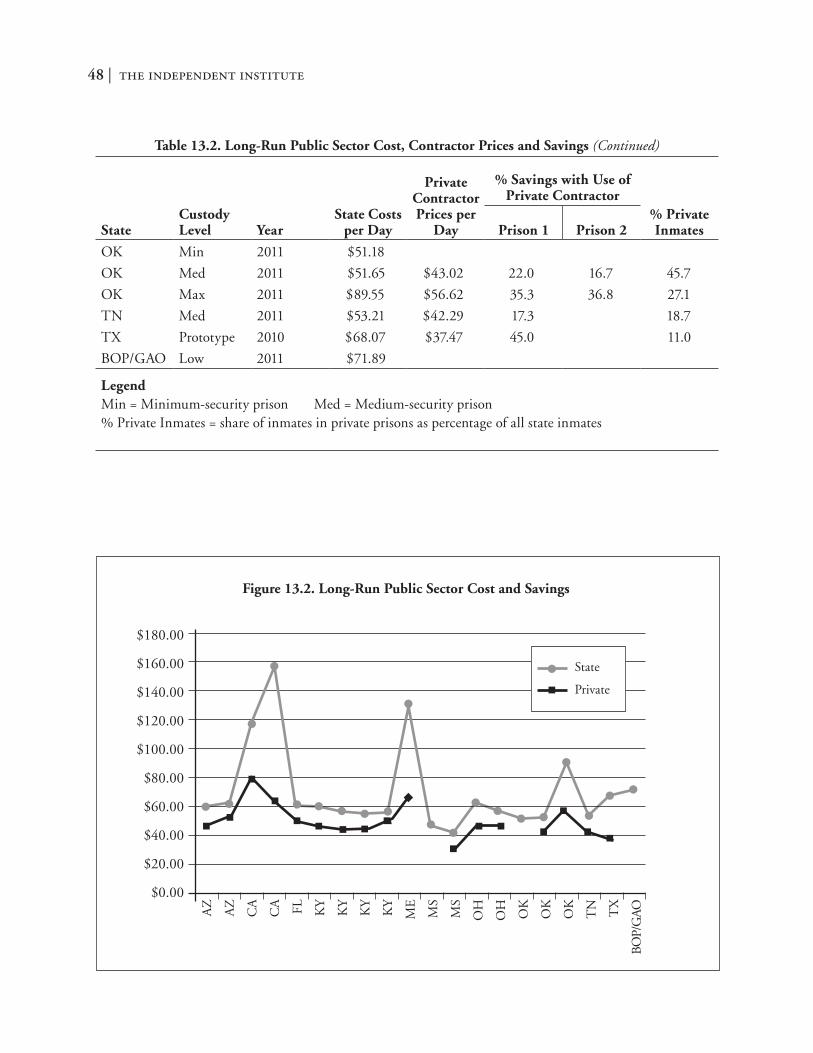
the independent institute48 |
StateCustody Level Year
State Costs per Day
Private Contractor Prices per
Day
% Savings with Use of Private Contractor
% Private InmatesPrison 1 Prison 2
OK Min 2011 $51.18
OK Med 2011 $51.65 $43.02 22.0 16.7 45.7
OK Max 2011 $89.55 $56.62 35.3 36.8 27.1
TN Med 2011 $53.21 $42.29 17.3 18.7
TX Prototype 2010 $68.07 $37.47 45.0 11.0
BOP/GAO Low 2011 $71.89
LegendMin = Minimum-security prison Med = Medium-security prison% Private Inmates = share of inmates in private prisons as percentage of all state inmates
Table 13.2. Long-Run Public Sector Cost, Contractor Prices and Savings (Continued)
$180.00
$160.00
$140.00
$120.00
$100.00
$80.00
$60.00
$40.00
$20.00
$0.00
AZ
AZ
CA
CA FL KY
KY
KY
KY
ME
MS
MS
OH
OH
OK
OK
OK
TN TX
BOP/
GA
O
State
Private
Figure 13.2. Long-Run Public Sector Cost and Savings

| 49Prison Break: A New Approach to Public Cost and Safety
14 | Conclusions
This study compares costs of state prisons to the prices paid for contractor-operated prisons. The data used were from government sources, interviews with offi -cials of state departments of corrections, and analysts from state legislative oversight agencies. We evaluated nine states and incorporated detailed federal data to supplement incomplete state data. Especially detailed data were available for Maine and Mississippi.
There are three reasons for the use of private pris-ons: to save on operational costs and maintenance; to relieve overcrowding whether ordered by the courts or required because of threat of litigation perceived by DOCs; and sale of a state prison to private operators for budgetary reasons. The statutory savings require-ments for private prisons are Florida (7 percent), Kentucky (10 percent), Mississippi (10 percent), Ohio (5 percent), and Texas (10 percent). The statutory requirement applies both to where the contractor operates a state prison and to where prisoners are placed in private prisons. In cases like Florida and Mississippi, the contractor operates state prisons. In
Kentucky and Oklahoma, the prisoners are transferred to private prisons. Texas uses both models.
Overcrowding, which is the second reason for the use of private prisons, includes both the out-of-state transfer of inmates and the in-state use of private facilities. In California, the courts required a timely reduction of overcrowding, leading to the use of out-of-state contract prisons. The examined states that experienced overcrowding in addition to Cali-fornia were Arizona, Kentucky, Ohio, Oklahoma, Tennessee, and Texas.
Contracting out by selling a state prison to private operator generates an immediate lump sum amount to narrow a state budgetary defi cit. This occurred in Ohio, which sold the Lake Erie Correctional Institu-tion to a private contractor.
The nature of the private prison contract sug-gests what is appropriately included in the state avoidable costs. The calculated state costs should refl ect the avoidable costs to the state when private contractors are considered. State legislators normally do not specify the costs to be considered for the stat-utory savings, and this is left to the interpretation of
Figure 13.3. Short- and Long-Run Savings (%)
55
45
35
25
15
5
−5
AZ
AZ
CA
CA FL KY
KY
KY
KY
ME
MS
OH
OH
OK
OK
OK
OK
TN TX
Short-Run Savings
Long-Run Savings
Perc
ent
Savi
ngs
Ove
r P
ublic
Pri
sons
the independent institute50 |
DOC staff. It is important to emphasize that even if the categories of the avoidable costs are specified, the measurements are difficult, and could be subject to individual interpretation.
Economic theory helps us determine the types of costs that should be taken into consideration be-cause of the use of private prisons. In statutory states without overcrowding, the appropriate comparison is between the state short-run or operating costs and the contractor price. When overcrowding exists, the total of the operating and capital costs should be compared to the contractor price. When a public prison is sold, as in Ohio, total or long-run cost is used for the comparison with the contractor’s price. When over-crowding exists, both the operating and capital costs, namely long-run costs, are the avoidable costs.
Table Appendix 3.1 specifies the short-run direct and indirect costs, which are linked to the operation of the state prisons. The long-run costs include the short-run costs, in addition to depreciation and the government interest payments for the bonds that are used to finance a prison. These two items, which are also termed capital costs, become avoidable costs when a DOC avoids building new prisons by send-ing inmates to private prisons. Our estimation of the avoidable costs includes a few categories of actual costs, which were missing in prior studies. In the short run, our calculated costs included data on underfunded pensions and retiree healthcare of current public em-ployees. These costs are easily ignored when state bud-gets are tight and are not reflected in the then- current delivery of prison services. However, these costs are real and are to be paid in the future. Neglecting these costs lowers the state’s apparent avoidable costs, and distorts legislative intent. California has by far the highest underfunded costs at $15.18 per inmate per day, followed by Maine’s $6.86. The others range from $0.55 per inmate per day in Florida to $4.44 in Texas. The underfunding pensions and retiree healthcare for government employees are reaching magnitudes that may lead to financial crises for state and local govern-ments with severe repercussions throughout the entire economy. Shifting to private operation of correctional institutions would significantly ameliorate the prob-lem. For example, it would take 8.75 years of Ohio’s
entire tax receipts to eliminate the underfunding problem. Shifting the operation of prisons to the pri-vate sector would reduce the 8.75 by almost one year. It is important to note that the magnitude of both tax receipts and the deficit are sensitive to the state of the economy and the stock market so that these numbers are suggestive of the problem.
The indirect costs are the administrative costs incurred by DOCs and other state agencies linked to and for inmates. These costs are difficult to obtain, especially to determine what proportion is avoidable. We used conservative estimates of these costs provided by the U.S. Government Accountability Office (US GAO, 2012: 13) based on work by the U.S. Bureau of Prisons (BOP). Again, maintaining our conserva-tive approach, based on data for Tennessee, we chose to include only one-fourth of the state indirect costs as avoidable.
For Florida and Mississippi where contractors manage the state prisons, we use the short-run or variable costs as avoidable costs to the states. In Flor-ida, the short-run savings were 7 percent as required by the state law. In Mississippi, the short-run savings were 8.69 percent, slightly below the 10 percent stat-utory requirement. The Joint Legislative Committee on Performance Evaluation and Expenditure Review (PEER) found that the costs of the private contractor met the statutory requirements (Mississippi, PEER, 2011; and 2012: 1). The long-run savings are irrele-vant for both states.
Whenever overcrowding exists, the statutory requirement is less relevant since the overcrowding has to be alleviated in a timely fashion. California is a classic example of the cost encountered by failing to avoid substantial overcrowding and because private prisons are prevented from operating in the state. Overcrowding requires that the long-run avoidable costs be compared against the contractor’s price. The long-run costs are appropriate because the state avoids building its own prisons. The long-run consideration is also relevant when the state owns old prisons that need major renovations, when it owns prisons that are subject to demolition, or when the state faces difficulties in raising capital. The long-run savings for Arizona’s two prisons are 14.25 and 22.34 percent;

| 51Prison Break: A New Approach to Public Cost and Safety
California had 32.20 and 58.61 percent savings for two prisons; Kentucky’s savings for its four prisons ranged between 12.46 and 23.50 percent; Ohio saved 20.28 and 26.81 percent in 2012 and 2010, respec-tively; Oklahoma saved on its four prisons 16.71 to 36.77 percent; Tennessee had 17.32 percent savings; and Texas had 44.95 percent savings. Maine, which does not utilize contract prisons, could have saved 47.40 percent when below capacity and 49.15 per-cent, if overcrowding exists.
Overcrowding as in California and Ohio reduces both the short- and long-run costs per inmate per day and at the same time diminishes the quality of incarceration and security of inmates and correctional officers. Clearly, the overcrowding reduces the state per-inmate costs compared to the private contractor’s price at the facility’s designed occupancy rate. This means that in the case of overcrowding state costs are biased downward. This lower cost-per-inmate issue was recognized by a 2013 Florida administrative law decision (CCA of Tennessee, LLC vs. [Florida] De-partment of Management Services, 2013: 7).
At least equal performance to state prisons is required for contracting out. For example, contracts can specify the minimum quantity and nutritional quality as provided in state prisons. Indeed, the American Correctional Association established stan-dards for prison performance, which the contract prisons generally met. Further, interviews with state DOCs reported that their contracts mandate perfor-mance levels, and DOCs closely monitor adherence to the contract requirements. Penalties can be and are imposed for performance violations. In Florida, contractors performed above the state level in train-ing and educating inmates, which could be attributed to competition among contractors and the desire for contract renewal. Ohio and Texas require joint meetings of public and contract wardens, a practice that leads to greater cooperation and mutual learn-ing. This practice seems to be beneficial and could be extended to other states. The greater exposure of contract prisons to financial and personal penalties and liabilities encourages good performance.
A prison facility has limited alternative uses, capital costs are high (beyond the financing ability of
most states), and the expected life span is long. At the same time, demand for prison space fluctuates and is expected to drop in the near future, leaving some public prisons vacant. The existence of private prisons enables DOCs to avoid building new prisons when demand is high and prevents waste of these facilities when demand declines. This is a major long-term cost savings that is not considered in the statutory calculation of the avoidable costs by states. Thus, even if there are no costs and performance preference to private prisons, the mere existence of private pris-ons saves the public sector from construction costs, the purchase of equipment, hiring of personnel that cannot be laid off when number of inmates declines, the training of those employees, and the enlarged administrative costs that exist when the number of inmates is large and becomes partially idle when the number declines. Contract prisons provide flexibility and savings in periods both when there is a shortage in cells and also in the avoidance of unused cells when the number of inmates drops.
A major finding from the data and the interviews is that competition yields savings and better perfor-mance. The economics of industrial organization demonstrates the important benefits derived from even the presence of a small competitor in an oth-erwise monopolistic market. Examples include the transparent tape and physicians’ services industries. In both industries, small firms have substantially increased competition and led to important gains for consumers. In the transparent tape industry, prices were reduced, and in the physicians’ services industry, quality and innovations were introduced.
In the case of corrections, even though private contractors comprise less than 7 percent of the in-dustry, they have generated substantial competitive benefits. It is a common in many other industries for small firms to have significant desirable effects in terms of price, new products, and technological inno-vations. The benefits emanate from two sources. As more contractors compete, the prices are lower and the performance is better. However, savings also occur in public prisons. When private prisons become an available option, efforts are made by public managers to lower costs, and demands by public employees

the independent institute52 |
are constrained since they realize that the legislature might favor private corrections as a more cost- effective option. Further, the greater the competition, the more managerial and technological innovations are introduced in both the public and private segments of the industry. It is important to note that the existence of public prisons also keeps in check price hikes by the private prisons. The knowledge that states could resort to the use of solely public prisons encourages private contractors to offer their services at even lower prices than the statutory requirement.
This study leads to a possible moderate change that could encourage further competition in the case of operation of existing state prisons and thereby achieve more efficient delivery of prison services. This is the model of managed competition initiated by then-Mayor Stephen Goldsmith of Indianapolis, IN, which encouraged public workers to participate in the bidding for their services alongside private competi-tors to preserve their jobs. Mayor Goldsmith initiated the “yellow pages” test where he enabled contracting out of all city services whenever several providers were listed. But, he went one step further and allowed city employees to compete for the service, as well. By so doing, public employees, as well as private contractors, have an incentive to search for managerial and techno-logical innovations and offer the service at competitive prices. This is possible when the outputs are quantifi-able and the contract can clearly state what is required, and where oversight by government is relatively inexpensive. A third requirement is that a sufficient number of competitors, including the public work-ers, emerge. Contracting out to a monopolist private company that replaces a public provider is undesired. All relevant contractors, public and private, should be aware of upcoming contracts. The existing situation where public prisons operate without a threat of com-petition yields an unnecessary monopolistic power that could yield inefficient operation.
Contracts should specify desired outcomes or performance and refrain from requiring what inputs to use or the method of “production.” Contractors should have the freedom to decide how best to meet the required outcomes. Obviously, contracts could be difficult to enforce when outcomes cannot be
quantified. Our discussions with state correctional executives suggested that contracts can specify the minimum performance levels required from the con-tractor that wins the bidding. Also, the private prison industry already includes a sufficient number of firms that compete across the United States. Thus, in each state where the legislature allows contracting out pris-ons, some existing state prisons could be auctioned as a “managed competition model” for a sufficient time period to encourage contractors to devote the appropriate resources for innovation and improved performance. This extension of competition could obviate to some degree the necessity for detailed con-tract specification and monitoring efforts. Reliance on markets like managed competition could reduce the necessity for such complicated calculations as in our Table Appendix 3.1.
The discussion above leads to a recommendation that could be considered. State legislators in the statu-tory states have established arbitrary levels of required savings of 5, 7, and 10 percent. High percentage savings may discourage some bidders and be counter-productive. It is not clear why the percentages differ and what the basis is for these numbers. By instituting managed competition where the public sector com-petes on a level field with the private sector, we let the market determine the savings. In such a case, the complicated calculations of what cost items should be considered as avoidable costs and how to measure these costs becomes unnecessary. Managed com-petition has worked for many local public services, and there is no reason why it cannot be successfully implemented in the state prison industry. Public and private competition and cooperation in service provi-sion has worked and should be extended.
The issue of statutory savings merits closer atten-tion. In Mississippi, the prices based on the required savings for contracting out were so low that no con-tractor offered the service, and as a result the state’s DOC would have to maintain the service. In compet-itive markets, when a price requested by a seller is too high and no one wishes to buy it, then the seller lowers the price until the product/service is sold. For example, when a homeowner sets a price for his or her house and receives no offers, he or she will lower it until the
| 53Prison Break: A New Approach to Public Cost and Safety
first offer is made. In the case of Mississippi, no offers were made probably because of unrealistic state costs, which did not include the unaccounted costs, and the arbitrarily stated statutory savings requirement.
Now, suppose that all costs were indeed included, and the state offered a contract under a managed com-petition model. The state workers would then not nec-essarily have won the contract. Now, if the state offers the contract without any required savings and a private contractor wins the contract with even 3 percent sav-ings, then the state still saves and a strong incentive is established for all private and the public suppliers to become more efficient in order to win the next contract. The legislatively established statutory savings effectively shields the state’s DOC from competition and enables workers to demand and gain wages that exceed their market values. In economic terms, prices should be able to fluctuate freely, and in this case, the lowest bidder wins the contract. Thus, implementing managed competition without any arbitrary savings requirement removes the need for complicated state costs calculations, probably leads to greater savings and improved service quality, especially in the long run, as a more competitive industry is created, and establishes a level playfield for the public and private providers. A qualification for this model is the necessity to assure that performance levels are quantifiable and maintained at a satisfactory level. Performance monitoring is thus required but is generally not a substantial expense.
This study raises some important issues related to contracting out prison services that could improve the process and outcomes and may warrant further analysis:
1. Fluctuations in demand: Demand for beds fluctu-ates over time and is expected to decline because of the decreasing number of youths, changes in laws like the “three strikes” statute, and easing of penalties for drug-related crimes. As a result, we may witness a decline in occupancy in some states, while demand remains high in others. Easing of legislative rules and procedures of inter-state transfer of inmates could save capital outlays for some states where the cost of imprisonment is high or overcrowding exists. At the same time,
inmate transfers could raise revenues for states that are efficient in service provision, enjoy economies of scale, or have unused capacity.
2. Medical services: Costs for medical services are very high, and the extent of the costs varies sub-stantially among the states. In most states, such costs range between $6 and $11 a day. Maine’s medical costs are high at $16.67, while in Cali-fornia, which essentially lost control of its prison healthcare to a court-appointed receiver for men-tal and physical health because of overcrowding, per-day medical costs reaches $43.95. About twenty states have outsourced medical services to private correctional medical healthcare compa-nies in order to cut costs (Leonard, 2012). Such contracting out is independent of contracting out the management of prisons. It seems that com-petitively contracting out healthcare, whether by DOCs or by private prison companies, suggests cost savings. Based on similar experiences, the state or the private prison contractor should be held financially liable up to a certain amount for shifting inmates to the medical provider (for example, see discussion in Section 12 on Missis-sippi). Clearly, the DOC or the private prison company is held liable for not referring a seriously sick inmate in order to save on costs. The same healthcare procedure should be maintained for both the state and private prisons. The analysis of medical procedures within existing contracts and a search for a socially efficient procedure that maintains business viability are desired.
3. Length of contract: Our suggested managed competition model is relevant for the existing state prisons and does not apply to other cases. An important issue that is not addressed in this study is the length of time for a contract. This period has to be long enough to recover the initial investment and maintain incentives for adopting techno-logical and managerial innovations. At the same time, a lengthy contract prevents new competitors from entering the market with innovations that could lead to lower prices than existing contrac-tors. However, if a sufficient number of prisons

the independent institute54 |
join managed competition and contracts open at varying times, lengthy contracts are possible. Eco-nomic theory suggests that as the market increases with both competitive contractors and prisons available for contracting, the length of contract time could be extended, and the extent of regu-lation by government could be reduced. We sug-gest a follow-up study on the lessons of managed competition in similar states and local markets to learn of its implications for the prison industry. If indeed the model is “sound,” then the study could follow with a model and stages of implementation.
The greater the competition, the more efficient both the operation and the performance of prisons become, and the need for public regulation could be reduced. Competition and transparency replace heavy regulation. The partnership between the public and private sectors in training of correctional officers, the joint regional coordination meetings of wardens, and mutual interests in the ownership and condition of the facilities further assure high performance and effi-cient operation. The conditions for success, however, are to allow entrance of firms to the industry under some necessary public regulation, and allowing the public sector to compete on a leveled playing field.
Appendix 1 | Data Sources for the Table on State Costs, Contract Prices, and Savings
Arizona We used three sources (Arizona Department
of Corrections, 2010; Arizona Department of Corrections, 2011; Arizona JLBC, 2012). For the short-run costs of male inmates in minimum- and medium- security prisons, we used data from page 3 in Arizona Department of Corrections (2011). Depreciation and other capital expenses were cal-culated by the Arizona JLBC (2012) to be $10.71 instead of the $1.41 reported by the Arizona DOC. A similar adjustment of $2.67 was made to account for underfunded pension liabilities as reported in Arizona JLBC (2012) for Arizona.
The following unaccounted costs were obtained from the Vera report (2012). We calculated $0.16 to be hierarchical costs per inmate per day for both minimum and medium prisons. We did not include this figure. Instead, we used the more comprehensive figure of 11 percent, which also includes the admin-istrative functions of DOC provided by US GAO (2012: 17). This calculated figure for Arizona was $5.42, which falls in the range of $1.40 to $6.64 of the other examined states, and the GAO benchmark figure of $8.09. Debt service per inmate per day was $0.04. This was calculated from the $530,000 reported by Vera for 2010. To be conservative, we did not include the $2.2 million in judgment costs reported by Vera since we were unsure whether such costs should be fully allocated to public correctional facilities.
CaliforniaFor California, wages can be separated from ben-
efits (California State Auditor, 2009). For California, wages and salaries were $36.72 per inmate per day, overtime was $6.63, and benefits were $16.25. Facili-ties and operations include food, repair, clothing, and other items. Education and training of inmates are included in state-provided professional services. The hierarchical cost of $4.04 per inmate per day includes both administration and headquarters costs. Vera (2012) reports unattributed statewide administrative costs for corrections to be $438 million. We added the per diem per inmate of $0.62 to the $44.04 to obtain $44.66. Since no data are available on interest and depreciation for California, we therefore used the $4.61 figure from US GAO (2012: 13). The annual price per inmate was $29,100 obtained from the above California State Auditor Report (p. 36). The daily fee was therefore $79.73 per inmate.
Monitoring costs for California have been exceptionally high. The state sent seventy-three monitors to the out-of-state facilities resulting in a total costs for oversight and monitoring for 2010–2011 of $15,981,000 or $4.42 per inmate per day. The cost and inmate population were obtained from the California Budget for Department of Cor-rections and Rehabilitation (2011/2012: CR5 and CR15).

| 55Prison Break: A New Approach to Public Cost and Safety
Data for 2011–2012 were obtained from Califor-nia Legislative Analyst’s Office (CALAO, 2013).
We had to make some minor adjustments to the data in this report in order to fit the categories of Table Appendix 3.1. However, this did not distort the values for the total short-run and long-run gov-ernment costs. Security in the report was classified as personnel services. Facility operations, which include maintenance and utilities, were incorporated in Table Appendix 3.1 as utilities. The remaining items under facility operation and records were classified in Table Appendix 3.1 as hierarchical. “Food and Clothing” were incorporated in Table Appendix 3.1 under the same categories. The remaining items under the cate-gory “Inmate Food and Activities” were added to the miscellaneous category, which was classified in Table Appendix 3.1 as “All other.” Finally, “Rehabilitation Programs” were classified in Table Appendix 3.1 as “State Provided Professional Services.”
Vera (2012) reported 167,276 inmates in fiscal year (FY) 2011. It reported $320.1 million in un-derfunded retiree healthcare contributions and $607 million in underfunded retiree healthcare contribu-tions for current employees, totaling $927.1 million. The latest California State Auditor Report (up to November 2012) provides the costs for 2007–2008, while Vera’s underfunded and statewide contributions are for 2009–2010. Vera also reported education and training costs provided by the California Department of Forestry and Fire Protection of $4.5 million. Since it is unclear whether these costs are recurring expenses, we chose the conservative approach of excluding them.
Florida We chose to use Table A-5 “Adult Male-Size
Adjusted for 2008/9” from the Office of Program Policy Analysis and Government Accountability (OP-PAGA, 2010a). Indirect costs entail costs imposed on the Departments of Corrections and Management Services. Our interviews revealed that there may be unfunded pensions for state employees, so the cur-rent state costs could be understated. However, Vera reported underfunding of only $0.55 per inmate per day. As for education and training programs, the cost for public facilities was $0.79 per inmate per day.
However, the spending by contractor-operated male prisons for the same services, adjusted for size so as to be comparable to state facilities, was in the range of $3.92 to $5.88 (OPPAGA, 2010a, Table A-5). For Table Appendix 3.1, we used the average of the two values, which is $4.90. Table A-7 of the above report provides daily price per inmate of $50.68 for the Bay Correctional Facility and $50.48 for the Moore Haven Correctional Facility. The average for the two private prisons was $50.57 per inmate per day. For the construction costs, we used OPPAGA (2010b) for the publicly built, close-custody Suwannee Correc-tional Institution of $97.8 million for 1,521 inmates. At the interest rate of 4 percent, the cost per inmate per day is $7.05. This cost item is presented in Table Appendix 3.1 but is not used in the calculation.
GAO Adjusted Figures The calculation of costs for the individual states
does not include the long-term costs for the facili-ties. However, it is reasonable to assume that state capital costs are similar to federal costs. We used the report by the U.S. Government Accountability Office (US GAO, 2012) to obtain short- and long-term costs. GAO provides capital and indirect cost percentages, which allowed us to obtain labor costs. We term labor costs as personnel services. In this case, personnel services include, in addition to the usual manpower costs, education and training of inmates. The GAO reported marginal costs, which includes food and medical, so that we were able to subtract such costs from the total direct costs to ob-tain just labor costs.
Kentucky Most of the data were obtained from officials at
the Kentucky DOC and from the Kentucky Legisla-tive Research Commission (KLRC) (2009). An offi-cial from the Kentucky DOC provided us with the following public short-run direct costs for the most comparable facilities to the contract prisons:
Public prison: Roederer Correctional Complex, minimum/medium, $53.78 (2011) and $51.31 (2012); private prison: Marion Adjustment Center, $47.21, and $43.98, respectively.

the independent institute56 |
Public prison: Little Sandy Correctional Com-plex, minimum, $48.76 (2011), and $50.53 (2012); private prison: Otter Creek, medium $44.14, and $49.63, respectively.
For 2011: http://corrections.ky.gov/about/ Documents/Research%20and%20Statistics/Annual%20Reports/Cost%20to%20Incarcerate%202011.pdf
For 2012: http://corrections.ky.gov/about/ Documents/Research%20and%20Statistics/Annual%20Reports/Cost%20to%20Incarcerate%202012.pdf
Vera (2012) provided data on underfunded pensions, underfunded retiree healthcare, and the number of inmates in the state. We used all that data to calculate the underfunded category (row 15a in Table Appendix 3.1) to be (200,000 + 13,700,000 + 7,900,000) / (21,347 * 365 = $2.80). The short-run hierarchical costs were termed statewide admin-istrative costs in the Vera report for 2009/2010 and calculated to be $2,800,000/(21,347 inmates * 365) = $0.33. Again from Vera, we obtained the total in-terest costs of $14.8 million. We then calculated the long-run interest costs per inmate per day to be $14.8 million / (21,347 inmates * 365) = $1.90. KLRC (2009, p. 17) provided the cost of monitoring to be $105,362 for 2009. We calculated the monitoring cost to be $0.23 per inmate per day for the 1,234 pri-vate inmates. The state monitoring cost was included as Central Office Overheads attributed to Private (row 26a). The source for the amount is the KLRC (2009), while the entries in Table Appendix 3.1 are for 2011 and 2012. The number of private inmates and the total number of inmates appears in the mini-mum/medium prison column, 2011. Again, the data on private and total inmates, as in all other examined states, come from U.S. BJS (2011) for 2010. Inmate numbers change on a daily basis. Also, Vera’s data re-fer to the fiscal year 2009/2010, while U.S. BJS refers to the calendar year 2010. The differences among the various sources are minor.
Maine Maine data were obtained from its Office of
Program Evaluation & Government Accountability (2012). Included in the state’s report are all adult prisoners of three levels. Personnel services include
pensions and benefits. We calculated the individual items by multiplying the $42,538 annual per-inmate costs by the percentage category on page 5 of the Maine report. Maine paid $1.6 million in interest. According to the Vera report (2012), underfunded retiree health-care amounted to $5.1 million. Per-diem underfunded retiree healthcare per inmate was then $5,100,000 / (2,038 inmates * 365) = $6.85. Unaccounted hierar-chical costs were $1.4 million according to the Vera report, and Maine reported general administration costs of $2,520,425. Thus, hierarchical costs, which incorporate the two elements, are $5.27 per inmate per day. The Vera report provides $1.6 million for capital costs which translates to $2.16 per inmate per day.
Mississippi Data were derived from the Joint Legislative
Committee on Performance Evaluation and Expen-diture Review (PEER) (2011). Data were extracted from page 8. For “Personnel Services,” we added other costs to salary costs. Annual debt services are hypothetical costs that reflect what it would cost the MDOC to finance a new prison and are included in Table Appendix 3.1 as “Interest on Debt.” These costs incorporate depreciation. Hierarchical costs include “Administrative Costs,” which are costs imposed on other state agencies. Vera did not obtain data from Mississippi for any underfunded contributions or other unattributed costs for corrections.
Monitoring of the five private prisons is paid by the contracted prison as part of its per diem. The amount is about $60,000 per prison, where four pris-ons house 1,000 inmates and the fifth 1,500 inmates, and occupancy is 98 percent. Thus, the cost per in-mate per day is around $0.15. Clearly, since the cost is part of the price charged by the contracted prison, it is not separately incorporated in our matrix.
Ohio Ohio Department of Rehabilitation and Correc-
tions (ODRC) must achieve at least a 5 percent savings in the per diem for private contracts after adding the costs of monitoring. This is the maximum price to be charged by the private company. The 2000 data were more detailed than the data in the recent years. How-

| 57Prison Break: A New Approach to Public Cost and Safety
ever, since the precise source is incomplete, we chose to present the data without evaluating it. The 2010 and 2012 data were provided by the ODRC. The short-run average variable cost for the public prisons of ODRC was calculated as a weighted average of the two public prisons most comparable to Lake Erie Cor-rectional Institution, the privately contracted prison. These were Richland Correctional Institution and Southeastern Correctional Institution. The weight-ing was done by the inmate population. The 2010 calculation was done by ODRC, while we followed the same procedure for 2012. Vera (2012) determined that the costs for 2010 were understated by 3.8 per-cent, and the same should be applied for 2012. We did not make the adjustment for the higher indirect and underfunded costs of 3.8 percent. Instead, in order to avoid double counting, we added the hierarchical costs and the federally determined 11 percent indirect costs calculated on the direct costs. Hierarchical costs are derived from the Vera report for 2010 by dividing the statewide administrative costs of $1,400,000 by the total number of inmates of 50,960 and by 365 to obtain $0.075. Underfunded retiree healthcare of $49,100,000 was similarly calculated to obtain $2.64 per inmate per day. Indirect costs were calculated in the US GAO (2012: 17) report as 11 percent of short-run direct costs. We applied that figure to calculate Ohio’s short-run indirect costs.
Ohio sold a 1,570-bed male prison to CCA in 2011 for $72 million. Depreciation costs for both 2010 and 2012 were $72.7 million / 20 years / 1,570 inmates / 365 = $6.34. However, we chose to be conservative and therefore used the US GAO (2012: 13) modernization, depreciation, and repair figure of $4.61. For interest paid on state bonds we used 4 per-cent on the actual Ohio’s sale price of $72.7 million to obtain a cost of $5.07 per inmate per day. Since the prison was sold in 2011, we then calculated the short- and long-run percentage savings just for 2012.
Oklahoma Data were obtained from Oklahoma Department
of Corrections, Total Cost to State, “Statement of Op-erating Cost per Inmate Based on FY2011 Actuals.” The category “Actual Costs” is assumed to refer to labor,
education, and training, including all benefits for such personnel. The unfunded pensions for 2010 were calcu-lated as: $11,600,000 / (24,549 * 365) = $1.29. These figures were obtained from Vera (2012), the Oklahoma page. We included depreciation costs based on the $4.61 figure calculated by the U.S. Bureau of Prisons (US GAO, 2012: 13), which was used to charge states for holding their inmates in federal prisons. OKDOC purchased in 2000 a 600-inmate private prison for about $27 million. Computing interest (0.04 percent) per inmate (600) per day (365) yields $4.93. Modern-ization, repair, and depreciation of $4.61 were obtained from the U.S. GAO based on the U.S. BOP study.
The number of private and total inmates, for every state was available from the U.S. BJS (2011, Appendix tables 1 and 20) http://www.azcorrections.gov/adc/divisions/adminservices/notice_rfp_1200001388.pdf. For Oklahoma (and also for Mississippi and Kentucky), we included the total for the state statistics under the medium category. The prices per diem paid by OKDOC to the three medium-security male private prisons and to the one maximum-security male private prison are available at http://www.doc.state.ok.us/field/private_prisons/privates.htm. This website also includes the daily occupancy rates (http://www.doc.state.ok.us/offenders/count.htm) and ages of all prisons (http://www.doc.state.ok.us/facilities/facilities.htm).
TennesseeThe Tennessee DOC provided a document from the
General Assembly of the State of Tennessee Fiscal Review Committee (2010). The state is responsible for major maintenance of the privately operated prison, which is owned by the state. The central overhead allocation reflects state costs for private contract prisons. This allo-cation is 76 to 77 percent of its own cost for state prisons. Both items were added to the price by the legislature to determine whether the state five percent statutory savings were met. The data for the number of inmates (27,451) and number of inmates in private facilities (5,120) are for 2010, and derived from U.S. BJS (2011).
Texas Data were obtained from the Texas Legislative
Budget Board (2011). Personnel services include just

the independent institute58 |
wages and salaries. Benefits were calculated by dividing the total benefits ($564,800,000) from Vera’s report, by the average number of offenders (22,798) in the 1,000-bed prototype institutions (2012, Table 14, p. 29) to obtain the daily cost. The calculation is as follows: (564,800,000 / 139,061) / 365 = $11.12. Hi-erarchical costs were calculated for Texas from the Vera report as statewide administrative costs of $9,400,000 / (139,061 * 365) = $0.19. The 139,061 number of inmates was taken from the Texas legislative report (Texas Legislative Budget Board, 2011, p. 39). Interest for capital outlays to fund repairs and rehabilitation was $208.7 million in 2010, which is found in the Vera report. We divided the number of adult prisoners in
the prototype institution by the total prisoners (22,798 / 139,061 * 208.7M) / (365 * 22,798) = $4.11. Texas has underfunded pensions and retiree healthcare that it has neglected to pay. The Vera report for fiscal year 2010 provides these numbers: $48.1 million of underfunded pensions, $177.2 million underfunded retiree healthcare, adding up to $225.3 million. The underfunded total per inmate per day is $225,000,000 / (139,061 inmates * 365) = $4.44. Indirect short-term cost was $1.30 per inmate per day was reported in the Criminal Justice Uniform Cost Report (Texas Legislative Budget Board, 2011). We chose to use the standard-ized US GAO (2012: 17) figure of 11 percent which is consistent with the data of most states.
Table Appendix 2.1. Avoidable Costs for Three Cases
Cost Item Definitions
Contracting Out Existing
Prison
Overcrowding and Use of
Contract Prison
Purchase of Existing State
Prison
Personnel Services (mainly security)
Includes wages, health insur-ance, and retirement benefits
x x x
Medical Services Includes contracted medical, dental, pharmaceutical, and mental health services
x x x
Food x x x
Utilities x x x
Fuel x x x
Contracted Professional Services
Includes teachers, psychologists, and others
x x x
Office & Supplies x x x
State-Provided Professional Services
x x x
Technology x x x
Rent Includes leasing vehicles and other equipment
x x x
General Operation x x x
Repairs x x x
All Other x x x
Paid Short-Run Costs
“Out-of-pocket” expenses that are direct function to the num-ber of inmates
x x x

| 59Prison Break: A New Approach to Public Cost and Safety
Cost Item Definitions
Contracting Out Existing
Prison
Overcrowding and Use of
Contract Prison
Purchase of Existing State
Prison
Underfunded Pensions & Retiree Healthcare
Payments below the appropriate actuarial value
x x x
Short-Run Direct Costs
Includes the out-of-pocket expenses and expenses incurred but unpaid
x x x
Parole Board
Hierarchical 0.25*x 0.25*x 0.25*x
Other Short-Run Indirect Costs
0.25*x 0.25*x 0.25*x
Short-Run Indirect Costs
Classification, assignment and tracking of inmates, adjudicat-ing inmate grievances, parole hearing, inmate transfer, liability insurance, human resources for employees, legal, and auditing
0.25*x 0.25*x 0.25*x
Total Short-Run Costs
Includes direct and indirect costs associated with the number of inmates accruing to DOC and other state agencies (also referred to variable costs)
x x x
Depreciation (capital cost)
x x
Interest on Debt x x
Total Long-Run Costs
Includes all expenses directly linked to the number of inmates and capital costs. The latter includes modernization, signif-icant repairs, depreciation, and financing costs. (The long-run costs are also referred to as the sum of short-run variable costs and the fixed or capital costs.)
x x
State Maintenance Expense
Includes annual upkeep of facility. In most states it appears as Repairs.
x x
Monitoring Costs Direct monitoring of private facilities including DOC’s central office related expenses. In most states these expenses are incorporated in the per diem price of contractor.

Item
ized
Cos
ts b
y St
ate,
C
usto
dy, a
nd Y
ear
AZ
AZ
CA
CA
FLK
YK
YK
YK
YM
EM
SM
S
Cus
tody
/Yea
rM
in
2010
Med
20
1020
07/8
All
2011
/12
Min
-M
ed
2008
/9
Min
-M
ed
2011
Min
-M
ed
2012
Med
20
11M
ed
2012
2011
Min
20
11
Med
-M
ax
2011
1aPe
rson
nel S
ervi
ces
(M
ainl
y Se
curi
ty)
59.6
067
.01
38.8
379
.25
21.1
920
.58
2aM
edic
al S
ervi
ces
21.8
943
.95
8.65
16.6
78.
788.
78
3aFo
od4.
613.
503.
013.
01
4aU
tilit
ies
3.38
5aFu
el2.
68
6aC
ontr
acte
d Pr
ofes
sion
al
Serv
ices
2.
10
7aO
ffice
and
Sup
plie
s2.
10
8aSt
ate-
Prov
ided
Pr
ofes
sion
al S
ervi
ces
4.20
2.54
4.90
1.52
2.31
0.83
9aTe
chno
logy
1.28
10a
Ren
ts0.
58
11a
Gen
eral
Ope
rati
ons
9.08
13.9
10.
58
12a
Rep
airs
0.58
13a
All
Oth
er2.
100.
58
14a
Paid
Sho
rt-R
un C
osts
46
.59
48.3
294
.77
134.
1253
.78
51.3
148
.76
50.5
311
4.79
35.2
933
.20
15a
Und
erfu
nded
Pen
sion
s an
d R
etir
ee H
ealth
care
2.67
2.67
15.1
815
.18
0.55
2.80
2.80
2.80
2.80
6.86
16a
Shor
t-R
un D
irec
t Cos
ts49
.26
51.0
910
9.95
149.
3052
.93
56.5
854
.10
51.5
653
.33
121.
6535
.29
33.2
0
17a
Paro
le B
oard
0.15
0.15
18a
Hie
rarc
hica
l4.
667.
110.
180.
330.
330.
330.
335.
272.
812.
81
19a
Oth
er S
hort
-Run
In
dire
ct C
osts
3.54
5.91
5.64
5.36
5.56
1.37
20a
Shor
t-R
un I
ndir
ect C
osts
5.42
5.62
12.0
97.
115.
826.
225.
955.
675.
8713
.38
3.88
3.65
21a
Tota
l Sho
rt-R
un C
osts
54.6
856
.51
122.
0515
6.41
58.7
562
.80
60.0
557
.23
59.2
013
5.03
39.1
736
.85
22a
Dep
reci
atio
n
(Cap
ital
Cos
t)9.
309.
304.
614.
612.
15
23a
Inte
rest
on
Deb
t0.
040.
047.
051.
901.
901.
901.
902.
1511
.26
7.57
24a
Tota
l Lon
g-R
un C
osts
64.0
165
.84
126.
6616
5.44
65.8
064
.93
62.1
859
.36
61.3
313
9.33
50.4
344
.42
25a
Stat
e M
aint
enan
ce
Exp
ense
Tabl
e A
ppen
dix
3.1.
Sta
te C
osts
and
Pri
vate
Con
trac
tor
Pri
ces
(Per
Inm
ate
Per
Day
)
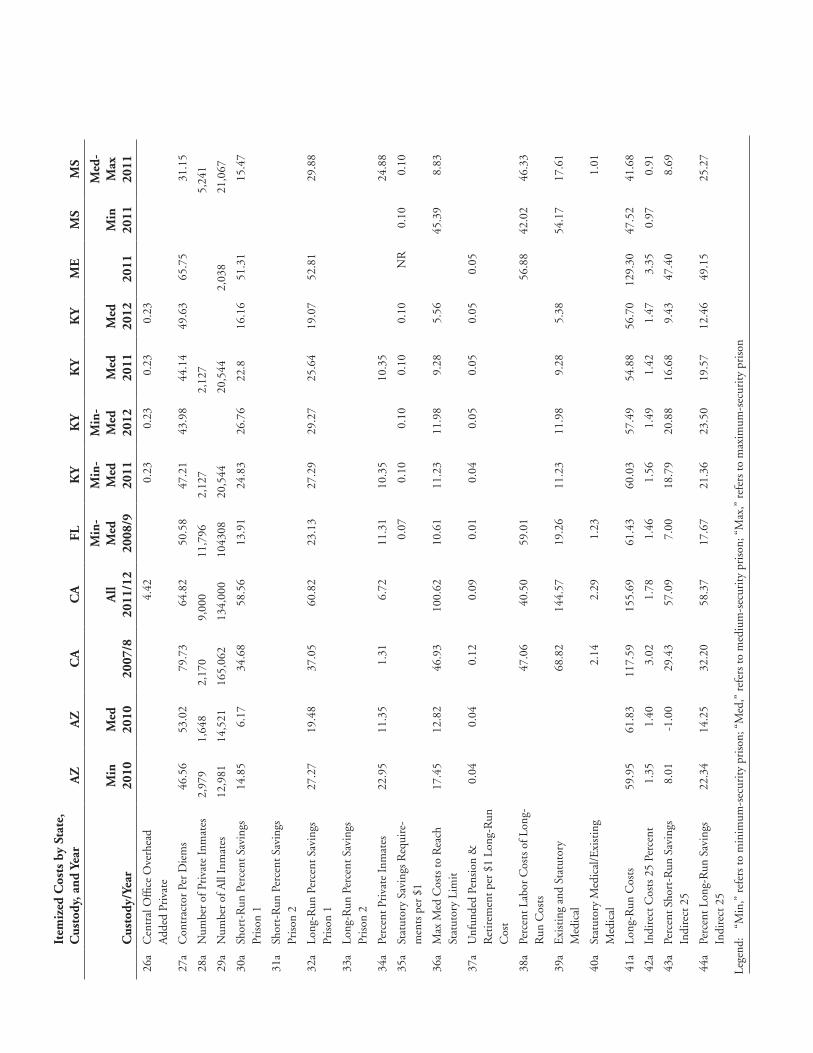
Item
ized
Cos
ts b
y St
ate,
C
usto
dy, a
nd Y
ear
AZ
AZ
CA
CA
FLK
YK
YK
YK
YM
EM
SM
S
Cus
tody
/Yea
rM
in
2010
Med
20
1020
07/8
All
2011
/12
Min
-M
ed
2008
/9
Min
-M
ed
2011
Min
-M
ed
2012
Med
20
11M
ed
2012
2011
Min
20
11
Med
-M
ax
2011
26a
Cen
tral
Offi
ce O
verh
ead
Add
ed P
riva
te4.
420.
230.
230.
230.
23
27a
Con
trac
tor
Per
Die
ms
46.5
653
.02
79.7
364
.82
50.5
847
.21
43.9
844
.14
49.6
365
.75
31.1
5
28a
Num
ber
of P
riva
te I
nmat
es2,
979
1,64
8.2,
170.
9,00
0.11
,796
.2,
127.
2,12
7.5,
241
29a
Num
ber
of A
ll In
mat
es12
,981
.14
,521
.16
5,06
2.13
4,00
0.10
4308
.20
,544
.20
,544
.2,
038
21,0
67
30a
Shor
t-R
un P
erce
nt S
avin
gs
Pris
on 1
14.8
56.
1734
.68
58.5
613
.91
24.8
326
.76
22.8
16.1
651
.31
15.4
7
31a
Shor
t-R
un P
erce
nt S
avin
gs
Pris
on 2
32a
Long
-Run
Per
cent
Sav
ings
Pr
ison
127
.27
19.4
837
.05
60.8
223
.13
27.2
929
.27
25.6
419
.07
52.8
129
.88
33a
Long
-Run
Per
cent
Sav
ings
Pr
ison
2
34a
Perc
ent P
riva
te I
nmat
es22
.95
11.3
51.
316.
7211
.31
10.3
510
.35
24.8
8
35a
Stat
utor
y Sa
ving
s R
equi
re-
men
ts p
er $
10.
070.
100.
100.
100.
10N
R0.
100.
10
36a
Max
Med
Cos
ts to
Rea
ch
Stat
utor
y Li
mit
17.4
512
.82
46.9
310
0.62
10.6
111
.23
11.9
89.
285.
5645
.39
8.83
37a
Unf
unde
d Pe
nsio
n &
R
etir
emen
t per
$1
Long
-Run
C
ost
0.04
0.04
0.12
0.09
0.01
0.04
0.05
0.05
0.05
0.05
38a
Perc
ent L
abor
Cos
ts o
f Lon
g-R
un C
osts
47.0
640
.50
59.0
156
.88
42.0
246
.33
39a
Exi
stin
g an
d St
atut
ory
Med
ical
68
.82
144.
5719
.26
11.2
311
.98
9.28
5.38
54.1
717
.61
40a
Stat
utor
y M
edic
al/E
xist
ing
Med
ical
2.14
2.29
1.23
1.01
41a
Long
-Run
Cos
ts59
.95
61.8
311
7.59
155.
6961
.43
60.0
357
.49
54.8
856
.70
129.
3047
.52
41.6
8
42a
Indi
rect
Cos
ts 2
5 Pe
rcen
t1.
351.
403.
021.
781.
461.
561.
491.
421.
473.
350.
970.
91
43a
Perc
ent S
hort
-Run
Sav
ings
In
dire
ct 2
5 8.
01-1
.00
29.4
357
.09
7.00
18.7
920
.88
16.6
89.
4347
.40
8.69
44a
Perc
ent L
ong-
Run
Sav
ings
In
dire
ct 2
522
.34
14.2
532
.20
58.3
717
.67
21.3
623
.50
19.5
712
.46
49.1
525
.27
Lege
nd:
“M
in,”
ref
ers
to m
inim
um-s
ecur
ity
pris
on; “
Med
,” r
efer
s to
med
ium
-sec
urit
y pr
ison
; “M
ax,”
ref
ers
to m
axim
um-s
ecur
ity
pris
on

Item
ized
Cos
ts b
y St
ate,
C
usto
dy, a
nd Y
ear
OH
OH
OH
OK
OK
OK
OK
TN
TX
BO
P/
GA
O
Cus
tody
/Yea
rM
in-M
ed
2010
Med
20
10M
in-M
ed
2012
2010
Min
20
11M
ed
2011
Max
20
11M
ed
2011
Pro
toty
pe 2
011
Low
20
11
1bPe
rson
nel S
ervi
ces
(Mai
nly
Secu
rity
)27
.87
28.9
429
.61
65.2
940
.92
41.1
6
2bM
edic
al S
ervi
ces
8.28
9.37
10.5
65.
97
3bFo
od2.
32
4bU
tilit
ies
5bFu
el
6bC
ontr
acte
d Pr
ofes
sion
al S
ervi
ces
1.58
0.02
7bO
ffice
and
Sup
plie
s7.
640.
720.
710.
72
8bSt
ate-
Prov
ided
Pro
fess
iona
l Ser
vice
sN
A
9bTe
chno
logy
10b
Ren
ts
11b
Gen
eral
Ope
rati
ons
4.53
12b
Rep
airs
0.43
13b
All
Oth
er
14b
Paid
Sho
rt-R
un C
osts
48
.92
37.0
943
.92
39.2
339
.69
76.5
750
.86
53.7
665
.48
15b
Und
erfu
nded
Pen
sion
s an
d R
etir
ee
Hea
lthca
re)
2.64
2.
64
1.29
1.29
1.29
4.
44
16b
Shor
t-R
un D
irec
t Cos
ts51
.56
37.0
946
.56
40.5
240
.98
77.8
651
.29
58.2
065
.48
17b
Paro
le B
oard
18b
Hie
rarc
hica
l2.
030.
19
19b
Oth
er S
hort
-Run
Ind
irec
t Cos
ts5.
674.
085.
12
4.46
4.51
8.57
5.64
6.40
7.20
20b
Shor
t-R
un I
ndir
ect C
osts
5.67
4.08
5.12
4.46
4.51
8.57
7.67
6.59
7.20
21b
Tota
l Sho
rt-R
un C
osts
57.2
341
.17
51.6
844
.98
45.4
986
.43
58.9
664
.79
72.6
8
22b
Dep
reci
atio
n (C
apit
al C
ost)
4.61
4.61
4.61
4.61
4.61
4.11
4.61
23b
Inte
rest
on
Deb
t5.
075.
074.
934.
934.
934.
11
34b
Tota
l Lon
g-R
un C
osts
66.9
241
.17
61.3
70.
0054
.52
55.0
395
.97
60.6
673
.01
77.2
9
25b
Stat
e M
aint
enan
ce E
xpen
se0.
13
26b
Cen
tral
Offi
ce O
verh
ead
Add
ed
Priv
ate
1.57
27b
Con
trac
tor
Per
Die
ms
43.0
256
.62
Tabl
e A
ppen
dix
3.1
(con
tinu
ed).
Sta
te C
osts
and
Pri
vate
Con
trac
tor
Pri
ces
(Per
Inm
ate
Per
Day
)

Item
ized
Cos
ts b
y St
ate,
C
usto
dy, a
nd Y
ear
OH
OH
OH
OK
OK
OK
OK
TN
TX
BO
P/
GA
O
Cus
tody
/Yea
rM
in-M
ed
2010
Med
20
10M
in-M
ed
2012
2010
Min
20
11M
ed
2011
Max
20
11M
ed
2011
Pro
toty
pe 2
011
Low
20
11
28b
Con
trac
tor
per
Die
m P
riso
n145
.86
45.8
640
.28
57.9
642
.29
37.4
7
29b
Con
trac
tor
per
Die
m P
riso
n 2
43.0
256
.62
30b
Num
ber
of P
riva
te I
nmat
es3,
038
6,01
93,
569
261
5,12
019
,155
31b
Num
ber
of A
ll In
mat
es51
,712
26,2
526,
684
7,80
296
127
,451
173,
649
32b
Shor
t-R
un P
erce
nt S
avin
gs P
riso
n 1
19.8
7%11
.26%
11.4
632
.94
25.3
942
.16
33b
Shor
t-R
un P
erce
nt S
avin
gs P
riso
n 2
5.44
34.4
9
34b
Long
-Run
Per
cent
Sav
ings
Pri
son
131
.47
25.2
721
.83
41.0
030
.29
48.6
8
35b
Long
-Run
Per
cent
Sav
ings
Pri
son
221
.83
41.0
0
36b
Perc
ent P
riva
te I
nmat
es5.
8722
.93
45.7
427
.13
18.7
011
.03
37b
Stat
utor
y Sa
ving
s R
equi
rem
ents
per
$1
0.05
0.05
0.05
0.10
NR
38b
Max
Med
Cos
ts to
Rea
ch S
tatu
tory
Li
mit
17.7
112
.44
14.7
538
.01
28.2
4
39b
Unf
unde
d Pe
nsio
ns a
nd R
etir
emen
t pe
r $1
Lon
g-R
un C
ost
0.04
0.04
0.02
0.01
0.06
40b
Perc
ent L
abor
Cos
ts o
f Lon
g-R
un
Cos
ts67
.70
53.0
853
.80
68.0
356
.05
53.2
5
41b
Exi
stin
g an
d St
atut
ory
Med
ical
17
.71
12.4
4N
R24
.12
48.5
734
.21
42b
Stat
utor
y M
edic
al/E
xist
ing
Med
ical
1.57
3.60
4.73
43b
Indi
rect
Cos
ts 2
5 Pe
rcen
t1.
421.
021.
281.
111.
132.
141.
921.
651.
80
44b
Perc
ent S
hort
-Run
Sav
ings
Ind
irec
t 25
Pri
son
113
.44
4.14
4.35
27.5
617
.32
37.3
9
45b
Perc
ent S
hort
-Run
Sav
ings
Ind
irec
t 25
Pri
son
2-2
.16
29.2
3
46b
Perc
ent L
ong-
Run
Sav
ings
Ind
irec
t 25
Pri
son
1 26
.81
20.2
822
.02
35.2
717
.32
44.9
5
47b
Perc
ent L
ong-
Run
Sav
ings
Ind
irec
t 25
Pri
son
2 16
.71
36.7
7
Lege
nd:
“M
in,”
ref
ers
to m
inim
um-s
ecur
ity
pris
on; “
Med
,” r
efer
s to
med
ium
-sec
urit
y pr
ison
; “M
ax,”
ref
ers
to m
axim
um-s
ecur
ity
pris
on.

Tabl
e A
ppen
dix
3.2.
Tot
al S
tate
Gov
ernm
ent
and
Cor
rect
iona
l Em
ploy
ees
and
Wag
es, M
arch
201
1
Stat
e
Cor
rect
iona
l E
mpl
oym
ent
(1)
Tota
l Sta
te
Gov
ernm
ent
Em
ploy
men
t (
2)
Cor
rect
iona
l W
ages
(3)
Tota
l Sta
te
Gov
ernm
ent
Wag
es (
4)
Perc
ent
Cor
rect
iona
l E
mpl
oym
ent
of S
tate
G
over
nmen
t E
mpl
oym
ent
(5)
Perc
ent
C
orre
ctio
nal
Wag
es o
f Sta
te
Gov
ernm
ent
Wag
es(6
)
Und
erfu
ndin
g as
a P
erce
ntag
e of
Gro
ss S
tate
P
rodu
ct (
2007
)(7
)
Year
s of
Tot
al S
tate
R
ecei
pts
to E
limi-
nate
Und
erfu
ndin
g D
efici
t (2
007)
(8
)
AZ
10,1
1368
,786
37,4
67,5
9428
6,28
3,59
814
.713
.124
4.85
CA
60,0
0740
7,32
137
2,32
8,84
52,
402,
403,
913
14.7
15.5
264.
15
FL30
,382
184,
237
91,8
58,1
8770
6,91
7,69
216
.513
.016
3.26
KY
4,18
381
,493
10,8
86,4
4930
4,18
5,94
95.
13.
534
5.35
ME
1,22
421
,354
5,14
4,15
087
,046
,104
6.2
5.9
334.
38
MS
3,17
457
,656
8,33
7,54
020
7,12
8,46
15.
54.
041
5.73
OH
15,2
6113
9,04
964
,809
,527
653,
416,
073
11.0
9.9
478.
74
OK
4,86
468
,339
15,3
29,1
2326
1,29
0,60
57.
15.
931
5.16
TN
6,95
386
,215
19,6
66,9
9431
2,19
8,85
58.
16.
313
2.84
TX
43,4
0331
8,37
012
8,03
8,40
71,
364,
972,
027
13.6
9.4
164.
67
US
462,
549
4,35
9,38
01,
921,
450,
594
19,9
71,8
61,9
9010
.69.
6N
ot A
pplic
able
Not
App
licab
le
Sour
ce: U
.S. C
ensu
s B
urea
u, 2
011,
Ann
ual S
urve
y of
Pub
lic E
mpl
oym
ent a
nd P
ayro
ll, M
arch
. Ret
riev
ed Ju
ly 2
6, 2
013,
ht
tp:/
/ww
w.c
ensu
s.go
v/go
vs/a
pes/
. Dat
a fo
r ta
x re
venu
e an
d st
ate
prod
uct c
olum
ns fr
om N
ovy-
Mar
x an
d R
auh
(200
9, p
. 198
).

| 65Prison Break: A New Approach to Public Cost and Safety
References
Abt Associates. 1998, July 16. Private Prisons in the United States: An Assessment of Current Practice. Cambridge, MA: Abt Associates.
Arizona Department of Corrections. 2010, September. Auditor General Staff Analysis of the Department of Corrections, Fiscal Year (FY) 2009–FY 2010. Retrieved December 24, 2012, from http://www.azauditor.gov/Reports/State_Agencies/Agencies/Corrections_ Department_of/Performance/10-08/10-08.pdf
Arizona Department of Corrections. 2011, April 13. FY 2010 Operating Per Capita Cost Report, Bureau of Planning, Budget and Research.
Arizona Department of Corrections. 2012 Request for Proposals to Build and Operate a Medium Security Prison. Retrieved April 22, 2014, from http://www.azcorrections.gov/adc/divisions/ adminservices/notice_rfp_1200001388.pdf
Arizona State legislature. 2014. Adult incarceration con-tracts; criteria. Retrieved April 21, 2014 from http://www.azleg.gov/FormatDocument.asp?inDoc=/ars/41/01609-01.htm&Title=41&DocType=ARS
Arizona Joint Legislative Budget Committee (LBC). 2012, September 19. State–Private Prison Cost Comparison. Staff Memorandum.
Avondale Partners, LLC. 2009, March 2. Corrections Industry: Behind the Bars—an In-Depth View of the Corrections Industry.
Baker, Jonathan B. 2002. Mavericks, Mergers, and Exclusion: Proving Coordinated Competitive Effects under the Antitrust Laws. New York Law Review, 77(April):135–203.
Benson, Bruce L. 2003. Do We Want the Produc-tion of Prison Service to Be More “Efficient”? In Alexander Tabarrok (Ed.), Changing the Guard: Private Prisons and the Control of Crime:163–216. Oakland, CA: The Independent Institute.
Berger, Warren. 1992. More Warehouses, or Factories with Fences. In Gary Bowman, et al. (Eds.). Privat-izing the United States Justice System. Jefferson, NC: McFarland & Company. 330–335.
Blackstone, Erwin A. 2003. Benefits of Osteopathic. Health Affairs, 22(1, January), 292.
Blackstone, Erwin A., et al. 2011–2012. The Case of Duopoly: Industry Structure Is Not a Sufficient Basis for Regulation. Regulation, 34(4, Winter), 12–17. Retrieved September 17, 2013, from http://www.cato.org/sites/cato.org/files/serials/files/regulation/2012/6/v34n4-3.pdf
Blumstein, James F., Cohen, Mark A., & Seth, Su-man. 2007. Do Government Agencies Respond to Market Pressure? Evidence from Private Prisons. Owen Graduate School of Management, Van-derbilt University. Retrieved January 20, 2013, from http://www.cca.com/static/assets/Blumstein_ Cohen_Study.pdf. Also available as Blumstein et al. 2008. Do Government Agencies Respond to Market Pressures? Evidence from Private Prisons. Virginia Journal of Social Policy and the Law, 15(3): 446–477.
Brakel, Samuel. 1992. Private Corrections. In Gary Bowman, et al. (Eds.), Privatizing the United States Justice System. Jefferson, NC: McFarland & Com-pany, 254–274.
Brakel, Samuel, & Kimberley Ingersoll Gaylord. 2003. Prisons and Corrections. In Alexander Tabarrok (Ed.), Changing the Guard: Private Prisons and the Control of Crime (pp. 125–162). Oakland, CA: The Independent Institute.
Brown, Ben. 2011, March 6. Alaskans Deserve Bet-ter than the Not-So Golden Goose Creek Prison. Juneau Empire.com. Retrieved December 20, 2012, from http://juneauempire.com/stories/030611/opi_ 795369352.shtml
Brown v. Plata. 2011. 563 U.S. ___, 131 S. Ct. 1910.
Burnett, William B. 1999. Predation by a Non- Dominant Firm: The Liggett Case (1993). In John E. Kwoka and Lawrence J. White (Eds.), The Anti-trust Revolution (pp. 239–263). New York: Oxford University Press.
California Governor Budget for Department of Cor-rections and Rehabilitation (2011/2012). Section 5225, 3-yr Expenditures and Personnel Years, actual 2010-11, pp CR5, CR15. Retrieved April 22, 2014,

the independent institute66 |
from http://www.ebudget.ca.gov/2012-13-EN/pdf/GovernorsBudget/5210/5225_fig1f.pdf
California Legislative Analyst’s Office (CALAO). 2008, February 7. Correctional Officer Pay, Bene-fits, and Labor Relations. Retrieved December 11, 2012, from http://www.lao.ca.gov/2008/stadm/ccpoa_pay_020708/ccpoa_pay_020708.aspx
California Legislative Analyst’s Office (CALAO). 2010, January 20. California Out-of-State Correctional Facility Program. Presented to the Assembly Ac-countability and Administrative Review Committee.
California Legislative Analyst’s Office (CALAO). 2012a, April 19. Providing Constitutional and Cost-Effective Inmate Medical Care.
California Legislative Analyst’s Office (CALAO). 2012b, February 23. The 2012–13 Budget: Refocus-ing CDCR After The 2011 Realignment. Retrieved December 11, 2012, from http://www.lao.ca.gov/analysis/2012/crim_justice/cdcr-022312.pdf
California Legislative Analyst’s Office (CALAO). 2013, January. California’s Criminal Justice System: A Primer. Retrieved February 3, 2013, from http://lao.ca.gov/laoapp/PubDetails.aspx?id=2682
California Public Works Board. 2012. Agenda with Analysis, September 11.
California State Auditor. 2009, September. California Department of Corrections and Rehabilitation: It Fail to Track and Use Data . . . . Report 2009-107.1. http://www.bsa.ca.gov/pdfs/sr2011/2009-107.1.pdf
California State Works Board. 2012. Agenda with Analysis for Meeting September 11, 2012. Retrieved November 16, 2013, from http://www.spwb.ca.gov/archives/agendas/documents/09-11-12_Agendaw_Analysis.pdf
Camp, Scott D., & Daggett, Dawn M. 2005. Quality of Operations at Private and Public Prisons: Using Trends in Inmate Misconduct to Compare Prisons. Washington, DC: Office of Research and Evalua-tion, Federal Bureau of Prisons.
Camp, Scott D., & Gaes, Gerald G. 2002. Growth and Quality of U.S. Private Prisons: Evidence from
a National Survey. Criminology and Public Policy, 1(3), July: 427–450.
CCA of Tennessee vs. Department of Management Ser-vices. 2013, July 12. State of Florida, Division of Administrative Hearings, Case No. 13-0880BID.
Culp, Richard. 2011, October 6. The Failed Promise of Prison Privatization. Prison Legal News. Retrieved September 17, 2013, from http://www.inthepublicin-terest.org/article/failed-promise- prison-privatization
Diroll, David J. 2011. Prison Crowding: The Long View, With Suggestions. The 2011 Monitoring Report of the Ohio Criminal Sentencing Commis-sion, March. Retrieved April 21, 2014, from http://www.supremecourt.ohio.gov/boards/Sentencing/resources/publications/monitoringreport2011.pdf
Dreyfuss, Rick. 2013, July 30. Pension Crisis Wors-ens in Pa. Philadelphia Inquirer, A15.
Elias, Paul. 2013. High Court Won’t Delay Inmates’ Early Release. Philadelphia Inquirer, A6.
Elliott Pollack and Company. 2010, January. Eco-nomic and Fiscal Impact of CCA-Arizona Correc-tional Facilities. Scottsdale, AZ: Elliot Pollack & Co. Retrieved January 28, 2013, from http://www.cca.com/static/assets/CCA_Arizona_Impact_Re-port_2009_FINAL_011810.pdf
Florida Chamber of Commerce. 2012, February 13. Data Shows Privately Run Prisons Can Provide a Better Environment for Effective Inmate Reha-bilitation Programs. Copy is available from the Chamber. Retrieved March 21, 2013, from http://www.wctv.tv/blogs/editorial/Data_Privately_Run_Prisons_Can_Provide_Better_Rehabilitation_ Programs_139216274.html.
Florida Department of Management Services, 2012, January 19. Private Prison Monitoring. Presentation before the Florida House Appropriations Commit-tee. Retrieved January 30, 2013, from http://big.as-sets.huffingtonpost.com/FloridaDMSJan2012.pdf
Florida Legislature Office of Program Policy Analysis And Government Accountability, 2013. March. Information Brief Comparing Costs of Public and Private Prisons. Retrieved June 10, 2014, from http://

| 67Prison Break: A New Approach to Public Cost and Safety
www.oppaga.state.fl.us/MonitorDocs/Reports/ pdf/9669rpt.pdf
Florida Office of Program Policy Analysis and Govern-ment Accountability (OPPAGA), 1997. Information Brief Comparing Costs of Public and Private Prisons, March. Report No. 96-69. Florida Legislature.
Florida Office of Program Policy Analysis and Gov-ernment Accountability (OPPAGA). 2010a, April 20. Private Prisons Exceed Savings Requirements. Florida Legislature.
Florida Office of Program Policy Analysis and Government Accountability (OPPAGA). 2010b, February 1. Prison Construction: Research Mem-orandum. Florida Legislature.
Gaes, Gerald G., et al. 2004. Measuring Prison Perfor-mance: Government Privatization and Accountability. New York: Altamira Press.
Gilroy, Leonard, & Kenny, Harris. 2011. Annual Privatization Report 2011: Corrections and Public Safety. Los Angeles: Reason Foundation. Retrieved December 14, 2012, from http://reason.org/files/publicsafety_annual_privatization_report_2011.pdf
Harris, Craig, 2013. Arizona faces growing cost of private prisons. The Arizona Republic. December 29. Retrieved April 21, 2014 from http://www.azcentral.com/news/arizona/articles/20131204 arizona-private-prisons-growing-cost.html
Healey, Thomas J., et al. 2012. Underfunded Public Pensions in the United States: The Size of the Prob-lem, the Obstacles to Reform and the Path Forward. Harvard Kennedy School, M-RCBJ Faculty Work-ing Paper No. 2012-08. Retrieved July 25, 2013, from http://www.hks.harvard.edu/var/ezp_site/storage/fckeditor/file/pdfs/centers-programs/centers/mrcbg/publications/fwp/MRCBG_FW-P_2012_08-Healey_Underfunded.pdf
Jing, Yijia. 2010. Prison Privatization: A Study of the Causes and Magnitude. New York: Nova Science Publishers.
Joint Legislative Committee on Performance Evaluation and Expenditure Review (PEER), Mississippi Depart-ment of Corrections. 2011, December 13. FY 2011 Cost per Inmate Day. The Mississippi Legislature.
Kentucky Department of Corrections. 2013. Cost to Incarcerate. Research and Statistics, Annual Reports. Retrieved February 5, 2013, from http://corrections.ky.gov/about/Pages/Researchand Statistics.aspx
Kentucky Legislative Research Commission (KLRC). 2009. Cost of Incarcerating Adult Felons. Research Report No. 373. Retrieved November 19, 2012, from http://www.lrc.ky.gov/lrcpubs/RR373.pdf
Lanza-Kaduce, Lonn, Karen F. Parker, and Charles W. Thomas, 1999. A Comparative Recidivism Analysis of Releases from Private and Public Pris-ons. Crime & Delinquency, 45(1). January: 28–47.
Leonard, Kimberly. 2012, July 21. Privatized Prison Healthcare Scrutinized. Washington Post. Retrieved April 22, 2014 from http://articles.washington-post.com/2012-07-21/national/35486443_1_ wexford-health-sources-prisoner-health-corizon
Logan, Charles H. 1992. Well Kept: Comparing Quality of Confinement in Private and Public Prisons. Journal of Criminal Law and Criminology, 83(3, Fall): 577–613.
Logan, Charles H. 1996. Private Prison Management: A Case Comparison. Criminal Justice Review, 21(1, spring): 62–85.
Logan, Charles H., & McGriff, Bill W. 1989, Sep-tember/October. Comparing Costs of Public and Private Prisons: A Case Study. Research in Action. U.S. Department of Justice, Office of Justice Pro-gram, NIJ Reports No. 216.
Lundahl, Brad W., et al. 2009. Prison Privatization: A Meta-Analysis of Cost and Quality Indicators. Research on Social Work, 19(4), 383–394. DOI: 10.1177/1049731509331946
Maine Office of Program Evaluation & Government Accountability. 2012, June. Cost per Prisoner in the State Correctional System. Retrieved April 22, 2014, from http://www.maine.gov/legis/opega/GOC/GOC_meetings/Current_handouts/6-8-12/Final%20CPP%20Info%20Brief%206-8-12.pdf
McCrie, Robert D. 1993. Private Correction: The Delicate Balance. In G. Bowman, et al. (Eds.),
the independent institute68 |
Privatizing Correctional Institutions (pp. 19–32). New Brunswick, NJ: Transaction Publishers.
MGT of America. 2006, November 1. Comparative Study of South Bay and Lake City Private Prison Facilities. Prepared for Florida Department of Management Services.
MGT of America. 2007, December 31. Performance Audit of the Department of Corrections for the Leg-islative Service Bureau of the Oklahoma Legislature: Final Report. Retrieved December 21, 2012, from http://www.okhouse.gov/Documents/OKRVSD-FinalReport080103.pdf
Mississippi Joint Legislative Committee on Performance Evaluation and Expenditure Review (PEER). 2011, December 13. Mississippi Department of Corrections’ FY 2011, Cost per Inmate Day. Retrieved from http://www.peer.state.ms.us/reports/rpt557.pdf
Mississippi Joint Legislative Committee on Performance Evaluation and Expenditure Review (PEER). 2012, December 11. Mississippi Department of Corrections’ FY 2012, Cost per Inmate Day. Retrieved from http://www.peer.state.ms.us/reports/rpt565.pdf
Moore, Adrian T. 1999. Private Prisons: Quality Correc-tions at a Lower Cost. The Reason Foundation, RPPI Policy Study No. 240. Retrieved September 25, 2013, from http://www.hawaii.edu/hivandaids/Private_ Prisons__Quality_Corrections_at_a_Lower_Cost.pdf
Munnell, Alicia H., et al. 2013. State and Local Pension Costs: Pre-Crisis, Post-Crisis, and Post- Reform. Center for Retirement Research at Boston College, Number 30, February. Retrieved July 25, 2013, from http://crr.bc.edu/wp-content/ uploads/2013/02/slp_30.pdf
Nelson, Julianne Nelson. 2005, December. Compe-tition in Corrections: Comparing Public and Private Sector Operations. Boston, MA: CNA Corporation.
Novy-Marx, Robert, & Rauh, Joshua D. 2009. The Li-abilities and Risks of State-sponsored Pension Plans. Journal of Economic Perspectives, 23(4, Fall), 191–210.
Ohio Department of Rehabilitation and Corrections (ODRC). 2007. Basic Model for Estimating Oper-ating Costs. Attachment to the contracts for North
Coast Correctional Treatment Facility and the Lake Erie Correctional Institution.
Ohio Department of Rehabilitation and Corrections (ODRC). 2011 Annual Report. Retrieved February 13, 2013, from http://www.drc.ohio.gov/web/reports/Annual/Annual%20Report%202011.pdf
Oklahoma Department of Corrections (OKDOC). 2011. Total Cost to State. Statement of Operating Cost per Inmate Based on FY 2011 Actual. Report sup-plied by the Oklahoma Department of Corrections.
Oklahoma Department of Corrections (OKDOC). 2012. History and Development of Private Bed Space in Oklahoma Department of Corrections. Document provided by OKDOC, November 2012.
Perrone, D., & Pratt, T. C. 2003. Comparing the Quality of Confinement and Cost-Effectiveness of Public Versus Private Prisons: What We Know, Why We Do Not Know More, and Where Do We Go From Here? The Prison Journal, 83: 301–322.
Pew, Center on the States. 2010, February. The Trillion Dollar Gap: Underfunded State Retirement Systems and the Roads to Reform. Washington, DC: Pew. Retrieved April 8, 2013, from http://www.hartfordinfo.org/issues/wsd/taxes/the_trillion_dollar_gap_final.pdf
Pew, Center on the States. 2012, June. The Widening Gap Update. Issue Brief. Retrieved November 4, 2013, from http://www.pewstates.org/uploaded-Files/PCS_Assets/2012/Pew_Pensions_Update.pdf
Picard, Ken. 2011. Is It Cheaper to House Ver-mont Prisoners In or Out of State? It Depends. Retrieved November 5, 2012, from http://7dvt.com/2011vermont-prisons
Pratt, Travis C. & Maahs, Jeff. 1999. Are Private Prisons More Cost-Effective Than Public Prisons? A Meta-Analysis of Evaluation Research Studies. Crime and Delinquency, 45: 358–371.
Sanders, Katie. 2012, February 14. Private Prisons Can Chase Escapees. Tampa Bay Times, 18.
Schmalensee, Richard. 1978. Entry Deliverance in the Need-To-Eat Cereal Industry. Bell Journal of Economics, 9(2, Autumn), 305–327.

| 69Prison Break: A New Approach to Public Cost and Safety
Segal, Geoffrey F., & Moore, Adriane T. 2002, January. Weighing the Watchman: Evaluating the Costs and Ben-efits of Outsourcing Correctional Services. Policy Study 289. Los Angeles: Reason Public Policy Institute.
Shichor, David. 1995. Punishment for Profit: Private Prison/Public Concerns. Thousand Oaks, CA: Sage.
State of Washington. 2012, June. The Washington State Budget Process. Office of Financial Manage-ment, Budget Division.
Strumpf, Dan. 2013, February 11. With Fewer to Lock Up, Prisons Shut Doors. Wall Street Journal, A-3.
Tang, Norman. 2012, July 9. The Profit of Prison. Motley Fool. Retrieved November 4, 2013, from http://beta.fool.com/ymwg/2012/07/09/profit-prison/6768/
Tennessee General Assembly, Fiscal Review Com-mittee. 2010, April 26. Memorandum on Cost Comparison: State and Private Prison Contractors.
Texas Legislative Budget Board. 2011, January. Criminal Justice Uniform Cost Report: Fiscal Years 2008–2010. January. Retrieved February 11, 2013, from http://www.lbb.state.tx.us/Public_Safety_Criminal_Justice/Uniform_Cost/Criminal %20Justice%20Uniform%20Cost%20Reports 2008-2010.pdf
Texas Legislative Budget Board. 2013, January. Criminal Justice Uniform Cost Report: Fiscal Years 2010–2012. January. Retrieved February 11, 2013, from http://www.lbb.state.tx.us/Public_Safety_Criminal_Justice/Uniform_Cost/Criminal%20Justice%20Uniform%20Cost%20Report%20Fiscal%20Years%202010%20to%202012.pdf
Thomas, Charles W. 2004. Correctional Privatization in America: An Assessment of Its Historical Origins, Present Status, and Future Prospects. In Alexander Tabarrok (Ed.), Changing the Guard: Private Prisons and the Control of Crime (pp. 57–124). Oakland, CA: The Independent Institute.
U.S. Army Corps of Engineers. 2011, March 31. Civil Works Construction Cost Index System. Retrieved November 4, 2013, from http://planning.usace.army.mil/toolbox/library/EMs/em1110.2.1304.pdf
U.S. Bureau of Justice Statistics (U.S. BJS). 2001, February. Emerging Issues on Privatized Prisons. NCJ 181249.
U.S. Bureau of Justice Statistics (U.S. BJS). 2005. Census of State and Federal Correctional Facilities, 2005. Retrieved February 25, 2012, from http://bjs.ojp.usdoj.gov/content/pub/pdf/csfcf05.pdf
U.S. Bureau of Justice Statistics (U.S. BJS). 2011. Prisoners in 2010. U.S. DOJ Report NCJ 236096. Retrieved February 27, 2013, from http://bjs.ojp.usdoj.gov/content/pub/pdf/p10.pdf
U.S. Government Accountability Office (US GAO). 2012, July 27. Federal Bureau of Prisons: Methods for Estimating Incarceration and Community Correc-tions Costs and Result of the Elderly Offender Pilot.
U.S. Government Accountability Office (US GAO). 1996, August. Private and Public Prisons and Stud-ies Comparing Operational Costs and/or Quality of Service. Report to the Subcommittee on Crime, Committee of the Judiciary, House of Representa-tives. GAO/GGD-96-158.
Vera Institute of Justice (Vera). 2012, March 20. The Price of Prisons: Incarceration Costs Taxpayers. New York: Vera Institute of Justice.
W M Financial Services, 2014. Rates Over Time— Interest Rate Trends. Retrieved April 21, 2014 from http://www.munibondadvisor.com/market.htm
the independent institute70 |
Acknowledgements
The authors thank the officials in the state corrections departments, state legislators, and state oversight agencies, as well as relevant federal officials, who provided the data and interviews used in this research. We also thank Cor-rections Corporation of America, GEO Group, and Management and Training Corp., members of the private corrections industry, for their partial funding of this project. Last but certainly not least, the authors gratefully acknowledge the helpful referees’ comments that have significantly improved this study through peer review. Any omissions or errors are the responsibility of the authors.

71
About the Authors
Simon Hakim is research fellow at The Independent Institute and professor of econom-ics and the director of the Center for Competitive Government at Temple University. He edits a book series on Protecting Critical Infrastructures with Springer Publisher. He earned M.A and Ph.D. degrees in Regional Science from the University of Pennsylvania. He also earned a M.Sc. degree in City and Regional Planning from the Technion, Israel Institute of Technology, and a B.A. in Economics at Hebrew University in Jerusalem. His special areas of research and teaching are economics of privatization and public- private-partnerships, economics of crime and security, private/public police, and home-land security. Dr. Hakim has published sixty-one scientific articles in leading economic,
criminal justice, security, and public policy journals. He has written over forty professional articles and edited sixteen books. Along with Erwin A. Blackstone, he wrote a major textbook on the electronic security industry. He is invited to lecture and teach classes on privatization and international economics in MBA and city plan-ning programs worldwide.
Dr. Hakim conducted many funded research and consulting projects on public-private partnerships, secu-rity, and public finance issues for the U.S. Departments of Justice and Labor; the Commonwealth Foundation; The Independent Institute; the Alarm Industry Research and Education Foundation; the private prison indus-try; the cities of Philadelphia, Newark, and New Castle County, DE; the Philadelphia International Airport; ADT; Vector Security; law firms; and other leading security companies. For the complete Curriculum Vitae see http://d3iovmfe1okdrz.cloudfront.net/cms/wp-content/uploads/2012/09/simonvitae_1.pdf
For the Center for Competitive Government see http://www.fox.temple.edu/ccg.
Erwin A. Blackstone is research fellow at The Independent Institute and has taught economics for over forty years. Prior to coming to Temple in 1976, Dr. Blackstone taught at Dartmouth College and Cornell University. His research areas and publica-tions include the economics of industrial organization, antitrust, health economics, and privatization. He has published on a variety of topics including hospital mergers, competition in police services, economics of biopharmaceuticals, tying agreements and collusion. His publications include over fifty articles in major economics and public policy journals, chapters in books, two edited books, a monograph on private policing, and a book on the electronic security industry. Dr. Blackstone has taught courses from
the introductory to the Ph.D. level. He was given in 1976 the Clark Award for distinguished teaching at Cornell and at Temple, the Andrisani-Frank Award for Excellence in teaching in 2001, and the Musser Excellence in Leadership Award for teaching in 2006. Professor Blackstone holds a Ph.D. from the University of Michigan.


THE ACADEMY IN CRISIS | Ed. by John W. Sommer
AGAINST LEVIATHAN | Robert Higgs
ALIENATION AND THE SOVIET ECONOMY | Paul Craig Roberts
AMERICAN HEALTH CARE | Ed. by Roger D. Feldman
ANARCHY AND THE LAW | Ed. by Edward P. Stringham
ANTITRUST AND MONOPOLY | D. T. Armentano
AQUANOMICS | Ed. by B. Delworth Gardner & Randy T. Simmons
ARMS, POLITICS, AND THE ECONOMY | Ed. by Robert Higgs
BEYOND POLITICS | Randy T. Simmons
BOOM AND BUST BANKING | Ed. by David Beckworth
CAN TEACHERS OWN THEIR OWN SCHOOLS? | Richard K. Vedder
THE CAPITALIST REVOLUTION IN LATIN AMERICA | Paul Craig Roberts & Karen Araujo
THE CHALLENGE OF LIBERTY | Ed. by Robert Higgs & Carl P. Close
CHANGING THE GUARD | Ed. by Alexander Tabarrok
THE CHE GUEVARA MYTH AND THE FUTURE OF LIBERTY | Alvaro Vargas Llosa
THE CIVILIAN AND THE MILITARY | Arthur A. Ekirch, Jr.
CRISIS AND LEVIATHAN, 25TH ANNIVERSARY EDITION | Robert Higgs
CUTTING GREEN TAPE | Ed. by Richard L. Stroup & Roger E. Meiners
THE DECLINE OF AMERICAN LIBERALISM | Arthur A. Ekirch, Jr.
DELUSIONS OF POWER | Robert Higgs
DEPRESSION, WAR, AND COLD WAR | Robert Higgs
THE DIVERSITY MYTH | David O. Sacks & Peter A. Thiel
DRUG WAR CRIMES | Jeffrey A. Miron
ELECTRIC CHOICES | Ed. by Andrew N. Kleit
THE EMPIRE HAS NO CLOTHES | Ivan Eland
THE ENTERPRISE OF LAW | Bruce L. Benson
ENTREPRENEURIAL ECONOMICS | Ed. by Alexander Tabarrok
FAULTY TOWERS | Ryan C. Amacher & Roger E. Meiners
FINANCING FAILURE | Vern McKinley
FIRE & SMOKE | Michael I. Krauss
THE FOUNDERS’ SECOND AMENDMENT | Stephen P. Halbrook
FREEDOM, FEMINISM, AND THE STATE | Ed. by Wendy McElroy
GLOBAL CROSSINGS | Alvaro Vargas Llosa
GOOD MONEY | George Selgin GUN CONTROL IN THE THIRD REICH | Stephen P. Halbrook
HAZARDOUS TO OUR HEALTH? | Ed. by Robert Higgs
HOT TALK, COLD SCIENCE | S. Fred Singer
HOUSING AMERICA | Ed. by Randall G. Holcombe & Benjamin Powell
JUDGE AND JURY | Eric Helland & Alexender Tabarrok
LESSONS FROM THE POOR | Ed. by Alvaro Vargas Llosa
LIBERTY FOR LATIN AMERICA | Alvaro Vargas Llosa
LIBERTY FOR WOMEN | Ed. by Wendy McElroy
LIVING ECONOMICS | Peter J. Boettke
MAKING POOR NATIONS RICH | Ed. by Benjamin Powell
MARKET FAILURE OR SUCCESS | Ed. by Tyler Cowen & Eric Crampton
MONEY AND THE NATION STATE | Ed. by Kevin Dowd & Richard H. Timberlake, Jr.
NEITHER LIBERTY NOR SAFETY | Robert Higgs
THE NEW HOLY WARS | Robert H. Nelson
NO WAR FOR OIL | Ivan Eland
OPPOSING THE CRUSADER STATE | Ed. by Robert Higgs & Carl P. Close
OUT OF WORK | Richard K. Vedder & Lowell E. Gallaway
PARTITIONING FOR PEACE | Ivan Eland
PATENT TROLLS | William J. Watkins, Jr.
PLOWSHARES AND PORK BARRELS | E. C. Pasour, Jr. & Randal R. Rucker
A POVERTY OF REASON | Wilfred Beckerman
THE POWER OF HABEAS CORPUS IN AMERICA | Anthony Gregory
PRICELESS | John C. Goodman
PRIVATE RIGHTS & PUBLIC ILLUSIONS | Tibor R. Machan
PROPERTY RIGHTS | Ed. by Bruce L. Benson
THE PURSUIT OF JUSTICE | Ed. by Edward J. López
RACE & LIBERTY IN AMERICA | Ed. by Jonathan Bean
RECARVING RUSHMORE | Ivan Eland
RECLAIMING THE AMERICAN REVOLUTION | William J. Watkins, Jr.
REGULATION AND THE REAGAN ERA | Ed. by Roger E. Meiners & Bruce Yandle
RESTORING FREE SPEECH AND LIBERTY ON CAMPUS | Donald A. Downs
RESURGENCE OF THE WARFARE STATE | Robert Higgs
RE-THINKING GREEN | Ed. by Robert Higgs & Carl P. Close
RISKY BUSINESS | Ed. by Lawrence S. Powell
SCHOOL CHOICES | John Merrifield
SECURING CIVIL RIGHTS | Stephen P. Halbrook
STRANGE BREW | Douglas Glen Whitman
STREET SMART | Ed. by Gabriel Roth
TAXING CHOICE | Ed. by William F. Shughart, II
TAXING ENERGY | Robert Deacon, Stephen DeCanio, H. E. Frech, III, & M. Bruce Johnson
THE TERRIBLE 10 | Burton A. Abrams
THAT EVERY MAN BE ARMED | Stephen P. Halbrook
TO SERVE AND PROTECT | Bruce L. Benson
TWILIGHT WAR | Mike Moore
VIETNAM RISING | William Ratliff
THE VOLUNTARY CITY | Ed. by David T. Beito, Peter Gordon, & Alexander Tabarrok
WINNERS, LOSERS & MICROSOFT | Stan J. Liebowitz & Stephen E. Margolis
WRITING OFF IDEAS | Randall G. Holcombe
Independent Studies in Political Economy

THE INDEPENDENT INSTITUTE is a non-profi t, non-partisan, scholarly re search and ed-
u ca tional or ga ni za tion that spon sors com pre hen sive stud ies in po liti cal econ omy. Our mission is to
boldly advance peaceful, prosperous, and free societies, grounded in a commitment to human worth
and dignity.
Politicized decision-making in so ci ety has con fi ned public debate to a narrow re con sid era tion of ex-
ist ing policies. Given the pre vail ing infl uence of partisan interests, little social innovation has oc curred.
In order to understand both the nature of and possible solutions to major public issues, the Independent
Institute adheres to the highest standards of in de pend ent inquiry, re gard less of political or social biases
and con ven tions. The resulting stud ies are widely dis trib uted as books and other publications, and are
debated in numerous conference and media pro grams. Through this un com mon depth and clarity,
the In de pen dent In sti tute is redefi ning public de bate and fostering new and ef fec tive directions for
gov ern ment reform.
Additional copies of this Independent Policy Report are available for $10.00 each.To order, visit www.independent.org or call 510-632-1366.
The Independent Institute • 100 Swan Way • Oakland, CA 94621 • [email protected] • www.independent.org