alternative fruit fly control for market access and to … · 2013-09-10 · hal final report...
TRANSCRIPT

Alternative fruit fly control for market access and to enhance IPM in eggplant
Dr Siva Subramaniam
The Department of Agriculture, Fisheries and Forestry, Qld
Project Number: VG09023

VG09023
This report is published by Horticulture Australia Ltd to pass on information concerning horticultural research and development undertaken for the vegetables industry.
The research contained in this report was funded by Horticulture Australia Ltd with the financial support of the vegetables industry.
All expressions of opinion are not to be regarded as expressing the opinion of Horticulture Australia Ltd or any authority of the Australian Government. The Company and the Australian Government accept no responsibility for any of the opinions or the accuracy of the information contained in this report and readers should rely upon their own enquiries in making decisions concerning their own interests.
ISBN 0 7341 3127 5 Published and distributed by: Horticulture Australia Ltd Level 7 179 Elizabeth Street Sydney NSW 2000 Telephone: (02) 8295 2300 Fax: (02) 8295 2399 © Copyright 2013

VG09023 (31 May 2013)
HAL FINAL REPORT
Alternative fruit fly control for market access and to enhance IPM in eggplant
Siva Subramaniam et al. AgriScience Queensland
Department of Agriculture, Fisheries and Forestry (DAFF) Queensland

HAL Project Number: VG09023 Project Leader: Dr Siva Subramaniam Senior Entomologist AgriScience Queensland, a service of the Department of Agriculture, Fisheries and Forestry (DAFF Qld) PO Box 538 BOWEN QLD 4805
Phone: (07) 404761 4000 Email: [email protected] Key Personnel: Iain Kay, Principal Entomologist, DAFF Qld (now retired) Verni Sivasubramaniam, Experimentalist, DAFF Qld Purpose:
The purpose of this report is to describe the activities and outcomes associated with the project ‘Alternative fruit fly control for market access and to
enhance IPM in eggplant’ Funding: This project has been funded by HAL using the vegetable industry levy, voluntary contributions from industry and matched funds from the Australian Government. State government funding for the project has been provided through AgriScience Queensland, a service of the Department of Agriculture, Fisheries and Forestry.
31 May 2013 Disclaimer: Any recommendations contained in this publication do not necessarily represent current HAL policy. No person should act on the basis of the contents of this publication, whether as to matters of fact or opinion or other content, without first obtaining specific, independent professional advice in respect of the matters set out in this publication.

- 1 -
CONTENTS
MEDIA SUMMARY .............................................................................................................................. 4
TECHNICAL SUMMARY .................................................................................................................... 4
INTRODUCTION .................................................................................................................................. 5
MATERIALS AND METHODS ............................................................................................................ 6
Eggplant production and management practices - Bowen, Burdekin and Bundaberg ............................ 6
Evaluation of preharvest cover sprays ................................................................................................ 8
Bundaberg Field Trial 1 (September - December 2010) ............................................................... 8
Bundaberg Field Trial 2 (March – August 2011) .......................................................................... 9
Bowen Field Trial 2010 (August – December 2010) .................................................................. 10
Bowen Field Trial 2011 (August – December 2011) .................................................................. 11
Burdekin Field Trial 2012 ( October – December 2012) ............................................................. 13
Commercial farm sampling .............................................................................................................. 14
Fruit sampling protocol- Bowen and Burdekin Trials ...................................................................... 14
Incubation and assessment of fruit samples ..................................................................................... 15
Bundaberg .................................................................................................................................... 15
Bowen and Burdekin .................................................................................................................... 15
Fruit fly monitoring .......................................................................................................................... 16
Fruit fly monitoring in Bundaberg ............................................................................................... 16
Fruit fly monitoring in Bowen and Burdekin ............................................................................... 16
Statistical analysis ............................................................................................................................ 20
RESULTS ............................................................................................................................................. 21
Bundaberg Field Trial 2010 .............................................................................................................. 21
Bundaberg Field Trial 2011 .............................................................................................................. 22
Fruit fly infestation levels in Bowen and Burdekin .......................................................................... 23
Bowen Field Trial 2010 ................................................................................................................ 23
Bowen Field Trial 2011 ............................................................................................................... 26
Burdekin Field Trial 2012 ............................................................................................................ 27
Commercial eggplant fruit samples, Bowen 2011 ............................................................................ 29
Fruit fly trapping - Bundaberg .......................................................................................................... 29
Fruit fly trapping results – Burdekin and Longford Creek ............................................................... 44
DISCUSSION ....................................................................................................................................... 52
TECHNOLOGY TRANSFER .............................................................................................................. 54
RECOMMENDATIONS ...................................................................................................................... 55

- 2 -
ACKNOWLEDGEMENTS .................................................................................................................. 55
BIBLIOGRAPHY ................................................................................................................................. 55
APPENDIX 1. ....................................................................................................................................... 57
LIST OF FIGURES
Figure 1. Eggplant fruit quality - marketable and unmarketable (reject) grade fruits. .................. 15 Figure 2. Fruit assessment. ............................................................................................................ 16 Figure 3. Fruit flies caught in the two cue-lure traps in Bundaberg Field Trial 2010 ................... 22 Figure 4. Fruit flies caught in the two cue-lure traps in Bundaberg Field Trial 2011 ................... 23 Figure 5. Mean numbers of fruit flies caught in the cue-lure traps – Bowen Field Trial
2010 ............................................................................................................................... 25 Figure 6. Mean maximum and minimum temperatures and rainfall, Bowen Field Trial
2010 ............................................................................................................................... 26 Figure 7 Mean numbers of fruit flies caught in the cue-lure traps – Bowen Field Trial 2011 .............. 27 Figure 8 Mean maximum and minimum temperatures and rainfall, Bowen Field Trial 2011 .............. 27 Figure 9 Mean numbers of fruit flies caught in the cue-lure traps – Burdekin Field Trial 2012 .......... 29 Figure 10. The number of fruit flies caught per day in Trap 1: (a) – B. tryoni and B.
neohumeralis; (b) – B. bryoniae, B. chorista and D. aequalis. ...................................... 32 Figure 11. The number of fruit flies caught per day in Trap 2: (a) – B. tryoni and B.
neohumeralis; (b) – B. bryoniae, B. chorista and D. aequalis. ...................................... 33 Figure 12. The number of fruit flies caught per day in Trap 3: (a) – B. tryoni and B.
neohumeralis; (b) – B. bryoniae, B. chorista and D. aequalis. ...................................... 33 Figure 13. The number of fruit flies caught per day in Trap 4: (a) – B. tryoni and B.
neohumeralis; (b) – B. bryoniae, B. chorista and D. aequalis. ...................................... 34 Figure 14. The number of fruit flies caught per day in Trap 5: (a) – B. tryoni and B.
neohumeralis; (b) – B. bryoniae, B. chorista and D. aequalis. ...................................... 35 Figure 15. The number of fruit flies caught per day in Trap 6: (a) – B. tryoni and B.
neohumeralis; (b) – B. bryoniae, B. chorista and D. aequalis. ...................................... 36 Figure 16. The number of fruit flies caught per day in Trap 7: (a) – B. tryoni and B.
neohumeralis; (b) – B. bryoniae, B. chorista and D. aequalis. ...................................... 37 Figure 17. The number of fruit flies caught per day in Trap 8: (a) – B. tryoni and B.
neohumeralis; (b) – B. bryoniae, B. chorista and D. aequalis. ...................................... 38 Figure 18. The number of fruit flies caught per day in Trap 9: (a) – B. tryoni and B.
neohumeralis; (b) – B. bryoniae, B. chorista and D. aequalis. ...................................... 39 Figure 19. The number of fruit flies caught per day in Trap 10: (a) – B. tryoni and B.
neohumeralis; (b) – B. bryoniae, B. chorista and D. aequalis. ...................................... 40 Figure 20. The number of fruit flies caught per day in Trap 11: (a) – B. tryoni and B.
neohumeralis; (b) – B. bryoniae, B. chorista and D. aequalis. ...................................... 41 Figure 21. The number of fruit flies caught per day in Trap 12: (a) – B. tryoni and B.
neohumeralis; (b) – B. bryoniae, B. chorista and D. aequalis. ...................................... 42 Figure 22. Monthly rainfall during the trapping period and long term maximum and minimum
temperatures for Bundaberg. (Source: www.bom.gov.au) ........................................... 43 Figure 30. The number of fruit flies caught per day in trap installed near eggplant crop and
sugarcane, Ayr (2012) .................................................................................................... 49

- 3 -
Figure 31. The number of fruit flies caught per day in trap installed near mahogany plantation and eggplant, Inkerman (2012) ..................................................................... 49
Figure 32. The number of fruit flies caught per day in trap installed near eggplant crop, Inkerman (2012) ............................................................................................................. 50
Figure 33. The number of fruit flies caught per day in trap installed near eggplant crop and sugarcane, Home Hill (2012) ......................................................................................... 50
Figure 34. The number of fruit flies caught per day in trap installed near eggplant crop and sugarcane, Home Hill (2012) ......................................................................................... 51
Figure 35. The number of fruit flies caught per day in trap installed near chilli and mango, Clare (2012) ................................................................................................................... 51
Figure 36. The number of fruit flies caught per day in trap installed in mango orchard, Ayr (2012) ............................................................................................................................. 52
LIST OF TABLES
Table 1. Summary of the industry standard practices – Bowen and Burdekin ...................................... 6 Table 2. Summary of the industry standard practices - Bundaberg ....................................................... 7 Table 3. Insecticide applications ............................................................................................................ 8 Table 4. Dates of harvest and assessment and holding temperatures ..................................................... 9 Table 5. Insecticide applications ............................................................................................................ 9 Table 6. Dates of harvest and assessment ............................................................................................ 10 Table 7. Insecticide applications .......................................................................................................... 11 Table 8. Dates of harvest and assessment and incubation period ........................................................ 11 Table 9. Insecticide cover sprays for Field Trial Bowen, 2011 ......................................................... 12 Table 10. Dates of harvest and assessment for Field Trial Bowen, 2011. ......................................... 12 Table 11. Insecticide cover sprays for Burdekin Field Trial 2012 ...................................................... 13 Table 12. Dates of harvest and assessment for Burdekin Field Trial 2012. ......................................... 14 Table 13. Insecticide cover sprays applied 4 weeks prior to fruit harvest on a commercial
farm. ............................................................................................................................... 14 Table 14. Descriptions of the fruit fly trap locations in Bundaberg ..................................................... 18 Table 15. Descriptions of the fruit fly trap locations in Burdekin and Longford Creek ...................... 19 Table 16. Number and size of fruit harvested and number of infested fruit – Bundaberg 2010. ......... 21 Table 17. Number and size of fruit harvested and number of infested fruit-Bundaberg 2011. ........... 22 Table 18. Fruit fly infestation levels in marketable fruit – Bowen trial 2010 ...................................... 24 Table 19. Fruit fly infestation levels in unmarketable fruit – Bowen Field Trial 2010 ....................... 24 Table 20. Fruit fly infestation levels in marketable fruit – Bowen Field Trial 2011 ........................... 26 Table 21. Fruit fly infestation levels in marketable fruit – Burdekin Field Trial 2012 ........................ 28 Table 22. Fruit fly infestation levels in packhouse fruit – Bowen ....................................................... 29

- 4 -
MEDIA SUMMARY Queensland is a major supplier of eggplant to the Australian market, with the crop value estimated at around $20M annually. Over ninety percent of eggplant production is based in the Bowen, Burdekin and Bundaberg regions, which supply quality fruit to the domestic markets from March to December. The major domestic markets for Queensland eggplant are Sydney, Melbourne, Brisbane and Adelaide. Queensland fruit fly is regarded by quarantine authorities as a serious pest that can infest a wide range of commodities. And as such, any commodity regarded as a host to Queensland fruit fly is required to be treated before movement into markets such as Victoria, South Australia, Tasmania and Western Australia which are currently considered to be free of Queensland fruit fly. This project focused on gathering appropriate information to assist the future development of a new systems approach to fruit fly management in eggplant in order to enhance future market access. This research project gathered baseline data on fruit fly seasonal activity in Bundaberg, Bowen and Burdekin regions and examined the effectiveness of several alternate chemistry groups applied prior to fruit harvest. Multiple field trials and commercial fruit sampling conducted in the Bowen, Burdekin and Bundaberg production regions demonstrated that the pre-harvest cover sprays tested in this work combined with a rigorous pack-house grading processes can effectively reduced the risk of fruit fly infestation in eggplant to a low level. During the course of this project a total of 21894 fruit were collected from 5 trials on DAFF research stations and sampling from a commercial eggplant farm in Bowen. No infested fruit were recorded from fruit that was classified as commercial grade fruit. A total of 6 infested fruit were recorded from 1313 fruit that was classified as unmarketable or reject fruit from the Bowen trial site. In addition to this only a single infested fruit was recorded from the Bundaberg trials were 6394 fruit were sampled but not graded using commercial standards. The fruit fly monitoring program carried out as part of this project identified the fruit fly seasonal patterns in relation to the eggplant production period and clearly showed a “low fruit fly period” from March to August. This demonstrates that eggplants grown during this period are at minimal risk of fruit fly infestation. Based on the results recorded during this project it is clear that current production systems with preharvest cover sprays (bifenthrin, abamectin and spinosad), pack-house sorting procedures and low fruit fly prevalence on eggplant farms does greatly reduce the risk of fruit fly infestation in eggplant.
TECHNICAL SUMMARY In this project, conducted in Queensland’s major eggplant production districts, field trials were undertaken to quantitatively evaluate the effectiveness of pre-harvest cover sprays that currently registered for pests other than fruit fly and postharvest mitigation measures in reducing the risk of fruit fly infestation in eggplant. In addition, fruit fly trapping was conducted to determine fruit fly seasonal patterns and habitat range in relation to the cropping seasons. In the Bundaberg district, twelve cue lure baited fruit fly traps were monitored from August 2010 to early February 2012. B. tryoni and B. neohumeralis were the main species caught, with absolute
- 5 -
numbers and relative proportions of the two species varying between trapping sites. The highest catches were taken in spring to mid-summer months (September to January), but flies were trapped all through the year. Bactrocera bryoniae, B. chorista and Dacus aequalis were trapped occasionally and a single D. newmani was caught. Although six species of fruit flies were recorded in the production areas only B. tryoni is recorded as attacking eggplant. Similarly, fruit fly monitoring, mainly focused on eggplant farms, was conducted in the Burdekin district and at Longford Creek (30 km south of Bowen) during 2012. The trap catches reflected a seasonal pattern in fruit fly activity, with low numbers during the winter months, rising in September and peaking during October to January. Fruit fly numbers were higher in the traps located on riverbanks, creeks and vegetation adjacent to fruit trees, while the numbers were low in the traps on eggplant farms in more open terrain or surrounded by sugarcane. During the course of this project a total of 21894 fruit were collected from 5 trials on DAFF research stations and sampling from a commercial eggplant farm in Bowen. No infested fruit were recorded from fruit that was classified as commercial grade fruit. A total of 6 infested fruit were recorded from 1313 fruit that was classified as unmarketable or reject fruit from the Bowen trial site. In addition to this only a single infested fruit was recorded from the Bundaberg trials were 6394 fruit were sampled but not graded using commercial standards. Based on the results recorded during this project it is clear that current production systems with preharvest cover sprays (bifenthrin, abamectin and spinosad), pack-house sorting procedures and low fruit fly prevalence on eggplant farms does greatly reduce the risk of fruit fly infestation in eggplant.
INTRODUCTION Eggplant (Solanum melongena L.) production is currently Queensland’s expanding vegetable industry, estimated to be worth $20M in 2010. Over 90% of Queensland’s eggplant production is based in the Bowen, Burdekin and Bundaberg regions. The fruit are harvested from May until November in Bowen and Burdekin regions while in Bundaberg there is normally has two harvest seasons; March to June and October to December. The major domestic markets for Queensland eggplant are Sydney, Melbourne, Brisbane and Adelaide. Queensland fruit fly (Bactrocera tryoni Froggatt) is present in all production regions of Queensland and is considered a major pest on a wide range of fruits and vegetables. Eggplant is listed as a host to B. tryoni and since 2008 quarantine treatments (preharvest and/or postharvest) have been required to enter markets such as Victoria and South Australia which are currently considered fruit fly free. However prior to 2008 these markets did not require fruit fly treatments for eggplant and to the best of our knowledge no infested fruit was ever recorded in commercial consignments from Queensland. It should be noted that on the 1st of June 2013 Victoria may be removing restrictions against the movement of Queensland fruit fly host produce. Should this occur then Queensland eggplant producers will only be required to treat produce entering Tasmania, South Australia and Western Australia. The major impediment to access to these restricted markets is the lack of treatment options currently available to industry. Under the Interstate Certification Assurance (ICA) Scheme the only treatment option for access to Tasmania and Western Australia is methyl bromide fumigation (ICA 04). For South Australia methyl bromide fumigation is permitted as is the use of a systems approach using

- 6 -
preharvest treatment and postharvest inspection (ICA 26). While ICA 26 does provide market access to South Australia and Victoria the only chemical currently approved for field control of fruit fly in eggplant is trichlorfon which is considered by industry as disruptive to integrated pest management programs for other pests. Other pests in eggplant requiring control include eggfruit caterpillar (Sceliodes cordalis), silverleaf whitefly (Bemisia tabaci biotype B), several species of thrips, heliothis, aphids and two-spotted mites (Tetranychus urticae). Another industry concern regarding trichlorfon is that is the fact that the long-term availability of trichlorfon is uncertain. This insecticide has been nominated by APVMA for review under Priority 1 category because of toxicological, human health and residue concerns (APVMA 2012). The aim of this project was to evaluate the effectiveness of the current production systems in mitigating the risk of fruit fly infestation. Areas investigated included:
field control measures (cover sprays),
pack-house quality control practices, and
ascertaining fruit fly prevalence and the influence of seasonal conditions.
MATERIALS AND METHODS
Eggplant production and management practices - Bowen, Burdekin and Bundaberg Information on eggplant production and cultivation practices was collated from growers and consultants. The details are summarised in Tables 1 and 2.
Table 1. Summary of the industry standard practices – Bowen and Burdekin
Growing and Management Practices
Descriptions
Number of commercial farms 8 in Bowen and Gumlu; 6 in Burdekin
Cultivated area & volume Estimated at 350 ha and 8,000 tons
Common varieties Black Pearl, Epic, Shiner, Venus
Major markets Brisbane, Sydney, Melbourne, Adelaide & Tasmania.
Growing season February to November
Harvest season From mid-May through November
Plant population Between 8,000 and 13,000 plants/ ha
Cultivation practices Transplanting into polythene mulched bed, trickle irrigation, and fertigation
Weed control Pre- and post-emergence herbicides, and inter-row sprays
Major insect pests Silverleaf whitefly, eggfruit caterpillar, two-spotted mites, green peach aphids, potato tuber moth, western flower thrips

- 7 -
Pest management Routine and monitoring-based insecticide sprays at 5 to 14 day intervals. Ground-rig application with 300 to 600 L spray volume.
Major fungal diseases bacterial wilt, sudden wilt, phomopsis fruit rot
Disease control Fungicide applications at 5 to 14 days intervals
Market access treatments Most farms use ICA-26 with preharvest cover spray
Fruit harvests Sequential picking of marketable size fruit at 4 to 7 day intervals
Pack-house operations Washing (iodine or chlorine), manual sorting & culling, packing and inspection, cooling and transport
Table 2. Summary of the industry standard practices - Bundaberg
Growing and Management Practices
Descriptions
Number of commercial farms Approx. 6-8 field plus several farms using protected cropping plastic igloos
Cultivated area & volume 40 ha plus protected crops; 1120 tons in 2010
Common varieties Shiner, Black Pearl
Major markets Brisbane, Sydney, Melbourne, Adelaide & Tasmania
Growing season February – June; August - December
Harvest season Mid-April to June and late September to early January
Plant population Between 8,000 and 13,000 plants/ ha
Cultivation practices Transplanting into polythene mulched bed (some bare ground beds), trickle irrigation, and fertigation. Protected cropping – hydroponic style pots, trellising.
Weed control Pre- and post-emergence herbicides, and inter-row sprays
Major insect pests Melon thrips, eggfruit caterpillar, western flower thrips, heliothis, two-spotted mites, green peach aphids, potato tuber moth, broad mite
Pest management Routine insecticide sprays, often at 5 - 14 day intervals, or insecticide sprays based on pest monitoring
Major fungal diseases bacterial wilt, sudden wilt, phomopsis fruit rot

- 8 -
Disease control Fungicide sprays at regular intervals or as necessary
Market access treatments Varies. Some fruit sent to markets not requiring treatment; some in-field fenthion applications; some post-harvest dipping.
Fruit harvests Sequential picking marketable size fruit at 4 to 7 day intervals
Pack-house operations Washing (iodine or chlorine), manual sorting & culling, packing and inspection, cooling and transport
Evaluation of preharvest cover sprays A range of preharvest cover spray options were trialled to determine their effectiveness in preventing fruit fly infestation in eggplant fruits. The insecticides chosen are registered for use in eggplant but not against fruit fly and are commonly used by growers for controlling various pests (thrips, mites, aphids etc) in eggplant. A total of five field trials were conducted on DAFF research stations at Bundaberg, Bowen and Ayr. Two field trials were conducted in Bundaberg and were undertaken during the spring season and the autumn-winter season. In Bowen and Ayr three trials were conducted during the spring-summer period.
Bundaberg Field Trial 1 (September - December 2010) The trial was to receive minimal insecticide applications. Spinosad was selected as the insecticide to use because it is registered on the crop (against heliothis, potato moth and western flower thrips at 4.8 - 9.6 g ai/100L), is used by growers already, and is the active ingredient in NaturalureTM, a commercial fruit fly bait. Eggplant seedlings, variety Shiner, were planted at Bundaberg Research Station on 2 September 2010 in a plot of nine rows (1.5m apart) by 95m long (i.e. approximately 1.3 ha) with a plant spacing of 0.5m. The plants were grown on white plastic with trickle irrigation using standard commercial irrigation and fertiliser practices. Fenamiphos (Nemacur® 100G) was applied to the soil before planting for nematode control. Mancozeb and copper hydroxide were applied on 8 September, 13 September and 18 November for disease control. Insecticide applications (Table 4.3) started when small fruit were present on the majority of plants. Sprays were applied in the equivalent of 1400 L/ha of water with a tractor driven boom spray fitted with TeeJet TwinJet TJ60-11003 nozzles.
Table 3. Insecticide applications
Date of application 2010
Active ingredient
Rate of active ingredient (g/100L)
Product Rate of product
(mL/100L)
15 November spinosad 4.8 Succcess2 20
18 November methomyl* 45.0 Lannate L 200
22 November spinosad 4.8 Succcess2 20
29 November spinosad 4.8 Succcess2 20

- 9 -
7 December spinosad 4.8 Succcess2 20
(Success2 – 240 g/L suspension concentrate; Lannate L – 225 g/L emulsifiable concentrate; * a non-ionic surfactant was added to the methomyl spray at 0.025%) Fruit were harvested on three occasions, at approximately weekly intervals. Fruit of commercial size were picked irrespective of condition, with fruit rejected in the field only if they were obviously rotten.
Table 4. Dates of harvest and assessment and holding temperatures
Harvest Date picked
(2010) Date assessed
(2010)
1 24 November 30 November
2 2 December 7 December
3 8 December 14, 15 December
Two Bugs for Bugs design fruit fly traps, baited with cue lure and maldison, were erected on 28th October. The traps were hung about 1.5m above the ground, one (Trap A) in the middle row about 12m in the crop at its northern end and the other (Trap B) in a row of trees about 5m outside the southern end of the crop. The traps were cleared weekly and the flies identified. Temperature and rainfall records for November and December weekdays, recorded at the BSES Research Station approximately 600m from the trial site, are shown in Appendix X.
Bundaberg Field Trial 2 (March – August 2011) Spinosad (Success2) was not used in this second trial as Dow AgroSciences has discontinued the production and sale of this insecticide, replacing it with another spinosyn compound, spinetoram (Success Neo). It is claimed that spinetoram, as Success Neo, will be at least as effective as Success2 and that it has improved photostability and so should have greater longevity on the plant. Eggplant seedlings, variety Shiner, were planted at Bundaberg Research Station on 8 March 2011 in a plot of nine rows (1.5m apart) by 95m long (i.e. approximately 1.3 ha) with a plant spacing of 0.5m. The plants were grown on white plastic with trickle irrigation using standard commercial irrigation and fertiliser practices. Fenamiphos (Nemacur® 100G) was applied to the soil before planting for nematode control. Mancozeb and copper hydroxide were applied on 27 June, 30 June and 7 July for disease control. Insecticide applications (Table 5) started when small fruit were present on the majority of plants. Two early applications of methomyl were used and spinetoram applications started approximately a week before the first harvest. Sprays were applied in the equivalent of 1400 L/ha of water with a tractor driven boom spray fitted with TeeJet TwinJet TJ60-11003 nozzles.
Table 5. Insecticide applications
Date of application 2010
Active ingredient
Rate of active ingredient (g/100L)
Product Rate of product (mL/100L)
30 May methomyl * 45.0 Lannate L 200

- 10 -
3 June methomyl * 45.0 Lannate L 200
6 June spinetoram 2.4 Success Neo 20
14 June spinetoram 2.4 Success Neo 20
20 June spinetoram 2.4 Success Neo 20
27 June spinetoram 2.4 Success Neo 20
(Success Neo – 120 g/L suspension concentrate; Lannate L – 225 g/L emulsifiable concentrate; * a non-ionic surfactant was added to the methomyl sprays at 0.025%) Fruit were harvested on two occasions, at approximately weekly intervals. Fruit of commercial size were picked irrespective of condition, with fruit rejected in the field only if they were obviously rotten. Two Bugs for Bugs design fruit fly traps, baited with cue-lure and maldison, were erected on 25th May. The traps were hung about 1.5m above the ground, one (Trap A) about 2m outside the crop at its northern end and the other (Trap B) about 5m inside the southern end of the crop in the middle row. The traps were cleared weekly and the flies identified and counted. Temperature and rainfall records for May - September weekdays, recorded at the BSES Research Station approximately 600m from the trial site, are shown in Appendix 1.
Table 6. Dates of harvest and assessment
Harvest Date picked
(2011) Date assessed
(2011)
1 14 June 21 June
2 23 June 30 June
3 30 June 7 July
Bowen Field Trial 2010 (August – December 2010) Fruit were planted to expose fruit to high fruit fly pressure in November and December. Previous research showed fruit fly numbers are high in the Bowen – Burdekin districts during these months (Subramaniam et al. 2011). Eggplant seedlings, variety Regal Black, were planted on 23 August 2010. The plants were grown with the trickle irrigation system and irrigated at weekly intervals until final harvest. Commercial agronomic practices were followed to grow and maintain the crops. Copper hydroxide (Kocide®) sprays were applied on 3 September, 8 October, 22 October and 6 December for bacterial and fungal disease control. A weekly spray program based on a commercial standard was designed to be applied during the fruiting period. However, due to consistent wet weather during November and December (36 rain days with 715 mm rain) only one bifenthrin (60g ai/ha) cover spray was applied, on 6 December. Sprays were applied with a tractor driven air-assisted sprayer. Table 4.7 details the insecticides applied. Pymetrozine and petroleum oil were applied to control silverleaf whitefly.

- 11 -
Fruit of commercial harvest size were harvested at weekly intervals, from 21 October to 17 December (Table 4.8). Two Bugs for bugs traps, baited with cure-lure and maldison were installed from 26th August to 17th December. The traps were attached to pole about 1.2 m above the ground, and erected eastern and western ends of the trial block. The trap contents were emptied fortnightly and taken to the Bowen laboratory for counting and species identification.
Table 7. Insecticide applications
Date of application
2010 Product
Active ingredient
Formulation Application Rate (g ai
/ha)
Spray volume (L/ha)
15 October Chess pymetrozine 500g/ Kg WG 100 500
D-C Tron petroleum oil 782g/L EC 1955 500
6 December Talstar bifenthrin 100g/L EC 60 600
Table 8. Dates of harvest and assessment and incubation period
Harvest Date harvested
(2010) Date assessed
(2010) Incubation period
(days)
1 21 October 01 November 11
2 29 October 06 November 8
3 11 November 18 November 7
4 17 November 25 November 8
5 25 November 01 December 6
6 1 December 08 December 7
7 8 December 15 December 7
8 17 December 23 December 6
Bowen Field Trial 2011 (August – December 2011) Two blocks of eggplant (variety Regal Black) was planted on 29 August 2011 at Bowen Research Station to expose fruit to high fruit fly pressure during the harvest period in October and November. The plants were grown according to commercial agronomic practices. Iprodione (Rovral) was applied on 21 October and Copper hydroxide (Kocide®) applied on 31 October for bacterial and fungal disease control. The first block was sprayed two times with bifenthrin (60g ai/ha) and the second block was sprayed three times with petroleum oil (0.5%), pyriproxyfen (50g ai/ha) and pymetrozine (100g ai/ha) in a rotation (Table 4.9). Spray intervals of 7 – 10 days were maintained between the applications. The sprays were applied using a tractor mounted air-assisted sprayer to match commercial practice.

- 12 -
Fruit of commercial harvest size were harvested at weekly intervals from 21 October to 25 November. The fruit were harvested 3 to 5 days after spray application as to follow minimum withholding period (WHP) recommended in the product label (Table 4.10). Fruit were sorted manually based on commercial standards and categorised into ‘marketable’ and `unmarketable’ (reject) fruit. Over mature, large size and defect fruits were rejected and classed as unmarketable. The fruit were incubated for 7–10 days at 25 – 27 0C, and after that each fruit was cut open and examined for fruit fly presence. Two Bugs for bugs traps, baited with cure-lure and maldison were installed on the 5th of September 2011. One trap were attached to pole about 1.2 m above the ground, and erected eastern end of the trial block. The second trap was installed on a mango tree that was approximately 200m away from the trial site. The trap contents were emptied fortnightly and taken to the Bowen laboratory for counting and species identification.
Table 9. Insecticide cover sprays for Field Trial Bowen, 2011
Date of application 2011
Product Active
ingredient Formulation
Application rate (g ai
/ha)
Spray volume (L/ha)
Block 1 – bifenthrin cover sprays
21 October Talstar bifenthrin 100g/L EC 60 400
31 October Talstar bifenthrin 100g/L EC
60 500
Block 2 – soft option rotation
21 October D-C Tron petroleum oil 782g/L EC 1564 400
31 October Chess pymetrozine 500g/ Kg
WG 100 500
D-C Tron petroleum oil 782g/L EC 1564 500
7 November Admiral pyriproxyfen 100g/L EC 50 500
15 November Chess pymetrozine 500g/ Kg
WG 100 500
22 November D-C Tron petroleum oil 782g/L EC 1564 500
Table 10. Dates of harvest and assessment for Field Trial Bowen, 2011.
Harvest Source Block
Date harvested (2011)
Days after cover spray
Date assessed (2011)
Incubation period (days)
1 1 and 2
21 October Pre spray 31 October 10
2 1 and 2
26 October 5 03 November 8
3 1 and 2
02 November 3 09 November 7
- 13 -
4 2
10 November 3 21 November 11
5 2
25 November 3 05 December 10
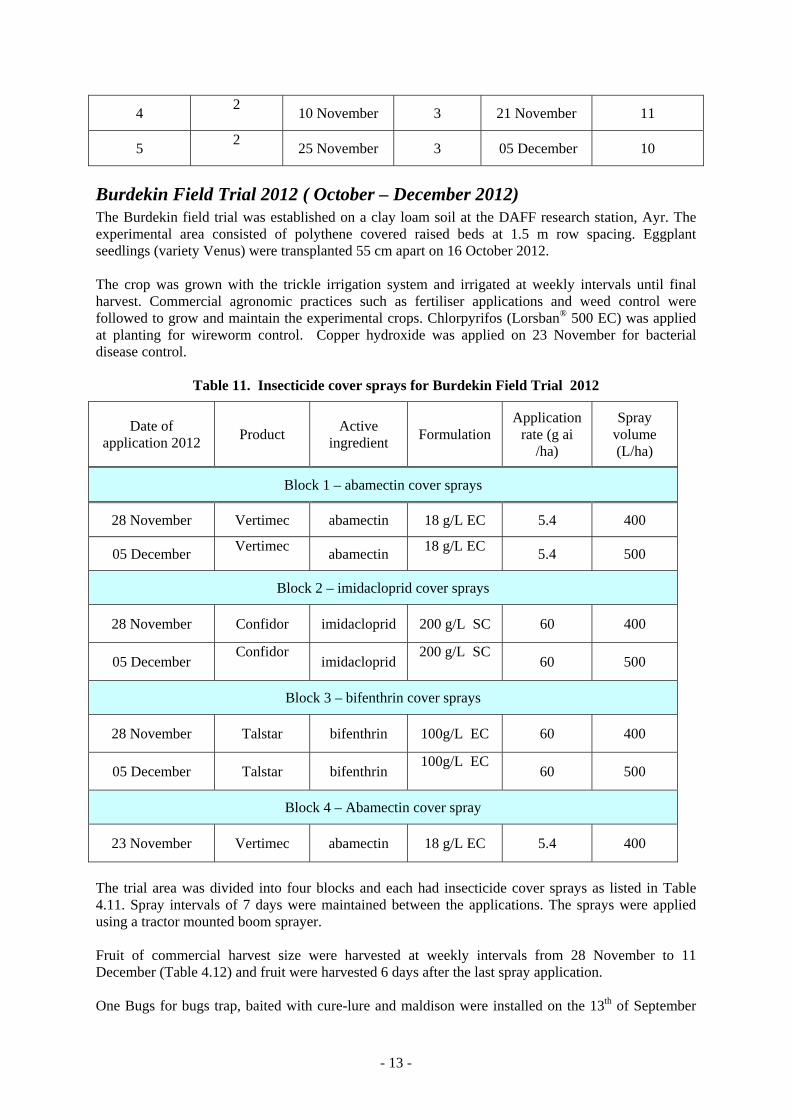
Burdekin Field Trial 2012 ( October – December 2012) The Burdekin field trial was established on a clay loam soil at the DAFF research station, Ayr. The experimental area consisted of polythene covered raised beds at 1.5 m row spacing. Eggplant seedlings (variety Venus) were transplanted 55 cm apart on 16 October 2012. The crop was grown with the trickle irrigation system and irrigated at weekly intervals until final harvest. Commercial agronomic practices such as fertiliser applications and weed control were followed to grow and maintain the experimental crops. Chlorpyrifos (Lorsban® 500 EC) was applied at planting for wireworm control. Copper hydroxide was applied on 23 November for bacterial disease control.
Table 11. Insecticide cover sprays for Burdekin Field Trial 2012
Date of application 2012
Product Active
ingredient Formulation
Application rate (g ai
/ha)
Spray volume (L/ha)
Block 1 – abamectin cover sprays
28 November Vertimec abamectin 18 g/L EC 5.4 400
05 December Vertimec
abamectin 18 g/L EC
5.4 500
Block 2 – imidacloprid cover sprays
28 November Confidor imidacloprid 200 g/L SC 60 400
05 December Confidor
imidacloprid 200 g/L SC
60 500
Block 3 – bifenthrin cover sprays
28 November Talstar bifenthrin 100g/L EC 60 400
05 December Talstar bifenthrin 100g/L EC
60 500
Block 4 – Abamectin cover spray
23 November Vertimec abamectin 18 g/L EC 5.4 400
The trial area was divided into four blocks and each had insecticide cover sprays as listed in Table 4.11. Spray intervals of 7 days were maintained between the applications. The sprays were applied using a tractor mounted boom sprayer. Fruit of commercial harvest size were harvested at weekly intervals from 28 November to 11 December (Table 4.12) and fruit were harvested 6 days after the last spray application. One Bugs for bugs trap, baited with cure-lure and maldison were installed on the 13th of September

- 14 -
2012. The trap was installed in a windbreak tree line approximately 10 m outside the trial site. The trap contents were emptied fortnightly and taken to the Bowen laboratory for counting and species identification.
Table 12. Dates of harvest and assessment for Burdekin Field Trial 2012.
Harvest Date harvested
(2012)
Days after cover spray
Date assessed (2012)
Incubation period (days)
1 28 November Pre spray 5 December 7
2 4 December 6 12 December 8
3 11 December 6 18 December 7
Commercial farm sampling One eggplant crop blocks (not part of the ICA 26 arrangement) was indentified on a commercial farm in Bowen. This crops did not receive any fruit fly specific cover sprays (fenthion or dimethoate) but other insecticides such as bifenthrin and abamectin were applied for controlling whitefly and mites (Table 4.13). Fruit was sampled on 10 October which was 9 days after the last insecticide application. Samples were randomly collected by the pack-house supervisor after fruit had been washed, sorted and graded through the normal commercial packing line (Table 4.14). No postharvest (dimethoate or fenthion) treatments were applied to these fruit. Table 13. Insecticide cover sprays applied 4 weeks prior to fruit harvest on a commercial farm.
Date of application
Product Active
ingredient Formulation
Application rate (g ai
/ha)
Spray volume (L/ha)
Bowen Farm 1
01 Sep 2011 Vantal abamectin 18 EW 5.4 250
09 Sep 2011 Venom bifenthrin 100 EC 60 300
20 Sep 2011 Venom bifenthrin 100 EC 60 300
01 Oct 2011 Vantal abamectin 18 EW 5.4 300
Fruit sampling protocol- Bowen and Burdekin Trials Fruit of commercial harvest size but irrespective of blemishes were selected across the entire block. Field samples were then transported to the DAFF Research Station at Bowen were fruit was sorted manually into either ‘marketable’ and ‘unmarketable’ (reject) fruit. Industry standards for grading fruit include maturity, size (over 12 cm diameter is considered to large and over mature) and skin defects.

- 15 -
Figure 1. Eggplant fruit quality - marketable and unmarketable (reject) grade fruits.
Incubation and assessment of fruit samples
Bundaberg Sampled fruit were returned to the laboratory and placed on a shallow layer of Grade 1 vermiculite in 10 L plastic containers with a mesh lid, with 3-5 fruit per container. Fifty fruit were selected at random, weighed and their length measured. The fruit were held in a constant temperature room with a 16:8 L:D photoperiod, 26 ± 1°C, but no humidity control, for 5 - 7 days. Fruit were assessed for fruit fly infestation by cutting each fruit into narrow slices 1 - 2 cm thick, which were examined for the presence of larvae. The vermiculite was sieved to recover pupae. Any fruit fly stages found were transferred into clean eggplant fruit to develop to the adult stage for identification.
Bowen and Burdekin Fruit were placed in ventilated plastic containers with approximately 6-10 fruit per container (Fig. 4.2). Fruit were held at 26 ± 2°C and 70 - 80% relative humidity to allow any eggs and larvae to develop. After 7 - 10 days of incubation, each fruit was cut open and examined for fruit fly presence. Any larvae from an infested fruit or pupae found in the containers were removed and counted and reared through to adulthood for species confirmation.

- 16 -
Figure 2. Fruit assessment.
Fruit fly monitoring In addition to trapping at trial sites trapping was also undertaken at various locations across both the Bundaberg and Burdekin district. The results of fruit fly trapping in the Bundaberg and Burdekin districts from 2010 to 2012 are reported here.
Fruit fly monitoring in Bundaberg Twelve fruit fly traps were erected around the Bundaberg district in late July 2010. The traps were Bugs for Bugs traps, which are a Sensus type trap. The traps were loaded with a wick containing cue lure and maldison. Each trap was hung approximately 1.5 – 1.75 m from the ground by a wire coated with Tanglefoot to prevent ants from invading the trap. Lures were replaced every eight weeks. The traps were cleared fortnightly (although there was a four week gap between collections from late December 2010 to mid January 2011) and the flies identified and counted. The details of trap locations and surrounding vegetation are summarised in Table 4.16 Average maximum and minimum temperature data for Bundaberg and monthly rainfall during the trapping period, obtained from the Bureau of Meteorology website (www.bom.gov.au), are shown in Fig 21
Fruit fly monitoring in Bowen and Burdekin In the recently completed project (VG06028), extensive fruit fly monitoring was conducted in the Bowen and Gumlu production area (Subramaniam et al. 2011). Therefore trapping in this project was focused on the Burdekin district and at Longford Creek (30 km south of Bowen). This trapping program was designed to cover eggplant farms and surrounding vegetation which include riverbanks, creek and native vegetations. Fruit fly populations were trapped using cue-lure baited Bugs for Bugs (modified Sensus type) traps and the wicks were changed every 12 weeks. Most traps were emptied every 14 days. However, vandalism of some traps and extreme weather events meant that strict adherence to the 14 day

- 17 -
sampling period was not always possible. To account for this, traps results have been presented as the mean number of flies/trap/day. The collected fruit flies were taken to the Bowen laboratory for counting and species identification. Traps were installed in two eggplant farms in Longford Creek and four eggplant farms in the Burdekin region. The details of trap locations, GPS coordinates and the surrounding vegetation were recorded for all traps and are summarised in Table 4.17. Daily minimum and maximum temperatures and rainfall data were collected for the trapping period from an automatic weather station established at Bowen and Ayr Research Stations.
- 18 -
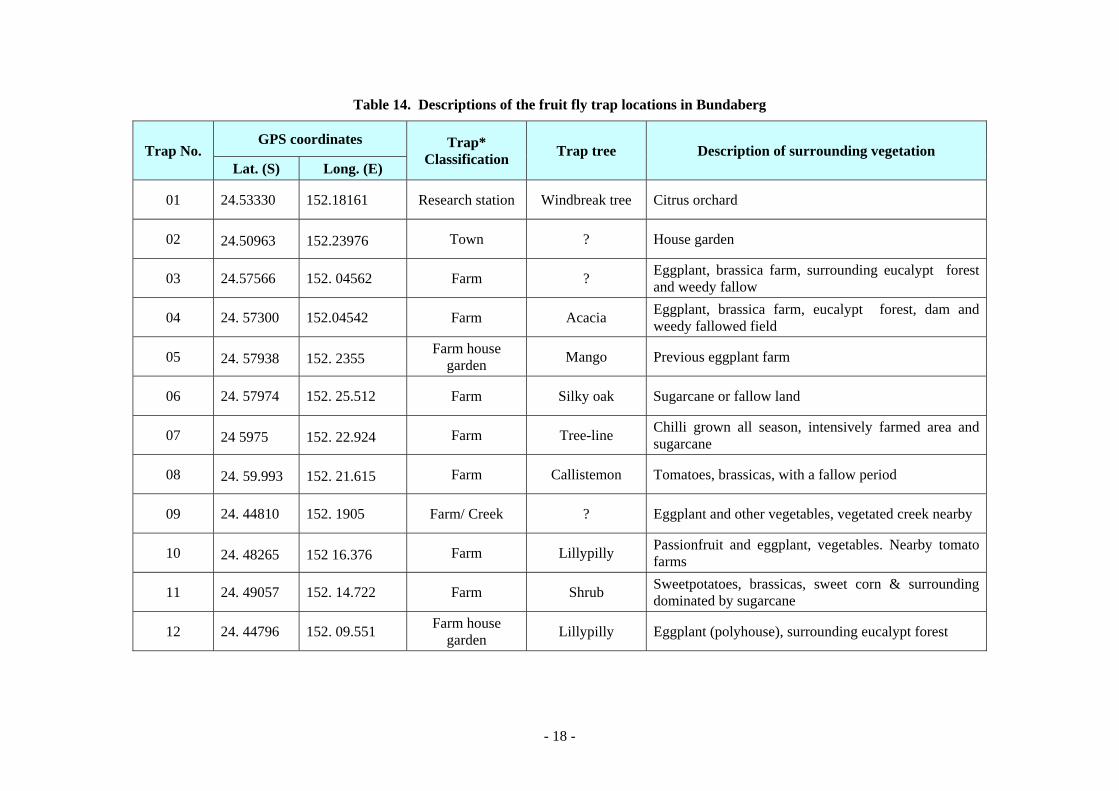
Table 14. Descriptions of the fruit fly trap locations in Bundaberg
Trap No. GPS coordinates Trap*
Classification Trap tree Description of surrounding vegetation
Lat. (S) Long. (E)
01 24.53330 152.18161 Research station Windbreak tree Citrus orchard
02 24.50963 152.23976 Town ? House garden
03 24.57566 152. 04562 Farm ? Eggplant, brassica farm, surrounding eucalypt forest and weedy fallow
04 24. 57300 152.04542 Farm Acacia Eggplant, brassica farm, eucalypt forest, dam and weedy fallowed field
05 24. 57938 152. 2355 Farm house
garden Mango Previous eggplant farm
06 24. 57974 152. 25.512 Farm Silky oak Sugarcane or fallow land
07 24 5975 152. 22.924 Farm Tree-line Chilli grown all season, intensively farmed area and sugarcane
08 24. 59.993 152. 21.615 Farm Callistemon Tomatoes, brassicas, with a fallow period
09 24. 44810 152. 1905 Farm/ Creek ? Eggplant and other vegetables, vegetated creek nearby
10 24. 48265 152 16.376 Farm Lillypilly Passionfruit and eggplant, vegetables. Nearby tomato farms
11 24. 49057 152. 14.722 Farm Shrub Sweetpotatoes, brassicas, sweet corn & surrounding dominated by sugarcane
12 24. 44796 152. 09.551 Farm house
garden Lillypilly Eggplant (polyhouse), surrounding eucalypt forest

- 19 -
Table 15. Descriptions of the fruit fly trap locations in Burdekin and Longford Creek
Trap No.
Date Installed
GPS coordinates Trap
location Trap*
Classification Trap tree
Description of surrounding vegetation
Lat. (S) Long. (E) Commercial
crops Other
vegetation
BO 01 7/6/12 20.21529 148.37360 Longford
Creek Farm trap
Cocky apple
Eggplant Gum trees; Cocky apple
BO 02 7/6/12 20.23408 148.37245 Longford
Creek Farm trap Paper bark
Eggplant Pumpkin
Pandanus, wattle, creek vegetation
BO 03 7/6/12 20.22088 148.35536 Longford
Creek Farm trap Gum tree
Eggplant, Melons
Gum trees, nearby creek
BO 04 7/6/12 20.19696 148.38092 Longford
Creek Farm trap Mango
Eggplant, Pumpkin
Home garden, chilli
BO 05 7/6/12 20.21867 148.40222 Longford
Creek River trap Grewia sp Eggplant
River bank vegetation
BO 06 7/6/12 20.21647 148.39755 Longford
Creek River trap Pongamia Eggplant
Creek vegetations
Bu 08 22/6/12 19.55240 147.43410 Ayr Farm trap Lychee Eggplant / Cucumber
Sugarcane, home garden, mango
Bu 09 22/6/12 19.55741 147.43022 Ayr Sugarcane Trap Power Pole Eggplant / Cucumber
Sugarcane / road
Trap No.
Date Installed
GPS coordinates Trap
location
Trap* Classification
Trap tree
Description of surrounding vegetation
Lat. (S) Long. (E) Commercial
crops other vegetation

- 20 -
Bu 10 27/6/12 19.72754 147.48466 Inkerman Plantation Trap African
Mahogany Eggplant
African Mahogany plantation
Bu 11 27/6/12 19.72872 147.48055 Inkerman Sugarcane Trap
Acasia Eggplant Sugarcane, eggplant
Bu 12 27/6/12 19.72570 147.44173 Home Hill Sugarcane Trap
Gum tree Eggplant Sugarcane
Bu 13 27/6/12 19.72324 14743362 Home Hill Sugarcane Trap
Power pole Eggplant Sugarcane
Bu 14 18/7/12 19.82091 147.22481 Clare Mango Trap Mango Eggplant Sugarcane
Bu 15 18/7/12 19.81988 147.22481 Clare Sugarcane Trap Mango Eggplant Sugarcane
Bu 16 17/8/12 19.61756 147.37830 Ayr Mango trap Neem Eggplant Sorghum, pulses
Mango,
Bu 17 17/8/12 19.61656 147.37410 Ayr Mango trap Mango Nil Mango orchard – various varieties
River trap = traps installed in or closed to river bank/ creek/ watercourse/ swamp often combined with dense vegetation Farm trap = placed around the farm boundaries and away from dense vegetation Mango trap = placed in proximity to mango orchard
Statistical analysis The upper percentage infestation levels (with 95% confidence) for fruit fly in eggplant were calculated using CQT_Stats (Liquido et al. 1997). Upper infestation levels were based on the number of samples taken and the number of infested fruit found. Where no infested fruit were found, the field samples were combined to give an overall upper infestation level for each trial.

- 21 -
RESULTS
Bundaberg Field Trial 2010 A total of 4765 fruit were harvested and assessed. One infested fruit with B. tryoni was recorded and a total of X adults from X larvae was reared from this fruit. Table 5.1 shows the data for each harvest.
Table 16. Number and size of fruit harvested and number of infested fruit – Bundaberg 2010.
Harvest Number of fruit
Weight (g) mean ± SD
Length (cm) mean ± SD
Number of fruit
infested
Upper % infested (95% confidence)
1 1238 5610 ± 135.4 17.9 ± 2.0 0 0.2420
2 1386 578.2 ± 108.9 17.4 ± 1.9 1 0.3422
3 2141 507.0 ± 109 110 ± 2.0 0 0.1399
Total 4765 1 0.0995
A total of 1649 flies were caught in the two traps during the trial period. Eighty percent of these flies were B. tryoni, 19% were B. neohumeralis and the remainder were Dacus aequalis (Figure 5.1).
0
5
10
15
20
25
4-N
ov
9-N
ov
14-N
ov
19-N
ov
24-N
ov
29-N
ov
4-D
ec
9-D
ec
14-D
ec
19-D
ec
24-D
ec
No
. flie
s/d
ay
B. tryoni
B. neohumeralis
D. aequalis
Trap A

- 22 -
0
5
10
15
20
25
4-N
ov
9-N
ov
14-N
ov
19-N
ov
24-N
ov
29-N
ov
4-D
ec
9-D
ec
14-D
ec
19-D
ec
24-D
ec
No
. flie
s/d
ayB. tryoni
B. neohumeralis
D. aequalis
Trap B
Figure 3. Fruit flies caught in the two cue-lure traps in Bundaberg Field Trial 2010
Bundaberg Field Trial 2011 A total of 1269 fruit were harvested and assessed. No fruit were infested with fruit flies. Table 5.3 shows the data for each harvest.
Table 17. Number and size of fruit harvested and number of infested fruit-Bundaberg 2011.
Harvest Number of
fruit Weight (g) mean ± SD
Length (cm) mean ± SD
Number of fruit infested
Upper % infested (95% confidence)
1 789 664.6 ± 133.0 20.1 ± 2.2 0 0.3797
2 379 620.2 ± 131.8 19.3 ± 2.6 0 0.7904
3 461 50.34 ± 114.7 17.3 ± 2.0 0 0.6498
Total 1629 0 0.1839
Three hundred fruit flies were caught in the two traps from late May to early September (Fig. 5.1). Bactrocera tryoni made up 61.3% of flies caught, B. neohumeralis 36.3%, and very small numbers of Bactrocera bryoniae and Bactrocera chorista were also caught.
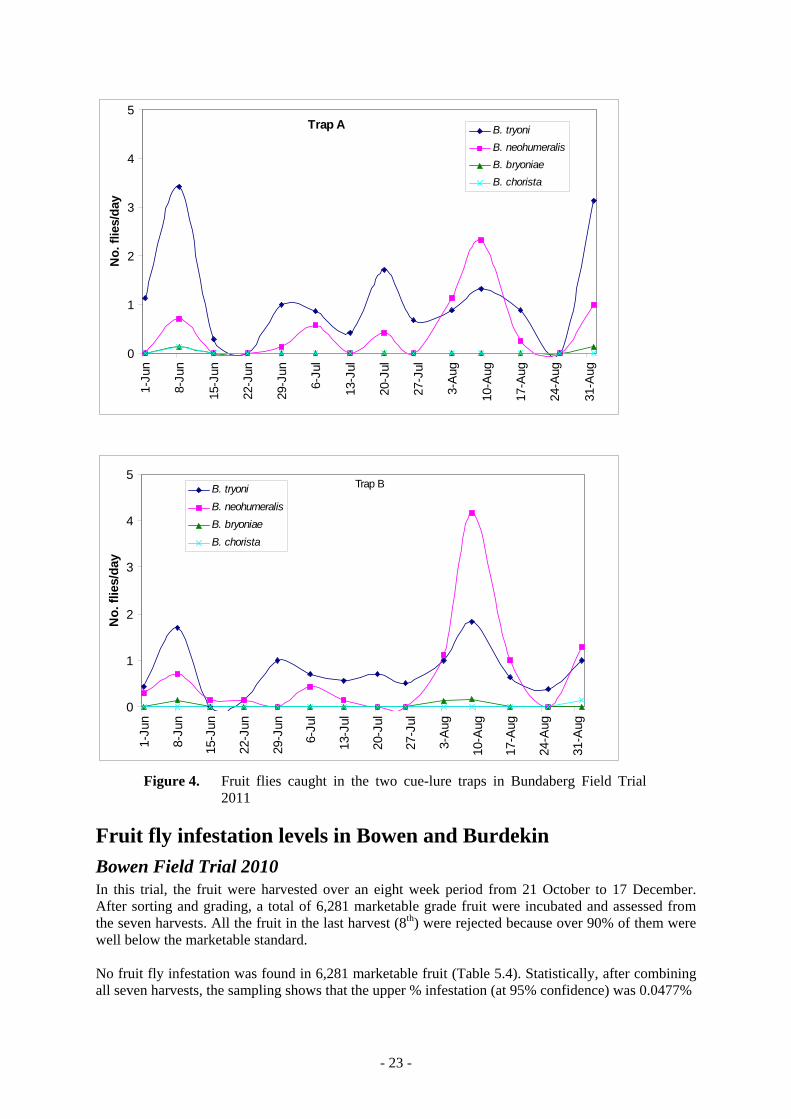
- 23 -
0
1
2
3
4
5
1-Ju
n
8-Ju
n
15-J
un
22-J
un
29-J
un
6-Ju
l
13-J
ul
20-J
ul
27-J
ul
3-A
ug
10-A
ug
17-A
ug
24-A
ug
31-A
ug
No
. flie
s/d
ayB. tryoni
B. neohumeralis
B. bryoniae
B. chorista
Trap A
0
1
2
3
4
5
1-Ju
n
8-Ju
n
15-J
un
22-J
un
29-J
un
6-Ju
l
13-J
ul
20-J
ul
27-J
ul
3-A
ug
10-A
ug
17-A
ug
24-A
ug
31-A
ug
No
. flie
s/d
ay
B. tryoni
B. neohumeralis
B. bryoniae
B. chorista
Trap B
Figure 4. Fruit flies caught in the two cue-lure traps in Bundaberg Field Trial 2011
Fruit fly infestation levels in Bowen and Burdekin
Bowen Field Trial 2010 In this trial, the fruit were harvested over an eight week period from 21 October to 17 December. After sorting and grading, a total of 6,281 marketable grade fruit were incubated and assessed from the seven harvests. All the fruit in the last harvest (8th) were rejected because over 90% of them were well below the marketable standard. No fruit fly infestation was found in 6,281 marketable fruit (Table 5.4). Statistically, after combining all seven harvests, the sampling shows that the upper % infestation (at 95% confidence) was 0.0477%

- 24 -
Table 18. Fruit fly infestation levels in marketable fruit – Bowen trial 2010
Harvest No. of fruit harvested
Weight (g) mean ± SD
No. of fruit infested
Larvae/ fruit Upper %
infested (95% confidence)
1 399 468 ± 113 0 0 0.7508
2 876 435 ± 49 0 0 0.3420
3 1108 449 ± 47 0 0 0.2704
4 428 450 ± 55 0 0 0.6999
5 986 513 ± 109 0 0 0.3038
6 859 406 ± 82 0 0 0.3487
7 1625 346 ± 91 0 0 0.1844
Total 6281 0 0 0.0477
In addition, a proportion of the ‘reject’ fruit from six harvests was incubated and assessed for infestation. Six infested fruit were found in 1,313 fruit (0.46%) from which 21 larvae were recorded. After further incubation only three B. tryoni adults emerged. These infested fruit were collected from late November to mid-December (Table 5.5). Due to consistent rain during November 2010, this trial block had not received any cover sprays for over six weeks. Only the last two harvests (7 and 17 December) were exposed to one bifenthrin cover spray, where the reject samples had three infested fruit from which eight larvae were collected but none pupated or produced adults. This larval mortality may be due to exposure to bifenthrin residues. Most farms during this time period have finished harvesting for the season or are applying cover sprays at 5 - 7 day intervals. All the larvae were found in over mature fruit which indicates fruit fly prefer to infest mature fruits. Results from these reject samples indicate that the process of grading and sorting to remove over mature or defect fruits, as part of the pack-house operation, can be considered as a component of a `system approach’ for fruit fly management for eggplant. This trial was extended beyond the normal commercial cropping season, which ends by mid-November. Consequently, the crop was exposed to higher fruit fly pressure and prolonged wet conditions. Long term weather data show that November and December are usually a very dry period in Bowen, but the 2010 season had over 715 mm rain with 36 rainy days (Fig 5.3). Cue-lure traps placed in the crops showed an increase in fly numbers during late November to December, with an average of 8 to 31 flies/ day (Fig 5.2).
Table 19. Fruit fly infestation levels in unmarketable fruit – Bowen Field Trial 2010
Harvest No. of fruit harvested
Weight (g) mean ± SD
No. of fruit infested
Larvae/ fruit
Fruit fly adult
emerged
Upper % infested (95% confidence)

- 25 -
1 177 602 ± 130 0 0 0 1.6925
4 125 586 ± 62 0 0 0 2.3966
5 81 600 ± 120 1 2 1 9557
6 229 737 ± 147 2 11 2 2.7490
7 165 562 ± 120 1 2 0 2.8746
8 536 394 ± 70 2 6 0 1.1745
Total 1313 6 21 3 0.9019
0
5
10
15
20
25
30
35
10-S
ep
17-S
ep
24-S
ep
1-O
ct
8-O
ct
15-O
ct
22-O
ct
29-O
ct
5-N
ov
12-N
ov
19-N
ov
26-N
ov
3-D
ec
10-D
ec
17-D
ec
Mea
n fl
ies/
trap
/day
B. tryoni
B. neohumeralis
B. bryoniae
Figure 5. Mean numbers of fruit flies caught in the cue-lure traps – Bowen Field Trial 2010
0
20
40
60
80
100
120
1-O
ct
8-O
ct
15-O
ct
22-O
ct
29-O
ct
5-N
ov
12-
No
v
19-
No
v
26-
No
v
3-D
ec
10-D
ec
17-D
ec
24-D
ec
31-D
ec
Rai
nfa
ll (
mm
)
0
5
10
15
20
25
30
35
40
Tem
per
atu
re (
OC
)
Rainfall
Maximum
Minimum

- 26 -
Figure 6. Mean maximum and minimum temperatures and rainfall, Bowen Field Trial 2010
Bowen Field Trial 2011 In this trial there were 1,651 fruit collected from the block that received bifenthrin cover sprays and 2,954 from the block that received ‘soft sprays’ (Tables 4.9 and 7). A total of 5,316 marketable fruit were sampled across the two blocks. In both cover spray treatments, no fruit fly infested fruit were found during the entire sampling period, started from 25 October to 25 November 2011. In addition to the marketable fruit, 61 unmarketable fruit were sampled at harvest 1 and once again no infested fruit were recorded.
Table 20. Fruit fly infestation levels in marketable fruit – Bowen Field Trial 2011
Harvest No. of fruit harvested
Weight (g) mean ± SD
No. of fruit infested
Larvae/ fruit
Upper % infested (95% confidence)
Pre-spray samples
1 711 321 ± 65 0 0 0.4213
Bifenthrin cover sprays
2 597 258 ± 46 0 0 0.5018
3 1054 291 ± 38 0 0 0.2842
Sub total 1651 0 0 0.1814
Soft cover sprays
2 776 300 ± 44 0 0 0.3860
3 1102 328 ± 44 0 0 0.2718
4 660 NA 0 0 0.4539
5 416 NA 0 0 0.7201
Sub total 2954 0 0 0.1014
Total 5316 0 0 0.0564

- 27 -
0
2
4
6
8
10
19-S
ep
26-S
ep
3-O
ct
10-O
ct
17-O
ct
24-O
ct
31-O
ct
7-N
ov
14-N
ov
21-N
ov
28-N
ov
No.
flie
s p
er d
ay
B.tryoni
B.neohumeralis
Figure 7 Mean numbers of fruit flies caught in the cue-lure traps – Bowen Field Trial 2011
0
20
40
60
80
100
120
1-O
ct
8-O
ct
15
-Oct
22
-Oct
29
-Oct
5-N
ov
12
-No
v
19
-No
v
26
-No
v
3-D
ec
10
-De
c
17
-De
c
24
-De
c
31
-De
c
Rai
nfa
ll (
mm
)
0
5
10
15
20
25
30
35
40
Tem
per
atu
re (O
C)
Rainfall
Maximum
Minimum
Figure 8 Mean maximum and minimum temperatures and rainfall, Bowen Field Trial 2011
Burdekin Field Trial 2012 A total of 3,242 fruit were sampled across the four treatment blocks at weekly intervals from 21 November to 11 December 2012. Table 8 shows the data for each harvest.

- 28 -
Table 21. Fruit fly infestation levels in marketable fruit – Burdekin Field Trial 2012
Harvest No. of fruit harvested
Weight (g) mean ± SD
No. of fruit infested
Larvae/ fruit
Upper % infested (95% confidence)
Pre-spray samples
1 393 297 ± 46 0 0 0.7623
Abamectin cover sprays ( 2)
2 174 466 ± 129 0 0 1.7217
3 253 395 ± 50 0 0 1.1841
Sub total 427 0 0 0.7016
Imidacloprid cover sprays (2)
2 108 457 ± 41 0 0 2.7738
3 222 423 ± 52 0 0 1.3494
Sub total 330 0 0 0.9078
Bifenthrin cover sprays ( 2)
2 127 384 ± 56 0 0 2.3588
3 211 395 ± 49 0 0 1.4198
Sub total 338 0 0 0.8863
Abamectin cover spray (1)
2 103 397 ± 39 0 0 2.9084
3 159 372 ± 70 0 0 1.8841
Sub total 262 0 0 1.1434
Total 1750 0 0 0.1712
In all cover spray treatments, no fruit fly infested fruit were found during the entire sampling period. This trial was extended beyond the normal commercial cropping season, which ends by mid-November and consequently the crop was exposed to the higher fruit fly pressure that occurs in the area in mid-summer (Subramaniam et al. 2011). Cue lure traps placed adjacent to the trial crop showed an increase in fly numbers during November (Fig 7). Even though these trial blocks were exposed to ideal conditions for fruit fly to colonise the crops, no infestation was recorded. In addition to the marketable fruit there were also 61 unmarketable fruit collected. No infested fruit were recorded.

- 29 -
0
10
20
30
40
50
60
70
80
90
27-S
ep
4-O
ct
11-O
ct
18-O
ct
25-O
ct
1-N
ov
8-N
ov
15-N
ov
22-N
ov
29-N
ov
6-D
ec
13-D
ec
No.
flie
s p
er d
ay
B.tryoni
B.neohumeralis
Other species
Figure 9 Mean numbers of fruit flies caught in the cue-lure traps – Burdekin Field Trial 2012
Commercial eggplant fruit samples, Bowen 2011 A total of 840 pack house fruit were collected from a commercial farm later in the season (table 9). Results show no fruit fly infestation which equates to 0.3566% upper infestation rate at the 95% confidence level. The block was not sprayed with preharvest fenthion or trichlorfon treatments, but had regular bifenthrin and abamectin sprays at 8 to 11 day intervals for controlling other pests (Table 4.13).
Table 22. Fruit fly infestation levels in packhouse fruit – Bowen
Sample No. of fruit
sampled Weight (g) mean ± SD
No. of fruit infested
Larvae/ fruit
Upper % infested (95% confidence)
1 840 87.2 ± 7.3 0 0 0.3566
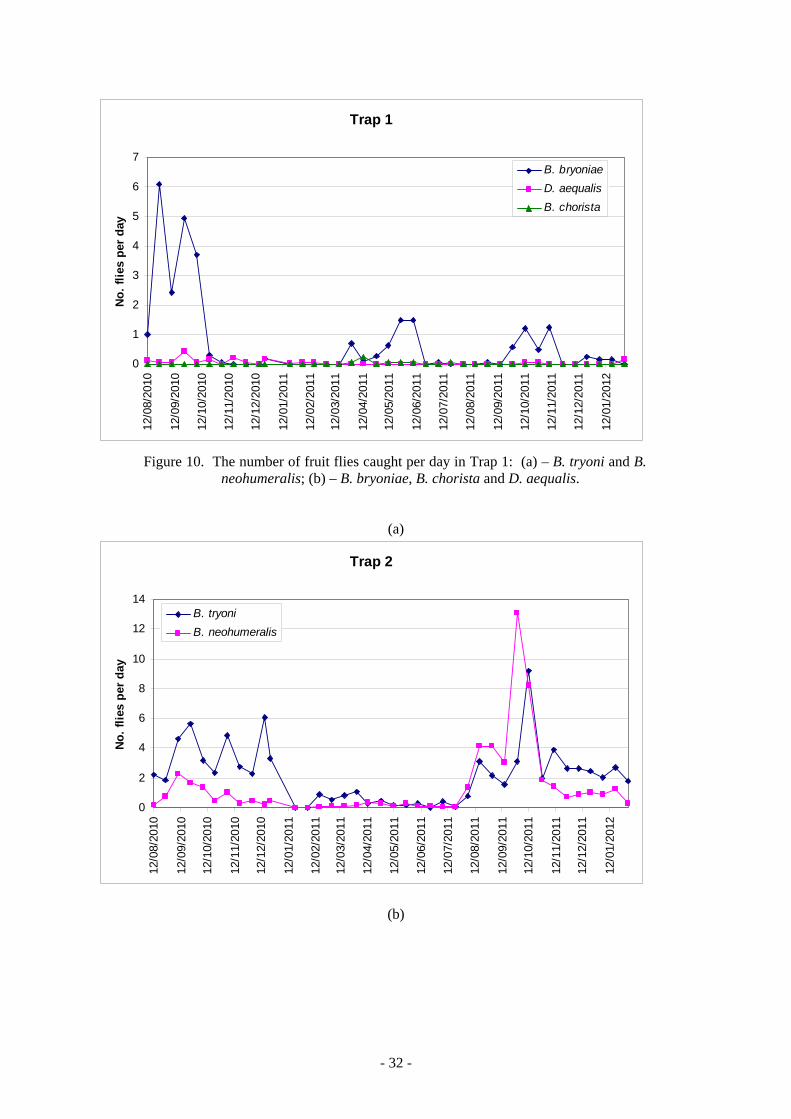
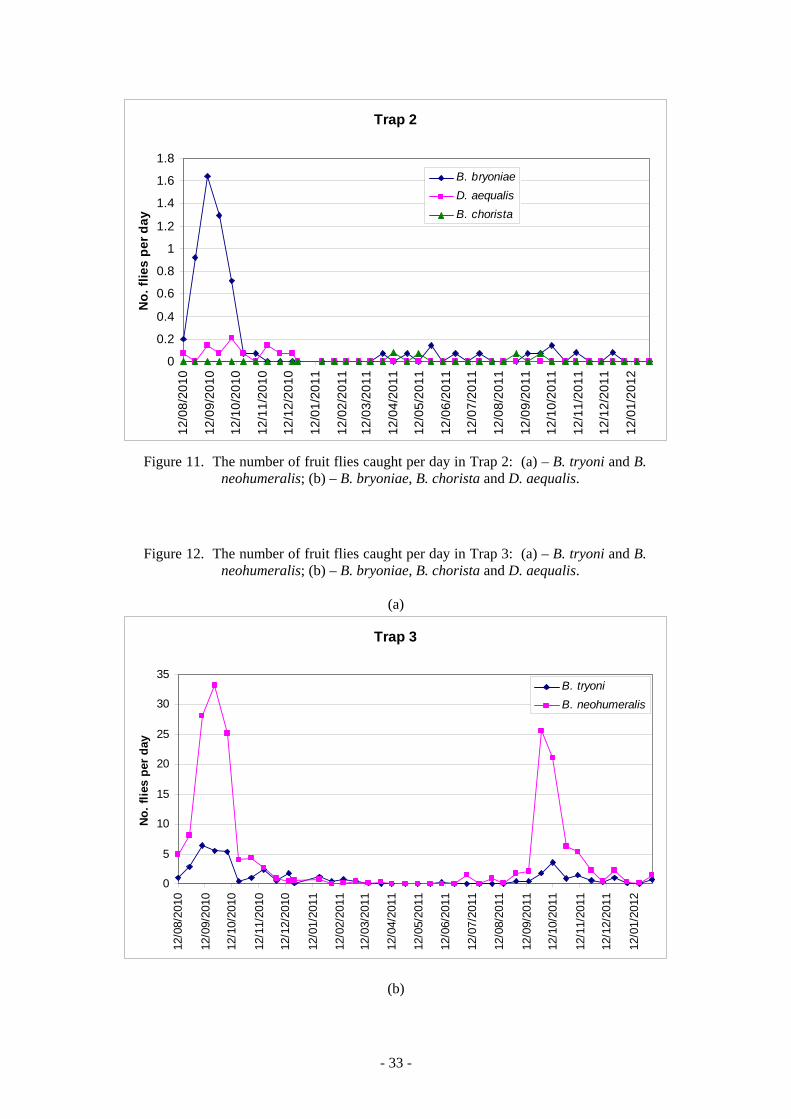
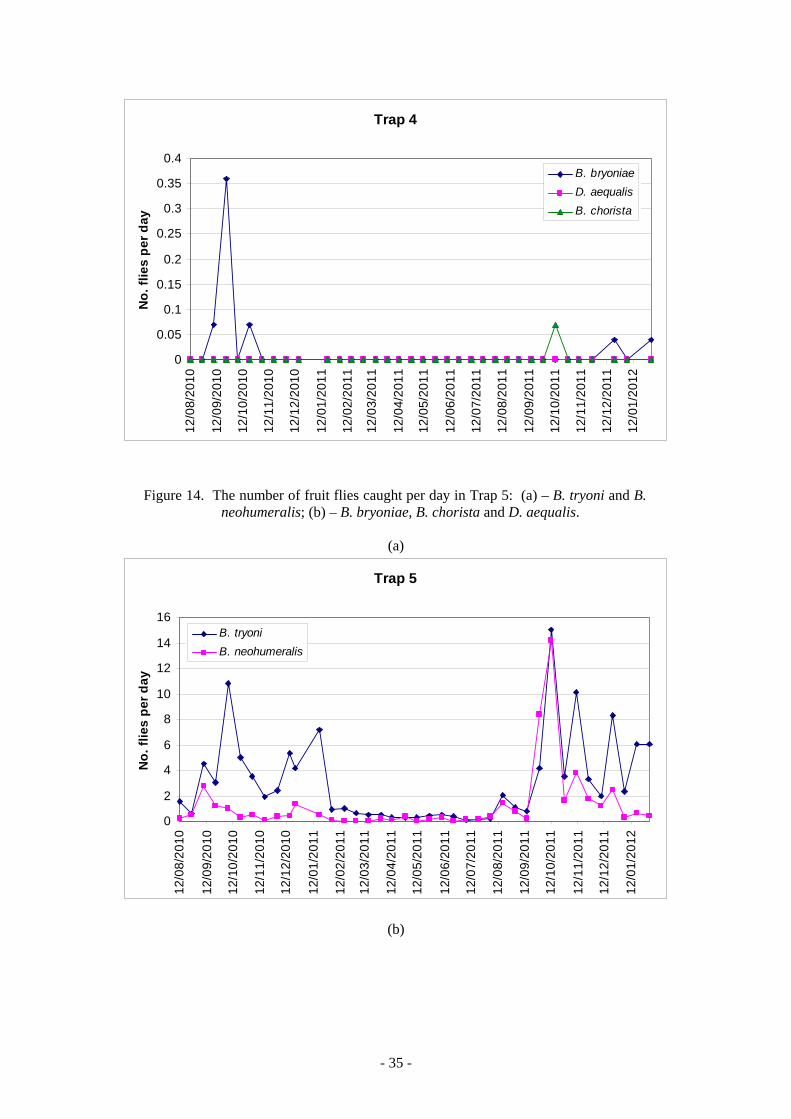
Fruit fly trapping - Bundaberg The trap catches are shown in Figures 10 to 21. Six species of fruit flies were trapped: B. tryoni, B. neohumeralis, Bactrocera bryoniae (Tryon), Bactrocera chorista (May), Dacus aequalis (Coquillett) (all shown in Figures 9 to 21) and Dacus newmani (Perkins). A single specimen of D. newmani was taken in Trap 3 in the fortnight ending 4 January 2012. B. tryoni and B. neohumeralis dominated the catches. Although the general pattern of occurrence was similar, the absolute numbers varied between trapping sites as did the proportions of each species trapped.

- 30 -
Trap 1 (Fig. 10). Similar numbers of B. tryoni and B. neohumeralis were caught. Peak numbers were trapped in September 2010 to January 2011 and again in September to December 2011. Both species were trapped throughout the year, even during the winter months. The nearby citrus trees had ripe fruit from late March to September – October, which probably sustained the fruit fly populations at 5 – 8 flies per day during that time. Trap 2 (Fig. 11). Catches were generally small in the trap in a suburban garden, with peaks of B. tryoni in September – December 2010 and August – November 2011. There was a large peak of B. neohumeralis from August to October 2011. Some flies were trapped throughout the trapping period although numbers were low during winter months. It is probable that this trap result would be typical of fly populations throughout the urban area. Trap 3 (Fig 12). This trap was initially placed beside an eggplant crop. B. tryoni was recorded while the crop and its residues were present (September – October 2010) and when a new crop was grown adjacent to the trap (September – October 2011), although numbers were not high. Large numbers of B. neohumeralis were trapped at the same times, but as eggplant is not recorded as a host of B. neohumeralis (Hancock et al. 2004) it is probable that factors other than the proximity of an eggplant crop were responsible for these peaks. Few flies were trapped for much of the year. Trap 4 (Fig 13). Few flies were caught in this trap, and no host crops were grown nearby. Small green frogs were frequently found in the trap, but it is not known what effect they had on the trap catches. Despite the low numbers of flies trapped, the seasonal pattern of occurrence was the same as that at the other sites, with peak numbers in spring and summer and low numbers during autumn and winter. Trap 5 (Fig 14). Both major species were caught all year, with peaks of B. tryoni from September 2010 to January 2011 and from October 2011 to February 2012 (i.e. the end of the trapping program), and a peak of B. neohumeralis in September 2011. Trap 6 (Fig. 15). The catches in this trap, located not far from Trap 5, had a similar pattern of occurrence as Trap 5 although the numbers of flies caught were higher. Flies were trapped throughout the trapping period. The Elliott River is quite close (~ 100m) to this trap. Trap 7 (Fig 16). This trap was located beside chilli (Capsicum annuum) crops within an intensively cropped district. Reportedly, the chilli crops were sprayed for fruit fly control early in the fruiting period but were not treated later in the fruiting cycle. Very high numbers of B. tryoni were caught while crops were present and for some time afterwards (August 2010 to March 2011, November 2011 onwards), and some flies were trapped from June to August. Trap 8 (Fig 17). A tomato crop, grown close to this trap was removed in late October 2010. Large numbers of B. tryoni were caught while the crop was present and for some time afterwards. Low numbers or no B. tryoni or B. neohumeralis were caught from February 2010 to December 2011 while the land was fallow or used for brassica crops. Trap 9 (Fig 18). Very low numbers of B. tryoni were trapped, with small peaks in spring in each year. B. neohumeralis numbers were higher, with peaks in spring. Trap 10 (Fig 19). Although the numbers of flies caught were not high in this trap, the pattern of B. tryoni and B. neohumeralis occurrence was different from that of most other trap sites in that peak catches extended through spring, summer and into autumn. A variety of crops are grown on this farm (passionfruit, eggplant) and on nearby farms (tomatoes). Trap 11 (Fig 20). Peaks of B. tryoni and B. neohumeralis were recorded in spring – early summer in both years, and catches were very low in autumn and winter. No host crops were grown on the farm during the trapping period or nearby.

- 31 -
Trap 12 (Fig 21). Small peaks of both B. tryoni and B. neohumeralis were recorded in spring 2010 and very low numbers were trapped from January 2010 until spring 2011 when numbers of both species, but particularly B. neohumeralis, increased greatly. It is unlikely that the pattern of occurrence was related to the nearby covered eggplant crop, which has an almost 12 month growing season. It is obvious from these trapping results that B. tryoni and B. neohumeralis numbers are highest in spring – summer irrespective of the presence of host crops, but that numbers are higher if host crops are in close proximity (e.g. Trap 7). Both species can occur throughout all the year, particularly when host crops are fruiting (e.g. Trap 1), but in lower numbers during autumn and winter. B. bryoniae, B. chorista and D. aequalis were trapped, but only in low numbers. B. bryoniae was trapped sporadically throughout the trapping period (e.g. Traps 7, 9, 10), with numbers generally highest in spring months (September – November). B. chorista was trapped in very low numbers in September – October and April – May, and D. aequalis was caught in spring and summer months. Drew et al. (1984) reported that the occurrence of B. bryoniae and B. chorista was highly correlated, with similar timing of population peaks. They reported that D. aequalis was caught at all times of the year, except for a short time in mid winter, and that B. bryoniae and B. chorista were rare when present and were absent at some times during the year. Graphs in Drew et al. (1984) show B. bryoniae peaks in September - November and May – June. Their results show similar patterns of occurrence to those recorded in this Bundaberg district study.
(a)
Trap 1
0
10
20
30
40
50
60
70
80
12
/08
/20
10
12
/09
/20
10
12
/10
/20
10
12
/11
/20
10
12
/12
/20
10
12
/01
/20
11
12
/02
/20
11
12
/03
/20
11
12
/04
/20
11
12
/05
/20
11
12
/06
/20
11
12
/07
/20
11
12
/08
/20
11
12
/09
/20
11
12
/10
/20
11
12
/11
/20
11
12
/12
/20
11
12
/01
/20
12
No
. fl
ies
pe
r d
ay
B. tryoni
B. neohumeralis
(b)
- 32 -
Trap 1
0
1
2
3
4
5
6
712
/08/
2010
12/0
9/20
10
12/1
0/20
10
12/1
1/20
10
12/1
2/20
10
12/0
1/20
11
12/0
2/20
11
12/0
3/20
11
12/0
4/20
11
12/0
5/20
11
12/0
6/20
11
12/0
7/20
11
12/0
8/20
11
12/0
9/20
11
12/1
0/20
11
12/1
1/20
11
12/1
2/20
11
12/0
1/20
12
No
. fl
ies
per
day
B. bryoniae
D. aequalis
B. chorista
Figure 10. The number of fruit flies caught per day in Trap 1: (a) – B. tryoni and B. neohumeralis; (b) – B. bryoniae, B. chorista and D. aequalis.
(a)
Trap 2
0
2
4
6
8
10
12
14
12/0
8/20
10
12/0
9/20
10
12/1
0/20
10
12/1
1/20
10
12/1
2/20
10
12/0
1/20
11
12/0
2/20
11
12/0
3/20
11
12/0
4/20
11
12/0
5/20
11
12/0
6/20
11
12/0
7/20
11
12/0
8/20
11
12/0
9/20
11
12/1
0/20
11
12/1
1/20
11
12/1
2/20
11
12/0
1/20
12
No
. fl
ies
per
day
B. tryoni
B. neohumeralis
(b)
- 33 -
Trap 2
0
0.2
0.4
0.6
0.8
1
1.2
1.4
1.6
1.8
12
/08
/20
10
12
/09
/20
10
12
/10
/20
10
12
/11
/20
10
12
/12
/20
10
12
/01
/20
11
12
/02
/20
11
12
/03
/20
11
12
/04
/20
11
12
/05
/20
11
12
/06
/20
11
12
/07
/20
11
12
/08
/20
11
12
/09
/20
11
12
/10
/20
11
12
/11
/20
11
12
/12
/20
11
12
/01
/20
12
No
. fl
ies
pe
r d
ay
B. bryoniae
D. aequalis
B. chorista
Figure 11. The number of fruit flies caught per day in Trap 2: (a) – B. tryoni and B. neohumeralis; (b) – B. bryoniae, B. chorista and D. aequalis.
Figure 12. The number of fruit flies caught per day in Trap 3: (a) – B. tryoni and B. neohumeralis; (b) – B. bryoniae, B. chorista and D. aequalis.
(a)
Trap 3
0
5
10
15
20
25
30
35
12/0
8/20
10
12/0
9/20
10
12/1
0/20
10
12/1
1/20
10
12/1
2/20
10
12/0
1/20
11
12/0
2/20
11
12/0
3/20
11
12/0
4/20
11
12/0
5/20
11
12/0
6/20
11
12/0
7/20
11
12/0
8/20
11
12/0
9/20
11
12/1
0/20
11
12/1
1/20
11
12/1
2/20
11
12/0
1/20
12
No
. fl
ies
per
day
B. tryoni
B. neohumeralis
(b)

- 34 -
Trap 3
0
0.5
1
1.5
2
2.5
3
3.5
12/0
8/20
10
12/0
9/20
10
12/1
0/20
10
12/1
1/20
10
12/1
2/20
10
12/0
1/20
11
12/0
2/20
11
12/0
3/20
11
12/0
4/20
11
12/0
5/20
11
12/0
6/20
11
12/0
7/20
11
12/0
8/20
11
12/0
9/20
11
12/1
0/20
11
12/1
1/20
11
12/1
2/20
11
12/0
1/20
12
No
. fl
ies
per
day
B. bryoniae
D. aequalis
B. chorista
Figure 13. The number of fruit flies caught per day in Trap 4: (a) – B. tryoni and B. neohumeralis; (b) – B. bryoniae, B. chorista and D. aequalis.
(a)
Trap 4
0
0.5
1
1.5
2
2.5
12/0
8/20
10
12/0
9/20
10
12/1
0/20
10
12/1
1/20
10
12/1
2/20
10
12/0
1/20
11
12/0
2/20
11
12/0
3/20
11
12/0
4/20
11
12/0
5/20
11
12/0
6/20
11
12/0
7/20
11
12/0
8/20
11
12/0
9/20
11
12/1
0/20
11
12/1
1/20
11
12/1
2/20
11
12/0
1/20
12
No
. fl
ies
per
day
B. tryoni
B. neohumeralis
(b)
- 35 -
Trap 4
0
0.05
0.1
0.15
0.2
0.25
0.3
0.35
0.4
12
/08
/20
10
12
/09
/20
10
12
/10
/20
10
12
/11
/20
10
12
/12
/20
10
12
/01
/20
11
12
/02
/20
11
12
/03
/20
11
12
/04
/20
11
12
/05
/20
11
12
/06
/20
11
12
/07
/20
11
12
/08
/20
11
12
/09
/20
11
12
/10
/20
11
12
/11
/20
11
12
/12
/20
11
12
/01
/20
12
No
. fl
ies
pe
r d
ay
B. bryoniae
D. aequalis
B. chorista
Figure 14. The number of fruit flies caught per day in Trap 5: (a) – B. tryoni and B. neohumeralis; (b) – B. bryoniae, B. chorista and D. aequalis.
(a)
Trap 5
0
2
4
6
8
10
12
14
16
12
/08
/20
10
12
/09
/20
10
12
/10
/20
10
12
/11
/20
10
12
/12
/20
10
12
/01
/20
11
12
/02
/20
11
12
/03
/20
11
12
/04
/20
11
12
/05
/20
11
12
/06
/20
11
12
/07
/20
11
12
/08
/20
11
12
/09
/20
11
12
/10
/20
11
12
/11
/20
11
12
/12
/20
11
12
/01
/20
12
No
. fl
ies
pe
r d
ay
B. tryoni
B. neohumeralis
(b)

- 36 -
Trap 5
0
0.2
0.4
0.6
0.8
1
1.2
1.4
1.6
1.8
12/0
8/20
10
12/0
9/20
10
12/1
0/20
10
12/1
1/20
10
12/1
2/20
10
12/0
1/20
11
12/0
2/20
11
12/0
3/20
11
12/0
4/20
11
12/0
5/20
11
12/0
6/20
11
12/0
7/20
11
12/0
8/20
11
12/0
9/20
11
12/1
0/20
11
12/1
1/20
11
12/1
2/20
11
12/0
1/20
12
No
. fl
ies
per
day
B. bryoniae
D. aequalis
B. chorista
Figure 15. The number of fruit flies caught per day in Trap 6: (a) – B. tryoni and B. neohumeralis; (b) – B. bryoniae, B. chorista and D. aequalis.
(a)
Trap 6
0
5
10
15
20
25
30
35
12
/08
/20
10
12
/09
/20
10
12
/10
/20
10
12
/11
/20
10
12
/12
/20
10
12
/01
/20
11
12
/02
/20
11
12
/03
/20
11
12
/04
/20
11
12
/05
/20
11
12
/06
/20
11
12
/07
/20
11
12
/08
/20
11
12
/09
/20
11
12
/10
/20
11
12
/11
/20
11
12
/12
/20
11
12
/01
/20
12
No
. fl
ies
pe
r d
ay
B. tryoni
B. neohumeralis
(b)

- 37 -
Trap 6
0
0.2
0.4
0.6
0.8
1
1.2
1.4
1.6
12
/08
/20
10
12
/09
/20
10
12
/10
/20
10
12
/11
/20
10
12
/12
/20
10
12
/01
/20
11
12
/02
/20
11
12
/03
/20
11
12
/04
/20
11
12
/05
/20
11
12
/06
/20
11
12
/07
/20
11
12
/08
/20
11
12
/09
/20
11
12
/10
/20
11
12
/11
/20
11
12
/12
/20
11
12
/01
/20
12
No
. fl
ies
pe
r d
ay
B. bryoniae
D. aequalis
B. chorista
Figure 16. The number of fruit flies caught per day in Trap 7: (a) – B. tryoni and B. neohumeralis; (b) – B. bryoniae, B. chorista and D. aequalis.
(a)
Trap 7
0
50
100
150
200
250
300
350
12
/08
/20
10
12
/09
/20
10
12
/10
/20
10
12
/11
/20
10
12
/12
/20
10
12
/01
/20
11
12
/02
/20
11
12
/03
/20
11
12
/04
/20
11
12
/05
/20
11
12
/06
/20
11
12
/07
/20
11
12
/08
/20
11
12
/09
/20
11
12
/10
/20
11
12
/11
/20
11
12
/12
/20
11
12
/01
/20
12
No
. fl
ies
pe
r d
ay
B. tryoni
B. neohumeralis
(b)

- 38 -
Trap 7
0
0.2
0.4
0.6
0.8
1
1.2
1.4
1.6
1.8
12/0
8/20
10
12/0
9/20
10
12/1
0/20
10
12/1
1/20
10
12/1
2/20
10
12/0
1/20
11
12/0
2/20
11
12/0
3/20
11
12/0
4/20
11
12/0
5/20
11
12/0
6/20
11
12/0
7/20
11
12/0
8/20
11
12/0
9/20
11
12/1
0/20
11
12/1
1/20
11
12/1
2/20
11
12/0
1/20
12
No
. fl
ies
per
day
B. bryoniae
D. aequalis
B. chorista
Figure 17. The number of fruit flies caught per day in Trap 8: (a) – B. tryoni and B. neohumeralis; (b) – B. bryoniae, B. chorista and D. aequalis.
(a)
Trap 8
0
5
10
15
20
25
30
35
40
45
50
12
/08
/20
10
12
/09
/20
10
12
/10
/20
10
12
/11
/20
10
12
/12
/20
10
12
/01
/20
11
12
/02
/20
11
12
/03
/20
11
12
/04
/20
11
12
/05
/20
11
12
/06
/20
11
12
/07
/20
11
12
/08
/20
11
12
/09
/20
11
12
/10
/20
11
12
/11
/20
11
12
/12
/20
11
12
/01
/20
12
No
. fl
ies
pe
r d
ay
B. tryoni
B. neohumeralis
(b)

- 39 -
Trap 8
0
0.2
0.4
0.6
0.8
1
1.2
1.4
1.6
12/0
8/20
10
12/0
9/20
10
12/1
0/20
10
12/1
1/20
10
12/1
2/20
10
12/0
1/20
11
12/0
2/20
11
12/0
3/20
11
12/0
4/20
11
12/0
5/20
11
12/0
6/20
11
12/0
7/20
11
12/0
8/20
11
12/0
9/20
11
12/1
0/20
11
12/1
1/20
11
12/1
2/20
11
12/0
1/20
12
No
. fl
ies
per
day
B. bryoniae
D. aequalis
B. chorista
Figure 18. The number of fruit flies caught per day in Trap 9: (a) – B. tryoni and B. neohumeralis; (b) – B. bryoniae, B. chorista and D. aequalis.
(a)
Trap 9
0
5
10
15
20
25
30
35
12
/08
/20
10
12
/09
/20
10
12
/10
/20
10
12
/11
/20
10
12
/12
/20
10
12
/01
/20
11
12
/02
/20
11
12
/03
/20
11
12
/04
/20
11
12
/05
/20
11
12
/06
/20
11
12
/07
/20
11
12
/08
/20
11
12
/09
/20
11
12
/10
/20
11
12
/11
/20
11
12
/12
/20
11
12
/01
/20
12
No
. fl
ies
pe
r d
ay
B. tryoni
B. neohumeralis
(b)

- 40 -
Trap 9
0
0.5
1
1.5
2
2.5
12/0
8/20
10
12/0
9/20
10
12/1
0/20
10
12/1
1/20
10
12/1
2/20
10
12/0
1/20
11
12/0
2/20
11
12/0
3/20
11
12/0
4/20
11
12/0
5/20
11
12/0
6/20
11
12/0
7/20
11
12/0
8/20
11
12/0
9/20
11
12/1
0/20
11
12/1
1/20
11
12/1
2/20
11
12/0
1/20
12
No
. fl
ies
per
day
B. bryoniae
D. aequalis
B. chorista
Figure 19. The number of fruit flies caught per day in Trap 10: (a) – B. tryoni and B. neohumeralis; (b) – B. bryoniae, B. chorista and D. aequalis.
(a)
Trap 10
0
2
4
6
8
10
12
14
12/0
8/20
10
12/0
9/20
10
12/1
0/20
10
12/1
1/20
10
12/1
2/20
10
12/0
1/20
11
12/0
2/20
11
12/0
3/20
11
12/0
4/20
11
12/0
5/20
11
12/0
6/20
11
12/0
7/20
11
12/0
8/20
11
12/0
9/20
11
12/1
0/20
11
12/1
1/20
11
12/1
2/20
11
12/0
1/20
12
No
. fl
ies
per
day
B. tryoni
B. neohumeralis
(b)

- 41 -
Trap 10
0
0.5
1
1.5
2
2.5
3
3.5
12
/08
/20
10
12
/09
/20
10
12
/10
/20
10
12
/11
/20
10
12
/12
/20
10
12
/01
/20
11
12
/02
/20
11
12
/03
/20
11
12
/04
/20
11
12
/05
/20
11
12
/06
/20
11
12
/07
/20
11
12
/08
/20
11
12
/09
/20
11
12
/10
/20
11
12
/11
/20
11
12
/12
/20
11
12
/01
/20
12
No
. fl
ies
pe
r d
ay
B. bryoniae
D. aequalis
B. chorista
Figure 20. The number of fruit flies caught per day in Trap 11: (a) – B. tryoni and B. neohumeralis; (b) – B. bryoniae, B. chorista and D. aequalis.
(a)
Trap 11
0
5
10
15
20
25
30
35
12
/08
/20
10
12
/09
/20
10
12
/10
/20
10
12
/11
/20
10
12
/12
/20
10
12
/01
/20
11
12
/02
/20
11
12
/03
/20
11
12
/04
/20
11
12
/05
/20
11
12
/06
/20
11
12
/07
/20
11
12
/08
/20
11
12
/09
/20
11
12
/10
/20
11
12
/11
/20
11
12
/12
/20
11
12
/01
/20
12
No
. fl
ies
pe
r d
ay
B. tryoni
B. neohumeralis
(b)

- 42 -
Trap 11
0
0.2
0.4
0.6
0.8
1
1.2
1.4
1.6
1.8
2
12
/08
/20
10
12
/09
/20
10
12
/10
/20
10
12
/11
/20
10
12
/12
/20
10
12
/01
/20
11
12
/02
/20
11
12
/03
/20
11
12
/04
/20
11
12
/05
/20
11
12
/06
/20
11
12
/07
/20
11
12
/08
/20
11
12
/09
/20
11
12
/10
/20
11
12
/11
/20
11
12
/12
/20
11
12
/01
/20
12
No
. fl
ies
pe
r d
ay
B. bryoniae
D. aequalis
B. chorista
Figure 21. The number of fruit flies caught per day in Trap 12: (a) – B. tryoni and B. neohumeralis; (b) – B. bryoniae, B. chorista and D. aequalis.
(a)
Trap 12
0
10
20
30
40
50
60
70
25
/08
/20
10
25
/09
/20
10
25
/10
/20
10
25
/11
/20
10
25
/12
/20
10
25
/01
/20
11
25
/02
/20
11
25
/03
/20
11
25
/04
/20
11
25
/05
/20
11
25
/06
/20
11
25
/07
/20
11
25
/08
/20
11
25
/09
/20
11
25
/10
/20
11
25
/11
/20
11
25
/12
/20
11
25
/01
/20
12
No
. fl
ies
pe
r d
ay
B. tryoni
B. neohumeralis
(b)

- 43 -
Trap 12
0
0.2
0.4
0.6
0.8
1
1.2
1.4
1.6
1.8
2
25
/08
/20
10
25
/09
/20
10
25
/10
/20
10
25
/11
/20
10
25
/12
/20
10
25
/01
/20
11
25
/02
/20
11
25
/03
/20
11
25
/04
/20
11
25
/05
/20
11
25
/06
/20
11
25
/07
/20
11
25
/08
/20
11
25
/09
/20
11
25
/10
/20
11
25
/11
/20
11
25
/12
/20
11
25
/01
/20
12
No
. fl
ies
pe
r d
ay
B. bryoniae
D. aequalis
B. chorista
Figure 22. Monthly rainfall during the trapping period and long term maximum and minimum temperatures for Bundaberg. (Source: www.bom.gov.au)
Bundaberg Rainfall
0
100
200
300
400
500
600
700
Aug-1
0
Sep-1
0
Oct-10
Nov-10
Dec-10
Jan-
11
Feb-1
1
Mar
-11
Apr-1
1
May
-11
Jun-
11
Jul-1
1
Aug-1
1
Sep-1
1
Oct-11
Nov-11
Dec-11
Jan-
12
mm
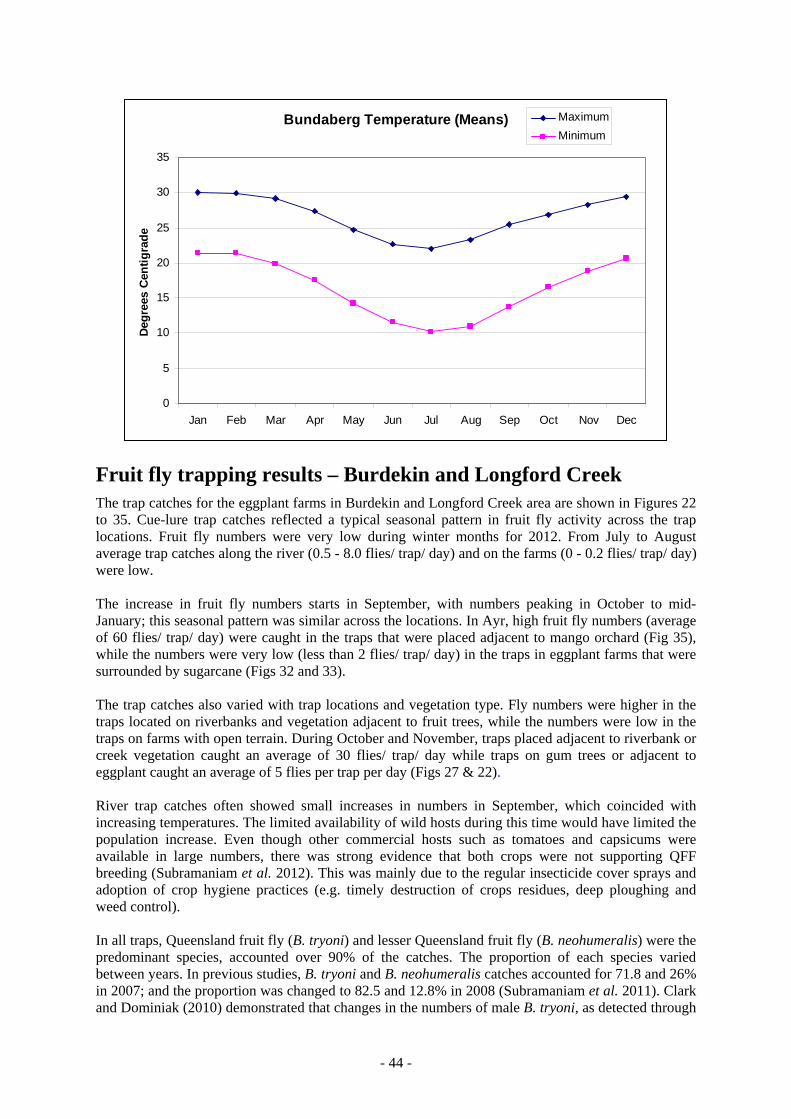
- 44 -
Bundaberg Temperature (Means)
0
5
10
15
20
25
30
35
Jan Feb Mar Apr May Jun Jul Aug Sep Oct Nov Dec
Deg
rees
Cen
tig
rad
e
Maximum
Minimum
Fruit fly trapping results – Burdekin and Longford Creek The trap catches for the eggplant farms in Burdekin and Longford Creek area are shown in Figures 22 to 35. Cue-lure trap catches reflected a typical seasonal pattern in fruit fly activity across the trap locations. Fruit fly numbers were very low during winter months for 2012. From July to August average trap catches along the river (0.5 - 8.0 flies/ trap/ day) and on the farms (0 - 0.2 flies/ trap/ day) were low. The increase in fruit fly numbers starts in September, with numbers peaking in October to mid-January; this seasonal pattern was similar across the locations. In Ayr, high fruit fly numbers (average of 60 flies/ trap/ day) were caught in the traps that were placed adjacent to mango orchard (Fig 35), while the numbers were very low (less than 2 flies/ trap/ day) in the traps in eggplant farms that were surrounded by sugarcane (Figs 32 and 33). The trap catches also varied with trap locations and vegetation type. Fly numbers were higher in the traps located on riverbanks and vegetation adjacent to fruit trees, while the numbers were low in the traps on farms with open terrain. During October and November, traps placed adjacent to riverbank or creek vegetation caught an average of 30 flies/ trap/ day while traps on gum trees or adjacent to eggplant caught an average of 5 flies per trap per day (Figs 27 & 22). River trap catches often showed small increases in numbers in September, which coincided with increasing temperatures. The limited availability of wild hosts during this time would have limited the population increase. Even though other commercial hosts such as tomatoes and capsicums were available in large numbers, there was strong evidence that both crops were not supporting QFF breeding (Subramaniam et al. 2012). This was mainly due to the regular insecticide cover sprays and adoption of crop hygiene practices (e.g. timely destruction of crops residues, deep ploughing and weed control). In all traps, Queensland fruit fly (B. tryoni) and lesser Queensland fruit fly (B. neohumeralis) were the predominant species, accounted over 90% of the catches. The proportion of each species varied between years. In previous studies, B. tryoni and B. neohumeralis catches accounted for 71.8 and 26% in 2007; and the proportion was changed to 82.5 and 12.8% in 2008 (Subramaniam et al. 2011). Clark and Dominiak (2010) demonstrated that changes in the numbers of male B. tryoni, as detected through

- 45 -
cue-lure sampling, also reflects changes in the number of females. B. bryoniae was recorded in a small proportion in most traps, but a small peak was observed during August to October mainly in traps in close proximity to mango orchard, riverbank or creeks (Fig 35). B. bryoniae is widely distributed in northern and eastern parts of Australia with a narrow host range. Wild cucumber (Diplocyclos palmatus) was reported as its major host (Drew 1989). B. bryoniae was not recorded from the wild fruit survey conducted in Bowen (Subramaniam et al. 2011). Other species, Bactrocera. chorista, B. alyxiae, Dacus aequalis, and D newmani, were present in very small numbers. The vegetable production season starts in March and continues until November, with the first-half of the fruit harvest season coinciding with the low fruit fly period. The December/ January fruit fly peak coincides with the end of the vegetable season and the cessation of field sprays on most vegetable farms. Therefore, this peak of activity for fruit fly is not a concern for the vegetable industry, as the production season ends in November. Figure 23 The number of fruit flies caught per day in trap installed near eggplant crop, Longford Creek.(2012)
Trap BO-01
0
2
4
6
8
10
21-J
un
5-Ju
l
19-J
ul
2-A
ug
16-A
ug
30-A
ug
13-S
ep
27-S
ep
11-O
ct
25-O
ct
8-N
ov
22-N
ov
6-D
ec
No.
flie
s p
er d
ay
B.tryoni
B.neohumeralis
Other species
Figure 24 The number of fruit flies caught per day in trap installed near eggplant and pumpkin, Longford Creek (2012)

- 46 -
Trap B0-02
0
1
2
3
4
5
6
7
8
9
1021
-Jun
5-Ju
l
19-J
ul
2-A
ug
16-A
ug
30-A
ug
13-S
ep
27-S
ep
11-O
ct
25-O
ct
8-N
ov
22-N
ov
6-D
ec
No.
flie
s p
er d
ay
B.tryoni
B.neohumeralis
Other species
Figure 25 The number of fruit flies caught per day in trap installed near melon and creek vegetation, Longford Creek (2012)
Trap B0-03
0123456789
10
21-J
un
5-Ju
l
19-J
ul
2-A
ug
16-A
ug
30-A
ug
13-S
ep
27-S
ep
11-O
ct
25-O
ct
8-N
ov
22-N
ov
6-D
ec
No.
flie
s p
er d
ay
B.tryoni
B.neohumeralis
Other species
Figure 26 The number of fruit flies caught per day in trap installed near eggplant and home garden, Longford Creek (2012)

- 47 -
Trap BO - 04
0
2
4
6
8
1021
-Jun
5-Ju
l
19-J
ul
2-A
ug
16-A
ug
30-A
ug
13-S
ep
27-S
ep
11-O
ct
25-O
ct
8-N
ov
22-N
ov
6-D
ec
No.
flie
s p
er d
ay
B.tryoni
B.neohumeralis
Other species
Figure 27 The number of fruit flies caught per day in trap installed near riverbank and eggplant, Longford Creek (2012)
Trap Bo - 05
0
5
10
15
20
25
21-J
un
5-Ju
l
19-J
ul
2-A
ug
16-A
ug
30-A
ug
13-S
ep
27-S
ep
11-O
ct
25-O
ct
8-N
ov
No.
flie
s p
er d
ay
B.tryoni
B.neohumeralis
Other species
Figure 28 The number of fruit flies caught per day in trap installed in creek vegetation, Longford Creek (2012)

- 48 -
Trap BO - 06
0
10
20
30
40
50
60
7021
-Jun
5-Ju
l
19-J
ul
2-A
ug
16-A
ug
30-A
ug
13-S
ep
27-S
ep
11-O
ct
25-O
ct
8-N
ov
22-N
ov
6-D
ec
No
flie
s p
er d
ay
B.tryoni
B.neohumeralis
Other species
Figure 29 The number of fruit flies caught per day in trap installed near eggplant crop and fruit trees, Ayr (2012)
Trap Bu- 08
0
2
4
6
8
10
23-J
ul
30-J
ul
6-A
ug
13-A
ug
20-A
ug
27-A
ug
3-Se
p
10-S
ep
17-S
ep
24-S
ep
1-O
ct
8-O
ct
15-O
ct
22-O
ct
No.
flie
s / d
ay
B.tryoni
B.neohumeralis
Other species

- 49 -
Trap Bu - 09
0
2
4
6
8
1023
-Jul
30-J
ul
6-A
ug
13-A
ug
20-A
ug
27-A
ug
3-S
ep
10-S
ep
17-S
ep
24-S
ep
1-O
ct
8-O
ct
15-O
ct
22-O
ct
No.
of
flie
s / d
ay
B.tryoni
B.neohumeralis
Other species
Figure 30. The number of fruit flies caught per day in trap installed near eggplant crop and sugarcane, Ayr (2012)
Trap Bu-10
0
5
10
15
20
25
30
35
23-J
ul
6-A
ug
20-A
ug
3-Se
p
17-S
ep
1-O
ct
15-O
ct
29-O
ct
12-N
ov
26-N
ov
10-D
ec
24-D
ec
7-Ja
n
21-J
an
4-Fe
b
18-F
eb
4-M
ar
18-M
ar
1-A
pr
15-A
pr
29-A
pr
13-M
ay
No.
flie
s p
er t
rap
B.tryoni
B.neohumeralis
Other species
Figure 31. The number of fruit flies caught per day in trap installed near mahogany plantation and eggplant, Inkerman (2012)

- 50 -
Trap Bu-11
0
1
2
3
4
5
6
7
8
9
1023
-Jul
23-A
ug
23-S
ep
23-O
ct
23-N
ov
23-D
ec
23-J
an
23-F
eb
23-M
ar
23-A
pr
No.
flie
s p
er t
rap
B.tryoni
B.neohumeralis
Other species
Figure 32. The number of fruit flies caught per day in trap installed near eggplant crop, Inkerman (2012)
Trap - Bu 12
0
2
4
6
8
10
23-J
ul
23-A
ug
23-S
ep
23-O
ct
23-N
ov
23-D
ec
23-J
an
23-F
eb
23-M
ar
23-A
pr
No.
flie
s / d
ay
B.tryoni
B.neohumeralis
Other species
Figure 33. The number of fruit flies caught per day in trap installed near eggplant crop and sugarcane, Home Hill (2012)
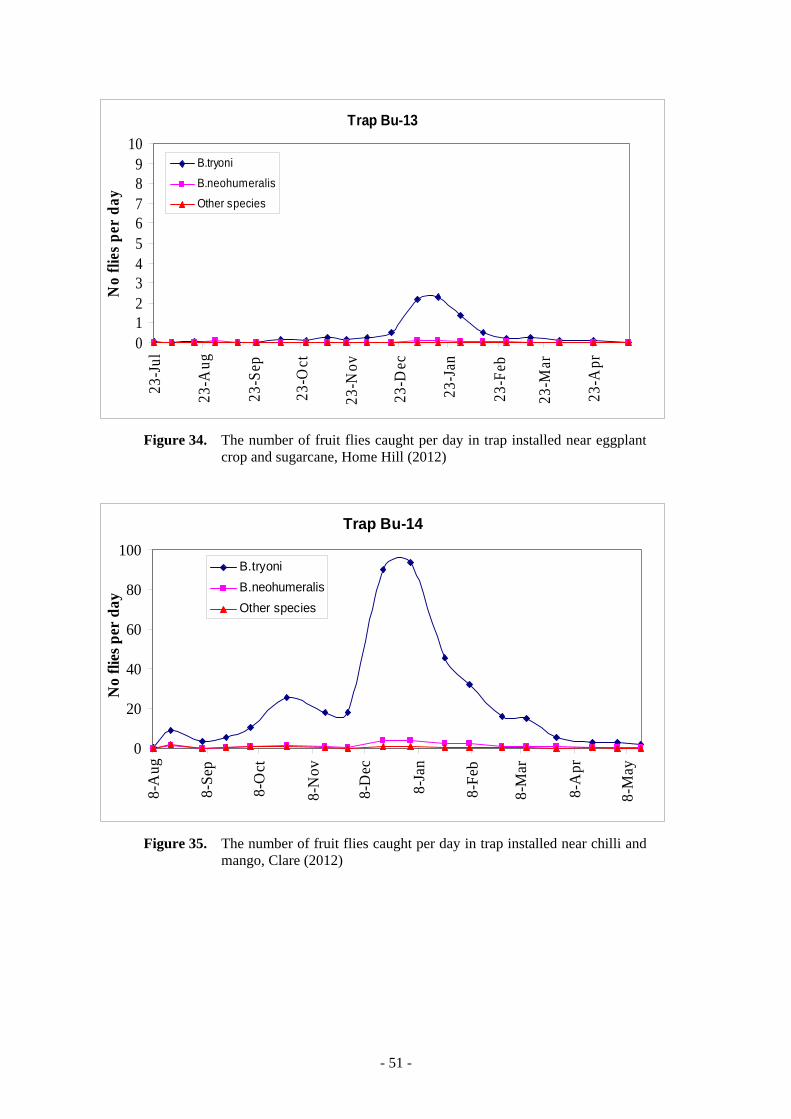
- 51 -
Trap Bu-13
0123456789
1023
-Jul
23-A
ug
23-S
ep
23-O
ct
23-N
ov
23-D
ec
23-J
an
23-F
eb
23-M
ar
23-A
pr
No
flie
s p
er d
ay
B.tryoni
B.neohumeralis
Other species
Figure 34. The number of fruit flies caught per day in trap installed near eggplant crop and sugarcane, Home Hill (2012)
Trap Bu-14
0
20
40
60
80
100
8-A
ug
8-S
ep
8-O
ct
8-N
ov
8-D
ec
8-Ja
n
8-F
eb
8-M
ar
8-A
pr
8-M
ay
No
flie
s p
er d
ay
B.tryoni
B.neohumeralis
Other species
Figure 35. The number of fruit flies caught per day in trap installed near chilli and mango, Clare (2012)

- 52 -
Trap Bu-16
0
10
20
30
40
50
60
70
80
9030
-Aug
13-S
ep
27-S
ep
11-O
ct
25-O
ct
8-N
ov
22-N
ov
6-D
ec
20-D
ec
3-Ja
n
17-J
an
31-J
an
14-F
eb
28-F
eb
14-M
ar
28-M
ar
11-A
pr
25-A
pr
9-M
ay
No
flie
s p
er d
ay
B.tryoni
B.neohumeralis
Other species
Figure 36. The number of fruit flies caught per day in trap installed in mango orchard, Ayr (2012)
DISCUSSION The major production areas of Bowen, Burdekin and Bundaberg are classified as areas with endemic fruit populations all year round. Trapping across the three regions found that the two main species of fruit fly caught in cue-lure traps were B. tryoni and B. neohumeralis. Although B. neohumeralis was the second most abundant species trapped it is important to note that B. neohumeralis is not a recorded as attacking eggplant (Hancock et al. 2004). Other fruit fly species recorded in low numbers which have also never been recorded as attacking eggplant include B. bryoniae, B. chorista, B. alyxiae, Dacus aequalis, and a single specimen of D. newmani. The detection of the fly species reported above was not unexpected as trapping programs have been undertaken in previous projects across Queensland. In the Bowen and Gumlu districts extensive trapping was undertaken over three years in HAL project VG06028 “Alternative fruit fly control and market access for capsicums and tomatoes” (Subramaniam et al. 2011). In the Bundaberg region previous trapping trials include monitoring fruit fly activity in capsicum crops in 2001-2002 (Kay et al. 2004); Bundaberg Fruit Vegetable Growers project “Area wide integrated pest management for Bundaberg production horticulture, 2011; Queensland University of Technology trials investigating the relationship between fruit fly activity and landscapes (Clark et al. 2012). In addition to published reports more trapping data is currently being recorded in HAL project BS09022 “Alternative fruit fly treatment for interstate market access for strawberries” which is looking at the establishment of a systems approach for strawberries in the Bundaberg region. As expected trapping results in this project varied depending on the time of the year and the locations (region and surrounding vegetation types) of the traps. However the presence of male fruit fly in traps does not directly correlate with infestation levels in eggplant which fruit remained at very low levels despite minimal insecticide use and the sampling regime which included unmarketable (reject/damaged) and marketable fruit. The highest fruit fly populations recorded at trial sites in this project was at the Ayr research station in the Burdekin region which had mean trap catches of nearly 80 flies per day in the later part of December. No infested fruit were recorded at this site despite the

- 53 -
high fruit fly populations and fruit receiving minimal cover sprays. Abamectin, imidacloprid and bifenthrin were all trialled separately at this site but as mentioned above, no infested fruit were recorded. A similar result was recorded for trial site at Bowen in October/November 2011. When marketable grade fruit were selected the was no infested fruit recorded from 2362 fruit that received bifenthrin cover sprays and 2954 fruit that received soft sprays (pymetrozine, petroleum oil and pyriproxyfen). In the 2010 trial at the same site no infestation was recorded from 6281 marketable fruit that had only received single applications of pymetrozine, petroleum oil and bifenthrin over a six week period. However, 6 infested fruit were recorded from 1313 fruit that had been graded as unmarketable (reject/damaged). This result does confirm that eggplant are a host to B. tryoni but is also highlights that fact that correct grading of fruit is a valid risk mitigation measure for use in systems approaches. Two trials were also conducted at the DAFF research station at Bundaberg. One difference between the Bundaberg trails and the trials in North Queensland was that fruit were not graded using commercially accepted criteria. Despite this very low number of infested fruit were recorded. In the 2010 trial a single infested fruit was recorded from 4765 fruit that received one application of methomyl and weekly applications of spinosad prior to harvest. In the second trial in Bundaberg in 2011 no infested fruit were recorded from 1629 fruit that received a similar spray regime to the 2010 trial except that spinetoram was substituted for spinosad. It should also be noted that this trial was the only trial conducted in June when fruit fly numbers were low (only 300 flies were recorded over a two month period). During the course of this project a total of 21894 fruit were collected from 5 trials on DAFF research stations and sampling from a commercial eggplant farm in Bowen. No infested fruit were recorded from fruit that was classified as commercial grade fruit. A total of 6 infested fruit were recorded from 1313 fruit that was classified as unmarketable or reject fruit from Bowen and Ayr trial sites. In addition to this only a single infested fruit was recorded from the Bundaberg trials were 6394 fruit were sampled but not graded using commercial standards. While insecticide regimes were applied to all fruit sampled in this project the spray regimes could be considered as soft regimes compared to past fruit fly spray regimes which included the use of either dimethoate or fenthion. In particular, the 2010 Bowen trial where only a single spray of bifenthrin was applied due to heavy rainfall. No flies were collected from 6281fruit sampled. This result does question the host status of eggplant to infestation by B. tryoni. Prior to 2009 eggplant was recorded as a host of B. tryoni but not all jurisdictions in Australia had legislated for the requirement for mandatory treatment. As such interstate state trade into non-fruit fly markets such as Victoria and South Australia was possible without the need for treatment and to the best of our knowledge there were no detections of live fruit fly in commercial eggplant consignments in these markets. However a review of the Queensland fruit fly host list resulted in the need for fruit fly treatments to be applied in 2009. The results of this trial and previous interstate trade without mandatory fruit fly treatments would indicate that eggplant is a poor or occasional host to B. tryoni. As such the risk of fruit fly infestation can be mitigated by the use of chemical covers sprays such as bifenthrin, abamection and spinetoram which have not traditionally been used as stand alone fruit fly sprays. Data generated in this project does show that their inclusion in a systems approach which includes field sprays, grading in the packhouse, and a packed product inspection (600 unit inspection or 2% of a consignment) would mitigate the risk of fruit fly. An integral part of all the systems approaches currently approved for interstate trade (ICA 20, ICA 21, ICA 26, ICA 27, ICA 34 etc) is the ability for fruit graders and packers to ensure that all packed product is free of visible signs of fruit fly infestation. This requirement is an essential part of the system and a pictorial guide explaining the different fruit fly life stages and damage symptoms on eggplant has been developed in this project. This grower friendly guide will assist both graders and

- 54 -
pack-house quality control staff in recognising fruit fly damage and oviposition marks on fruit during the sorting and inspection process. One recommendation of this project is that ICA 26 be modified to include in field treatment options such as bifenthrin, abamectin and spinetoram in addition to use of trichlorfon which is the only treatment option available to growers after the APVMA decision to suspend the use of dimethoate and fenthion on eggplant. However is should be noted that ICA 26 is currently not accepted by Tasmania (currently reviewing this decision) or Western Australia (although Western Australia does use ICA 26 for treatment of Medfly to access South Australia) for control of Queensland fruit fly and entry to these markets is only possible using methyl bromide fumigation (ICA 04). The lack of harmonisation of approval for ICA 26 makes it uncertain if the data generated in this project will be sufficient to gain national acceptance for this procedure. However, before a submission to the Domestic Market Access Working Group (DQMAWG) for modification of ICA 26 can be progressed, applications to the APVMA for minor use permits for all three chemicals will need to be developed. While the development of applications to the APVMA for minor use permits has not been undertaken as part of this project, QDAFF will assist industry if they wish to pursue this option.
TECHNOLOGY TRANSFER Farm visits were conducted to explain the project’s objectives and expected outcomes for eggplant
growers. Growers with traps on their properties have been informed of the species and numbers of fruit flies
trapped throughout the project work. Members of the project team visited eggplant farms to discuss the project with growers, collect
information and data on growing practices, and confirm market requirements, pesticide use-pattern, pest management practices and target markets.
Project results were presented to industry at the Fruit Fly Area-wide Management Workshop, held
in Gayndah on the 14th Oct 2010. Project information and results to date were presented at a Fruit Fly Forum organised by
Bundaberg Fruit and Vegetable Growers Association on the 16th of August 2011. This industry forum was well attended, with representatives from major industry bodies, experts from CSIRO, universities and government departments and most importantly many local growers and consultants.
Project results were presented to the Bowen Grower Meeting on the 18th of April 2012, where
discussion and planning for 2012 fruit sampling also occurred. A Queensland fruit fly pictorial guide explaining the various life stages and damage symptoms on
eggplant has been developed. This grower friendly guide will assist both growers and pack-house quality control staff in recognising fruit fly damage and oviposition marks on fruit during the sorting and inspection process.

- 55 -
RECOMMENDATIONS The field trials demonstrate the efficacy of preharvest cover sprays and pack-house mitigation
measures in controlling the risk of fruit fly infestation in eggplants. Extensive sampling has provided a high level of assurance that eggplant fruit grown using this fruit fly management regime is completely free of, or at very low risk of, fruit fly infestation. On this basis, an application to have ICA 26 modified to include new chemical controls for B. tryoni should be submitted to DQMAWG.
The main insecticide active ingredients evaluated in this project were bifenthrin, abamectin and
spinetoram. These active ingredients are not currently registered for the control of fruit fly in eggplant. Permit approval is required from the Australian Pesticides and Veterinary Medicines Authority (APVMA) before a submission to DQMAWG can be progressed.
In the Bowen and Burdekin production region, fruit fly trapping data showed a “low fruit fly pest
period” from April to August. This pest population data further supports the local understanding that eggplant produced during this low fruit fly activity period are at minimal risk of fruit fly infestation.
This study and previous research (VG06028) shows that cover spray applications are having most
of their influence on fruit fly populations in the warmer production period from August to December. Therefore, a standardised cover spray program at 7 – 10 day intervals would be of most benefit during this warmer production period towards the end of the season.
ACKNOWLEDGEMENTS The project team acknowledge the following organisations and individuals:
Horticulture Australia Ltd for funding the project.
Bundaberg, Bowen and Burdekin district farmers who allowed trapping on their properties and provided crop production information.
Nick Macleod, Science Leader DAFF, who provided guidance and support for the project.
Sandy Anderson, Administration Officer DAFF Bowen provided administrative support and data entry for the project.
Bowen, Bundaberg and Ayr Research Station staff maintained the crop and assisted with harvesting.
Bundaberg technical and field staff - Emma Thoren, assisted in identifying and counting the trapped flies. Chris and Bruce Thompson assisted in assessing the fruit.
Project staff - Lorna McQuade and Jennell Glover provided support for fruit sampling and assessment.
BIBLIOGRAPHY Ahmad, S.F., Sohail,A., Khan,R.R., and Nadeem, M. (2010) Evaluation of insecticide resistance in
two strains of fruit fly, Bactrocera zonata (saunders) (tephritidae: diptera), with fruit dip method. Pakistan Entomology. Vol. 32, (2) : 163-167.
APVMA (2011). Proposed suspension and allowed uses following 2011 Dietary Risk Assessment of

- 56 -
dimethoate. Information sheet.
http://www.apvma.gov.au/products/review/current/dimethoate_a_z.php
APVMA (2012). Chemical review program - chemical nominated for review. http://www.apvma.gov.au/products/review/a_z_reviews.php
Clarke, A., Balagawi, S., Jackson, K (2012) Preharvest fruit fly, Final Report (CRC 40088) Cooperative Research Centre for National Plant Biosecurity.
Clarke A.R. & Dominiak, B.C. 2010. Positive correlation of male and female Bactrocera tryoni (Froggatt) (Diptera: Tephritidae) catches in orange-ammonia traps. General and Applied Entomology 39: 9-13.
Drew, R.A.I., Zalucki, M.P. and Hooper, G.H.S. (1984). Ecological studies of eastern Australian fruit flies (Diptera: Tephritidae) in their endemic habitat. I. Temporal variation in abundance. Oecologia 64: 267-272.
Drew, R.A.I., (1989). The tropical fruit flies (Diptera: Tephritidae: Dacinae) of the Australasian and Oceanian regions. Memoirs of the Queensland Museum 26:1-521
Hancock, D.L., Hamacek, E.L., Lloyd, A.C. and Elson-Harris, M.M. 2000. The distribution and hosts plants of fruit flies (Diptera: Tephritidae) in Australia. QDPI Information Series Q99067.
ISPM (2002). The use of integrated measures in a systems approach for pest risk management. International Standards for Phytosanitary Measures (ISPM No. 14), Produced by the Secretariat of the International Plant Protection Convention, FAO
Jorgensen K, Cannon R, Muirhead I. (2003). Guidelines for the establishment of pest free areas for Australian Quarantine. Plant Health Australia Ltd and Agriculture, Fisheries and Forestry Australia.
Kay, I., Lloyd, A., Brown, J. and Hamacek, E. (2004). Heliothis and Fruit Fly Integrated Pest Management Strategies for Tomato, Vegetable and Melon Crops. Final Report for HAL Project VX99035, Sydney, Australia.
Liquido NJ, Barr PG, Chew V (1997). CQT_STATS: Biological Statistics for Pest Risk Assessment in Developing Commodity Quarantine Treatment. USDA-ARS Publication Series.
Mullins T and Subramaniam S (2011). Horticultural production estimates for Bowen and Burdekin dry tropics. Bowen Research Station, DAFF.
Senior, L,. and Wright, C. (2012) Efficacy data to support fruit fly control systems for export trade in tomatoes and peppers. Department of Agriculture, Fisheries and Forestry, Queensland, Australia
Subramaniam, S., Jackson, K., Lloyd, A., Kopittke, R., Hamacek., E. and Kreymborg, D., (2011). Alternative fruit fly control and market access for capsicums and tomatoes. Final Report for HAL Project VG06028, Sydney, Australia.
Subramaniam, S, Jackson, K, Lloyd, A and Hamacek, E (2012). Evaluation of tomato and capsicum production systems at Bowen and Gumlu in mitigating the risk of fruit fly infestation. Department of Agriculture, Fisheries and Forestry, Queensland, Australia.
VSN International (2011). GenStat for Windows 14th Edition. VSN International, Hemel Hempstead, UK. Web page: GenStat.co.uk

- 57 -
APPENDIX 1.

- 58 -