alternative nitrogen fertilizer … report june 2013 submitted by ... support of this project. ......
TRANSCRIPT

1
ALTERNATIVE NITROGEN FERTILIZER MANAGEMENT
STRATEGIES TO IMPROVE FERTILIZER RECOVERY AND
WATER QUALITY IN WETLAND TARO (COLOCASSIA
ESCULENTA) PRODUCTION SYSTEMS
FINAL REPORT
June 2013
Submitted By
Jonathan Deenik, Department of Tropical Plant and Soil Sciences, College of Tropical
Agriculture and Humana Resources, University of Hawaii at Manoa, Honolulu, Hawaii
Gregory Bruland, Biology and Environmental Studies, Principia College, St. Louis, Missouri
Roy Yamakawa, Kauai County Cooperative Research and Extension, College of Tropical
Agriculture and Humana Resources. Lihue, Hawaii
Linda J. Cox, Department of Natural Resources and Environmental Management, College of
Tropical Agriculture and Humana Resources, University of Hawaii at Manoa, Honolulu, Hawaii

2
ACKNOWLEDGEMENTS
We thank the participating farmers from Hanalei, Kaua`i who donated their time and land in
support of this project. We would like to thank Garvin Brown for his assistance in setting up the
plot barriers and irrigation system at each far. Thanks also go to Jessica Panzer for her assistance
with soil and water sample collection, lab work, and data management. This project was made
possible through grants from USDA-NIFA NRI (2008-35107-04526) and from the College of
Tropical Agriculture and Human Resources HATCH Supplemental Funding.

3
Contents
Executive Summary ....................................................................................................................................... 4
Background and Purpose .............................................................................................................................. 5
Approach and Experimental Design .............................................................................................................. 5
Experimental Design ................................................................................................................................. 5
Soil and Water Sampling ........................................................................................................................... 8
Tissue Analysis .......................................................................................................................................... 9
Taro Harvest and Nitrogen Recovery ........................................................................................................ 9
Statistical Analysis ..................................................................................................................................... 9
Results ........................................................................................................................................................... 9
Taro Yield .................................................................................................................................................. 9
Soil Nitrogen............................................................................................................................................ 11
Water Nitrogen ....................................................................................................................................... 13
Fertilizer treatment effects on nutrient uptake and N recovery by taro plants ..................................... 15
Cost Benefit Analysis ............................................................................................................................... 17
Interpretation and Significance .................................................................................................................. 18
Conclusions and Recommendations ........................................................................................................... 19
References .................................................................................................................................................. 21

4
Executive Summary
Commercial wetland taro production requires nitrogen (N) fertilization to maintain corm yields
and profitability. Current N fertilization practice on most commercial taro farms consists of
monthly applications of urea directly into the surface water of the ponded fields. Due to
fertilizer inefficiencies and potential downstream N contamination of fragile freshwater and
marine ecosystems, a CTAHR funded project was implemented in Hanalei to evaluate the effect
of a controlled release urea and organic fertilizer on taro yield, N use efficiency and water
quality.
A controlled experiment with four treatments including a check plot (no fertilizer), fish bone
meal organic fertilizer (FBM), Duration® (polymer coated urea) fertilizer, and a farmer practice
using conventional urea fertilizer was established at four commercial farms in Hanalei Valley.
Fertilizer treatment effects on water and soil N concentration was assessed through water and
soil sampling. Analysis of variance was used to evaluate treatment effects on taro yield, fertilizer
N use efficiency, and economic return to the farmer.
Fertilizer treatment had no significant effect on mean taro yield. The polymer coated urea (PCU)
controlled release fertilizer showed the highest average yield and lowest amount of variation.
The fish bone meal (FBM) and PCU fertilizers provided a long term reservoir of plant available
N in the root zone, and reduced N export to the river system in effluent water. The current farmer
practice did not store applied N in the soil, but rather showed an increased export of N to the
river system with potential to contaminate fragile downstream freshwater and marine
ecosystems. Varying fertilizer did not improve N use efficiency. Results from a partial cost
benefit analysis showed that the PCU fertilizer treatment showed the highest mean return with
the lowest variability across the three farm sites.
Results from the experiment indicate that the Duration®
PCU product from Agrium Technologies
is an economically viable alternative to conventional urea with the added benefit that it will
reduce potential N contamination of fragile downstream aquatic resources. Further on-farm tests
are recommended to confirm that net returns are higher or similar to conventional fertilization
over time.

5
Background and Purpose
Wetland taro is grown in Hawaii to produce poi taro, a staple food prized by native Hawaiians
and local consumers alike. Commercial production of taro for poi milling requires N fertilizer
applications to maintain corm yields. Conventional taro farms currently apply N fertilizers,
typically as urea (46-0-0), directly into the floodwaters at monthly intervals for the first six
months of the crop. Much of the urea N applications to the surface water may not be taken up by
taro plants because N is subject to a number of loss pathways. As urea hydrolyzes in the
floodwaters ammonium (NH4+) is released, which can be rapidly nitrified in the oxic water to
nitrate (NO3-). Both NH4
+ and
NO3
- forms of N can leave taro fields in the floodwater, enter
freshwater streams or rivers, and ultimately move into coastal waters posing an environmental
threat to fragile coastal and marine ecosystems. Additionally, N can be lost to the atmosphere
when NH4+
volatilizes to ammonia (NH3) gas during diurnal increases in surface water pH.
Lastly, when the NO3- from the nitrified urea diffuses into the anoxic subsoil it is converted to
N2O through denitrification and lost to the atmosphere.
In order to address the inefficiencies associated with current N Management, CTAHR funded a
project to evaluate the use of controlled-release urea and organic fertilizers as alternative
fertilization strategies in wetland taro production. The project addressed two specific objectives:
1) to assess the effect of polymer coated urea (PCU) and fish blood meal (FBM) on taro yields
and N recovery in wetland taro, and 2) to determine the effect of slow release N and organic
fertilizers on N in the water and soil. The alternative fertilization strategies were hypothesized to
keep applied N in the NH4+-N form in the soil sediment to make it available for taro plant uptake
with the following benefits: 1) increase N recovery, 2) decrease loading of N into the Hanalei
River, and 3) increase taro yield.
Approach and Experimental Design
Experimental Design
Four farmers with the Kauai Taro Growers Association agreed to participate and donate one taro
field to be used in the experiment. The four fields were located within the Hanalei Wildlife
Refuge (Fig. 1) and situated on the Hanalei soil series (very fine, mixed, semiactive, nonacid,
isohyperthermic Typic Endoaquepts). Soil samples were collected from each field and analyzed
at the Agricultural Diagnostic Service Center (ADSC) at the University of Hawaii to determine
baseline fertility status. Sampling results are presented in Table 1. The field selected at Farm 2
had been fallow for at least 10 years, and showed significantly different soil fertility status
compared to the three other taro fields, which had been under continuous taro cultivation for
decades.

6
Table 1. Baseline soil sample results for lo`i from the four participating farms.
Farm ID pH TC TN P K Ca Mg
-----------%---------- ------------------------ppm---------------------
1 (RH) 6.0 1.8 0.12 168 179 2248 910
2 (AD) 5.2 5.5 0.29 13 91 1126 1124
3 (MF) 6.2 2.4 0.08 105 155 2569 890
4 (GK) 6.0 2.8 0.19 160 130 1945 1001
Figure 1. North Shore of Kauai with inset showing locations of the four lo`i (red polygons)
within the Hanalei Wildlife Refuge.
Each field was subdivided into four distinct plots using plywood barriers inserted into the
sediment with a pipe system to allow for individual entry and exit of irrigation water into each
plot (Fig. 2). Four fertilizer treatments, including including T1 check plot (no fertilizer), T2 fish
bone meal organic fertilizer (FBM), T3 Duration®
(polymer coated urea, PCU), and T4 farmer

7
Figure 2. Construction activities associated with the implementation of experimental plots at
select Hanalei taro farms.
control urea were randomly assigned one plot at each farm. All fields received a basal
application of K as 0-0-50 at equivalent rate of 600 lbs per acre. Lime and fertilizers were tilled
into the fields prior to installation of barriers. All plots were planted with the same taro variety
(Maoli Lehua) between February 15 and February 23, 2011. Planting density was equivalent to
10,890 plants per acre across all farms. The check plots received no fertilizer inputs for the
duration of the experiment. The fish bonemeal organic fertilizer obtained from Island
Commodities, Inc. of Kapolei, Oahu contained rendered fish and slaughterhouse scraps with the
following analysis: N = 7.67%, P = 2.81%, K = 0.86%, Ca = 4.50%, Mg = 0.16%. The Duration
fertilizer (43-0-0) utilized in T3, a polymer coated controlled release urea product (PCU), was
obtained from Agrium Advanced Technologies (Denver, CO) and formulated to meet the
following specifications: 25% (w/w) 45 day release, 50% (w/w) 90 day release, 25% (w/w) 180
day release. The farmer control treatment (T4) consisted of monthly applications of urea (46-0-0)
applied directly into the ponded plots. Lime was applied at the equivalent of 2,000 lbs per acre
and P fertilizer as triple super phosphate (0-45-0) at the equivalent of 200 lbs per acre at farm 2
to correct soil acidity, low Ca and low P concentrations. All N fertilizers were applied to achieve
a rate of 480 lbs N per acre and the specific amounts applied to each plot are outlined in Table 2.
Fertilizer materials for T2 and T3 were tilled into the flooded plots on February 8 and 9, 2011
Table 2. Plot size at each farm and corresponding amount of fertilizer applied.
Farm Treatment Plot Area (ft2) Fertilizer Application
1 T4 9,085 36.3 lbs 46-0-0/mo
T3 1,520 38.7 lbs
T2 1,680 301 lbs
2 T4 2,376 9.5 lbs 46-0-0/mo
T3 1,840 46.8 lbs
T2 1,800 323 lbs
3 T4 10,500 41.9 lbs 46-0-0/mo
T3 1,400 35.6 lbs
T2 1,360 244 lbs
4 T4 4,320 17.2 lbs 46-0-0/mo
T3 1,500 38.2 lbs

8
T2 1,600 287 lbs
Figure 3. Application of fish bone meal fertilizer (left) and tillage operation to incorporate
fertilizer materials.
(Fig. 3), and plot outlets were closed for two weeks to prevent the loss of water from the plots.
Soil and Water Sampling
Soil and water sampling commenced on March 7, 2011. Soil samples were collected monthly to
a depth of six inches using a plastic coring tube with a 2.5 inch diameter. Six cores were taken
from each plot, homogenized and a sub-sample placed in a ziplock bag and stored on ice
immediately after collection. Soil samples were transported in a cooler to the University of
Hawaii, MNanoa (UHM) where they were refrigerated, extracted with 2 M KCl within 24 hours,
and extracts kept frozen until analyses.
Water samples were collected from the intake point and at each plot exit at all four farms every
two weeks until June 27, 2011, and then monthly until harvest. The water quality parameters
analyzed on site included temperature, conductivity, total dissolved solids, salinity, dissolved O2,
and pH. These were recorded in situ using a YSI portable 556MPS mulitparameter probe (YSI
Incorporated, Yellow Springs, OH). A sub-sample from each plot was collected in a 250 mL
Nalgene sample bottle, stored on ice, and transported to the University of Hawaii where all
samples were filtered through Whatman 42 filter paper and then frozen.
Soil extracts and water samples were then sent by air shipment to the Marine Sciences Analytical
Laboratory MSAL) at the University of Hawaii Hilo. The samples were analyzed for nitrate
(NO3--N) and ammonium (NH4
+-N) colorimetrically on an autoanalyzer by cadmium reduction
and the indophenol blue method, respectively. Water samples were analyzed for total dissolved
N using a Shimadzu TNM-1 instrument by high temperature combustion chemiluminesecence
detection.

9
Tissue Analysis
On June 15, 2011, four leaf samples were collected from each plot, brought to the University of
Hawaii, dried at 70°C to a constant weight, and analyzed for total elemental concentration at the
ADSC.
Taro Harvest and Nitrogen Recovery
Experimental plots were harvested on March 27th
and 28th
, 2012 to evaluate N fertilizer effect on
taro yield, taro density, and N uptake. The two center rows with a length 40 feet from each plot
were selected as harvest rows (area = 160 ft2). Ohana within the harvest area were counted,
excavated, roots removed, and keiki and makua separated. Keiki and makua weights were
recorded for each plot. Five ohana were randomly selected and flagged in adjacent rows,
removed and packed for shipping. These five plants were carried back to UHM, dried at 70°C to
a constant weight, dry weight recorded, and analyzed for total elemental concentration at the
ADSC. Nitrogen uptake was calculated by multiplying dry weight by tissue N concentration and
scaled up to lbs per acre. Apparent N recovery (ANR) was calculated according to the following
equation:
( ) ( )
Where Nuptakefertilized is the N in the taro plants from the fertilized plots and Nuptakecheck is the N
in the taro plants from the check plots that received no N fertilizer (units are expressed as lbs N
per acre).
Statistical Analysis
A one-way analysis of variance (ANOVA) with farm as replicate was used to examine the effect
of each fertilizer treatment on taro tissue N concentration (%), yield (lbs taro per acre), and ANR
(%). All statistical analyses were performed using the Minitab (16) statistical software package
(Minitab, Inc., 2007).
Results
Taro Yield
Use of the same four fertilizer treatments at four separate, but similar taro fields in Hanalei, the
farms served replicates of the same experiment and allowed a mean taro yield and a variance to
be calculated. This information was used to perform ANOVA and assess the effect of fertilizer
treatments on yield. Analysis of variance was performed using yield data from three of the four
farms because the taro crop failed at Farm 2. Results of ANOVA showed that N fertilizer type
had no significant effect on taro corm yield (Fig. 4a). Mean yields varied from a low of 19,956
10
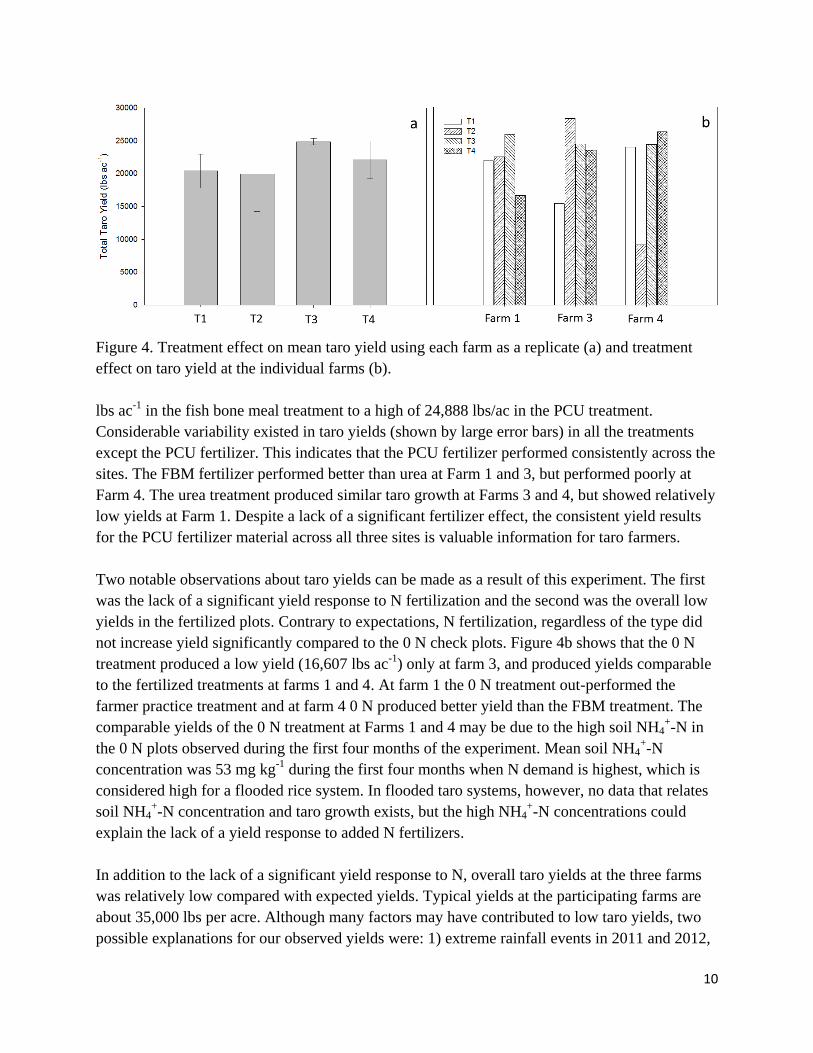
Figure 4. Treatment effect on mean taro yield using each farm as a replicate (a) and treatment
effect on taro yield at the individual farms (b).
lbs ac-1
in the fish bone meal treatment to a high of 24,888 lbs/ac in the PCU treatment.
Considerable variability existed in taro yields (shown by large error bars) in all the treatments
except the PCU fertilizer. This indicates that the PCU fertilizer performed consistently across the
sites. The FBM fertilizer performed better than urea at Farm 1 and 3, but performed poorly at
Farm 4. The urea treatment produced similar taro growth at Farms 3 and 4, but showed relatively
low yields at Farm 1. Despite a lack of a significant fertilizer effect, the consistent yield results
for the PCU fertilizer material across all three sites is valuable information for taro farmers.
Two notable observations about taro yields can be made as a result of this experiment. The first
was the lack of a significant yield response to N fertilization and the second was the overall low
yields in the fertilized plots. Contrary to expectations, N fertilization, regardless of the type did
not increase yield significantly compared to the 0 N check plots. Figure 4b shows that the 0 N
treatment produced a low yield (16,607 lbs ac-1
) only at farm 3, and produced yields comparable
to the fertilized treatments at farms 1 and 4. At farm 1 the 0 N treatment out-performed the
farmer practice treatment and at farm 4 0 N produced better yield than the FBM treatment. The
comparable yields of the 0 N treatment at Farms 1 and 4 may be due to the high soil NH4+-N in
the 0 N plots observed during the first four months of the experiment. Mean soil NH4+-N
concentration was 53 mg kg-1
during the first four months when N demand is highest, which is
considered high for a flooded rice system. In flooded taro systems, however, no data that relates
soil NH4+-N concentration and taro growth exists, but the high NH4
+-N concentrations could
explain the lack of a yield response to added N fertilizers.
In addition to the lack of a significant yield response to N, overall taro yields at the three farms
was relatively low compared with expected yields. Typical yields at the participating farms are
about 35,000 lbs per acre. Although many factors may have contributed to low taro yields, two
possible explanations for our observed yields were: 1) extreme rainfall events in 2011 and 2012,

11
which caused extensive flooding, and 2) extensive Phytophthora spp. damage to taro plants
during the vegetative growth phase in 2011. Approximately 12 inches of rain fell between May 7
and 9, 2011 causing extensive flooding for several days throughout Hanalei Valley and
damaging the experimental plots. In March of 2012, Hanalei Valley experienced another bout of
excessive rains between March 4 and 6 and again on March 8. An estimated 50 inches of rain fell
between March 3 and 9, which was almost twice the monthly average. The flooding caused by
these extreme rainfall events likely contributed to lower than average taro yields. Kona weather
patterns in May and June, 2011, when the taro was at the height of vegetative growth, caused an
outbreak of Phytophthora with significant damage to taro leaves across all treatments at all sites
(Fig. 5). Phytophthora infestations of taro leaves reduce the photosynthetic capacity of the taro
plant and thus cause lower corm yields.
Figure 5. Evidence of heavy phytophora incidence and damage on taro leaves across
experimental sites.
Soil Nitrogen
Fertilizer treatment effect on soil N status was monitored by measuring NH4+ + NO3
--N
throughout the duration of the experiment. Applying urea monthly into the flood water showed
small increases in soil NH4+-N between 118 and 187 days after planting, but overall soil NH4
+-N
status in the farmer practice (T4) plots were similar to soil NH4+-N levels in the 0N (T1) plots
(Fig. 6). The PCU fertilizer produced a steep rise in soil NH4+-N concentration in two weeks
after application with mean concentration at 407 lbs NH4+-N per acre and maintained a high
NH4+-N concentration up to 150 days after application. The organic FBM fertilizer also show a
rapid rise in soil NH4+-N concentration, which peaked at 309 lbs NH4
+-N per acre at two months
after application and then showed a steady decline beginning at 150 days after application. Soil
NH4+-N concentrations for the plots receiving monthly urea applications (farmer practice) were
generally not different from the 0N control plots except for slightly elevated levels at 118, 145,
and 187 days after planting. By 265 days after application all treatments showed NH4+-N
concentrations similar to the 0N control plot.

12
Days
0 50 100 150 200 250 300 350 400 450 500
So
il N
H4
+-N
(lb
s/a
cre
)
0
100
200
300
400
500
600
700
0N (T1)
Fish/bone meal (T2)
Control Release (T3)
Farmer Practice (T4)
Figure 6. Mean soil NH4
+-N concentrations for the different treatments. Error bars
represent the standard deviation.
Soil NH4+-N concentrations in the FBM and PCU fertilizer plots were characterized by high
variability. Ammonium release from the FBM fertilizer reached a maximum at 65 days at Farm 3
and 4, but declined more rapidly at Farm 3 (Fig 7A). At Farm 1 the maximum was reached after
118 days. All of the applied N from the PCU fertilizer was recovered as NH4+-N at the first
sampling date 35 days after application at Farms 1 and 3 (Fig. 7B). Maximum soil NH4+-N levels
at Farm 4 were not reached until 118 days after application. The NH4+-N release pattern
observed at Farm 4 was more in line with expectations for a controlled release material. The
rapid release of NH4+-N observed at Farms 1 and 3 indicated that the material was not
conforming to a slow release pattern, but rather releasing all its soluble N within the first 35
days. A 35-day incubation experiment in the laboratory conducted to assess N release from urea
and the PCU fertilizers, found that the PCU fertilizer released approximately 46% of the added N
as NH4+-N compared to 97% in 35 days for the standard urea fertilizer. The PCU fertilizer was
formulated to release 25% of the added N within the first 30 days, but appears to be solubilizing
N almost twice as fast as the formulation analysis predicts under fully saturated conditions.
Overall, however, the FBM and PCU fertilizers provided a large reservoir of plant available N in
the soil for up to 200 days of the taro growth cycle whereas the farmer practice fertilization
treatment showed little potential to store N in the soil.

13
B
0 100 200 300 400
A
Days
0 100 200 300 400
Extr
acta
ble
NH
4
+-N
(lb
ac
-1)
0
100
200
300
400
500
600
Farm 4
Farm 3
Farm 1
Days Figure 7. Soil NH4
+-N concentrations for the plots amended with fish bone meal (A) and
controlled release urea fertilizer (B) at Farms 1, 3, and 4.
Water Nitrogen
Total N (NH4+-N, NO3
--N, + organic N) concentrations in the outflow water for each treatment at
the three farms are displayed in Figure 8. The 0N plots (T1) showed low total N in the water at
all sites throughout the sampling period. The FBM and PCU fertilizer treatments showed
elevated total N in the outflowing water during the first two sampling events at Farms 1 and 3
and up to the fourth sampling event (8 weeks) at Farm 4. Urea fertilization events produced
pronounced spikes in water N concentration at Farms 1 and 4, but the relationship between
fertilization event and water N concentration was less apparent at Farm 3. The relationship
between urea fertilization and water N spikes was clearest at Farm 4. The effect of N fertilization
on potential for N loading into the Hanalei river system was evaluated by comparing effluent
water N concentration with the accepted limit that background total N concentration in natural
water bodies is less than 1.0 mg L-1
(US Geological Survey, 1999). Total N concentration in
water from Hanalei River flowing into the patches (inflow), exceeded 1.0 mg L-1
only once at
Farm 4 for the duration of the experiment (Fig. 9). For the check plots not receiving any N
fertilizer, N concentrations surpassed the limit three times at Farm 1 and once at Farm 4. Water
samples collected at Farm 3 generally showed little effect of N fertilization on water N
concentration with the farmer practice treatment and PCU treatments showing elevated N
concentration for 2 out of the 14 sampling events. The FBM treatment exceeded 1.0 mg L-1
three
times. At Farms 1 and 4 the N fertilizer treatment had a much more significant effect on N water
concentrations. At Farm 1, the FBM fertilizer caused N water concentrations to exceed the limit
in 50% of the samples (7/14) and more than half the samples for the PCU fertilizer (8/14).
Similarly, the FBM and PCU fertilizers resulted in elevated N concentrations in 5 and 6

14
Figure 8. Total N concentration in water samples collected from
outflow pipes for each treatment. Urea fertilization events for
Farmer Practice treatments (T4) are indicated with arrows.
elevated N concentrations in 5 and 6 of the 14 sampling events, respectively. Results for the
farmer practice treatment were not consistent at Farms 1 and 4 with a high incidence of excess N
in the water at Farm 4 (8/14), but low incidence at Farm 1 (1/14). The inconsistencies were
difficult to explain with the current data.

15
Farm 1
Inflow T1 T2 T3 T4
# o
f S
am
ple
s A
bove 1
.0 m
g T
ota
l N
L-1
0
2
4
6
8
10
Farm 3
Inflow T1 T2 T3 T4
Farm 4
N Fertilizer Treatment
Inflow T1 T2 T3 T4
Figure 9. The number of outflow water samples exceeding 1.0 mg total N L
-1 at each farm.
Nitrogen export from the plots under different N fertilization treatments was estimated by using
measured flow rates out of the plots, the concentration of total N in the exiting water, and
summing by treatment across the 14 sampling events (for the FBM and PCU fertilizer
treatments, data for the first sampling point
were excluded because the water flow out of
the patch was restricted according to
recommended practice). Results in Figure 10
show that large variation in calculated N
export from the fertilized plots existed,
especially for the FBM and farmer practice
treatments. Nonetheless, N export was
significantly higher (P<0.05) from the farmer
practice plots (T4) in comparison with the
plots that received no N fertilizers (T1). On
the other hand, N export from FBM and PCU
fertilizer plots was not significantly different
from the 0 N plots. Furthermore, N export
from the farmer practice treatment was
significantly higher than N export from the PCU
treatment (P<0.1).
Fertilizer treatment effects on nutrient uptake and N recovery by taro plants
Nitrogen uptake by the taro plants showed large variability across the three farm sites (Fig. 11A),
but generally showed higher uptake values in the fertilized plots at Farm 4 compared with Farms
1 and 3. The FBM and PCU fertilizers improved N uptake by 31% and 41%, respectively,
compared to the farmer practice at Farm 1, but showed smaller improvements at Farm 4 (19%
Figure 10. Fertilizer treatment effect on total
N export in effluent water (N expressed as
lbs N summed over 13 sampling events)
Fertilizer Treatment
T1 T2 T3 T4
Ma
ss o
f N
in
Ou
tflo
w (
lbs)
0
5
10
15
20
25
30

16
and 6%, respectively) (Fig. 11A). In contrast, at Farm 3 the FBM and PCU fertilizers reduced N
uptake by 30% and 12%, respectively, compared with the farmer practice.
Nitrogen recovery expressed as ANR was low in all treatments with similar values observed
across the three fertilization treatments (Fig. 11B). In the three fertilizer treatments, ANR was
approximately 15%, which is within the reported ANR values for rice grown under flooded
conditions (10-40%), but considered very low. Low ANR in flooded agricultural systems
Farm
1 3 4
N U
pta
ke (
lbs a
cre
-1)
0
20
40
60
80
100
120
T1
T2
T3
T4
Fertilizer Treatment
2 3 4
Appare
nt
N R
ecovery
(%
)
0
5
10
15
20
25
A B
Figure 11. Fertilizer treatment effects on taro N uptake at each farm (A) and ANR (B).
is not unusual due to the multiple N transformation pathways leading to loss including ammonia
volatilization (loss of dissolved NH4+ to NH3 gas), denitrification (microbial conversion of
dissolved NO3- to N2O/N2 gas under anaerobic conditions), and run-off in the effluent flood
water. The relative contributions of each loss pathway are difficult to predict and measure in the
field, and were not directly measured in this experiment. Nitrogen loss through ammonia
volatilization can be very high [up to 60 % of added N (Ghosh and Bhat, 1998)] especially when
fertilizers such as urea are broadcast into water with pH above 7.4. On average, flood water pH
was consistently above 7.4 in all treatments during the first four months of the taro crop
indicating that potential N loss to ammonia volatilization was high early in the crop cycle.
Nitrogen loss through the ammonia volatilization pathway was especially likely for the farmer
practice treatment because urea was applied directly to the alkaline surface water. Under such
circumstances the urea hydrolyzes rapidly to NH4+ and then at high pH is easily volatilized to
NH3 gas. Nitrogen loss through volatilization in the FBM and PCU treatments was likely
reduced because the fertilizers were incorporated into the soil sediment reducing the movement
of NH4+-N into the surface water. The data in Figure 6 showing large reservoirs of NH4
+ in the
soil suggest that N applied into the subsoil is protected against rapid loss through volatilization.
After four months the pH of the flood waters in all plots was consistently below 6.5 significantly
reducing the likelihood of N loss to ammonia volatilization.

17
Denitrification of N fertilizers can be substantial in flooded soils and contribute to losses ranging
from 20 to almost 70% of applied N (De Datta, 1981). For denitrification to occur N must be in
the NO3- form. Once applied to the soil N in the conventional urea fertilizer is rapidly hydrolyzed
into NH4+, released more slowly as NH4
+ in the PCU material, and mineralized relatively rapidly
into NH4+ for the high N organic FBM. If the NH4
+ remains in the anaerobic subsoil and does not
diffuse into adjacent aerobic soil regions, further transformations will not occur and it will be
available for plant uptake. However, if the NH4+ diffuses into the aerobic surface sediment or
aerobic regions surrounding taro roots, it is subject to microbially mediated nitrification reactions
which convert it into NO3-. The NO3
- can be used by plant roots, but it can also diffuse back into
the adjacent anaerobic soil, be denitrified and lost as N2O or N2 gas. Recent experimental work at
UHM has shown that subsurface applied NH4+ in a whole core taro experiment is readily
nitrified to NO3- in the aerobic soil regions adjacent to taro roots and then rapidly lost to
denitrification. These experiments demonstrated that the coupling of nitrification and
denitrification of NH4+ in the taro rhizosphere accounted for between 40 to 68% N loss (Penton
et al., 2013). This process may be responsible for the large N losses and explain the low ANR
observed in the FBM and PCU fertilizer treatments where a large reservoir of NH4+ was present
in the subsoil during the first five months of the taro growing cycle. The presence of an aerobic
taro rhizosphere coupled with a plentiful source of subsoil NH4+
satisfy the conditions needed for
the loss of fertilizer N by the coupling of nitrification and denitrification.
Cost Benefit Analysis
A partial cost benefit analysis assessed the effect of the fertilizer strategies economic returns to
the farmers. The following values were used in the analysis: 1) the experimentally derived taro
yield values (lbs/acre); 2) 67¢/lb as the current market value of fresh taro1; and 3) fertilizer costs
2
of 48¢/lb for urea, 30¢/lb FBM, and 68¢/lb PCU3. All fertilizers were applied at a rate consistent
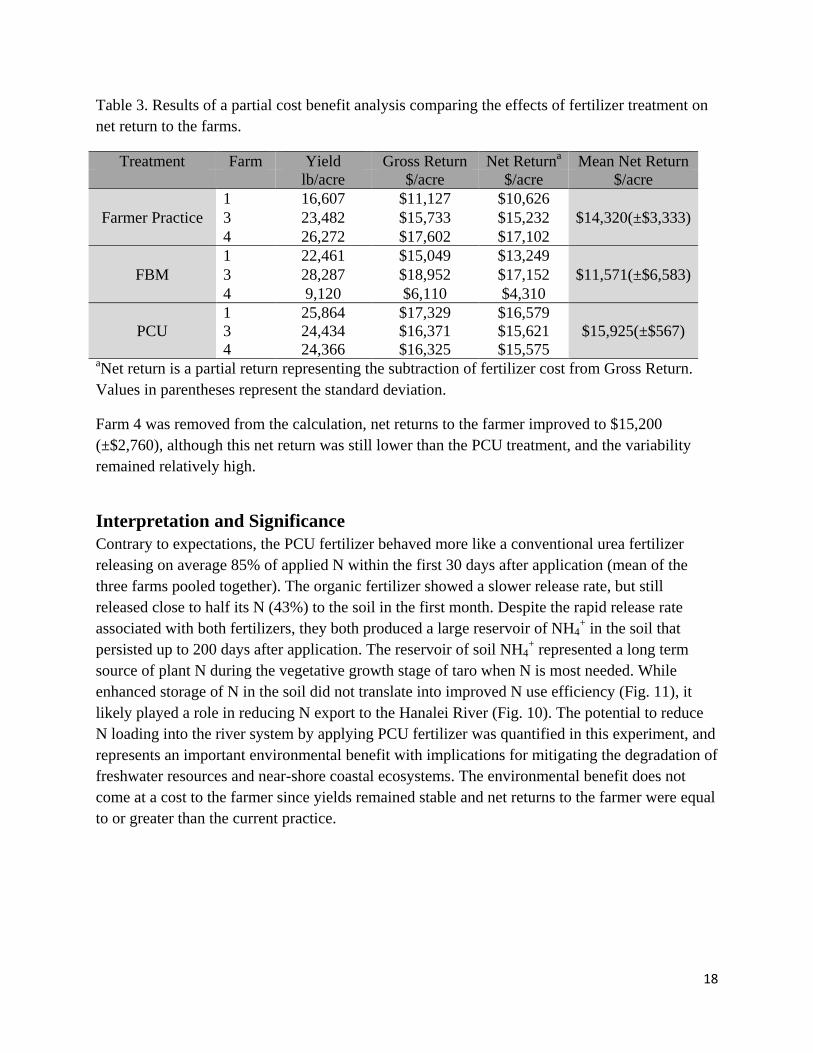
with 480 lbs N per acre as described above. The data in Table 3 show mean net return and the
standard deviation calculated across each fertilizer treatment at Farm 1, 3, and 4. The PCU
fertilizer treatment showed the highest mean return with the lowest variability across the three
farm sites. The farmer practice and FBM fertilizers showed large variability. Farmers generally
prefer predictable consistent results. The PCU fertilizer material appears to be the most cost-
effective option, primarily because it behaves consistently across sites. A more complete cost
benefit analysis that includes labor costs may increase the attractiveness of the PCU fertilizer
because there was only one application event for this fertilizer. Labor costs associated with
monthly applications of urea in the farmer practice further reduce returns to the farmer. The very
low yields in the FBM treatment at Farm 4 had a strong adverse effect on net return. When
1 Farm gate price (Hawaii Agricultural Statistics (2011) 2 All prices as of April 23, 2013 through direct contact with BEI Hawaii (urea), Island Food Commodities, Inc. (FBM), Agrium, Inc. (PCU), and include shipping for the FBM and PCU products. All fertilizer prices are subject to change based on shifting market value. 3 It must be noted that when fertilizer cost was expressed a per unit N basis, FBM was most expensive ($3.75/lb N) followed by PCU ($1.58/lb N) and urea the cheapest ($1.04/lb N).
18
Table 3. Results of a partial cost benefit analysis comparing the effects of fertilizer treatment on
net return to the farms.
Treatment Farm Yield Gross Return Net Returna Mean Net Return
lb/acre $/acre $/acre $/acre
Farmer Practice
1 16,607 $11,127 $10,626
$14,320(±$3,333) 3 23,482 $15,733 $15,232
4 26,272 $17,602 $17,102
FBM
1 22,461 $15,049 $13,249
$11,571(±$6,583) 3 28,287 $18,952 $17,152
4 9,120 $6,110 $4,310
PCU
1 25,864 $17,329 $16,579
$15,925(±$567) 3 24,434 $16,371 $15,621
4 24,366 $16,325 $15,575 aNet return is a partial return representing the subtraction of fertilizer cost from Gross Return.
Values in parentheses represent the standard deviation.
Farm 4 was removed from the calculation, net returns to the farmer improved to $15,200
(±$2,760), although this net return was still lower than the PCU treatment, and the variability
remained relatively high.
Interpretation and Significance
Contrary to expectations, the PCU fertilizer behaved more like a conventional urea fertilizer
releasing on average 85% of applied N within the first 30 days after application (mean of the
three farms pooled together). The organic fertilizer showed a slower release rate, but still
released close to half its N (43%) to the soil in the first month. Despite the rapid release rate
associated with both fertilizers, they both produced a large reservoir of NH4+ in the soil that
persisted up to 200 days after application. The reservoir of soil NH4+ represented a long term
source of plant N during the vegetative growth stage of taro when N is most needed. While
enhanced storage of N in the soil did not translate into improved N use efficiency (Fig. 11), it
likely played a role in reducing N export to the Hanalei River (Fig. 10). The potential to reduce
N loading into the river system by applying PCU fertilizer was quantified in this experiment, and
represents an important environmental benefit with implications for mitigating the degradation of
freshwater resources and near-shore coastal ecosystems. The environmental benefit does not
come at a cost to the farmer since yields remained stable and net returns to the farmer were equal
to or greater than the current practice.

19
Accounting for N for the current
farmer practice treatment was
problematic. Urea applied into the
flood waters did not have a strong
effect on soil NH4+ in comparison
with the plots receiving no N
fertilizers (T1) except on two
occasions where the farmer practice
treatment produced significantly
higher NH4+ concentrations (Fig.
12). This combined with the low N
use efficiency for the farmer practice
treatment, suggests that the N was
lost in the water column either through
volatilization or export in the effluent
water. Overall, the water sampling data
indicated that the farmer practice
treatment had a significantly higher
tendency to export N to the river
system than the 0N check and PCU fertilizer treatments. However, a more intensive water
sampling procedure is required to better characterize the fate of urea applied to surface waters.
Conclusions and Recommendations
The experimental results showed that varying the source of N fertilizer did not have a significant
benefit to taro yield or N use efficiency largely because soil N reserves and yield response to the
three fertilizers were not consistent across the three farms. At Farms 1 and 3, the FBM and PCU
fertilizers tended to increase taro yields compared with the farmer practice providing some
evidence for potential benefits to the farmer. At Farm 4, however, the farmer practice produced
the best yields and FBM growth was especially poor. Excessive rainfall resulting in flooding and
heavy disease pressure from Phytophthora infestation may have led to the below average yields
and varied response across farms.
In terms of N storage potential, the PCU and FBM fertilizers showed promise in maintaining
applied N as NH4+
in the root zone during the peak taro N requirement period, and
simultaneously reducing N loading to the river system with important implications for protecting
fragile freshwater and marine ecosystems from degradation. In contrast, the current farmer
practice showed the highest likelihood to contribute excess N to the river system. The PCU and
FBM fertilizers achieved the environmental benefit of protecting aquatic resources from N
contamination while still maintaining taro yield and benefit to the farmer.
Days
0 100 200 300 400
Soil
NH
4
+-N
(lb
s a
cre
-1)
0
20
40
60
80
100
120
140
160
180
200
0 N (T1)
Farmer Practice (T4)
*
*
Figure 12. Soil reserves as affected by farmer practice
applied urea fertilizer in comparison with the 0N check
treatment. Symbols represent mean concentrations
pooled across farms and error bars are one standard
deviation. * denotes significant difference compared
with 0N plots (P<.0.05).

20
From an economic perspective, the partial budget favored the use of the PCU fertilizer because it
showed the greatest potential to provide consistent returns to the farmer. Overall, consistent
returns to the farmer combined with potential to reduce N contamination of the downstream
environment are incentives for farmers to consider PCU as a viable fertilizer option. Results
from the experiment demonstrate that adoption of a controlled release fertilizer can maintain
consistent economic returns to the farmer, potentially reduce labor costs, and provide measurable
benefits to the environment.
The FBM material compared favorably with other fertilizers and showed potential as a viable
organic fertilizer for wetland taro production. Some of its positive attributes include the
provision of a lasting supply of plant available N, potential to supply other essential plant
elements such as P and Ca, potential benefits to soil quality due to its organic nature, and
potential reductions in labor due to a single pre-plant application. In this experiment, however,
the lack of a consistent yield response across all three sites and its higher cost ($1,800 /acre
compared to $500/ac and $750/ac for the conventional urea and PCU, respectively) made it a less
attractive option. The application method and timing used for the FBM fertilizer was not ideal
and may partly explain uneven results observed in the experiment. Ideally, the FBM should be
tilled into a dry taro field and left for two weeks before flooding. The initial aerobic phase
immediately following application facilitates the decomposition process and minimizes the
build-up of potential toxic intermediate decomposition products that accumulate under anaerobic
conditions. Due to the experimental design and unique set-up conditions for this experiment, the
FBM was applied directly to flooded soil. The plots were left to sit for 10 days before planting,
and the decomposition under anaerobiosis clearly had created less than ideal conditions for
planting. Potentially adverse soil conditions persisted during the first month, and taro growth was
somewhat delayed at Farms 1 and 3, but recovered during the second month. At Farm 4, where
water flow was lowest, taro growth was especially poor and never recovered resulting in the very
low final yields. When the FBM is applied correctly to a drained taro patch as described above,
taro yields exceeding 50,000 lbs per acre have been recorded at farms on Oahu demonstrating its
value as a locally available organic fertilizer.
Up to now, alternatives to urea for N fertilization in flooded taro have not been considered based
on economic and practical questions. Results from this experiment indicate that the Duration®
PCU product from Agrium Technologies may be economically viable alternative to conventional
urea with the added benefit that it will reduce potential N contamination of fragile downstream
aquatic resources. While the results do not show significant taro yield benefits to the farmers,
farmers do not incur an economic penalty for the added environmental benefits. We recommend
that controlled release fertilizers continue to be tested to confirm that net returns are higher or
similar to conventional fertilization over time. The next phase of research should address the
following:

21
1. Can fertilizer application rates be decreased using a controlled release fertilizer due to
observed long term storage of N in the root zone?
2. Confirm lower N export from controlled release fertilized fields with a more intensive
water sampling design.
References
De Datta, SK.1981. Principles and Practices of Rice Production. Wiley, 618 pp.
Ghosh, B. C. and R. Bhat (1998). "Environmental hazards of nitrogen loading in wetland rice
fields." Environmental Pollution 102(1, Supplement 1): 123-126.
Penton, C.R., J.L. Deenik, B.N. Popp, G.L. Bruland, P. Engstrom, D. St Louis, G.A. Brown, and
J. Tiedje. 2012. Importance of sub-surface rhizosphere-mediated coupled nitrification-
denitrification in a flooded agroecosystem in Hawaii. Soil Biology and Biochemistry. 57:
362-373.
U.S. Geological Survey, 1999, The Quality of Our Nation’s Waters—Nutrients and Pesticides:
U.S. Geological Survey Circular 1225, 82 p.